20
The Green Battery for a Sustainable Europe Now, 2020 and Beyond 2014 Dr. Peter Bauhofer

Präsentationsunterlagen Innsbruck 14.02.2014 Folie 1 Dr. Peter Bauhofer
The Green Battery for a Sustainable Europe Now, 2020 and Beyond 2014 Dr. Peter Bauhofer

Präsentationsunterlagen Innsbruck 14.02.2014 Folie 2 Dr. Peter Bauhofer
Contents
Policy Framework
E-Transition: Strategic Goals and Status Quo
The System Flexibility Tool Box
Needs for Corporate Success
Präsentationsunterlagen Innsbruck 14.02.2014 Folie 3 Dr. Peter Bauhofer
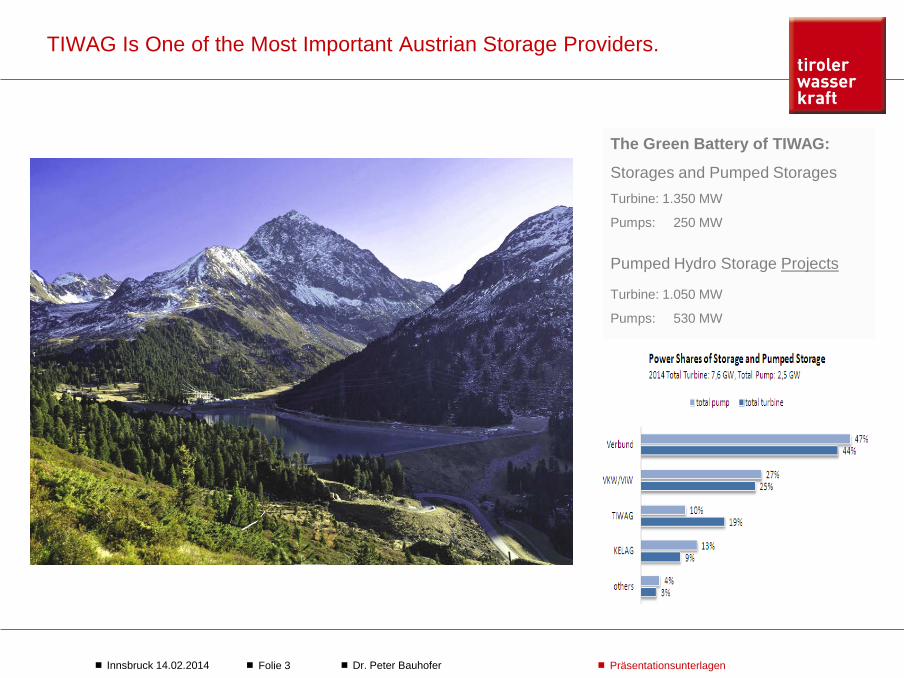
TIWAG Is One of the Most Important Austrian Storage Providers.
The Green Battery of TIWAG:
Storages and Pumped Storages Turbine: 1.350 MW
Pumps: 250 MW
Pumped Hydro Storage Projects
Turbine: 1.050 MW
Pumps: 530 MW

Präsentationsunterlagen Innsbruck 14.02.2014 Folie 4 Dr. Peter Bauhofer
The Psychology of Transition
„I want to be independent of big energy companies and I want to decide wether I produce by myself, or when, how and from whom I buy energy. „ „I want to be a creative part of the new energy system and I want to understand it.“
ecological, self sufficient
selection of supplier
liberalised market
low price
stability and
security of supply
discussion
metamorphosis
emotional ambition
?

Präsentationsunterlagen Innsbruck 14.02.2014 Folie 6 Dr. Peter Bauhofer
202020 Strategy and Beyond
save climate
guarantee a save and low cost electricity supply
ensure economical growth and create new green markets
2020 Strategy is the ignition for large scale RES integration being continued by the 2030 greenbook and the 2050 Roadmap: reduce emissions by at least 20 % until 2020,
20 % more efficiency by 2020, 50 % more efficiency by 2050,
20 %tot RES share by 2020 = > 32 % el, 80 %el in some countries by 2050,
enforce sustainable ressource management,
reduce external energy dependency significantly.

Präsentationsunterlagen Innsbruck 14.02.2014 Folie 7 Dr. Peter Bauhofer
Energy Dependency Causes Geostrategic Weakness [Ref. EUROSTAT 2013].
Präsentationsunterlagen Innsbruck 14.02.2014 Folie 10 Dr. Peter Bauhofer
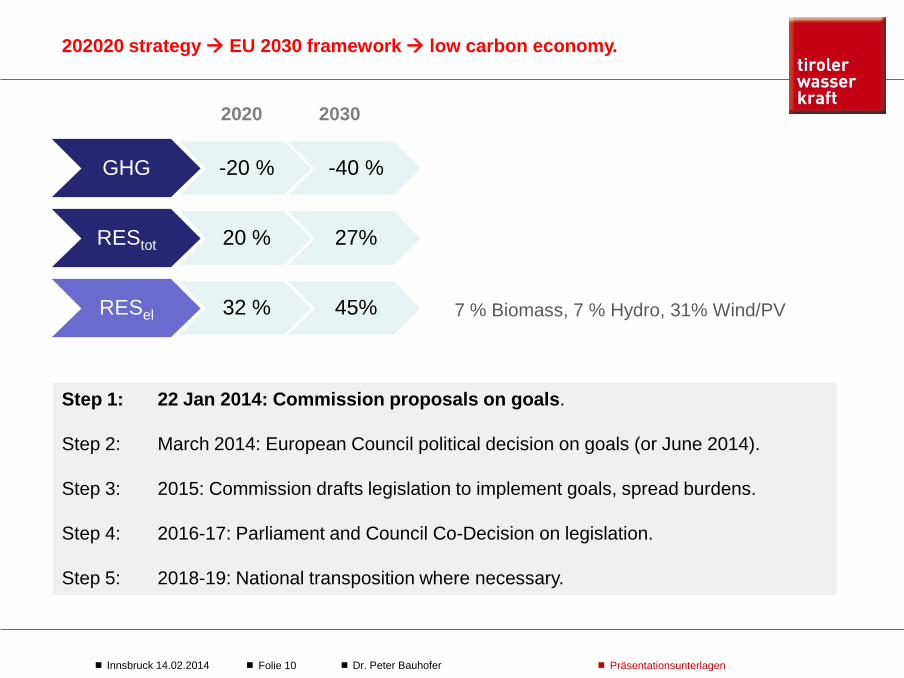
202020 strategy EU 2030 framework low carbon economy.
Step 1: 22 Jan 2014: Commission proposals on goals. Step 2: March 2014: European Council political decision on goals (or June 2014). Step 3: 2015: Commission drafts legislation to implement goals, spread burdens. Step 4: 2016-17: Parliament and Council Co-Decision on legislation. Step 5: 2018-19: National transposition where necessary.
GHG -20 % -40 %
REStot 20 % 27%
RESel 32 % 45%
2020 2030
7 % Biomass, 7 % Hydro, 31% Wind/PV
Präsentationsunterlagen Innsbruck 14.02.2014 Folie 14 Dr. Peter Bauhofer
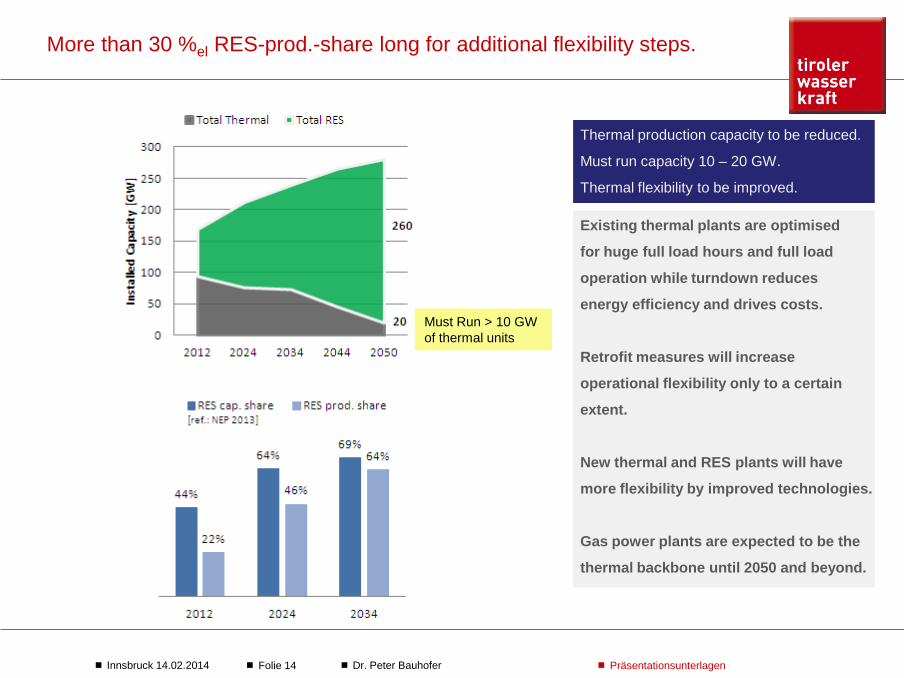
More than 30 %el RES-prod.-share long for additional flexibility steps.
Existing thermal plants are optimised
for huge full load hours and full load
operation while turndown reduces
energy efficiency and drives costs.
Retrofit measures will increase
operational flexibility only to a certain
extent.
New thermal and RES plants will have
more flexibility by improved technologies.
Gas power plants are expected to be the
thermal backbone until 2050 and beyond.
Thermal production capacity to be reduced.
Must run capacity 10 – 20 GW.
Thermal flexibility to be improved.
Must Run > 10 GW of thermal units

Präsentationsunterlagen Innsbruck 14.02.2014 Folie 16 Dr. Peter Bauhofer
Increasing Capacity Produces Less Electricity. Efficiency Sinking.
0
20.000
40.000
60.000
80.000
100.000
120.000
140.000
160.000
180.000
200.000
1990 1992 1994 1996 1998 2000 2002 2004 2006 2008 2010 2012
[MW
]
Installierte Leistung zur Stromerzeugung nach Energieträgern in Deutschland Quellen: BMU, AGEE-Stat., BMWI.Darstellung: TIWAG/EE
Pumpspeicher- und SpeicherkraftwerkeAndere n. Erneuerbare
Photovoltaik
Wind
Biomasse
Laufwasserkraft
Naturgas
Mineralölprodukte
Braunkohle
Steinkohle
Nuklear
Vorläufige Angaben für 2013.
0
100.000
200.000
300.000
400.000
500.000
600.000
700.000
1990 1992 1994 1996 1998 2000 2002 2004 2006 2008 2010 2012
[Gw
h]
Bruttostromerzeugung nach Energieträgern in DeutschlandQuellen: BMU, AGEE-Stat., BMWI.Darstellung: TIWAG/EE
Andere n. Erneuerbare
Photovoltaik
Wind
Biomasse
Wasserkraf t
Naturgas
Mineralölprodukte
Braunkohle
Steinkohle
Nuklear
Anmerkung en: Stromerzeugung aus Wasserkraft in Lauf-, Pump- und Speicherkraftwerken aus natürlichem Zufluss. Vorläufige Angaben für 2013.
Austria and Germany consequently follow their NREAP-path
and even exceed it. Up to now national goals are met.
Restrictions of thermal plants, wind and photovoltaics more
and more long for flexibility measures to stabilise the system.
Production efficiency is being reduced significantly.
Large scale storages will be missing.
2035: - 60 %

Präsentationsunterlagen Innsbruck 14.02.2014 Folie 28 Dr. Peter Bauhofer
Socio Economic Benefit of Pumped Hydro Storage Is Significant.
PHS as precondition for RES integration
Increased PHS benefit for RES integration and thermal operation efficiency
strong PHS benefit for • RES integration, • security of supply (long term storage), • thermal operation efficiency
RES corridor as of EEG 2014 draft
focus on power oriented extension of existing PHS-groups power and capacity extension, new PHS
PV gradient > 5 GW/h!
system stability system stability, efficiency security of supply, system stab, thermal efficiency

Präsentationsunterlagen Innsbruck 14.02.2014 Folie 29 Dr. Peter Bauhofer
HPS is a multy utility toolbox.
Socio Economic Welfare and RES Integration
System Stability Efficiency, Security of Supply
redispatch black Start anc.Serv.: p/f- control, v/rp-control
load smoothing
seasonal energy shifting
remuneration/market
yes yes yes yes, energy only
yes, energy only
PHS
Power to Gas
CAES
Batteries
Flying Wheels
Feed-in-Mgt.
DSM
[Ref.: TIWAG 2013]

Präsentationsunterlagen Innsbruck 14.02.2014 Folie 30 Dr. Peter Bauhofer
Efficient thermal production longs for efficient load smoothing.
sec – min min - hrs hrs - days
pumped hydro
power to gas
CAES
batteries
flying wheels
demand side mgt
RES feed in mgt.
[Ref.: www.store-project.eu, 2013]
sec min hrs days

Präsentationsunterlagen Innsbruck 14.02.2014 Folie 31 Dr. Peter Bauhofer
Alpine HPS capacity to complete German daily HPS facilities.
Reservoir – volumes and drop hights limit German
hydro power storage facilities for short-term
operation to maximum of 1 day. All relevant strategy studies expect from 2025 on
a significant increase of medium and seasonal
storage when baseload capacity reduced stepwise
and renewables’ share will become dominant. The challenges until 2025 can be met mainly by
increased power installation (turbines and pumps)
while post 2025 power and energy storage is
needed urgently. New Alpine HPS reservoirs will meet these
challenges by progressive power and capacity
development.
The German HPS-system has
short- term storage characteristics.
[Ref.: EE, BES/TIWAG 2013]

Präsentationsunterlagen Innsbruck 14.02.2014 Folie 32 Dr. Peter Bauhofer
2.330
2.340
2.350
2.360
2.370
2.380
2.390
2.400
2.410
1.Jun 1.Jul 31.Jul 30.Aug 29.Sep 29.Okt 28.Nov 28.Dez 27.Jän 26.Feb 28.Mär 27.Apr 27.Ma
Simultaneous short-, medium- and long-term storage with alpine HPS.
Flexible turbine and pump capacities
combined with
huge reservoir capacities/drop heights
together with
a maximum of availability
give a broadband operation-service
for the entire system and thus guarantee system
stability and security of supply.
Highly flexible load alternations at huge gradients
meet all LFC requests simultaneously with
Charging or discharging the system for short-,
medium or long term shaping and seasonal
energy storage.
Ancillary services, residual load management
and seasonal storage is the core business for
HPS in the 21rst century.
Mai Dec Jun
[Ref.: TIWAG 2013]
Präsentationsunterlagen Innsbruck 14.02.2014 Folie 33 Dr. Peter Bauhofer
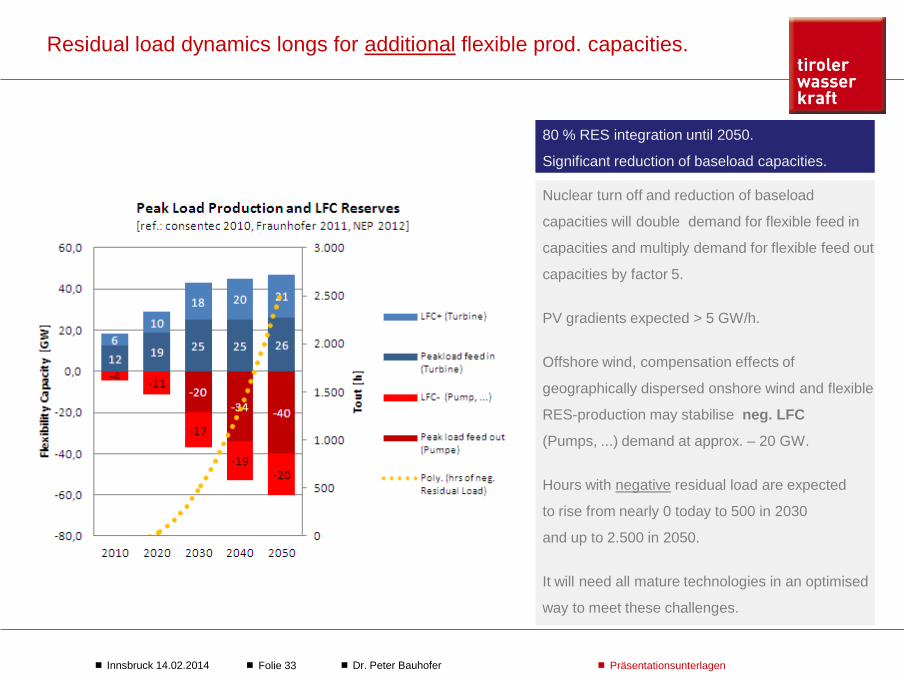
Residual load dynamics longs for additional flexible prod. capacities.
Nuclear turn off and reduction of baseload
capacities will double demand for flexible feed in
capacities and multiply demand for flexible feed out
capacities by factor 5. PV gradients expected > 5 GW/h. Offshore wind, compensation effects of
geographically dispersed onshore wind and flexible
RES-production may stabilise neg. LFC
(Pumps, ...) demand at approx. – 20 GW. Hours with negative residual load are expected
to rise from nearly 0 today to 500 in 2030
and up to 2.500 in 2050. It will need all mature technologies in an optimised
way to meet these challenges.
80 % RES integration until 2050.
Significant reduction of baseload capacities.
Präsentationsunterlagen Innsbruck 14.02.2014 Folie 34 Dr. Peter Bauhofer
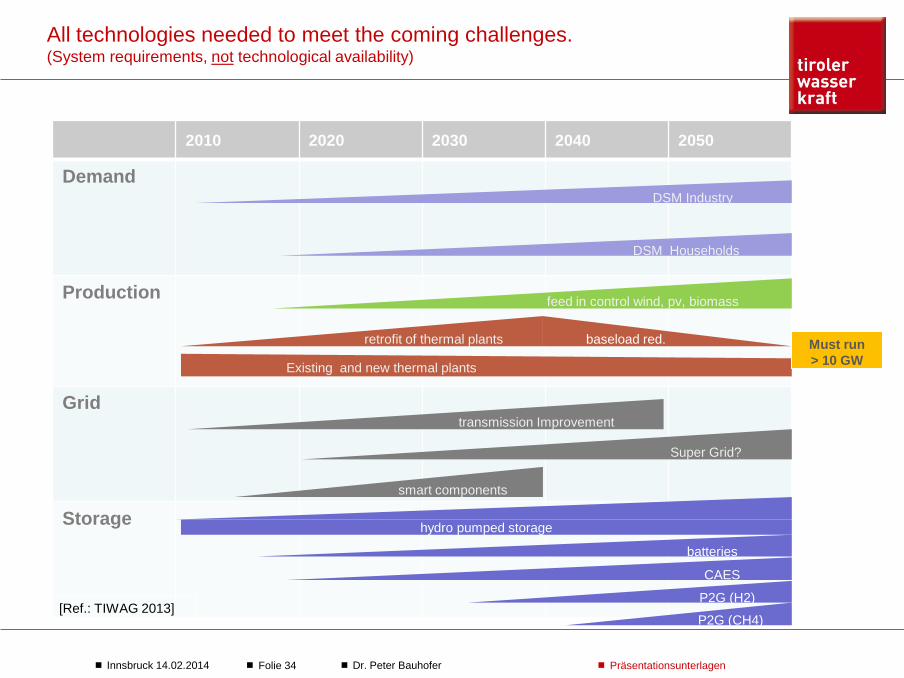
All technologies needed to meet the coming challenges. (System requirements, not technological availability)
2010 2020 2030 2040 2050
Demand
Production
Grid
Storage
DSM Industry
DSM Households
feed in control wind, pv, biomass
Existing and new thermal plants
retrofit of thermal plants
transmission Improvement
Super Grid?
smart components
hydro pumped storage
CAES
batteries
P2G (H2)
P2G (CH4)
Must run > 10 GW
[Ref.: TIWAG 2013]
baseload red.

Präsentationsunterlagen Innsbruck 14.02.2014 Folie 36 Dr. Peter Bauhofer
Alpine and scandinavian hydropower will meet the challenge together.
D-A-CH together with scandinavian storage
and HPS facilities will significantly help to
meet the future challanges by creating
win-win opportunities within the
authorized potential: large scale RES integration
thermal production optimisation
system stability
price stabilisation
CO2 reduction
Alpine HPS benefit from strong
interconnectors to the German system.
Austria’s hydraulic potential is only used
by 50 %.
Appr. 13.000 GWh are expected to be
developed. Tirol shares 21 %.
[Ref.: TIWAG, OE, BfE, BNA, Statkraft, DGENER, 2013]
Desirable investment for European industry:
20 GW = Euro 24 billion within 15 yrs.
Individual costs depend on local conditions and operational focus.
~ 20 GW
today today > 2020 > 2020 +/- 2030 +/- 2030

Präsentationsunterlagen Innsbruck 14.02.2014 Folie 39 Dr. Peter Bauhofer
Ancillary Services are a Market Product!
380 kV
110, 220 kV
10 - 30 kV
230 V
Decentr. Load Mgt: batteries Vehicle to Grid (V2G) Demand Side Mgt.
Ancillary Services stabilise the system:
voltage stabilisation
black start ability to manage black outs
spinning reserves
system balancing
load/frequency reserves
long term reserves
backup-reserves
Ancillary services have to be provided
market oriented also in future: independent
of technology and grid-level.
Storages do not have to be part of the grid
infrastructure.
Hydro Pumped Storage Gas Power Plants
Transmission Grid
Distribution Grid
Service Provider
[Ref.: TIWAG 2013]

Präsentationsunterlagen Innsbruck 14.02.2014 Folie 41 Dr. Peter Bauhofer
System flexibility issues for the 21rst century
1. sufficient power reserves by production optimisation, weather – oriented DSM,
2. guaranteed power availability for defined time frames,
3. effective and efficient RES and thermal surplus recovery,
4. fast power control to meet huge residual load gradients mainly caused by PV,
5. sufficient and highly efficient storage facilities.
1. market oriented system services
2. power and energy oriented market design

Präsentationsunterlagen Innsbruck 14.02.2014 Folie 44 Dr. Peter Bauhofer
Thanks for your kind attention!
Dr. Peter Bauhofer Leiter Abt. Energiestrategie und Energieeffizienz
++43 699 1257 2511
Let’s Live a Sustainable Future!


