148
The Greenhouse Gas Protocol The GHG Protocol for Project Accounting WORLD RESOURCES INSTITUTE 2000 2010 2020 2030 204 The Greenhouse Gas Protocol The GHG Protocol for Project Accounting

The Greenhouse Gas Protocol
The GHG Protocol for Project Accounting
WORLD
RESOUR CES
I N S T I T U T E
2000 2010 2020 2030 204
TheG
reenhouse Gas Protocol
The G
HG
Protocol for P
roject Accounting
WR
I WB
CS
D
WORLD
RESOUR CES
INSTITUTE
10 G Street, NE (Suite 800)
Washington, DC 20002
USA
Tel: (1 202) 729 76 00
Fax: (1 202) 729 76 10
Web: www.wri.org
4, chemin de Conches
1231 Conches-Geneva
Switzerland
Tel: (41 22) 839 31 00
Fax: (41 22) 839 31 31
E-mail: info@ wbcsd.org
Web: www.wbcsd.org
ISBN 1-56973-598-0
JP WRI_Cover.new cov3.qxd 11/22/05 4:27 PM Page 1

About WBCSDThe World Business Council for Sustainable Development(WBCSD) is a coalition of 175 international companies united by a shared commitment to sustainable development via thethree pillars of economic growth, ecological balance and socialprogress. Our members are drawn from more than 30 countriesand 20 major industrial sectors. We also benefit from a Global Network of 50+ national and regional business councilsand partner organizations.
Our mission is to provide business leadership as a catalyst forchange toward sustainable development, and to support the business license to operate, innovate and grow in a world increasingly shaped by sustainable development issues
Our objectives include:
• Business Leadership—to be a leading business advocate onsustainable development.
• Policy Development—to participate in policy development to create the right framework conditions for business to make an effective contribution towards sustainable development.
• The Business Case—to develop and promote the business case for sustainable development.
• Best Practice—to demonstrate the business contribution to sustainable development solutions and share leading edge practices among members.
• Global Outreach—contribute to a sustainable future for developing nations and nations in transition.
About WRIThe World Resources Institute is an environmental think tank thatgoes beyond research to create practical ways to protect the Earthand improve people’s lives. Our mission is to move human societyto live in ways that protect Earth’s environment for current andfuture generations.
Our program meets global challenges by using knowledge to catalyze public and private action:
• To reverse damage to ecosystems. We protect the capacity ofecosystems to sustain life and prosperity.
• To expand participation in environmental decisions. We collaborate with partners worldwide to increase people’s access to information and influence over decisions about natural resources.
• To avert dangerous climate change. We promote public and private action to ensure a safe climate and sound world economy.
• To increase prosperity while improving the environment. We challenge the private sector to grow by improving environmentaland community well-being.
In all of our policy research and work with institutions, WRI tries tobuild bridges between ideas and actions, meshing the insights ofscientific research, economic and institutional analyses, andpractical experience with the need for open and participatory decision-making.
GHG Protocol Initiative Team
Project Management Team (PMT)This team was assigned to guide and oversee the development of the document until it was road tested in September 2003.
Mike McMahon, BPJennifer DuBose, Climate Neutral NetworkP.R. Shukla, Indian Institute of ManagementMelanie Eddis, KPMGBob Fledderman, MeadWestvacoClifford Schneider, MeadWestvacoJane Ellis, Organization for Economic Cooperation and DevelopmentRichard Tipper, The Edinburgh Centre for Carbon ManagementYasuo Hosoya, Tokyo Electric Power Company (TEPCO)
Revision Management Team (RMT)This team was instituted in December 2003, to guide the integration of feedback received from the road testing phase and advice towards the finalisation of the document.
Mike McMahon, BPArthur Lee, Chevron Corporation Einar Telnes, Det Norske Veritas (also on the DNV review team)Ken-Ichi Shinoda, Global Industrial and Social Progress Research InstituteAdam Costanza, International PaperMelanie Eddis, KPMG (also on the KPMG review team)Jed Jones, KPMG (also on the KPMG review team)Fabian Gaioli, MGM InternationalJulia Martinez, Ministry of Environment and Natural Resources (SEMARNAT), MexicoLucy Naydenova, Ministry of Housing, Spatial Planning and the Environment, NetherlandsTom Baumann, Natural Resources Canada (NRCan)Patrick Hardy, NRCanJeff Fiedler, Natural Resources Defense Council (NRDC) (also Taskforce Leader)Michelle Passero, Pacific Forest TrustAjay Mathur, Senergy GlobalSivan Kartha, Tellus InstituteMichael Lazarus, Tellus InstituteYasushi Hieda, TEPCOMartin Hession, United Kingdom Department for Environment Food and Rural Affairs (UK DEFRA)Lisa Hanle, United States Environmental Protection Agency (USEPA)Maurice LeFranc, USEPA (also Taskforce Leader)
W O R L D R E S O U R C E S I N S T I T U T E Suzie GreenhalghDerik BroekhoffFlorence DavietJanet Ranganathan
W O R L D B U S I N E S S C O U N C I L F O R S U S T A I N A B L E D E V E L O P M E N TMahua AcharyaLaurent CorbierKjell OrenHeidi Sundin
AC
KN
OW
LE
DG
EM
EN
TS
JP WRI_Cover.new cov3.qxd 11/22/05 4:27 PM Page 2

P A R T I B A C K G R O U N D , C O N C E P T S A N D P R I N C I P L E S 3
C H A P T E R 1 Introduction 4
C H A P T E R 2 Key GHG Project Accounting Concepts 10
C H A P T E R 3 Policy Aspects of GHG Project Accounting 18
C H A P T E R 4 GHG Accounting Principles 22
P A R T I I G H G R E D U C T I O N A C C O U N T I N G A N D R E P O R T I N G 25
C H A P T E R 5 Defining the GHG Assessment Boundary 28
30
30
C H A P T E R 6 Selecting a Baseline Procedure 36
37
37
C H A P T E R 7 Identifying the Baseline Candidates 38
39
39
C H A P T E R 8 Estimating Baseline Emissions—Project-Specific Procedure 48
49
50
C H A P T E R 9 Estimating Baseline Emissions—Performance Standard Procedure 60
62
64
C H A P T E R 1 0 Monitoring and Quantifying GHG Reductions 72
73
74
C H A P T E R 1 1 Reporting GHG Reductions 80
81
Table of Contents
G U I D A N C E
R E Q U I R E M E N T S
G U I D A N C E
R E Q U I R E M E N T S
G U I D A N C E
R E Q U I R E M E N T S
G U I D A N C E
R E Q U I R E M E N T S
G U I D A N C E
R E Q U I R E M E N T S
G U I D A N C E
R E Q U I R E M E N T S
R E Q U I R E M E N T S
jpText_FINAL.qxd 11/22/05 3:48 PM Page 1

P A R T I I I G H G P R O J E C T A C C O U N T I N G E X A M P L E S 83
E X A M P L E 1 Cement Sector GHG Project Using the Project-Specific Baseline Procedure 84
E X A M P L E 2 Compressor Station Efficiency Improvement GHG Project Using the Performance Standard Baseline Procedure 110
P A R T I V S U P P L E M E N T A R Y I N F O R M A T I O N 119
A N N E X A Legal Requirements 120
A N N E X B Illustrative Information Sources for Barrier Categories 122
A N N E X C Assessing Net Benefits Using Investment Analysis 123
A N N E X D Glossary 130
References 134
Contributors 138
Table of Contents
2
Lynn Betts, Natural Resources Conservation Service
jpText_FINAL.qxd 11/22/05 3:48 PM Page 2

BACKGROUND, CONCEPTS AND PRINCIPLES C H A P T E R 1 Introduction
C H A P T E R 2 Key GHG Project Accounting Concepts
C H A P T E R 3 Policy Aspects of GHG Project Accounting
C H A P T E R 4 GHG Accounting Principles
Part IjpText_FINAL.qxd 11/22/05 3:48 PM Page 3

Introduction
PA R T I4
1
he Greenhouse Gas Protocol Initiative is a multi-stakeholder partnership of businesses,
nongovernmental organisations (NGOs), governments, academics, and others convened by
the World Business Council for Sustainable Development (WBCSD) and the World Resources
Institute (WRI). Launched in 1998, the Initiative’s mission is to develop internationally accepted
greenhouse gas (GHG) accounting and reporting standards and/or protocols, and to promote their
broad adoption.
The GHG Protocol Initiative is comprised of two separate but linked modules:
• the GHG Protocol Corporate Accounting and Reporting Standard (Corporate Accounting Standard),
revised edition, published in March 2004; and
• the GHG Protocol for Project Accounting (this document).
T
jpText_FINAL.qxd 11/22/05 3:48 PM Page 4

1.1 The GHG Protocol for Project Accounting
The GHG Protocol for Project Accounting (Project
Protocol) provides specific principles, concepts, and
methods for quantifying and reporting GHG reduc-
tions—i.e., the decreases in GHG emissions, or increases
in removals and/or storage—from climate change miti-
gation projects (GHG projects). The Project Protocol is
the culmination of a four-year multi-stakeholder
dialogue and consultation process, designed to draw
knowledge and experience from a wide range of expert-
ise. During its development, more than twenty developers
of GHG projects from ten countries “road tested” a
prototype version of the Protocol, and more than a
hundred experts reviewed it.
The Project Protocol’s objectives are to:
• Provide a credible and transparent approach for quanti-
fying and reporting GHG reductions from GHG projects;
• Enhance the credibility of GHG project accounting
through the application of common accounting
concepts, procedures, and principles; and
• Provide a platform for harmonization among different
project-based GHG initiatives and programs.
To clarify where specific actions are essential to meeting
these objectives, the Project Protocol presents require-
ments for quantifying and reporting GHG reductions and
provides guidance and principles for meeting those
requirements. Though the requirements are extensive,
there is considerable flexibility in meeting them. This
flexibility arises because GHG project accounting neces-
sarily involves making decisions that directly relate to
policy choices faced by GHG programs—choices that
involve tradeoffs between environmental integrity,
program participation, program development costs, and
administrative burdens. Because the Project Protocol is
not intended to be biased toward any specific programs
or policies, the accounting decisions related to these
policy choices are left to the discretion of its users.
1.2 Who Can Use the Project Protocol?The Project Protocol is written for project developers,
but should also be of interest to administrators or
designers of initiatives, systems, and programs that
incorporate GHG projects, as well as third-party verifiers
for such programs and projects. Any entity seeking to
quantify GHG reductions resulting from projects may use
the Project Protocol. However, it is not designed to be
used as a mechanism to quantify corporate or entity-
wide GHG reductions; the Corporate Accounting
Standard should be used for that purpose.
GHG projects can be undertaken for a variety of reasons,
including generating officially recognized GHG reduction
“credits” for use in meeting mandatory emission targets,
obtaining recognition for GHG reductions under volun-
tary programs, and offsetting GHG emissions to meet
internal company targets for public recognition or other
internal strategies. Though the Project Protocol is
intended to be compatible with all of these purposes,
using it does not guarantee a particular result with
respect to quantified GHG reductions, or acceptance or
recognition by GHG programs that have not explicitly
adopted its provisions. Users are strongly encouraged to
consult with relevant programs or other interested
parties regarding the resolution of policy-relevant
accounting decisions. In the absence of external guid-
ance on these decisions, users should strive for maximum
transparency when justifying the basis of such decisions
and fulfilling the Project Protocol’s requirements.
1.3 Overview of the Project ProtocolThe Project Protocol has four parts. Part I presents GHG
project accounting concepts and principles, as well as
background information and a discussion of policy issues
related to GHG project accounting. Part II contains the
procedures and analyses that are required to quantify,
monitor, and report GHG reductions. Part III provides
two case study examples of how to quantify GHG reduc-
tions from GHG projects, and Part IV includes annexes
to supplement the requirements and guidance contained
in Parts I and II. Following are brief summaries of the
information in Parts I and II.
PART I : B A C K G R O U N D , C O N C E P T S A N D P R I N C I P L E S
• Chapter 1: Introduction. This chapter provides an
introduction to the GHG Protocol Initiative and the
Project Protocol, outlines its uses and limitations, and
provides an overview of some tools that supplement
the Project Protocol.
C H A P T E R 1 : Introduction 5
jpText_FINAL.qxd 11/22/05 3:48 PM Page 5

• Chapter 2: Key GHG Project Accounting Concepts.This chapter describes the terms and concepts used in
project-based GHG accounting. This information is
needed to properly understand and apply the Project
Protocol and should be read carefully before moving
on to the accounting chapters in Part II.
• Chapter 3: Policy Aspects of GHG Project Accounting.This chapter clarifies where and how certain decisions
about GHG project accounting relate to the policy
objectives of GHG programs.
• Chapter 4: GHG Accounting Principles. This chapter
outlines general GHG accounting principles that
underpin project-based GHG accounting. These princi-
ples are intended to guide accounting decisions when
there is flexibility or uncertainty in applying the
Project Protocol’s requirements.
PART II: G H G R E D U C T I O N A C C O U N T I N G A N D R E P O R T I N G
The chapters in Part II are intended to guide project
developers sequentially through the requirements for
GHG project accounting, monitoring, and reporting.
However, some of the requirements in different chapters
are interrelated, and some back-and-forth consultation
of chapters may be required. For instance, the full scope
of the GHG assessment boundary (Chapter 5) may not
be finalized until baseline emissions have been estimated
(Chapter 8 or 9).
The chapters in Part II are divided into “requirements”
and associated “guidance” intended to ensure that
accounting for project-based GHG reductions is
complete and transparent. To ensure that the GHG
reductions have been quantified according to the Project
Protocol, users should follow the guidance closely in
completing the requirements.
• Chapter 5: Defining the GHG Assessment Boundary.This chapter provides requirements and guidance for
identifying the GHG sources and sinks that will be
taken into account in quantifying GHG reductions. It
requires differentiating the GHG project into one or
more “project activities.” In addition to primary
effects—specific changes in GHG emissions that a
project activity is designed to achieve—project activi-
ties may result in unintended changes in GHG
emissions elsewhere, or secondary effects. The GHG
assessment boundary encompasses all these effects.
• Chapter 6: Selecting a Baseline Procedure. This
chapter provides brief guidance on choosing between
the project-specific and the performance standard
procedures for estimating “baseline emissions”—i.e.,
the emissions to which project activity emissions will
be compared in order to quantify GHG reductions.
Introduction
C H A P T E R 16
jpText_FINAL.qxd 11/22/05 3:49 PM Page 6

• Chapter 7: Identifying the Baseline Candidates. This
chapter provides requirements and guidance on how to
identify baseline candidates, which are technologies or
practices that should be considered and analysed to
estimate baseline emissions.
• Chapter 8: Estimating Baseline Emissions —Project-Specific Procedure. This chapter contains the
requirements and guidance for estimating baseline
emissions using the “project-specific” procedure. This
procedure employs a structured analysis of baseline
candidates to identify a “baseline scenario” specific to
a particular project activity.
• Chapter 9: Estimating Baseline Emissions —Performance Standard Procedure. This chapter
contains the requirements and guidance for estimating
baseline emissions using the “performance standard”
procedure. This procedure estimates baseline emissions
from a numerical analysis of all the baseline candi-
dates identified in Chapter 7.
• Chapter 10: Monitoring and Quantifying GHGReductions. This chapter describes the data that
need to be monitored in order to credibly quantify
GHG reductions.
• Chapter 11: Reporting GHG Reductions. This chapter
defines the reporting requirements needed to transpar-
ently report GHG reductions.
1.4 Issues Not Addressed by the Project Protocol
The Project Protocol intentionally does not address
several issues related to GHG projects, including
sustainable development, stakeholder consultation,
ownership of GHG reductions, uncertainty, confidential-
ity, and verification. These issues are not addressed
because they are not directly related to GHG reduction
accounting and quantification.
1 . 4 . 1 S U S T A I N A B L E D E V E L O P M E N TUnder the Kyoto Protocol’s Clean Development
Mechanism (CDM), a key provision is that GHG projects
contribute to local sustainable development goals in
addition to generating GHG reductions. Sustainable
development criteria may also be important to other
GHG programs. Because sustainable development is not
directly related to GHG accounting, the Project Protocol
does not address such provisions or criteria.
1 . 4 . 2 S T A K E H O L D E R C O N S U L T AT I O NFor many GHG projects, successful implementation (and
the furthering of sustainable development goals) will
depend on successfully soliciting and responding to
concerns from communities the GHG project affects.
While such stakeholder consultation is an important part
of project planning and implementation, the Project
Protocol does not offer guidance on this issue.
1 . 4 . 3 O W N E R S H I P O F G H G R E D U C T I O N SGHG reductions may occur at sources not under the
direct ownership or control of the project developer.
Where legal ownership of project-based GHG reductions
is sought, direct ownership or control is often an impor-
tant consideration. The Project Protocol does not
address ownership issues. Chapter 3 of the Corporate
Accounting Standard contains a discussion of ownership
and control of GHG emissions that may be relevant for
project developers seeking more guidance in this area.
1 . 4 . 4 U N C E R T A I N T YProject-based GHG accounting involves many forms of
uncertainty, including uncertainty about the identifica-
tion of secondary effects, the identification of baseline
candidates, baseline emission estimates, and the meas-
urement of GHG project emissions. Chapter 10 of this
document provides brief guidance for dealing with
uncertainty; however, the Project Protocol contains no
explicit requirements for addressing uncertainty.
1 . 4 . 5 C O N F I D E N T I A L I T YQuantifying GHG reductions can sometimes require
extensive amounts of information, including informa-
tion that a project developer, its partners, or business
competitors may consider confidential. This may be a
significant consideration for deciding whether the cred-
ible quantification of GHG reductions is realistic and
possible. The Project Protocol does not address issues
of confidentiality.
C H A P T E R 1 : Introduction 7
jpText_FINAL.qxd 11/22/05 3:49 PM Page 7

1 . 4 . 6 V E R I F I C AT I O NFor many purposes, project developers may choose to
have a third party verify their quantification of GHG
reductions. Chapter 11 of the Project Protocol contains
minimum requirements for reporting the quantification
of GHG reductions in a manner that is transparent and
allows for evaluation by interested parties. However, the
Project Protocol does not offer guidance on how to
solicit or conduct third-party verification. This is left to
the discretion of its users.
1.5 Project ProtocolTreatment of Additionality
The concept of additionality is often raised as a vital
consideration for quantifying project-based GHG reduc-
tions. Additionality is a criterion that says GHG
reductions should only be recognized for project activities
that would not have “happened anyway.” While there is
general agreement that additionality is important, its
meaning and application remain open to interpretation.
The Project Protocol does not require a demonstration of
additionality per se. Instead, additionality is discussed
conceptually in Chapter 2 and in terms of its policy dimen-
sions in Chapter 3. Additionality is incorporated as an
implicit part of the procedures used to estimate baseline
emissions (Chapters 8 and 9), where its interpretation and
stringency are subject to user discretion.
1.6 Linkages with the Corporate Accounting Standard
The Corporate Accounting Standard provides standards
and guidance for companies and other types of organisa-
tions to prepare a GHG emissions inventory at the
organisational level. Although the Corporate Accounting
Standard and Project Protocol address different business
goals, policy and regulatory contexts, and GHG account-
ing concepts and issues, they are linked through the use
of common accounting principles. In both, the principles
of relevance, completeness, consistency, transparency,
and accuracy are applied in their appropriate contexts.
The application of these principles is intended to ensure
the credible accounting of both corporate GHG emissions
and project-based GHG reductions.
A company can use both GHG Protocol Initiative
modules in combination to meet different purposes and
objectives. Where a company is developing an inventory
of its corporate-wide GHG emissions, the Corporate
Accounting Standard can be used. If the same company
develops a GHG project, then the Project Protocol can
be used to quantify its project-based GHG reductions.
The Corporate Accounting Standard includes a GHG
balance sheet showing how project-based GHG reduc-
tions can be accounted for in relation to a company’s
overall GHG emissions target.
1.7 Additional ToolsWRI and WBCSD are developing four sets of tools to
help project developers use the Project Protocol. These
tools will be available on the GHG Protocol website at
www.ghgprotocol.org.
1 . 7 . 1 G H G P R O J E C T T Y P O L O G YThe GHG Project Typology provides information to assist
project developers in identifying and classifying different
types of GHG project activities by their primary effect.
The typology includes basic guidance specific to each
type of project activity, such as how to identify baseline
candidates and secondary effects, how to conduct
monitoring, and how to address technology-specific
calculation issues.
1 . 7 . 2 S E C T O R - S P E C I F I C G U I D A N C EOver time the Project Protocol, which is broadly
applicable to all types of GHG projects, will be supple-
mented with sector-specific guidance. These guidance
documents will provide more specific and in-depth
procedures for particular types of GHG projects, such as
those involving the displacement of grid electricity and
biological carbon sequestration.
1 . 7 . 3 G H G C A L C U L AT I O N T O O L SA number of the GHG Protocol tools provide guidance on
calculating GHG emissions from different GHG sources.
Although developed for the Corporate Accounting
Standard, these tools can be adapted to calculate GHG
emissions from GHG projects. For example, the station-
ary combustion tool can be used to estimate GHG
Introduction
C H A P T E R 18
jpText_FINAL.qxd 11/22/05 3:49 PM Page 8

emissions from a project activity that involves fuel
switching. The tools that are currently available include
cross-sector and sector-specific tools.
Cross-sector tools include:
• Stationary combustion
• Mobile combustion
• Measurement and estimation of uncertainty
• Use of hydrofluorocarbons (HFCs) in refrigeration and
air-conditioning equipment
Sector-specific tools include:
• Aluminium
• Iron and steel
• Nitric acid
• Ammonia
• Adipic acid
• Cement
• Lime
• Office-based organisations
• Pulp and paper mills
• HFC-23 from HCFC-22 production
• Semi-conductors
• Wood product manufacturing
1 . 7 . 4 R E L AT I O N S H I P B E T W E E N T H E P R O J E C TP R O T O C O L A N D O T H E R I N T E R N AT I O N A LP R O J E C T- B A S E D I N I T I AT I V E S
The Kyoto Protocol’s CDM is currently the chief inter-
national initiative involving project-based GHG
reductions. In principle, the methods and procedures
provided in the Project Protocol can be used for the
development of GHG projects for the CDM. Similarly,
the International Organization for Standardization
(ISO) provides ISO 14064, which includes an interna-
tional standard on GHG accounting and reporting for
GHG mitigation projects. The guidance provided by the
Project Protocol can facilitate the application of the
ISO requirements.
A mapping of key concepts between both initiatives
and the Project Protocol will be provided on the GHG
Protocol Initiative website. This will enable partici-
pants in these initiatives to understand how to use the
Project Protocol alongside these initiatives.
C H A P T E R 1 : Introduction 9
jpText_FINAL.qxd 11/22/05 3:49 PM Page 9

Key GHG Project Accounting Concepts
PA R T I10
2
number of key concepts must be understood to account for GHG reductions from GHG
projects. This chapter explains the importance of these concepts and describes how
and where they are used in Part II of the Project Protocol. The concepts presented here
are also defined in the glossary in Annex D.
A
jpText_FINAL.qxd 11/22/05 3:49 PM Page 10

2.1 GHG ProjectA GHG project consists of a specific activity or set of
activities intended to reduce GHG emissions, increase
the storage of carbon, or enhance GHG removals from
the atmosphere. A GHG project may be a stand-alone
project or a component of a larger non-GHG project,
and may be comprised of one or more project activities.
Part II of the Project Protocol focuses on accounting
for and reporting the GHG reductions that result from
a single GHG project.
2.2 Project ActivityA project activity is a specific action or intervention
targeted at changing GHG emissions, removals, or stor-
age. It may include modifications to existing production,
process, consumption, service, delivery or management
systems, as well as the introduction of new systems.
Under the Project Protocol, properly identifying and
defining project activities is crucial (see Chapter 5).
GHG reductions are determined separately for each
project activity associated with a GHG project.
Chapters 6 through 9 of the Project Protocol deal
specifically with determining GHG reductions from
individual project activities. If a GHG project involves
more than one activity, its total GHG reductions are
quantified as the sum of the GHG reductions from each
project activity (see Chapter 10).
2.3 GHG Source/SinkA GHG source is any process that releases GHG emis-
sions into the atmosphere. Under the Project Protocol,
there are five general GHG source categories:
• combustion emissions from generating grid-
connected electricity;
• combustion emissions from generating energy or
off-grid electricity, or from flaring;
• industrial process emissions—e.g., carbon dioxide
(CO2) from the production of clinker for cement;
• fugitive emissions—e.g., GHG leaks from pipelines;
and
• waste emissions—e.g., GHG emissions from landfills.
A GHG sink is any process that removes and stores GHG
emissions from the atmosphere. The Project Protocol
identifies one GHG sink category: increased storage or
removals of CO2 by biological processes.
The GHG sources and sinks affected by a project activity
must be identified to determine the project activity’s
GHG effects (see Chapter 5), and to specify how emis-
sions from GHG sources and sinks affected by the project
activity will be monitored (see Chapter 10).
2.4 GHG EffectsGHG effects are changes in GHG emissions, removals, or
storage caused by a project activity. There are two types
of GHG effects: primary effects and secondary effects.
P R I M A R Y E F F E C T SA primary effect is the intended change caused by a
project activity in GHG emissions, removals, or storage
associated with a GHG source or sink. Each project
activity will generally have only one primary effect.
The primary effect is defined as a change relative to
baseline emissions (see Figure 2.1), which are deter-
mined using either of the baseline procedures presented
in Chapters 8 and 9. Primary effects are identified for
each project activity in Chapter 5.
S E C O N D A R Y E F F E C T SA secondary effect is an unintended change caused by a
project activity in GHG emissions, removals, or storage
associated with a GHG source or sink (see Box 2.1).
Secondary effects are typically small relative to a proj-
ect activity’s primary effect. In some cases, however,
they may undermine or negate the primary effect.
Secondary effects are classified into two categories:
• One-time effects—Changes in GHG emissions associ-
ated with the construction, installation, and
establishment or the decommissioning and termination
of the project activity.
• Upstream and downstream effects—Recurring
changes in GHG emissions associated with inputs
to the project activity (upstream) or products from
C H A P T E R 2 : Key GHG Project Accounting Concepts 11
jpText_FINAL.qxd 11/22/05 3:49 PM Page 11

the project activity (downstream), relative to
baseline emissions.
Some upstream and downstream effects may involve
market responses to the changes in supply and/or
demand for project activity inputs or products. Only
significant secondary effects, however, need to be
monitored and quantified under the Project Protocol.
Whether a secondary effect is considered significant
depends on its magnitude relative to its associated
primary effect and on circumstances surrounding the
associated project activity.
Secondary effects for each project activity are identified
in Chapter 5, which includes guidance on how to assess
their significance and mitigate them.
2.5 GHG Assessment BoundaryThe GHG assessment boundary encompasses all primary
effects and significant secondary effects associated with the
GHG project. Where the GHG project involves more than
one project activity, the primary and significant secondary
effects from all project activities are included in the GHG
assessment boundary. The GHG assessment boundary is
used to identify the GHG sources and sinks that must be
examined to quantify a project’s GHG reductions. It is not
a physical or legal “project boundary.” Primary and signif-
icant secondary effects are considered within the GHG
assessment boundary, irrespective of whether they occur
near the project, or at GHG sources or sinks owned or
controlled by the project participants. Under the Project
Protocol, it is not necessary to define a project boundary
based on a GHG project’s physical dimensions or according
to what is owned or controlled.
2.6 GHG ReductionsThroughout the Project Protocol, the term GHG reduction
refers to either a reduction in GHG emissions or an
increase in removals or storage of GHGs from the atmos-
phere, relative to baseline emissions. Primary effects will
result in GHG reductions, as will some secondary effects.
A project activity’s total GHG reductions are quantified
as the sum of its associated primary effect(s) and any
significant secondary effects (which may involve
decreases or countervailing increases in GHG emissions).
A GHG project’s total GHG reductions are quantified as
the sum of the GHG reductions from each project activity.
Chapter 10 contains requirements and guidance on how
to quantify the GHG reductions from each project activity
and the GHG project.
2.7 Baseline CandidatesBaseline candidates are alternative technologies or prac-
tices, within a specified geographic area and temporal
range, that could provide the same product or service as
a project activity. The identification of baseline candi-
dates is required to estimate the baseline emissions for
the project activity. Baseline candidates are identified
for each project activity in Chapter 7, which includes
guidance on how to define an appropriate geographic
area and temporal range.
2.8 Baseline ScenarioThe baseline scenario is a reference case for the project
activity. It is a hypothetical description of what would
have most likely occurred in the absence of any consider-
ations about climate change mitigation. The baseline
scenario is used to estimate baseline emissions (see
Figure 2.1). There are three generic possibilities for the
baseline scenario:
• implementation of the same technologies or practices
used in the project activity;
• implementation of a baseline candidate; or
• the continuation of current activities, technologies, or
practices that, where relevant, provide the same type,
quality, and quantity of product or service as the proj-
ect activity.
Key GHG Project Accounting Concepts
C H A P T E R 212
Secondary effects are sometimes referred to as “leakage” in theGHG project literature and by some GHG programs. However, thedefinition of leakage varies from context to context (e.g., it issometimes defined with respect to physical project boundariesor to ownership or control of GHG emission sources). Under theProject Protocol, the term secondary effect is used to avoidconfusion with the varying interpretations of the term leakage.
B O X 2 . 1 Secondary effects and leakage
jpText_FINAL.qxd 11/22/05 3:49 PM Page 12

An explicit baseline scenario for a project activity is
identified only if the project-specific baseline procedure
is used to estimate baseline emissions (Chapter 8). If the
performance standard baseline procedure is used, base-
line emissions are estimated without explicitly
identifying a baseline scenario (see Chapter 9).
2.9 Baseline EmissionsGHG reductions from a project activity are quantified
relative to baseline emissions, which refers broadly to
baseline GHG emissions, removals, or storage. Baseline
emissions associated with primary effects are derived
from either a baseline scenario (Chapter 8) or a
performance standard (Chapter 9). Baseline emissions
associated with secondary effects are estimated in
Chapter 5 and will be linked to the project-specific base-
line scenario. If the performance standard procedure is
used, baseline emissions associated with secondary
effects are inferred from baseline candidates or are esti-
mated conservatively.
2.10 Baseline ProceduresBaseline procedures are methods used to estimate baseline
emissions. The Project Protocol describes two procedures:
• Project-specific procedure—This procedure produces
an estimate of baseline emissions through the identifi-
cation of a baseline scenario specific to the proposed
project activity. The baseline scenario is identified
through a structured analysis of the project activity
and its alternatives. Baseline emissions are derived
from the baseline scenario and are valid only for the
project activity being examined. This procedure is
described in Chapter 8.
• Performance standard procedure—This procedure
produces an estimate of baseline emissions using a
GHG emission rate derived from a numerical analysis
of the GHG emission rates of all baseline candidates.
A performance standard is sometimes referred to as a
multi-project baseline or benchmark, because it can
be used to estimate baseline emissions for multiple
project activities of the same type. It serves the same
function as a baseline scenario, but avoids the need to
identify an explicit baseline scenario for each project
activity. The performance standard procedure is
described in Chapter 9.
C H A P T E R 2 : Key GHG Project Accounting Concepts 13
GHG reductions must be quantified relative to a reference level of GHG emissions. Under national and corporate-level GHG accounting,reductions are typically quantified against actual GHG emissions in a historical base year (see Figure 2.1a). For project-based GHGaccounting, however, GHG reductions are quantified against a forward-looking, counter-factual baseline scenario (see Figure 2.1b). Themost important challenge for GHG project accounting is identifying and characterizing the baseline scenario.
Actual GHG reduc-tions relative to Year 1 emissions
F I G U R E 2 . 1 a : Comparison against a base year for corporate/entity accounting
F I G U R E 2 . 1 b : Comparison against a baseline scenario forproject accounting
F I G U R E 2 . 1 Quantifying GHG reductions relative to a baseline scenario
GH
GEM
ISSI
ON
S
Y E A R 1 Y E A R 2
} Claimed GHG reductions relative to baseline scenario
Baseline Emissions
Project Emissions
GH
GEM
ISSI
ON
S
Y E A R 1 Y E A R 2
}
jpText_FINAL.qxd 11/22/05 3:49 PM Page 13

2.11 Valid Time Length for the Baseline Scenario
Generally, the farther out into the future one tries to proj-
ect “what would have happened,” the more uncertain this
projection becomes. For this reason, a particular baseline
scenario or performance standard should be valid only for
a finite period of time for the purpose of estimating base-
line emissions. After a certain period, either no further
GHG reductions are recognized for the project activity, or
a new (revised) baseline scenario or performance stan-
dard is identified. The length of this period may vary,
depending on technical and policy considerations,1 and on
whether baseline emission estimates are dynamic or static
(see Figure 2.2). The valid time length for the baseline
scenario of each project activity is determined in
Chapter 10, as a prelude to quantifying GHG reductions.
2.12 Dynamic Versus Static Baseline Emission Estimates
Baseline emissions are often estimated using an emission
rate, relating GHG emissions to the production of a
product or service or to a certain period of time.
Baseline emission rates may be dynamic or static. Static
baseline emission rates do not change over time, while
dynamic baseline emission rates change over time.
A static baseline emission rate is most appropriate for
GHG projects that are substituting for existing plants or
technologies where it can be reasonably assumed that
basic operating parameters will not change over a certain
time period (see Figure 2.2a). In contrast, dynamic base-
line emission rates are better suited to GHG projects that
are part of a system that changes significantly over time
(see Figure 2.2b). Two types of GHG projects that may
require dynamic baseline emission rates include:
• Electricity supply projects—The baseline emission
rate may be based on displaced generation sources
that are expected to change significantly over time.
• LULUCF projects—The baseline emission rate may
change over time to reflect the changing growth
patterns of carbon stocks in trees.
2.13 Equivalence of Products and ServicesNearly every project activity will provide products or
services in the context of some broader market for them.
Therefore, if the project activity were not implemented,
it should be assumed that the market would have
provided a quantity and quality of products or services
equivalent to what the project activity would have
produced.2 This is particularly true when a GHG project
is small relative to the market in which it operates (i.e.,
its presence or absence will not affect market prices).
This concept of equivalence has broad application in the
quantification of GHG reductions. For example:
• Identifying secondary effects (Chapter 5)—If a
project activity reduces the production of a product or
Key GHG Project Accounting Concepts
C H A P T E R 214
Baseline emission rates may be dynamic or static. Static baseline emission rates do not change over time, while dynamic baseline emission rates change over time.
L = end of valid time length for the baseline scenario
F I G U R E 2 . 2 a : Static emission rate F I G U R E 2 . 2 b : Dynamic emission rate
F I G U R E 2 . 2 Dynamic and static baseline emission rate estimates
BAS
ELIN
E EM
ISSI
ON
RAT
E
T I M E L
BAS
ELIN
E EM
ISSI
ON
RAT
E
T I M E L
jpText_FINAL.qxd 11/22/05 3:49 PM Page 14

service, the market will compensate and provide a level
of production equivalent to that in the baseline scenario.
This response may give rise to a secondary effect.
• Identifying baseline candidates (Chapter 7)—Baseline candidates should be capable of providing
the same quality of products or services as the project
activity. Furthermore, if the project-specific baseline
procedure is used, baseline candidates should be
capable of providing the same quantity of products
or services as the project activity.
• Estimating baseline emissions (Chapters 8 and 9)—Baseline emissions should be estimated by assuming
equivalent quality and quantities of production in the
baseline scenario as in the project activity.
Some exceptions to equivalence will occur only when the
market for the products or services provided by a project
activity is poorly functioning or nonexistent, or where a
project activity is so large that the market response
would not have been proportional (e.g., because the proj-
ect activity is large enough to change market prices
relative to the baseline scenario, causing a change in the
total quantity produced). In quantifying GHG reductions,
project developers should fully explain any exceptions to
the assumption of equivalence.
2.14 AdditionalityAs previously described in section 2.9, project-based
GHG reductions are quantified relative to baseline
emissions, which are derived either from an identified
baseline scenario (see Figure 2.1) or by using a
performance standard that serves the same function as
a baseline scenario. Though the presumption is gener-
ally that a project activity differs from its baseline
scenario, in some cases, a project activity (or the same
C H A P T E R 2 : Key GHG Project Accounting Concepts 15
jpText_FINAL.qxd 11/22/05 3:49 PM Page 15

technologies or practices it employs) may have been
implemented “anyway.” In these cases, the project
activity and its baseline scenario are effectively identical.
While such a project activity may appear to reduce GHG
emissions relative to historical emission levels, compared
to its baseline scenario the project activity does not reduce
GHG emissions. In the context of GHG programs, it is
important to count only GHG reductions from project
activities that differ from—or are additional to—their
baseline scenarios (see Box 2.2). Distinguishing a project
activity from its baseline scenario is often referred to as
determining additionality.
While the basic concept of additionality may be easy to
understand, there is no common agreement about how to
prove that a project activity and its baseline scenario are
different. The two baseline procedures (project-specific
and performance standard) presented in Chapters 8 and
9 of the Project Protocol reflect two different method-
ological approaches to additionality.
T H E P R O J E C T- S P E C I F I C A P P R O A C H T O A D D I T I O N A L I T YThe project-specific approach to additionality aims to
identify a distinct baseline scenario specific to the project
activity, in spite of subjective uncertainties involved in
doing so. The reasoning behind this approach is that a
rigorously identified baseline scenario is all that is neces-
sary to establish additionality: if the project activity is
different from its baseline scenario, it is additional.
However, because identifying a baseline scenario always
involves some uncertainty, many observers argue that
this approach should be combined with explicit addition-
ality tests. (Some of these tests are described in Chapter
3, which discusses the policy dimensions of additionality.)
T H E P E R F O R M A N C E S T A N D A R D A P P R O A C H T O A D D I T I O N A L I T YThe second approach is to avoid project-specific
determinations of additionality and instead try to ensure
the overall additionality of quantified GHG reductions
from multiple project activities. This is done by develop-
ing a performance standard, which provides an estimate
of baseline emissions that would otherwise be derived
from baseline scenarios for each project activity. Under
this approach, the presumption is that any project activity
will produce additional GHG reductions if it has a lower
GHG emission rate than the performance standard.3 A
performance standard can provide a consistent way to
address additionality for a number of similar project
activities and avoids having to identify individual baseline
scenarios. The challenge is to set the performance stan-
dard at a sufficiently stringent level to ensure that, on
balance, only additional GHG reductions are quantified.
NOTES1 See Chapter 3 for a discussion of the policy considerations.
2 Alternatively, if the project activity involves reducing the production of a prod-
uct or service, the market will generally respond by making up for this lost
production when the project activity is implemented.
3 Or a higher GHG removal rate in the case of project activities involving GHG sinks.
Key GHG Project Accounting Concepts
C H A P T E R 216
jpText_FINAL.qxd 11/22/05 3:49 PM Page 16

C H A P T E R 2 : Key GHG Project Accounting Concepts 17
GHG emission trading programs operate by capping the emissionsof a fixed number of individual facilities or sources. Under theseprograms, tradable “offset credits” are issued for project-basedGHG reductions that occur at sources not covered by the program.Each offset credit allows facilities whose emissions are capped toemit more, in direct proportion to the GHG reductions represented bythe credit. The idea is to achieve a zero net increase in GHG emis-sions, because each tonne of increased emissions is “offset” byproject-based GHG reductions.
The difficulty is that many projects that reduce GHG emissions (rela-tive to historical levels) would happen regardless of the existence ofa GHG program and without any concern for climate change mitiga-tion. If a project “would have happened anyway,” then issuing offsetcredits for its GHG reductions will actually allow a positive netincrease in GHG emissions, undermining the emissions target of theGHG program. Additionality is thus critical to the success andintegrity of GHG programs that recognize project-based GHGreductions. The following table (Table 2.1) illustrates this concept.
B O X 2 . 2 Why additionality is important
T A B L E 2 . 1 Illustration of GHG emission balances with and without “additional” reductions
T Y P E S O F G H G E M I S S I O N S
GHG emissions that would have occurred without a GHG program1
GHG emissions under a GHG program cap of 15,000tonnes, without offset credits2
GHG emissions under a GHG program cap of 15,000tonnes, with 2,500 tonnes in offset credits based on“additional” reductions3
GHG emissions under a GHG program cap of 15,000tonnes, with 2,500 tonnes in offset credits for reduc-tions that “would have happened anyway”4
C A P P E D S O U R C E S
20,000 tonnes
15,000 tonnes
17,500 tonnes
17,500 tonnes
U N C A P P E D S O U R C E S
50,000 tonnes
50,000 tonnes
47,500 tonnes
50,000 tonnes
T O T A L
70,000 tonnes
65,000 tonnes
65,000 tonnes
67,500 tonnes
N O T E S :1 The GHG emissions from “capped sources” are what would have occurred at
the plants and facilities the GHG program is intending to cap, if there hadbeen no GHG program. The uncapped source emissions are net of any GHGreductions that “would have happened anyway”.
2 In this case, a GHG program is in place with a cap of 15,000 tonnes, caus-ing a net reduction of 5,000 tonnes in overall GHG emissions. Uncappedsources remain unaffected.
3 In this case, 2,500 tonnes of additional GHG reductions are achieved atuncapped sources, resulting in a net 2,500 tonne decrease in GHG emissionsfrom these sources to 47,500 tonnes. The credits used to achieve these
reductions allow the capped sources to emit an additional 2,500 tonnesbeyond the 15,000 tonnes they were originally limited to, so GHG emissionsfrom capped sources rise to 17,500 tonnes. Total GHG emissions, however,remain the same, as if there were a cap with no offset credits.
4 In this case, credits are issued for GHG reductions that “would have happenedanyway.” In other words, GHG emissions at uncapped sources are the same asthey would have been without the presence of any GHG program (i.e., 50,000tonnes). Total emissions increase because capped sources are allowed to emitmore due to the credits (in this case, an increase of 2,500 tonnes).
jpText_FINAL.qxd 11/22/05 3:49 PM Page 17

Policy Aspects of GHG Project Accounting
PA R T I18
3
HG project accounting necessarily involves making decisions that directly relate to
policy choices faced by GHG programs. These policy choices involve tradeoffs between
environmental integrity, program participation, program development costs, and
administrative burdens. This chapter seeks to clarify the major areas where decisions about GHG
project accounting relate to the policy objectives of GHG programs. It is explanatory in nature and
contains no requirements, but will be helpful to consider regardless of whether a specific GHG
program is involved. The chapter covers five major areas where GHG accounting decisions are
relevant to policy objectives:
• 3.1 Additionality
• 3.2 Selection of Baseline Procedures
• 3.3 Secondary Effects Accounting
• 3.4 Valid Time Length for Baseline Scenarios
• 3.5 Static Versus Dynamic Baseline Emission Estimates
G
jpText_FINAL.qxd 11/22/05 3:49 PM Page 18

3.1 AdditionalityAs noted in Chapter 2, section 2.14, additionality is a
critical concern for GHG programs. Whatever methods are
used to address additionality, a GHG program must decide
how stringent to make its additionality rules and criteria
based on its policy objectives. Under the project-specific
approach, stringency is determined by the weight of
evidence required to identify a particular baseline scenario
(and possibly to pass any required additionality tests—see
Box 3.1). Under the performance standard approach,
stringency is determined by how low the performance
standard GHG emission rate is relative to the average
GHG emission rate of similar practices or technologies.1
Setting the stringency of additionality rules involves a
balancing act. Additionality criteria that are too lenient
and grant recognition for “non-additional” GHG reduc-
tions will undermine the GHG program’s effectiveness. On
the other hand, making the criteria for additionality too
stringent could unnecessarily limit the number of recog-
nized GHG reductions, in some cases excluding project
activities that are truly additional and highly desirable.
In practice, no approach to additionality can completely
avoid these kinds of errors. Generally, reducing one type
of error will result in an increase of the other.
Ultimately, there is no technically correct level of strin-
gency for additionality rules. GHG programs may decide
based on their policy objectives that it is better to avoid
one type of error than the other. For example, a focus on
environmental integrity may necessitate stringent addi-
tionality rules. On the other hand, GHG programs that
are initially concerned with maximizing participation
and ensuring a vibrant market for GHG reduction credits
may try to reduce “false negatives”—i.e., rejecting
project activities that are additional—by using only
moderately stringent rules.
3.2 Selection of Baseline ProceduresUnder the Project Protocol, there are two possible
procedures for estimating baseline emissions: the
project-specific procedure and performance standard
procedure. The choice of a baseline procedure will
affect the outcome of any GHG project accounting
effort, since the two procedures can lead to different
levels of quantified GHG reductions, even for the same
project activity. As their names imply, however, these
procedures are conceptually linked to the project-
specific and performance standard approaches for
dealing with additionality, as outlined in Chapter 2
(section 2.14). Any choice about which procedure to
use is thus relevant to GHG program concerns about
additionality. Moreover, as a practical matter, GHG
programs may decide that one or the other procedure is
preferred on administrative grounds. Requiring the
project-specific procedure, for example, may involve
less preparatory work in starting a GHG program (in
exchange for more administrative work later on),
whereas developing performance standards may require
significant upfront investment of resources, but may
lower transaction costs once the GHG program is
underway. From a GHG program perspective, such
policy considerations are important in deciding which
baseline procedure project developers should use.
3.3 Secondary Effects AccountingIf a secondary effect involves a significant increase in
GHG emissions, it can undermine or even negate a proj-
ect activity’s primary effect (see Chapter 2, section 2.4).
Therefore, accurately accounting for the GHG reductions
caused by a project activity requires some examination
of secondary effects. The practical challenge is deciding
how far to go in this examination.
One question concerns breadth. In a full “life cycle
analysis” of GHG emissions2 for a particular product, for
example, one could in principle examine GHG emissions
associated not just with inputs to the product, but also
the inputs to those inputs, and so on up the product’s
“value chain.” Generally, the cost and time requirements
for this kind of analysis are prohibitive. Another question
concerns significance. The secondary effects for many
types of GHG projects can be relatively small, particu-
larly for small projects. Yet time and money are still
required to estimate, monitor, and quantify these effects.
GHG project accounting requires decisions about the
tradeoff between accounting for secondary effects and the
time and effort required to do so. From the perspective of
GHG programs, requiring an extensive and detailed
accounting of secondary effects will help to ensure envi-
ronmental integrity, but could limit program participation,
since these requirements may be too burdensome for some
project developers. Strict requirements could also increase
administrative costs incurred to evaluate or verify second-
C H A P T E R 3 : Policy Aspects of GHG Project Accounting 19
jpText_FINAL.qxd 11/22/05 3:49 PM Page 19

Policy Aspects of GHG Project Accounting
C H A P T E R 320
As noted in Chapter 2, many observers argue that the identificationof a project activity’s baseline scenario should be accompanied byan explicit demonstration of additionality using various additional-ity “tests.” Some illustrative additionality tests are presented inTable 3.1. Generally, these tests try to isolate the reasons for imple-menting a GHG project—particularly whether achieving GHGreductions was a decisive reason for implementing it (even if onlyone among many). They involve evaluating objective conditions thatare assumed to indicate reasons for initiating a project. They are
intended only to help establish that the GHG project and baselinescenario are different, and are applied separately from the actualidentification of a baseline scenario.
However, there is no agreement about the validity of any particularadditionality test, or about which tests project developers shoulduse. GHG programs must decide on policy grounds whether torequire additionality tests, and which tests to require. Becausetheir use is a matter of policy, the Project Protocol does not requireany of these tests.
B O X 3 . 1 Policy and the use of additionality “tests”
T A B L E 3 . 1 Examples of possible “tests” for additionality
T E S T
Legal, Regulatory, or Institutional Test
Technology Test
Investment Test
Common Practice Test
Timing Test
G E N E R A L D E S C R I P T I O N O F T H E T E S T A S I T I S C O M M O N LY F O R M U L AT E D
The GHG project must reduce GHG emissions below the level required (or effectively required) by any offi-cial policies, regulations, guidance, or industry standards. If these reductions are not achieved, theassumption is that the only real reason for doing the project is to comply with regulations, and anyclaimed GHG reductions are not additional.
The GHG project and its associated GHG reductions are considered additional if the GHG project involvesa technology that is not likely to be employed for reasons other than reducing GHG emissions. The defaultassumption is that for these technologies, GHG reductions are a decisive reason (if not the only reason)for implementing them. GHG projects involving other technologies could still be considered additional,but must demonstrate additionality through some other means.
Under the most common version of this test, a GHG project is assumed to be additional if it can bedemonstrated (e.g., through the divulgence of project financial data) that it would have a low rate ofreturn without revenue from GHG reductions. The underlying assumption is that GHG reductions must bea decisive reason for implementing a project that is not an attractive investment in the absence of anyrevenue associated with its GHG reductions. A GHG project with a high or competitive rate of return couldstill be additional, but must demonstrate additionality through some other means.
The GHG project must reduce GHG emissions below levels produced by “common practice” technologiesthat produce the same products and services as the GHG project. If it does not, the assumption is thatGHG reductions are not a decisive reason for pursuing the project (or conversely, that the only real reasonis to conform to common practice for the same reasons as other actors in the same market). Therefore,the GHG project is not considered to be additional.
The GHG project must have been initiated after a certain date to be considered additional. The implicitassumption is that any project started before the required date (e.g., before the start of a GHG program)could not have been motivated by GHG reductions. Under most versions of this test, though, GHG projectsstarted after the required date must still further establish additionality through some other test.
jpText_FINAL.qxd 11/22/05 3:49 PM Page 20

ary effects. The extent and detail of secondary effects
analysis are, therefore, essentially policy decisions from
the perspective of GHG programs.
3.4 Valid Time Length for Baseline Scenarios
Technical considerations can inform a decision about
what the valid time length should be for a baseline
scenario or performance standard. For example, technol-
ogy and economic trends may suggest an appropriate
time length for specific project types within a particular
geographic area. For GHG programs, however, deciding
on different valid time lengths for the baseline scenarios
of individual project activities is likely to be too cumber-
some. Instead, it is often easier for administrative
reasons—and to provide consistent expectations for proj-
ect developers—to simply adopt a common valid time
length for all baseline scenarios or performance stan-
dards (usually several years). In the context of GHG
programs, such administrative and policy considerations
are likely to be the key deciding factors in how long base-
line scenarios or performance standards will be valid.
3.5 Static Versus Dynamic Baseline Emission Estimates
From a GHG program policy perspective, the key issue
in choosing between static or dynamic baseline emission
estimates once again involves a tradeoff between
environmental integrity and program participation.
Generally, dynamic baseline emission estimates ensure
a greater degree of environmental integrity by keeping
estimates accurate and in line with changing circum-
stances. The tradeoff is that dynamic baseline estimates
may increase transaction costs under a GHG program
and will increase uncertainty for project developers.
This could discourage investment and limit participation
in the GHG program.
NOTES1 Or how high the performance standard GHG removal rate is relative to aver-
age GHG removal rates.
2 In some cases, the Project Protocol refers to “GHG emissions” to encompass
both the emissions that are a direct product of a GHG source and the removals
that are a direct product of a GHG sink.
21
jpText_FINAL.qxd 11/22/05 3:49 PM Page 21

GHG Accounting Principles
PA R T I22
4
ix principles are intended to underpin all aspects of the accounting, quantification, and
reporting of project-based GHG reductions. Their purpose is to guide decisions where
the Project Protocol affords flexibility or discretion, or where the requirements and
guidance are ambiguous with respect to a particular situation. The application of these principles
will help ensure the credibility and consistency of efforts to quantify and report project-based
GHG reductions according to the Project Protocol.
The principles are derived in part from accepted financial accounting and reporting principles
and are largely the same as those that guide the Corporate Accounting and Reporting Standard.
S
jpText_FINAL.qxd 11/22/05 3:49 PM Page 22

4.1 RelevanceUse data, methods, criteria, and assumptions that areappropriate for the intended use of reported information
The quantification and reporting of GHG reductions
should include only information that users—both inter-
nal and external to the GHG project—need for their
decision-making. This information should thus fit the
intended purpose of the GHG project and meet the
expectations or requirements of its users. Data, methods,
criteria, and assumptions that are misleading or that do
not conform to Project Protocol requirements are not
relevant and should not be included.
4.2 CompletenessConsider all relevant information that may affect theaccounting and quantification of GHG reductions, andcomplete all requirements
All relevant information should be included in the quan-
tification of GHG reductions. Among other things, this
means that all the GHG effects of a GHG project should
be considered and assessed (Chapter 5), all relevant
technologies or practices should be considered as base-
line candidates (Chapter 7), and all relevant baseline
candidates should be considered when estimating base-
line emissions (Chapters 8 and 9). The GHG project’s
monitoring plan should also specify how all data
relevant to quantifying GHG reductions will be collected
(Chapter 10). Finally, notwithstanding areas where
there is flexibility and discretion, all requirements
within relevant chapters should be completed to quan-
tify and report GHG reductions.
4.3 ConsistencyUse data, methods, criteria, and assumptions thatallow meaningful and valid comparisons
The credible quantification of GHG reductions requires
that methods and procedures are always applied to a
GHG project and its components in the same manner,
that the same criteria and assumptions are used to
evaluate significance and relevance, and that any data
collected and reported will be compatible enough to
allow meaningful comparisons over time.
4.4 TransparencyProvide clear and sufficient information for reviewers to assess the credibility and reliability ofGHG reduction claims
Transparency is critical for quantifying and reporting
GHG reductions, particularly given the flexibility and
policy-relevance of many GHG accounting decisions
(see Chapter 3). GHG project information should be
compiled, analysed, and documented clearly and
coherently so that reviewers may evaluate its credibility.
Specific exclusions or inclusions should be clearly
identified, assumptions should be explained, and appro-
priate references should be provided for both data and
C H A P T E R 4 : GHG Accounting Principles 23
jpText_FINAL.qxd 11/22/05 3:49 PM Page 23

assumptions. Information relating to the GHG
assessment boundary, the identification of baseline candi-
dates, and the estimation of baseline emissions should be
sufficient to enable reviewers to understand how all
conclusions were reached. A transparent report will
provide a clear understanding of all assessments support-
ing GHG reduction accounting and quantification. This
should be supported by comprehensive documentation of
any underlying evidence to confirm and substantiate the
data, methods, criteria, and assumptions used.
4.5 AccuracyReduce uncertainties as much as is practical
Uncertainties with respect to GHG measurements, esti-
mates, or calculations should be reduced as much as is
practical, and measurement and estimation methods
should avoid bias. Acceptable levels of uncertainty will
depend on the objectives for implementing a GHG proj-
ect and the intended use of quantified GHG reductions.
Greater accuracy will generally ensure greater credibility
for any GHG reduction claim. Where accuracy is sacri-
ficed, data and estimates used to quantify GHG
reductions should be conservative.
4.6 ConservativenessUse conservative assumptions, values, and procedureswhen uncertainty is high
GHG reductions should not be overestimated. Where
data and assumptions are uncertain and where the cost of
measures to reduce uncertainty is not worth the increase
in accuracy, conservative values and assumptions should
be used. Conservative values and assumptions are those
that are more likely to underestimate than overestimate
GHG reductions.
GHG Accounting Principles
C H A P T E R 424
jpText_FINAL.qxd 11/22/05 3:49 PM Page 24

GHG Reduction Accounting and ReportingC H A P T E R 5 Defining the GHG Assessment Boundary
C H A P T E R 6 Selecting a Baseline Procedure
C H A P T E R 7 Identifying the Baseline Candidates
C H A P T E R 8 Estimating Baseline Emissions — Project-Specific Procedure
C H A P T E R 9 Estimating Baseline Emissions — Performance Standard Procedure
C H A P T E R 1 0 Monitoring and Quantifying GHG Reductions
C H A P T E R 1 1 Reporting GHG Reductions
Part IIjpText_FINAL.qxd 11/22/05 3:49 PM Page 25

The chapters in Part II are intended to guide project
developers sequentially through the requirements for
GHG project accounting, monitoring, and reporting.
Chapters 6 through 9 are completed for each project
activity comprising the GHG project. Some of the
requirements in different chapters are interrelated, and
some back-and-forth consultation of chapters may be
required. In particular, the definition of the GHG assess-
ment boundary (Chapter 5) may require modification
depending on the final identification of each project
activity’s baseline emissions (Chapters 8 or 9). The
following diagram provides a “road map” for how the
Part II chapters should be followed. The GHG account-
ing principles (Chapter 4) should inform decisions
throughout each of these chapters.
GHG Reduction Accounting and Reporting
26
jpText_FINAL.qxd 11/22/05 3:49 PM Page 26

PA R T I I : GHG Reduction Accounting and Reporting 27
Steps for accounting and reporting GHG reductions from a GHG project
Select Baseline Procedure(Chapter 6)
Identify Baseline Candidates(Chapter 7)
Define GHG Assessment Boundary(Chapter 5)
Monitor and Quantify GHG Reductions(Chapter 10)
Report GHG Reductions(Chapter 11)
Estimate Baseline Emissions: Project-Specific Procedure
(Chapter 8)
Estimate Baseline Emissions:Performance Standard Procedure
(Chapter 9) }Refine GHG AssessmentBoundary (as necessary)
Complete for eachProject Activity
The GHG accounting princi-ples (Chapter 4) shouldinform decisions throughouteach step—including thereporting of GHG reductions.
jpText_FINAL.qxd 11/22/05 3:49 PM Page 27

Defining the GHG Assessment Boundary
PA R T I I28
5
or a comprehensive accounting of GHG reductions, it is necessary to set a GHG assess-
ment boundary that includes all the primary effects and significant secondary effects of
a GHG project.
Defining a GHG assessment boundary involves:
• identifying the project activity (or activities) that comprise the GHG project;
• identifying the primary and secondary effects associated with each project activity; and
• thoroughly analyzing the secondary effects to determine which are significant for the purpose of
estimating and quantifying GHG reductions.
F
jpText_FINAL.qxd 11/22/05 3:49 PM Page 28

C H A P T E R 5 : Defining the GHG Assessment Boundary 29
The GHG assessment boundary encompasses GHG
effects, regardless of where they occur and who has
control over the GHG sources or sinks associated with
them. This inclusive GHG assessment boundary is
intended to encourage a more comprehensive assess-
ment of the GHG project’s effect on GHG emissions
and to minimize the possibility of overlooking any
significant GHG effects that may occur outside the
project’s physical location or beyond the control of the
project developer. However, what constitutes significant
is left to the discretion of the project developer.
Fulfilling the requirements of this chapter will depend
in part on fulfilling the requirements of Chapter 8 or 9
—which concern the estimation of baseline emissions—
since identifying primary and secondary effects depends
on the baseline scenario identified.
F I G U R E 5 . 1 The GHG assessment boundary
Project Activity 1 P R I M A R Y E F F E C T 1
Significant Secondary Effects
Insignificant Secondary Effects
P R I M A R Y E F F E C T 2
Significant Secondary Effects
Insignificant Secondary Effects
Project Activity 2 }}The GHG assessment boundary includes all the primary effects and significant secondary effects associated with the GHG project,which can consist of multiple project activities (two project activities are depicted). Insignificant secondary effects are not includedin the GHG assessment boundary.
G H GP R O J E C T
G H G A S S E S S M E N T
B O U N D A R Y
jpText_FINAL.qxd 11/22/05 3:49 PM Page 29

RequirementsFor complete, accurate, and transparent quantification
of project-based GHG reductions, the GHG assessment
boundary (Figure 5.1) shall be clearly defined and
reported. The GHG assessment boundary shall include
the primary and significant secondary effects of all
project activities. The following steps are required for
defining the GHG assessment boundary:
5.1 Identify each project activity associated with the GHG project.
5.2 Identify all primary effects related to each project activity.
5.3 Consider all secondary effects related to each project activity.
5.4 Estimate the relative magnitude of all secondary effects.
5.5 Assess the significance of all secondary effects.
Exclude insignificant secondary effects from the GHG
assessment boundary. Justify any exclusions.
Guidance5.1 Identifying Project Activities A project activity is a single intervention designed to
cause GHG reductions (see Chapter 2 and Table 5.1
for examples), and a GHG project may be comprised
of more than one project activity. GHG reductions are
estimated and quantified1 for each project activity.
5.2 Identifying Primary EffectsThe Project Protocol classifies six generic types of
primary effects:
• Reduction in combustion emissions from generating
grid-connected electricity.
• Reduction in combustion emissions from generating
energy or off-grid electricity, or from flaring.
• Reductions in industrial process emissions from a
change in industrial activities or management practices.
• Reductions in fugitive emissions.
• Reductions in waste emissions.
• Increased storage or removals of CO2 by
biological processes.
5.3 Considering All Secondary Effects Project activities often produce changes in GHG emis-
sions aside from their primary effects—and these are
termed secondary effects. As with primary effects, these
secondary effects are defined as a difference in GHG
emissions between the baseline scenario and the project
activity. The baseline scenario used for estimating the
secondary effects is the same as that identified for the
related primary effect.
Secondary effects may be “positive” (e.g., involving a
reduction in GHG emissions) or “negative” (e.g., involv-
ing an increase in GHG emissions). Typically, secondary
effects are small in comparison to the primary effect, but
occasionally they may be large and negative enough to
render the project activity unviable as a GHG reduction
effort. Therefore, it is wise to consider the type and
magnitude of secondary effects before proceeding with
rest of the Project Protocol.
Defining the GHG Assessment Boundary
C H A P T E R 530
RE
QU
IR
EM
EN
TS
Courtesy of the World Bank
jpText_FINAL.qxd 11/22/05 3:49 PM Page 30

The guidance provided in this chapter will help project
developers think comprehensively about secondary effects.
However, it is not necessary to undertake a complete life-
cycle analysis when considering secondary effects. For
some project activities, reducing the uncertainty around
the quantification of the primary effect may be more
important than exhaustively examining secondary effects.
The principle of relevance can be used to guide decisions
about the extent of the secondary effects to consider.
This principle takes into account the purpose of the GHG
project and the decision-making needs of the project
developers and may help them decide the extent to which
secondary effects should be considered.
5 . 3 . 1 O N E - T I M E E F F E C T SOne-time effects are secondary effects related to GHG
emissions that occur during the construction, installa-
tion, and establishment or the decommissioning and
termination of the project activity. One-time effects are
identified by considering whether the project activity will
require any practices, processes, or consumption or
production of energy or materials during its establish-
ment and termination that will cause a change in GHG
emissions unrelated to the primary effect.
For some types of projects, large one-time effects may
arise during construction or establishment from the
transportation of equipment, or manufacturing and use
of cement used in construction. During the decommis-
sioning or termination phase, the one-time effects to
consider may be associated with off-site waste disposal
and dismantling equipment.
One-time effects during the establishment phase can also
be large for some land-use projects. For example, refor-
estation and afforestation projects often require the
clearing of vegetation to prepare a site for planting. This
results in GHG emissions from the machinery used to
clear the site, as well as the release of stored carbon from
the cleared vegetation and disturbed soils.
C H A P T E R 5 : Defining the GHG Assessment Boundary 31G
UI
DA
NC
E
T A B L E 5 . 1 Examples of the relationship between GHG projects, project activities, and primary effects
G H G P R O J E C T
Wind Power Project
Energy Efficiency Project
Transportation Fuel Switch Project
Industrial Fuel Switch Project
Afforestation Project
Forest Management Project
Agricultural Tillage Project
Landfill Gas Project
P R O J E C T A C T I V I T Y
Generate grid-connected electricity fromwind turbines
Improve energy efficiency of lighting byusing energy-efficient light bulbs
Change from fossil fuel to biofuel in buses
Fuel switch to natural gas at an off-gridstationary combustion plant
Change land-use to enhance carbon storage
Change forest management to enhancecarbon storage
Change tillage practices to enhancecarbon storage
a) Install equipment to capture methaneb) Generate grid-connected electricity
from captured methane
P R I M A R Y E F F E C T
Reduction in combustion emissions from gener-ating grid-connected electricity
Reduction in combustion emissions from gener-ating grid-connected electricity
Reduction in combustion emissions from gener-ating energy or off-grid electricity, or from flaring
Reduction in combustion emissions from gener-ating energy or off-grid electricity, or from flaring
Increased storage or removals of CO2 by biological processes
Increased storage or removals of CO2 by biological processes
Increased storage or removals of CO2 by biological processes
a) Reduction in waste emissionsb) Reduction in combustion emissions from
generating grid-connected electricity
jpText_FINAL.qxd 11/22/05 3:49 PM Page 31

5 . 3 . 2 U P S T R E A M A N D D O W N S T R E A M E F F E C T SUpstream and downstream effects are recurring second-
ary effects associated with the operating phase of a
project activity and relate to either the inputs used
(upstream) or the products produced (downstream) by
a project activity. Upstream and downstream effects are
identified by considering whether there are any inputs
consumed or products/by-products produced by the
project activity that will cause a change in GHG emis-
sions unrelated to the primary effect during the project
activity’s operating phase.
Some examples of where upstream and downstream
effects may arise include:
• Project activities that use fossil or biomass fuels to
generate electricity, heat, or steam. Upstream effects
may result from changes in the extraction of fossil
fuels, the harvest of biomass, and the transportation
of either type of fuel—e.g., changes in the release of
methane (CH4) during coal mining, the release of CO2
from fuel combustion during harvesting, and the
release of CO2 from transporting coal or biomass.
• Project activities that cause a change in the use of
materials or products that give rise to GHG emissions
as a result of physical or chemical processing during
their manufacture, use, or disposal.
• Project activities that cause a change in the use of
materials or products whose application gives rise to
GHG emissions—e.g., changes in nitrous oxide (N2O)
emissions associated with the application of nitrogen
fertilizer; changes in HFC leakage from refrigeration
equipment, or changes in the use of lime in sulphur
dioxide scrubbers in a coal fired boiler.
• Project activities that involve the transportation of
materials, employees, products, and waste. Changes in
GHG emissions may arise from changes in the combus-
tion of fuels in vehicles, trains, ships, and aircraft.
• Project activities that affect levels of fugitive or
vented emissions. For example, a project activity may
incidentally cause changes in GHG emissions from
leaking joints, seals, packing, and gaskets; CH4 emis-
sions vented from coal mines; or CH4 leaks from gas
transport and storage.
• Project activities that cause changes in GHG emissions
from disposed waste—e.g., changes in CH4 emissions
from landfilled waste, even if these changes occur much
later than the implementation of the project activity.
U P S T R E A M A N D D O W N S T R E A M E F F E C T S
I N V O L V I N G M A R K E T R E S P O N S E S
In theory, nearly all upstream and downstream effects
will involve, or be associated with, some kind of market
response. Market responses occur when alternative
providers or users of an input or product react to
a change in market supply or demand caused by the
project activity.
For example, a downstream market response occurs
when a forest protection project activity that reduces the
supply of fibre causes logging to shift to other adjacent
forests to meet unchanged fibre demand. An upstream
market response could occur where the project activity
involves switching fuel from coal to biomass; the switch
to biomass may reduce the availability of this biomass to
existing users, who may then substitute a more GHG-
intensive fuel to meet their needs, increasing GHG
emissions. These are both examples of negative market
responses. An example of a positive market response is
where a forest plantation increases the supply of fibre,
which in turn reduces logging at other sites.
The extent to which an upstream or downstream effect
involves a market response depends on:
• the extent to which products and services consumed
or produced by the project activity can be replaced
by substitutes;
• the ability of alternative producers to change their
supply of a product or service;
• the ability of alternative consumers to change their
demand for a product or service; and
• the cumulative impact of similar projects.
If a product or service consumed or produced by the
project activity has many substitutes, many alternative
suppliers, or many consumers, then market responses are
likely to occur and the effects of these market responses
on GHG emissions should be considered. For each input
used or product produced by the project activity, project
developers should describe whether the input or product
Defining the GHG Assessment Boundary
C H A P T E R 532
GU
ID
AN
CE
jpText_FINAL.qxd 11/22/05 3:49 PM Page 32

is highly substitutable and indicate the extent to which
they believe a market response will or will not occur.
Market responses can often be small and difficult to
discern, especially if the quantity of inputs consumed or
products produced by a project activity is small relative
to the overall market. If an upstream or downstream
effect involving a market response is identified, the
market involved should be carefully described and
defined along with the project activity’s size relative to
the market. Where negative market responses cannot be
eliminated or mitigated by project design (Box 5.1),
every reasonable attempt should be made to estimate
their possible significance. Where estimating the market
response is infeasible, the reasons for this should be
clearly documented and explained. If estimated, the
market response should be factored into the estimation
and final quantification of secondary effects.
5.4 Estimating the Relative Magnitudeof Secondary Effects
Project developers should attempt to estimate the
magnitude of secondary effects as a prelude to deter-
mining whether they are significant. Following are
some basic approaches for estimating the magnitude of
secondary effects.
U S I N G D E FA U L T O R E X I S T I N G D AT AAvailable default data or rough estimates often provide a
reasonable basis for quantifying secondary effects, and
are usually the most cost-effective route to take. Default
or existing data are useful for all secondary effects that
do not involve a market response, including one-time
effects. Default data are also appropriate for estimating
the magnitude of small secondary effects, which can in
principle be aggregated together. In some cases, it may
be possible to use default data from existing market
assessments for upstream and downstream effects involv-
ing market responses.
U S I N G E M I S S I O N FA C T O R SMany secondary effects can be estimated as the product of
an emission rate and the level of input used or product
produced that is related to the change in GHG emissions.
This approach works well for upstream and downstream
secondary effects. The key to this approach is to determine
how input or product levels differ between the project
activity and baseline scenario. For example, a change in
methane emissions associated with the extraction of
coal can be estimated as the product of an emission rate
for methane (e.g., tonnes of CO2eq/tonnes of coal used)
and the difference between the amount of coal used in
the project activity and baseline scenario. If market
responses are involved, however, it may sometimes be
difficult to determine the change in quantities of inputs
or products between the baseline scenario and the project
activity. Estimating this change may require some kind of
market assessment.
U N D E R T A K I N G A M A R K E T A S S E S S M E N TA market assessment involves the economic modelling
(e.g., equilibrium or econometric modelling) of the rele-
vant market’s response to the project activity’s impact
on supply or demand for an input or product. Many
markets will not respond with a one-for-one substitution
C H A P T E R 5 : Defining the GHG Assessment Boundary 33G
UI
DA
NC
E
GHG projects can sometimes mitigate market responses byincorporating unique design elements. Project developersshould describe and explain any such design elements. Someexamples of these design elements include:
• Providing alternative income streams to displaced workers.For example, land-use projects can accommodate displacedworkers by developing other employment opportunities, suchas ecotourism.
• Providing an alternative supply of the products or servicesreduced by the project activity. For example, an avoided defor-estation project could meet the baseline scenario’s marketdemand for fibre by including a forest plantation as an addi-tional GHG project activity.
• Using inputs for the project activity that have no alternativeuse. For example, GHG projects that employ alternative inputsto GHG-intensive materials or fuels might use waste biomass,such as rice husks, as the alternative input.
Design solutions are likely to be more feasible for marketresponses caused by a nearby shift of physical activities,because it is easier to identify and manage changes that takeplace close to the GHG project’s physical site.
B O X 5 . 1 Mitigating market responses
jpText_FINAL.qxd 11/22/05 3:49 PM Page 33

and/or may substitute other products or supply sources
with very different GHG profiles. While this approach
will provide estimates of how a project activity affects
supply and demand of products, it presents some chal-
lenges. For instance:
• Developing an economic model for a specific market
may be unrealistically costly if a model does not
already exist.
• Even conducting an analysis with existing models may
be costly.
• Different models and assumptions often yield different
results.
• Currently there are no off-the-shelf guidelines or
approaches to determine what models and assumptions
to use.
• Uncertainty associated with the modelling effort may
still be very high.
In most cases, market assessments are only necessary
where the changes in supply or demand caused by a
project activity are significant relative to the overall
size of the market. Very small changes in supply or
demand will not appreciably affect the behaviour of
other actors in the market.
A P P LY I N G T H E C O N S E R VAT I V E N E S S P R I N C I P L EAny method used to estimate secondary effects is prone
to uncertainty. Because of this, the conservativeness prin-
ciple should guide any effort to estimate their magnitude.
For instance, it is advisable to use upper-bound estimates
for project activity GHG emissions and lower-bound or
zero estimates for baseline emissions.2 Use of a conserva-
tive estimate for baseline emissions is appropriate
whenever it is difficult to determine the baseline scenario
conditions related to a secondary effect. This is particu-
larly relevant when the performance standard procedure
is used to estimate baseline emissions for a project
activity. In this case, it may be simplest to assume that
the baseline emissions for secondary effects are zero,
as the baseline scenario conditions may be ambiguous.
5.5 Assessing the Significance of Secondary Effects
Only significant secondary effects are included in the GHG
assessment boundary. However, the significance of a
secondary effect can be subjective and can depend on the
project activity’s context. The following criteria may be
used to help determine whether a secondary effect is
significant or not:
• The secondary effect involves a positive differencebetween baseline emissions and project activityemissions. From an environmental standpoint, the
purpose of considering secondary effects is to identify
those that would negate the project activity’s primary
effect. If a specific secondary effect can be shown to
be positive (i.e., it would increase the estimate of GHG
reductions if included), but would be costly to monitor
and quantify, it may be more practical to exclude it
from the GHG assessment boundary. Such exclusions
should result in a conservative estimate of GHG reduc-
tions for the overall GHG project.
• The secondary effect is small relative to the associ-ated primary effect. If a secondary effect is small in
absolute terms and in relation to the primary effect
and all other secondary effects, it may be excluded
from the GHG assessment boundary. However, it is
important to take into account the cumulative effect of
Defining the GHG Assessment Boundary
C H A P T E R 534
GU
ID
AN
CE
jpText_FINAL.qxd 11/22/05 3:49 PM Page 34

excluding “small” secondary effects. In some cases,
it may be advisable to develop a single proxy estimate
for the changes in GHG emissions associated with
multiple “small” secondary effects. Any criteria used
to determine that a secondary effect is “small” in
magnitude should be explained.
• The secondary effect involves a negligible marketresponse. If a secondary effect is expected to arise
from a market response to the project activity and this
market response will be small or negligible, the
secondary effect may be insignificant. This will most
often be the case where the project activity’s produc-
tion or consumption of products or services is
insignificantly small relative to the total markets for
those products or services. The only exception to this
would be where the absolute change in GHG emissions
associated with even a small market response would be
significant relative to the project activity’s primary
effect. This is most likely where the primary effect is
linked to reducing the supply of a GHG-emitting prod-
uct or service, in which case the market response will
usually be to meet demand using other suppliers,
negating the primary effect.
Any exclusion of a secondary effect should be justified,
and the justification should include an assessment of
whether the effect could become significant in the future
due to changing circumstances.
S I G N I F I C A N T S E C O N D A R Y E F F E C T S T H AT C A N C E L E A C H O T H E R O U TIn some instances, two significant secondary effects—
one positive and one negative—associated with related
GHG sources or sinks may effectively counterbalance
each other. For example, a project activity that
switches the fuel used for stationary combustion from
coal to biomass may give rise to two secondary effects:
(1) a reduction in rail transportation GHG emissions
associated with transporting coal (positive), and (2) an
increase in rail transportation GHG emissions associ-
ated with transporting biomass (negative). If these two
secondary effects were of the same magnitude, they
would cancel each other out. If it can be demonstrated
that two related significant secondary effects will coun-
terbalance each other, their net effect could be
considered insignificant and they could be excluded
from the GHG assessment boundary. However, the
expected magnitude of both secondary effects should
be clearly substantiated.
NOTES1 GHG reductions are estimated with ex ante information, and are quantified
ex post with information compiled during monitoring. See Chapter 10 for
more information on quantification and monitoring.
2 If the secondary effect involves GHG removals and storage, conservative
estimates would be reversed: lower-bound or zero estimates for the project
activity and upper-bound estimates for baseline emissions.
C H A P T E R 5 : Defining the GHG Assessment Boundary 35G
UI
DA
NC
E
Warren Gretz, National Renewable Energy Lab
jpText_FINAL.qxd 11/22/05 3:49 PM Page 35

Selecting a Baseline Procedure
PA R T I I36
6
n Chapters 8 and 9, the Project Protocol presents two procedures for estimating baseline
emissions associated with a project activity’s primary effect: the project-specific and perform-
ance standard procedures. This chapter provides brief guidance on when one procedure may
be preferable to the other.
I
jpText_FINAL.qxd 11/22/05 3:49 PM Page 36

C H A P T E R 6 : Selecting a Baseline Procedure 37G
UI
DA
NC
E
RequirementFor each primary effect associated with a projectactivity the project developer shall select and justifythe choice of baseline procedure used to estimatebaseline emissions.
GuidanceSelecting and Justifying a Baseline ProcedureThe performance standard procedure may be
preferred when:
1. A number of similar project activities are beingimplemented. Where a number of similar project
activities in the same geographic area are being
undertaken, developing a performance standard may
be the most cost-effective route. If a GHG program
approves a performance standard for one project
activity, it may be used for numerous similar project
activities in the same area (assuming they are all
developed within the time period for which the
performance standard is valid).
2. Obtaining verifiable data on project activity alternatives is difficult. The project-specific proce-
dure requires a structured analysis of the barriers
and possibly the benefits associated with the project
activity and its alternatives. This requires access to
verifiable data on the barriers faced by these alterna-
tives, as well as the expected benefits of these
alternatives, including in some cases economic or
financial performance data. While identifying barri-
ers and expected benefits for the project activity may
be relatively straightforward, undertaking the same
analysis for its alternatives may be more challenging
and time consuming. The performance standard
procedure requires verifiable data on the GHG emis-
sion rates of individual alternatives, but not on their
potential barriers or benefits. Thus, when access to
information on the barriers and benefits for alterna-
tives is limited, the performance standard procedure
may be preferred.
3. Confidentiality concerns arise with respect to theproject activity. Under the project-specific proce-
dure, any data relating to barriers and possibly net
benefits should be reported. In some cases, these data
may include financial or other information that proj-
ect developers wish to keep confidential. If the
credible identification of the baseline scenario under
the project-specific procedure is not possible without
the use of confidential data, project developers may
prefer to use the performance standard procedure.
However, in some cases gathering sufficient data from
competitors to determine a performance standard
may also be complicated due to confidentiality issues.
The project-specific procedure may be preferred when:
4. The number of baseline candidates is limited, orGHG emission rate data for baseline candidates aredifficult to obtain. The performance standard proce-
dure requires verifiable GHG emission rate data on
each individual facility or site within a given
geographic area and temporal range, or a large
enough sample of data to represent each facility or
site statistically. The project-specific procedure, on
the other hand, requires verifiable information relat-
ing to each representative type of technology or
practice in the chosen geographic area and temporal
range. In cases where the data set of facilities or sites
may be too small—or access to GHG emission rate
data is too limited—developing a robust performance
standard may be difficult. In these situations, the
project-specific procedure may be more appropriate.
USING A COMBINATION OF BASELINE PROCEDURESIn some cases, it may be possible to combine the project-
specific and performance standard procedures to
estimate baseline emissions. This would involve using a
performance standard to characterize one of the alterna-
tives (e.g., the continuation of current activities) in the
project-specific procedure. Using a combination of the
baseline procedures may be useful when the baseline
scenario could be represented by a blend of alternative
technologies, management or production practices, or
delivery systems (e.g., grid-connected electricity genera-
tion). If a combination of baseline procedures is used,
both procedures should be performed in their entirety.
jpText_FINAL.qxd 11/22/05 3:49 PM Page 37

Identifying the Baseline Candidates
PA R T I I38
7
oth the project-specific and performance standard baseline procedures presented in
Chapters 8 and 9 rely on the identification of baseline candidates. Baseline candi-
dates are alternative technologies or practices within a specified geographic area and
temporal range that could provide the same product or service as the project activity. They can
involve both existing and potential technologies and practices. This chapter describes how to
formulate a complete list of baseline candidates appropriate for either baseline procedure.
B
jpText_FINAL.qxd 11/22/05 3:50 PM Page 38

RequirementsFor each project activity, the project developer shall
develop a complete list of baseline candidates that will
be used in the baseline procedures to represent possible
alternatives to the project activity. The following steps
are required:
7.1 Define the product or service provided by the project activity.
7.2 Identify possible types of baseline candidates.
7.3 Define and justify the geographic area and the temporal range used to identify baseline candidates.
7.4 Define and justify any other criteria used to identify baseline candidates.
7.5 Identify a final list of baseline candidates.
7.6 Identify baseline candidates that are representative of common practice (for the project-specific baseline procedure).
GuidanceAlthough the requirements for this chapter follow a
sequential order, identifying a final list of baseline candi-
dates is not a strictly linear process. Some iteration
between the steps outlined in the requirements will
usually be necessary to arrive at a final definition of the
geographic area and temporal range, and a final list of
baseline candidates.
Identifying an exhaustive list of baseline candidates can
be both costly and time consuming. It is often necessary
to try to balance time and cost with the need to identify
a representative list of baseline candidates. Where trade-
offs are necessary, it is best to be transparent about any
decisions relating to the final list of baseline candidates.
The accounting principles in Chapter 4 provide helpful
guidance when making these decisions.
Baseline candidates may be defined somewhat differ-
ently, depending on which baseline procedure is used
(Chapter 8 or 9). Project developers should carefully
review the guidance for identifying the final list of base-
line candidates (section 7.5) for an understanding of the
key differences.
7.1 Defining the Product or Service Provided by the Project Activity
Baseline candidates provide a product or service identi-
cal (or nearly identical) to that of the project activity. To
identify baseline candidates, it is therefore important to
first clearly define the product or service provided by the
project activity. The product or service can take many
forms, depending on the type of project activity, and in
some cases may not be intuitively obvious. In most cases,
the product or service should be defined narrowly to
include only the immediate or direct outputs associated
with the project activity. Project developers should be
careful not to identify a product or service that is
provided by a larger facility or system of which the
project activity is only a component. For example, for
a project activity that substitutes a low-GHG-emitting
fuel for a high-GHG-emitting fuel in vehicles, the service
provided would be energy used for transportation, not
transportation itself. Thus, alternative fuels would be
considered as baseline candidates, but alternative modes
of transportation would not.
C H A P T E R 7 : Identifying the Baseline Candidates 39G
UI
DA
NC
E
jpText_FINAL.qxd 11/22/05 3:50 PM Page 39

7.2 Identifying Possible Types of Baseline Candidates
Possible baseline candidates can be identified by thinking
broadly about the different alternatives that have a
comparable product or service to the project activity
(Table 7.1). The following questions can help in this effort:
• What alternative new or existing technologies,
management or production practices, or delivery
systems would provide products or services similar
to the project activity?
• What alternative management, production, or delivery
systems do others use to provide the same product(s)
and/or service(s) as the project activity?
Identifying the Baseline Candidates
C H A P T E R 740
GU
ID
AN
CE
T A B L E 7 . 1 Examples of the product or service and baseline candidates for some types of project activities
G H G P R O J E C T
Wind Power Project
Energy EfficiencyProject
Transportation FuelSwitch Project
Industrial FuelSwitch Project
AfforestationProject
Forest ManagementProject
Agricultural TillageProject
Landfill Gas (LFG) Project
P R O J E C T A C T I V I T Y
Generate grid-connected elec-tricity from wind turbines
Improve energy efficiency oflighting by using energy-efficient light bulbs
Change from fossil fuel tobiofuel in buses
Fuel switch to natural gas at an off-grid stationary combustion plant
Change land-use to enhancecarbon storage
Change forest management toenhance carbon storage
Change tillage practices toenhance carbon storage
a) Install equipment to capture methane
b) Generate grid-connected electricity from captured methane
P R O D U C T AND/OR S E R V I C E
Kilowatt-hours of electricity
Lighting (e.g., amount of illumina-tion per square meter of floorspace)
Kilojoules of energy to power transportation
Tonnes of steam required forindustrial processes
Product/service changes depend-ing on the land-use but the area ofland is equivalent*
Forestry commodities from a givenarea of land**
Agricultural commodities from agiven area of land
a) Collection and disposal of waste gases*
b) Kilowatt-hours of electricity
P R I M A R Y E F F E C T
Reduction in combustion emissions from generating grid-connected electricity
Reduction in combustion emissions from generating grid-connected electricity
Reduction in combustion emis-sions from generating energy oroff-grid electricity, or from flaring
Reduction in combustion emis-sions from generating energy oroff-grid electricity, or from flaring
Increased storage or removals ofCO2 by biological processes
Increased storage or removals ofCO2 by biological processes
Increased storage or removals ofCO2 by biological processes
a) Reduction in waste emissionsb) Reduction in combustion
emissions from generating grid-connected electricity
*For these project activities, there may or may not be equivalence in the type of product or service provided by the project activity and the baseline candidates.**For these project activities, there may or may not be equivalence in the quantity or quality of product or service provided by the project activity and the baseline candidates.
jpText_FINAL.qxd 11/22/05 3:50 PM Page 40

• What is the production, management, or delivery
system most commonly used to serve the same market
as the project activity?
• If any, what is/are the status-quo technologies, manage-
ment or production practices, or delivery systems?
For both the project-specific and the performance stan-
dard procedures, baseline candidates should provide
the same product or service as the project activity.
Exceptions may occur in certain limited situations.
In some cases, for example, baseline candidates may
provide a product or service that is comparable but not
identical to the project activity’s product or service—
e.g., different lighting technologies with different
characteristics. Generally, the availability and nature
of substitute products or services for the project
activity should be considered in identifying baseline
candidates with the “same” product or service. For
transparency, project developers should outline when
and why the product or service provided by baseline
candidates will not be the same as the project activity.
7.3 Defining the Geographic Area and Temporal Range
In developing a final list of baseline candidates, it is
important to identify specific types of baseline candi-
dates within a geographic area and temporal range
relevant to the project activity.
The most important criterion in defining the geographic
area and temporal range is that they should contain a
sufficient number and diversity of baseline candidates to
allow a credible analysis and estimate of baseline emis-
sions. If the following guidelines result in an area or
range yielding too few baseline candidates, the area or
range should be expanded. For example, the temporal
range may need to be expanded from recent historical
plants, technologies, equipment, or practices to include
new or under-construction plants, equipment being
installed, or technologies or practices being imple-
mented. Similarly, the geographic area could be
expanded to include other areas that exhibit circum-
stances similar to those surrounding the project activity
(e.g., technological, resource, socioeconomic, or political
circumstances). Defining the appropriate geographic
area and temporal range may be an iterative process.
7 . 3 . 1 D E F I N I N G T H E G E O G R A P H I C A R E AThe geographic area determines the locations of plants,
equipment, or practices that are included in the final
list of baseline candidates. Generally it will make sense
to start with national political boundaries to define the
C H A P T E R 7 : Identifying the Baseline Candidates 41G
UI
DA
NC
E
E X A M P L E S O F B A S E L I N E C A N D I D AT E T Y P E S
Other electricity-generating technologies on the grid, such asfossil fuel or other renewable energy technologies
• Incandescent light bulbs• Compact fluorescent light bulbs • Halogen light bulbs
• Diesel• Gasoline• Ethanol• Biodiesel• LNG
• Other fossil fuels, such as coal or oil• Renewable energy sources
• Continuation of current land-use• Cropland growing different food crops• Pastureland
• Continuing current forest management• Variations in forest management, such as increasing thinning or
fertilisation
• Continuing current tillage practices• No-till / zero tillage• Mouldboard ploughing• Conventional tillage• Ridge tillage
a) • Continuation of current activities• Flaring of LFG• Use of LFG for fuel
b) Other electricity-generating technologies on the grid, such asfossil fuel or renewable energy technologies
jpText_FINAL.qxd 11/22/05 3:50 PM Page 41

geographic area, and to modify this area as appropri-
ate (see Figure 7.1). Depending on circumstances
surrounding the project activity and various aspects
of the baseline candidates, the appropriate geographic
area may be narrower (e.g., an area within a country
or an electricity grid), or wider (e.g., an international
region or global area).
Some general rules of thumb for defining the geographic
area include:
1. Where the baseline candidates reflect a mature tech-
nology or practice that is similar across regions or is
rapidly converging, a regional or global geographic
area may be the most appropriate geographic area.
2. Where the baseline candidates vary because of
human-influenced factors, some form of jurisdic-
tional/administrative boundary may be the most
appropriate geographic area. Human-influenced
factors may include legal factors (e.g., government
policies, laws or regulations); socio-cultural factors
(e.g., social norms, traditions, individual habits, atti-
tudes, values, vested interests, human capital); or
economic factors (e.g., household incomes, energy and
other factor prices, employment, imperfect markets,
financing, demand for specific services). For instance,
if legislation affects a certain sector in a given
state/province of a country, that state/province may be
more representative than the country.
3. Where the baseline candidates are constrained by the
availability of physical infrastructure, such as supply
networks for electricity and fuels, an area that repre-
sents the extent of infrastructure may be the most
appropriate geographic area. For instance, the power
grid is appropriate for grid-connected electricity proj-
ects. Similarly, market boundaries are appropriate if
baseline candidates are constrained or isolated by a
clearly defined market region.
4. Where the baseline candidates vary according to
biophysical characteristics, such as climatic variation
(e.g., temperature or precipitation) or geological vari-
ation (e.g., soils, topography, or altitude), some form
of representative ecological zone may be the most
appropriate geographic area. Land-use and forestry
projects are often defined by the homogeneity in soil,
vegetation, and/or climatic conditions.
A number of factors may influence the choice of geographic
area. The principles of transparency and relevance should
be used to weigh the importance of these factors.
7 . 3 . 2 D E F I N I N G T H E T E M P O R A L R A N G E The temporal range defines the appropriate time period
from which to select the relevant baseline candidates,
and is based on installation, implementation, or estab-
lishment dates of the various technologies, equipment, or
practices. For instance, if a 5-year temporal range were
selected, only those technologies, pieces of equipment, or
practices that became operational or were implemented
in the last 5 years would be used. The temporal range is
usually based on one or more of the following:
• Recent plants, technologies, equipment, or recentlyestablished practices (e.g., during the last 5 to 7 years).
Identifying the Baseline Candidates
C H A P T E R 742
GU
ID
AN
CE
F I G U R E 7 . 1 Defining the geographic area
S M A L L E R L A R G E R
Start with national political boundaries to define the geographic area, and modify this area as appropriate to obtain a reasonablelist of baseline candidates reflecting technological, jurisdictional, infrastructural, and physical/territorial considerations.
➡➡➡
➡ ➡
Province/state/regionwithin a nation
Start Here
National Regional Global
T O T A L A R E A
Other (e.g., ecological zone, market boundary)Other
(e.g., ecological zone, market boundary)
jpText_FINAL.qxd 11/22/05 3:50 PM Page 42

These data are observable and verifiable, whereas the
data for under-construction, near-future, or future
equipment or practices can only be estimated or
projected. Where possible, recently built plants and
newly established practices are the best baseline candi-
dates to use.
• Under-construction plants, equipment beinginstalled, or technologies or practices being imple-mented. Although these baseline candidates may be
more difficult to find data for and fully characterize,
they may provide a better indication of trends in
technology, practices, or fuel mix than existing
baseline candidates.
• Planned future plants, technologies, equipment, orproposed practices. Data on planned baseline candi-
dates tend to be relatively uncertain, since plans can
be modified before or during the implementation or
construction phase. If these data are used, they should
be based on published government or company plans.
For larger plants or operations, information may also
be available from environmental impact assessments,
operating permits, or similar documents.
Project developers should start with a temporal range
that includes the recently built plants and equipment, or
recently established practices (e.g., the last 5 years).
Where necessary, the temporal range may be expanded
to include under-construction plants, equipment being
installed or practices being implemented and/or planned
future plants, equipment, or practices to capture any
trends in the sector that are indicative of future technol-
ogy, management, or regulatory paths (see Figure 7.2).
Some general rules of thumb to use for defining the
temporal range include:
1. If a single technology or practice dominates a sector
or region where no significant changes have taken
place—e.g., one fuel source, such as coal (with no
change in combustion efficiencies over time) or hydro,
dominates a power grid—a longer temporal range can
be used, since there has been little change over time.
2. If there is a large and varied number of alternative
technologies or practices providing similar products
or services in a sector or region, a longer temporal
range should be used to ensure that the baseline
candidates are representative of the range of resource
C H A P T E R 7 : Identifying the Baseline Candidates 43G
UI
DA
NC
E
Suzie Greenhalgh, WRI
jpText_FINAL.qxd 11/22/05 3:50 PM Page 43

options available. This may include under-construc-
tion plants, equipment being installed or practices
being implemented or planned future plants, equip-
ment, or practices.
3. If technology is changing very rapidly and the sector
is relatively homogeneous in its use of the technology,
the temporal range may need to be shorter in order
to capture the trend in the sector.
4. If a sector experiences a discrete policy or legal
change or autonomous change in technology, practices,
or resource mix, a temporal range that corresponds
to the point of change should be used. This range may
include under-construction plants, equipment being
installed or practices being implemented.
If information on emission rates is available, the tempo-
ral range can also be defined by assessing the trends in
emission rates. Stable trends can use a longer temporal
range; upward or downward trends can use a shorter
temporal range; scattered trends can use a longer tempo-
ral range; and if a break point (or a distinct change in
GHG emission rates) exists, the year in which the break
point occurred can be used to define the first year of the
temporal range.
Once again the circumstances surrounding the project
activity influence the choice of temporal range, and the
principles of relevance and transparency should be used
when making decisions regarding the temporal range.
7.4 Defining Other Criteria Used to Identify Baseline Candidates
Other factors, such as legal requirements and common
practice, may be helpful in identifying the baseline
candidates, or may guide the definition of the geographic
area and temporal range.
7 . 4 . 1 B A S E L I N E C A N D I D AT E S A N D L E G A L R E Q U I R E M E N T S
The presence of enforced laws or regulations that affect
baseline candidates can be a basis for defining the
geographic area and temporal range. The geographic
area should align with, or lie within, the jurisdiction to
which the law or regulation applies, and the temporal
range should not extend prior to any date covered by the
law or regulation. The result will be that any baseline
candidates that do not comply with the regulations may
be eliminated from the final list.
Where legal requirements are not enforced, it may not
be appropriate to use legal jurisdictions or dates of
enactment to constrain the geographic area or temporal
range. If laws and regulations are not enforced, this lack
of enforcement should be documented.
Relevant legal requirements will include any applicable
national/state/provincial/local regulations or laws that
directly or indirectly affect GHG emissions and that
require technical, performance, or management actions.
These may involve the use of a specific technology (e.g.,
Identifying the Baseline Candidates
C H A P T E R 744
GU
ID
AN
CE
F I G U R E 7 . 2 Defining the temporal range
P A S T F U T U R E
Start with a temporal range that includes the recently built plants, equipment, or recently established practices. Where necessary,choose a longer historical period or expand the temporal range to include under-construction plants, equipment being installed orpractices being implemented, and/or planned future plants, equipment, or practices.
➡➡➡Longer historicperiod
Start Here
Recent (e.g., last 5 to
7 years)
Under-constructionplants, equipment beinginstalled. or practices
being implemented
Near-future orplanned plants,equipment or
practices
P R E S E N T
jpText_FINAL.qxd 11/22/05 3:50 PM Page 44

gas turbines instead of diesel generators), meeting a
certain standard of performance (e.g., fuel efficiency
standards for vehicles), or managing operations accord-
ing to a certain set of criteria or practices (e.g., forest
management practices).
These legal requirements should be laws that have been
passed by a legislative body, have been enacted, and are
being enforced at a national, state/provincial, or local
level. Generally, they should not include voluntary agree-
ments with no enforcement mechanism, laws or
regulations under discussion, and general government
policies—none of which are considered mandatory.
Baseline candidates comply with legal requirements
when either:
• there are no applicable mandatory laws or regulations
concerning the baseline candidates in the defined
geographic area and temporal range (or concerning
the GHG source in the country/area where the affected
source is located); or
• the technology or practices employed by the baseline
candidates perform as well as any standard and meet
all the conditions prescribed by existing and enforced
mandatory laws and regulations.
A number of challenges arise with defining legal
requirements, including:
• unclear and/or contradictory written law(s)
or regulation(s);
• questions regarding how to treat pending legislation;
• varying levels of enforcement of particular laws
and regulations; and
• laws or regulations applying to project activities where
the sites, facilities, production, or delivery systems
affected and the GHG sources or sinks affected are
located in different regulatory jurisdictions.
If legal requirements are used to constrain the geographic
area and temporal range, or to constrain the final list of
baseline candidates, project developers should be trans-
parent about how they decided which legal requirements
to consider. Additional discussion and further guidance
on legal requirements can be found in Annex A.
7 . 4 . 2 B A S E L I N E C A N D I D AT E S A N D C O M M O N P R A C T I C E
In some cases it may be advisable to eliminate from the
list of relevant baseline candidates those whose GHG
emissions are higher than those of “common practice”
technologies or practices. This will generally be the case
only if the project-specific procedure is used to estimate
baseline emissions.
Common practice refers to the predominant technologies
or practices in a given market, as determined by the
degree to which those technologies or practices have
penetrated the market (defined by a specified geographic
area). Collecting data on all baseline candidates within
the geographic area and calculating a relative percent-
age for each different technology or practice will give
the level of penetration for each technology or practice.
This percentage could be based on the number of plants
or sites using each technology or practice, or could be
weighted by the proportion of the total output for the
market that is attributed to each technology or practice.
GU
ID
AN
CE
jpText_FINAL.qxd 11/22/05 3:50 PM Page 45

The level of penetration that represents common prac-
tice may differ between sectors and geographic areas,
and may depend on the diversity of different baseline
candidates within a geographic area. For example, in
one area a certain technology may have a 60 percent
market share, while in another area it may only have a
15 percent market share. In both instances, the technol-
ogy may be common practice. Low rates of penetration
or market shares that represent common practice
usually occur in areas where there is a large diversity of
baseline candidates. If there are few alternative tech-
nologies or practices, the common practice penetration
rate may be quite high.
Common practice technologies or practices may or may
not correspond to what is legally required.
7.5 Identifying the Final List of Baseline Candidates
7 . 5 . 1 R E L AT I O N S H I P B E T W E E N B A S E L I N EC A N D I D AT E S A N D B A S E L I N E P R O C E D U R E SThe number of baseline candidates to be identified and
how baseline candidates are defined may differ, depend-
ing on the procedure used to identify baseline emissions.
For the performance standard, the baseline candidates
include all individual plants, instances of a technology,
or practices that provide the same product or service as
the project activity. For the project-specific procedure,
baseline candidates usually include a more limited
number of individual instances and/or representative
types of plants, technologies, or practices.
For example, there may be six plants producing the
same product as the project activity—three plants
utilizing technology X (plants A, B and C), two plants
using technology Y (plants D and E) and one plant
using technology Z (plant F). The baseline candidates
for the performance standard would include the six
individual plants (plants A, B, C, D, E and F). For the
project-specific procedure, the baseline candidates
could be the representative technologies—X, Y and Z
(see Figure 7.3).
For the project-specific procedure, representative types
of technologies or practices should be carefully defined
and explained. In some cases, an individual plant or
instance of a technology or practice may be chosen as
representative. In other cases, it may make sense to
define a representative type using average performance
characteristics or GHG emissions from a number of
individual plants. For example, the GHG emission rate
of technology X may be characterized as the average
GHG emission rate of plants A, B, and C. Sometimes
there are wide variations in performance for a certain
type of technology—e.g., coal-fired boilers with a wide
range of fuel-use efficiencies. For these technologies, it
will often make sense to define baseline candidates
corresponding to different performance levels—or for
specific makes and models—of the technology.
Representative types of technologies or practices should
always be present in some form within the appropriate
geographic area and temporal range.
Finally, for the project-specific procedure, each baseline
candidate should also be capable of providing an equiv-
alent quantity of product or service as the project
activity. In certain situations, this may mean that a
single baseline candidate is defined as a number of simi-
lar smaller plant technologies or practices that in
aggregate provide an equivalent quantity of product or
service as the project activity.
7 . 5 . 2 S E L E C T I N G A F I N A L L I S TThe final baseline candidates used to estimate baseline
emissions are those that fall within the defined
geographic area and temporal range and provide the
same product or service as the project activity.
Completeness, relevance, and transparency are the most
important principles to use when identifying the base-
line candidates. The final list of baseline candidates,
their characteristics, and a description of how they were
identified within the geographic area and temporal
range should be documented before undertaking one of
the baseline procedures.
In some cases, the number of specific baseline candi-
dates within the geographic area and temporal range
may be quite large. In these cases, a statistical
sampling may be used to define the final list of baseline
candidates used in the baseline procedures. Methods
used to identify a sample of baseline candidates should
be fully described and explained.
Identifying the Baseline Candidates
C H A P T E R 746
GU
ID
AN
CE
jpText_FINAL.qxd 11/22/05 3:50 PM Page 46

7.6 Identifying the Baseline Candidates that Represent Common Practice
If the project-specific procedure is used to estimate base-
line emissions, project developers should identify any
baseline candidates that represent what could be consid-
ered common practice. The guidance provided above in
section 7.4.2 can assist in defining common practice
technologies or practices. Instances where common prac-
tice cannot be meaningfully defined should be explained.
If the performance standard procedure is used to esti-
mate baseline emissions, identifying common practice
baseline candidates is not necessary. This is because
rates of market penetration for different baseline candi-
dates (and thus what constitutes common practice) will
be directly reflected in the baseline emission rate derived
using that procedure.
C H A P T E R 1 : Introduction 47G
UI
DA
NC
E
For the performance standard baseline procedure, the baseline candidates include all individual plants, instances of a technology, orpractices that provide the same product or service as the project activity. For the project-specific procedure, baseline candidates includea more limited number of representative types of plants, technologies, or practices.
Project-Specific ProcedureBaseline Candidates:Representative Types of Plants/Technologies/Practices
Performance Standard ProcedureBaseline Candidates: IndividualPlants/Instances of a Technologyor Practice
F I G U R E 7 . 3 Relationship between baseline candidates and baseline procedures
} } }A B C D E F
Technology Type X Technology Type ZTechnology Type Y
Hisham Zerriffi, Program on Energy and Sustainable Development
jpText_FINAL.qxd 11/22/05 3:50 PM Page 47

Estimating Baseline Emissions—Project-Specific Procedure
PA R T I I48
8
he project-specific procedure produces an estimate of baseline emissions for a project
activity’s primary effect through the identification of a baseline scenario linked to the
specific circumstances surrounding the project activity. The baseline scenario is identified
through a structured analysis of the project activity and the baseline candidates identified in
Chapter 7. This procedure has two components. The first component involves identifying the
baseline scenario. The second component involves estimating the GHG emissions associated with
the baseline scenario.
TDavid Parsons, National Renewable Energy Lab
jpText_FINAL.qxd 11/22/05 3:50 PM Page 48

49R
EQ
UI
RE
ME
NT
S
RequirementsFor each project activity, the following steps shall be
performed to identify the baseline scenario and estimate
baseline emissions:
8.1 Perform a comparative assessment of barriers.
8 . 1 . 1 Identify all barriers that would affect deci-sions to implement the project activity or anyof the baseline candidates.
8 . 1 . 2 Identify barriers to the continuation ofcurrent activities.
8 . 1 . 3 Assess the relative importance of the identi-fied barriers for each alternative.
8.2 Identify and justify the baseline scenario.
8 . 2 . 1 Explain the significance of any barriers thataffect the project activity and how thesebarriers will be overcome.
8 . 2 . 2 Identify the baseline scenario using theresults of the comparative assessment ofbarriers. Where it is not possible to identify the
baseline scenario using the results of the
comparative assessment of barriers, either:
a) identify the baseline scenario as the most
conservative viable alternative, which will
have the lowest GHG emissions or the highest
GHG removals compared to other viable
alternatives; or
b) identify the baseline scenario using a net bene-
fits assessment. The baseline scenario will be
the alternative with the greatest net benefits—
excluding any benefits resulting from GHG
reductions—relative to assessed barriers.
8 . 2 . 3 Justify the identified baseline scenario.
8.3 Estimate baseline emissions.Use assumptions, calculations, and emission factors
specific to the identified baseline scenario.
C H A P T E R 8 : Estimating Baseline Emissions—Project-Specific Procedure
jpText_FINAL.qxd 11/22/05 3:50 PM Page 49

GuidanceThe baseline scenario is a reference case for the project
activity. It describes an activity or a set of activities that
result in GHG emissions (referred to as “baseline emis-
sions”), against which project activity emissions can be
compared for the purpose of quantifying GHG reduc-
tions. Broadly speaking, there are three types of possible
alternatives for a baseline scenario:
• The baseline scenario involves implementation of
the same technologies or practices involved in the
project activity.
• The baseline scenario involves the configuration,
deployment, implementation, operation, and decom-
missioning of new technologies or practices described
by one of the baseline candidates from Chapter 7.
• The baseline scenario involves the continuation of
current activities that, where relevant, provide the
same type, quality, and quantity of product(s) or serv-
ice(s) as the project activity.
C O N T I N U AT I O N O F C U R R E N T A C T I V I T I E SThe “continuation of current activities” can be thought
of as the “do nothing” alternative. It will mean slightly
different things depending on the type of project activity.
Examples include:
• Provision of grid-connected electricity from existing
power plants, where the project activity involves
construction of new generation equipment that would
displace grid-connected electricity.
• Continued operation of existing equipment, where the
project activity involves retrofitting the equipment to
improve its efficiency.
• Continued emissions of methane from a landfill, where
the project activity involves capturing and destroying
this methane.
• Continued operation of working forests, where the
project activity involves additional carbon sequestra-
tion through enhanced forest management.
In some cases, these kinds of possibilities may be identi-
fied as baseline candidates in Chapter 7. Within the
project-specific procedure, however, they are considered
separately from a consideration of other baseline candi-
dates. This is primarily because they are unlikely to face
the same kinds of barriers as other baseline candidates,
and in some instances will face unique types of barriers
that do not apply to other baseline candidates. The
assessment of the continuation of current activities is
thus qualitatively different from the assessment of other
alternatives for the baseline scenario.
8.1 Performing a Comparative Assessment of Barriers
The comparative assessment of barriers determines to
what extent the project activity and each baseline candi-
date are affected by barriers to their implementation.
Estimating Baseline Emissions—Project-Specific Procedure
C H A P T E R 850
GU
ID
AN
CE
A determination of additionality is implicit in this procedure in thesense that if the identified baseline scenario is not the projectactivity, the project activity will be additional. However, the identi-fication of the baseline scenario will always be subject to somedegree of subjectivity. It will be up to project developers and thosereviewing a GHG project to decide what constitutes a significantset of barriers for a project, whether barriers are insurmountable,and ultimately how to weigh and compare the cumulative signifi-cance of barriers for different alternatives (see section 8.1).Similarly, subjective decisions will be required in any assessmentof net benefits, if such an assessment is employed to help identifythe baseline scenario (see section 8.2.2). Because of the subjec-tivity involved, strong attention should be paid to the principles oftransparency, conservativeness, completeness, and relevance inperforming the project-specific procedure.
In performing this procedure, project developers may also wishto consider how it relates to the policy objectives of GHGprograms concerning additionality, as outlined in Chapter 3. Thestringency of this procedure is determined by the weight ofevidence required to establish any particular claim concerningthe final identification of the baseline scenario. GHG programsthat desire a stringent additionality determination may imposespecific informational requirements for substantiating anyclaims, or may require that certain methods be used. They mayalso choose to require certain additionality tests prior to identi-fying the baseline scenario (which could, for example, eliminatecertain baseline candidates from consideration).
B O X 8 . 1 The project-specific procedure, additionality, and GHG programs
jpText_FINAL.qxd 11/22/05 3:50 PM Page 50

8 . 1 . 1 I D E N T I F Y I N G B A R R I E R S T O T H E P R O J E C T A C T I V I T Y A N D B A S E L I N E C A N D I D AT E S
Identified barriers should include anything that would
discourage a decision to try to implement the project
activity or baseline candidates. All possible barriers
should be considered. The project activity and baseline
candidates may each face multiple barriers. Table 8.1
lists major categories of possible barriers. How each
category is addressed in identifying and defining actual
barriers should be explained.
8 . 1 . 2 I D E N T I F Y I N G B A R R I E R S T O T H E C O N T I N U AT I O N O F C U R R E N T A C T I V I T I E S
In most cases, there are no barriers to the continuation
of current activities. However, if barriers do exist, they
are often prohibitive or insurmountable. Barriers to the
continuation of current activities could include:
• The end of a piece of equipment’s useful lifetime, where
the GHG project involves retrofitting this equipment
(see Box 8.2).
• Market or regulatory changes that force a shift in
existing production, management practices, or tech-
nologies. These would be changes that necessitate
large-scale shutdown or replacement of existing facili-
ties and equipment, or force changes in current
practices (e.g., if a law were passed requiring the
destruction of HFC-23 at HCFC-22 production facili-
ties). Such conditions should be fully explained.
8 . 1 . 3 A S S E S S I N G T H E R E L AT I V E I M P O R T A N C E O F T H E I D E N T I F I E D B A R R I E R S
In some cases, an identified barrier may eliminate an
alternative from further consideration. This can occur if
the barrier makes the alternative infeasible, or is other-
wise prohibitive or insurmountable. However, barriers
C H A P T E R 8 : Estimating Baseline Emissions—Project-Specific Procedure
51G
UI
DA
NC
E
T A B L E 8 . 1 Barrier categories
B A R R I E R T Y P E S
Financial and Budgetary
Technology Operation and Maintenance
Infrastructure
Market Structure
Institutional / Social /Cultural / Political
Resource Availability
B A R R I E R E X A M P L E S *
• High costs• Limited or no access to capital• High perceived risks, resulting in high borrowing costs or lack of access to credit or capital. Perceived
risks might be associated with, among other things:• political instability • currency fluctuations• regulatory uncertainty • poor credit rating of project partners • unproven technologies or business models • general risk of project failure
• Lack of trained personnel capable of maintaining, operating, or managing a technology and lack ofeducation or training resources
• Inadequate supply or transport infrastructure for inputs, spare parts, fuels, etc.• Lack of infrastructure required to integrate and maintain new technologies/practices
• Market barriers or uncorrected market “failures” impede the adoption of the technology or practice in question
• Institutional or political opposition to the implementation of the technology or practice in question• Limited or no institutional capacity required to facilitate the technology or practice in question• Low social acceptance of the technology or practice in question• Aversion to high upfront costs or lack of awareness of benefits results in limited uptake of a product
or service (e.g., energy-efficient appliances)• Lack of consensus on future management decisions (e.g., with respect to land-use)
• Irregular or uncertain supply of resources required to implement or operate a technology or practice
*This list is not intended to be exhaustive. Project developers or GHG programs may identify other forms of barriers that are not described here.
jpText_FINAL.qxd 11/22/05 3:50 PM Page 51

are rarely “absolute” in the sense that they are impossi-
ble to overcome. In most cases, therefore, the relative
importance of barriers should be assessed relative to
each other and for each possible alternative.
Such an assessment can be qualitative, although quantita-
tive components of an assessment should be incorporated
where possible. In many cases, an identified barrier either
will be specific to one alternative, or will affect all alter-
natives equally. If an identified barrier affects different
alternatives to different degrees, then any differences
should be characterized and fully explained. In principle,
this could mean distinguishing between:
• the likelihood that a particular barrier would be
present for a particular alternative, and
• the significance or extent of the barrier where it
is present.
The degree to which an identified barrier affects each
alternative may be characterized qualitatively using
descriptive explanations and relative rankings (e.g.,
high, medium, or low).
The relative importance of the identified barriers should
be estimated by determining the cumulative effect of all
identified barriers on each alternative, and providing a
rough ranking of the alternatives according to the barriers
they face. Assessments of the cumulative effects of barri-
ers should be substantiated and explained. One way to
present the final results is in matrix form, as in Table 8.2.
For the purpose of identifying a baseline scenario, it is not
always necessary to finely distinguish the rank of each
baseline scenario alternative (e.g., in Table 8.2., base-
line candidates 2 and 3 both face “medium” barriers).
8.2 Identifying the Baseline Scenario Before attempting to identify a baseline scenario, project
developers should check that the data needed to do so are
available. Available data should be relevant, reliable, and
verifiable and may involve industry, country, regional,
and local information. All possible sources for obtaining
the necessary information should be documented. For the
comparative assessment of barriers, the data must be
adequate to describe the relevance of each barrier in its
local context, and to demonstrate how identified barriers
affect (or do not affect) the project activity and each
baseline candidate. Annex B contains a list of useful
information sources. If net benefits are assessed, the
Estimating Baseline Emissions—Project-Specific Procedure
C H A P T E R 852
GU
ID
AN
CE
A retrofit project activity involves modifying existing equipment, or replacing existing equipment with new parts, devices, orsystems that:
• improve the equipment’s efficiency and lower its rate of GHGemissions; and/or
• increase the equipment’s utilization so that it produces moreof a particular product or service.
Thus, many retrofit project activities result in two primaryeffects: (1) lowering the rate of GHG emissions associated withthe equipment, and (2) displacing GHG emissions from othersources, for any amount of production greater than historicallevels, due to increased utilization.
For the first primary effect, “continuation of current activities”would involve continued operation of the equipment that theproject activity is retrofitting. For the second primary effect,“continuation of current activities” would involve continuedproduction from other existing facilities that the project activ-ity’s expanded production displaces.
For the first primary effect, the most significant barrier to thecontinuation of current activities would be the breakdown ofexisting equipment (e.g., by reaching the end of its useful life-time). If a piece of equipment would have to be replaced in thenear future, then in practical terms this would constitute anabsolute barrier to the continuation of current activities, andthe continuation of current activities should not be consideredas a baseline scenario alternative.
Predicting the remaining life of a piece of equipment can be challenging. It can depend on many variables, such as maintenance practices, owner policies about repairing versusreplacing equipment, replacement schedules, the date ofinstallation, and cumulative operating hours. Estimates ofremaining equipment life can be derived from manufacturers’specifications, current commercial practice, regulatory stan-dards governing equipment replacement, or the equipment’seconomically competitive life. The rationale for any equipmentlife estimates should be explained. If the retrofit involvesreplacing a component of a larger piece of equipment (e.g.,installing more energy-efficient burners in a boiler), the life ofthe component (burner) should be used, rather than the life ofthe entire equipment (boiler).
B O X 8 . 2 Retrofit project activities and the continuation of current activities
jpText_FINAL.qxd 11/22/05 3:50 PM Page 52

C H A P T E R 8 : Estimating Baseline Emissions—Project-Specific Procedure
53G
UI
DA
NC
E
T A B L E 8 . 2 Example of rough ranking of baseline scenario alternatives by cumulative significance of barriers
B A R R I E R 1( H ) *
Present
Not present
Not present
Not present
Not present
B A R R I E R 2( L ) *
Present
Not present
Present
Not present
Not present
B A R R I E R 3( M ) *
High
Low
Medium
Medium
Not present
B A R R I E R 4( L ) *
Present
Present
Present
Present
Not present
R A N K B Y C U M U L AT I V E I M P A C T
(5) Highest barriers
(2) Second-lowest barriers
(4) Medium barriers
(3) Medium barriers
(1) Lowest (no) barriers
data must be adequate to substantiate the magnitude of
benefits for each alternative.
8 . 2 . 1 E X P L A I N I N G B A R R I E R S T O T H E P R O J E C T A C T I V I T Y A N D H O W T H E Y W I L L B E O V E R C O M E
The significance of any barriers facing the project activ-
ity should be fully explained, and all measures and
design features intended to overcome these barriers
should be documented. For example, to overcome project
activity barriers, GHG projects may be designed to:
• contribute to the transfer of technologies or practices;
• strengthen local manufacturing and maintenance
capacities;
• introduce innovative financing arrangements;
• raise awareness of new products, technologies, and
practices;
• increase consumer demand; and
• increase competitive pressure for technological or
management change in the local market.
8 . 2 . 2 I D E N T I F Y I N G T H E B A S E L I N E S C E N A R I O U S I N G T H E C O M P A R AT I V E A S S E S S M E N T O F B A R R I E R S
The comparative assessment of barriers can be used to
identify the baseline scenario. For example, if only one
alternative faces few or no barriers and all other alterna-
tives (including the project activity) face significant or
insurmountable barriers, it can be argued that the baseline
scenario is the alternative that faces few or no barriers.
However, the comparative assessment of barriers may be
inconclusive where:
• Barriers facing the project activity are not significant.
In this case, either the comparative assessment of
barriers will be inconclusive or the project activity (if
it is the only viable alternative) will be identified as the
baseline scenario.
• More than one alternative faces barriers that are not
significant or that could be realistically overcome.
In such cases there are two options for identifying the
baseline scenario: (a) using the most conservative viable
alternative, or (b) conducting a net benefits assessment.
All reasoning and conclusions behind the identification of
the baseline scenario should be fully explained. Any
contention that barriers for a particular alternative are
prohibitive or insurmountable should be substantiated, and
explanations should focus on how the barriers would
prevent the implementation of the alternative. Any barri-
ers for a particular alternative that are thought to be
surmountable but still significant should also be explained.
a) Identifying the Baseline Scenario as the Most Conservative Viable Alternative
The alternative with the lowest level of GHG emissions
or the highest level of GHG removals is identified as the
baseline scenario. If the project activity does not face
*Relative importance of barriers compared to each other: H = Significant barrier; M = Moderately significant barrier; L = Less significant barrier Note: Describing a barrier as “present” may be sufficient in instances where a barrier affects more than one alternative to roughly the same extent.
B A S E L I N E S C E N A R I OA L T E R N AT I V E S
Project Activity
Baseline Candidate 1
Baseline Candidate 2
Baseline Candidate 3
Continuation of Current Activities
jpText_FINAL.qxd 11/22/05 3:50 PM Page 53

significant barriers, it will most likely be the most
conservative viable alternative. If the project activity is
not considered a viable alternative, its exclusion from
consideration should be fully explained.
b) Identifying the Baseline Scenario Using a Net Benefits Assessment
Where the project activity does not face significant
barriers, or where it is not possible to identify a baseline
scenario using only the comparative assessment of barri-
ers, it may be possible to identify the baseline scenario
using an assessment of net benefits. This approach
demonstrates that the baseline scenario would involve a
particular alternative because it would have had the
greatest net payoff, rather than the fewest barriers. A
net benefits assessment should be conducted for each
alternative whose barriers can be realistically overcome.
A net benefits assessment identifies the baseline scenario
as the alternative that would provide the greatest incen-
tives (identified as benefits) to its decision-makers relative
to any disincentives (already identified as barriers).
Identifying the baseline scenario involves three steps:
1. assessing benefits for each alternative,
2. comparing benefits to identified barriers, and
3. identifying the alternative with the greatest benefits
relative to barriers.
Step 1: Assessing Benefits for Each AlternativeBenefits from implementing the GHG project
(see Box 8.3) or baseline candidates can take many
forms, including:
• expected financial returns (assessed either qualita-
tively or quantitatively);
• research and demonstration value for a new technol-
ogy or practice;
• positioning in or entry into a specific market, strategic
alignment, other competitive benefits; and
• public relations benefits.
Regardless of the kinds of benefits identified, the goal is
to determine which of the possible alternatives has the
highest net benefits—absent any benefit resulting from
GHG reductions (see Box 8.4)—and whether the project
activity or any of the baseline candidates would be
preferable, from the standpoint of decision-makers, to
continuing current activities.
It is important to assess benefits only from the stand-
point of those responsible for making the decision
whether to implement the GHG project or activities asso-
ciated with a particular alternative. For example, a GHG
project may incidentally provide widespread benefits to a
local community—e.g., by reducing local air pollution or
providing supplemental income to local residents (say,
from forestry products). These benefits, however, may
not directly influence a decision to implement a project
activity (assuming the community is not in charge of the
decision). Rather, such benefits should be considered only
to the extent that they translate into direct benefits for
Estimating Baseline Emissions—Project-Specific Procedure
54
GU
ID
AN
CE
The baseline scenario is specific to an individual project activityand primary effect. However, benefits are usually assessed asthey relate to an entire GHG project or baseline candidate, ratherthan a specific project activity or component activity of a base-line candidate. This is because the decision to implement aparticular project activity almost always depends on a decisionabout implementing the entire GHG project with which it is asso-ciated. In some cases, meaningfully assigning benefits (e.g.,revenues or public relations value) for an entire GHG project to aspecific project activity may be difficult or impossible.
B O X 8 . 3 Assessing benefits with respect to the GHG project
The baseline scenario is intended to represent what would havebeen most likely to occur absent any consideration of the projectactivity’s potential for climate change mitigation. For thisreason, any potential benefits resulting from GHG reductions areexcluded from the assessment of benefits. For example,revenues generated from the sale of GHG reduction “credits”should be excluded from the assessment because they resultfrom the GHG reductions. Similarly, research and demonstrationbenefits should be excluded if they directly relate to climatechange mitigation. On the other hand, benefits that are associ-ated with, but are not the direct result of GHG reductions shouldstill be assessed. For example, there may be costs savings asso-ciated with measures that also happen to reduce GHGemissions. These savings should be assessed as benefits.
B O X 8 . 4 Excluding benefits resulting from GHG reductions
C H A P T E R 8
jpText_FINAL.qxd 11/22/05 3:50 PM Page 54

the decision-makers—i.e., the project developer—and
thus contribute to a decision on whether to implement a
project activity.
Benefits may be assessed qualitatively and quantita-
tively. Some types of benefits (e.g., public relations
benefits) may be difficult or impossible to quantify, and
should therefore be assessed qualitatively. A largely
qualitative assessment (see Box 8.5) may be sufficient
and appropriate if the relative net benefits of the GHG
project and baseline candidates can be differentiated
clearly enough to identify an unambiguous choice for the
baseline scenario (i.e., after benefits are netted against
identified barriers, in Step 3, below).
A matrix, such as the one in Table 8.3, can be used to
present a ranking of the benefits of possible alternatives
according to their relative magnitude. As with the identi-
fication of barriers, the final assessment and ranking
may be qualitative rather than numerical, but should be
based on substantiated assessments for each alternative.
Step 2: Comparing Benefits to Identified BarriersThe net benefits of each alternative can be determined by
comparing benefits to identified barriers. Net benefits
may be positive or negative. Negative net benefits could
occur, for example, if implementing a baseline candidate
would be expected to result in a financial loss, or would
otherwise result in negative repercussions for decision-
makers (e.g., adverse publicity). Alternatives may be
excluded from further consideration if it is determined
that the expected benefits would offer insufficient incen-
tive for overcoming the identified barriers. Table 8.4
offers a sample matrix for assessing net benefits and
screening out unviable alternatives. Some alternatives
may have already been rejected at this point—e.g., if
they faced insurmountable barriers.
C H A P T E R 8 : Estimating Baseline Emissions—Project-Specific Procedure
55G
UI
DA
NC
E
A GHG project that captures landfill gas (LFG) to generate elec-tricity would have two project activities: (1) capturing methanethat would otherwise be emitted; and (2) displacing GHG emis-sions from grid-connected electricity plants. The first projectactivity might have three baseline scenario alternatives: theproject activity itself (i.e., capturing methane as part of an LFG-to-energy project); flaring the gas instead of using it for energy;and doing nothing (continuing current activities). Because flar-ing the gas would incur costs and generate no revenue, it wouldhave negative net benefits. With some basic representative costanalysis and reference to natural gas prices, the project devel-oper might be able to demonstrate that potential revenues fromusing the gas as a fuel would not cover the cost of installingelectricity generation equipment—again resulting in negativefinancial benefits. Assuming there are no barriers to the contin-uation of current activities (e.g., no laws requiring LFG flaring),it could be convincingly demonstrated that “doing nothing” isthe appropriate baseline scenario without the need for detailedquantitative financial analysis.
B O X 8 . 5 Example of a qualitative benefits assessment
T A B L E 8 . 3 Example of rough ranking of alternatives by magnitude of benefits
B A S E L I N E S C E N A R I O A L T E R N AT I V E S *
Project Activity
Baseline Candidate 1
Baseline Candidate 2
Baseline Candidate 3
Continuation of Current Activities
M A G N I T U D E O F B E N E F I T S
Small
Large
Medium
Zero
Small
R E L AT I V E R A N K I N G S
Low
Highest
Middle
Lowest
Low
This table summarizes the results of a benefits assessment by ranking the baseline scenario alternatives according to the relativemagnitude of their benefits. It is not necessary to distinguish the rank of every alternative (e.g., the Project Activity and Continuation ofCurrent Activities are both ranked “Low”) to identify the baseline scenario, it is only necessary to find the alternative with the greatestbenefits relative to identified barriers.*This assumes all alternatives did not face significant barriers.
jpText_FINAL.qxd 11/22/05 3:50 PM Page 55

Comparing financial benefits and barriers (e.g., revenues
and costs) is usually straightforward. In many cases,
however, benefits will be “netted” against barriers quali-
tatively. Such analysis may be subjective and should be
fully explained for the sake of transparency. If financial
returns are a significant source of benefits for more than
one alternative, it may be desirable for the sake of trans-
parency and credibility to quantify net financial benefits
using an investment analysis. Guidelines for conducting
an investment analysis are provided in Annex C.
Step 3: Identifying the Baseline Scenario Each possible alternative should be assessed with respect
to how decision-makers would weigh benefits against
perceived barriers. The baseline scenario will have the
greatest net benefits relative to the disincentives
presented by barriers. The alternative with the highest
benefits will not necessarily be the baseline scenario if it
faces more significant barriers than other alternatives. If
all alternatives have negative net benefits, the alterna-
tive with the least negative net benefits should be
identified as the baseline scenario. A table like Table 8.5
could be provided to summarize the analysis used to
identify the baseline scenario. A full explanation of how
the baseline scenario was identified should be provided
for transparency.
If making an unambiguous distinction between the net
benefits of two or more alternatives is difficult, two
options are available for identifying the baseline scenario:
• Undertake a more detailed assessment of the barriers
and benefits to try to distinguish more clearly between
the alternatives—provided the additional level of
detail can be substantiated with available information.
Estimating Baseline Emissions—Project-Specific Procedure
C H A P T E R 856
GU
ID
AN
CE
T A B L E 8 . 4 Example of assessing net benefits and screening out unviable alternatives
B A S E L I N E S C E N A R I O A L T E R N AT I V E S
Project Activity
Baseline Candidate 1
Baseline Candidate 2
Baseline Candidate 3
Continuation of Current Activities
B E N E F I T S
Small
Large
Medium
Zero
Small
I D E N T I F I E D B A R R I E R S
Highest barriers
Second-lowest barriers
Medium barriers
Medium barriers
Lowest (no) barriers
N E T B E N E F I T S
Large negative [Exclude]
Large positive
Zero
Negative [Exclude]
Small positive
This table summarizes the comparison of benefits to identified barriers for each baseline scenario alternative. The resulting “net benefits”may be positive or negative. Negative net benefits could occur, for example, if implementing a baseline candidate would be expected toresult in a financial loss, or would otherwise result in negative repercussions for decision-makers. Alternatives may be excluded fromfurther consideration if it is determined that benefits would offer insufficient incentive for overcoming the identified barriers.
T A B L E 8 . 5 Sample summary of the net benefits assessment
B A S E L I N E S C E N A R I O A L T E R N AT I V E S
Baseline Candidate 1
Continuation of Current Activities
Baseline Candidate 2
N E T B E N E F I T S
Large positive net benefits
Small positive net benefits
Zero net benefits
C O N C L U S I O N S
Baseline scenario will involve implementation ofBaseline Candidate 1
Viable, but not most attractive to decision-makers
Least attractive viable alternative for decision-makers
This table summarizes the final results of the net benefits assessment and indicates the identified baseline scenario, in this caseBaseline Candidate 1. The identified baseline scenario is the alternative with the highest net benefits.
jpText_FINAL.qxd 11/22/05 3:50 PM Page 56

57
• Choose the most conservative viable alternative—i.e.,
the one with the least GHG emissions or most GHG
removals. Note that if the project activity remains as
one of the viable alternatives, it will most likely be the
most conservative alternative.
8 . 2 . 3 J U S T I F Y I N G T H E B A S E L I N E S C E N A R I OThe baseline scenario may be justified using the analysis
and documentation associated with the comparative
assessment of barriers and, where undertaken, the net
benefits assessment. In some cases, the baseline scenario
will involve a baseline candidate that would have been
implemented later than the project activity. In these cases,
additional explanations and justifications for the timing of
the baseline scenario should be provided (see Box 8.6).
In some cases, a final “reality check” involving a review
of common practice will help strengthen the justification
for the baseline scenario. This kind of reality check
should involve three steps:
1. Listing all the baseline candidates identified as
common practice in Chapter 7, section 7.6.
2. Indicating if the technologies or practices employed
by the project activity are common practice, using the
same analysis applied to the baseline candidates.
3. Explaining any instances where common practice
technologies or practices were rejected from consider-
ation as the baseline scenario. Explanations should be
supported by evidence pertaining to the project activ-
ity’s specific circumstances and discuss why
decision-makers would not have implemented a
common practice alternative in the baseline scenario.
GU
ID
AN
CE
If the identified baseline scenario involves the implementationof a particular baseline candidate, the presumption is usuallythat the baseline candidate’s implementation would have coin-cided with the project activity’s implementation. In many cases,however, a particular baseline candidate could have been imple-mented significantly later than the onset of the GHG project (butstill within the GHG project’s lifetime). This might occur if:
• barriers to the baseline candidate are temporary,
• the baseline candidate would only be implemented after abarrier arises to the continuation of current activities, or
• the net benefits from implementing the baseline candidateare low in the near term but would increase substantiallyunder future conditions.
If these kinds of circumstances are expected, they should beexplained. In such circumstances, the identified baselinescenario will consist of:
• a period during which the baseline scenario involves thecontinuation of current activities, and
• a subsequent period during which the baseline scenarioinvolves the implementation of a baseline candidate.
The length of time until a baseline candidate would have beenimplemented can depend on a variety of factors, including thetype of technology or practice involved, economic trends or marketconditions, and the nature of any barriers. Precise predictionsabout the timing of implementation may be difficult; for trans-parency, all assumptions and analyses should be explained.
B O X 8 . 6 Baseline scenarios that involve laterimplementation of a baseline candidate
Courtesy of Holcim Cement
jpText_FINAL.qxd 11/22/05 3:50 PM Page 57

8.3 Estimating Baseline EmissionsBaseline emission estimates for the project activity’s
primary effect should be derived from the types of
technologies or practices represented in the baseline
scenario. In most cases, it should be possible to specify
a GHG emission rate for these technologies or practices,
in the form of GHG emissions per unit of product or
service (identified in Chapter 7, section 7.1). Total base-
line emissions can then be calculated using the project
activity’s level of production of the product or service.1
Box 8.7 provides guidance on how to estimate baseline
emissions when the baseline scenario involves continua-
tion of current activities. The GHG emission rate for the
baseline scenario should be fully explained, and support-
ing assumptions and calculations should be documented.
Absolute baseline emissions should be estimated when
it is difficult or inappropriate to specify a baseline GHG
emission rate. This is generally the case for land-use
and some fugitive emission project activities.
Box 8.8 provides guidance on estimating baseline
emissions when the baseline scenario involves the later
implementation of a baseline candidate.
Estimating Baseline Emissions—Project-Specific Procedure
C H A P T E R 858
GU
ID
AN
CE
• Project Activities That Displace or Reduce Production fromOther Sources. For these project activities, baseline emissionsare estimated from the GHG emission rates of existing sourceswhose production will be displaced or reduced. A common exam-ple is estimating the “operating margin” for grid electricityproduction, where electricity will either be displaced (e.g., energysupply projects) or reduced (e.g., end-use energy conservationprojects). The method used to estimate GHG emissions fromdisplaced existing sources should be fully explained.
• Project Activities That Reduce the GHG Emission Rate of anExisting Process (Retrofit Projects). For these project activities,baseline emissions from the continuation of current activitiesmay be estimated as the historical GHG emission rate for theprocess or equipment that is being retrofitted.
B O X 8 . 7 Estimating baseline emissions when the baseline scenario involves the continuation of current activities
• Project Activities That Capture or Destroy Fugitive Emissions.For these project activities, baseline emissions from the continu-ation of current activities may be estimated from historicalemission rates at the GHG sources affected by the project activ-ity. Where the project activity does not affect the underlyingproduction of GHGs at these sources, baseline emissions will beequivalent to the amount of GHG emissions captured or destroyedby the project activity.
• Project Activities That Remove or Store GHGs. For these projectactivities, baseline emissions from the continuation of currentactivities will either be equivalent to GHG emissions sequesteredby the project activity, or can be estimated using land-use trendsor other projections related to GHG removal rates.
Baseline emissions from the continuation of current activities can be estimated differently, depending on the type of project activity.
jpText_FINAL.qxd 11/22/05 3:50 PM Page 58

C H A P T E R 8 : Estimating Baseline Emissions—Project-Specific Procedure
59G
UI
DA
NC
E
Where a baseline candidate is implemented later than the proj-ect activity, the baseline scenario will initially involve thecontinuation of current activities. In this situation, there are twooptions for estimating baseline emissions:
• Specify different baseline emission rates (or absolute baselineemission estimates) for different time periods. For example,identify a baseline emission rate for the continuation of currentactivities that will apply up until the baseline candidate isimplemented. Then specify another baseline emission rate —derived for the baseline candidate— that will be used for theperiod after the baseline candidate’s implementation.
• Specify a single, combined baseline emission rate for thevalid time length of the baseline scenario (see Chapter 2,section 2.11). This generally involves weighting differentbaseline emission rates according to the length of timeduring which they will apply. For example, the baselinescenario may be valid for 10 years. The baseline scenarioinvolves the continuation of current activities for three years,after which a baseline candidate will be implemented. In thiscase, the baseline emission rate can be calculated as 0.3multiplied by the baseline emission rate for the continuationof current activities plus 0.7 multiplied by the baseline emis-sion rate for the baseline candidate.
B O X 8 . 8 Estimating baseline emissions when thebaseline scenario involves the laterimplementation of a baseline candidate
NOTES1 Using the project activity’s level of output to calculate baseline emissions
assumes equivalence in output between the project activity and baseline
scenario (see section 2.13). A different basis for calculating total baseline
emissions may be necessary if the baseline scenario would not produce
equivalent output.
Gary Kramer, Natural Resources Conservation Service
jpText_FINAL.qxd 11/22/05 3:50 PM Page 59

Estimating Baseline Emissions—Performance Standard Procedure
PA R T I I60
9
he performance standard procedure analyses the GHG emission rates of all baseline
candidates identified in Chapter 7 to construct a GHG emission performance standard
against which project activity emissions can be compared. The performance standard is
used to determine baseline emissions for the project activity’s primary effect. Once a perform-
ance standard is developed, any number of similar project activities may be compared to it. A
performance standard is periodically updated to reflect changing circumstances within the
relevant geographic area or temporal range identified in Chapter 7.
T
jpText_FINAL.qxd 11/22/05 3:50 PM Page 60

The GHG emission rate for a performance standard can
be expressed in different ways, depending on the type of
project activity involved (see Table 9.1). For energy effi-
ciency, energy generation, and industrial process project
activities, a GHG performance standard will generally be
defined as a rate of GHG emissions per unit of a product
or service produced by all the baseline candidates. This
type of performance standard is referred to as a produc-
tion-based performance standard.
For project activities involving storage or removals of
CO2 by biological processes, fugitive emissions, or waste
emissions—where there is no easily measured produc-
tion of a product or service—the performance standard
will usually be defined as a rate of GHG emissions (or
removals) per unit of time and size or capacity of the
baseline candidates. This type of performance standard
is referred to as a time-based performance standard.
C H A P T E R 9 : Estimating Baseline Emissions—Performance Standard Procedure
61
T A B L E 9 . 1 Types of performance standard emission rates
T Y P E S O F P E R F O R M A N C E S TA N D A R D S
Production-Based
Time-Based
R E L E VA N T T Y P E S O FP R O J E C T A C T I V I T I E S
Energy efficiency, energy gener-ation, and industrial processes
Waste and fugitive emissionsand storage or removals of CO2
by biological processes
P E R F O R M A N C E S T A N D A R DE X P R E S S E D A S :
GHG EmissionsUnit of Product or Service
GHG Emissions(Unit of Time) . (Unit of Baseline Candidate Size or Capacity)
The GHG emission rate for a performance standard can be expressed in different ways, depending on the type of project activityinvolved. For energy efficiency, energy generation, and industrial process project activities, a GHG performance standard will generallybe defined as a rate of GHG emissions per unit of a product or service produced by all the baseline candidates. For project activitiesinvolving storage and removals of CO2 by biological processes, fugitive emissions, or waste emissions—where there is no production ofa product or service—the performance standard will usually be defined as a rate of GHG emissions (or removals) per unit of time andsize or capacity of the baseline candidates.
jpText_FINAL.qxd 11/22/05 3:50 PM Page 61

RequirementsThe steps outlined below shall be followed to derive a
performance standard relevant to the type and location
of the GHG project being proposed.
9.1 Specify appropriate performance metrics for all baseline candidates
Select and report an appropriate performance metric(s),
depending on the type of project activity and the number
of relevant inputs used by the baseline candidates.
9 . 1 . 1 P R O D U C T I O N - B A S E D P E R F O R M A N C E S T A N D A R D S
For energy efficiency, energy generation, and industrial
process project activities, a performance metric shall be
identified for each set of baseline candidates that uses
the same type of relevant input.
Performance Metric = Ic
P
Where:
• Ic = Units of a relevant input common to all baseline
candidates of type c
• P = Units of a product or service, common to all base-
line candidates, that depends on input Ic
Justify the choice of input, and product or service, for
each identified performance metric. The product or serv-
ice (denominator) shall be the same as that identified in
Chapter 7, section 7.1.
Where a baseline candidate does not use any inputs
related to the project activity’s primary effect, a separate
performance metric does not need to be identified and the
GHG emission rate for the baseline candidate is zero.
9 . 1 . 2 T I M E - B A S E D P E R F O R M A N C E S T A N D A R D SFor project activities involving storage and removals of
CO2 by biological processes, fugitive emissions, or waste
emissions, a single performance metric shall be identi-
fied that relates GHG emissions to a specific length of
time for each baseline candidate:
Performance Metric = E
S . t
Where:
• E = Units of GHG emissions or removals
• S = Units of baseline candidate size or capacity
• t = Units of time
Justify why the type of units chosen for S and t are the
most appropriate for developing a performance metric.
Both the type of GHG emissions in the numerator and
the type of units for the denominator shall be common to
all baseline candidates.
9.2 Calculate the GHG emission rate for each baseline candidate
For each baseline candidate, calculate and report a
GHG emission rate using the performance metric(s)
selected above. Perform the following steps, depending
on the type of performance standard being derived:
9 . 2 . 1 P R O D U C T I O N - B A S E D P E R F O R M A N C E S T A N D A R D S
For each baseline candidate:
• Obtain the quantity of the relevant input required by
the baseline candidate over a specified time period (in
units of Ic, as identified in section 9.1.1). The time
period used to gather the data shall be reported and
justified and shall be comparable for all baseline candi-
dates. Report and justify any discrepancies between the
time periods used for different baseline candidates
(e.g., different lengths or different periods of time).
• Obtain the quantity of product or service produced by
the baseline candidate (in units of P, as specified in
section 9.1.1) over the same time period that was used
to measure the quantity of relevant input used.
Estimating Baseline Emissions—Performance Standard Procedure
C H A P T E R 962
RE
QU
IR
EM
EN
TS
jpText_FINAL.qxd 11/22/05 3:50 PM Page 62

• Convert the quantity of the relevant input to GHG emis-
sions using an appropriate emission factor. Any and all
emission factors shall be reported and justified.
Each baseline candidate shall have a GHG emission rate
of the form:
• Quantity of GHG emissions
P
9 . 2 . 2 T I M E - B A S E D P E R F O R M A N C E S T A N D A R D SFor each baseline candidate:
• Identify the size or capacity of the baseline candidate
(in units of S, as specified in section 9.1.2).
• Obtain the quantity of the relevant GHG emissions (in
units of E, as specified in section 9.1.2) produced by
the baseline candidate over a specified time period (in
units of t , as specified in section 9.1.2). Report and
justify the time period and its length. Where GHG
emissions data for a baseline candidate were collected
during a period of time significantly different from
other baseline candidates (e.g., during a different
year), report and justify this discrepancy.
Each baseline candidate shall have a GHG emission rate
in the form:
• Quantity of GHG emissions
S . t
9.3 Calculate GHG emission rates for different stringency levels
Numerically analyse the GHG emission rates of all base-
line candidates to calculate the GHG emission rates
corresponding to the following stringency levels:
• Most stringent: The best-performing baseline candi-
date (i.e., the baseline candidate with the lowest GHG
emission rate or highest GHG storage/removal rate).
• The weighted mean GHG emission rate.
• The median GHG emission rate (i.e., the 50th
percentile, calculated in the same manner as other
percentile calculations).
• At least two better-than-average GHG emission rates
(e.g., the 25th and 10th percentiles).
The mean, median, and percentile GHG emission rates
shall be calculated to reflect the relative contribution
of each baseline candidate to total production (produc-
tion-based performance standards) or to the aggregate
size or capacity of all baseline candidates (time-based
performance standards).
9.4 Select an appropriate stringency level for the performance standard
Choose the stringency level from those calculated in
section 9.3 that is most appropriate for approximating
baseline emissions. The GHG emission rate associated
with this stringency level shall be the performance stan-
dard. Report the selected stringency level and associated
performance standard and justify why it was chosen.
9.5 Estimate baseline emissionsFor production-based performance standards, calculate
baseline emissions by multiplying the level of production
of the project activity (i.e., total units of product or service
produced) by the performance standard emission rate.
For time-based performance standards, calculate base-
line emissions by multiplying the relevant time period
(e.g., one year) and the project activity size or capacity
by the performance standard emission rate.
C H A P T E R 9 : Estimating Baseline Emissions—Performance Standard Procedure
63R
EQ
UI
RE
ME
NT
S
jpText_FINAL.qxd 11/22/05 3:50 PM Page 63

GuidanceGHG performance standards are derived from an analy-
sis of the GHG emission rates of the baseline candidates
identified in Chapter 7. Calculating GHG emission rates
for the baseline candidates, however, requires identifying
the processes that give rise to their GHG emissions. For
production-based performance standards, baseline
candidate GHG emissions generally arise (directly or
indirectly) from the use of an input, or factor of produc-
tion. GHG emissions for coal-burning power plants, for
example, result directly from the combustion of coal
needed to generate electricity. For time-based perform-
ance standards, baseline candidate GHG emissions arise
from processes inherent to the land or equipment associ-
ated with the baseline candidates. GHG removals on
agricultural lands, for example, typically arise from the
carbon sequestration process in soils.
Therefore, the first step in deriving a performance stan-
dard is to identify appropriate performance metrics for
the baseline candidates, connected to the processes that
give rise to their GHG emissions.
9.1 Specifying the Appropriate Performance Metrics
This step involves identifying the units of measure that
will be used to gauge the performance of baseline candi-
dates. Actually measuring performance and converting
this performance to a GHG emission rate for each base-
line candidate is completed in section 9.2.
The performance metrics that need to be specified will
depend on the type of performance standard being
derived and the types of relevant inputs used by differ-
ent baseline candidates. Table 9.2 provides some
examples of different GHG projects and their possible
performance metrics.
9 . 1 . 1 P R O D U C T I O N - B A S E D P E R F O R M A N C E S T A N D A R D S
Numerous inputs are required to produce most products
and services. A relevant input, however, is one that is
related to the primary effect of the project activity (see
Chapter 5)—i.e., to the intended change in GHG reduc-
tions caused by the project activity.
For example, producing plastic toys requires at least two
major inputs that contribute to GHG emissions: electric-
ity and plastic. A proposed GHG project might involve
producing plastic toys using less electricity, with no
change in the type or quantity of plastic. The GHG project
would consist of a single project activity, whose primary
effect would be to reduce combustion emissions from
generating grid-connected electricity. Units of electricity
(rather than units of plastic) per plastic toy would be used
to specify the performance metric. Any change in GHG
emissions from changes in plastic consumption required
to make toys would be addressed as a secondary effect.
In some cases, baseline candidates may use inputs unre-
lated to a project activity’s primary effect. For example,
a project activity’s primary effect may involve a reduc-
tion in combustion emissions from generating
grid-connected electricity. However, some types of power
plants (e.g., hydroelectric plants) do not produce
combustion emissions. If one of the baseline candidates
is a power plant that does not use fossil fuels as an input,
specifying a performance metric for it is unnecessary
and its GHG emission rate is zero.
When There Is Only a Single Relevant Input for All Baseline CandidatesIn many cases, all baseline candidates use the same rele-
vant input. If all baseline candidates use only one relevant
input (e.g., electricity) to produce the product or service
provided by the project activity, then only one perform-
ance metric needs to be identified.
For example, a refrigerator efficiency project activity’s
primary effect is reducing combustion emissions from
generating grid-connected electricity. The only relevant
input used by baseline candidates (i.e., alternative
refrigeration technologies) is electricity. Thus, a single
performance metric (e.g., kilowatt-hours per unit of
cooling/refrigeration) would be appropriate for all base-
line candidates.
When Baseline Candidates Use Multiple Relevant InputsIf baseline candidates use a variety of relevant inputs
(e.g., various types of fuel), then multiple performance
metrics should be identified—one for each type of rele-
vant input identified.
Estimating Baseline Emissions—Performance Standard Procedure
C H A P T E R 964
GU
ID
AN
CE
jpText_FINAL.qxd 11/22/05 3:50 PM Page 64

C H A P T E R 9 : Estimating Baseline Emissions—Performance Standard Procedure
65G
UI
DA
NC
E
T A B L E 9 . 2 Examples of performance metrics for different types of project activities
G H G P R O J E C T
Wind PowerProject
EnergyEfficiencyProject
Transport-ation FuelSwitch Project
Industrial FuelSwitch Project
AfforestationProject
ForestManagementProject
AgriculturalTillage Project
Landfill Gas(LFG) Project
P R O J E C T A C T I V I T Y
Generate grid-connectedelectricity fromwind turbines
Improve energy efficiency of lightingby using energy-efficient light bulbs
Change from fossil fuel tobiofuel in buses
Fuel switch tonatural gas at anoff-grid stationarycombustion plant
Change land- use to enhancecarbon storage
Change forestmanagement toenhance carbonstorage
Change tillagepractices toenhance carbonstorage
a) Install equip- ment to capturemethane
b) Generate grid-connectedelectricity fromcaptured methane
P R I M A R Y E F F E C T
Reduction in combustionemissions from generatinggrid-connected electricity
Reduction in combustionemissions from generatinggrid-connected electricity
Reduction in combustionemissions from generatingenergy or off-grid electricity,or from flaring
Reduction in combustionemissions from generatingenergy or off-grid electricity,or from flaring
Increased storage orremovals of CO2 by biological processes
Increased storage orremovals of CO2 by biologi-cal processes
Increased storage orremovals of CO2 by biologi-cal processes
a) Reduction in waste emissions
b) Reduction in combustionemissions from generating grid-connected electricity
S A M P L E B A S E L I N EC A N D I D AT E S
SOther electricity-generating technologies on the grid, such as fossil fuel or other renewable-energy technologies
• Incandescent light bulbs• Compact fluorescent light bulbs • Halogen light bulbs
• Diesel • Gasoline • Ethanol • Biodiesel• LNG
• Other fossil fuels, such as coal or oil• Renewable energy sources
• Continuation of current land-use• Cropland growing different
food crops• Pastureland
• Continuing current forest management
• Variations in forest management,such as increasing thinning or fertilisation
• Continuing current tillage practices• No-till or zero tillage• Mouldboard ploughing• Conventional tillage• Ridge tillage
a) • Continuation of current activity• Flaring of LFG • Use of LFG for fuel
b) Other electricity-generatingtechnologies on the grid, suchas fossil fuel or renewableenergy technologies
POSSIBLE PERFORMANCEMETRICS
S• m3 of gas consumed/kWh
electricity generated• Tonnes coal/kWh electricity
generated
kWh electricity consumed/m2
of lighted space
Litres of diesel fuelconsumed/kilojoules of energyrequired for transportation
Tonnes of coalconsumed/tonne of steamproduced
Tonnes of CO2eqsequestered/ha/yr
Tonnes of CO2eqsequestered/ha/yr
Tonnes of CO2eqsequestered/ha/yr
a) Tonnes of methane/ m3 landfill waste/month
b) Tonnes coal/kWh electricitygenerated
P R O D U C T I O N - B A S E D P E R F O R M A N C E M E T R I C S
T I M E - B A S E D P E R F O R M A N C E M E T R I C S
jpText_FINAL.qxd 11/22/05 3:50 PM Page 65

For example, electricity can be produced using a variety of
generation technologies that rely on different fuels. For a
project activity whose product is electricity production, proj-
ect developers should identify a series of performance
metrics corresponding to all fuel types used by the baseline
candidates (e.g., tonnes of coal per kilowatt-hour, cubic
meters of natural gas per kilowatt-hour, etc.).
As another example, water heaters within a certain
geographic area and temporal range may use either gas
or electricity as a primary energy source. A project
activity that involves reducing water heater energy
consumption should be compared to a GHG performance
standard derived from performance metrics for both gas
and electric water heaters.
9 . 1 . 2 T I M E - B A S E D P E R F O R M A N C E S T A N D A R D SPerformance metrics for time-based performance stan-
dards have three components: units of GHG emissions in
the numerator, and units of time and size or capacity in
the denominator. Units of time will often be years, but
could be any other appropriate length of time.
Appropriate units for size could include, for example,
hectares of land, kilometres of natural gas pipeline, or
tonnes of landfill waste. Units of capacity could include
cubic meters of natural gas or potential throughput
volume (e.g., for gas pipelines or compressor stations).
Where all baseline candidates are of the same size or
capacity, then the “size” units could be expressed simply
in terms of a single baseline candidate—e.g., a piece of
equipment. The performance metric would then take the
form of GHG emissions per specific length of time per
piece of equipment.
9.2 Calculating the GHG Emission Rate for Each Baseline Candidate
This step involves measuring the performance of each base-
line candidate using the appropriate performance metric,
and calculating an associated GHG emission rate.
9 . 2 . 1 P R O D U C T I O N - B A S E DP E R F O R M A N C E S T A N D A R D S
For production-based performance standards, the perform-
ance rate is converted to a GHG emission rate. For
example, the performance of a power plant may be meas-
ured in terms of cubic meters of natural gas consumed per
kilowatt-hour produced. This would then be converted to a
GHG emission rate by calculating the amount of CO2 emit-
ted per cubic meter of natural gas consumed.
To measure performance, data should be collected for
each baseline candidate. The appropriate time period
over which input use and production data are collected to
determine GHG emission rates varies by technology and
depends on engineering variables, rates of production,
and possible fluctuations in production efficiency, among
other things. The time period should be sufficiently repre-
sentative for the technology in question. For example, if
the technology’s production is cyclical, it is important
that the entire cycle be considered when establishing
input and production quantities. Similarly, if GHG emis-
sions vary over the course of a baseline candidate’s
operation (e.g., between ramping up periods and steady
operation), or are affected by certain environmental
conditions, it is important to account for such variations.
The appropriate emission factor to use for converting
units of relevant input to units of GHG emissions
depends on whether consumption of the relevant input
results in GHG emissions directly or indirectly.
For Relevant Inputs That Result Directly in GHG EmissionsFor relevant inputs whose consumption directly results
in GHG emissions, identifying the appropriate emission
factor is usually straightforward. If the relevant input
is a fossil fuel, for example, it can be converted to CO2
emissions based on its carbon content and the condi-
tions under which it was burned. Appropriate default
emission factors for different fossil fuels are available
from the Intergovernmental Panel on Climate Change
(IPCC), the GHG Protocol calculation tools, and other
sources. Alternatively, GHG emissions for each baseline
candidate can be monitored directly, avoiding the need
for an emission factor.
For Relevant Inputs That Result Indirectly in GHG EmissionsSome types of inputs cause GHG emissions indirectly
during their production. These inputs may have different
emission factors, depending on where and how they were
produced. For example, if the relevant input for the
baseline candidates is electricity, the GHG emissions
Estimating Baseline Emissions—Performance Standard Procedure
C H A P T E R 966
GU
ID
AN
CE
jpText_FINAL.qxd 11/22/05 3:50 PM Page 66

arise from its generation rather than its consumption,
and the appropriate emission factor will depend on
where and how the electricity is generated. Electricity
may cause zero emissions if it is produced by non-GHG-
emitting generators, such as wind turbines, but may
cause substantial emissions if it is produced by an ineffi-
cient coal plant.
Emission factors for electricity also differ based on loca-
tions and time periods. For these emission factors, it is
important to consider where and how the relevant input
would have been produced in the project activity’s
absence. There are two basic possibilities:
• The relevant input would have been produced at the
same locations and in the same manner. In this case,
the same emission factor is used for the baseline
candidates as for the project activity. For example, an
energy-efficient industrial motor installed at an exist-
ing factory will reduce combustion emissions from
generating grid-connected electricity. The baseline
candidates—consisting of various motor technolo-
gies—against which this project activity is compared
are drawn from a geographic area encompassing
several different countries. However, the project activ-
ity will reduce electricity consumption only from the
local grid in the country where it is located. Any alter-
native to the project activity would have to be in the
same location as the existing factory. Thus, the GHG
emission rate for each baseline candidate should be
calculated using an emission factor (converting kilo-
watt-hours to kilograms of CO2) for the grid where the
project activity is located—not where each baseline
candidate is located.
• The relevant input would have been produced at differ-
ent locations or from different sources. Different
emission factors may be required for the same relevant
input produced at different locations and used by
different baseline candidates. For example, a proposed
project activity involves constructing a new energy-
efficient toy factory. Without the factory, the toys that
it produces would have been provided by a combina-
tion of several other factories (baseline candidates)
in six different countries. The GHG emission rate for
each baseline candidate should be calculated using
an electricity emission factor for the grid where each
baseline candidate is located.
For baseline candidate GHG emission rates to be credible,
transparency regarding their derivation is essential. For
determining electric grid emission factors, users of this
Protocol are also advised to consult the GHG Protocol
guidance related to grid-connected electricity projects.
9 . 2 . 2 T I M E - B A S E D P E R F O R M A N C E S T A N D A R D SFor time-based performance standards, calculating the
GHG emission rate involves measuring GHG emissions
for each baseline candidate over a certain time period,
as well as noting the size or capacity of each baseline
candidate. The length of time over which GHG emission
data are collected to determine the rate should be
comparable for each baseline candidate.
67G
UI
DA
NC
E
Britt Sandler, Program on Energy and Sustainable Development
jpText_FINAL.qxd 11/22/05 3:50 PM Page 67

9.3 Calculating the GHG Emission Rate for Different Stringency Levels
The stringency of a GHG performance standard refers to
how low its GHG emission rate (or how high its GHG
removal rate) is relative to the GHG emission rates of all
the baseline candidates. A stringency level is essentially
a better-than-average GHG emission rate. Different
stringency levels are identified and reported to enhance
the transparency of the performance standard’s deriva-
tion. Stringency levels may be specified as a GHG
emission rate corresponding to a certain percentile
(better than the 50th percentile) or to the lowest-emit-
ting baseline candidate.
For all stringency levels other than the most stringent,
GHG emission rates are derived using basic statistical
measures (i.e., the mean and various percentiles). To
prevent small baseline candidates from skewing the
results, baseline candidate GHG emissions are weighted
by size or contribution to total production.
The following procedures can be used to derive a GHG
emission rate for each of the required stringency levels.
(An example of the percentile calculations is also
provided in Box 9.1).
Determining the most stringent stringency level Identify the GHG emission rate of the best-performing
baseline candidate—i.e., the baseline candidate with the
lowest GHG emission rate, or highest GHG
storage/removal rate.
Calculating the size- or production-weighted meanGHG emission rateUse the following formula:
Weighted mean GHG emission rate =
Where:
• ERj = GHG emission rate of baseline candidate j
• Qj = quantity of product or service produced by
baseline candidate j over a certain time period,
e.g., one year (production-based performance
standards) or the size or capacity of baseline
candidate j (time-based performance standards)
• n = total number of baseline candidates.
The time period used to quantify production should be
the same for all baseline candidates. However, this
period does not need to coincide with the period used to
determine each baseline candidate’s GHG emission rate.
Determining the median GHG emission rateCalculate the GHG emission rate corresponding to the
50th percentile, using the methods described below.
Calculating the GHG emission rate for a given percentileUse the following approach:
a) For each baseline candidate using a particular relevant
input (where calculating a production-based perform-
ance standard) or for each baseline candidate (where
calculating a time-based performance standard):
• Quantify total production over a certain time
period (e.g., one year) or quantify its size or capacity.
• Assign a GHG emission rate to each unit of product
or service produced (e.g., each individual kilowatt-
hour) by the baseline candidate over that time
period or to each unit of the baseline candidate’s
size or capacity (e.g., each hectare).
Estimating Baseline Emissions—Performance Standard Procedure
68
GU
ID
AN
CE
j=1
n
j=1
n
(ERj. Qj )
Qj
Hisham Zerriffi, Program on Energy and Sustainable Development
jpText_FINAL.qxd 11/22/05 3:50 PM Page 68

C H A P T E R 9 : Estimating Baseline Emissions—Performance Standard Procedure
69G
UI
DA
NC
E
b) Sort each unit of product or service produced (for all
baseline candidates using a particular relevant input)
or each unit of size or capacity (for all baseline candi-
dates) by their assigned GHG emission rates, from
lowest to highest. Label them so that x1 is the smallest
value, and xa is the largest value, where:
• xm is the GHG emission rate assigned to each unit,
m, produced by a baseline candidate
• a is the aggregate number of items or units
produced by all baseline candidates using a particu-
lar relevant input, or the aggregate units of size or
capacity for all baseline candidates
• m is the rank of the unit produced with respect to
its assigned GHG emission rate (each unit should
have a distinct rank; assign ranks sequentially to
each unit with the same GHG emission rate)
c) Calculate the GHG emission rate corresponding to a
specific percentile (pc) between 0 and 100 by first
calculating its approximate rank, w :
w = (a . pc)
+ 0.5100
Once w has been calculated, let g be the integer part of
w, and f be the fraction part of w (e.g., if w =
10.375, then g = 10 and f = 0.375).
d) Calculate the emission rate (pe) of the chosen
percentile (pc) using the following equation:
pe = (1 – f ) xg + fx g+1
(Note: If the aggregate number of units produced, a,
is large, xg and xg+1 will rarely correspond to differ-
ent GHG emission rates. In practice, this means that
any given percentile is likely to correspond to the
GHG emission rate of a specific baseline candidate).
Where the Baseline Candidates Have Multiple Relevant Inputs
• Calculate pe for each type of relevant input (i.e.,
repeat the above four steps for each relevant input).
• Calculate the production-weighted average of the per-
centile GHG emission rates using the following formula:
Production-Weighted
Average Percentile
Where:
• ERi= pe (i.e., the GHG emission rate at percentile pc )
for relevant input i
• Qi = quantity of product or service produced from all
baseline candidates using relevant input i over a
certain time period, e.g. one year (same as a, above)
• n = total number of relevant inputs
9.4 Selecting an Appropriate Stringency Level for the Performance Standard
The final step in deriving a GHG performance standard
is to choose an appropriate stringency level. The GHG
performance standard is the GHG emission rate corre-
sponding to the appropriate stringency level.
An appropriate stringency level reasonably approximates
baseline emissions for the type of project activity under
consideration. What is reasonable depends on many
considerations and ultimately depends on program policy
decisions about additionality (see Chapter 3 and Box
9.2). Generally, an appropriate stringency level should
reflect a performance rate that is better (lower-emitting
or higher-removing) than the (weighted) mean GHG emis-
sion rate, taking into account trends in such factors as:
• regulatory requirements,
• recent and planned investments,
• technology penetration,
• policies or practices, and
• management regimes.
Note that for some technologies, a “best practice” or
“best candidate” stringency level may be most
i=1
n
i=1
n
(ERi. Qi )
Qi
=
=
jpText_FINAL.qxd 11/22/05 3:50 PM Page 69

Estimating Baseline Emissions—Performance Standard Procedure
C H A P T E R 970
GU
ID
AN
CE
Consider a set of five baseline candidates representing different power plants, which all use the same fuel and had the following produc-tion levels and GHG emissions over the past year:
Baseline Candidates 1 2 3 4 5
Production (kWh) 2,500 1,000 5,000 10,000 4,000
GHG emission rate (kg C/kWh) 0.300 0.227 0.217 0.330 0.317
The most stringent stringency level is equal to the lowest GHG emission rate among the baseline candidates: 0.217 kg C/kWh.
The production-weighted mean GHG emission rate is calculated as:
(2,500 . 0.300) + (1,000 . 0.227) + (5,000 . 0.217) + (10,000 . 0.330) + (4,000 . 0.317)
(2,500 + 1,000 + 5,000 + 10,000 + 4,000)
The median (50th percentile), 25th, and 10th percentile emission rates are calculated as follows:• First, assign each kilowatt-hour produced by each power plant the emission rate of the power plant that produced it. For example, each
kilowatt-hour produced by Baseline Candidate 1 would be assigned an emission rate of 0.300 kg C/kWh.
• Next, sort every kilowatt-hour by its emission rate from lowest to highest:
Rank, m, for each kWh 1–5,000 5,001–6,000 6,001–8,500 8,501–12,500 12,501–22,500
Assigned GHG emission rate, xm 0.217 0.227 0.300 0.317 0.330
• To determine the median (50th percentile) GHG emission rate:
w =(22,500 . 50)
+ 0.5 w = 11,250.5100
Therefore, g = 11,250 and f = 0.5
pe = (1 – 0.5) . 0.317 + 0.5 . 0.317 = 0.317 kg C/kWh
• To determine the 25th percentile GHG emission rate:
w =(22,500 . 25)
+ 0.5 w = 5,625.5100
Therefore, g = 5,625 and f = 0.5
pe = (1 – 0.5) . 0.227 + 0.5 . 0.227 = 0.227 kg C/kWh
B O X 9 . 1 Sample calculation of specific percentiles
= 0.295 kg C/kWh
• To determine the 10th percentile GHG emission rate:
w =(22,500 . 10)
+ 0.5 w = 2,250.5100
Therefore, g = 2,250 and f = 0.5
pe = (1 – 0.5) . 0.217 + 0.5 . 0.217 = 0.217 kg C/kWh
jpText_FINAL.qxd 11/22/05 3:50 PM Page 70

appropriate. This is generally the case where lower
GHG emissions correlate with better economic perform-
ance and fewer implementation barriers (e.g., absent
technical barriers and differences in capital costs, the
most attractive boiler investments may also tend to be
the most efficient in terms of fuel use and, therefore, the
lowest emitting). Less demanding stringency levels may
be appropriate where the best-performing candidates
have higher costs or greater barriers to practical imple-
mentation (e.g., many types of end-use energy efficiency
project activities), or where the baseline candidates
represent planned rather than existing technologies.
Project developers should keep all of these considera-
tions in mind when using the performance standard
procedure. They should also carefully apply the princi-
ples of transparency, conservativeness, completeness,
and relevance in deriving a performance standard.
9.5 Estimating Baseline EmissionsOnce a performance standard is derived, calculating
baseline emissions is, in most cases, simply a matter
of multiplying project activity production levels by the
performance standard GHG emission rate (for produc-
tion-based performance standards), or project activity
size or capacity and length of time by the performance
standard GHG emission rate (for time-based perform-
ance standards). Exceptions to this will occur only where
it is believed that baseline production levels would differ
from project activity production levels (see the discussion
in Chapter 2, section 2.13 on equivalence).
C H A P T E R 9 : Estimating Baseline Emissions— Performance Standard Procedure
71G
UI
DA
NC
E
The final selection of the stringency level for the performancestandard is implicitly linked to considerations about additional-ity. The objective is to ensure that GHG reductions acrossmultiple project activities are “additional” in aggregate, ratherthan to try to determine the additionality of any individual proj-ect. However, there is no “technically correct” stringency level fora performance standard. For GHG programs, part of the selectionof a stringency level involves balancing the overall additionalityof registered GHG reductions with program participation. Highstringency levels tend to reduce the incidence of non-additionalGHG reductions receiving credit, but at the same time may elim-inate many projects from consideration, some of which mighthave been additional. Policy objectives will thus play a role insetting a performance standard.
Furthermore, in some instances GHG programs may decide that aperformance standard by itself is insufficient to guarantee thelevel of environmental integrity they wish to achieve. Under somecircumstances, even a very stringent performance standard mightin practice allow more non-additional GHG reductions to be regis-tered than additional GHG reductions. In some cases, therefore,performance standards may be combined with additionality teststo ensure that only project activities that are likely to be additionalare considered for crediting. Such tests often take the form ofbasic eligibility criteria. Examples include:
• Making eligible only project activities that are not required by law.
• Making eligible only technologies of a certain type or subtype(e.g., those with low market penetration).
• Making eligible only project activities of a certain size.
• Making eligible only project activities that are explicitlydesigned to overcome certain barriers.
Finally, some GHG programs may decide to use a high stringencylevel to determine which projects are eligible for credit, and thena lower stringency level for calculating baseline emissions.
B O X 9 . 2 Performance standards, additionality,and GHG programs
Hisham Zerriffi, Program on Energy and Sustainable Development
jpText_FINAL.qxd 11/22/05 3:50 PM Page 71

Monitoring and Quantifying GHG Reductions
PA R T I I72
10
his chapter provides requirements and guidance for monitoring GHG emissions related to each
project activity’s primary and secondary effects, and any parameters related to baseline emis-
sions estimates. It also contains requirements and guidance for quantifying GHG reductions.T
Courtesy of Holcim Cement
jpText_FINAL.qxd 11/22/05 3:50 PM Page 72

CHAPTER 10: Monitoring and Quantifying GHG Reductions 73R
EQ
UI
RE
ME
NT
S
Requirements
10.1 Create a plan for monitoring GHG emissions and baseline parametersrelated to each project activity’s GHG effects.
The monitoring plan shall contain provisions for:
• monitoring GHG emissions from all GHG sources and
sinks related to primary and significant secondary
effects within the GHG assessment boundary;
• monitoring any data related to assumptions underlying
baseline emission estimates (i.e, baseline parameters);
and
• describing data storage and quality assurance/quality
control (QA/QC) measures.
1 0 . 1 . 1 MONITOR PROJECT ACTIVITY EMISSIONS For each GHG source or sink related to a primary or
significant secondary effect, the following shall be
described in the monitoring plan:
• The data that will be monitored relating to GHG emissions.
• Whether the data are measured, modelled, calculated,
or estimated; the level of uncertainty in any measure-
ments or estimates; and how this uncertainty will be
accounted for.
• Where relevant, the project activity operating condi-
tions during periods when data are monitored.
• All measurement or other data collection methods
used. Include all relevant assumptions, constants,
mathematical relationships, and formulas.
• Technical information related to the collection of
measurement data.
• For technology-based projects this includes such infor-
mation as the location and specifications of meters;
procedures for meter reading, calibration, and main-
tenance; the length of measurement periods, etc.
• For practice-based projects, this includes a descrip-
tion of equipment and methods used to gather data,
control sites (if any), procedures for calibrating and
maintaining equipment, etc.
• The frequency of monitoring activities.
• All sources of data and information.
Justify any instances where GHG emissions associated
with a secondary effect are too costly to monitor and
must therefore be estimated.
10.1.2 MONITOR BASELINE PARAMETERSAll baseline parameters shall be described in the moni-
toring plan, including:
• What data will be monitored and how they relate to
baseline emission estimates for the primary and
secondary effects.
• Whether the data are measured, modelled, calculated,
or estimated; the level of uncertainty in any measure-
ments or estimates; and how this uncertainty will be
accounted for.
• All measurement or other data collection methods
used. Include all relevant assumptions, constants,
mathematical relationships, and formulas.
• Technical information related to the collection of
measurement data.
• The frequency of monitoring activities.
• All sources of data and information.
1 0 . 1 . 3 D E S C R I B E Q A / Q C M E A S U R E SHow the GHG project data will be maintained and how
QA/QC measures will be implemented shall be described in
the monitoring plan and include the following information:
• Entity(ies) or person(s) responsible for measurement
and data collection procedures.
• Length of time the data will be archived.
• Data transmission, storage, and backup procedures
and strategies for identifying and managing lost or
poor-quality data.
• All QA/QC procedures for measurement, calculation, and
data collection procedures.
jpText_FINAL.qxd 11/22/05 3:50 PM Page 73

10.2 Quantify GHG reductions for the GHG project.
GHG reductions shall be quantified using the
following steps.
1 0 . 2 . 1 I D E N T I F Y T H E T I M E P E R I O D O V E R W H I C H G H G R E D U C T I O N S W I L L B E Q U A N T I F I E D .
• For each project activity and primary effect, identify
and justify the valid time length for the corresponding
baseline scenario or performance standard.
• Quantify GHG reductions for a period of time no longer
than the shortest valid time length identified.
1 0 . 2 . 2 U S I N G M O N I T O R E D D AT A , Q U A N T I F Y T H E G H G R E D U C T I O N S F O R T H E G H G P R O J E C T O N A P E R I O D I C B A S I S —E . G . , A N N U A L LY.
• Quantify the project’s GHG reductions as the sum of
all primary effects and significant secondary effects
for all project activities.
• Document the calculation methods used to quantify
GHG reductions and any uncertainties associated with
estimates of each project activity’s GHG emissions.
Guidance
10.1 Creating a Monitoring PlanMonitoring is the process of collecting the data used to
quantify GHG reductions and to validate assumptions
underlying the quantification. A monitoring plan is a
working document that describes procedures for collect-
ing data on project activity emissions, for collecting data
related to baseline emission estimates, and for ensuring
and controlling the quality of the collected data. The
monitoring plan should be updated whenever the
methodologies used to estimate, calculate, or measure
project activity or baseline emissions are changed. Such
changes should also be fully explained.
Every time GHG reductions are quantified and reported,
the project developer should check:
a) The accuracy, completeness, and consistency of all
monitored data.
b) The validity of any assumptions made during the proj-
ect development phase regarding baseline emissions
and project activity emissions. This requires analyzing
collected data to verify that:
• each project activity has been implemented and is
performing as expected; and
• any parameter values used to estimate the baseline
emissions continue to be valid.
Monitoring should always be conducted in a way that
allows a complete and transparent quantification of GHG
reductions. In general, project developers should follow
the GHG Accounting Principles (Chapter 4 and Box 10.1)
when designing a GHG project monitoring plan.
1 0.1.1 MONITORING PROJECT ACTIVITY EMISSIONSMonitoring GHG emissions (or removals) for the project
activity can be achieved through:
• direct measurements of GHG emissions (e.g., measur-
ing emissions from a smokestack); and
• indirect measurements of GHG emissions combined
with calculations (e.g., calculating GHG emissions
from fuel consumption data or calculating sequestered
carbon from measured tree diameters).
Monitoring and Quantifying GHG Reductions
74
RE
QU
IR
EM
EN
TS
CHAPTER 10
jpText_FINAL.qxd 11/22/05 3:50 PM Page 74

Both direct measurement and calculation-based
approaches are subject to uncertainties (see Box 10.2).
The relative accuracy of these approaches depends on the
instruments used, the quality of the data collected, and
the rigor of the quality control measures, as well as on
the assumptions underlying any calculations. All data
uncertainties should be fully described and explained,
and any calculation assumptions should also be
explained. Where uncertainty is significant, lower and
upper bounds or confidence intervals for all measure-
ments should be identified. The project developer should
be conservative and use data for quantification that
reflect uncertainties and that will tend to underestimate
GHG reductions.
The GHG sources or sinks that must be monitored can
vary by size, location, and type, and monitoring methods
can differ greatly in terms of cost. Choices will be
required about how much analytical effort and monitor-
ing resources to devote to each GHG source or sink.
These choices may involve tradeoffs among cost, accu-
racy, and uncertainty. Available monitoring methods and
their associated accuracies should be explained. If proj-
ect developers use a less accurate method for monitoring
a particular GHG source or sink, they should explain
why this method was chosen.
In some cases, changes in GHG emissions associated with
secondary effects may be small, even though they are
significant. They may in turn be costly to monitor. As a
general rule, the cost of monitoring should not exceed the
value of the GHG emissions being monitored. The value of
GHG emissions can be derived from a number of sources,
including prices for tradable GHG allowances or credits.
Where cost does exceed value, it may be prudent to esti-
mate rather than monitor the GHG emissions associated
with a secondary effect. All estimates of GHG emissions
associated with a secondary effect should be explained.
1 0 . 1 . 2 M O N I T O R I N G B A S E L I N E P A R A M E T E R SIn some cases, monitoring data indicative of baseline emis-
sions can aid the credibility of quantifying GHG reductions.
This will most often be the case where the project-specific
procedure was used. There are two basic types of baseline
parameters that can be monitored:
• Baseline parameters that indicate the continued validityof certain assumptions. For example, it may be neces-
sary to monitor changes in regulations that would affect
baseline emissions, or whether assumptions about the
barriers considered in the project-specific procedure are
still valid. If monitoring these parameters indicates that
a key baseline assumption is no longer valid, then the
CHAPTER 10: Monitoring and Quantifying GHG Reductions 75G
UI
DA
NC
E
Relevance: The levels of accuracy and uncertainty associatedwith monitoring methods should reflect the intended use of thedata and the objectives of the GHG project; some intended usesmay require more accuracy than others.
Completeness: All primary effects and all significant secondaryeffects should be monitored or estimated. All monitoring meth-ods and data collection procedures should be fully documented.
Consistency: Methods used to monitor, check, and store datashould be consistent over time to ensure comparability and verifiability.
Transparency: All monitoring methods, calculations, andassociated uncertainties should be explained. Monitoringmust be sufficient to allow the transparent quantification ofGHG reductions.
Accuracy: Measurements, estimates, and calculations shouldbe unbiased, and uncertainties reduced as far as practical.Calculations and measurements should be conducted in amanner that minimizes uncertainty.
Conservativeness: Where there are uncertainties in monitoreddata, the values used to quantify GHG reductions should err onthe side of underestimating GHG reductions.
B O X 1 0 . 1 Applying the GHG accounting principlesto monitoring
In general terms, uncertainties associated with GHG reductionscan be categorized into “scientific uncertainty” and “estimationuncertainty.” Scientific uncertainty arises when the science ofthe actual emissions and/or removal processes is not completelyunderstood. Estimation uncertainty arises any time GHG emis-sions are monitored and quantified, and can be further dividedinto “model uncertainty” and “parameter uncertainty.” Chapter7 of the Corporate Accounting Standard addresses these partic-ular types of uncertainty in further detail. In addition, an onlineuncertainty tool, available on the GHG Protocol Web site,provides useful information on uncertainty.
B O X 1 0 . 2 Understanding uncertainty
jpText_FINAL.qxd 11/22/05 3:50 PM Page 75

baseline scenario (or associated baseline emission esti-
mates) should be reconsidered.
• Baseline parameters that help determine baselineemission estimates. Some baseline parameters are
monitored to help calculate baseline emissions. For
example, baseline parameters may be monitored prior
to the implementation of a GHG project as a way to
calibrate baseline emission estimates. If baseline
emissions are estimated dynamically (see Chapter 2,
section 2.12), baseline parameters may include emis-
sion factors or other variables that directly determine
baseline emissions over time. For example, baseline
emissions may be determined by an annually updated
electricity GHG emission factor for project activities
that displace grid-connected power plants.
1 0 . 1 . 3 D E S C R I B I N G Q A / Q C M E A S U R E SQA/QC measures are necessary to ensure that data
related to GHG emissions are reliable. QA/QC measures
encompass a variety of activities, including site audits,
central data control, site technician reminders, and
maintaining service sheets. In general, QA/QC should
focus primarily on data collection activities, and second-
arily on data processing and storage. The credentials of
any parties responsible for monitoring should be docu-
mented. In addition, for data quality assurance:
• ensure data have been properly entered into data
templates, forms, or software; and
• assess calculation results to ensure data have been
properly processed.
Chapter 7 of the Corporate Accounting Standard
(on “Managing Inventory Quality”) provides additional
guidance that may be useful for QA/QC of monitored
GHG emissions data from project activities.
10.2 Quantifying GHG ReductionsThe final step in GHG project accounting is to quantify
GHG reductions. Both ex post quantification and the
ex ante estimation of GHG reductions can be performed
using the same basic procedures. An ex ante estimate
involves making predictions about the project activity’s
performance (and possibly how baseline emissions may
change). Ex post quantification of GHG reductions
uses actual monitored data once the GHG project has
been implemented.
1 0 . 2 . 1 I D E N T I F Y I N G T H E T I M E P E R I O D O V E R W H I C H G H G R E D U C T I O N S W I L L B E Q U A N T I F I E D
How long a baseline scenario or performance standard
should remain valid for the purpose of quantifying GHG
reductions will be subject to uncertainty (see Chapter 2,
section 2.11). It may help to consider the following ques-
tions in justifying a time length:
• How quickly are economic conditions changing?
• How quickly are changes occurring in the technologies
or practices providing the same product or service as
the project activity?
• At what point are the criteria and assumptions used
to identify the geographic area or temporal range for
baseline candidates likely to change?
• When might the barriers (or net benefits) faced
by the project activity or baseline candidates
change significantly?
• If the project activity involves a retrofit, when would
the retrofitted equipment have otherwise reached the
end of its useful lifetime?
• Are baseline emission estimates static or dynamic?
Given the uncertainties involved, there will seldom be a
single “right answer” to what the valid time length
should be; the conservativeness principle should guide
any justification. Alternatively, project developers may
wish to use a standard valid time length prescribed by an
existing GHG program (see Chapter 3 for a discussion of
the policy aspects of this decision).
Monitoring and Quantifying GHG Reductions
CHAPTER 1076
GU
ID
AN
CE
jpText_FINAL.qxd 11/22/05 3:50 PM Page 76

1 0 . 2 . 2 U S I N G T H E D AT A T O Q U A N T I F Y G H G R E D U C T I O N SThe following formulas should be used to quantify the GHG reductions for all GHG projects that involve changes in GHG
emissions as the primary effect:
• GHG Reductiony (t CO2eq) = z Project Activity Reductionzy
Where:
Project Activity Reductionzy = Primary Effectszy + Secondary Effectszy
Primary Effectszy = p [Baseline Emissionspzy – Project Activity Emissions pzy]
Baseline Emissionspzy = Baseline GHG emissions related to the primary effect, p, for each project
activity, z, in year y (in t CO2eq)
Project Activity Emissionspy z = GHG emissions related to primary effect, p, for each project
activity, z, in year y (in t CO2eq)
Secondary Effectszy = s [Baseline Emissionsszy – Project Activity Emissionsszy ]
Baseline Emissionsszy = Baseline GHG emissions related to the secondary effect, s, for each
project activity, z, in year y (in t CO2eq)
Project Activity Emissionsszy = GHG emissions related to secondary effect, s, for each project
activity, z, in year y (in t CO2eq)
CHAPTER 10: Monitoring and Quantifying GHG Reductions 77G
UI
DA
NC
E
jpText_FINAL.qxd 11/22/05 3:50 PM Page 77

The following formulas should be used to quantify the GHG reductions for all GHG projects involving biological GHG
storage or removals as the primary effect:
• GHG Reductiony (t CO2eq) = z Project Activity Reductionzy
Where:
Project Activity Reductionzy = Primary Effectzy + Secondary Effectszy
Primary Effectzy (t CO2eq) = Net Stockszy. 44
t CO2/t carbon12
Net Stockszy (t carbon) = p [Project Activity Carbon Stockspzy – Baseline Carbon Stockspzy]
Project Activity Carbon Stockspzy = k carbon stocks from each biological carbon pool,
k, related to each primary effect, p, for project activity, z, in year y (in t carbon)
Baseline Carbon Stockspzy = k baseline carbon stocks from each biological carbon pool,
k, related to each primary effect, p, for project activity, z, in year y (in t carbon)
Secondary Effectszy = Emissions Secondary Effectszy + Removals Secondary Effectszy
Emissions Secondary Effectszy = s [Baseline Emissionsszy – Project Activity Emissionsszy]
Baseline Emissionsszy = Baseline GHG emissions related to the secondary effect, s, for each
project activity, z, in year y (in t CO2eq)
Project Activity Emissionsszy = GHG emissions related to secondary effect, s, for each
project activity, z, in year y (in t CO2eq)
Removals Secondary Effectszy (t CO2eq) = Net Stockszy. 44
t CO2/t carbon12
Net Stockszy (t carbon) = s[Project Activity Carbon Stocksszy – Baseline Carbon Stocksszy]
Project Activity Carbon Stocksszy = k carbon stocks from each biological
carbon pool, k, related to each secondary effect, s, for project activity, z, in year y(in t carbon)
Baseline Carbon Stocksszy = k baseline carbon stocks from each biological
carbon pool, k, related to each secondary effect, s, for project activity, z, in year y(in t carbon)
Where GHG emission rates are used to quantify baseline and project activity emissions, use the following formulas:
• Project Activity Emissionsy = (Production Levely ) . (Project Activity Emission Ratey )
• Baseline Emissionsy = (Production Levely ) . (Baseline Emission Ratey )
Where:
Project Activity Emission Ratey = tonnes of CO2eq per unit of production in year y for the project activity
Baseline Emission Ratey = tonnes of CO2eq per unit of production in year y specified for the project activity’s
baseline scenario or performance standard
Production Levely = the amount produced in year y of the project activity’s product or service (as defined
in Chapter 7)
Monitoring and Quantifying GHG Reductions
CHAPTER 1078
GU
ID
AN
CE
jpText_FINAL.qxd 11/22/05 3:50 PM Page 78

CHAPTER 10: Monitoring and Quantifying GHG Reductions 79G
UI
DA
NC
E
Where measuring the production level is not possible, a
conservative estimate should be made. Unless there are
exceptional circumstances (see discussion of “Equiva-
lence” in Chapter 2, section 2.13), the production level
used to estimate baseline emissions should be equivalent
to the project activity’s actual production level.
NOTE: The formulas above use annual values for project
activity and baseline emissions as a default. Where there
is significant sub-annual variability in project activity and
baseline emissions, it may be more accurate to quantify
GHG reductions more frequently than on an annual basis.
jpText_FINAL.qxd 11/22/05 3:50 PM Page 79

Reporting GHG Reductions
PA R T I I80
11
his chapter presents a list of the information that must be compiled and reported to ensure
transparency and enable third-party reviewers to evaluate the quantification of GHG
reductions for a GHG project. These are minimum reporting requirements and may be
supplemented as necessary based on guidance contained in Chapters 5–10. Project developers
should retain all data, assumptions, criteria, assessments, and explanations used to support
reported information and should follow the principles of transparency and completeness in
reporting GHG reductions.
T
jpText_FINAL.qxd 11/22/05 3:50 PM Page 80

RequirementsProject developers shall report the following information.
11.1 Description of the GHG ProjectThe following information describing the GHG project
shall be reported:
• Name of the GHG project.
• Names and contact details of project developers,
including any significant intermediaries.
• Reason for quantifying the GHG reductions and
their anticipated use—e.g., internal company strat-
egy, meeting targets in a voluntary or mandatory
GHG program.
• Short description of the GHG project and of the prod-
ucts or services that its project activities will provide.
Where relevant, describe the type of technology
employed by the GHG project.
• If the GHG project is part of a larger initiative, a brief
summary of the overall initiative, including any other
GHG projects in this larger initiative.
• Geographic location. Indicate if the GHG project
involves activities or effects in more than one
political jurisdiction.
• Start date of the GHG project, and the date when GHG
reductions are first generated.
• Expected operational life of the GHG project.
• The valid time length of the baseline scenario or
performance standard for each project activity, and
its justification.
• General market and regulatory conditions for the
products or services provided by each project activity.
11. 2 The GHG Assessment BoundaryThe GHG assessment boundary shall be reported, including:
• Each project activity associated with the GHG project.
• The primary effect(s) resulting from each
project activity.
• All significant secondary effects resulting from each
project activity.
• Justifications for excluding any secondary effects and
why they are not significant.
11.3 Baseline Emissions for Each Project Activity and Primary Effect
The following shall be reported for each project activity
and primary effect.
1 1 . 3 . 1 A L L I D E N T I F I E D B A S E L I N E C A N D I D AT E SA list and description of identified baseline candidates
shall be reported, along with:
• The product or service provided by the project activity
and each baseline candidate.
• The rationale for the defined geographic area and
temporal range used to identify baseline candidates.
• Any other criteria used to identify the baseline candi-
dates.
• If the project-specific procedure is used to estimate
baseline emissions, an identification of which baseline
candidates represent common practice.
1 1 . 3 . 2 P R O J E C T- S P E C I F I C B A S E L I N E E M I S S I O N S E S T I M AT E
If the project-specific procedure is used to estimate base-
line emissions, the estimated baseline emission rate shall
be reported, along with:
• An explanation for why the project-specific procedure
was used to estimate baseline emissions.
• How baseline emissions were estimated, including all
necessary information to show the project-specific
procedure was carried out according to the require-
C H A P T E R 1 1 : Reporting GHG Reductions 81R
EQ
UI
RE
ME
NT
S
jpText_FINAL.qxd 11/22/05 3:50 PM Page 81

ments in Chapter 8. This shall include a description
and justification of the identified baseline scenario.
1 1 . 3 . 3 P E R F O R M A N C E S T A N D A R D B A S E L I N E E M I S S I O N S E S T I M AT E
If the performance standard procedure is used, the esti-
mated baseline emission rate shall be reported, including:
• An explanation for why the performance standard
procedure was used to estimate baseline emissions.
• How the baseline emissions were estimated, including
all necessary information to show the performance
standard procedure was carried out according to the
requirements in Chapter 9. This shall include:
• The GHG emission rates for different stringency
levels, including the most stringent level; the mean
GHG emission rate; the median GHG emission rate;
and at least two low-percentile GHG emission rates.
• The selected stringency level for the performance
standard, including a justification for why it
is appropriate.
11.4 Estimated GHG Reductions for the GHG Project
Before implementing a GHG project, project developers
shall report an estimate of annual and total GHG reduc-
tions expected to result from the GHG project over the
time period for which GHG reductions will be quantified
(see Chapter 10, section 10.2). They shall also report the
calculation methods used to estimate and quantify GHG
reductions and any uncertainties associated with the esti-
mates of each project activity’s GHG emissions.
11.5 Monitoring PlanHow all GHG sources or sinks within the GHG assess-
ment boundary will be monitored once the GHG project
is implemented shall be reported, including the following
elements of the monitoring plan:
• The procedures for collecting data necessary to deter-
mine actual GHG emissions or removals for each
project activity (and to evaluate whether assumptions
concerning the project activity remain valid), as well
as the frequency of monitoring related to each GHG
source or sink and an assessments of data collected,
e.g., reliability, etc.
• The procedures that will be followed to collect the
data necessary to estimate (and update assumptions
about) baseline emissions, as well as the frequency
of monitoring related to each GHG source or
sink and assessments of data associated with any
collected data.
• The data collection and storage system, including:
• Data report format, reporting frequency, and length
of time records are archived.
• Data transmission, storage, and backup procedures
and strategies for identifying and coping with lost or
poor-quality data.
• Entity (or entities) responsible for measurement and
data collection procedures.
• All QA/QC procedures to be implemented for measure-
ment and data collection procedures—e.g., site audits,
calibration, central data control, site technician
reminders, maintenance procedures, service sheets.
11.6 Annual Monitoring and GHG Reduction Quantification Reports
An annual monitoring and quantification report shall
be produced to confirm that the GHG project has been
implemented as planned and to update or revise any
assumptions. Any changes to the monitoring plan shall
also be reported. The report shall contain a quantifica-
tion of GHG reductions for the GHG project based on
actual monitored GHG emissions data.
Reporting GHG Reductions
C H A P T E R 1 182
RE
QU
IR
EM
EN
TS
jpText_FINAL.qxd 11/22/05 3:51 PM Page 82

GHG Project Accounting Examples
Part III
E X A M P L E 1 Cement Sector GHG Project Using the Project-Specific Baseline Procedure
E X A M P L E 2 Compressor Station Efficiency Improvement GHG ProjectUsing the Performance Standard Baseline Procedure
jpText_FINAL.qxd 11/22/05 3:51 PM Page 83

his case study illustrates the application of Part II
of the Project Protocol to a hypothetical GHG proj-
ect, using the project-specific procedure to estimate
baseline emissions. The numbering of the sections
in this example corresponds to the numbering of the chap-
ters in Part II of the Project Protocol. This case study is
intended to be illustrative in nature; additional details or
justifications may be needed for various sections for an
actual project. The square brackets found throughout the
text denote where additional explanations and justification
may be required for actual GHG projects.
The GHG project presented here involves the reduction
of GHG emissions associated with a cement manufac-
turing plant, owned by “Company X.” This project is
intended to reduce GHG emissions: (1) by reducing
process GHG emissions associated with cement clinker
production, and (2) by reducing GHG emissions associ-
ated with energy production and consumption.
Background and Overview of GHG Emissions from Cement ManufacturingPortland cement is manufactured by a complex process
of “burning” (pyro-processing) selected raw materials
and then fine-grinding the resulting clinker. The process
entails the conversion of a chemically designed and phys-
ically prepared raw material mixture into cement
clinker. In Company X’s facilities, this is done in a rotary
kiln through the controlled combustion of coal.
Figure E1.1 illustrates a typical cement manufacturing
process (dry process with rotary kiln), energy consump-
tion, and the types of GHG emissions generated in a
84
EX
AM
PL
ES
Cement Sector GHG Project Using the Project-Specific Baseline Procedure
T
1jpText_FINAL.qxd 11/22/05 3:51 PM Page 84

EXAMPLE 1 : Cement Sector GHG Project 85E
XA
MP
LE
S
Indirect GHG emissions associated with purchased
electricity or fuel consumption
F I G U R E E 1 . 1 Flow diagram of cement manufacturing process (dry process with rotary kiln), with energyconsumption points and types of GHG emissions generated in a cement facility
L E G E N D
➡
GHG emissions associatedwith purchased electricity or
fuel consumption
➡
Electricity/fuel used inconveyor or truck transport
Electricity/fuel used inconveyor or truck transport
Quarrying, mining of raw material
Mining and/or sourcing of fuel
GHG emissions associatedwith purchased electricity
Process CO2 emissions: CaCO3+heat = CO2+CaO
GHG emissions from heat consumption
GHG emissions associatedwith purchased electricity
GHG emissions associatedwith purchased electricity
GHG emissions associatedwith purchased electricity
GHG emissions associatedwith purchased electricity
Cement manufacturing process
Raw material, including fuelsourcing activity, generallylocated outside the plant site
Heat energy
Electrical energy
Transportation
GHG emissions
Equipment name
Process name
Bold Type
Regular Type
Raw millRaw material crushing,
grinding, mixing,homogenising, drying
Rotary kilnCalcination and pyro-
processing: Preheating,calcination, clinkering
Coal millCrushing, grinding,
drying
Clinker coolerClinker cooling
Cement millFine grinding of
clinker and blending
PackerPacking
➡
➡
➡
➡
➡➡
jpText_FINAL.qxd 11/22/05 3:51 PM Page 85

cement facility. The raw materials—consisting of lime-
stone, silica sand, clay, and other blending
materials—are quarried and transported by either
conveyor belt or truck, depending on the distance of raw
material sources to the plant. Clinker raw materials,
clay, limestone, and silica sand are crushed, ground, and
homogenized prior to calcination and pyro-processing.
Fuels, particularly those of solid form (coal or alterna-
tive fuels, such as waste tyres, municipal solid waste,
and biofuels) are also ground and dried. The ground raw
material is then preheated. The calcination of limestone
and pyro-processing takes place by burning the fuel and
preheated raw material at a very high temperature
(above 2,000˚C) in the rotary kiln to form clinker
nodules. The clinker nodules are cooled in the clinker
cooler. In the cement mill, clinker is fine-ground and
blended with additives to produce cement.
GHG emissions from cement manufacturing depend on
the fuel mix, energy consumption, plant technology, and
other variables, and are plant-specific. The two main
GHG emission sources are:
• Calcination/pyro-processing, which is generally the
largest source of GHG emissions. (CaCO3+ heat = >
CaO+CO2). The GHG emissions from this source are
categorized as industrial process emissions, which can
generate 50 percent or more of total cement manufac-
turing GHG emissions (OECD/IEA 2000).
• Fuel burning in pyro-processing, which requires
flame temperatures above 2,000˚C and large quanti-
ties of fuels. Depending on the raw materials and the
actual production process, a cement plant consumes
fuel at a rate between 3,200 and 5,500 megajoules
per tonne (MJ/t) of clinker.
GHG Project DescriptionThe information in this section is intended to provide
context for the GHG project. Some of this information is
reported to meet the requirements in Chapter 11 of the
Project Protocol. Additional information should also be
reported when documenting and reporting an actual
GHG project (see Chapter 11).
Company X has three manufacturing facilities in
Indonesia producing ordinary Portland cement (OPC).
Each facility is equipped with a cement kiln. The facili-
ties are situated in different provinces on different
islands—one in Kalimantan and two in West Java (see
Figure E1.2).
Company X’s proposed GHG project consists of two proj-
ect activities:
• Project Activity 1: Reducing clinker content incement production by increasing material additives.Currently, Company X produces OPC clinker with a
clinker-to-cement ratio of 95 percent. Company X
proposes to manufacture blended cement, which uses
increased proportions of limestone and pozzolan addi-
tives in the fine-grinding process. The result is cement
with a lower clinker fraction (81 percent) with a
Cement Sector GHG Project
86
EX
AM
PL
ES
X 1 – W E S T J AVA
X 3 – K A L I M A N T A N
F I G U R E E 1 . 2 Location of Company X’s cement manufacturing facilities
X 2 – W E S T J AVA
jpText_FINAL.qxd 11/22/05 3:51 PM Page 86

strength comparable to that of OPC. Lowering the
clinker-to-cement ratio reduces both process emissions
and associated fuel-related GHG emissions.
The pozzolanic additives used include coal fly ash and
volcanic ash (trass). The use of these materials will
require investment in new equipment to improve clinker
quality. With its existing equipment, Company X can
only slightly reduce its clinker-to-cement ratio (from
95 percent to 91 percent).
• Project Activity 2: Switching fuels from coal tobiofuels (palm kernel and rice husk) in kiln burning.All of Company X’s cement kilns use coal as fuel for
clinker burning. Company X intends to replace a
portion of the coal with biofuels found near its plants,
and consequently to reduce GHG emissions.
Chapter 5: Defining the GHG Assessment Boundary
5 . 1 I D E N T I F Y I N G P R O J E C T A C T I V I T I E SThis GHG project consists of two project activities—
reducing clinker content and switching fuels.
5 . 2 & 5 . 3 I D E N T I F Y I N G P R I M A R Y E F F E C T S A N D C O N S I D E R I N G A L L S E C O N D A R Y E F F E C T S
The primary effects and possible secondary effects asso-
ciated with each project activity are listed below in
section 5.4 & 5.5 along with an estimation of their
magnitude and assessment of significance for the second-
ary effects. [For many GHG projects it will make sense
to list these separately.]
5 . 4 & 5 . 5 E S T I M AT I N G T H E R E L AT I V E M A G N I T U D E A N D A S S E S S I N G T H E S I G N I F I C A N C E O F S E C O N D A R Y E F F E C T S
Project Activity 1: Reducing Clinker ContentThis project activity reduces GHG emissions in two ways,
both of which are related to the reduced amount of
clinker required to produce cement. The activity there-
fore has two primary effects:
• Reduction in industrial process emissions from the
calcination process.
• Reduction in combustion emissions from generating
energy for pyro-processing.
EXAMPLE 1 : Cement Sector GHG Project 87E
XA
MP
LE
S
jpText_FINAL.qxd 11/22/05 3:51 PM Page 87

Possible secondary effects and their magnitude and
significance include:
• Reduction in combustion emissions from reduced elec-
tricity use during the clinker production process (e.g.,
in the operation of the rotary kiln, raw material grind-
ing, and fuel preparation). This positive secondary
effect is smaller than the two primary effects. In the
interest of being conservative, it will not be included in
the GHG assessment boundary.
• Reduction in combustion emissions from the reduced
transport and preparation of raw materials. This posi-
tive secondary effect is expected to be small. As a
conservative measure, it will be excluded from the
GHG assessment boundary.
• Increased combustion emissions from the transporta-
tion of additives (e.g., fly ash and trass) to the plant
site. The increase in GHG emissions is expected to be
small compared to the primary effects (less than one
percent). Because this secondary effect will be coun-
terbalanced by GHG reductions from the reduced
transport and preparation of the raw materials, it is
considered insignificant and will not be included in the
GHG assessment boundary.
• Increased combustion emissions from additional elec-
tricity required for the preparation of additive
materials. The increase in GHG emissions is expected
to be small compared to the primary effects (less
than half a percent). Because this secondary effect is
counterbalanced by the reduction in GHG emissions
from reduced electricity use in clinker production and
is not expected to change over time, it is considered
insignificant and will not be included in the GHG
assessment boundary.
• Possible increase in GHG emissions at other cement
companies, who also use fly ash and trass. This could
result from the decreased availability of these inputs
because of Company X’s GHG project (i.e., a market
response). A feasibility study on the availability of
Cement Sector GHG Project
88
EX
AM
PL
ES
jpText_FINAL.qxd 11/22/05 3:51 PM Page 88

additive materials suggests that these additive
materials are abundant. Thus, this market response
is considered insignificant.
Project Activity 2: Switching FuelsThis project activity is intended to reduce combustion
emissions by substituting coal with biofuels. Coal is used
to produce heat energy in the clinker kilns.
The project activity’s primary effect is the reduction
in combustion emissions from generating energy, due
to the switch from coal to biofuels. Possible secondary
effects include:
• Increased combustion emissions associated with the
transportation of biofuels.
• Reduced combustion emissions associated with the
transportation of coal.
• Reduced waste emissions due to less waste materials
being burned or anaerobically decomposing in land-
fills (the biofuel would have otherwise been disposed
of in landfills).
• Reduced combustion emissions from using less elec-
tricity for coal preparation.
• Possible increase in combustion emissions from gener-
ating energy caused by the reduced availability of
biofuels (i.e., a market response).
A preliminary estimation indicates that the reduced
GHG emissions associated with the second, third, and
fourth secondary effects listed above are greater than the
increased GHG emissions from the transportation of
biofuels (the first secondary effect). Although the effects
yield a further 4 percent reduction in GHG emissions for
this project activity, they have been excluded from the
GHG assessment boundary as a conservative measure.
Regarding the last secondary effect, other users of rice
husks and palm kernels may need to increase their
consumption of fossil fuels to generate energy, thereby
increasing GHG emissions. However, preliminary
research indicates that rice husks and palm kernel shells
are available in abundance. Based on current demand,
the supply of these materials is approximately 1.5 times
greater than the expected demand. Therefore, this
secondary effect is considered insignificant and is
excluded from the GHG assessment boundary.
Chapter 6: Selecting a Baseline ProcedureThe project-specific procedure was chosen to estimate
baseline emissions for both project activities. The proj-
ect-specific procedure was preferred over a performance
standard approach because of difficulties in obtaining
performance data on individual cement kilns in
Indonesia. Further, the total number of comparable
cement kilns in Indonesia is small, making it difficult to
develop a robust statistical performance standard.
Chapter 7: Identifying the Baseline Candidates
For the project-specific procedure, the baseline candi-
dates identified include representative types of plants,
technologies, or practices that produce the same product
or service as the project activities within a specified
geographic area and temporal range.
7 . 1 D E F I N I N G T H E P R O D U C T O R S E R V I C E P R O V I D E D B Y T H E P R O J E C T A C T I V I T Y
The primary characteristic of the baseline candidates is
that they must provide the same or similar products or
services as those provided by the two project activities.
• For Project Activity 1, the product is cement that is
equally as strong as OPC.
• For Project Activity 2, the product is heat energy for
kiln burning to create clinker.
7 . 2 I D E N T I F Y I N G P O S S I B L E T Y P E S O F B A S E L I N E C A N D I D AT E S
Project Activity 1: Reducing Clinker ContentTwo materials that can be used to replace clinker in
cement production are trass and fly ash. Trass is a fine,
sandy, volcanic ash that is abundant in volcanic regions
of the country. To avoid prohibitive transport costs,
trass deposits that are close to the plants are used. In
West Java, trass is found in Cianjur and Nagrek, and
in Tasikmalaya, which is near the X1 and X2 plants.
Trass is currently mostly used for small-scale, light
brick-making projects.
Fly ash is produced in large quantities in Indonesia as a
waste product of electricity generation from coal. Coal is
the preferred national energy generation source because of
EXAMPLE 1 : Cement Sector GHG Project 89E
XA
MP
LE
S
jpText_FINAL.qxd 11/22/05 3:51 PM Page 89

Indonesia’s large coal reserves. The Indonesian Hazardous
Waste Regulation (PP No. 18/1999) classifies fly ash
from power plants as hazardous waste, affecting the
availability of its beneficial use. Exemption to this classifi-
cation can be granted if fly ash successfully passes Toxic
Characteristic Leaching Procedure (TLCP) and Lethal
Dosis (LD) 50 tests.
Based on this information and the questions outlined in
Chapter 7, section 7.2 of the Project Protocol, the range
of technical options that could produce cement with
strength equal to that of OPC include:
• Production of current OPC cement with a clinker-to-
cement ratio of 95 percent.
• Production of OPC with a lower clinker-to-cement
ratio (e.g., 91 percent). Existing technologies allow an
increase of additives of up to 4 percent to produce this
type of OPC.
• Production of Portland Pozzolan Cement (PPC). PPC is
another type of cement with a lower clinker-to-cement
ratio than that of the OPC. However, the strength of
PPC develops more slowly than OPC and generates less
heat during the curing process. The additive used in
PPC is mainly trass.
• Production of OPC with new equipment to achieve an
81 percent clinker-to-cement ratio (as proposed for
project activity 1).
Project Activity 2: Switching FuelsA range of possible fuels could be used to provide energy
for producing clinker. These include:
• Coal.
• Natural gas.
• Industrial diesel oil.
• Non-renewable resources, such as waste tyres, waste
oil, and hazardous waste. However, continuous
streams of these resources are not found in Indonesia.
There is no regulation that requires the reuse or recy-
cling of hazardous waste, such as burning of
hazardous wastes in cement kilns. (Waste fuels may
also have negative side effects in terms of dioxin and
other pollutant emissions).
• Renewable energy fuels, such as biomass (which could
partly replace coal or other fuels, as proposed for
Project Activity 2).
7 . 3 D E F I N I N G T H E G E O G R A P H I C A R E A A N D T E M P O R A L R A N G E
7 . 3 . 1 D E F I N I N G T H E G E O G R A P H I C A R E A
Project Activity 1: Reducing Clinker ContentThe geographic area defined was Indonesia because:
• The principal market for cement produced by Company X
is Indonesia, and the cement produced must comply
with the national standard SNI 15-3500-1994.
• Company X’s facilities are located in different areas in
Indonesia: two plants are located in West Java within
one province, the other is located on Kalimantan in
South Kalimantan province.
Cement Sector GHG Project
90
EX
AM
PL
ES
jpText_FINAL.qxd 11/22/05 3:51 PM Page 90

• Cement manufacturing facilities need to be located
close to the source of demand. Cement produced in
Kalimantan mostly serves Kalimantan and Sulawesi
(the island next to Kalimantan) customers, while the
facilities in Java mostly serve customers in Java.
Project Activity 2: Switching Fuels The geographic area defined was Indonesia because:
• Only dry-process kilns are currently operating in
Indonesia. In a larger geographic area (e.g., Southeast
Asia), different types of kilns are operating. For exam-
ple, in the Philippines, dry-process cement kilns make
up about 51 percent of overall capacity, while the rest
is wet-process cement kilns (Mohanty 1997).
• All fuel is obtained domestically, and fuel prices for
each type of fuel are uniform within the country.
Different fuel prices in different countries in the
Southeast Asia regions make a larger regional
geographic area inappropriate.
• Some cement companies in Indonesia have manufac-
turing facilities in different provinces, including
Company X. This makes the smaller provincial level
inappropriate because the sourcing of fuel may differ
from one province to another.
7 . 3 . 2 D E F I N I N G T H E T E M P O R A L R A N G E
Project Activity 1: Reducing Clinker ContentThe temporal range chosen was from 1997 to the pres-
ent. The beginning of this time period coincides with the
Asian economic crisis, providing a discrete break point
where cement technology changed. A majority of the wet
kilns were shut down at this point, and when the market
recovered, a number of new dry kiln plants were
constructed to meet the growing demand.
Project Activity 2: Switching FuelsThe temporal range chosen was from 1997 to the pres-
ent, for reasons similar to those for Project Activity 1.
Cuts in fuel subsidies have been imposed as part of the
IMF Financial Package granted to Indonesia to support
recovery from the Asian economic crisis in 1997. This
measure was expected to raise general energy efficiency
awareness and bring about fuel switching to renewable
energy. However, reducing fuel subsidies is unpopular,
and in the past has caused civil unrest, so the fuel subsi-
dies still exist.
7 . 4 D E F I N I N G O T H E R C R I T E R I A U S E D T O I D E N T I F Y B A S E L I N E C A N D I D AT E S
Project Activity 1: Reducing Clinker ContentBlended cement is classified under the Indonesian standard
SNI 15-3500-1994 (Semen Campur). Following this stan-
dard, blended cement may contain various additives
(artificial and natural trass, limestone, and others) at
unspecified proportions. Therefore, legal requirements are
not relevant, and no other criteria were identified.
Project Activity 2: Switching FuelsIndonesia has no stated legal requirements with respect
to fuels used in clinker burning, and no other criteria
were identified to define baseline candidates.
7 . 5 I D E N T I F Y I N G T H E F I N A L L I S T O F B A S E L I N E C A N D I D AT E S
Based on the necessary characteristics and the defined
geographic area and temporal range, the final list of base-
line candidates for each project activity is as follows.
Project Activity 1: Reducing Clinker Content• Baseline Candidate 1: Continuation of current activi-
ties—production of OPC with a clinker-to-cement ratio
of 95 percent. This candidate also reflects the average
Indonesian clinker-to-cement ratio content.
• Baseline Candidate 2: Production of OPC with a lower
clinker-to-cement ratio (91 percent). International and
Indonesian cement standards allow OPC to be
produced with additive materials in addition to
gypsum. Company X can produce OPC with a clinker-
to-cement ratio of 91 percent without significant
additional equipment or other investment. This base-
line candidate is considered to be a “safe” business
measure where investment risks are negligible.
• Baseline Candidate 3: Production of OPC with new
equipment to achieve an 81 percent clinker-to-cement
ratio. This baseline candidate is identical to Project
Activity 1, and so will be referred to as Project
Activity 1 in the rest of the example.
The production of PPC is eliminated from the list of
baseline candidates because it does not provide similar
types of product characteristics. Although the final
strength is comparable to that of OPC (420 kg/cm2), the
strength of PPC develops more slowly than that of OPC
and generates less heat during the curing process.
EXAMPLE 1 : Cement Sector GHG Project 91E
XA
MP
LE
S
jpText_FINAL.qxd 11/22/05 3:51 PM Page 91

Project Activity 2: Switching Fuels• Baseline Candidate 1: Continuation of current activi-
ties—using coal as the primary fuel for clinker
burning. Coal is readily available and is the cheapest
fuel for clinker burning.
• Baseline Candidate 2: Replacement of coal with natural
gas. Natural gas is available, and Company X’s
manufacturing facility is equipped with a gas pipeline
and gas burner. Prior to 1997, some kilns belonging to
Company X used natural gas for clinker burning, as
the cost was comparable to the cost of coal. Since the
economic downturn in 1997, however, the natural gas
price has been about 25 percent higher than that of coal.
• Baseline Candidate 3: Replacement of coal with fuel
oil. Oil (diesel oil or fuel oil) supply is available for
continuous use. Almost all kilns in the Indonesian
cement industry are equipped with oil burners. The
price of fuel oil is about twice that of coal.
• Baseline Candidate 4: Replacement of coal with
renewable energy fuels, such as biomass. This base-
line candidate is identical to Project Activity 2, and
so will be referred to as Project Activity 2 in the rest
of the example.
Replacement of coal with such non-renewable resources
as waste tyres, waste oil, and hazardous waste is elimi-
nated as a baseline candidate, since a continuous stream
of these sources is not available in Indonesia.
7 . 6 I D E N T I F Y I N G B A S E L I N E C A N D I D AT E S T H AT R E P R E S E N T C O M M O N P R A C T I C E
Project Activity 1: Reducing Clinker ContentAll cement manufacturing in Indonesia uses a dry process
(i.e., rotary kilns and pre-heaters). There is no significant
difference in the production systems from one cement
company to another. The cement used in Indonesia is
dominated by high-quality OPC with a 28-day strength of
about 420 kg/cm2. Current practice focuses on the produc-
tion of OPC with a clinker-to-cement ratio of 95 percent.
The market share of OPC in Indonesia is about 82 percent,
whereas the market share of the PPC and masonry cement
accounts for about 18 percent (see Table E1.1).
Table E1.1 indicates that the production of OPC (95
percent clinker-to-cement ratio) is common practice.
In 1996 Company X introduced blended cement “R.”
Production was discontinued in 1998 due to lack of
acceptance by the market. The blended cement “R”
was of a slightly lower quality than OPC, and many
customers were not satisfied with its performance.
Since then, no other cement companies have attempted
to produce blended cement.
Project Activity 2: Switching FuelsClinker burning in Indonesia is based almost entirely on
coal. Coal is locally available in abundance at a competi-
tive price. There is no significant difference in the
production systems or fuel usage from one cement
company to another. Coal is identified as the common
practice fuel.
Chapter 8: Estimating Baseline Emissions—Project-Specific Procedure
The project-specific procedure estimates baseline emis-
sions by identifying a baseline scenario for each project
activity. The list of possible alternatives for each project
activity—the baseline candidates—is evaluated using a
comparative assessment of barriers.
This GHG project consists of two project activities with
a total of three primary effects and the baseline scenar-
ios for these primary effects are interrelated. Project
Cement Sector GHG Project
92
EX
AM
PL
ES
T A B L E E 1 . 1 Indonesian market share for different types of cement (percent)
T Y P E O F C E M E N T
OPC
PPC + Masonry
Blended
1 9 9 9
74.8
25.2
0
2 0 0 0
77.2
22.8
0
2 0 0 1
77.7
22.3
0
2 0 0 2
81.9
18.1
0
Source: Indonesia Cement Association, 2002 and laboratory tests on OPC cement from each cement manufacturing plant where published data were unavailable.
jpText_FINAL.qxd 11/22/05 3:51 PM Page 92

Activity 1 has two primary effects: (1) reduction in
industrial process emissions resulting from reduced
clinker in the calcination process, and (2) reduction
in combustion emissions from generating energy for
pyro- processing resulting from reduced clinker in the
calcination process. The baseline scenario identified
for Project Activity 1 will be used to estimate baseline
emissions for all primary effects. Baseline emissions
for the second primary effect will also depend on the
type of fuel used to produce heat energy, which is deter-
mined by the baseline scenario for Project Activity 2.
Finally, baseline emissions for Primary Effect 3 will in
part depend on the clinker content of cement.
In sum, two baseline scenarios are identified for the GHG
project, and these are used in combination to estimate the
baseline emissions for the three primary effects (see Figure
E1.3 and descriptions in Table E1.2).
The remainder of this section is organised so that all
the information pertaining to the two project activities
is kept together.
8 . 1 A P E R F O R M I N G A C O M P A R AT I V E A S S E S S M E N T O F B A R R I E R S :Project Activity 1—Reducing Clinker Content
The possible alternatives for the baseline
scenario include:
• Implementation of the same technologies as those
involved in Project Activity 1 (i.e., 81 percent
clinker content).
• Baseline Candidate 1: Continuation of current activi-
ties (i.e., continued production of OPC cement with a
clinker-to-cement ratio of 95 percent).
• Baseline Candidate 2: Production of OPC with a lower
clinker-to-cement ratio (91 percent).
EXAMPLE 1 : Cement Sector GHG Project 93E
XA
MP
LE
S
T A B L E E 1 . 2 How baseline emission estimates are derived
P R I M A RY E F F E C T
Project Activity 1: Reductionin process emissions
Project Activity 1: Reduction in combustion emissions fromgenerating energy
Project Activity 2: Reductionin combustion emissions fromgenerating energy
B ASELINE SCENARIO ANALYSIS USED
Clinker composition used in cement production
a) Clinker composition used in cement production (which determines the amount of heat required); and
b) Type of fuel used to produce heat energy
Type of fuel used to produce heat energy
E S T I M AT E O F B A S E L I N E E M I S S I O N S
Baseline emissions derived from the percentage ofclinker used in cement production
Combustion emissions derived from the amount ofheat required to produce the clinker and an emis-sion factor for the type of fuel used to produce heat
Combustion emissions derived from the amount ofheat required to produce the clinker* and an emis-sion factor for the type of fuel used to produce heat
*For the baseline emissions of Primary Effect 3, the clinker composition is assumed to be 81 percent, premised on the implementation of Project Activity 1. See the Monitoring and Quantification analysis (related to Chapter 10, below) for a full description of how baselineemissions and GHG reductions are estimated and quantified.
F I G U R E E 1 . 3 How baseline emissions for eachprimary effect are derived from theproject activity baseline scenarios
For Project Activity 1
B A S E L I N E S C E N A R I O B A S E L I N E E M I S S I O N S
Primary Effects 1 and 2 are the primary effects associated with Project Activity 1. Primary Effect 3 is the primary effect associated with Project Activity 2.
For Primary Effect 1
For Primary Effect 2
For Primary Effect 3For Project Activity 2
For Project Activity 1
jpText_FINAL.qxd 11/22/05 3:51 PM Page 93

8 . 1 A . 1 I D E N T I F Y I N G B A R R I E R S T O T H E P R O J E C T
A C T I V I T Y A N D B A S E L I N E C A N D I D AT E S
Based on the barrier categories in Table 8.1 (in Chapter 8 of
the Project Protocol), the following barriers were identified:
Financial and Budgetary BarriersThere are two types of barriers in this category: invest-
ment risk and high cost.
Investment Risk: Country risk and uncertain economic
growth will hinder investment in any industrial sector,
including the cement industry. Five years after the 1997
economic crisis, Indonesia began to experience a slow
economic recovery. Some economic indicators, such as
export and import shares, show signs of improvement.
The country’s position in terms of international compet-
itiveness, legal certainty, and general level of risk for
investment remains unfavourable for foreign investors.
The 2002 World Investment Report by the United
Nations Conference on Trade and Development
(UNCTAD) ranked Indonesia 138 out of 146 countries
surveyed for Foreign Direct Investment (FDI) perform-
ance between 1998 and 2000. Moreover, between 1998
and 2000 Indonesia's FDI index value was -0.6, mean-
ing that Indonesia did not have a favourable investment
environment. The situation is exacerbated by safety
concerns associated with terrorist attacks to several
businesses and continuing conflicts in some regions,
such as in Aceh and Papua. The International Country
Risk Group considers Indonesia to be riskier for busi-
ness than its Asian neighbours.
As a consequence, financial institutions have set up loan
restrictions. This limitation is normally defined in terms of
a maximum cash amount available for loans. Since the
risk is directly linked to the duration of the loan, more
restrictive limitations are imposed on longer-term transac-
tions, such as loans to obtain the technology required to
produce blended cement. [This barrier can be substanti-
ated using financial analysis and notes from negotiations
with financial institutions.]
Poor investment conditions would not be a barrier if
Company X simply continued with its current activities
(Baseline Candidate 1) or pursued Baseline Candidate 2,
which requires no significant investment. Therefore, this
barrier only applies to Project Activity 1, which requires
significant new investment.
High Cost: Project Activity 1 will require extensive invest-
ment in new equipment and research and development.
New equipment investments are expected to cost approx-
imately $5 million (U.S.) and include:
• Improved quality control. Additional laboratory equip-
ment is needed, including x-ray fluorescence (XRF)
and x-ray diffraction (XRD) automatic samplers.
• Storage, handling, and proportioning equipment for
additive materials. Additional hoppers/storage facili-
ties, feeders, conveyors, limestone crushers, and
cement grinding equipment is needed.
• Increased cement grinding fineness. Air separators
are needed.
• Additional environmental controls. Pre-dedusting
systems are needed.
Research and development efforts are needed to determine
how the new and existing equipment can be used to
produce blended cement. Before blended cements can be
launched in the market, extensive testing is needed both
internally and externally. The research and development
for Project Activity 1 will require an investment of
approximately $3 million (U.S.). These tasks include:
• Trial production involving laboratory testing by
Company X to obtain indicative information on required
fineness, sulphite content, additive composition, etc.
• Full-scale trial production in selected mills.
• Laboratory testing and field testing of the new blended
cement by Company X. Additional testing by third
parties, such as universities and contractors, is also needed.
Baseline Candidate 1 (continuation of current activities)
would require no additional investment, and expenditures
associated with Baseline Candidate 2 would be minimal.
[Additional information may be required to demonstrate
that the expenditures for Baseline Candidate 2 would
be minimal.]
Technology Operation and Maintenance BarriersExisting technology and human resources at Company X
are inadequate to increase the quality of clinker and
improve quality assurance in producing blended cement.
New technology and training are needed (see above),
because Company X has no prior experience with these
Cement Sector GHG Project
94
EX
AM
PL
ES
jpText_FINAL.qxd 11/22/05 3:51 PM Page 94

technologies and they are not readily available in
Indonesia. Utilizing the technology will also require addi-
tional research and development efforts (see above).
This barrier affects Project Activity 1 and to a lesser
extent Baseline Candidate 2. Baseline Candidate 2 has
less complicated technology. Technology operation and
maintenance is not a barrier for Baseline Candidate 1.
Infrastructure and Market Structure Barriers No significant infrastructure or market structure barriers
affect Project Activity 1 or any of its baseline candidates.
Institutional, Social, and Cultural BarriersThe market share of OPC in Indonesia is about 82 percent,
whereas the market share of the PPC and masonry cement
accounts for 18 percent, and the share of blended cement
is 0 percent (see Table E1.1). A cement blend like that
proposed for Project Activity 1 (81 percent clinker-to-
cement ratio) may face difficulties competing with more
established cement products. Blended cement is (mistak-
enly) perceived to be of inferior quality in Indonesia. A
significant effort is needed to educate consumers regarding
new cement types with strength and characteristics compa-
rable to those of OPC. This perception is a barrier primarily
for Project Activity 1, where the significantly lower clinker-
to-cement ratio is likely to affect consumers’ perceptions
because it is significantly darker in colour than OPC. It will
not be a significant barrier for Baseline Candidates 1 or 2.
Resource Availability Barriers No significant resource availability barriers affect
Project Activity 1 or any of its baseline candidates. For
the project activity, additive materials are available in
abundant amounts.
8 . 1 A . 2 I D E N T I F Y I N G B A R R I E R S
T O T H E C O N T I N U AT I O N O F C U R R E N T A C T I V I T I E S
There are no barriers to the continuation of current
activities (Baseline Candidate 1), and no legal or market
shifts that would affect the continuation of current activi-
ties are expected.
8 . 1 A . 3 A S S E S S I N G T H E R E L AT I V E I M P O R T A N C E
O F T H E I D E N T I F I E D B A R R I E R S
The relative importance of barriers is assessed for each
baseline scenario alternative. Overall, the financial and
budgetary barriers are the most significant type of
barrier. Social and cultural barriers are of similar signif-
icance, although these only affect Project Activity 1 and
not the other alternatives. Technological barriers exist,
but are less important than the others.
Table E1.3 presents a matrix that shows a rough ranking
of the possible baseline scenario alternatives based on the
barriers they face. This indicates that the alternative with
the lowest barriers is Baseline Candidate 1, which is the
continuation of current activities. Baseline Candidate 2,
however, faces low barriers and cannot be excluded from
consideration as the baseline scenario.
8 . 2 A I D E N T I F Y I N G T H E B A S E L I N E S C E N A R I O : Project Activity 1—Reducing Clinker Content
8 . 2 A . 1 E X P L A I N I N G B A R R I E R S T O T H E P R O J E C T A C T I V I T Y
A N D H O W T H E Y W I L L B E O V E R C O M E
Below are short descriptions of how Company X will
overcome the barriers to Project Activity 1. [Additional
explanatory information may be required for an actual
GHG project.]
EXAMPLE 1 : Cement Sector GHG Project 95E
XA
MP
LE
S
jpText_FINAL.qxd 11/22/05 3:51 PM Page 95
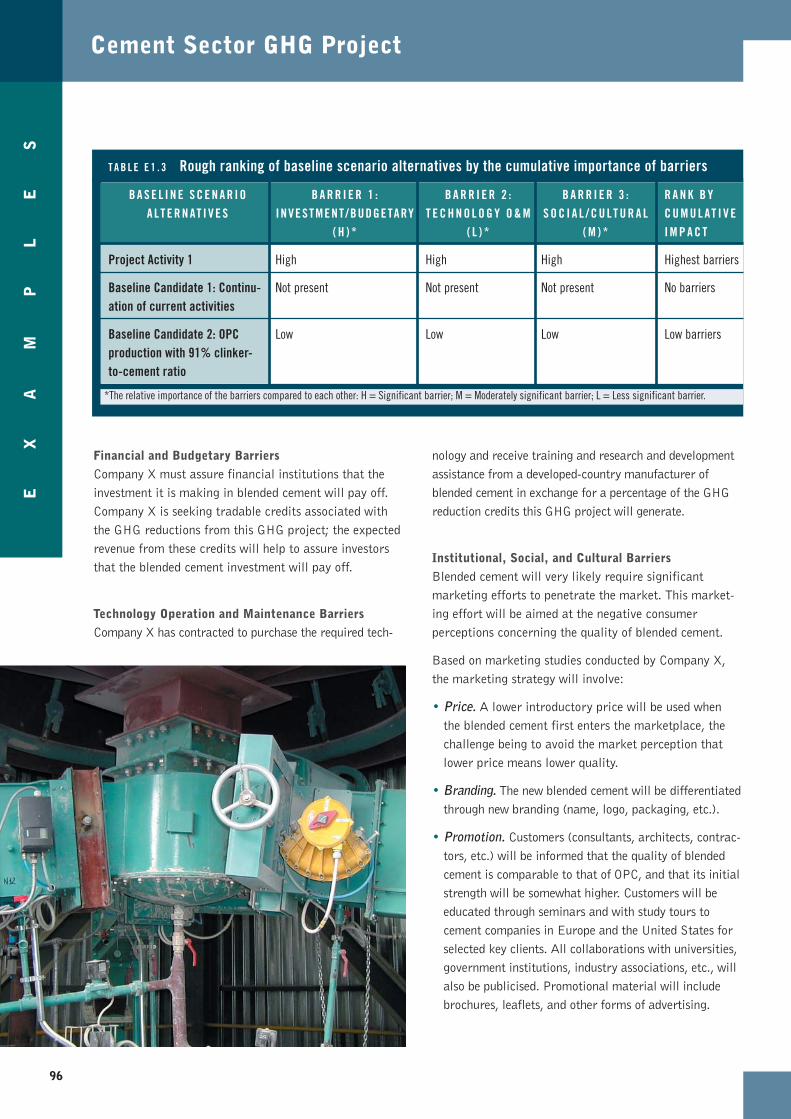
Financial and Budgetary BarriersCompany X must assure financial institutions that the
investment it is making in blended cement will pay off.
Company X is seeking tradable credits associated with
the GHG reductions from this GHG project; the expected
revenue from these credits will help to assure investors
that the blended cement investment will pay off.
Technology Operation and Maintenance BarriersCompany X has contracted to purchase the required tech-
nology and receive training and research and development
assistance from a developed-country manufacturer of
blended cement in exchange for a percentage of the GHG
reduction credits this GHG project will generate.
Institutional, Social, and Cultural BarriersBlended cement will very likely require significant
marketing efforts to penetrate the market. This market-
ing effort will be aimed at the negative consumer
perceptions concerning the quality of blended cement.
Based on marketing studies conducted by Company X,
the marketing strategy will involve:
• Price. A lower introductory price will be used when
the blended cement first enters the marketplace, the
challenge being to avoid the market perception that
lower price means lower quality.
• Branding. The new blended cement will be differentiated
through new branding (name, logo, packaging, etc.).
• Promotion. Customers (consultants, architects, contrac-
tors, etc.) will be informed that the quality of blended
cement is comparable to that of OPC, and that its initial
strength will be somewhat higher. Customers will be
educated through seminars and with study tours to
cement companies in Europe and the United States for
selected key clients. All collaborations with universities,
government institutions, industry associations, etc., will
also be publicised. Promotional material will include
brochures, leaflets, and other forms of advertising.
Cement Sector GHG ProjectE
XA
MP
LE
S
T A B L E E 1 . 3 Rough ranking of baseline scenario alternatives by the cumulative importance of barriers
B A S E L I N E S C E N A R I OA LT E R N AT I V E S
Project Activity 1
Baseline Candidate 1: Continu-ation of current activities
Baseline Candidate 2: OPCproduction with 91% clinker-to-cement ratio
B A R R I E R 1 :INVESTMENT/BUDGETARY
( H ) *
High
Not present
Low
B A R R I E R 2 :T E C H N O L O G Y O & M
( L ) *
High
Not present
Low
B A R R I E R 3 :S O C I A L / C U L T U R A L
( M ) *
High
Not present
Low
R A N K B YC U M U L AT I V EI M P A C T
Highest barriers
No barriers
Low barriers
*The relative importance of the barriers compared to each other: H = Significant barrier; M = Moderately significant barrier; L = Less significant barrier.
96
jpText_FINAL.qxd 11/22/05 3:51 PM Page 96

8 . 2 A . 2 I D E N T I F Y I N G T H E B A S E L I N E S C E N A R I O U S I N G
T H E C O M P A R AT I V E A S S E S S M E N T O F B A R R I E R S
The summary of the comparative assessment of barriers
in Table E1.3 suggests that identifying the baseline
scenario conclusively from this assessment is not possi-
ble. For both Baseline Candidates 1 and 2, barriers are
either nonexistent or are low enough that they could be
easily overcome. Therefore, neither possibility can be
excluded from consideration as the baseline scenario.
Table E1.4 summarizes the results of the barriers analy-
sis and initial conclusions concerning identification of
the baseline scenario.
Identifying the Baseline Scenario Using a Net Benefits AssessmentBecause the comparative assessment of barriers does not
conclusively identify a baseline scenario for Project
Activity 1, there are two options:
• Identify the more conservative baseline scenario from
Baseline Candidate 1 and Baseline Candidate 2. The
more conservative alternative would be Baseline
Candidate 2, which would have lower GHG emissions
than the continuation of current activities (Baseline
Candidate 1).
• Assess the net benefits of each alternative.
For this example, we will assess the net benefits of each
alternative to identify the baseline scenario. For
completeness, the net benefits of Project Activity 1 are
also assessed (even though Project Activity 1 was
rejected as the baseline scenario using the comparative
assessment of barriers).
For the net benefits assessment, the approximate net
benefits of each alternative are estimated and
compared—in the absence of any considerations of bene-
fits resulting from GHG reductions. Incremental costs
are evaluated and a qualitative and quantitative assess-
ment is made of the expected benefits. Benefits are
assessed from the perspective of relevant “decision-
makers,” who for Project Activity 1 and the two baseline
candidates are the project developer, Company X.
Net benefits are evaluated over a 20-year time period.
This is the expected length of time that the process
changes represented by the project activity and Baseline
Candidate 2 would be likely to continue at Company X
without further modification (i.e., the project lifetime).
The most significant source of identified net benefits
relates to potential financial benefits, as summarized in
Table E1.5. [This is a summary table; the conclusions
presented would require supporting data and analysis for
an actual GHG project.]
Another potential benefit for Project Activity 1 is early
positioning in the blended cement market should the
demand for blended cement increase in the future. This
benefit is speculative and is insufficient to outweigh the
negative net benefits from investment.
Baseline Candidate 1 (continuation of current activities)
results in zero net benefits (i.e., there is no change in
current levels of costs and benefits). Baseline Candidate 2
results in large expected net benefits. Since its associated
investment and technology barriers are low, the net finan-
cial benefits expected for Baseline Candidate 2 are positive.
Table E1.6 summarizes the ranking of the baseline scenario
alternatives. This is based on a comparison of barriers to
net benefits. Project Activity 1 is not the baseline scenario,
since it has high barriers and negative net benefits. The
continuation of current activities, although it faces no barri-
ers, gives no potential income growth for Company X.
Therefore, Baseline Candidate 2 is selected as the baseline
EXAMPLE 1 : Cement Sector GHG Project 97E
XA
MP
LE
S
T A B L E E 1 . 4 Results of comparative assessment of barriers
BASEL INE SCENARIO ALTERNAT IVES
Project Activity 1
Baseline Candidate 1: Continuation of current activities
Baseline Candidate 2: OPC productionwith 91% clinker-to-cement ratio
RANK BY CUMULAT IVE IMPACT OF BARRIERS
Highest barriers
No barriers
Low barriers
C O N C L U S I O N
Reject as baseline scenario
Could be the baseline scenario
Could be the baseline scenario
jpText_FINAL.qxd 11/22/05 3:51 PM Page 97

scenario, since the barriers are considered low and it offers
financially attractive net benefits to Company X.
8 . 2 A . 3 J U S T I F Y I N G T H E B A S E L I N E S C E N A R I O
The identified baseline scenario is Baseline Candidate 2.
It involves minimal capital investment but offers signifi-
cant monetary savings associated with reduced clinker
production. It is also conservative, because it would
result in fewer GHG emissions than the other viable
alternative—Baseline Candidate 1 (the continuation of
current activities).
Common practice is identified as OPC cement with a 95
percent clinker-to-cement ratio. Both the identified base-
line scenario and Project Activity 1 have lower GHG
emissions than common practice.
8 . 1 B P E R F O R M I N G A COMPARATIVE ASSESSMENT OF BARRIERS:Project Activity 2—Switching Fuels
The possible alternatives for the baseline scenario include:
• Implementation of the same technologies as those
involved in Project Activity 2 (i.e., switching from coal
to biofuels in kiln burning).
Cement Sector GHG Project
98
EX
AM
PL
ES
TABLE E1.5 Incremental costs and net financial benefits for Project Activity 1 and associated baseline candidates
INCREMENTAL COSTS
Investment costs—• Equipment and human resources
to improve clinker quality and QA/QC.
Additional operating costs—• Additional cost of additive material
to reduce clinker-to-cement ratio from 95 percent to 81 percent.
• Additional cost of transporting the additive materials.
• Additional electricity cost for preparing the additive materials.
Market entry costs—To gain market entry there will beadditional marketing costs for thefirst four years.
Zero relative costs (no additional investment required or costs foreseen).
Additional operating costs—• Additional cost of additive material
to reduce clinker-to-cement ratio from 95 percent to 91 percent.
• Additional cost of transporting additive materials.
• Additional electricity cost for preparing the additive materials.
INCREMENTAL BENEF ITS
• Slight reduction in fuel costs from a reduction in clinker production.
• Revenues from the sale of cement (same for other alternatives).
• If the market for blended cement grows in Indonesia,Company X may benefitfrom this project activity interms of gaining early entryinto the market.
Zero relative benefits (noadditional savings orrevenues foreseen).
• Small reduction in fuel costs from a reduction in clinker production.
• Revenues from the sales of cement (same for otheralternatives).
N E T F I N A N C I A L B E N E F I T S
Direct Financial: A negative net income is expected.Incremental investment and theadditional operating and marketingcosts exceed the cost savings fromreduced clinker use and sale ofcement. Using the weighted averagecapital cost of 12 percent as thediscount rate, the NPV for 20 yearsis: negative $ 3 million (U.S.).
Market Entry:At this point such benefits arespeculative and insufficient tojustify the incremental costs.
Conclusion:Negative net benefits.
Zero net benefits.
Increase in income from thesavings associated with a lowerclinker usage. This gives a positivecash flow. Using the weightedaverage capital cost of 12 percentas the discount rate, the NPV for20 years is $20 million (U.S.).
Conclusion:Large positive net benefits.
Project Activity 1
Baseline Candidate 1:Continuation of current activities
Baseline Candidate 2:OPC production with a 91 percent clinker-to-cement ratio
jpText_FINAL.qxd 11/22/05 3:51 PM Page 98

• Baseline Candidate 1: Continuation of current activi-
ties (i.e., continued use of coal as the primary fuel for
clinker burning).
• Baseline Candidate 2: Replacement of coal with
natural gas.
• Baseline Candidate 3: Replacement of coal with fuel oil.
8 . 1 B . 1 I D E N T I F Y I N G B A R R I E R S T O T H E P R O J E C T
A C T I V I T Y A N D B A S E L I N E C A N D I D AT E S
Based on the barrier categories in Table 8.1 (in
Chapter 8 of the Project Protocol), the following
barriers were identified:
Financial and Budgetary BarriersThere are two types of barriers in this category: invest-
ment risk and high cost.
Investment Risk: The financial and investment context
described for Project Activity 1 also applies to Project
Activity 2. The absence of incentives and the difficulty in
procuring funds for new equipment needed to utilize
biofuels present a large barrier to Project Activity 2. This
barrier does not affect any of the baseline candidates,
since no significant capital expenditures are required for
Company X to use coal, natural gas, or fuel oil.
High Cost: Project Activity 2 will require new equipment
investments, which are expected to cost approximately
$15 million (U.S.). These investments include:
• Installation of storage for the biofuels, transportation and
collection systems, and fuel feeding and burning systems.
• Pneumatic devices or bucket elevators to deliver rice husks
and palm kernel shells from ground-level storage into an
intermediate storage bin above the feed point level.
• Environmental controls that cover the biofuels supply
chain from source to final combustion. This will
include specialized collection systems, secured storage
facilities, and other fuel-specific handling systems.
Fuel costs are another possible financial and budgetary
barrier. Both natural gas and fuel oil (Baseline Candidates
2 and 3) have higher costs than coal (Table E1.7).
EXAMPLE 1 : Cement Sector GHG Project 99E
XA
MP
LE
S
T A B L E E 1 . 7 Comparison of fuel prices
FUEL TYPE
Coal
Gas
Fuel Oil
Rice Husk
Palm Kernel Shell
PR ICE (U .S .$ )* / TONNE
412.00
900.00
1,350.00
30.20
25.00
CALORIF IC VALUE (MCAL /TONNE)**
5,800
10,103
9,700
3,500
4,300
PRICE (U .S .$ )* /MCAL
0.071
0.089
0.142
0.009
0.006
*Original price is in rupiah.**Mcal = Megacalories. Calorific value of coal is based on supplier data, while the calorific values of other fuel types are taken from IPCC default value (IPCC, 1996).
T A B L E E 1 . 6 Screening baseline scenarios based on comparison of barriers to expected benefits
BASEL INE SCENARIO ALTERNAT IVES
Project Activity 1
Baseline Candidate 1: Continuation ofcurrent activities
Baseline Candidate 2: OPC productionwith 91 percent clinker-to-cement ratio
OVERALL NET BENEF ITS
Negative net benefit
Zero
Large positive net benefit
IDENT IF IED BARRIERS
High barriers
No barriers
Low barriers
C O N C L U S I O N
Exclude
A viable baseline scenariobut not the most attractive
Identified as the baseline scenario
jpText_FINAL.qxd 11/22/05 3:51 PM Page 99

The cost of the biofuels is much less than that of coal.
Therefore, some cost savings accrue to Project Activity 2
from the reduction in coal usage and the lower cost of
the biofuels. However, these savings are not enough to
cover the cost of the additional equipment needed to
utilize biofuels. The higher moisture content of biofuels
also means that more heat is needed to produce clinker.
This results in higher energy use during clinker produc-
tion and more frequent monitoring of the process. Table
E1.8 summarizes the significance of the financial and
budgetary barriers facing each alternative. [This is a
summary table; the conclusions presented would require
supporting data and analysis for an actual GHG project.]
Technology Operation and Maintenance BarriersNo significant technology barriers affect Project Activity 2
or any of its baseline candidates.
Infrastructure BarriersThe rice husks and palm kernel shells used in Project
Activity 2 are regarded as waste. Rice husks can be
sourced from areas close to the cement plants and can
be compacted to lower bulk-density, which reduces
transportation costs. The palm oil industry produces
palm kernel shells. These wastes are mostly available
in Kalimantan and, to a lesser extent, in Java, and are
cheaper than conventional fuel (Table E1.8). However,
the current infrastructure for waste collection, treatment,
and final disposal is underdeveloped compared with other
countries. Utilizing biofuels will require waste collection
and treatment systems to be implemented (approximately
Cement Sector GHG Project
100
EX
AM
PL
ES
INVESTMENT COST
U.S. $15 million
None
None
None
FUEL COST
U.S. $0.007/Mcal*
U.S. $0.071/Mcal
U.S. $0.089/Mcal
U.S. $0.142/Mcal
CONCLUS ION
Lower fuel costs but high up-front investmentcosts required, with limited access to capitaldue to the poor Indonesian investment climate.
Current activities have the least cost overall.
Significantly more expensive than using coal(U.S. $0.02/Mcal higher cost).
More expensive than using coal or natural gas.
*Assuming weighted average of rice husk and palm kernel shell utilization. Utilization of renewable sources increases heat consumption per tonne ofclinker produced. This heat consumption increase depends on the amount of biofuel used with the actual increase requiring monitoring.
T A B L E E 1 . 8 Assessment of financial and budgetary barriers for Project Activity 2 and its associatedbaseline candidates
BASELINE SCENARIO ALTERNATIVE
Project Activity 2
Baseline Candidate 1: Continuation ofcurrent activities (coal)
Baseline Candidate 2: Replacement ofcoal with natural gas
Baseline Candidate 3: Replacement ofcoal with fuel oil
jpText_FINAL.qxd 11/22/05 3:51 PM Page 100

$6 million out of the total $15 million (U.S.) investment).
This barrier only affects Project Activity 2.
Infrastructure barriers do not apply to Baseline
Candidates 1, 2, and 3, since the infrastructure for fossil
fuel collection, transportation, storage, and utilization is
already in place at Company X’s facilities.
Market Structure BarriersNo significant market structure barriers affect Project
Activity 2 or any of its baseline candidates.
Institutional, Social, and Cultural Barriers No significant institutional, social, or cultural barriers
affect Project Activity 2 or any of its baseline candidates.
Resource Availability BarriersNo significant resource availability barriers affect
Project Activity 2 or any of its baseline candidates. Rice
husks and palm kernel shells are available in abun-
dance; the only barriers to their use are infrastructural.
There is some possibility that other cement companies
will follow Company X’s lead to use biofuels, causing
future resource availability issues. Any increase in the
use of biofuels will need to be monitored.
8 . 1 B . 2 I D E N T I F Y I N G B A R R I E R S T O T H E C O N T I N U AT I O N
O F C U R R E N T A C T I V I T I E S
There are no barriers to the continuation of current
activities (Baseline Candidate 1); no legal or market
shifts are expected that would affect the continuation
of current activities.
8 . 1 B . 3 A S S E S S I N G T H E R E L AT I V E I M P O R T A N C E
O F T H E I D E N T I F I E D B A R R I E R S
Overall, the financial and budgetary barriers are the
most significant barriers. The infrastructural barriers
can be overcome by working with local government
permitting authorities and obtaining access to financing.
Thus, the importance of financial and budgetary barriers
is determined to be high, while the importance of infra-
structural barriers is medium.
Project Activity 2 is affected by all identified barriers.
Baseline Candidates 2 and 3 face relatively high finan-
cial and budgetary barriers. Baseline Candidate 1 faces
no barriers. The net affect of barriers for each alterna-
tive is summarized in Table E1.9.
8 . 2 B I D E N T I F Y I N G T H E B A S E L I N E S C E N A R I O
8 . 2 B . 1 E X P L A I N I N G B A R R I E R S T O T H E P R O J E C T A C T I V I T Y
A N D H O W T H E Y W I L L B E O V E R C O M E
Following are short descriptions of how Company X will
overcome the barriers to Project Activity 2. [Additional
explanatory information may be required for an actual
GHG project.]
Financial and Budgetary BarriersSimilar to Project Activity 1, Company X must assure
financial institutions that the investment it makes in
using biofuels will pay off. Company X is seeking recog-
nition and tradable credits associated with the GHG
reductions from this GHG project. The expected revenue
from these credits will help to assure investors that the
biofuel investment will pay off.
EXAMPLE 1 : Cement Sector GHG Project 101E
XA
MP
LE
S
T A B L E E 1 . 9 Rough ranking of baseline scenario alternatives by cumulative significance of barriers
B A S E L I N E S C E N A R I OA LT E R N AT I V E S
Project Activity 2
Baseline Candidate 1: Continuation of current activities
Baseline Candidate 2: Replacement of coal with natural gas
Baseline Candidate 3: Replacement of coal with fuel oil
BARRIER 1:INVESTMENT/BUDGETARY (H)*
High
Not present
Medium
Medium/high
BARRIER 2:INFRASTRUCTURE (M)*
High
Not present
Not present
Not present
RANK BY CUMULATIVE IMPACT
Highest Barriers
No barriers
Medium barriers
Medium/high barriers
*The relative importance of barriers compared to each other: H = Significant barrier; M = Moderately significant barrier.
jpText_FINAL.qxd 11/22/05 3:51 PM Page 101

Infrastructure BarriersCompany X will invest the money required to build the
necessary infrastructure to utilize biofuels and work with
local government officials to ensure that biofuel collec-
tion and treatment facilities can be constructed.
8 . 2 B . 2 I D E N T I F Y I N G T H E B A S E L I N E S C E N A R I O U S I N G
T H E C O M P A R AT I V E A S S E S S M E N T O F B A R R I E R S
Based on the comparative assessment of barriers, Project
Activity 2 and Baseline Candidates 2 and 3 are rejected as
the baseline scenario (Table E1.10). Baseline Candidate 1,
which is the continuation of current activities, faces no
barriers and is identified as the baseline scenario.
8 . 2 B . 3 J U S T I F Y I N G T H E B A S E L I N E S C E N A R I O
The identified baseline scenario is the continuation of
current activities—i.e., the use of coal as the fuel for
clinker production. It involves no capital investment
and faces no barriers. This baseline scenario is reason-
able, since it also represents common practice. Project
Activity 2 is not common practice.
8 . 3 E S T I M AT I N G B A S E L I N E E M I S S I O N SBaseline emissions are estimated for each primary
effect, based on the identified baseline scenarios for
each project activity.
Project Activity 1: Reducing Clinker ContentPrimary Effect 1: Reduction in industrial process
emissions resulting from reduced clinker in the
calcination process.
The CO2 emission factor for calcination from a tonne of
clinker is 0.525 t CO2/t clinker.1
Baseline emissions for this primary effect are equal to
the clinker content of the cement multiplied by the CO2
emission factor for calcination:
= (0.91 t clinker/t cement) . (0.525 t CO2/t clinker)
= 0.478 tonnes of CO2eq for every tonne of cementproduced by Company X
Primary Effect 2: Reduction in combustion emissions
from generating energy for pyro-processing resulting
from reduced clinker in the calcination process.
Only CO2 emissions are considered, since nitrous oxide
and methane emissions from the clinker burning process
are considered insignificant (Ellis 2000). The baseline
scenario involves coal as the fuel used in clinker burning.
Coal from Indonesia has an emission factor of 0.402 kg
CO2eq/Megacalorie (CO2/Mcal). As a preliminary esti-
mate, it is assumed that clinker requires an energy input
of 755 Mcal/t of clinker.
Baseline emissions for this primary effect are equal to
the CO2 emission factor for coal multiplied by the energy
input required for clinker production, multiplied by the
clinker content of the cement:
= (0.402 kg CO2eq/Mcal) . (755 Mcal/t clinker)
x (0.91 t clinker/t cement) / (1,000 kg CO2 /t CO2)
= 0.276 tonnes of CO2eq for every tonne of cementproduced by Company X
Project Activity 2: Switching FuelsPrimary Effect 3: Reduction in combustion emissions from
generating energy due to the switch from coal to biofuels.
Project Activity 2 effectively reduces the GHG emission
rate associated with the fuel used for clinker burning,
E X A M P L E 1
Cement Sector GHG Project
102
EX
AM
PL
ES
T A B L E E 1 . 1 0 Results of comparative assessment of barriers
BASEL INE SCENARIO ALTERNAT IVES
Project Activity 2
Baseline Candidate 1: Continuation of current activities
Baseline Candidate 2: Replacement of coal with natural gas
Baseline Candidate 3: Replacement of coal with fuel oil
RANK BY CUMULATIVE IMPACT
Highest barriers
No barriers
Medium barriers
Medium/high barriers
C O N C L U S I O N
Rejected as the baseline scenario.
Identified as the baseline scenario.
Rejected as the baseline scenario.
Rejected as the baseline scenario.
jpText_FINAL.qxd 11/22/05 3:51 PM Page 102

which in the baseline scenario is coal. Project Activity 1
results in a reduction in the amount of clinker required
for every tonne of cement produced. Thus, baseline emis-
sions for Project Activity 2 are premised on the lower
amount of clinker required by Project Activity 1—i.e.,
0.81 tonnes of clinker/tonne of cement.
For Project Activity 2 the baseline emissions are equal to
the CO2 emission factor for coal multiplied by the energy
input required for clinker production, multiplied by the
lower clinker content of the cement:
= (0.402 kg CO2eq/Mcal) . (755 Mcal/t clinker)
x (0.81 t clinker/t cement) / (1,000 kg CO2/t CO2)
= 0.246 tonnes of CO2eq for every tonne of cementproduced by Company X
Chapter 10: Monitoring and Quantifying the GHG Reductions
1 0 . 1 C R E AT I N G A M O N I T O R I N G P L A NThe monitoring plan presented here is an overview and,
as with the requirements for Chapter 8, this section is
organised by following all the requirements for each proj-
ect activity sequentially. A detailed monitoring plan will
include provisions for monitoring frequency, record keep-
ing, and methods used to measure, calculate, or estimate
data on GHG emissions and baseline parameters.
10.1A.1 M O N I T O R I N G P R O J E C T A C T I V I T Y E M I S S I O N S :
Project Activity 1—Reducing Clinker Content
GHG emissions are monitored using indirect measure-
ment and calculations. The data that need to be
monitored for Project Activity 1 and brief assessments of
the uncertainty associated with these data are provided
in Table E1.11. [Additional detail would in most cases
be necessary for an actual project.]
EXAMPLE 1 : Cement Sector GHG Project 103E
XA
MP
LE
S
T A B L E E 1 . 1 1 Data requirements and uncertainty levels for monitoring Project Activity 1 emissions
DATA
Clinker-to-cement ratio ofblended cement
CO2 emission factor due tocalcination process
Tonnes of cement produced by Company X
CO2 emission factor for coalused in clinker productionprocess (tonnes CO2/Mcal)
Energy content of coal used in clinker productionprocess (Mcal/tonne)
Amount of coal used in clinker production process (tonnes)
LEVEL OFUNCERTA INTY
Low
Low
Low
Low
Low
Low
UNCERTA INTYFACTORS
N/A
MgO and CaO content ofraw material and clinker
N/A
Heat values for coal used
Heat values for coal used
N/A
H O W U N C E R T A I N T I E S A R E A D D R E S S E D
N/A
Conduct a laboratory analysis usingx-ray analyser.
N/A
• Conduct a laboratory analysis to test the heating values for coal used.
• In the absence of laboratory analysis, use IPCC default emission factors.
• Conduct a laboratory analysis to test the heating values for coal used.
• In the absence of laboratory analysis, use IPCC default emission factors.
N/A
GHG EFFECT / SOURCE
Primary Effect 1:Industrial processemissions
Primary Effect 2:Combustion emissions fromgenerating energyfor pyro-processing
jpText_FINAL.qxd 11/22/05 3:51 PM Page 103

10.1A.2 M O N I T O R I N G B A S E L I N E P A R A M E T E R S
The data in Table E1.12 will be monitored to ensure
that baseline emission estimates for Project Activity 1
remain valid.
For the first assumption, if additive materials were to
become scarce, significant secondary effects may arise
from other users of these materials switching to conven-
tional raw materials, thus increasing their GHG
emissions. Baseline emission estimates may need to be
revised to account for this switch. This secondary effect
would then need to be included in the GHG assessment
boundary. The availability of unused additive materials
will be verified annually.
For the second assumption, if the market share of
blended cement in Indonesia rises above 30 percent, the
baseline scenario will no longer be assumed to be valid,
and no more GHG reductions will be quantified for
Project Activity 1. The market penetration of blended
cement will be verified annually.
1 0 . 1 A . 3 D E S C R I B I N G Q A / Q C M E A S U R E S
Most of the data required in the monitoring plan, the
monitoring frequency, and measurement/estimation
methods are already accounted for in the existing ISO
9001 system and the audited management accounting
system for Portland cement. Furthermore, each year an
independent verifier from an accredited entity will verify
the actual GHG reductions generated.
1 0 . 1 B . 1 M O N I T O R I N G P R O J E C T A C T I V I T Y E M I S S I O N S :
Project Activity 2—Switching Fuels
The data needed to determine GHG emissions related to
the primary effect of Project Activity 2 are the same used
to determine GHG emissions associated with the second
primary effect for Project Activity 1 (see Table E1.11).
Project Activity 2 does not have any significant secondary
effects. Therefore, no separate monitoring plan is required
for the GHG emissions associated with Project Activity 2.
1 0 . 1 B . 2 M O N I T O R I N G B A S E L I N E P A R A M E T E R S
The data in Table E1.13 will be monitored to ensure
that baseline emission estimates for Project Activity 2
remain valid.
Before the GHG project begins, data on the energy input
required to produce clinker are required in order to cali-
brate estimates of baseline emissions. As noted above,
under Estimating Baseline Emissions (section 8.3), the
E X A M P L E 1104
EX
AM
PL
ES
T A B L E E 1 . 1 2 Data requirements and uncertainty levels for monitoring baseline parameters related toProject Activity 1 (reducing clinker content)
DATA
Availability of unusedadditive materials
Total sales of OPC in Indonesia
Total sales of blendedcement in Indonesia
Sales of non-OPC andnon-blended cement in Indonesia
Market share of blendedcement in Indonesia
Strength of blendedcement and OPC cement
LEVEL OFUNCERTA INTY
Medium
Low
Low
UNCERTA INTYFACTORS
Displacement ofother users of flyash and trass
Lack of records and available dataon cement market
N/A
H O W U N C E R T A I N T I E S A R E A D D R E S S E D
Regular surveys of other users of fly ashand trass to ascertain level of use.
• Conduct a data assessment from the cement market association and exist-ing market studies.
• Conduct a regular survey and investigation of the OPC and blended cement market.
• An independent expert should validate the data quality for the cement sector.
Conduct a laboratory analysis to assessthe OPC and blended cement strength.
BASELINE PARAMETER/ASSUMPTION
Additive materials (flyash, trass) remainabundantly available
Blended cement haslimited market penetra-tion in Indonesia
Cement Sector GHG Project
jpText_FINAL.qxd 11/22/05 3:51 PM Page 104

estimated specific heat consumption when coal is used as
a fuel is 755 Mcal/t of clinker.2 To accurately estimate
baseline emissions, this preliminary estimate will need to
be verified and modified if necessary.
If the availability of rice husks and palm kernel shells
drops below 1.5 times the amount used by other users,
then significant secondary effects may arise from the
project activity because other users of these biofuels may
switch to more conventional fuels with higher GHG emis-
sions. Baseline emission estimates would then need to be
revised to account for this fuel switch. This secondary
effect would then need to be included in the GHG assess-
ment boundary. The availability of unused rice husks and
palm kernel shells will be verified annually.
1 0 . 1 B . 3 D E S C R I B I N G Q A / Q C M E A S U R E S
Most of the data required in the monitoring plan, the
monitoring frequency, and measurement/estimation
methods, are already accounted in the existing ISO
9001 system and audited management accounting
system for Portland cement. Furthermore, each year an
independent verifier from an accredited entity will verify
the actual GHG reductions generated.
1 0 . 2 Q U A N T I F Y I N G G H G R E D U C T I O N S
1 0 . 2 . 1 I D E N T I F Y I N G T H E T I M E P E R I O D O V E R W H I C H
G H G R E D U C T I O N S W I L L B E Q U A N T I F I E D
Project Activity 1: Reducing Clinker ContentThe valid time length for the baseline scenario is esti-
mated at 5 years. This is based on the expectation that
the market penetration of blended cement in Indonesia
could reach 30 percent within 5 years, after which the
production of blended cement would be considered
common practice.
The market share of blended cement varies considerably
across countries. For instance, it is around 47 percent in
EXAMPLE 1 : Cement Sector GHG Project 105E
XA
MP
LE
S
T A B L E E 1 . 1 3 Data requirements and uncertainty levels for monitoring baseline parameters related toProject Activity 2 (switching fuels)
DATA
Specific heatconsumption usingcoal fuel only
Availability of unusedrice husks and palmkernel shells
Biofuels used by other users
LEVEL OFUNCERTA INTY
Low
Medium
Medium
UNCERTA INTYFACTORS
N/A
Quantity of unusedrice husks andpalm kernel shells
Quantity of biofuelused by other users
H O W U N C E R T A I N T I E S A R E A D D R E S S E D
Pre-project documentation of specific heat consumption of coal used for clinker production.
Regular surveys of sources for rice husks and palm kernel shells to ascertain level of availability.
Regular surveys of other users of rice husks and palm kernel shells toascertain level of use.
BASEL INE PARAMETER/ASSUMPT ION
Energy input required to produce one tonne of clinker
Biofuels remain abundantly available
jpText_FINAL.qxd 11/22/05 3:51 PM Page 105

India and around 21 percent in Malaysia. Increasing the
blended cement share to 47 percent in India took about
5 years (1999–2003). Blended cement is also sold in
Mexico and Costa Rica. In Japan, blended cement had a
26 percent market share in 2002, and about 50 percent
of the cement is blended in Germany.
Based on these figures, the opinions of international
experts consulted, and on Company X’s international
experience, it appears that setting the common practice
threshold for blended cement in Indonesia at 30 percent
within 5 years would be a justifiable time period for
quantifying GHG emissions.
Project Activity 2: Switching FuelsThe valid time length of the baseline scenario is assumed
to be 15 years. This period reflects an assessment of
long-term assumptions about common practice fuel
usage for clinker production. Specifically, the use of
fuels other than coal is not common practice and is likely
to remain unchanged for several reasons:
• Coal is locally available in abundance at
competitive prices.
• The infrastructure for renewable waste collection,
treatment, and final disposal is underdeveloped
compared to that in many developed countries.
• Clinker burning in the Indonesian cement industry is
presently based almost entirely on coal.
• The total cost (including infrastructure) to use fossil
fuels is lower than the cost for alternative fuels, and
the cement industry tends to use fossil fuels, rather
than investing in new equipment to enable the use of
alternative energy sources.
Any change in these circumstances will depend largely
on government policy and efforts to improve waste fuel
infrastructure. The Indonesian national action plan on
Urban Waste Management 2003 has a projected
15-year time frame for improving the waste manage-
ment infrastructure to acceptable levels. This time
frame may decrease or increase, depending on national
and local government commitments and their efforts to
solicit public engagement.
GHG ProjectThe time period over which GHG reductions will be
quantified for the GHG project is 5 years, corresponding
to the shortest valid baseline scenario time length
(Project Activity 1).
1 0 . 2 . 2 CALCULAT IONS FOR QUANT IFY ING GHG REDUCT IONS
Estimating GHG ReductionsEx ante GHG reductions are estimated preliminarily here
on an annual basis. In reality, GHG project (and baseline)
emissions will change over time—e.g., as overall produc-
tion expands and as biofuels are phased in over time to
substitute for coal. The formulas used to quantify GHG
reductions ex post will differ from those used to estimate
ex ante GHG reductions, since combustion emissions, for
example, can be determined directly from monitored fuel
usage. Ex post calculation formulas are presented below
in the section on quantifying GHG reductions.
106
Cement Sector GHG ProjectE
XA
MP
LE
S
E X A M P L E 1
jpText_FINAL.qxd 11/22/05 3:51 PM Page 106

GHG reductions are estimated in units of CO2eq tonnes.
Baseline emissions and project emissions are calculated for
each primary and significant secondary effect.
P R I M A R Y E F F E C T S :
P R O J E C T A C T I V I T Y 1 — R E D U C I N G C L I N K E R C O N T E N T
Primary Effect 1: Reduction in industrial process
emissions resulting from reduced clinker in the
calcination process.
Process emissions from cement production are estimated
to be 0.525 t CO2 /t clinker. Project Activity 1 will use a
clinker-to-cement ratio of 81 percent.
GHG emissions from Project Activity 1, Primary
Effect 1 are:
= (0.81 t clinker/t cement) .
(0.525 t CO2/t clinker)
= 0.425 tonnes of CO2eq for every tonne of cementproduced by Company X
Baseline emissions for Primary Effect 1 were estimated
above (section 8.3) as 0.478 t CO2/t of cement.
GHG reductions will therefore be:
= 0.478 – 0.425
= 0.053 t CO2eq/t cement produced
Primary Effect 2: Reduction in combustion emissions
from generating energy for pyro-processing resulting
from reduced clinker in the calcination process.
Again, the project activity will use a clinker-to-cement
ratio of 81 percent. The change in fuel mix is accounted
for under Project Activity 2, so here the reduction in
coal combustion emissions associated with reducing fuel
usage required for clinker production are calculated.
GHG emissions from Project Activity 1, Primary
Effect 2 are:
= (0.402 kg CO2eq/Mcal) . (755 Mcal/t clinker) .
(0.81 t clinker/t cement) / (1,000 kg CO2/t CO2)
= 0.246 tonnes of CO2eq for every tonne of cementproduced by Company X
Baseline emissions for Primary Effect 2 were estimated
above (section 8.3) as 0.276 t CO2eq/t of cement.
GHG reductions will therefore be:
= 0.276 – 0.246
= 0.03 t CO2eq/t cement produced
P R I M A R Y E F F E C T S :
P R O J E C T A C T I V I T Y 2 — S W I T C H I N G F U E L S
Primary Effect 3: Reduction in combustion emissions
from generating energy due to the switch from coal
to biofuels.
Biofuels will be gradually substituted for coal until they
account for about 15 percent of the fuel mix on an over-
all heat input basis. Since biofuels effectively have a
zero emissions factor, the overall fuel-mix emission
factor will equal 85 percent of baseline emissions. GHG
emissions from Project Activity 2 related to its primary
effect are therefore:
= (0.246 t CO2eq/t cement) . (0.85)
= 0.209 t CO2eq/t cement
Baseline emissions for Project Activity 2 were estimated
above (section 8.3) as 0.246 t CO2eq/t of cement.
EXAMPLE 1 : Cement Sector GHG Project 107E
XA
MP
LE
S
jpText_FINAL.qxd 11/22/05 3:51 PM Page 107

E X A M P L E 1
GHG reductions will therefore be:
= 0.246 – 0.209
= 0.037 t CO2eq/t cement produced
Aggregating the GHG reductions associated with each
primary effect together, total GHG reductions related to
primary effects will be:
= 0.053 + 0.03 + 0.037
= 0.12 t CO2eq/t cement produced
Secondary EffectsNo significant secondary effects were identified for
either project activity, so secondary effects do not need
to be estimated.
Total Estimated GHG Reductions Company X’s cement production is expected to expand
over time. However, average annual production will be
in the neighbourhood of 2 million tonnes of cement.
Thus, annual GHG reductions are estimated at:
= (2 million tonnes) . (0.12 tonnes CO2eq/t cement)
= 240,000 tonnes CO2eq.
This is a rough estimate based on preliminary assump-
tions; actual quantification of GHG reductions may differ
once the project is implemented, and the GHG project is
monitored and verified.
Cement Sector GHG Project
108
EX
AM
PL
ES
jpText_FINAL.qxd 11/22/05 3:51 PM Page 108

EXAMPLE 1 : Cement Sector GHG Project 109E
XA
MP
LE
S
Quantifying GHG ReductionsGHG reductions for the GHG project are quantified ex post using monitored data. Therefore, the calculations and
formulas used will differ somewhat from those used to estimate GHG reductions ex ante. The formula for the annual
quantification of GHG reductions is as follows:
R = BE – PE
Where:
R = Annual GHG reductions for the entire GHG project
BE = Total annual baseline emissions for all three GHG project primary effects
PE = Total annual GHG project emissions
BE = [Process Emissions] + [Combustion Emissions]
= [Cy. CFb
. EFp] + [Cy. CFb
. E . EFc]
Where:
Cy = Quantity of cement produced in year y, in tonnes
CFb = Fraction of clinker in cement, baseline scenario = 0.91
EFp = Emission factor for process emissions from clinker production = 0.525 t CO2/t clinker
(WBCSD Cement Protocol 2001).
E = Energy input from coal required to produce a tonne of clinker = 755 Mcal/tonne of
clinker (as determined through pre-implementation monitoring)
EFc = Emission factor for coal combustion = 0.402 kg CO2eq/Mcal (as determined under the
monitoring plan)
PE = [Process Emissions] + [Combustion Emissions]
= [Cy. CFp
. EFp ] + [Fy. ECc
. EFc ]
Where:
CFp = Fraction of clinker in cement, GHG project = 0.81
Fy = Amount of coal consumed in year y, in tonnes
ECc = Energy content of coal in units of Mcal/tonne, as determined under the monitoring plan
NOTES1 0.525 tonnes of CO2/tonne of clinker is the default emission factor for the
calcination process in the cement industry (WBCSD Cement Protocol 2001).
2 This figure would differ if other fuels were used, but the identified baseline
scenario involves continued use of coal.
With the exception of the picture on page 88, all pictures in this example
were provided by Italcementi, to whom we are particularly thankful.
jpText_FINAL.qxd 11/22/05 3:51 PM Page 109

PA R T I I I110
EX
AM
PL
ES
ollowing is a hypothetical project illustrating how
to use the performance standard procedure to
estimate baseline emissions. All names in the
example are fictional. Also, the information here
is quite general; project developers would normally be
expected to provide more detailed information.
The numbering of the sections in this example corre-
sponds to the numbering of the chapters in Part II of the
Project Protocol.
Background and Overview of Natural GasCompressor Station GHG EmissionsNatural gas compressor stations, which are typically
found every 100 to 150 km along a gas pipeline, are
instrumental in maintaining adequate pressure for the
gas to travel through a pipeline system. Compressor
stations usually contain more than one compressor.
Although the compressor itself is not a source of GHG
emissions, the compressor is powered by a driver, typi-
cally a gas or diesel engine or gas turbine that releases
GHG emissions, specifically carbon dioxide (CO2) and
methane (CH4). It is the complete unit encompassing the
compressor and its associated driver that is hereafter
referred to as the “compressor.”
Significant reductions in CO2 and CH4 can be achieved by
improving the compressor efficiency or the process effi-
ciency (e.g., load optimization). This hypothetical case
study illustrates a pipeline project in Indonesia that
reduces CO2 and CH4 emissions at a new compressor
station by installing higher-efficiency (lower-emitting)
compressors. The case study is designed to illustrate the
steps a project developer would take to develop a
performance standard for compressor station GHG emis-
Compressor Station EfficiencyImprovement GHG Project Using thePerformance Standard Baseline Procedure
F
2jpText_FINAL.qxd 11/22/05 3:51 PM Page 110

sions. The efficiency values are illustrative and should
not be used to develop an actual performance standard.
Each compressor installed under this GHG project has a
fuel efficiency of 10.6 megajoules of natural gas/kilowatt
hour of compression (MJ/kWh).
G H G P R O J E C T D E S C R I P T I O NThe information provided in this case study is intended to
provide context for the GHG project. Some of this infor-
mation is reported to meet the requirements in Chapter
11 of the Project Protocol. Additional information
should also be reported when documenting and reporting
an actual GHG project (see Chapter 11).
GHG project title: Jogja pipeline compressor station
efficiency improvement project.
Description: The GHG project will install high-efficiency
compressors used to maintain adequate pressure for gas
to move along a pipeline. This involves installing
compressors as part of an extension of a pipeline within
an existing natural gas transmission system. Each
compressor will be fuelled by natural gas. This pipeline
extension will deliver gas to a natural gas power plant
that is currently under construction.
Size: The GHG project installs 30 new state-of-the-art,
high-efficiency compressors.
Geographical location: Yogyakarta region in Indonesia.
Names of project partners: Jogja Gas Pipelines, Inc. (a
private natural gas transmissions company), and the
Indonesian Energy Agency (the government agency that
deals with gas pipelines). The pipeline is owned by Jogja
Gas Pipelines, Inc., and the land and gas in the pipeline
are owned by the Indonesian Energy Agency.
Project technology: High-efficiency pipeline compressors.
(These compressors require 10.6 MJ/kWh of compression.)
Chapter 5: Defining the GHG Assessment Boundary
5 . 1 I D E N T I F Y I N G P R O J E C T A C T I V I T I E SThis GHG project involves just one project activity:
installing higher-efficiency compressors as part of an
extension of a pipeline within an existing natural gas
transmission system.
5 . 2 & 5 . 3 I D E N T I F Y I N G P R I M A R Y E F F E C T S A N D C O N S I D E R I N G A L L S E C O N D A R Y E F F E C T S
The primary and secondary effects associated with this
project activity are identified in Table E2.1.
5 . 4 & 5 . 5 ESTIMATING THE RELATIVE MAGNITUDE AND ASSESSING THE SIGNIFICANCE OF SECONDARY EFFECTS
Since the power plant’s demand for natural gas—and
the associated pipeline and compressors required to
deliver this gas—will be the same with or without the
GHG project, there will be no net difference between
baseline emissions and project activity emissions associ-
ated with one-time activities, and therefore no one-time
effects. By reducing natural gas usage at the compres-
sors, the GHG project will slightly reduce demand for
natural gas. This in turn will slightly reduce GHG emis-
sions from extracting and transporting natural gas. To be
conservative, such GHG reductions will be ignored.
Therefore, no significant secondary effects are identified.
Therefore, the GHG assessment boundary includes only
GHG sources associated with the primary effect.
Chapter 6: Selecting a Baseline ProcedureThe performance standard procedure was chosen, since
there is a relative degree of uniformity for compressor
technology in the commercial market.
Chapter 7: Identifying the Baseline Candidates
To identify the list of baseline candidates, different alter-
natives are considered whose products or services are
comparable to the project activity within a relevant
geographic area and temporal range. Since the perform-
ance standard procedure is being used, baseline
candidates include all the individual plants, technologies,
or practices whose products or services are similar to
those of the project activity.
EXAMPLE 2: Compressor Station GHG Project 111E
XA
MP
LE
S
jpText_FINAL.qxd 11/22/05 3:51 PM Page 111

7 . 1 D E F I N I N G T H E P R O D U C T O R S E R V I C EP R O V I D E D B Y T H E P R O J E C T A C T I V I T Y
The service provided by the project activity is the
compression of a particular volume of natural gas so
that the gas can be delivered to a power plant.
7 . 2 I D E N T I F Y I N G P O S S I B L E T Y P E S O F B A S E L I N E C A N D I D AT E S
Since only compressor stations can provide this service,
the identified baseline candidates include all compressor
stations used for gas pipelines within the geographic
area and temporal range described under section 7.3.
7 . 3 D E F I N I N G T H E G E O G R A P H I C A R E A A N D T E M P O R A L R A N G E
7 . 3 . 1 D E F I N I N G T H E G E O G R A P H I C A R E A
As an initial default, the geographic area considered was
the country of Indonesia. However, this default was
rejected, despite a sufficient number of compressors
found in Indonesia to develop a performance standard.
Instead, the final geographic area selected was global,
since the project involves implementing technologies that
are commercially available globally.
7 . 3 . 2 D E F I N I N G T H E T E M P O R A L R A N G E
The initial temporal range considered was all compres-
sors that went into operation during the last five years.
However, compressor efficiency improves at a fairly rapid
pace, so it was decided to use a temporal range of the
previous three years. This takes a conservative approach
by considering only the more recent and more efficient
compressor technologies, and still provides a large
enough data set to develop the performance standard.
7 . 4 D E F I N I N G O T H E R C R I T E R I A U S E D T O I D E N T I F Y B A S E L I N E C A N D I D AT E S
The following factors were considered in identifying
baseline candidates:
• General market conditions. Due to the energy mix in
Indonesia, the host country, natural gas is the only
potential fuel source for the proposed power plant.
Similarly, receipt of the gas via a pipeline is the only
viable option for transporting the natural gas.
• Relevant legal requirements. There are no regulations
or laws in Indonesia governing the use of compressor
technology or installation for the purposes of trans-
porting natural gas in pipelines. To check for legal
Compressor Station GHG Project
112
EX
AM
PL
ES
T A B L E E 2 . 1 Primary and secondary effects
PRIMARY EFFECT
Reduction in combustionemissions from generatingoff-grid electricity fromreduced fuel use bycompressors (per unit ofnatural gas transported).
ONE-T IME EFFECTS
Considered:• GHG emissions associated with the manufacture,
installation, and decommissioning of compressors.
Magnitude/Significance:The project activity will cause GHG emissions asso-ciated with the manufacture, installation, anddecommissioning of compressors. However, thesesame activities would have occurred in the baselinescenario, producing GHG emissions from the sameGHG sources. The result is zero net change betweenproject activity GHG emissions and baseline emis-sions, so there are no one-time GHG effects.
UPSTREAM AND DOWNSTREAM EFFECTS
Considered: • Reduced GHG emissions associated with
reduced mining/extraction of natural gas.• Reduced GHG emissions associated with
reduced transportation of natural gas.
Magnitude/Significance:The project will cause an absolute reduction indemand for natural gas, leading to reductions inGHG emissions associated with extracting andtransporting natural gas. Such GHG reductionswould constitute positive secondary effects; tobe conservative, these GHG reductions areassumed to be zero. No other inputs or outputsare associated with the project that might causesecondary effects.
S E C O N D A R Y E F F E C T S
E X A M P L E 2
jpText_FINAL.qxd 11/22/05 3:51 PM Page 112

requirements, applicable national, regional, and local
laws were researched. In addition, Jogja Gas
Pipelines, Inc., checked with local lawyers and govern-
ment officials for any additional information. No
applicable laws were found.
7 . 5 I D E N T I F Y I N G T H E F I N A L L I S T O F B A S E L I N E C A N D I D AT E S
The resulting list of baseline candidates and associated
data are provided in Table E2.2. This list consists of all
compressors that went on line between 2001 and 2003
globally. All selected candidates are capable of providing
the same quality and quantity of service as the compres-
sors employed by the GHG project.
Chapter 9: Estimating Baseline Emissions—Performance Standard Procedure
9 . 1 S P E C I F Y I N G T H E A P P R O P R I AT E P E R F O R M A N C E M E T R I C S
For this project activity, a production-based performance
metric is appropriate, since it is possible to quantify
performance in terms of units of input per unit of product or
service. The service in this case is the compression of natu-
ral gas. The amount of compression provided by compressor
station drivers can be reliably inferred from their kilowatt-
hours of electrical output. Thus, the units of service for the
performance metric are kilowatt-hours (kWh).
The compressor station input related to the project activ-
ity’s primary effect is a fuel: natural gas. Quantities of
natural gas can be measured in terms of energy content
(e.g., megajoules (MJ)). Therefore, for this project activ-
ity, the units for the relevant input are megajoules.
EXAMPLE 2: Compressor Station GHG Project 113E
XA
MP
LE
S
T A B L E E 2 . 2 Identified baseline candidates and data set for developing the GHG performance standard
COMPRESSOR YEAR OPERATION # OF COMPRESSOR UNITS CAPACITY DESIGN FUEL USAGESTARTED AT EACH STATION (KW/UNIT) (MJ/KWH)
Station A (Russia) 2003 25 70 10.5Station B (China) 2003 10 70 11.1Station C (Germany) 2003 5 50 12.2Station D (Norway) 2003 25 55 11.5Station E (Chile) 2003 30 65 12.7Station F (Russia) 2003 22 60 11.5Station G (Algeria) 2003 21 50 12.5Station H (U.S.) 2002 18 50 15.5Station I (U.S.) 2002 6 60 14.8Station J (Nigeria) 2002 12 50 14Station K (Qatar) 2002 15 60 14Station L (China) 2002 23 55 15Station M (China) 2002 36 50 15.5Station N (Indonesia) 2002 14 30 16Station O (Russia) 2002 20 40 15.5Station P (U.S.) 2002 25 60 15.5Station Q (Russia) 2002 25 50 15.9Station R (Norway) 2001 13 40 16Station S (Bolivia) 2001 26 50 15.2Station T (Russia) 2001 21 50 15.5
Total # of Compressors 392
jpText_FINAL.qxd 11/22/05 3:51 PM Page 113

The performance metric used to determine GHG emis-
sions from baseline candidates is MJ/kWh.
9 . 2 C A L C U L AT I N G T H E G H G E M I S S I O N R AT E F O R E A C H B A S E L I N E C A N D I D AT E
Data on the performance rates for each baseline candi-
date were obtained in the process of identifying the
baseline candidates (Table E2.2). Performance rates
for compressor stations are measured using the
performance metric MJ/kWh, also called the “design
fuel usage.” Design fuel usage data were found from
the manufacturers’ specification sheets for the drivers
used at the compressor stations. The design fuel usage
for a particular technology depends on the load at
which the technology is run. Where the load data
proved difficult to find, 100 percent load was assumed
in order to be conservative (see Box E2.1). (This would
result in the lowest possible design fuel usage for a
particular technology.)
GHG emission rates were calculated for each baseline
candidate using the IPCC emission factor for natural
gas: 15.3 tonnes of C/TJ = 0.056 kg CO2eq/MJ. The
results are shown in Table E2.3.
9 . 3 C A L C U L AT I N G T H E G H G E M I S S I O N R AT E F O R D I F F E R E N T S T R I N G E N C Y L E V E L S
Different stringency level GHG emission rates were
calculated as follows:
Most stringent: The lowest-emitting baseline candidate
is Station A (0.59 kg CO2eq/kWh).
Mean: The output-weighted average emission rate is
0.78 kg CO2eq/kWh.
Median: The median (50th percentile) of this data set is
equal to the GHG emission rate of the twelfth most effi-
cient group of compressor units in the data set—i.e.,
Station S. This emission rate is 0.85 kg CO2eq/kWh.
25th percentile: The 25th percentile of this data set is
equal to the GHG emission rate of the sixth most effi-
cient group of compressor units in the data set—i.e.,
Station G. This emission rate is 0.70 kg CO2eq/kWh (see
Box E2.2).
10th percentile: The 10th percentile of this data set is
equal to the GHG emission rate of the third most
efficient group of compressor units in the data set—i.e.,
Station D. This emission rate is 0.65 kg CO2eq/kWh (see
Box E2.2).
Compressor Station GHG Project
EXAMPLE 2114
EX
AM
PL
ES
A compressor station has a maximum rated capacity of 70 kilo-watts (kW). Fuel usage over one year was measured at 7.5 millionMJ, but no data are available on load or output (in kWh). Designfuel usage would be calculated as follows:
(7.5 million MJ/year)(70 kW) . (8,760 hours/year) .(100% load factor)
This fuel usage calculation is conservative, because if the loadwere in fact less than 100 percent, actual design fuel usage(and resulting GHG emissions) would be higher.
B O X E 2 . 1 Sample calculation of design fuel usage where load data are unavailable
T A B L E E 2 . 3 Baseline candidate GHG emission rates
BASELINE CANDIDATE GHG EMISSION RATE (KG CO2/KWH)
Station A 0.59Station B 0.62Station C 0.69Station D 0.65Station E 0.71Station F 0.65Station G 0.70Station H 0.87Station I 0.83Station J 0.79Station K 0.83Station L 0.84Station M 0.87Station N 0.90Station O 0.87Station P 0.87Station Q 0.89Station R 0.90Station S 0.85Station T 0.87
=12.2 MJ/kWh
jpText_FINAL.qxd 11/22/05 3:51 PM Page 114

9 . 4 SELECT ING AN APPROPRIATE STR INGENCYLEVEL FOR THE PERFORMANCE STANDARD
The 10th percentile stringency level was chosen, corre-
sponding to a performance standard of 0.65 kg
CO2eq/kWh. This stringency level is equivalent to the emis-
sion rates of Stations D and F, both recently constructed
compressor stations. The data graphed in Figure E2.1
reveal that the compressor stations that started opera-
tion in 2003 (Stations A–G) have significantly lower
emission rates on average than those that came on line
in 2001 and 2002 (Stations H–T). Taking account of
this trend, the 10th percentile seems reasonable, given
that it equates roughly to the average emission perform-
ance of the 2003 compressor stations. For this and other
reasons (e.g., considerations about additionality, which
are not discussed here), the 10th percentile stringency
level is determined to be a reasonable estimate for the
baseline emission rates for future compressor stations.
9 . 5 E S T I M AT I N G B A S E L I N E E M I S S I O N SBaseline emissions are calculated as the performance
standard emissions rate multiplied by the project activity
level of service (measured in kWh). It is assumed that the
kilowatt-hours of output (and therefore the amount of gas
compressed) remains the same in the baseline scenario
and project, since the project activity itself will not signif-
icantly alter the supply of, or demand for, natural gas.
Annual baseline emissions are calculated under section
10.2.2 as part of quantifying the GHG reductions.
Chapter 10: Monitoring and Quantifying the GHG Reductions
For this project example, monitoring and quantifying
GHG reductions are relatively straightforward. This
section presents a simple overview of how monitoring
and quantification requirements can be met. Technical
details related to monitoring conditions and equipment
specifications are omitted.
1 0 . 1 C R E AT I N G A M O N I T O R I N G P L A NBecause there are no significant secondary effects, the
monitoring plan is devoted to the Jogja project’s single
primary effect—i.e., reductions in combustion emissions
from generating off-grid electricity resulting from
reduced fuel use by compressors. Elements of the moni-
toring plan are described below.
1 0 . 1 . 1 M O N I T O R I N G P R O J E C T A C T I V I T Y E M I S S I O N S
• For each of the 30 compressors installed under the
GHG project, fuel usage data will be collected continu-
ously using natural gas flow meters. The data will be
converted to units of MJ, based on standard factors
for the energy content of natural gas. Uncertainty
associated with these measurements will be low.
EXAMPLE 2: Compressor Station GHG Project 115E
XA
MP
LE
S
B O X E 2 . 2 How to calculate the 10th and 25th percentiles
K G C O 2 / K W H C O M P R E S S O R R A N K I N G
0.59 1–250.62 26–350.65 36–600.65 61–820.69 83–870.70 87–1080.71 109–1380.79 139–1500.83 151–1560.83 157–1710.84 172–1940.85 195–2200.87 221–2450.87 246–2650.87 266–3010.87 302–3190.87 320–3400.89 341–3650.90 366–3780.90 379–392
For the 25th percentile:
w = (392) . ( 25 ) + 0.5 = 98.5 g = 98, f = 0.5, and a = 392 100
pe = (1 - 0.5) . (0.70) + 0.5(0.70) = 0.70 kg CO2eq/kWh
For the 10th percentile:
w = (392) . ( 10 ) + 0.5 = 39.7 g = 39, f = 0.7, and a = 392100
pe = (1 - 0.7) . (0.65) + 0.7(0.65) = 0.65 kg CO2eq/kWh
jpText_FINAL.qxd 11/22/05 3:51 PM Page 115

• CO2 emissions will be calculated by multiplying fuel
usage data (in MJ) for each compressor by the IPCC
emission factor for natural gas (0.056 kg CO2eq/MJ).
1 0 . 1 . 2 M O N I T O R I N G B A S E L I N E P A R A M E T E R S
No baseline parameters are monitored. The performance
standard is assumed to be a valid indicator of baseline
emissions for a period of 3 years (see section 10.2.1).
1 0 . 1 . 3 D E S C R I B I N G Q A / Q C M E A S U R E S
• All data will be collected electronically and archived
for 10 years.
• Equipment will be checked and calibrated bi-annually.
1 0 . 2 Q U A N T I F Y I N G G H G R E D U C T I O N S
1 0 . 2 . 1 I D E N T I F Y I N G T H E T I M E P E R I O D O V E R W H I C H G H G
R E D U C T I O N S W I L L B E Q U A N T I F I E D
From the limited global data set on new compressor
stations between 2001 and 2003, it appears that
compressor station efficiency and GHG emissions
performance have been improving and improved notice-
ably in 2003. The gains in efficiency seen in 2003,
however, are not expected to proceed as rapidly in the
near future. Given recent trends and future expectations,
the performance standard is assumed to be valid for a
period of 3 years.
1 0 . 2 . 2 CALCULAT IONS FOR QUANT IFY ING GHG REDUCT IONS
The GHG reductions are calculated as the difference
between the baseline emissions and the project
activity emissions:
GHG Reduction = Baseline emissions
– Project activity emissions
Because secondary effects were considered negligible
(i.e., baseline and project activity emissions associated
with one-time, upstream, and downstream GHG sources
are equivalent), they were not included in the GHG
reduction equation. Therefore, the total GHG reductions
are equal to the change in GHG emissions associated
with reducing fuel consumption by the compressors.
Table E2.4 illustrates the assumptions used for calculat-
ing baseline and project activity emissions. All
compressors operate under the same conditions (i.e.,
load and hours of operation). The GHG project will
install thirty compressors.
Compressor Station GHG Project
EXAMPLE 2116
EX
AM
PL
ES
F I G U R E E 2 . 1 Different stringency levels applied to the compressor data set
kg C
O2e
q/kW
h
MedianMean25th percentile10th percentileMost stringent
1.00
0.90
0.80
0.70
0.60
0.50
0.40
0.30
0.20
0.10
0.00
Stat
ion
R
Stat
ion
N
Stat
ion
Q
Stat
ion
T
Stat
ion
P
Stat
ion
O
Stat
ion
M
Stat
ion
H
Stat
ion
S
Stat
ion
L
Stat
ion
K
Stat
ion
I
Stat
ion
J
Stat
ion
E
Stat
ion
G
Stat
ion
C
Stat
ion
F
Stat
ion
D
Stat
ion
B
Stat
ion
A
jpText_FINAL.qxd 11/22/05 3:51 PM Page 116

EXAMPLE 2: Compressor Station GHG Project 117E
XA
MP
LE
S
T A B L E E 2 . 4 Baseline and project activity emissions
1
2
3
4
5
ASSUMPT ION FACTORS
Power/Max Load (kW)
Operating Hours (hrs/yr)
Load Factor (%)
No. of Compressors
GHG Emission Rate* (kg CO2eq/kWh)
BASEL INE VALUES
70
8,300
80
30
0.65
PROJECT ACT IV I TY VALUES
70
8,300
80
30
0.60
*These figures are rounded; results below were calculated with unrounded numbers.
Baseline emissions for a compressor are expressed by
the performance standard emission rate (0.65 kg
CO2eq/kWh) multiplied by the total kWh of compression
provided (13.9 million kWh, derived from rows 1–4 of
Table E2.4). Project activity emissions are calculated
using the high-efficiency compressor design fuel usage
(10.6 MJ/kWh) multiplied by the IPCC emission factor
for natural gas (0.056 kg CO2eq/MJ) multiplied by the total
kWh of compression provided (also 13.9 million kWh).
jpText_FINAL.qxd 11/22/05 3:51 PM Page 117

Baseline Emissions = (Power load) . (Operating Hours) . (Load Factor) .
(# of Compressors) . (Performance Standard
Emission Rate) / 1,000
=(70) . (8,300) . (80%) . (30) . (0.65)
1,000
= 9,004 t CO2eq/year
Project Activity Emissions =
(Power load) . (Operating Hours) . (Load Factor) .
(# of Compressors) . (Project Activity
Emission Rate) / 1,000
=(70) . (8,300) . (80%) . (30) . (0.60)
1,000
= 8,299 t CO2eq/year
GHG Reductions =Baseline Emissions – Project Activity Emissions
= 9,004 – 8,299
= 705 t CO2eq/year
Actual GHG reductions will be quantified annually using
monitored data, for a period of 3 years.
Compressor Station GHG Project
118
EX
AM
PL
ES
jpText_FINAL.qxd 11/22/05 3:51 PM Page 118

Supplementary InformationA N N E X A Legal Requirements
A N N E X B Illustrative Information Sources for Barrier Categories
A N N E X C Assessing Net Benefits Using Investment Analysis
A N N E X D Glossary
References
Contributors
Part IVjpText_FINAL.qxd 11/22/05 3:51 PM Page 119

Legal requirements are sometimes relevant to determi-
nations about additionality. If laws or regulations require
the use of a certain technology or practice utilized by the
project activity, and using that practice or technology is
the only way to comply with the laws or regulations, then
the project activity will probably not be additional.
Similarly, any baseline candidates that do not comply
with legal requirements will in most cases be rejected as
possibilities for the baseline scenario.
This annex provides guidance on the kinds of informa-
tion that may be needed for assessing the compliance
of the project activity and baseline candidates with
legal requirements.
A.1 Laws and Regulations to ConsiderLaws or regulations may directly affect the GHG emis-
sions of the project activity or a baseline candidate (e.g.,
a stipulated standard requires the use of more energy-
efficient equipment), or may affect GHG emissions
indirectly as a consequence of their implementation (e.g.,
a law that mandates water use reductions may lower the
daily water pumping rate—and thereby energy use—at a
water treatment plant). Both types of laws or regulations
should be considered when assessing if the project activity
or baseline candidates comply with legal requirements.
In certain circumstances, a decision on the relevance of
laws and regulations and/or their interpretation may be
required. The principle of transparency should be used in
making these decisions. Cases where interpretations may
be necessary include:
1. Policy versus regulation/legislation. Some countries
may have a declared policy to promote specific tech-
nologies or practices that result in GHG reductions
(e.g., India’s policy of meeting 10 percent of its power
generation through renewable energy by year 2012),
but do not have any corresponding regulations. Also,
regulations are enforceable by law (with penalty for
non-compliance), whereas a policy is not always
enforceable (and, consequently, there is no penalty for
non-compliance). This distinction is important
because while GHG projects (and therefore the project
activity) may contribute to meeting the policy goals,
legal requirements are not relevant because no
explicit regulation exists to enforce the policy.
2. Clarity of the law or regulation. Where the applica-
bility of a law or regulation is unclear, it may be
necessary to interpret the intent of the law or regula-
tion. For instance, stated technology, performance, or
management standards may be unclear and difficult
to interpret with regard to their relevance to the proj-
ect activity and baseline candidates. Also, laws and
regulations sometimes have conflicting goals. For
instance, a country may have a subsidy for fossil fuel
used for electricity generation, as well as a national
regulation specifying that a certain amount of elec-
tricity generation must come from renewable sources.
The project developer may need to explain the impact
of these two regulations on the development of the
GHG project—e.g., low electricity prices due to the
subsidy on fossil fuels deter the development of renew-
able energy projects, despite a national regulation to
encourage the development of renewable energy.
3. Laws or regulations applying to project activitieswhere the affected sites, facilities, productionsystems, or delivery systems associated withaffected GHG sources or sinks are located in differ-ent regulatory jurisdictions. Where a project activity
and the affected sites, facilities, production systems,
or delivery systems where GHG emissions arise are
located in different jurisdictions, the relevant laws or
regulations to consider are usually those that apply to
the location of the project activity, rather than the
location of the sites where GHG emissions are
affected. However, it may be useful to consider, if
possible, relevant laws in both jurisdictions. For
example, a project activity to reduce electricity use
takes place at a U.S. company in New York; however,
some of the combustion sources feeding the electricity
grid are in Canada. The project developer should
consider both U.S. and Canadian regulations regard-
ing the project activity and explain why certain
regulations may not be applicable.
4. Pending regulations. Where pending regulations may
affect the GHG project or a project activity in the near
future, it may be useful to note their possible impact
and to track their development in the monitoring plan.
Legal Requirements
PA R T I V120
AN
NE
X
A
AjpText_FINAL.qxd 11/22/05 3:51 PM Page 120

A.2 Finding Information on Legal Requirements
Locating information on the relevant legal requirements can
be time consuming. Possible information sources include:
• public documents listing national, regional,
state/provincial, or local mandatory laws, or regula-
tory standards;
• legal texts;
• local lawyers and legal opinions; and
• local regulators or enforcement bodies.
While collecting the information, project developers should
ensure that all information is reliable and verifiable.
A.3 Legal Requirements, Enforcement, and Common Practice
In some cases, determining whether possible baseline
candidates are compliant with legal requirements may
not be useful for identifying a final list of baseline candi-
dates. The enforcement of laws and regulations may be
uneven or weak because of financial and/or administra-
tive constraints on enforcement or regulatory agencies.
For instance, a regulation may have been promulgated at
a national level, but implementation at the provincial or
regional level may be weak. In this case, what is
common practice may become more important than
legal requirements when trying to identify the baseline
candidates. Box A.1 provides some possible sources of
information for establishing enforcement levels and
common practice.
Legal Requirements 121A
NN
EX
A
Land-Use Projects
• Remote sensing
• Aerial photographs
• Surveys, e.g., U.S. Forest Service surveys
• Random spot-checking on the ground (which can be generalized
for the rest of an area). This method is used for forest certification
• Tax records may shed light on a company’s activity in a certain
area, which can then be compared to any existing laws
• Other records in the public domain that reflect certain land-use
activities that do not comport with the law
GHG Emission Reduction Projects
• Regulatory permits to see what companies undertaking similar
activities are required to do. In most countries this should be
public information
• Number of fines administered for not complying with a given law
or regulation
• Surveys of technology penetration or use, compliance action, etc.
• An enforcement agency may acknowledge that certain laws or
regulations are not being enforced or are poorly enforced
• Expert opinions
B O X A . 1 Information sources for establishing enforcement levels and common practice
jpText_FINAL.qxd 11/22/05 3:51 PM Page 121

Following are some possible information sources for the
barrier categories outlined in Chapter 8.
B.1 Financial and BudgetaryType of Information: Financial or budgetary information
(e.g., availability of financing, credit, foreign capital, risk).
Information Sources: Documents prepared by the project
developer, contractors, or project partners in the context
of the proposed project or similar previous projects; offi-
cial planning data; public reports or studies (e.g., baseline
studies for other projects); lending institution reports; and
country-specific laws on foreign investment.
B.2 Technology, Operation, and Maintenance
Type of Information: Locally available fuels, materials,
know-how, technology, and other resources.
Information Sources: Technology inventory lists; indus-
try studies or corporate documents; local
advisors/experts familiar with the local conditions
around the project.
Type of Information: Skill and informational data (e.g.,
training programs, information dissemination mechanisms).
Information Sources: Sector-level reports of bilateral
and multilateral organisations (e.g., Joint
Implementation/Clean Development Mechanism);
National Strategies Studies; public reports or studies
(e.g., baseline studies for other projects); nongovernmen-
tal organisations (NGOs); government sources; local
advisors/experts familiar with local conditions.
B.3 InfrastructureType of Information: Extent of infrastructure (e.g.,
roads for transporting inputs or products, support
companies or personnel for maintaining equipment).
Information Sources: Industry studies or corporate
documents; local advisors/experts familiar with the
local conditions; public reports or studies (e.g., base-
line studies for other projects); infrastructure maps
(e.g., road, railways).
B.4 Market StructureType of Information: Market information (e.g., product
prices, tariffs, import rules, distribution systems).
Information Sources: Industry studies or corporate
documents; local advisors/experts familiar with the local
conditions; public reports or studies (e.g., baseline stud-
ies for other projects).
B.5 Institutional, Social, Cultural, and Political
Type of Information: Institutional, social, cultural, and
political conditions.
Information Sources: NGOs; local advisors/experts
familiar with the local conditions.
B.6 Resource AvailabilityType of Information: Geographic and climatic condi-
tions; availability of natural resources.
Information Sources: Resource maps; NGOs; local advi-
sors/experts familiar with local conditions.
Illustrative Information Sources for Barrier Categories
PA R T I V122
AN
NE
X
B
BjpText_FINAL.qxd 11/22/05 3:51 PM Page 122

For many types of projects, financial returns (those not
related to GHG reductions) will constitute a significant
and tangible form of benefits. Thus, in some cases, devel-
oping a convincing assessment of the relative net benefits
for the baseline scenario alternatives may require some
form of investment analysis.1
Investment analysis seeks to assess in a detailed and
rigorous way one component of the benefits that may
arise from implementing the GHG project or a baseline
candidate—i.e., expected financial returns—without
considering non-revenue benefits, and without accounting
for any identified barriers other than cost. To identify the
baseline scenario, investment analysis excludes any poten-
tial revenues associated with the sale of GHG reductions.
The goal is to determine which of the possible baseline
scenario alternatives has the highest expected financial
benefits—excluding any GHG reduction revenues—and
whether the GHG project or any of the baseline candidates
would be preferable financially to “doing nothing”
(defined as continuing current activities).
There are several methods for conducting investment
analysis, and nearly unlimited levels of detail at which
these methods can be performed. To identify the baseline
scenario, it is generally not necessary to provide a
detailed itemization of expected costs and revenues, as
long as the overall magnitude of identified cost and
revenue streams can be explained. All relevant costs
(capital, operations and maintenance, fuel costs, taxes,
etc.) and revenues (as appropriate) should be reflected in
the analysis.
There are two options for performing an investment
analysis:
• Expected Cost Comparison, and
• Financial Benchmark Comparison
C.1 Expected Cost ComparisonThis option is only used when the continuation of current
activities is not a valid baseline scenario alternative—
i.e., there are insurmountable barriers to continuing
current activities, or continuing current activities is not
a meaningful possibility.
Under this option, the project activity and baseline
candidates are compared on the basis of expected costs,
without considering any potential revenues.2 Expected
costs may be expressed in terms of:
• Present value, or
• Levelized cost per unit of product or service (e.g.,
levelized $/kWh).
Comparing expected costs based on their present value is
only appropriate when the project activity and all baseline
candidates would produce an identical quantity of the
same (identical quality) product or service. If the project
activity and baseline candidates are of different size (e.g.,
power plants of differing capacities), compare costs using
the levelized cost per unit of product or service.
Although baseline candidates are compared to the proj-
ect activity, any investment analysis should evaluate
costs and/or revenues for an entire GHG project, not a
single component project activity. As explained in
Chapter 8 (Box 8.3), this is because the decision to
implement a particular project activity almost always
depends on a decision about implementing the entire
GHG project with which it is associated. In some cases,
it may be difficult or impossible to meaningfully assign
revenues and costs for an entire GHG project to a
specific project activity.
Note: If it is not possible to express costs per unit of
product or service—or project developers otherwise wish
to base a comparison on expected net revenues rather
than expected costs—the GHG project and baseline
candidates may be compared on the basis of their internal
rates of return (IRR). The advantage of this approach is
that it is not necessary to identify and defend a particular
discount rate (see step (e), below). To do a comparison
based on an IRR, follow the steps for doing a Financial
Benchmark Comparison, choosing IRR as the financial
indicator, but ignore any steps for calculating a bench-
mark rate of return and exclude “continuation of current
activities” from the list of baseline scenario alternatives.
An expected cost comparison analysis should consist of
the following basic steps:
a) Identify the Expected Costs. For the GHG project
and each baseline candidate, identify all relevant costs
and classify them according to whether they are: (1)
upfront or ongoing; and (2) fixed or variable. Provide
a further breakdown and itemization of the costs as
desired to enhance the transparency and credibility of
the analysis.
Assessing Net Benefits Using Investment AnalysisA
NN
EX
C
CjpText_FINAL.qxd 11/22/05 3:51 PM Page 123

In theory, taxes should be included as a cost, even though
calculating taxes without any knowledge of revenues is
usually not possible. Therefore, tax costs should be
estimated, and these estimates should be explained.
b) Identify the Time Period. Identify the time period
over which costs will be evaluated. In most cases, this
should correspond to the expected length or lifetime
of the GHG project (not the valid length of the base-
line scenario). The GHG project and all baseline
candidates should be evaluated over the same time
period. (If a particular baseline candidate has an
expected lifetime shorter than the identified time
period, assume that it is replaced with the same tech-
nology or practice at the end of its lifetime, incurring
costs for replacement as appropriate, and that it oper-
ates until the end of the identified time period).
c) Present Costs Numerically. For the GHG project and
each baseline candidate, provide numerical estimates
of the costs in each category. Ongoing costs should be
estimated for discrete time periods (usually one year)
until the end of the time period identified in step (b).
Cost estimates should be fully explained.
d) Assess Cost Uncertainties. For the GHG project and
each baseline candidate, provide a qualitative assess-
ment of the uncertainty associated with the cost
estimates for each cost category identified in step (a).
(These should be the same for the GHG project and all
baseline candidates). For example, ongoing variable
costs may depend largely on the cost of fuel; there-
fore, the degree of uncertainty associated with fuel
cost projections should be characterized. Any associ-
ated uncertainties should not include any risk factors
identified as barriers or reflected in the discount rate
identified in step (e).
e) Identify an Appropriate Discount Rate. Identify an
appropriate discount rate to use for calculating either
the present value of costs or the levelized cost per unit
of service. An appropriate discount rate may be
derived from the same sources that would be used to
derive a benchmark rate of return (see Financial
Benchmark Comparison, step (a)). The discount rate
and how it was chosen should be explained for trans-
parency purposes.
The choice of discount rate is not crucial if it can be
shown that changing the discount rate (e.g., as part of
a sensitivity analysis) does not result in a change in
the relative ranking of expected costs for the GHG
project and all baseline candidates. This could be the
case if the GHG project and all baseline candidates
have similar ratios of upfront to ongoing costs, and no
major differences in the expected timing of ongoing
costs. In such cases, less effort may be required to
justify a particular discount rate.
f) Calculate a (Reasonable) Range of Expected Costsfor the GHG Project and Each Baseline Candidate.Using the discount rate identified in step (e), calculate
reasonable low and high estimates of expected costs—
present value or levelized—by varying numerical cost
estimates according to the degree of associated uncer-
tainty identified in step (d). Estimates of low and high
expected costs should also reflect the effects of differ-
ent discount rate assumptions (if changing the
discount rate could result in a different relative rank-
ing of the GHG project and baseline candidates). All
assumptions used to generate high and low cost esti-
mates should be explained.
Low and high expected cost estimates should not neces-
sarily reflect “best case” and “worst case” outcomes,
as these outcomes may be very unlikely to happen.
Rather, they should reflect a range of outcomes that
are reasonably likely to occur and indicate a reason-
able cost range that reflects the identified levels of
uncertainty in underlying cost drivers (construction
costs, fuel costs, maintenance costs, etc.).
g) Rank the Results. Using the results of step (f), rank
the GHG project and baseline candidates from high-
est to lowest expected cost. (Table C.1 presents one
way to express the ranking results). In general, use
the midpoint of each cost range to decide the appro-
priate rank. This ranking is also from lowest to
highest net benefits.
O P T I O N A L : S E N S I T I V I T Y A N A LY S I SIn cases where a clear ranking of baseline scenario
alternatives using low and high estimates is difficult, it
may be desirable to conduct a full sensitivity analysis of
expected costs. A sensitivity analysis tests the robust-
ness of the results from the expected cost analysis by
varying any external parameters or assumptions that
are not in the project developer’s control (such as input
costs), and key decision-making parameters (such as
the discount rate). Sensitivity analyses can be
124
AN
NE
X
CAssessing Net Benefits Using Investment Analysis
jpText_FINAL.qxd 11/22/05 3:51 PM Page 124

performed with most financial analysis tools with mini-
mal extra effort. Realistic deviations for assumptions
should be used to test if the ranking of baseline
scenario alternatives changes as common assumptions
change. Choose the ranking that corresponds to the
best set of realistic assumptions, and explain why this
set of assumptions was chosen.
C.2 Financial Benchmark ComparisonA financial benchmark comparison is performed in cases
where the continuation of current activities is a valid
baseline scenario alternative. In these cases, a bench-
mark is identified that represents the benefits
decision-makers would expect to realise (e.g., from
alternative investments) if they did not invest in the
GHG project or any of the baseline candidates. This is
usually done by specifying some form of required rate
of return for an investment.3
A financial benchmark comparison involves an assess-
ment of both expected costs and expected revenues for
the GHG project and all baseline candidates (unless a
“unit cost of service” benchmark is used, as described
below). Under this option, financial returns for the GHG
project and baseline candidates are compared with each
other and with the benchmark rate of return to deter-
mine a relative ranking of baseline scenario alternatives
with respect to net benefits.
A financial benchmark comparison should consist of the
following basic steps:
a) Identify a Benchmark Rate of Return. A benchmark
rate of return is required to assess the GHG project
and baseline candidates against the possible continua-
tion of current activities. Generally speaking, the
benchmark rate of return should reflect standard
returns in the market to which the GHG project is
providing products or services, considering specific
risks for that market and technology sector. It should
not reflect the subjective profitability expectation or
risk profile of a particular project developer, or risks
specific to the GHG project or a particular baseline
candidate. The latter types of risk should instead be
identified as “financial and budgetary” barriers in the
comparative assessment of barriers step of the proj-
ect-specific procedure (Chapter 8). The choice of
benchmark rate of return should be explained for
transparency purposes. Some possible sources for
benchmark rate of return are listed below:4
• Government bond rates, increased by a suitable risk
premium to reflect private investment and/or the
GHG project type, as substantiated by an independ-
ent (financial) expert.
• Estimates of the cost of financing and required
return on capital (e.g., commercial lending rates
and guarantees required for the country and the
type of project represented by the GHG project).
These estimates should be based on bankers’ views
and private equity investors’ or funds’ required
return on investment for comparable projects.
• A company internal benchmark (weighted average
capital cost of the company), if the company is the
sole project developer (e.g., when the GHG project
upgrades or retrofits an existing process). The proj-
ect developer should demonstrate that this
Assessing Net Benefits Using Investment Analysis 125A
NN
EX
C
T A B L E C . 1 Example of results from expected cost comparison
B A S E L I N E S C E N A R I OA LT E R N AT I V E S
Baseline Candidate 3
Continuation of Current Activities
GHG project*
Baseline Candidate 2
Baseline Candidate 1
P R E S E N T VA L U E O FE X P E C T E D C O S T S
$25-$40 million
N/A
$20-$30 million
$15-$22 million
$8-$17 million
EXPECTED COST RANK
1
N/A
2
3
4
RELATIVE RANKING
Lowest Net Benefits
N/A
Low Net Benefits
Middle Net Benefits
Greatest Net Benefits
*Investment analysis evaluates costs/revenues for the entire GHG project, not individual project activities.
jpText_FINAL.qxd 11/22/05 3:51 PM Page 125

benchmark has been consistently used in the past—
i.e., that projects under similar conditions developed
by the same company used the same benchmark.
b) Choose an Appropriate Financial Return Indicator.Choose a financial indicator with which to character-
ize the returns of the GHG project and baseline
candidates, explain the choice, and compare the
returns to the continuation of current activities. The
appropriate type of financial return indicator may
depend on the type of GHG project and conventions
within its technology sector. Some common indicators
and qualifications on their use for investment compar-
isons are provided below.5
• Internal Rate of Return (IRR). The IRR is an
intrinsic rate of return for the GHG project or base-
line candidate based on expected cost and revenue
streams. The higher the IRR, the more desirable the
GHG project or baseline candidate will be as an
investment. Calculated IRRs must be compared to
the benchmark rate of return identified in step (a)
to determine whether a particular baseline candi-
date (or the GHG project) will have positive or
negative net financial benefits. Any baseline candi-
date with an IRR lower than the benchmark rate of
return (even if the IRR is positive) will, in effect,
have negative net financial benefits relative to the
continuation of current activities.
• Net Present Value (NPV). The NPV expresses
future streams of costs and revenues as a single net
amount of current dollars relative to the opportu-
nity cost of investment, as represented by the
benchmark rate of return. A negative NPV means
that a baseline candidate would have negative net
financial benefits relative to the continuation of
current activities, while a positive NPV indicates
positive net financial benefits. However, NPV can
only be used to validly compare the GHG project
and baseline candidates to each other if they are all
of identical size or capacity and will produce identi-
cal quantities of a product or service. NPV is not
used as a basis for comparison if the GHG project
and baseline candidates are of different sizes or
capacities (e.g., if the GHG project is a 100-MW
natural gas power plant and one of the baseline
candidates is a 500-MW coal plant).
• Cost-Benefit Ratio. A cost-benefit ratio calculates
the present value of costs and revenues separately
and expresses the results as a ratio. The benchmark
rate of return is used as the discount rate to deter-
mine present value. A positive cost-benefit ratio
means that a baseline candidate would be expected
to have negative net financial benefits relative to
continuing current activities. Cost-benefit ratios
may be used to compare and rank the GHG project
and baseline candidates, regardless of their relative
sizes and capacities.
• Unit Cost of Service. The unit cost of service indi-
cator is a levelized cost per unit of product or
service produced by the GHG project and baseline
candidates (e.g., levelized $/kWh or levelized
$/Gigajoule). The benchmark rate of return is used
to calculate expected levelized costs for the GHG
project and baseline candidates. Expected revenues
are not included in this calculation. However, use of
this type of financial indicator requires identifying a
second benchmark: a benchmark unit cost of service
to which the levelized unit costs of the GHG project
and baseline candidate may be compared. This
second benchmark, in effect, proxies for expected
revenues. Baseline candidates with a lower expected
unit cost than the benchmark will have positive net
benefits relative to the continuation of current
activities. Expected unit costs may be used to rank
baseline candidates and the GHG project against
each other. There may be several ways to specify a
benchmark unit cost of service. Standard methods
would include the use of historical or projected
market prices, or an analysis of long-run marginal
costs for the product or service produced by the
GHG project and baseline candidates.
c) Identify the Expected Costs. Identify all relevant
costs and classify them according to whether they are:
(1) upfront or ongoing, and (2) fixed or variable.
Provide further breakdown and itemization of costs as
desired to enhance the transparency and credibility of
the analysis.
d) Identify the Expected Revenues. For the GHG proj-
ect and each baseline candidate, identify all sources
of revenue (other than any revenues that may arise
from the GHG reductions themselves—e.g., tradable
credit revenues).
126
AN
NE
X
CAssessing Net Benefits Using Investment Analysis
jpText_FINAL.qxd 11/22/05 3:51 PM Page 126
e) Identify the Time Period. Identify the time period
over which costs and revenues will be evaluated. In
most cases, this period should correspond to the
expected length or lifetime of the GHG project. The
GHG project and all baseline candidates should be
evaluated over the same time period. (If a particular
baseline candidate has an expected lifetime shorter
than the identified time period, assume that it is
replaced with the same technology or practice at the
end of its lifetime, incurring costs for replacement as
appropriate, and that it operates until the end of the
identified period).
f) Estimate Costs and Revenues Numerically. For the
GHG project and each baseline candidate, provide
numerical estimates of the costs and revenues in each
identified category. Ongoing costs and revenues should
be estimated for discrete time periods (usually one
year) until the end of the time period identified in step
(e). Cost and revenue estimates should be explained.
g) Assess the Cost and Revenue Uncertainties. For the
GHG project and each baseline candidate, provide a
qualitative assessment of the uncertainty associated
with the cost and revenue estimates for each cost
category. For example, ongoing variable costs may
depend largely on the cost of fuel; the degree of uncer-
tainty associated with fuel cost projections should
therefore be characterized. Any associated uncertain-
ties should not include any risk factors identified as
barriers or reflected in the benchmark rate of return
identified in step (a).
h) Calculate a (Reasonable) Range of ExpectedFinancial Returns for the GHG Project and EachBaseline Candidate. Using the financial return indi-
cator identified in step (b), calculate reasonable low
and high estimates of expected returns (or expected
levelized unit costs if using the unit cost of service
indicator). Calculate this range by varying numerical
cost and revenue estimates according to the degree of
associated uncertainty identified in step (g). Explain
all assumptions used to generate high and low finan-
cial return/unit cost estimates.
Low and high expected financial return/unit cost
estimates should not necessarily reflect “best case”
and “worst case” outcomes, as these outcomes may
be unlikely to happen. Rather, they should reflect a
range of outcomes that are reasonably likely to
occur and indicate a reasonable range that reflects
the identified levels of uncertainty in underlying cost
and revenue drivers.
i) Examine Sensitivity to Benchmark Assumptions.If the IRR is not being used as the financial indicator,
examine the sensitivity of the results in step (h) to
changes in the benchmark rate of return. As appropri-
ate, adjust the ranges identified in step (h) based on
the results for a reasonable range of benchmark rates
of return. Describe the overall degree of sensitivity to
these changes in the benchmark rate of return, and
explain the range of benchmark rates of return used to
adjust the results in step (h).
j) Rank the Results for the GHG Project and BaselineCandidates. Using the results of step (h), rank the
GHG project and baseline candidates from lowest to
highest expected returns (IRR, NPV, or Cost-Benefit
Ratio), or highest to lowest expected unit cost (Unit
Cost of Service). In general, use the midpoint of each
cost range to decide the appropriate rank. Include the
continuation of current activities in the ranking. The
appropriate value for the relative net benefits of
continuing current activities will depend on the chosen
financial return indicator, as shown in Table C.2.
Assessing Net Benefits Using Investment Analysis 127A
NN
EX
C
T A B L E C . 2 Relationship between financial return indicator and value for continuation of current activities
F I N A N C I A L R E T U R N I N D I C AT O R
IRR
NPV
Cost-Benefit Ratio
Unit Cost of Service
VA L U E F O R C O N T I N U AT I O N O F C U R R E N T A C T I V I T I E S
Benchmark Rate of Return (+/-)
$0
1
Benchmark Unit Cost of Service (+/-)
jpText_FINAL.qxd 11/22/05 3:51 PM Page 127

Examples of how to present the possible final rankings in
a matrix format are provided in Tables C.3 through C.6.
Other presentation formats may also be used.
O P T I O N A L : S E N S I T I V I T Y A N A LY S I SIn cases where a clear ranking of baseline scenario
alternatives using low and high estimates is difficult, it
may be desirable to conduct a full sensitivity analysis of
financial benchmark results. A sensitivity analysis tests
the robustness of the results by varying any external
Assessing Net Benefits Using Investment Analysis
128
AN
NE
X
C T A B L E C . 3 Example of results from financial benchmark comparison: IRR
BASEL INE SCENARIO ALTERNAT IVES
Baseline Candidate 3
Continuation of Current Activities
GHG project
Baseline Candidate 2
Baseline Candidate 1
IRR
2 – 5%
9 – 11%*
10 – 12%
13 – 17%
17 – 30%
NET BENEF ITS
Negative
Zero
Slightly Positive
Positive
Large Net Benefits
RELAT IVE RANK ING
Lowest Benefits
Low Benefits
Low Benefits
Medium Benefits
Highest Benefits
*Identified range for benchmark rate of return
T A B L E C . 4 Example of results from financial benchmark comparison: NPV
BASEL INE SCENARIO ALTERNAT IVES
Baseline Candidate 3
Continuation of Current Activities
GHG project
Baseline Candidate 2
Baseline Candidate 1
NPV
-$3 to -$1 million
$0*
-$1 to $4 million
$4 to $7 million
$9 to $10 million
NET BENEF ITS
Negative
Zero
Slightly Positive
Positive
Large Net Benefits
RELAT IVE RANK ING
Lowest Benefits
Low Benefits
Low Benefits
Medium Benefits
Highest Benefits
*NPV is defined as zero for continuing current activities for all sensitivity scenarios.
T A B L E C . 5 Example of results from financial benchmark comparison: cost-benefit ratio
BASEL INE SCENARIO ALTERNAT IVES
Baseline Candidate 3
Continuation of Current Activities
GHG project
Baseline Candidate 2
Baseline Candidate 1
COST-BENEF IT RAT IO
1.2 – 1.5
1*
0.8 – 1.1
0.6 – 0.9
0.2 – 0.5
NET BENEF ITS
Negative
Zero
Slightly Positive
Positive
Large Net Benefits
RELAT IVE RANK ING
Lowest Benefits
Low Benefits
Low Benefits
Medium Benefits
Highest Benefits
*Cost-benefit ratio is defined as 1 for continuing current activities for all sensitivity scenarios.
jpText_FINAL.qxd 11/22/05 3:51 PM Page 128

parameters or assumptions that are not in the project
developer’s control (such as input costs and output
prices), and key decision-making parameters (such
as the discount rate). Sensitivity analyses can be
performed with most financial analysis tools with
minimal extra effort. Realistic deviations for the
assumptions should be used to test if the ranking of
baseline scenario alternatives changes as common
assumptions change. Choose the ranking that corre-
sponds to the best set of realistic assumptions, and
explain why this set of assumptions was chosen.
NOTES1 Investment analysis may not be required or appropriate for GHG projects
where the primary non-GHG benefits to decision-makers are not financial.
2 In other words, this option is analogous to a cost-effectiveness analysis.
3 The required rate of return essentially represents the “opportunity cost” of an
investment. In the very broadest terms, it represents the return decision-
makers could expect if they put their money into a standard set of investment
options unrelated to the GHG project or any of the baseline candidates.
4 From the CDM “Tool for the Demonstration and Assessment of Additionality,” EB
16 Report Annex 1, United Nations Framework Convention on Climate Change.
5 In some cases, examining more than one indicator will provide greater
insight into the relative ranking of baseline scenario alternatives from a
decision-maker’s perspective. For example, if two baseline candidates have
very similar IRRs, the one with the higher expected NPV (if there is one) will
generally be preferred.
Assessing Net Benefits Using Investment Analysis 129A
NN
EX
C
T A B L E C . 6 Example of results from financial benchmark comparison: unit cost of service
BASEL INE SCENARIO ALTERNAT IVES
Baseline Candidate 3
Continuation of Current Activities
GHG project
Baseline Candidate 2
Baseline Candidate 1
UNIT COST OF SERVICE (e.g., $/KWH)
$0.09 - $0.12
$0.03 - $0.05*
$0.03 - $0.04
$0.025 - $0.035
$0.02 - $0.025
NET BENEF ITS
Negative
Zero
Slightly Positive
Positive
Large Positive
RELAT IVE RANK ING
Lowest Benefits
Low Benefits
Low Benefits
Medium Benefits
Highest Benefits
*Identified range for benchmark unit cost of service
Lynn Betts, Natural Resources Conservation Service
jpText_FINAL.qxd 11/22/05 3:51 PM Page 129

Glossary
PA R T I V130
AN
NE
X
D
Additionality A criterion often applied to GHG projects, stipulating that project-based GHG reductions should only bequantified if the project activity “would not have happened anyway”—i.e., that the project activity (orthe same technologies or practices it employs) would not have been implemented in its baselinescenario and/or that project activity emissions are lower than baseline emissions.
Allowances The basic tradable commodity within GHG emission trading systems. Allowances grant their holder theright to emit a specific quantity of pollution once (e.g., one tonne of CO2eq). The total quantity ofallowances issued by regulators dictates the total quantity of emissions possible under the system. Atthe end of each compliance period, each regulated entity must surrender sufficient allowances to covertheir GHG emissions during that period.
Barriers Any factor or consideration that would (significantly) discourage a decision to try to implement theproject activity or its baseline candidates.
Base Year A historic datum (a specific year or an average over multiple years) for tracking corporate GHG emissions over time. This term applies only to corporate or entity-wide GHG accounting, not to project-based GHG accounting.
Base Year Emissions GHG emissions in the base year. This term applies only to corporate or entity-wide GHG accounting, notto project-based GHG accounting.
Baseline Candidates Alternative technologies or practices within a specified geographic area and temporal range that couldprovide the same product or service as the project activity.
Baseline Emissions An estimate of GHG emissions, removals, or storage associated with a baseline scenario or derivedusing a performance standard (see baseline procedures).
Baseline Parameter Any parameter whose value or status can be monitored in order to validate assumptions about base-line emissions estimates or to help estimate baseline emissions.
Baseline Procedures Methods used to estimate baseline emissions. The Project Protocol presents two optional procedures:the project-specific procedure and the performance standard procedure.
Baseline Scenario A hypothetical description of what would have most likely occurred in the absence of any considera-tions about climate change mitigation.
Benefits The benefits that would be expected to accrue to decision-makers involved with the activities in eachbaseline scenario alternative, excluding all potential benefits resulting from GHG reductions.
Carbon Dioxide Equivalent The universal unit of measurement used to indicate the global warming potential of greenhouse gases. (CO2eq) It is used to evaluate the impacts of releasing (or avoiding the release of) different greenhouse gases.
Carbon Stock The absolute quantity of carbon held within a GHG sink at a specified time (see GHG sink).
Common Practice The predominant technology(ies) implemented or practice(s) undertaken in a particular region or sector.
Decision-Makers Any parties who might be involved in the decision to implement a project activity or one of its baselinecandidates. In most cases, the project developer will be the sole “decision-maker” with respect to theproject activity. However, other parties could be the “decision-makers” for baseline candidates.
Direct GHG Emissions Emissions or removals from GHG sources or sinks that are owned or controlled by the project developer.
Dynamic Baseline Emissions Baseline emission estimates that change over the valid time length of the baseline scenario. Dynamicbaseline emissions are often estimated for land-use and forestry projects.
DjpText_FINAL.qxd 11/22/05 3:51 PM Page 130

Emission Factor A factor relating GHG emissions to a level of activity or a certain quantity of inputs or products or serv-ices (e.g., tonnes of fuel consumed, or units of a product). For example, an electricity emission factor iscommonly expressed as t CO2eq/megawatt-hour.
Fuel Switching Using an alternative fuel (usually of lower carbon intensity) to produce required energy.
Geographic Area A physical area that helps define the final list of baseline candidates. The area can be defined by anumber of factors including sociocultural, economic, or legal factors; the availability of necessaryphysical infrastructure; and/or biophysical characteristics.
GHG Assessment Boundary Encompasses all primary effects and significant secondary effects associated with the GHG project.Where the GHG project involves more than one project activity, the primary and significant secondaryeffects from all project activities are included in the GHG assessment boundary.
GHG Emissions GHGs released into the atmosphere.
GHG Program A generic term for: (1) any voluntary or mandatory, government or non-government initiative, system,or program that registers, certifies, or regulates GHG emissions; or (2) any authorities responsible fordeveloping or administering such initiatives, systems, or programs.
GHG Project A specific activity or set of activities intended to reduce GHG emissions, increase the storage ofcarbon, or enhance GHG removals from the atmosphere. A GHG project may be a stand-alone project,or a component of a larger non-GHG project.
GHG Protocol Initiative A multi-stakeholder partnership of businesses, nongovernmental organisations, governments, (GHG Protocol) academics, and others convened by the World Business Council for Sustainable Development and the
World Resources Institute to design and develop internationally accepted GHG accounting and report-ing standards and/or protocols, and to promote their broad adoption.
GHG Reductions A decrease in GHG emissions or an increase in removal or storage of GHGs from the atmosphere, rela-tive to baseline emissions. Primary effects will result in GHG reductions, as will some secondaryeffects. A project activity’s total GHG reductions are quantified as the sum of its associated primaryeffect(s) and any significant secondary effects (which may involve decreases or countervailingincreases in GHG emissions). A GHG project’s total GHG reductions are quantified as the sum of theGHG reductions from each project activity.
GHG Sink Any process that removes GHG emissions from the atmosphere and stores them.
GHG Source Any process that releases GHG emissions into the atmosphere.
Greenhouse Gases (GHGs) Greenhouse gases are gases that absorb and emit radiation at specific wavelengths within the spec-trum of infrared radiation emitted by the Earth’s surface, the atmosphere, and clouds. The six mainGHGs whose emissions are human-caused are: carbon dioxide (CO2); methane (CH4); nitrous oxide(N2O); hydrofluorocarbons (HFCs); perfluorocarbons (PFCs); and sulphur hexafluoride (SF6).
Indirect GHG Emissions Emissions or removals that are a consequence of a project activity, but occur at GHG sources or sinksnot owned or controlled by the project developer.
Legal Requirements Any mandatory laws or regulations that directly or indirectly affect GHG emissions associated with aproject activity or its baseline candidates, and that require technical, performance, or managementactions. Legal requirements may involve the use of a specific technology (e.g., gas turbines instead of diesel generators), meeting a certain standard of performance (e.g., fuel efficiency standards forvehicles), or managing operations according to a certain set of criteria or practices (e.g., forestmanagement practices).
Glossary 131A
NN
EX
D
jpText_FINAL.qxd 11/22/05 3:51 PM Page 131

Market Response The response of alternative providers or users of an input or product to a change in market supply ordemand caused by the project activity.
One-Time Effects Secondary effects related to the construction, installation, and establishment or the decommissioningand termination of the project activity.
Performance Metric A rate that relates the level of consumption of relevant inputs to the level of production for differentbaseline candidates, or that relates GHG emissions to the size or capacity of different baseline candi-dates. Performance metrics are used in developing performance standards.
Performance Standard A GHG emission rate used to determine baseline emissions for a particular type of project activity. Aperformance standard may be used to estimate baseline emissions for any number of similar projectactivities in the same geographic area.
Performance A baseline procedure that estimates baseline emissions using a GHG emission rate derived from a Standard Procedure numerical analysis of the GHG emission rates of all baseline candidates. A performance standard is
sometimes referred to as a multi-project baseline or benchmark, because it can be used to estimatebaseline emissions for multiple project activities of the same type.
Primary Effect The intended change caused by a project activity in GHG emissions, removals, or storage associatedwith a GHG source or sink. Each project activity will generally have only one primary effect.
Production-Based A performance standard defined as a rate of GHG emissions per unit of a product or service produced Performance Standard by all identified baseline candidates. This type of performance standard will generally apply to energy
efficiency, energy generation, and industrial process project activities.
Project See GHG project.
Project Activity A specific action or intervention targeted at changing GHG emissions, removals, or storage. It mayinclude modifications or alterations to existing production, process, consumption, service, or manage-ment systems, as well as the introduction of new systems.
Project Developer A person, company, or organisation developing a GHG project.
Project-Specific Procedure A baseline procedure that estimates baseline emissions through the identification of a baselinescenario specific to the proposed project activity.
Relevant Input Any kind of material or energy that is: (1) required to produce the product or service common to allbaseline candidates, and (2) related to the project activity’s primary effect.
Retrofit Project Any GHG project that involves modifying existing equipment, or replacing existing equipment with newparts, devices, or systems.
Secondary Effect An unintended change caused by a project activity in GHG emissions, removals, or storage associatedwith a GHG source or sink. Secondary effects may be “positive” (i.e., resulting in GHG reductions) or “negative” (i.e., resulting in GHG emissions).
Sequestration The uptake and storage of CO2, which can be sequestered by plants or in underground or deep-sea reservoirs.
Static Baseline Emissions Baseline emission estimates that do not change over the valid time length of the baseline scenario.
Glossary
132
AN
NE
X
D
jpText_FINAL.qxd 11/22/05 3:51 PM Page 132

Stringency Level A GHG emission rate that is more restrictive than the average GHG emission rate of all baseline candi-dates. Stringency levels may be specified as a GHG emission rate corresponding to a certain percentile(better than the 50th percentile) or to the lowest-emitting baseline candidate. Stringency levels aredefined in the course of developing a performance standard.
Temporal Range A contiguous time period that helps define the final list of baseline candidates. The temporal rangecan be defined by a number of factors, such as the dominance of a single technology for an extendedperiod of time, the diversity of options in a sector or region, and/or a discrete change in an area’s or aregion’s policy, technology, practice, or resource.
Time-Based A performance standard defined as a rate of GHG emissions per unit of time and unit of size or Performance Standard capacity of the baseline candidates. This type of performance standard will generally apply to
project activities involving storage or removals of CO2 by biological processes, fugitive emissionsand waste emissions.
Upstream/Downstream Effects Secondary effects associated with the inputs used (upstream) or the products produced (downstream)by a project activity.
Valid Time Length The time period over which baseline emission estimates, derived from a baseline scenario or for the Baseline Scenario performance standard, are considered valid for the purpose of quantifying GHG reductions. Once the
valid time length for the baseline scenario expires, either no further GHG reductions are recognized forthe project activity, or a new (revised) baseline scenario or performance standard must be identified.
Glossary 133A
NN
EX
D
Courtesy of World Bank
jpText_FINAL.qxd 11/22/05 3:52 PM Page 133

General ReferencesAulisi, A., A.E. Farrell, J. Pershing, and S. Vandeveer. 2005.Greenhouse Gas Emissions Trading in U.S. States: Observationsand Lessons from the OTC NOx Budget Program. World ResourcesInstitute White Paper, January 2005.
Australian Greenhouse Office. http://www.greenhouse.gov.au.
Bode, J., J. de Beer, K. Blok, and J. Ellis. 2000. An Initial View onMethodologies for Emission Baselines: Iron and Steel Case Study.OECD and IEA Information Paper, June 2000.
Baseline Protection Initiative. 2002. Baseline ProtectionInitiative—Reference Manual. National Climate Change Process,Government of Canada, April 2002.
Bosi, M. 2000. An Initial View on Methodologies for EmissionBaselines: Electricity Generation Case Study. OECD and IEAInformation Paper, June 2000.
BP and PricewaterhouseCoopers. 2000. Credit Based EmissionsReduction Projects: Learning Through Practical Engagement.
CDM Executive Board Report 16. 2004. Annex 1: Tool for theDemonstration and Assessment of Additionality. UNFCCC.
Center for Sustainable Development in the Americas. 2002.“Climate Change Glossary.” http://www.csdanet.org/English/publications/glossary.htm#C.
Chomitz, K. 2002. “Baseline, Leakage and Measurement Issues: HowDo Forestry and Energy Projects Compare?” Climate Policy, 2: 35-49.
CMS Cameron McKenna. 2002. “Climate Change Jargon Buster.”www.law-now.com.
CO2e.com. 2001. “Glossary.” http://www.CO2e.com/common/glossary.asp#C.
Government of Canada. 2002. Climate Change Technology EarlyAction Measures (TEAM: System of Measurement and Reportingto TEAM (SMART). December 2002.
Greenhouse Gas Emissions Reduction Trading Pilot (GERT).http://www.gert.org.
Hargrave, T., N. Helme, and I. Puhl. 1998. Options for SimplifyingBaseline Setting for Joint Implementation and Clean DevelopmentMechanism Projects. Center for Clean Air Policy, November 1998.
Harrison, D., S. Schatzki, T. Wilson, and E. Haites. 2000. CriticalIssues in International Greenhouse Gas Emissions Trading:Setting Baselines for Credit-Based Trading Programs—LessonsLearned from Relevant Experience. Electric Power ResearchInstitute, December 2000.
Houghton, J.T., Meira Filho, L.G., Lim, B., Treanton, K., Mamaty, I.,Bonduki, Y., Griggs, D.J., and Callander, B.A. 1997. Revised 1996Guidelines for National Greenhouse Gas Inventories. IPCC/OECD/IEA.
International Emissions Trading Association. 2001. Carbon ContractsCornerstone: Drafting Contracts for the Sale of Project BasedEmission Reductions. Discussion Paper No. 02-01, Version 1.2.
International Organization for Standardization (ISO) FDIS/14064-2: Greenhouse gases—Specification with guidance at the projectlevel for quantification, monitoring and reporting of greenhousegas emission reductions or removal enhancements. Expected forpublication in 2006.
Japanese Ministry of Environment. 2001. Technical Procedures forCDM/JI Projects at the Planning Stage. October 2001.
Kelly, C. 1999. Developing the Rules for Determining Baselineand Additionality for the Clean Development Mechanism:Recommendations to the UNFCCC. Center for Clean Air Policy,Prepared for the UNFCCC Technical Workshop, April 1999.
Lazarus, M., S. Kartha, and S. Bernow. 2001. Project Baselinesand Boundaries for Project-Based GHG Emission ReductionTrading. Tellus Institute, A Report to the Greenhouse Gas EmissionTrading Pilot Program, April 2001.
Matsuo, N. 2001. Baseline Development for Project-BasedInstruments. Institute for Global Environmental Strategies,PowerPoint presentation, September 2001.
Matsuo, N. 2000. Proposal for Step-by-Step Baseline Standardizationfor CDM—From Project-Specific to Generalized Formula. Version 3,Institute for Global Environmental Strategies, August 2000.
Matsuo, N. 1999. Baseline as the Critical Issue of CDM—Possible Pathway to Standardization. Global Industrial and SocialProgress Research Institute and Institute for Global EnvironmentalStrategies, Prepared for presentation at Workshop on Baselines forthe CDM, February 25–26, 1999, Tokyo, Japan.
McNeill, R. 2002. The GERT Experience with the Surplus Criterion.GERT, July 2002.
References
PA R T I V134
jpText_FINAL.qxd 11/22/05 3:52 PM Page 134

New South Wales Greenhouse Gas Abatement Scheme.http://www.greenhousegas.nsw.gov.au.
Probase. 2003. Procedures for Accounting and Baselines for JIand CDM Projects. EU Fifth Framework Programme, JointImplementation Network, The Netherlands.
Prototype Carbon Fund. 2001. PCF Approaches to Additionality,Baselines, Validation and Verification. PCF Training Workshop,The World Bank, November 2001.
Prototype Carbon Fund. 2001. Prototype Carbon Fund AnnualReport 2001. The World Bank.
Rogers, E.M. 1995. Diffusion of Innovations. Fourth Edition, Simonand Schuster, New York, New York, February 1995.
Rolfe, C., R. Hornung, A. Pape, W. Bell, and J. Hull. 2000. GERTExploration of Methodological and Project-by-Project Approachesto Additionality. A Greenhouse Gas Emission Reduction TradingMember Document, August 2000.
Rosenqvist, A., A. Milne, R. Lucas, M. Imhoff, and C. Dobsone.2003. “A Review of Remote Sensing Technology in Support of theKyoto Protocol.” Environmental Science and Policy, 6 (5), 441–55.
Spalding-Fecher, R. 2002. The CDM Guidebook: The CleanDevelopment Mechanism of the Kyoto Protocol—A Guidebook forProject Developers in Southern Africa. Energy and DevelopmentResearch Centre, University of Cape Town, First Electronic Edition,May 2002.
Tipper, R., and B.H. de Jong. 1998. “Quantification and Regulationof Carbon Offsets from Forestry: Comparison of AlternativeMethodologies, with Special Reference to Chiapas, Mexico.”Commonwealth Forestry Review, 77 (3), 21928.
United Nations Framework Convention on Climate Change.http://unfccc.int.
United States Environmental Protection Agency. 2001. “GlobalWarming Glossary.” http://www.epa.gov/globalwarming/glossary.html.
Violette, D., C. Mudd, and M. Keneipp. 2000. An Initial View onMethodologies for Emission Baselines: Energy Efficiency CaseStudy. OECD and IEA Information Paper, June 2000.
Winkler, H., S. Thorne. 2002. “Baselines for Suppressed Demand:CDM Projects Contribution to Poverty Alleviation.” South AfricanJournal of Economic and Management Sciences, 5 (2), June 2002.
World Resources Institute (WRI) and World Business Council forSustainable Development. 2004. The Greenhouse Gas Protocol: ACorporate Accounting and Reporting Standard, revised edition.WRI/WBCSD, Washington D.C.
WBCSD. 2000. Clean Development Mechanism: Towards a Blueprint.WBCSD, October 2000.
Chapter 5: Defining the GHG Assessment Boundary
Aukland, L., P. Moura Costa, and S. Brown. 2002. “A ConceptualFramework and Its Application for Addressing Leakage: The Caseof Avoided Deforestation.” Climate Policy, 94 1–15. ElsevierScience Ltd.
Murray, B.C., B.A. McCarl, and H. Lee. 2004. “Estimating Leakagefrom Forest Carbon Sequestration Programs.” Land Economics,February 2004.
Niles, J.O., S. Browns, J. Pretty, A.S. Ball, and J. Fay. 2002.Potential Carbon Mitigation and Income in Developing Countriesfrom Changes in Use and Management of Agricultural and ForestLands. Draft prepared for The Nature Conservancy.
Schwarze, R., J.O. Niles, and J. Olander. 2002. “Understanding and Managing Leakage in Forest-Based Greenhouse-Gas-Mitigation Projects.” Philosophical Transactions of the RoyalSociety, August 2002.
Wear, D.N., and B.C. Murray. 2004. “Federal Timber Restrictions,Interregional Spillovers, and the Impact on U.S. SoftwoodMarkets.” Journal of Environmental Economics and Management,47 (2), 307–30.
Chapter 7: Identifying the Baseline Candidates
Murtishaw, S., J. Sathaye, and M. Lefranc. 2005. “SpatialBoundaries and Temporal Periods for Setting Greenhouse GasPerformance Standards.” Energy Policy (in press).
References 135
jpText_FINAL.qxd 11/22/05 3:52 PM Page 135
Chapter 8: Estimating Baseline Emissions—Project-Specific Procedure
Embree, S. and I. Puhl. 1999. Operationalizing AdditionalityReference for Project Developers. Learning from the Experience ofSweden, the USA and the World Bank Programs. GERT, May 1999.
Ploutakhina, M., I. Puhl, and S. Hotimsky. 2001. Capacity-Buildingfor CDM Projects in Industry: Development of OperationalGuidelines and Decision-Support Tools for Baseline Studies forGHG Emissions Reduction Projects in the Industrial Sector.Presented at a special event by UNIDO in cooperation with MRI atCOP7, Marrakech, Morocco, November 9, 2001.
United Nations Industrial Development Organization. 2003.Baseline Guidance: Guideline Document Final Edition V 1.0, July10th 2003.
Chapter 9: Estimating Baseline Emissions—Performance Standard Procedure
Dunmire, C., M. Lazarus, S. Kartha, and S. Bernow. 1999.Evaluation of Benchmarking as an Approach for EstablishingClean Development Mechanism Baselines. Tellus Institute andStratus Consulting, October 1999.
Ellis, J., and M. Bosi. 1999. Options for Project EmissionBaselines. OECD and IEA Information Paper, October 1999.
Kartha, S., M. Lazarus, and M. Bosi. 2002. Practical BaselineRecommendations for Greenhouse Gas Mitigation Projects in theElectric Power Sector. OECD and IEA Information Paper, May 2002.
Kerr, T., R. Morgan, J. Haydel, and B. Thapa. 2002. AverageDisplaced Emissions Rate (ADER): Approach and Methodology.U.S. EPA and ICF Consulting.
Kolar, S., E. Levina, E. Williams, and K. Lawson. 2001. Multi-Project Baselines for Joint Implementation Projects in Poland.Center for Clean Air Policy, January 2001.
Lawson, K., S. Kolar, and C. Kelly. 2000. A Regional Approach toDeveloping Multi-Project Baselines for the Power Sector. Centerfor Clean Air Policy (CCAP), November 2000.
Lazarus, M., S. Kartha, and S. Bernow. 2000. Key Issues inBenchmark Baselines for the CDM: Aggregation, Stringency,Cohorts, and Updating. Tellus Institute, June 2000.
Lazarus, M. and M. Oven. 2001. Crediting GHG EmissionsReductions from Electricity Projects: International Experienceand Practical Options. ATPAE/USAID.
Liu, D., and P. Rogers. 2000. “Baseline Determination forGreenhouse Gas Abatement.” In: Ghosh, P. (Ed.). Implementationof the Kyoto Protocol: Opportunities and Pitfalls for DevelopingCountries. Asian Development Bank.
Meyers, S. 2000. “Determining Baselines and Additionality for theClean Development Mechanism: Are Simplified Methods Viable?”Unpublished memo, Lawrence Berkeley National Laboratory (LBNL).
Meyers, S., C. Marnay, K. Schumacher, and J. Sathaye. 2000.Estimating Carbon Emissions Avoided by Electricity Generationand Efficiency Projects: A Standardized Method. LawrenceBerkeley National Laboratory, LBNL-46063, September 2000.
Sathaye, J., S. Murtishaw, L. Price, M. Lefranc, J. Roy, H. Winkler, andR. Spalding-Fecher. 2004. “Multi-Project Baselines for Evaluation ofElectric Power Projects.” Energy Policy, 32 (2004), 1303–17.
Sathaye, J., L. Price, E. Worrell, M. Ruth, R. Schaeffer, M. MacedoCosta, W. Yanjia, J. Roy, S. Das, H. Winkler, R. Spalding-Fecher, Y.Afrane-Okese, and O. Davidson. 2001. Multi-Project Baselines forEvaluation of Industrial Energy Efficiency and Electric PowerProjects. Lawrence Berkeley National Laboratory, LBNL-48242,December 2001.
Winkler, H., R. Spalding-Fecher, J. Sathaye, and L. Price. 2001.“Multi-Project Baselines for Potential Clean DevelopmentMechanism Projects in the Electricity Sector in South Africa.”Journal of Energy in Southern Africa, 12 (4), 449–57.
Chapter 10: Monitoring and Quantifying the GHG Reduction
Center for Clean Air Policy. 2001. Study on the Monitoring andMeasurement of Greenhouse Gas Emissions at the Plant Level inthe Context of the Kyoto Mechanisms. Final Report, June 2001.
CERUPT (Ministry of Housing, Spatial Planning and theEnvironment of the Netherlands). 2001. Operational Guidelinesfor Baseline Studies, Validation, Monitoring and Verification ofClean Development Mechanism Project Activities: A Guide forProject Developers and Validation/Verification Bodies. Version1.0: Volume 1: Introduction; Volume 2a: Baseline Studies,Monitoring and Reporting; Volume 2b: Baseline Studies forSpecific Project Categories; Volume 2c: Baseline Studies forSmall-scale Project Categories, December 2001.
CERUPT (Ministry of Housing, Spatial Planning and theEnvironment of the Netherlands). 2001. Operational Guidelinesfor Baseline Studies, Validation, Monitoring and Verification ofJoint Implementation Projects: A Guide for Project Developers.
References
136
jpText_FINAL.qxd 11/22/05 3:52 PM Page 136

Version 1.0: Volume 2a: Baseline Studies, Monitoring andReporting; Volume 2b: Baseline Studies for Specific ProjectCategories; Volume 2c: Standardized Baselines and StreamlinedMonitoring Procedures for Selected Small-scale CleanDevelopment Mechanism Project Activities.
Ellis, J. 2002. Developing Guidance on Monitoring and ProjectBoundaries for Greenhouse Gas Projects. OECD and IEAInformation Paper, May 2002.
Ellis, J. 2002. Developing Monitoring Guidance for Greenhouse GasMitigation Projects. OECD and IEA Information Paper, May 2002.
International Performance Measurement & Verification ProtocolCommittee. 2002. International Performance Measurement &Verification Protocol: Concepts and Options for DeterminingEnergy and Water Savings. Volume 1, March 2002.
Prototype Carbon Fund. 2002. Monitoring Protocol (MP) Colombia:Jepirachi Wind Power Project. Draft: May 2002.
United Kingdom Department for Environment, Food, and RuralAffairs. 2002. Determination of Baselines and Monitoring Protocolsfor Non-LUCF Projects. Prepared by EcoSecurities, June 2002.
Vine, E., and S. Jayant. 1997. The Monitoring, Evaluation,Reporting, and Verification of Climate Change MitigationProjects: Discussion of Issues and Methodologies and Review of
Existing Protocols and Guidelines. Lawrence Berkeley NationalLaboratory, prepared for the U.S. Environmental Protection Agency,December 1997.
Example 1: Cement Sector GHG Project Using the Project-Specific Baseline Procedure
Ellis, J. 2000. An Initial View on Methodologies for EmissionBaselines: Cement Case Study. OECD and IEA Information Paper,June 2000.
Mohanty, Brahmanand (ed.). 1997. Technology, Energy Efficiencyand Environmental Externalities in the Cement Industry. Schoolof Environment, Resources and Development, Asian Institute ofTechnology, Thailand.
Organisation for Economic Co-operation and Development andInternational Energy Agency. 2000. Emission Baselines:Estimating the Unknown. OECD and IEA report, November 2000.
World Business Council for Sustainable Development (WBCSD).2001. The Cement CO2 Protocol: CO2 Accounting and ReportingStandard for the Cement Industry. WBCSD, Geneva.
References 137
jpText_FINAL.qxd 11/22/05 3:52 PM Page 137

Contributors
PA R T I V138
GHG Project Case Study Contributors
Architrandi Priambodo, URS (Example 1: Cement Project)(Heidelberg Cement, Indocement and Lafarge kindly permitted theuse of some data to support this example)
Maurice LeFranc and Lisa Hanle, United States EnvironmentalProtection Agency (Example 2: Compressor Project)
Taskforce Members & Writing Team
Ingo Puhl, 500ppm (Taskforce Leader)
Stirling Habbitts, Anglo American/KPMG
David Evans, BP
Tamsin Lishman, BP
Andrzej Blachowcz, Center for Clean Air Policy (CCAP)
Karen Lawson, CCAP
Mike Burnett, Climate Trust
Sonal Pandya, Conservation International
Consistency and Verifiability Check
KPMG LLP, London, and DNV performed a review of the final draft, taking into account specific questions raised by the WBCSD/WRIauthors in relation to the document's clarity, consistency and verifiability.
jpText_FINAL.qxd 11/22/05 3:52 PM Page 138

Contributors 139
Jesse Uzzell, DNV (Taskforce Leader)
Ben de Jong, El Colegio de la Frontera Sur
Peter Haenke, Energetics
John Palmisano, Energy and Communications Solutions
John D. Cowan, Environmental Interface Limited
Tatiana Bosteels, Environmental Resources Management (ERM)
Samy Hotimsky, ERM/University of East Anglia
Malik Amin Aslam, ENVORK
Paul Norrish, Future Forests
Marc Lemieux, Gaz Metropolitan
Liu Deshun, GCCI/INET, Tsinghua University
Jeffrey Frost, GHG Spaces Ltd.
Axel Michaelowa, Hamburg Institute of International Economics
Stephen Kenihan, ICLEI
Naoki Matsuo, Institute for Global Environmental Strategies/Climate Experts Ltd.
Martina Bosi, International Energy Agency
Dwight Demorais, Lafarge
Scott Murtishaw, Lawrence Berkeley National Laboratory (LBNL)
Jayant Sathaye, LBNL (Taskforce Leader)
Edward Vine, LBNL
Erik Haites, Margaree Consultants Inc
Marybeth Parker, Mirant
Reid Miner, National Council for Air and Steam Improvement
Karl Hausker, PA Consulting Group
Mariko Fujimori, Pacific Consultants
Kazuhito Yamada, Pacific Consultants
Michelle Passero, Pacific Forest Trust
Agus Sari, Pelangi
Michael Molitor, PricewaterhouseCoopers (PwC)
Laurent Segalen, PwC
Toby Campbell-Colquhoun, Royal Dutch Shell
Will Gibson, Tetra Tech
Ellen Hawes, The Nature Conservancy (TNC)
Tia Nelson, TNC
Paul Steenhof, Torrie Smith Associates
Ralph Torrie, Torrie Smith Associates
Manuela Ojan, Toyota
Jackie Jones, UK DEFRA
Michelle Manion, Union of Concerned Scientists
Kai-Uwe Schmidt, United Nations Framework Convention on Climate Change
Ken Andrasko, USEPA
Ben DeAngelo, USEPA
Paul Gunning, USEPA
Robert Prolman, Weyerhaeuser Company
Venkata Ramana, Winrock International
Sandra Greiner, World Bank
Johannes Heister, World Bank
Samrat Sengupta, World Wildlife Fund
Kevin Baumert, WRI
jpText_FINAL.qxd 11/22/05 3:52 PM Page 139

Contributors
140
Road Testers
The list below reflects the companies/organisations that volunteered to road test this document; names in brackets are the person(s)responsible for this effort.
Ademe, France (Boris Bailly and Fredric Gal)
Applied Ecological Services (Steve Apfelbaum and Cheryl Miller)
BP (Mark Akhurst and Jane Scott-Gall)
Chevron Corporation (Jonathan Grant and Arthur Lee)
Climate Neutral Network (Sue Hall)
Dow Chemical Company (Jorma Salmikivi)
Energetics Pty Ltd and Sydney Water (Peter Haenke)
Environmental Interface Limited (John D. Cowan)
Florida Light and Power (Mary Archer and Lynn Smallridge)
Independent Consultant (Walker Lunn)
Indian Council of Forestry Research & Education (Neeta Hooda and Promode Kant)
Indocement/Heidelberg Cement (Oivind Hoidalen
and Clemens Huetter)
Interface Inc. (Melissa Vernon)
International Paper (Adam Costanza)
LBNL (Satish Kumar and Edward Vine)
Louis Berger Group (Subrata Mazumder)
Natural Resources Canada (Tom Baumann and Partrick Hardy)
Oregon Department of Energy (Sam Sadler)
Pacific Forest Trust (Michelle Passero and Jon Remucal)
Priestley Consulting (Janice Priestley)
Research Triangle Institute (Brian Murray and Allan Sommer)
Saskatchewan Research Council (Mark Johnston)
State Forests of NSW (Penny Baalman and Nick O’Brien)
TEPCO (Yasushi Hieda and Hiroyuki Takahashi)
URS (Architrandi Priambodo)
USEPA (Ken Andrasko and Ben DeAngelo)
Woodrising Consulting Inc. (Neil Bird)
Road Test Draft and Final Reviewers
This list reflects the names of persons who provided feedback to the road test and pre-publication drafts.
Karin Ritter, American Petroleum Institute
Marina Alvaro, Anglo American
Ian Emsley, Anglo American
John Roberts, Anglo American
Christopher Loreti, Battelle
Jim Qin, Borax
John Yong, Brown University
Jill Gravender, California Climate Action Registry
Geoff Styles, Capacity Building, Leadership & Action
Lisa Nelowet Grice, CH2M Hill
Karen Meadows, Climate Neutral Network
Hennie Conradie, Deloitte & Touche
Michael Lehmann, DNV (also on the DNV review team)
Ramesh Ramachandran, DNV (also on the DNV review team)
Veena Vadini, DNV
Heather McGray, ECOLOGIA/WRI
Justin Guest, EcoSecurities
Eric Holdsworth, Edison Electric Institute
Bruce Maillet, EMCON
David Corregidor Sanz, ENDESA
Gustavo Silva-Chavez, Environmental Defense
Marguerite Barenbrug, Environmental Impact ManagementServices
Michael Gillenwater, Environmental Resources Trust
Peter Nelson, Eskom
jpText_FINAL.qxd 11/22/05 3:52 PM Page 140

Contributors 141
Wendy Poulton, Eskom
Mandy Rambharos, Eskom
Clive Turner, Eskom
Atul Kumar, Gujarat Ambuja Cement
Y.K. Saxena, Gujarat Ambuja Cement
Werner Heck, Heck Associates
N.K. Verma, Indian Farmers Fertilizer Cooperative Limited
Itaru Watanabe, Japan Quality Assurance (JQA)
Shigenari Yamamoto, JQA
Chris Hunter, Johnson & Johnson
Satoshe Takase, Kansai Electric Power Company (KEPCO)
Shintaro Yokokawa, KEPCO
Tom Frost, KPMG
Anna Greenshields, KPMG (also on the KPMG review team)
Henk Harmsen, KPMG
Andrew Howard, KPMG
Donna Boysen, Louis Berger Group
Vinay Deodhar, Louis Berger Group
Zoe Budnik-Lees, National Business Initiative (NBI)
Andre Fourie, NBI
Charlotte Middleton, NBI
Dan Bilello, National Renewable Energy Laboratory
Neil Cohn, Natsource
Dale Bryk, Natural Resources Defense Council
Sanjeev Raghubir, Nestle
Mikako Kokitsu, Osaka Gas
David Sumi, PA Consulting
Greg San Martin, Pacific Gas & Electric
Lance Moodley, Palabora Mining
S.K. Bajaj, Phillips India
G.P. Singh, Phillips India
Kyle Tanger, Project Performance Corporation
Harmke Immink, PwC
Joe Kruger, Resources for the Future
Kaj Embern, Respect Europe
Mei Li Han, Respect Europe
Gerrit Kornelius, SASOL
Steven R. Schiller, Schiller Consulting
Pancho Ndebele, South African Breweries
Lee Ann Kozak, Southern Company
Hiroyuki Takahashi, TEPCO
Dinesh Babu, The Energy and Resources Institute (TERI)
Preety Bhandari, TERI
Ulka Kelkar, TERI
Parikshit Srivastava, TERI
Sean Clark, The Climate Trust
Miriam Lev-On, The LEVON Group
Satoshi Yoshida, Tokyo Gas Company
Werner Betzenbichler, TÜV Süddeutschland
Sandeep Tandon, United States Agency for International Development
Anthony Dinicola, Unocal
Terri Shires, URS Corporation
Cynthia Cummins, USEPA
Evan Jones, VCR-MVR
Eric Lesueur, Veolia Environment
John Sebastian, Veolia Environment
Amanda Stobart, Webber Wentzel
Sandra Brown, Winrock International
Tim Pearson, Winrock International
Sudhir Sharma, Winrock International India
Rob Bradley, WRI
Maria Cordeiro, WRI
Taryn Fransen, WRI
David Jhirad, WRI
Rebecca Eaton, WWF
jpText_FINAL.qxd 11/22/05 3:52 PM Page 141

Contributors
142
General Contributors
Heather Tansey, 3M
Alain Bill, ALSTOM Power
Charles Eyre, Aon Risk Consulting
Danielle Cesano, ARUP
Anne Boucher, Baseline Protection Initiative
Simon Worthington, BP
Adolfo E. Silva, Canadian Petroleum Products Institute
Kevin Boehmer, Canadian Standards Association
Greg Kats, Capital E
Fred J. Keller, Carrier Corporation
Jake Schmidt, CCAP
Alexander Roeder, CEMEX
Gerard Alleng, Center for Energy and Environmental Policy, University of Delaware
Donald Goldberg, Center for International Environmental Law
Alice LeBlanc, Chicago Climate Exchange
John O. Niles, Climate, Community & Biodiversity Alliance
Michael Totten, Conservation International
John Kessels, CRL Energy
Harold Belore, Cumming Cockburn Limited
K. C. Narang, Dalmia Cement
Robert Casamento, Deloitte
Aditi Haldar, Development Alternatives
Dale Didion, ISG Resources
Simon Dawes, DNV
Trygve Roed-Larsen, DNV
Neil Kolwey, E Source
Bill Kyte, E.ON UK
Louise Aukland, EcoSecurities
Crosbie Baulch, Energetics
David Crossley, Energy Futures Australia
Xu Huaqing, Energy Research Institute
Pierre Boileau, Environment Canada
Juerg Fuessler, Ernst Basler & Partners Ltd.
Richard Ney, Essential Science
Thomas Sylvester, Exelon Power
Wendel Dreve, Farmer’s Ethanol LLC
Bhanu Swaminathan, Fertiliser Association of India
Lauren Sandler, First Environment
Duncan Noble, Five Winds International
Hans Buwalda, Fletcher Building Limited
Cesar Munoz, Fundacion Entorno
George Fowkes, Future Forests
Aldyen Donnelly, Greenhouse Emissions Management Consortium
Michael Dutschke, Hamburg Institute of International Economics
David Brand, Hancock Natural Resource Group
Mihir Moitra, Hindalco Industries Limited
Anne Choate, ICF Consulting
Abyd Karmali, ICF Consulting
Jim McConnach, IEEE
Kim Maloney, Independent consultant
V. Ranganathan, Indian Institute of Management
Jerry Marks, International Aluminium Institute
Fraser Thomson, International Aluminium Association
Robert Dornau, International Emissions Trading Association
Tony Irwin, IRM Consulting
Koichi Kitamura, KEPCO
Koji Toyama, KEPCO
Chi Mun Woo, KPMG
Naseem Pankhida, KMPG
Bertrand Gaillard, Lafarge
Simon Rice, Lafarge
Lenny Bernstein, L.S. Bernstein & Associates
jpText_FINAL.qxd 11/22/05 3:52 PM Page 142

David Lesolle, Ministry of Environment, Wildlife, and Tourism, Botswana
Xuedu Lu, Ministry of Science and Technology of China
Indrani Kowlessar, NRCan
Stephen Seres, NRCan
David Howard, NREL
Mary Quilliam, Nuclear Energy Institute
Laurie Wayburn, Pacific Forest Trust
Matthew McCulloch, Pembina Institute
Kristian Rajakaltio, PwC
Neil Rein, Resource Recovery Systems
Neil Sampson, Sampson Group
Doug Howell, Seattle City Light
Gerhard Mulder, SENTER
Gareth Phillips, SGS
Roon Osman, Shell
Tony O’Hara, State Forests of NSW
Malte Meinhausen, Swiss Federal Institute of Technology
G. S. Basu, Tata Steel
R. P. Sharma, Tata Steel
Midori Sasaki, TEPCO
Yoshiyuki Tsuji, TEPCO
Leena Srivastava, TERI
Mark Jackson, The Carbon Store
Eric Firstenberg, TNC
Patrick Gonzalez, TNC
Zoe Kant, TNC
Bill Stanley, TNC
Kentaro Suzawa, Tokyo Gas Company
William Hohenstein, United States Department of Agriculture
Gary Bull, University of British Columbia
Katie Begg, University of Surrey
Mahesh Gundappa, URS Corporation
Gloria Godinez, WBCSD
Susanne Haefeli, WBCSD
Simon Schmitz, WBCSD
Ian Noble, World Bank
Lasse Ringius, World Bank
Sebastian Scholz, World Bank
Pankaj Bhatia, WRI
Liz Cook, WRI
Anthony Dvarskas, WRI
Peter Gage, WRI
Ryan Levinson, WRI
Jennifer Layke, WRI
Jonathan Pershing, WRI
Anand Rao, WRI
Emily Weninger, WRI
Manmitta Dutta, Yale Univerisity
WRI and WBCSD would like to thank the following individuals and organizations for their generous financial support: EnergyFoundation, Spencer T. and Ann W. Olin Foundation, the USAgency for International Development, the US EnvironmentalProtection Agency, Baxter International, BP, Chevron Corporation,Ford, International Paper, SC Johnson, Dow, Environment Canada,and Natural Resource Canada. We would also like to thank KPMGand Shell for their support in holding GHG Protocol meetings.
Contributors 143
Design: Alston Taggart, Studio Red
jpText_FINAL.qxd 11/22/05 3:52 PM Page 143

144
DisclaimerThis document, designed to promote best practice GHG
project accounting and reporting, has been developed
through a globally diverse multi-stakeholder consulta-
tive process involving representatives from business,
nongovernmental organizations, government, academ-
ics, and other backgrounds. While WBCSD and WRI
encourage use of the GHG Protocol for Project
Accounting, its application and the preparation and
publication of reports based on it are the full responsi-
bility of its users. In particular, use of the Project
Protocol does not guarantee a particular result with
respect to quantified GHG reductions, or acceptance or
recognition of quantified GHG reductions by GHG
programs. Neither the WBCSD and WRI, nor other
individuals who contributed to this Protocol assume
responsibility for any consequences or damages result-
ing directly or indirectly from its use and application.
Ordering publications
WBCSD
WBCSD, c/o Earthprint Limited
Tel: (44 1438) 748 111
Fax: (44 1438) 748 844
wbcsd@ earthprint.com
Publications are available at:
www.wbcsd.org
www.earthprint.com
WRI
Hopkins Fulfillment Service
Tel: (1 410) 516 6956
Fax: (1 410) 516 6998
e-mail: hfscustserv@ press.jhu.edu
Publications can be ordered from WRI’s secure online
store: http:// www.wristore.com
Copyright © World Resources Institute and World Business
Council for Sustainable Development, November 2005
ISBN 1-56973-598-0
Printed in USA
T
Printed on Chorus Art Silk (50% recycled, 15% post consumer waste, chlorine-freepulp processed paper) with soy-based inks.
jpText_FINAL.qxd 11/22/05 3:52 PM Page 144

About WBCSDThe World Business Council for Sustainable Development(WBCSD) is a coalition of 175 international companies united by a shared commitment to sustainable development via thethree pillars of economic growth, ecological balance and socialprogress. Our members are drawn from more than 30 countriesand 20 major industrial sectors. We also benefit from a Global Network of 50+ national and regional business councilsand partner organizations.
Our mission is to provide business leadership as a catalyst forchange toward sustainable development, and to support the business license to operate, innovate and grow in a world increasingly shaped by sustainable development issues
Our objectives include:
• Business Leadership—to be a leading business advocate onsustainable development.
• Policy Development—to participate in policy development to create the right framework conditions for business to make an effective contribution towards sustainable development.
• The Business Case—to develop and promote the business case for sustainable development.
• Best Practice—to demonstrate the business contribution to sustainable development solutions and share leading edge practices among members.
• Global Outreach—contribute to a sustainable future for developing nations and nations in transition.
About WRIThe World Resources Institute is an environmental think tank thatgoes beyond research to create practical ways to protect the Earthand improve people’s lives. Our mission is to move human societyto live in ways that protect Earth’s environment for current andfuture generations.
Our program meets global challenges by using knowledge to catalyze public and private action:
• To reverse damage to ecosystems. We protect the capacity ofecosystems to sustain life and prosperity.
• To expand participation in environmental decisions. We collaborate with partners worldwide to increase people’s access to information and influence over decisions about natural resources.
• To avert dangerous climate change. We promote public and private action to ensure a safe climate and sound world economy.
• To increase prosperity while improving the environment. We challenge the private sector to grow by improving environmentaland community well-being.
In all of our policy research and work with institutions, WRI tries tobuild bridges between ideas and actions, meshing the insights ofscientific research, economic and institutional analyses, andpractical experience with the need for open and participatory decision-making.
GHG Protocol Initiative Team
Project Management Team (PMT)This team was assigned to guide and oversee the development of the document until it was road tested in September 2003.
Mike McMahon, BPJennifer DuBose, Climate Neutral NetworkP.R. Shukla, Indian Institute of ManagementMelanie Eddis, KPMGBob Fledderman, MeadWestvacoClifford Schneider, MeadWestvacoJane Ellis, Organization for Economic Cooperation and DevelopmentRichard Tipper, The Edinburgh Centre for Carbon ManagementYasuo Hosoya, Tokyo Electric Power Company (TEPCO)
Revision Management Team (RMT)This team was instituted in December 2003, to guide the integration of feedback received from the road testing phase and advice towards the finalisation of the document.
Mike McMahon, BPArthur Lee, Chevron Corporation Einar Telnes, Det Norske Veritas (also on the DNV review team)Ken-Ichi Shinoda, Global Industrial and Social Progress Research InstituteAdam Costanza, International PaperMelanie Eddis, KPMG (also on the KPMG review team)Jed Jones, KPMG (also on the KPMG review team)Fabian Gaioli, MGM InternationalJulia Martinez, Ministry of Environment and Natural Resources (SEMARNAT), MexicoLucy Naydenova, Ministry of Housing, Spatial Planning and the Environment, NetherlandsTom Baumann, Natural Resources Canada (NRCan)Patrick Hardy, NRCanJeff Fiedler, Natural Resources Defense Council (NRDC) (also Taskforce Leader)Michelle Passero, Pacific Forest TrustAjay Mathur, Senergy GlobalSivan Kartha, Tellus InstituteMichael Lazarus, Tellus InstituteYasushi Hieda, TEPCOMartin Hession, United Kingdom Department for Environment Food and Rural Affairs (UK DEFRA)Lisa Hanle, United States Environmental Protection Agency (USEPA)Maurice LeFranc, USEPA (also Taskforce Leader)
W O R L D R E S O U R C E S I N S T I T U T E Suzie GreenhalghDerik BroekhoffFlorence DavietJanet Ranganathan
W O R L D B U S I N E S S C O U N C I L F O R S U S T A I N A B L E D E V E L O P M E N TMahua AcharyaLaurent CorbierKjell OrenHeidi Sundin
AC
KN
OW
LE
DG
EM
EN
TS
JP WRI_Cover.new cov3.qxd 11/22/05 4:27 PM Page 2

The Greenhouse Gas Protocol
The GHG Protocol for Project Accounting
WORLD
RESOUR CES
I N S T I T U T E
2000 2010 2020 2030 204
TheG
reenhouse Gas Protocol
The G
HG
Protocol for P
roject Accounting
WR
I WB
CS
D
WORLD
RESOUR CES
INSTITUTE
10 G Street, NE (Suite 800)
Washington, DC 20002
USA
Tel: (1 202) 729 76 00
Fax: (1 202) 729 76 10
Web: www.wri.org
4, chemin de Conches
1231 Conches-Geneva
Switzerland
Tel: (41 22) 839 31 00
Fax: (41 22) 839 31 31
E-mail: info@ wbcsd.org
Web: www.wbcsd.org
ISBN 1-56973-598-0
JP WRI_Cover.new cov3.qxd 11/22/05 4:27 PM Page 1


