23
The Growing Connectedness of the Electric and Natural Gas Systems MIPSYCON | November 8, 2017 | St. Paul, MN Mike Nygaard Senior Engineer, Policy Studies, MISO

The Growing Connectedness of the
Electric and Natural Gas Systems MIPSYCON | November 8, 2017 | St. Paul, MN
Mike Nygaard Senior Engineer, Policy Studies, MISO

1
• Transmission: ~66,000 miles
• Peak load: ~127,000 MW
• Generation capacity: ~175,000 MW
• Gross Market Charges: ~$25 billion (2016)
• 437 Market Participants serving 42 million people1
1 – Source: MISO Corporate Fact Sheet
MIPSYCON | November 8, 2017 | St. Paul, MN
Geographically, MISO is the largest Independent System Operator in North America

2 “Other” category includes hydro, pumped hydro, oil, solar, and others
Coal 35%
Gas 43%
Nuclear 8%
Wind 9%
Other 5%
Coal 48%
Gas 28%
Nuclear 6% Wind
10%
Other 7%
Coal 19%
Gas 67%
Nuclear 12%
Wind 0%
Other 2%
MISO North & Central Regions
130,000 MW
MISO South Region
45,000 MW
MISO 175,000 MW
2017 Installed Capacity
Coal 46%
Gas 27%
Nuclear 16%
Wind 8%
Other 3%
2016 MISO Energy Mix
MWh as a % of total energy production
MIPSYCON | November 8, 2017 | St. Paul, MN
The current resource mix in MISO is largely coal and gas, supplemented by nuclear and renewables

3
6%
11% 8% 7%
12%
16%
21% 18%
24% 27%
21%
Gas Share (%) of MISO Electric Generation (MWh)
MISO North / Central MISO Total (including MISO South) Range of scenario
outcomes2 • Gas prices • Growth in
renewables • Impacts of coal
retirements
High certainty gas burn (across a range of scenarios)
2011 2012 2013 2014 2015 2016 2030
42%
…
Installed gas capacity is projected to increase 8,000 MW in the queue through 20203
(Signed interconnection agreements 3,700 MW; final definitive studies 4,300 MW)
$4.00 $2.76 $3.73 $4.37 $2.63 Henry Hub $/MMBtu $2.51 ?
MIPSYCON | November 8, 2017 | St. Paul, MN
2 – MISO MTEP17 sensitivities with range of gas prices (mid-case +/- 30%) 3 - MISO Interconnection Queue as of October, 2017
Gas demand has grown and MISO’s evolving fleet will propel gas demand even higher

4
• Increased flows from Marcellus/Utica on new-build pipelines and pipeline reversals are improving supply diversity
• U.S. gas production gains continue to be favorable, causing lower (and flatter) prices
• Perceived long-term abundance is driving LNG exports from facilities like Sabine Pass in MISO South
Graphics per MISO Phase I: Gas and Electric Infrastructure Interdependency Analysis, February, 2012. Updated flow changes 2015
Historic Flow Patterns and LNG Imports Developing “Grid” Flow Patterns & LNG Exports
MIPSYCON | November 8, 2017 | St. Paul, MN
Significant changes in the gas industry are driving impacts in MISO
5
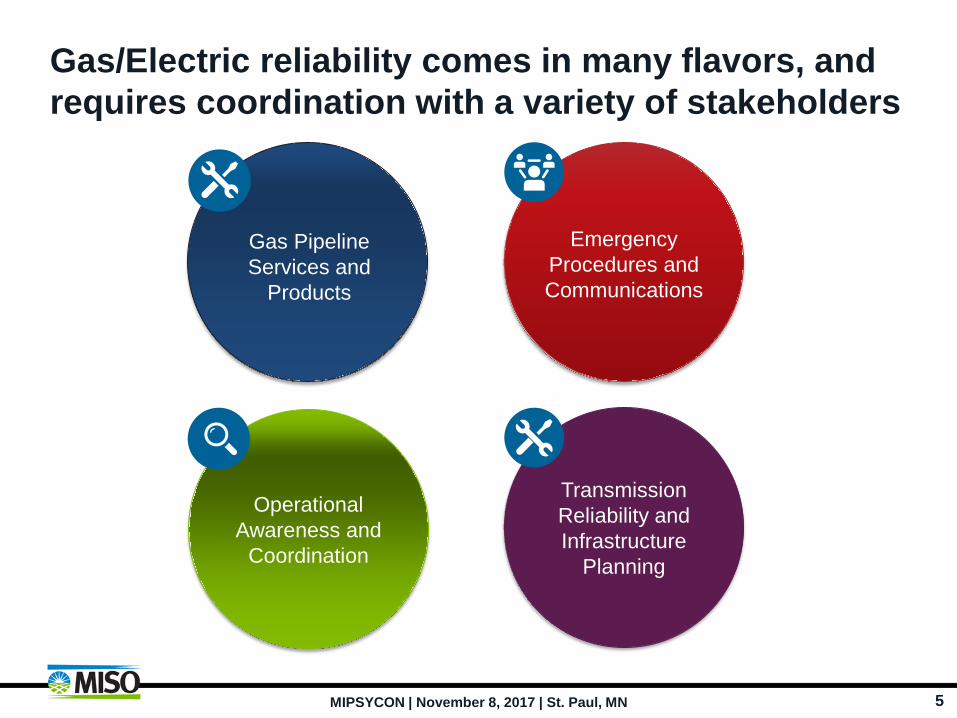
Operational Awareness and
Coordination
Emergency Procedures and Communications
Gas Pipeline Services and
Products
Transmission Reliability and Infrastructure
Planning
MIPSYCON | November 8, 2017 | St. Paul, MN
Gas/Electric reliability comes in many flavors, and requires coordination with a variety of stakeholders

6
70,000
75,000
80,000
85,000
90,000
95,000
0
5,000
10,000
15,000
20,000
25,000
1 4 7 10 13 16 19 22
Load
(MW
)
Win
d (M
W)
MISO Load – Feb 12, 2015
Hour of Day
Gas Pipeline Services and
Products
MIPSYCON | November 8, 2017 | St. Paul, MN
Chart source: CAISO
CAISO Load – March 31
Gas-fired capacity is important during ramping periods, especially as renewable generation drives ramp requirements even higher

7
• Peak Load4: ~109,000 MW
• Forced Outages: ~18,000 MW 75% Mech. Failure 25% Gas-Related
• Load Shed: 0 Watts
Minneapolis, MN Average High: 23 F Actual High: -13 F
St. Louis, MO Average High: 40 F
Actual High: 1 F
New Orleans, LA Average High: 60 F Actual High: 37 F Emergency
Procedures and Communications
MIPSYCON | November 8, 2017 | St. Paul, MN
The Polar Vortex event on January 6-7, 2014 stressed MISO’s system with record peak demands and high forced outage rates
4 –All data is for January 6, 2014

8
• 2016 survey included responses from ~87% of MISO’s gas-fired generators (representing 63,500 MW of capacity)
• Responses further the optimization of operational tools: pipeline notification website, fuel impact report, and electric/gas pipeline control room display
• Key Results – Survey participants reported an increased utilization of flexible gas
services, such as no-notice (42%) and non-ratable subscriptions (66%)
– 83% of Combined Cycle units in MISO North/Central and 100% in MISO South utilize Firm Transportation or a blend of Firm/Interruptible, but only 23% of MISO capacity has dual fuel capability
– 70% of MISO North/Central generation is connected to one of 5 pipelines, either directly or via LDC/Gas Utility
Operational Awareness and
Coordination
MIPSYCON | November 8, 2017 | St. Paul, MN
MISO’s Winter Fuel Survey provides a regional view on winterization and fuel supply practices

9
• Communication Coordination – Operational contact list established with all
pipelines in the MISO footprint – Monthly—and as-needed—operational calls
with major pipelines – Sharing of MISO public data with pipelines
• DA Wind Forecast & RT Wind Generation • LMP Contour Map
• Gas Market/Situational Awareness – MISO pipeline notification website – Monitoring market condition
• Intercontinental Exchange subscription – Gas industry internal training – Daily gas outage report tracking – CROW
monitoring
Operational Awareness and
Coordination
MIPSYCON | November 8, 2017 | St. Paul, MN
It is critical for MISO’s operators to know what is happening on the gas system

10
• 2015 EIPC study5 investigated gas-electric contingency events
• NERC transmission planning standards (TPL-001-4) came into effect 2015/2016
– Extreme Events analysis includes “Loss of two generating stations resulting from…loss of a large gas pipeline into a region”
• NERC Single Point of Disruption (SPOD) special assessment – Aims to identify potential risks to BPS as a result of disruptions on major natural
gas infrastructure facilities
• Federal Task Force – Ensuring Safe and Reliable Underground Natural Gas Storage
– Established in the wake of Aliso Canyon incident, identifies large gas storage facilities where an outage could affect on gas-fired generation reliability
Transmission Reliability and Infrastructure
Planning
MIPSYCON | November 8, 2017 | St. Paul, MN
Reliability of the integrated gas-electric system is a hot topic, with interest from a wide array of groups
5- http://www.eipconline.com/gas-electric-documents.html

11
GPCM About: - Standalone natural gas model, built on MS Access database foundation - Used for long-term look into pricing and pipeline flow trends
Pros: - Well-regarded in gas industry - Benchmarked against historical data - Forecast dataset (included) is accurate and easily modified
Cons: - Monthly data granularity - No integrated electric model
PLEXOS About: - Co-optimized Gas/Electric production cost modeling platform - Electric model has been used for many MISO studies, including CPP analysis
Pros: - Capable of very granular detail - Integrated gas/electric co-optimization - Familiar tool for MISO
Cons: - Minimal support for gas model - No gas model dataset included
Transmission Reliability and Infrastructure
Planning
MIPSYCON | November 8, 2017 | St. Paul, MN
New modeling tools allow for a view into the interactions between the gas and electric systems

12 MIPSYCON | November 8, 2017 | St. Paul, MN
These models can tell stories about macro- and micro-effects of increased reliance on gas-fired generation
*Charts are for illustrative purposes only Transmission
Reliability and Infrastructure
Planning
GPCM results highlight financial impacts of
increase in gas usage
PLEXOS results highlight operational and reliability impacts of increase in gas
usage

13 MIPSYCON | November 8, 2017 | St. Paul, MN
Market Point Price Basis: 2011 vs 2016 Copyright © 2000-2017 RBAC, Inc, All Rights Reserved
Emerson 2011: $0.08 2016: $-0.22
Leidy 2011: $0.39 2016: $-0.65
MichCon 2011: $0.32 2016: $0.08
Ventura 2011: $0.07 2016: $-0.11
Chicago 2011: $0.18 2016: $0.00
Transco Z5 2011: $0.71 2016: $0.23
Carthage 2011: $-0.18 2016: $-0.10
TX E, ETX 2011: $-0.24 2016: $-0.13
Henry Hub
• Natural gas generation has risen from 18% of MISO’s energy in 2014 to 27% in 2016 • Nearly 8,000 MW of gas-fired generation projects in advanced stages of MISO’s GI queue
• MTEP17 Futures forecasted between 20-28 GW of additional gas-fired generation by 2031 in MISO
Reliance on gas-fired generation continues to grow in MISO and across the country

14 MIPSYCON | November 8, 2017 | St. Paul, MN
• A base Henry Hub gas price is developed, with basic high/low sensitivities assigned
• Fixed cost to transport gas from Henry Hub to one of a few dozen Market Points (Ventura, Carthage, Chicago, etc.)
– Bases vary by month and year, but not by Future scenario
– Based largely on historic flow patterns and pricing
• Fixed cost to transport gas from Market Points to state-wide Natural Gas Pools (NG Indiana, NG Louisiana, NG Minnesota, etc.)
– Intended to represent cost to get gas to a unit’s “burner tip”
– All generators in the state-wide pool see the same gas price
Traditional representation of the natural gas transportation system in electric analyses is simplified

15
Price adders change over time
AND by scenario
MIPSYCON | November 8, 2017 | St. Paul, MN
National Regional State Plant
Henry Hub
Ventura
Carthage
Minnesota
Iowa
Arkansas
National Pipeline Pipeline Zone Plant
Henry Hub
Northern Natural
Gulf South
NNG Mkt ABC
NNG Mkt EF
Gulf S ETX
Plant 1
Plant 4
Plant 3
Plant 2
Plant 5
Previous Structure
Enhanced Structure
Price adders change over time
This effort involves development of more granular gas prices in the MTEP study process

16 MIPSYCON | November 8, 2017 | St. Paul, MN
Gas supply assumptions
RCIT* gas demand
assumptions
DRAFT unit-specific gas
prices
Gas demand from expansion
units
FINAL unit-specific gas
prices
*RCIT: Residential, Commercial, Industrial, & Transportation (all demand except Electric Generation)
Gas Model
Resource Forecasting
Model
Production Cost Model
Old Process New Process Generator Pricing Points
33 (statewide pools)
~750 (One for each gas-fired plant in the model footprint)
Gas System Variables
Henry Hub price
Henry Hub price, gas supply & demand, pipeline congestion charges, fuel contract types
Henry Hub price
Production Cost Model
Resource Forecasting
Model
Previous process Enhanced process
Gas Model Burner tip
adders Burner tip
adders
MISO’s new process models the impacts of our study assumptions on the gas pipeline system

17
• Understanding changes in gas flows patterns and infrastructure utilization
• Future infrastructure requirements
• Implications of gas generation in winter
• Gas supply flexibility ‒ Hourly variations (including gas takes during short or specific portions of the day)
‒ Load following and ability to ramp up/down for varying load or renewable energy changes
‒ Short-notice ability to make changes
• Impacts of gas pipeline contingency events
• Capabilities/limitations of pipeline/LDC services and terms
• Regulators’ role as we move forward
MIPSYCON | November 8, 2017 | St. Paul, MN
As gas-fired generation continues to grow in MISO, we’re considering the following with our stakeholders:

18
Questions?
Mike Nygaard
Senior Policy Studies Engineer, MISO
(651) 632-8487
MIPSYCON | November 8, 2017 | St. Paul, MN

19
Appendix

20
• MISO: – Is an independent, not-for-profit entity
– Does not own any electric transmission or generation assets
– Manages one of the world’s largest energy and operating reserves markets using security-constrained economic dispatch of generation
– Ensures reliable operation of the bulk electric transmission system
– Coordinates long-term regional planning of the transmission system
• MISO’s mission: – Work collaboratively and transparently with our stakeholders to enable
reliable delivery of low-cost energy through efficient, innovative operations and planning
Midcontinent Independent System Operator (MISO) Facts & Functions
MIPSYCON | November 8, 2017 | St. Paul, MN

21
Operational Awareness and
Coordination
MIPSYCON | November 8, 2017 | St. Paul, MN
The Gas Pipeline Notifications Page on MISO’s website compiles notices from our region’s pipeline EBBs

22
MISO Control Rooms / Real Time Display Internal Tool for Real Time Operations
Operational Awareness and
Coordination
MIPSYCON | November 8, 2017 | St. Paul, MN
Pipeline maps in our control rooms give operators a sightline into the gas system


