- +. {I BlueCross . ~" BlueShield . bhi,. Blue Health Intelligence / THE HEALTH Of AMERICA REPORT HealthC re· THE GROWTH IN SPECIALTY DRUG SPENDING FROM 2013 TO 2014 This report was written by HealthCore, a wholly-owned and independently operated health outcomes subsidiary of Anthem, Inc.
Transcript
-+. {I BlueCross. ~ " BlueShield .
bhi,. Blue Health Intelligence
/ THE HEALTH Of AMERICA REPORT
HealthC re·
THE GROWTH IN SPECIALTY DRUG SPENDING FROM 2013 TO 2014
This report was written by HealthCore, a wholly-owned and independently operated health outcomes subsidiary of Anthem, Inc.
The Growth in Specialty Drug Spending from 2013 to 2014 [May 2016]
..I
:"··············1,,,
......................... ·
t
( 1 )
BLUE CROSS BLUE SHIELD, THE HEALTH OF AMERICA REPORT
EXECUTIVE SUMMARY
Blue Cross and Blue Shield (BCBS) companies are committed to ensuring that people have timely access to safe, effective, cutting-edge prescription medicines when they need them, whether the drugs cost pennies or thousands of dollars. In fact, health insurance companies cover more than 98 percent of prescription drug costs for people who need more than $100,000 in medicines per year. The U.S. government estimated that more than $450 billion was spent on prescription drugs in 2015.1 Drug spending has grown rapidly over the past two years, growing 12.6 percent from 2013 to 2014 — the highest annual increase since 2003 — and an additional
DRUG SPENDING HAS GROWN RAPIDLY OVER THE PAST TWO YEARS
2013 201412.6% 20157.6%
7.6 percent from 2014 to 2015.2 However, drug spending grew more rapidly — 15.8 percent — for commercial health plans in 2015.3
Drug spending also is projected to rise more quickly than overall health care spending over the next several years. A leading contributor to the increase in drug spending is the growth of specialty drugs, which are growing in cost faster than traditional pharmaceuticals. Estimates suggest that the $87 billion spent in 2012 on specialty drugs could quadruple by 2020, reaching approximately $350 billion.4
This report analyzes the growth in specialty drug spending from 2013 to 2014 by analyzing the majority of BCBS companies’ commercially-insured and individual members across the country, or a sample size of approximately 70.5 million BCBS members per year in 2013 and 2014 (70 percent of all BCBS membership).
Using claims data for specialty drugs covered by both pharmacy and medical benefts provides a unique and holis-tic view of specialty drug costs in the U.S. (Specialty drugs may be covered by insurance under either the pharmacy or medical beneft, depending on how they are administered or how the health plan covers them.) Approximately half of specialty drug spending is funded by each beneft. Examining medical beneft data is important in order to analyze changes in cancer drug spending, one of the top contributors to specialty costs, since more than 80 percent of cancer medication costs are billed through the medical beneft.
1. ASPE Issue Brief: Observations on Trends in Prescription Drug Spending. March 2016.
2. CMS, National Health Expenditures, Historical and Projected, Calendar Years 1960-2024, Centers for Medicare and Medicaid Services, Offce of the Chief Actuary, July 28, 2015.
3. S&P Global, 2015 DATA RESULTS: Second Consecutive Year of Signifcantly Increasing Drug Costs; Individual Market Becomes More Costly Than the Employer-Based Market, S&P Healthcare Claims Index Monthly Report, May 2016.
4. Medicines Use and Spending in the U.S.: A Review of 2015 and Outlook to 2020, IMS Institute for Healthcare Informatics, April 2016.
The Growth in Specialty Drug Spending from 2013 to 2014 [May 2016]
6 • II
( 2 )
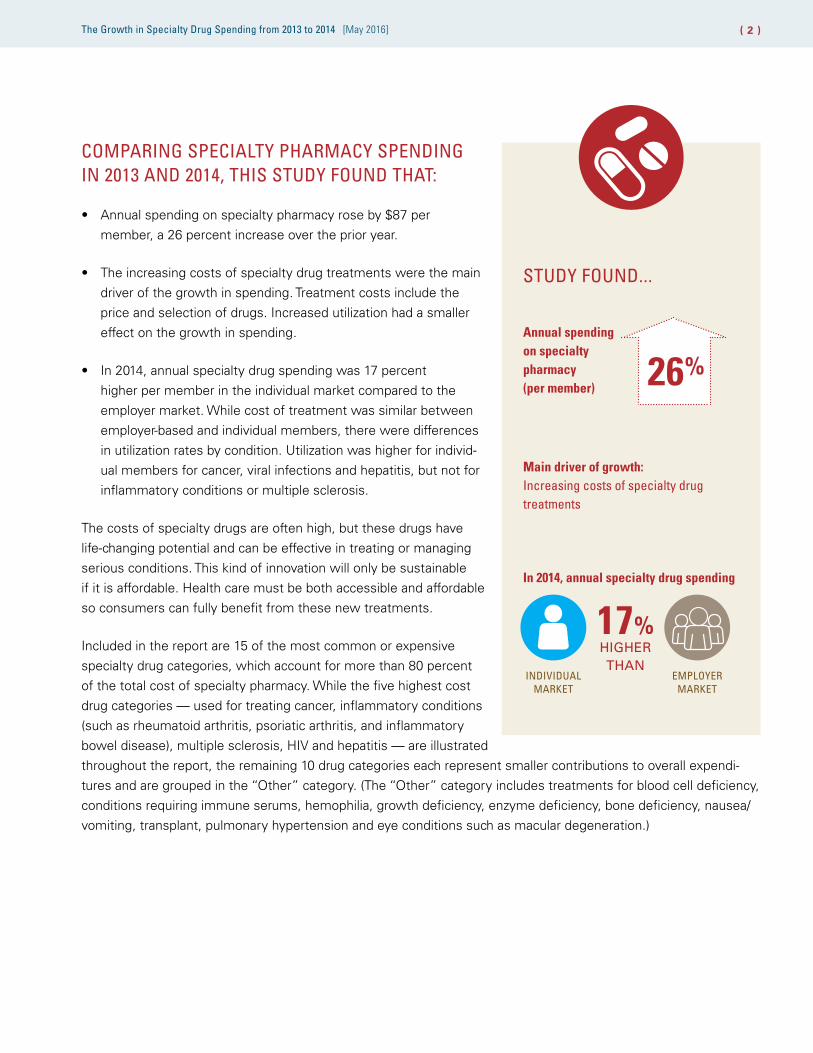
COMPARING SPECIALTY PHARMACY SPENDING IN 2013 AND 2014, THIS STUDY FOUND THAT:
• Annual spending on specialty pharmacy rose by $87 per member, a 26 percent increase over the prior year.
• The increasing costs of specialty drug treatments were the main driver of the growth in spending. Treatment costs include the price and selection of drugs. Increased utilization had a smaller effect on the growth in spending.
• In 2014, annual specialty drug spending was 17 percent higher per member in the individual market compared to the employer market. While cost of treatment was similar between employer-based and individual members, there were differences in utilization rates by condition. Utilization was higher for individ-ual members for cancer, viral infections and hepatitis, but not for infammatory conditions or multiple sclerosis.
The costs of specialty drugs are often high, but these drugs have life-changing potential and can be effective in treating or managing serious conditions. This kind of innovation will only be sustainable if it is affordable. Health care must be both accessible and affordable so consumers can fully beneft from these new treatments.
Included in the report are 15 of the most common or expensive specialty drug categories, which account for more than 80 percent of the total cost of specialty pharmacy. While the fve highest cost drug categories — used for treating cancer, infammatory conditions (such as rheumatoid arthritis, psoriatic arthritis, and infammatory bowel disease), multiple sclerosis, HIV and hepatitis — are illustrated
STUDY FOUND...
Annual spending on specialty pharmacy (per member) 26%
Main driver of growth: Increasing costs of specialty drug treatments
In 2014, annual specialty drug spending
17% HIGHER THAN
INDIVIDUAL EMPLOYER MARKET MARKET
throughout the report, the remaining 10 drug categories each represent smaller contributions to overall expendi-tures and are grouped in the “Other” category. (The “Other” category includes treatments for blood cell defciency, conditions requiring immune serums, hemophilia, growth defciency, enzyme defciency, bone defciency, nausea/ vomiting, transplant, pulmonary hypertension and eye conditions such as macular degeneration.)
The Growth in Specialty Drug Spending from 2013 to 2014 [May 2016]
....... .......... -·······
· ■
■
■
■
· ■
■
■ ■ ■ ■ ■ ■
( 3 )
Overall Spending Increases by Drug Category Within this study sample of BCBS members, approximately $14.6 billion was spent on specialty pharmacy drugs for the top 15 drug categories in 2013. About two thirds of the cost was from treating cancer, infammatory conditions and multiple sclerosis. Total spending on the 15 drug categories in 2014 increased 26 percent to $18.4 billion. Because membership remained stable over the two-year period, there was a corresponding 26 percent increase on annual per member basis.
TOTAL SPENDING ON THE TOP 15 SPECIALTY DRUG CATEGORIES
$14.6 BILLION (2013) $18.4 BILLION (2014)
33% ($4.77B)29% ($4.25B)
22% ($3.22B)
Cancer
Inflammatory conditions
Multiple sclerosis
Hepatitis5% ($1.00B)
30% ($5.58B)26% ($4.69B)
23% ($4.16B) HIV5% ($0.72B)
6% ($1.09B) Other1% ($0.15B)
10% ($1.49B) 10% ($1.86B)
While spending increased in every category, the single largest increase was in hepatitis spending, which grew 612 percent, resulting in a $29 annual increase per member, as a result of the introduction of new drugs. Drug spending on infammatory conditions grew by 29 percent, resulting in a $22 annual increase per member.
ANNUAL PER MEMBER COST FOR TOP 15 SPECIALTY DRUG CATEGORIES
$97
$83
$44 $23
$88
$110
$105
$53
$34 $31
$94
Cancer
Inflammatoryconditions
Multiple sclerosis HIV
Other
Hepatitis $5
$87 Increase
$29 Hepatitis
$22 Inflammatory conditions
$14 Cancer
$9 Multiple sclerosis
$8 HIV
$6 Other
2013 2014
The Growth in Specialty Drug Spending from 2013 to 2014 [May 2016]
■ ■
l l
I - I - l
l
■ ■
( 4 )
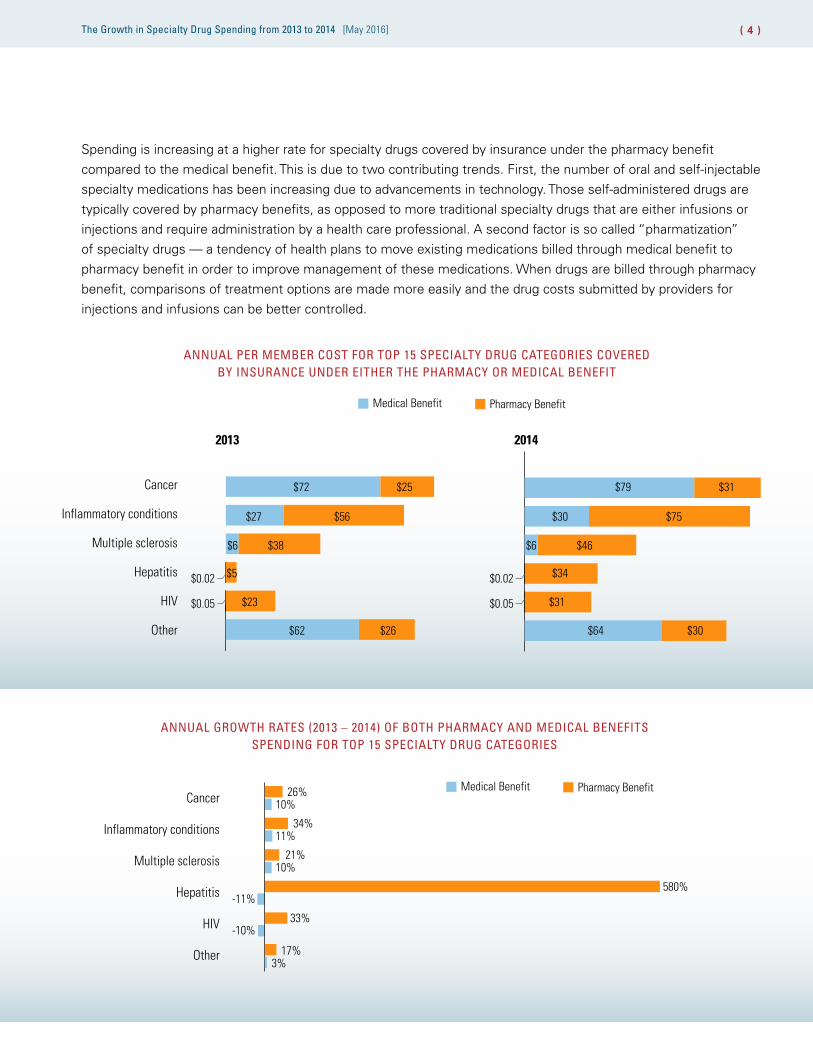
Spending is increasing at a higher rate for specialty drugs covered by insurance under the pharmacy beneft compared to the medical beneft. This is due to two contributing trends. First, the number of oral and self-injectable specialty medications has been increasing due to advancements in technology. Those self-administered drugs are typically covered by pharmacy benefts, as opposed to more traditional specialty drugs that are either infusions or injections and require administration by a health care professional. A second factor is so called “pharmatization” of specialty drugs — a tendency of health plans to move existing medications billed through medical beneft to pharmacy beneft in order to improve management of these medications. When drugs are billed through pharmacy beneft, comparisons of treatment options are made more easily and the drug costs submitted by providers for injections and infusions can be better controlled.
ANNUAL PER MEMBER COST FOR TOP 15 SPECIALTY DRUG CATEGORIES COVERED BY INSURANCE UNDER EITHER THE PHARMACY OR MEDICAL BENEFIT
Medical Benefit Pharmacy Benefit
2013 2014
Cancer
Inflammatory conditions
Multiple sclerosis
Hepatitis $0.02
HIV $0.05
Other
$72 $25
$27 $56
$6 $38
$5
$62
$23
$26
$0.02
$0.05
$79 $31
$30 $75
$64 $30
$34
$46$6
$31
ANNUAL GROWTH RATES (2013 – 2014) OF BOTH PHARMACY AND MEDICAL BENEFITS SPENDING FOR TOP 15 SPECIALTY DRUG CATEGORIES
Medical Benefit Pharmacy Benefit26%Cancer 10%
34%Inflammatory conditions 11%
21%Multiple sclerosis 10%
580%Hepatitis -11%
33%HIV -10%
17%Other 3%
The Growth in Specialty Drug Spending from 2013 to 2014 [May 2016]
I ■ ■ I
I l
I I
I I
I I
■ - - ■ - --
---
nn
( 5 )
Cost of Treatment and Utilization Increases
Total cost of treatment increased across all specialty drug categories.
PER PATIENT MONTHLY COST OF TREATMENT BY SELECT DRUG CATEGORIES
Of the 26 percent cost increase for specialty drugs between 2013 and 2014 for commercially-insured members, 15 percent can be attributed to higher costs for treatments. Utilization accounted for an 11 percent increase in specialty pharmacy spending. Utilization increased for each of the conditions below.
UTILIZATION BY SELECT DRUG CATEGORIES
2013Cancer
Inflammatory conditions
Multiple sclerosis
Hepatitis
HIV
$6,460 +7%
+14%
+7%
+15%
$6,908
$5,404 $6,156
$2,651
$3,762
$2,833
$4,298
$4,313
While some of the increased cost was due to drug price increases for existing agents, much of it can be attributed to new, high-cost treatments that came on the market. Hepatitis treatment had the most dramatic cost increase of more than 400 percent from 2013 to 2014 with the approval of Sovaldi (sofosbuvir) in December 2013 and Harvoni (ledipasvir/ sofosbuvir) in October 2014. Excluding these two new medications, hepatitis cost of treatment increases were in line with increases for other drug categories like multiple sclerosis and infammatory conditions, which grew at 14 and 15 percent, respectively.
2014
2013 211
234
212 222
135
77
161
83
23 15
Scripts per 100,000 member months
2014
+402%$21,573
Inflammatory Cancer HIV Multiple Hepatitis conditions sclerosis
The Growth in Specialty Drug Spending from 2013 to 2014 [May 2016]
-•
( 6 )
The cost of treatment trends for multiple sclerosis medications are different than hepatitis C, where the cost increases were caused by new expensive agents entering the market. The cost increase for multiple sclerosis was driven by uniform double-digit increases in price for most of the top volume drugs as well as by the approval of a new expensive agent, Tecfdera (dimethyl fumarate) in 2013. The cost increase for infammatory conditions was mainly due to higher prices of existing agents. As new, expensive medications become available for different conditions in the coming years, there may be similar sudden, steep increases in cost of treatment for other conditions.
Employer-Based versus Individual Markets
The Affordable Care Act (ACA) expanded access 2014 ANNUAL PER MEMBER SPECIALTY DRUG COSTS to health insurance for millions of Americans and
broadened medical benefts. Under the health reform law, anyone can obtain coverage regardless of age and health status. The law applied the ACA’s insurance reforms and expanded benefts to individual market policies sold both within and outside of government marketplaces. In 2014, annual total spending for specialty drugs was 17 percent higher per member in the individual market compared to the employer market. While the cost of treatment was similar between employer-based and individual market members, there were differences in utilization rates by condition. Utilization was higher for individual members for cancer, HIV and hepatitis, but not for infammatory conditions or multiple sclerosis.
INDIVIDUAL EMPLOYER-BASED
$489 $419 This chart includes the “Other” category.
The Growth in Specialty Drug Spending from 2013 to 2014 [May 2016]
( 7 )
PER PATIENT MONTHLY COST OF TREATMENT BY SELECT DRUG CATEGORIES FOR INDIVIDUAL MEMBERS VERSUS THOSE WHO RECEIVE COVERAGE THROUGH AN EMPLOYER IN 2014
Cancer
Multiple sclerosis
Hepatitis
Inflammatory conditions
HIV
INDIVIDUAL
EMPLOYER$6,875 $7,117
$6,204 $5,834
$2,859
$4,353
$2,771
$22,765 $21,197
$4,020
UTILIZATION BY SELECT DRUG CATEGORIES FOR INDIVIDUAL MEMBERS VERSUS THOSE WHO RECEIVE COVERAGE THROUGH AN EMPLOYER IN 2014
Scripts per 100,000 member months
297291 EMPLOYER
INDIVIDUAL 240
214 203
134
85 72
35 20
Inflammatory Cancer HIV Multiple Hepatitis conditions sclerosis
The Growth in Specialty Drug Spending from 2013 to 2014 [May 2016]
--
( 8 )
Specialty Rx Spending Varies by Region The increase in spending on specialty pharmacy from 2013 to 2014 occurred nationally, in all nine U.S. Census divisions. However, some regions had higher annual per member cost increases than others. In particular, the South, which had some of the lowest specialty pharmacy costs in 2013, had the greatest annual per member cost increases.
PER MEMBER COSTS OF SPECIALTY DRUGS BY U.S. CENSUS DIVISION
2013
2014
$369 $348 $279 $315 $296 $334 $330 $433 $409
$443 $415 $383 $395 $421 $414 $434 $478 $478
PACIFIC
MOUNTAIN
WEST NORTH
CENTRAL EAST
NORTH CENTRAL
MIDDLE ATLANTIC
SOUTH ATLANTIC
NEW ENGLAND
WEST SOUTH
CENTRAL
EAST SOUTH
CENTRAL
--------------------
--------------------
--------------------
----------------------~ --
-------
CONCLUSION AND IMPLICATIONS
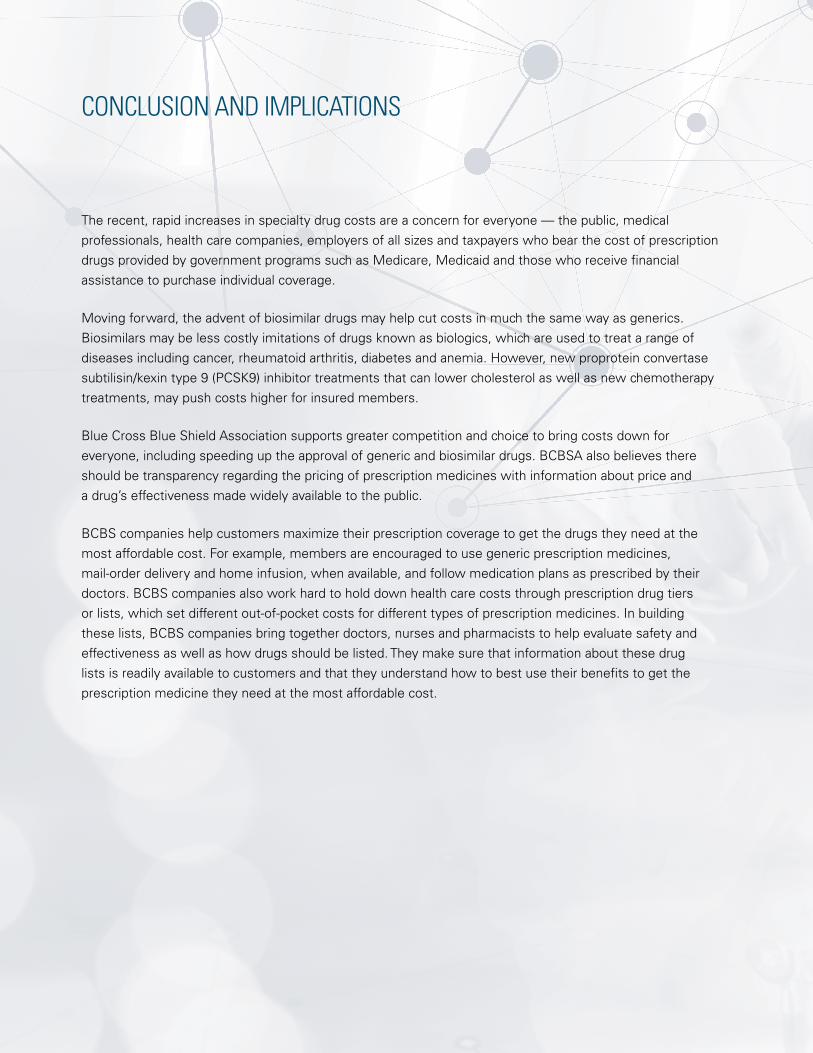
The recent, rapid increases in specialty drug costs are a concern for everyone — the public, medical professionals, health care companies, employers of all sizes and taxpayers who bear the cost of prescription drugs provided by government programs such as Medicare, Medicaid and those who receive fnancial assistance to purchase individual coverage.
Moving forward, the advent of biosimilar drugs may help cut costs in much the same way as generics. Biosimilars may be less costly imitations of drugs known as biologics, which are used to treat a range of diseases including cancer, rheumatoid arthritis, diabetes and anemia. However, new proprotein convertase subtilisin/kexin type 9 (PCSK9) inhibitor treatments that can lower cholesterol as well as new chemotherapy treatments, may push costs higher for insured members.
Blue Cross Blue Shield Association supports greater competition and choice to bring costs down for everyone, including speeding up the approval of generic and biosimilar drugs. BCBSA also believes there should be transparency regarding the pricing of prescription medicines with information about price and a drug’s effectiveness made widely available to the public.
BCBS companies help customers maximize their prescription coverage to get the drugs they need at the most affordable cost. For example, members are encouraged to use generic prescription medicines, mail-order delivery and home infusion, when available, and follow medication plans as prescribed by their doctors. BCBS companies also work hard to hold down health care costs through prescription drug tiers or lists, which set different out-of-pocket costs for different types of prescription medicines. In building these lists, BCBS companies bring together doctors, nurses and pharmacists to help evaluate safety and effectiveness as well as how drugs should be listed. They make sure that information about these drug lists is readily available to customers and that they understand how to best use their benefts to get the prescription medicine they need at the most affordable cost.
METHODOLOGY NOTES
This report defned specialty drugs as those that share some or all of the following attributes: high-cost; biologic in origin (made in or from living systems); require frequent dosing adjustments and/or intensive clinical monitoring; require special handling, including temperature control or specifc nursing expertise; and are used to manage complicated, serious and/or uncommon conditions.
This report analyzes the growth in specialty drug spending from 2013 to 2014. Because specialty drugs may be covered by insurance under either pharmacy or medical beneft (depending on how they are administered or how the health plan covers them) this report includes medications covered by both pharmacy and medical benefts. Approximately half of specialty drug spending is funded by each beneft. Examining medical beneft data is important in order to analyze changes in cancer drug spending, one of the top contributors to specialty costs, since more than 80 percent of cancer medication costs are billed through the medical beneft.
The report covers the majority of Blue Cross and Blue Shield (BCBS) companies’ commercially-insured and individual members across the country and approximately 70 percent of all BCBS membership, or a sample size of approximately 70.5 million BCBS members per year in 2013 and 2014. It does not include members who receive coverage through Medicare or Medicaid programs. All costs reported are the combined cost of payment by BCBS companies and by members (out of pocket). Costs do not account for rebates provided by drug manufactures.
This is the seventh study of the Blue Cross Blue Shield, The Health of America Report series, a collaboration between the Blue Cross Blue Shield Association and Blue Health Intelligence, which uses a market-leading claims database to uncover key trends and insights into health care affordability and access to care. This report was written by and also includes medical claims data from HealthCore, a wholly-owned and independently operated health outcomes subsidiary of Anthem, Inc.
* Any discrepancies between reported differences or percentages in the fgures are due to rounding to the nearest dollar.
Blue Cross Blue Shield Association is an association of independent Blue Cross and Blue Shield companies. Health Intelligence Company, LLC operates under the trade name Blue Health Intelligence (BHI) and is an Independent Licensee of BCBSA. 16-219-V05


![THE GROWTH IN SPECIALTY DRUG SPENDING FROM 2013 TO 2014 · 2020-03-03 · The rowth in Specialty Drug Spending from 2013 to 2014 [May 2016] 3 CMS, National Health Expenditures, Historical](https://static.documents.pub/doc/80x56/5f40753d66e06d0e1e418660/the-growth-in-specialty-drug-spending-from-2013-to-2014-2020-03-03-the-rowth-in.jpg)


