16
Application Report THE GUIDE TO STED SAMPLE PREPARATION From Eye to Insight
Application Report
THE GUIDE TO STED SAMPLE PREPARATION
From Eye to Insight

2 THE GUIDE TO STED SAMPLE PREPARATION
The Guide to STED Sample Preparation
This Guide is designed for the STELLARIS STED and STELLARIS 8 STED microscopes equipped with 592, 660 and 775 nm STED laser lines and STED WHITE objective lenses.
Stimulated emission depletion (STED) nanoscopy has revolutionized the life sciences bringing resolution well below the diffraction limit of confocal microscopy and with molecular specificity. STED is build on a confocal system, scanning the sample with an excitation beam together with a donut–shaped STED beam. In this way, fluorophores return to the ground state via stimulated emission and the effective observation volume is smaller than the diffraction–limited confocal volume. STED nanoscopy works in 2D (generating the donut–shaped beam with a vortex), and also in 3D (combining the vortex with a z–phase mask).
Using the STELLARIS STED or STELLARIS 8 STED:
> The lateral resolution that can be achieved is below 50 nm (typically 30–40 nm, depending on the sample) using the vortex donut;
> Confocal optical sectioning is intrinsically present. Combined with the high–end STED WHITE objective lenses, it is possible to image 3D structures deep inside the sample (e.g. tissue);
> The axial resolution can be pushed below 130 nm (typically 100 nm, depending on sample) combining the vortex with the z–phase mask;
> The resolution can be tuned in all three dimensions to match the needs of the application;
> Fast image acquisition is possible (several images per second);
> Live–cell nanoscopy is possible, using fluorescent proteins or other fluorescent tags, thanks to the highly sensitive spectral HyD detector;
> A broad range of suitable fluorophores can be imaged, enabled by the option of three different STED lasers (592, 660, and 775 nm) and the spectral flexibility of the white light laser (WLL) for excitation.
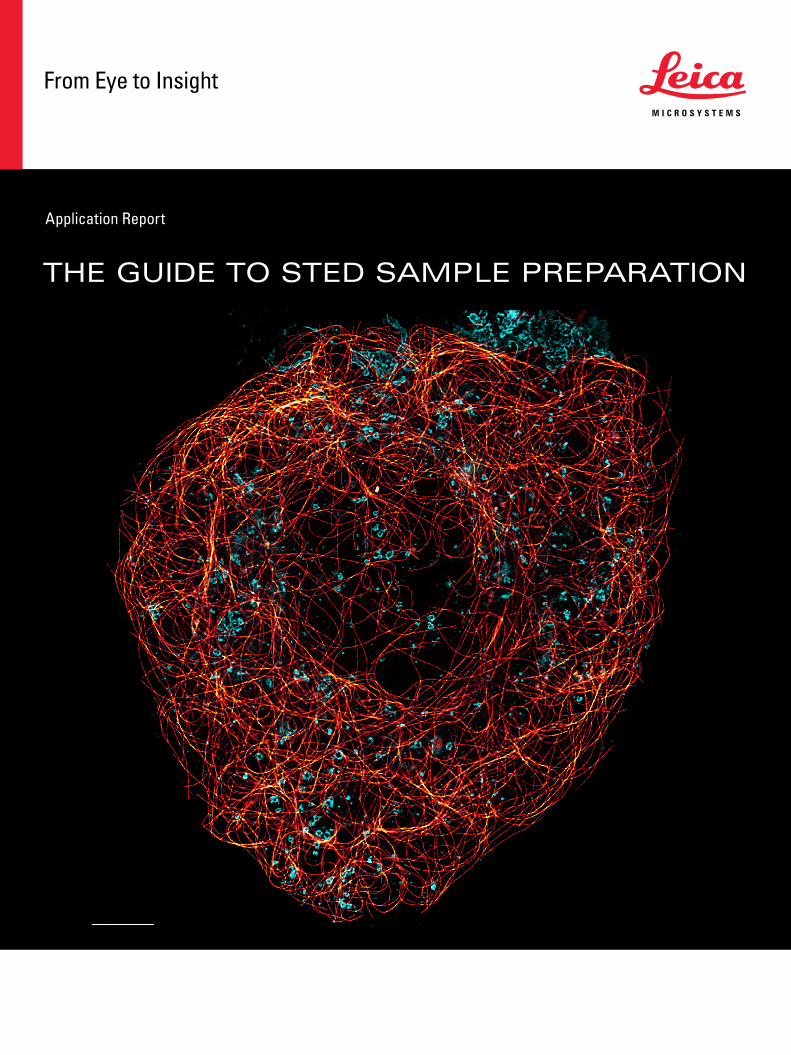
Title page: STED for Cell Biology: Multicolor live-cell TauSTED 775 resolves the intricate cytoskeleton network labeled with SiR-tubulin (glow), and trafficking vesicles labeled with CF594 (cyan). Scale bar: 5 mm . SiR-tubulin is available from Spirochrome. CF594 courtesy of Biotium, Inc.
The following guide describes the main points for successful STED imaging.
3D STED of half glomerulus in cleared kidney tissue using the STED WHITE 93x glycerol objective lens. Immunostaining with antibodies against nephrin and Atto594, Z–color coded. Scale bar: 10 μm. Sample courtesy of David Unnersjö Jess, KTH, Stockholm, Sweden .

3THE GUIDE TO STED SAMPLE PREPARATION
Quick Start
General Recommendations
The dyes and procedures outlined in this guide apply to STED in general, and to TauSTED as well.
Samples should be bright and photostable in confocal mode before starting with STED
Prepare samples only on #1.5 or #1.5H glass coverslips
Avoid flaming coverslips to clean them, as carbon particles may deposit
Avoid DAPI for counterstaining and mounting media containing DAPI
Match the refractive index (RI) of mounting medium and objective lens immersion medium as closely as possible
Respect the curing time of hardening mounting media, e.g. at least 24h for Prolong Diamond
Avoid Vectashield as mounting medium
Top 3 fluorescent labels for single color STED imaging1
STED 592 STED 660 STED 775
Fixed samplesOG 488 AF 555 STAR635P
AF 488 ATTO 542 ATTO 647N
Live–cells Citrine / mVenus / mNeonGreen SPY555 SiR / SPY650
Top 3 fluorescent label combinations for dual color STED imaging1
Fluorescent label #1 Fluorescent label #2 STED (nm)
Name Exc. (nm) Em. (nm) Name Exc. (nm) Em. (nm)
STAR 440SX 458/470 475 – 510 OG 488 514/520 523 – 580 592
AF 532 532 520 – 565 TMR 580 590 – 650 660
STAR 580 580 600 – 630 STAR 635P 635 655 – 750 775
1Rating based on internal and external feedback. It may not apply to all experimental situations, due to changes in signal intensity / stability (microenvironment, degree of labeling, mounting medium) and STED efficiency.

4 THE GUIDE TO STED SAMPLE PREPARATION
Nephrin in cleared kidney section. 3D STED at a depth of 130 to 150 μm into the tissue, using the STED WHITE 93x glycerol objective lens. Immunostaining performed with Atto594. Sample courtesy of David Unnersjö Jess, KTH, Stockholm, Sweden .
STED WHITE objective lenses
STED works for a large variety of samples: cells cultured in monolayer, cell spheroids, tissue sections, and even whole organisms, e.g. nematodes (C. elegans) and insects (e.g. larvae of D. melanogaster). The required depth of imaging is very dependent on the sample and the optical quality and chromatic correction of the objective lens can affect dramatically the STED performance.
The STELLARIS STED and the STELLARIS 8 STED systems are equipped with a dedicated family of high–end objective lenses: the STED WHITE class. The chromatic correction of the STED WHITE class delivers excellent performance all over the visible spectral range and at different depths (Figure 1).
Focu
s/μm
λ/nm
400 500 600 700 800 900 1000-1.0
-0.5
0.0
0.5
1.0
HC PL APO 100x/1.40 OIL STEDHC PL APO 86x/1.20 W CORR STED
HC PL APO 93x/1.30 GLYC CORR STEDHC PL APO 100x/1.40 OIL
Figure 1. STED WHITE Class objective lenses: Chromatic correction over the 400 – 1000 nm wavelength range.

5THE GUIDE TO STED SAMPLE PREPARATION
Depending on the application, three different objective lenses are available:
HC PL APO 100x/1.4 oil STED WHITE
HC PL APO 93x/1.3 Glyc motCORR STED WHITE
HC PL APO 86x/1.2 W motCORR STED WHITE
Magnification 100x 93x 86x
Free working distance 130 µm 300 µm 300 µm
Immersion medium Oil Glycerol* Water
Type F imm. ne23= 1.518 Type G imm. ne
23= 1.45 Glycerine
solution ne37= 1.46
Water
Application Fixed cell samples Deep tissue, fixed samples, live‑cell Live–cell, FCS
The 100x oil STED WHITE is the lens of choice for standard fixed samples and for structures close to the coverslip, and for imaging up to 30 µm deep in the sample. It gives the highest resolution based on its numerical aperture. For live cell imaging and 2D/3D Deep STED Nanoscopy, the 93x Glyc STED WHITE is the lens of choice. The motorized correction collar allows adjustment to varying coverslip thickness, changes in temperature, and optimizing for signal from deep
inside the specimen. For applications in aqueous media and STED–FCS, the 86x W STED WHITE is the recommended lens.
It is important to match the refractive index of the sample and objective lens immersion medium as closely as possible. Please check the section “Sample mounting and substrate considerations” for additional information.
Confocal
STED
3D STED cross section of Cos 7 cells showing mitochondria labeled with antibodies against Tom20. Confocal (top) and STED (bottom) fluorescence corresponds to Atto594. Scale bar 10 μm. Sample courtesy of Urs Ziegler and Jana Doehner, ZMB, University of Zurich, Switzerland.

6 THE GUIDE TO STED SAMPLE PREPARATION
Choosing a fluorescent label for STED
The palette of fluorescent labels suitable for STED imaging has grown over the years and it is possible to perform multicolor STED all over the entire visible spectrum. A selection of fluorescent labels and a rating of their STED performance can be found in Table 1. It is highly recommended to choose a fluorescent label from this list and evaluate the STED performance in situ.
Fluorophore Exc. (nm) STED (nm) Performance1
AF 488 488 592 excellent
DyLight 488 488 592 excellent
STAR 488 488 592 excellent
ATTO 488 488 592 very good
FITC 488 592 very good
STAR 440SXP 458 / 470 592 very good
OG 488488 / 514 592 excellent
660 very good
Chromeo 488488 592 excellent
660 moderate
Chromeo 505488 / 514 592 excellent
660 moderate
AF 532 532 660 excellent
AF 555 555 660 excellent
Cy3 550 660 excellent
AF 546 546 660 very good
DyLight 550 550 660 very good
ATTO 565565 660 excellent
775 very good
TMR / TRITC554 660 excellent
775 moderate
AF 594 594 775 excellent
ATTO 647N 647 775 excellent*
ATTO 594 594 775 excellent*
SiR 635 775 excellent
STAR RED 635 775 excellent
STAR 580 580 775 excellent
STAR 635P 635 775 excellent
AF 568 568 775 very good
AF 633 633 775 very good
ATTO 633 633 775 very good
ATTO 655 655 775 very good
ATTO 590 590 775 very good
Table 1. Fluorescent labels for single color STED.
1Rating based on internal and external feedback. It may not apply to all experimental situations, due to changes in signal intensity / stability (microenvironment, degree of labeling, mounting medium) and STED efficiency. *Hydrophobic, may require labeling optimization to suppress background.

7THE GUIDE TO STED SAMPLE PREPARATION
Multicolor STED is a very powerful tool to study molecular proximity with nanoscopy resolution. The STED donut determines where the fluorescence originates in space; therefore, imaging with a single STED line ensures that the different channels (colors) are intrinsically aligned. For this reason, applications requiring proximity/co–localization analysis are done using a single STED line and fluorescent labels with different emissions. It is also possible to implement a sequential workflow with
multiple STED lines, but this approach may require additional image analysis (i.e. post–processing image registration), as it is the case for channel overlay in classical co–localization experiments.
A selection of label combinations for dual and triple color STED are listed in Table 2 and Table 3. These combinations were tested for minimal cross–talk in the detection channels.
Fluorescent label #1 Fluorescent label #2 STED (nm)
Name Exc. (nm) Em. (nm) Name Exc. (nm) Em. (nm)
BD Horizon V500,
STAR 440SX
458/470 475 – 510 OG 488,
Chromeo 505
514/520 523 – 580 592
AF 532 514 520 – 565 TMR, TRITC, Cy3 580 590 – 650 660
AF 514,
OG 488
505 515 – 565 TMR, TRITC, Cy3 580 590 – 650 660
AF 594,
ATTO 594
590 600 – 630 STAR 635P,
ATTO 647N
635/650 655 – 750 775
STAR 580 575 585 – 640 STAR 635P,
ATTO 647N
635/650 655 – 750 775
STAR 600 590 600 – 640 STAR 635P,
ATTO 647N
635/650 655 – 750 775
Table 2. Fluorescent label combinations for dual color STED (single STED line)1
1 Rating based on internal and external feedback. It may not apply to all experimental situations, due to changes in signal intensity / stability (microenvironment, degree of labeling, mounting medium, sample aging) and STED efficiency. Slight adjustment of excitation lines and detection range may be required for optimal spectral separation.
STED and DNA origami imaging: TauSTED 775 delivers resolutions <30nm on GATTA-Bead R whose nominal size is 23 nm. Scale bar: 1 µm.
TauSTED

8 THE GUIDE TO STED SAMPLE PREPARATION
Confocal STED
Confocal STED
2D STED imaging of mammallian cells labeled with antibodies against vimentin (Alexa Fluor 488, green) and tubulin (Alexa Fluor 647, magenta). Scale bar 2 μm. Sample courtesy of Leila Nahidiazar, University of Amsterdam, Netherlands.
STED for kidney disease research: Multicolor 2D and 3D TauSTED 775 of non-cleared mouse kidney immunostained for synaptopodin (green) and nephrin (magenta). The STED WHITE glycerol lens provides optimal adaptive correction to resolve the proteins within the highly compact tissue architecture. Scale bar: 10 μm. Sample courtesy of Victor Puelles, Milagros Wong, and Jan Czogalla, Universitätsklinikum Hamburg-Eppendorf, Germany.
Y
X
Z
X
TauSTEDConfocal

9THE GUIDE TO STED SAMPLE PREPARATION
STED: 592 nm, 660 nm, 775 nm
Fluorescent label #1 Fluorescent label #2 Fluorescent label #3
Name Exc. (nm) Em. (nm) Name Exc. (nm) Em. (nm) Name Exc. (nm) Em. (nm)
OG 488 488 500 – 545 TMR, TRITC 550 560 – 635 ATTO 647N,
STAR 635P
640 650 – 750
OG 488* 470 475 – 525 AF 532 532 538 – 550 TMR, TRITC 580 590 – 650
AF 514* 480 490 – 535 AF 546 540 545 – 580 AF 594 590 600 – 650
TRITC 550 560 – 590 ATTO 594 600 610 – 640 ATTO 647N,
STAR 635P
660 665 – 750
AF568,
AF555
550 560 – 570 AF 594,
ATTO594
580 590– 625 SiR,
STAR 635P
640 650 – 750
Table 3. Fluorescent label combinations for triple color STED (single and multiple STED lines)1
1Rating based on internal and external feedback. It may not apply to all experimental situations, due to changes in signal intensity / stability (microenvironment, degree of labeling, mounting medium, sample aging) and STED efficiency. Slight adjustment of excitation lines and detection range may be required for optimal spectral separation.
*Multi–color images can be acquired by using either the fit ting STED laser only or both STED lasers frame/stack sequentially.
STED for Developmental Biology: smFISH* of RNA in a Drosophila embryo whole-mount preparation. Probes are directly labeled and there is no signal amplifica-tion. Top: Three color TauSTED 775 captures the signal from hb CalFluor 610 (cyan), gt Quasar 670 (green), and eve Quasar 705 (magenta). Bottom: confocal imaging of the whole Drosophila embryo. Sample courtesy of Tom Pettini, University of Manchester, UK.*Single molecule in-situ hybridization.

10 THE GUIDE TO STED SAMPLE PREPARATION
The sample of interest may contain additional fluorescent markers, for example a counterstain for confocal use only. In that case, the emission of the counterstain should fall outside the detection range of the fluorophores used for STED to avoid interference. Furthermore, the STED line may excite the markers and cause photobleaching; it is recommended to image those markers before STED imaging.
Please note: DAPI and Hoechst (typical DNA counterstains) may have a negative influence on image quality in terms of background, especially when using the 592 nm STED line. Avoid their use whenever possible. If nanoscopy images of DNA/nuclear staining are required, we recommend Picogreen (Thermofisher) for the STED lines 592 nm and 660 nm, and SiR–DNA (Spirochrome) for STED applications with the 775 nm laser.
The next section is about immunofluorescence labeling, but the fluorophore selection discussed here is valid for other labeling strategies (e.g. polypeptide tags such as SNAP and Halo, click chemistry reactions, organelle markers).
Immunofluorescence labeling considerations
After selecting the fluorescent label(s) for STED, the next step is to perform the labeling and evaluate the quality in situ. As a rule of thumb, one needs to have an excellent confocal image quality – in terms of high signal/noise ratio – before switching to STED mode.
The recommended approach for immunofluorescence labeling is to perform two experiments, A and B, sequentially or in parallel:
A) Evaluation of STED for the selected label(s) in the cellular / tissue environment
The labeling properties of fluorophores and antibodies can change with the microenvironment (pH, ionic strength, redox state). Therefore, it is recommendable to perform a control labeling in the sample of interest with a well–established primary antibody (e.g. an antibody against alpha–tubulin for cell samples). This step helps to check that the fluorescent label behaves as expected in situ.
B) Immunofluorescence labeling on the structure of interest
Using a standard protocol as starting point (see below), optimize the labeling for the structure(s) of interest. It is useful to perform a series of experiments with increasing concentrations of primary and secondary antibodies.
As mentioned above, the S/N ratio provides a good estimate for the quality of the staining. The labeling density plays an important role in signal intensity and increasing the antibody concentration can enhance sample quality. Therefore, it is advisable to test the staining with 2 to 5–fold higher secondary antibody concentrations than the typical working (confocal) concentrations to ensure optimal labeling density.
Standard immunofluorescence labeling protocol
Each action performed in immunofluorescence labeling has a distinct influence on sample quality. The following protocol serves as a starting point for mammalian cells. If the sample of interest has already a well–established staining protocol, that can be tested directly and maybe even optimized with the following recommendations.
Reagents:
> Phosphate buffer saline (PBS), pH 7.4
> 2% Paraformaldehyde (PFA) in PBS
> 0.1% Triton in PBS
> Bovine Serum Albumin (BSA)

11THE GUIDE TO STED SAMPLE PREPARATION
Procedure:
All steps are performed at room temperature.
1. Rinse 3x with PBS.
Cells should be washed, culture medium removed by rinsing several times. Tissues should be dissected and cleaned from parts that could hinder image acquisition. Use established lab protocols, if they are known to work. Samples must be treated gently and quickly.
2. Fix with 2% PFA in PBS for 15 min.
Fixation is a critical step, as it defines how well the structure(s) will be preserved. This step becomes even more critical at the resolution STED provides, and thus should be addressed with care. PFA is a common fixative, but it is not always the best performing one. Literature search and optimization may be required, along with the recommended guidelines from the primary antibody manufacturer. Alternatively, a 5 min incubation with ice–cold (–20°C) 100% methanol can be used. Methanol fixation does not require subsequent permeabilization steps (steps 5 and 6 can be ignored). Recently, a new fixation method based on glyoxal was reported and may be an alternative. For details, refer to Richter et al., EMBO J. 2018 Jan 4; 37(1): 139–159.)
3. Rinse 3x with PBS.
Remove most of the fixative quickly for the following steps.
4. Wash 3x with PBS (5 min each).
Remove the rest of the fixative for the following steps.
5. Permeabilize with 0.1% Triton in PBS for 10 min.
Crucial step to reveal epitopes to primary antibodies. Lower concentrations / shorter incubation times may preserve the structure better, but compromise labeling density. Higher concentrations / longer incubation times may make the epitope more accessible to antibodies but also deteriorate the structure. Some fixatives –e.g. methanol– do not need extra permeabilizing steps.
6. Rinse 3x with PBS.
Remove permeabilizing agents.
7. Block with 2% BSA in PBS for 1h.
Blocking can be performed with different agents, normally consisting of inert proteins that bind to non–specific binding partners which would otherwise bind to antibodies and increase the unspecific labeling of fluorescent dyes. It is also advisable to use blocking agents while incubating with antibodies, as e.g. the serum helps in preserving the cellular structure. Thicker tissues might require longer incubation times.
8. Incubate with primary antibody for 1h.
Higher antibody concentrations may be helpful for increasing labelling density for better STED imaging. Longer incubation times may give better results, but also may increase background, so it needs to be checked. In thicker samples (e.g. whole mounts), incubation may take up to days. Alternatively, the incubation can be done at 4°C overnight.
9. Wash 3x with PBS (5 min each).
Washing steps are important, especially when using high concentration of antibodies. 5 minutes is the absolute minimum for washing steps here. Longer washing times (10 – 20 min) can deliver better results. Previous rinsing steps may speed up the process.
10. Incubate with secondary antibody for 1h.
Antibody concentration may need optimization in terms of S/N ratio. A good starting point is a 1:100 dilution for commercially available fluorescently labeled antibodies; for other antibody sources, a good starting point is 5x higher concentration than the recommended one. Thicker tissues need longer incubation times.
11. Wash 3x with PBS (5 min each).
Remove unbound antibodies from sample. Longer and more washing steps will increase the quality of the labeling. Previous rinsing steps may speed up the process.
12. Mount.
See “Sample mounting and sample substrate considerations” section.
13. Store at 4°C until imaging.
As mentioned above, the staining should look crisp and bright when observed through the ocular. The staining should yield good S/N in confocal images.

12 THE GUIDE TO STED SAMPLE PREPARATION
An important point to consider for STED imaging in combination with immunofluorescence is the size of the tag. The size of an antibody molecule (IgG approximately 10 nm) may become the limiting factor for labeling density and the size of the structure measured with STED. If size becomes an issue, a different approach using smaller tags, such as F(ab)–fragments or fluorescently labeled nanobodies, may be more adequate. Alternatively, polypeptide tags expressed with the target protein through transfection or genome–editing techniques, or a fluorescent tag directed to the structure of interest (e.g. phalloidin fluorescent conjugates for actin) can deliver excellent STED image quality.
Sample mounting and substrate considerations
Optimal optical performance requires an environment with a homogeneous index of refraction to enable a high penetration depth and to minimize aberrations. Hence, the mounting medium should have a refractive index that matches the immersion medium of the objective lens. Furthermore, autofluorescence derived from the mounting medium should be negligible upon application of the STED laser (592, 660 or 775 nm).
Changes in the refractive index due to sample composition –for example, myelin and fat in tissue samples– may distort the shape of the focal spot and affect the STED performance. In such cases, optical clearing can help. Details of STED combined with optical clearing are described in the “3D Deep STED Nanoscopy” workflow: https://www.leica–microsystems.com/applications/life–science/3d–sted–nanoscopy/ and in Unnersjö–Jess et al., Kidney International, 2015. Also, clearing with the SeeDB2 protocol has been used to map the neuronal circuitry (Meng–Tsen Ke et al., Cell Reports, 2016).
Prolong Gold and Prolong Diamond anti–fade reagents (Thermo Fisher Scientific) are good starting options for mounting samples for STED and can be used for cells in culture unless a different mounting medium is required. It is very important to follow the indications about the curing times from the manufacturer (for example, we recommend to wait at least 24 h before imaging samples mounted in Prolong Gold / Diamond).
In some cases, the mounting medium can alter the fluorescent properties of the labels. For example, VectaShield (Vectorlabs) affects the fluorescence quantum yield of large Stoke’s shift dyes and should be avoided in those cases; mounting media containing DAPI should be avoided in general. The 2,2‑Thiodiethanol (TDE) can affect the behavior of fluorescent proteins and some green dyes. For a list of dyes working in TDE, please refer to Staudt et al., Microscopy Research and Technique, 2007.
For home–made mounting medium options, very good results were obtained with glycerol–based recipes as described below:
A Mixtures of glycerol / water–based solutions
Mixtures of PBS and glycerol produce mounting media with refractive indices that can be adjusted between 1.33 and 1.47. They are easy to prepare and suitable for longer sample storage at –20°C. The media are particularly useful in combination with the 93x STED WHITE glycerol lens. Adding antifading reagents, e.g. DABCO (2.5 %) or NPG (4 %), can help when higher photostability is needed. Antifading reagents containing p–phenylenediamine decrease STED performance and should be avoided.
B Mowiol mounting medium
Take 6 g of glycerol (analytical grade) and add 2,4 g of Mowiol powder, 6 ml of H2O, 12 ml of 0.2 M TRIS buffer pH 8, and stir the solution ca. 4 h. After that, let the solution rest for additional 2h. Heat the mixture in a water bath for 10 min at 50°C and then centrifuge at 5000 g for 15 min. Finally, take the supernatant and store aliquots at –20°C. Mowiol can be used for storing samples at –20°C. DABCO (2.5 %) can be added for higher photostability.

13THE GUIDE TO STED SAMPLE PREPARATION
The most common mounting media for STED applications are summarized as follows (Table 4):
Mounting Medium Provider Comment
Glycerol e.g. Sigma–Aldrich RI adjustable in combination with water–based solutions (~1,43 – 1,47).
Mowiol1 e.g. Calbiochem Excellent for long–term sample storage at –20 C.
Prolong Gold1
Prolong Diamond1
Thermo Fisher Scientific Excellent for long–term sample storage at –20 C. Follow instructions for adequate
curing time before imaging samples
TDE e.g. Sigma–Aldrich RI adjustable (1,33 – 1,52).
Affects fluorescence yield of fluorescent proteins and green dyes2
1Recommended mounting media for cellular applications.
2Staudt et al., 2,2–Thiodiethanol: A New Water Soluble Mounting Medium for High Resolution Optical Microscopy, Microcopy Research and Technique, 2007
The material and thickness of the substrate supporting the sample constitutes a critical point in terms of the optical STED performance. All Leica objective lenses with coverglass correction are corrected for #1.5 coverslips, thickness: 0.170 ± 0.01 mm (e.g. Hecht–Assistent, cat. number 1014/2424 or Menzel). To ensure optimal STED performance, it is recommended to go even further with quality and only use high precision glass coverslips / bottom cell culture chambers, #1.5H (thickness 0.170 ± 0.005 mm). For glass coverslips, this option is available from, e.g., Marienfeld–Superior. For glass bottom cell culture chambers, the following types have shown good results: Lab–Tek Chamber Slide System (Thermo Fisher Scientific), Ibidi µ–slides / µ–dishes (Ibidi GmbH), and Mattek glass bottom dishes (MatTek Corporation).
Please note: The use of #1 coverslips significantly decreases image quality, both in terms of loss of resolution and signal intensity, and, therefore, should be avoided.
If the sample substrate or the sample itself absorbs in the STED beam wavelength (592, 660, or 775 nm), it may be destroyed during imaging. This same problem is common for substrates, such as polymer coverslips and resins used for embedding, and samples containing natural pigments. Therefore, it is crucial to avoid these substrates, if possible, and areas of the sample with strong STED absorption as much as possible.
Triple color, 2D STED imaging of Cos 7 cells stained with antibodies against NUP153 (AF568, green), TOM20 (Atto 594, magenta), and with SiR–actin
(SiR, gray). Confocal (top) and STED (bottom) comparison of a sample mounted in Prolong Diamond. Scale bar 2 μm. Sample courtesy of Urs Ziegler and
Jana Doehner, ZMB, University of Zurich, Switzerland.
Confocal
STED

14 THE GUIDE TO STED SAMPLE PREPARATION
Live–cell STED imaging
STED has extended its range of applications to imaging dynamic processes in live cells and organisms with nanoscopy resolution. The live cell capability is significantly improved by TauSTED, which utilizes reduced light dose and delivers high image quality and resolution. To get the best STED performance, a fundamental step is, again, selecting the most appropriate fluorescent label. For live–cell imaging, there are two main strategies to choose from, namely using fluorescent proteins (FPs) or using organic fluorophores. In the case of FPs, a straightforward approach is the expression of the protein of interest fused to a fluorescent protein (FP). The options for FPs suitable for STED are summarized below (Table 5).
Name Excitation (nm)
STED (nm)
Performance*
mTFP 462/470 592 excellent
mTurquoise 434/470 592 very good
eGFP 484 592 very good
EmGFP 487 592 very good
mNeonGreen 506 592 excellent
660 moderate
eYFP 514 592 excellent
660 moderate
Venus 515 592 excellent
660 moderate
mCitrine 516 592 excellent
660 moderate
DsRed/mRFP 558 660 very good
mStrawberry 574 660 very good
mCherry 587 775 moderate
iRFP 690 775 moderate
Table 5. Fluorescent proteins suitable for STED imaging
Organic fluorophores outperform FPs in STED imaging, especially in the red emission range, but have the drawback of being more difficult to target to the structure of interest, plus being non cell–permeable. However, developments in recent years have shown a growing interest and success in labeling approaches based on tags that can be combined with cell–permeable fluorophores for STED nanoscopy (Table 6). A smart approach is to clone the protein of interest with a small polypeptide (e.g. SNAP–tag, Halo–tag, Fluorogen–activating proteins) that reacts in situ with cell–permeable fluorescent tags. An example of this strategy that produces excellent STED results is the combination of
Halo–tag and SiR–CA for single color STED applications. Dual color, live–cell STED imaging using SNAP–tag / ATTO590–BG and Halo–tag / SiR–CA has been reported by Bottanelli et al., Nature Communications, 2016. Another interesting concept for live–cell STED with exchangeable fluorogenic probes was demonstrated by Spahn et al., Nano Letters, 2019. This approach enables whole cell, 3D, multi–color STED for extended periods of time and with excellent signal to noise ratio. Recently, Johnsson group developed a set of cell permeable, fluorogenic, STED compatible fluorophores, which allow wash‑free, multicolor, live‑cell nanoscopy. Wang. et. al. Nature Chemistry, 2020. The variants of SNAP‑tag and Halo‑tag in addition broaden enormously the range of possible cellular targets.
Name Excitation (nm)
STED (nm)
Performance*
Tubulin Tracker Green 488 592 excellent
OG 488 BAPTA 494 592 excellent
SPY505‑DNA1 512 592 excellent
TMR, Methyl Ester,
Perchlorate (TMRM)
540 660 excellent
SPY555‑DNA / ‑actin,
/‑tubulin, SPY555‑BG
(for SNAP‑tag)1
555 660 excellent
ATTO590–BG
(for SNAP–tag)2
590 775 excellent
SiR–based probes
(SiR–tubulin,
SiR–actin, SiR–CA)3
635 775 excellent
Nile Red 561 775 excellent
Fluorogen Activated
Proteins / Malachite
Green
640 775 excellent
SPY595‑DNA1 599 775 excellent
SPY620‑DNA /‑actin,
SPY620‑BG
(for SNAP‑tag)1
619 775 excellent
SPY650‑DNA /
‑tubulin, SPY650‑BG
(for SNAP‑tag)1
652 775 excellent
Table 6. Organic fluorescent labels for live–cell STED
*Rating based on internal and external feedback. It may not apply to all experimental situations, due to changes in signal intensity / stability (microenvironment, degree of labeling, mounting medium) and STED efficiency.
1 and 3commmercially available from Spirochrome2commercially available New England Biolabs Inc.

15THE GUIDE TO STED SAMPLE PREPARATION

CONNECT
WITH US!
Leica Microsystems CMS GmbH · Am Friedensplatz 3 · 68165 Mannheim, GermanyT +49 621 7028 2801 · F +49 621 7028 1180
www.leica‑microsystems.com
Copy
right
© 0
3/20
21 L
eica
Mic
rosy
stem
s CM
S Gm
bH, M
annh
eim
, Ger
man
y. A
ll rig
hts
rese
rved
. Sub
ject
to m
odifi
catio
ns. L
EICA
and
the
Leic
a Lo
go a
re re
gist
ered
trad
emar
ks o
f Lei
ca M
icro
syst
ems
IR G
mbH
.


