24
The hidden harmony is better than the obvious one. Heraclitus

The hidden harmony is better than the obvious one.
Heraclitus

On Variations in the Peak Luminosityof Type Ia Supernovae
Frank TimmesThermonuclear Applications Group X-2
Los Alamos National Laboratory
LA-UR-04-5097 www.cococubed.com
KITP - Accretion and Explosion: the Astrophysics of Degenerate Stars
20Feb2007
• A few observations
• Why the intrinsic scatter?
• Tracking the proton/neutron ratio
• Some new results
An outline of this talk on thermonuclear supernovae

Filippenko, 1997
The spectra and light curves near peak light are similar.
Barbon et al 1973Doggett et al 1985
13
14
15
16
174000 6000 8000 10000
Rest Wavelength (Angstrom)
-2.5
log
f ! +
Con
stan
t
SNIa
t ~ 1 week
90N
87N
87D
Fe IICo II
Si IICa II
Fe IIIFe II
Ee IIFe IIISi II
S II
Si IIO I
Ca II 0
1
2
3
4
5
6
7
0 50 100 150 200 250 300
Days After Maximum Light
mB B
elow
Max
imum
Lig
ht
Type Ia Supernovae
Blue Light Curves
38 Events

• The Phillips relation compensates for the variation in peak luminosity to give a standard candle.
• This makes the peak luminosity a function of a single parameter: e.g., the width of the light curve or the mass of 56Ni ejected.
Kim et al. 1997
Brighter light curves are broader.
-20 0 20 40 60
-17
-18
-19
-20
-20 0 20 40 60
-17
-18
-19
-20
as measured
light-curve timescale
“stretch-factor”corrected
days
MV
- 5
log(h
/65)
days
MV
- 5
log(h
/65)
Calan/Tololo SNe Ia

Riess et al. 1998
Dimmer than the template is interpreted as evidence an accelerating universe.
Supernova Cosmology Project
34
36
38
40
42
44
WM=0.3, WL=0.7
WM=0.3, WL=0.0
WM=1.0, WL=0.0
m-M
(m
ag
)
High-Z SN Search Team
0.01 0.10 1.00z
-1.0
-0.5
0.0
0.5
1.0
!(m
-M)
(ma
g)
Accelerating
Low Density
High Density
Accelerating
Low Density
High Density

For nearby supernovae, the intrinsic variation in peak magnitude is ~0.5 in the B and V bands.
For more distant events, there are several sub-luminous events which broaden the variation to about 1 magnitude in B.
-19.8
-19.6
-19.4
-19.2
-19
Peak A
bsolu
te M
agnitude B
-band
SN
19
90
NN
GC
46
39
SN
19
81
BN
GC
45
36
SN
19
89
BN
GC
36
27
SN
19
98
bu
NG
C 3
36
8
SN
19
72
EN
GC
52
53
SN
19
37
CIC
41
82
SN
19
60
FN
GC
44
96
A
Type Ia SN with Cepheid-based distances
Gibson et al. 2000
-19.8
-19.6
-19.4
-19.2
-19
-18.8
-18.6
-18.4
-18.2
Pe
ak
Ab
so
lute
M
ag
nitu
de
B
-ba
nd
90
O9
0T
90
Y9
0a
f9
1S
91
U9
1a
g9
2J
92
K9
2P
92
ae
92
ag
92
al
92
aq
92
au
92
bc
92
bg
92
bh
92
bk
92
bl
92
bo
92
bp
92
br
92
bs
93
B9
3H
93
O9
3a
g9
3a
h
Distant Type Ia SN
Hamuy et al. 1996

School of Athens1510Raffaello Sanzio
Let’s re-explore the idea that variations in the peak luminosity originate in part from a scatter in the metallicity of the main-sequence stars that become white dwarfs.

Most of a main-sequence star's initial metallicity comes from the CNO and 56Fe nuclei inherited from its ambient interstellar medium.
The slowest step in the hydrogen burning CNO cycle is 14N(p,γ).All the CNO piles up at 14N when hydrogen burning is done.
12C
13N
13C 14N
15O
15N
Cycle 1
(p,!)
(p,!)
(p,!)(,e+")
(,e+")
(p,#)
17O
17F
16O
18F
18O 19F
Cycle 2 Cycle 3
Cycle 4
(p,!)
(p,!)
(p,!)
(p,!)
(,e+")
(,e+")
(p,#)
(p,#)(p,#)5.0-
0
5.0
1
5.1
2
5.2
3
5.3
4
5.4
5.345.45
log
L/L s
un
Tgol ffe
Central Stars of Planetary Nebulae
WhiteDwarfs
AGB
RGB
post-AGB
main-sequence
ZAHB
9.1
8.3 7.7
6.4
2.73.7
shown: 6.8(9.7 to Teff=4200K)
Herwig, ARAA, 20052 Msun, Z=Zsun
During helium burning all of the 14N is converted into 22Ne by 14N(α,γ)18F (β+,νe)18O (α,γ)22Ne.

Mass and charge conservation set the white dwarf’s 22Ne mass fraction and neutron enrichment
X(22Ne) = 22!X(12C)
12+
X(14N)14
+X(16O)
16
"
Ye =1022
X(22Ne) +2656
X(56Fe) +12
!1!X(22Ne)!X(56Fe)
"
n!
i=1
Xi = 1 Ye =n!
i=1
Zi
AiXi
Assuming the 22Ne and 56Fe are uniformly distributed.

Carbon-Oxygen White Dwarf
Type Ia Supernova Neutron Star
Accrete He Accrete H or He Accrete C+ODouble degenerate merger
Near Central IgnitionDetonate He at base
Supersoft x-ray sources?
Carbon doesn't detonate
Carbon detonatesSub-Chandra model
Fast, dim SNIawith remnant
Light C at edge
O+Ne+Mg WD
> 8x10⁹ g/cc
~ 2x10⁹ g/cc
Mchandra
Standard Model
He S
hell Grows
C+O Nova
M < 4x10⁻⁸ Msun/yr
M > 3x10⁻⁶ Msun/yr
M < 10-8 Msun/yr
We’ll assume the standard model of a Type Ia supernova.

W7, Nomoto et al. 1984
Nearly all such 1D models produce most of their 56Ni in a nuclear statistical equilibrium environment between ~ 0.2 and 0.8 Msun.
In this region, weak reactions occur on time-scales longer than the time-scale for disruption of the white dwarf.

Höflich et al., 1998
While many 1D models have sophisticated flame treatments, we want to elucidate physics that are robust to any complicated hydrodynamics.
Iwamoto et al., 1999
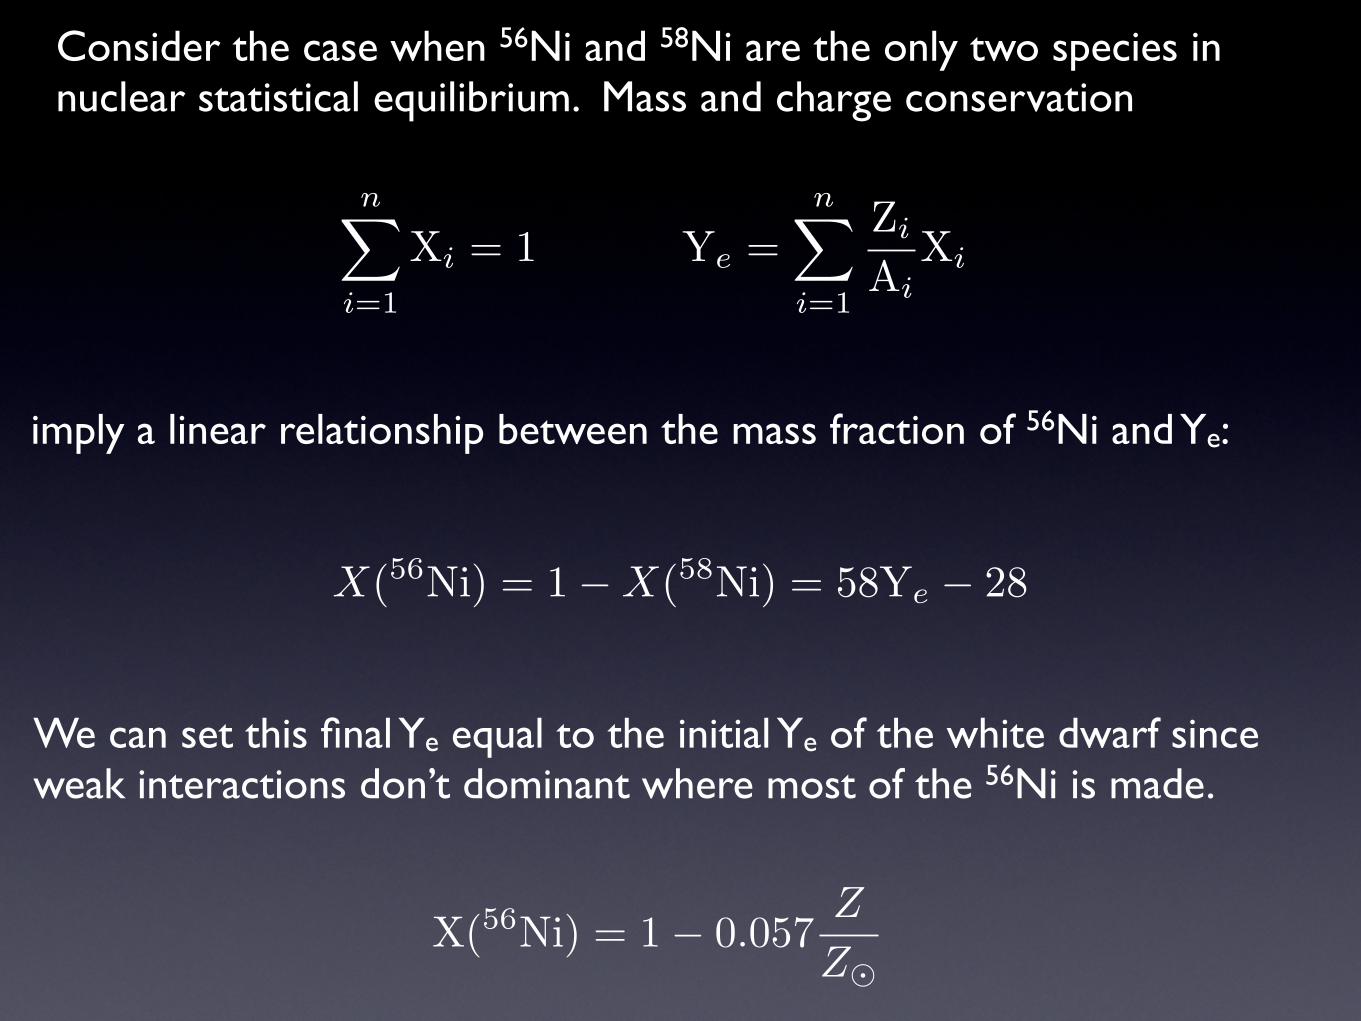
Consider the case when 56Ni and 58Ni are the only two species in nuclear statistical equilibrium. Mass and charge conservation
imply a linear relationship between the mass fraction of 56Ni and Ye:
n!
i=1
Xi = 1 Ye =n!
i=1
Zi
AiXi
X(56Ni) = 1!X(58Ni) = 58Ye ! 28
We can set this final Ye equal to the initial Ye of the white dwarf since weak interactions don’t dominant where most of the 56Ni is made.
X(56Ni) = 1! 0.057Z
Z!

The average peak B and V magnitudes of nearby Type Ia events imply ~0.6 Msun of 56Ni is produced. Using this fiducial mass gives
M(56Ni) =!
X(56Ni)dm ! 0.6"1" 0.057
Z
Z!
#M!
If a third isotope is present, say 54Fe, then Saha-like equations must be solved for the NSE distribution. The net result is a slightly shallower slope
M(56Ni) ! 0.6!1" 0.054
Z
Z!
"M!
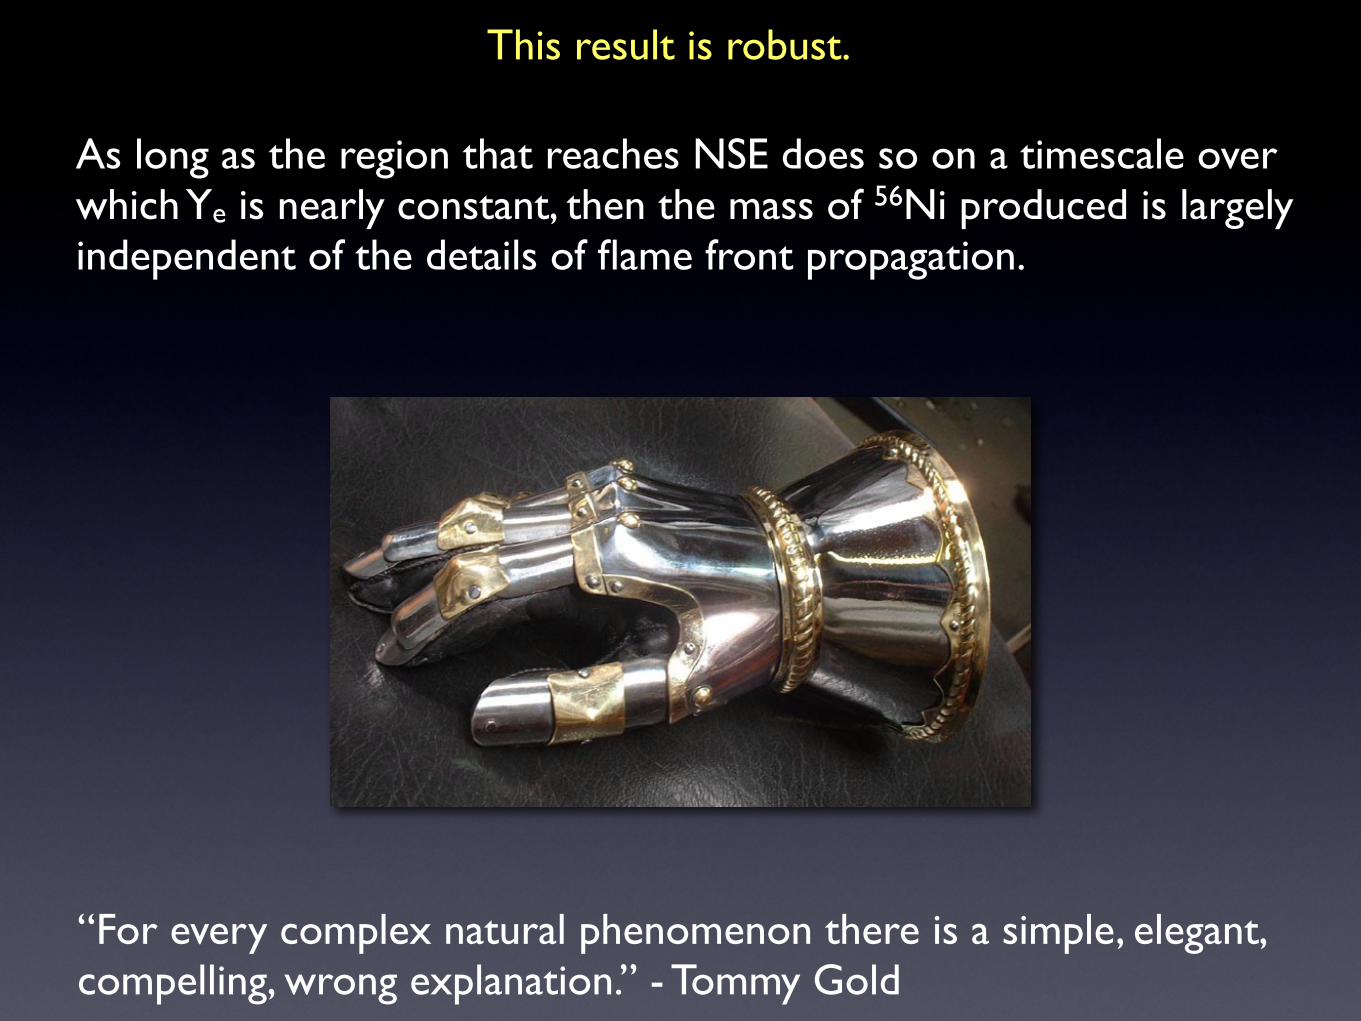
As long as the region that reaches NSE does so on a timescale over which Ye is nearly constant, then the mass of 56Ni produced is largely independent of the details of flame front propagation.
This result is robust.
“For every complex natural phenomenon there is a simple, elegant, compelling, wrong explanation.” - Tommy Gold
10-1
100
101
.2
.4
.6
Mass o
f 56N
i eje
cte
d (
Msun)
Metallicity of Progenitor (Z/Zsun
)
Dominguez et al.
Analytical result
W7 models
Factor of 3 variation
in the CNO + Fe abundances
~25% variation
in56
Ni
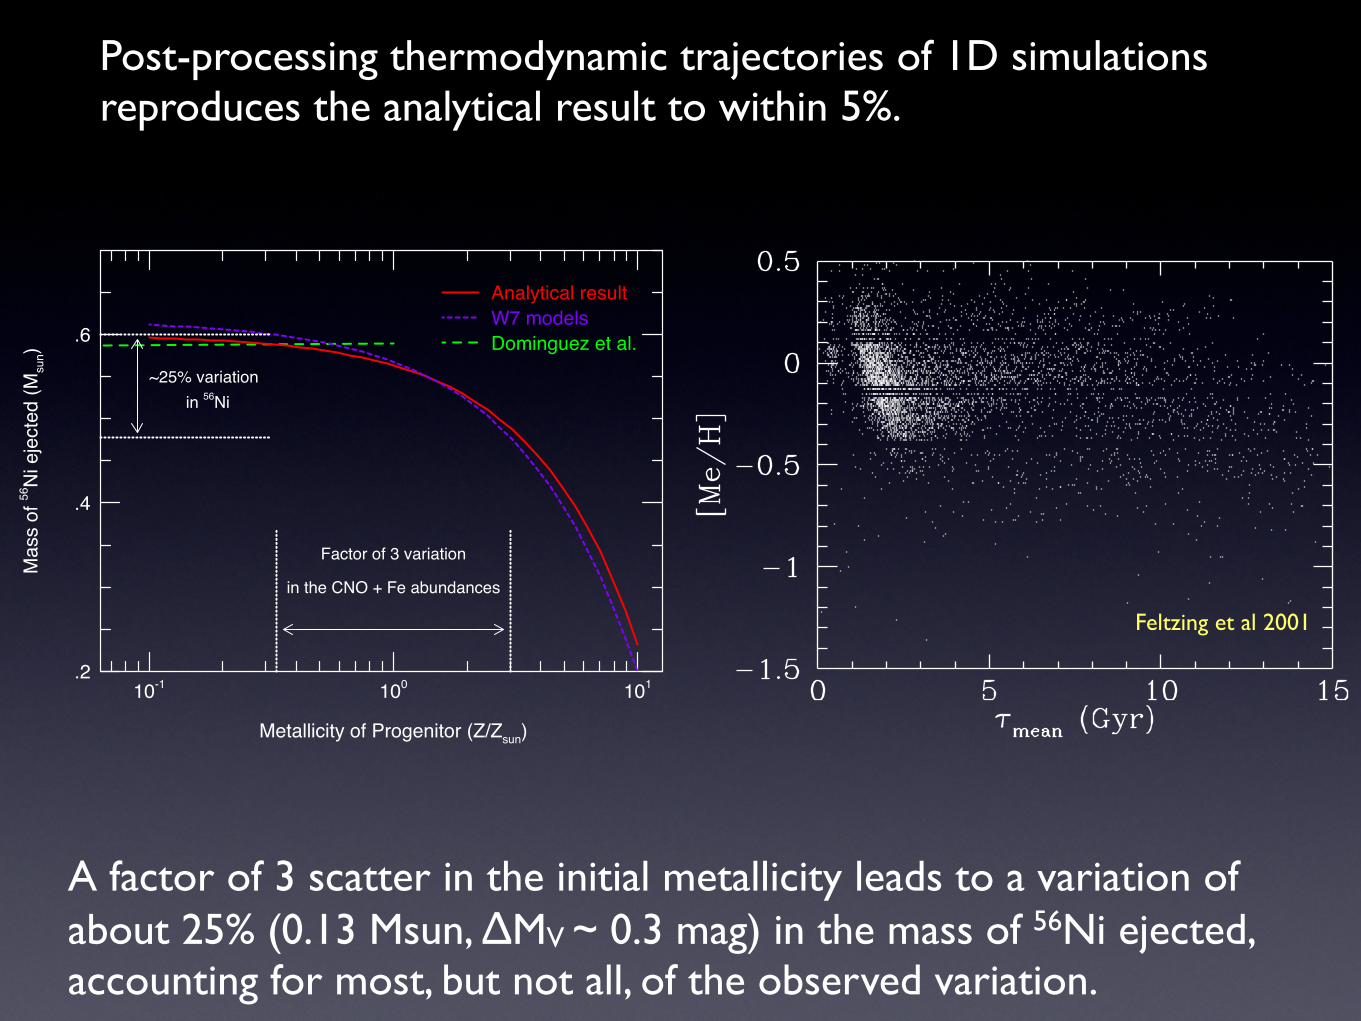
Post-processing thermodynamic trajectories of 1D simulations reproduces the analytical result to within 5%.
A factor of 3 scatter in the initial metallicity leads to a variation of about 25% (0.13 Msun, ΔMV ~ 0.3 mag) in the mass of 56Ni ejected, accounting for most, but not all, of the observed variation.
Feltzing et al 2001
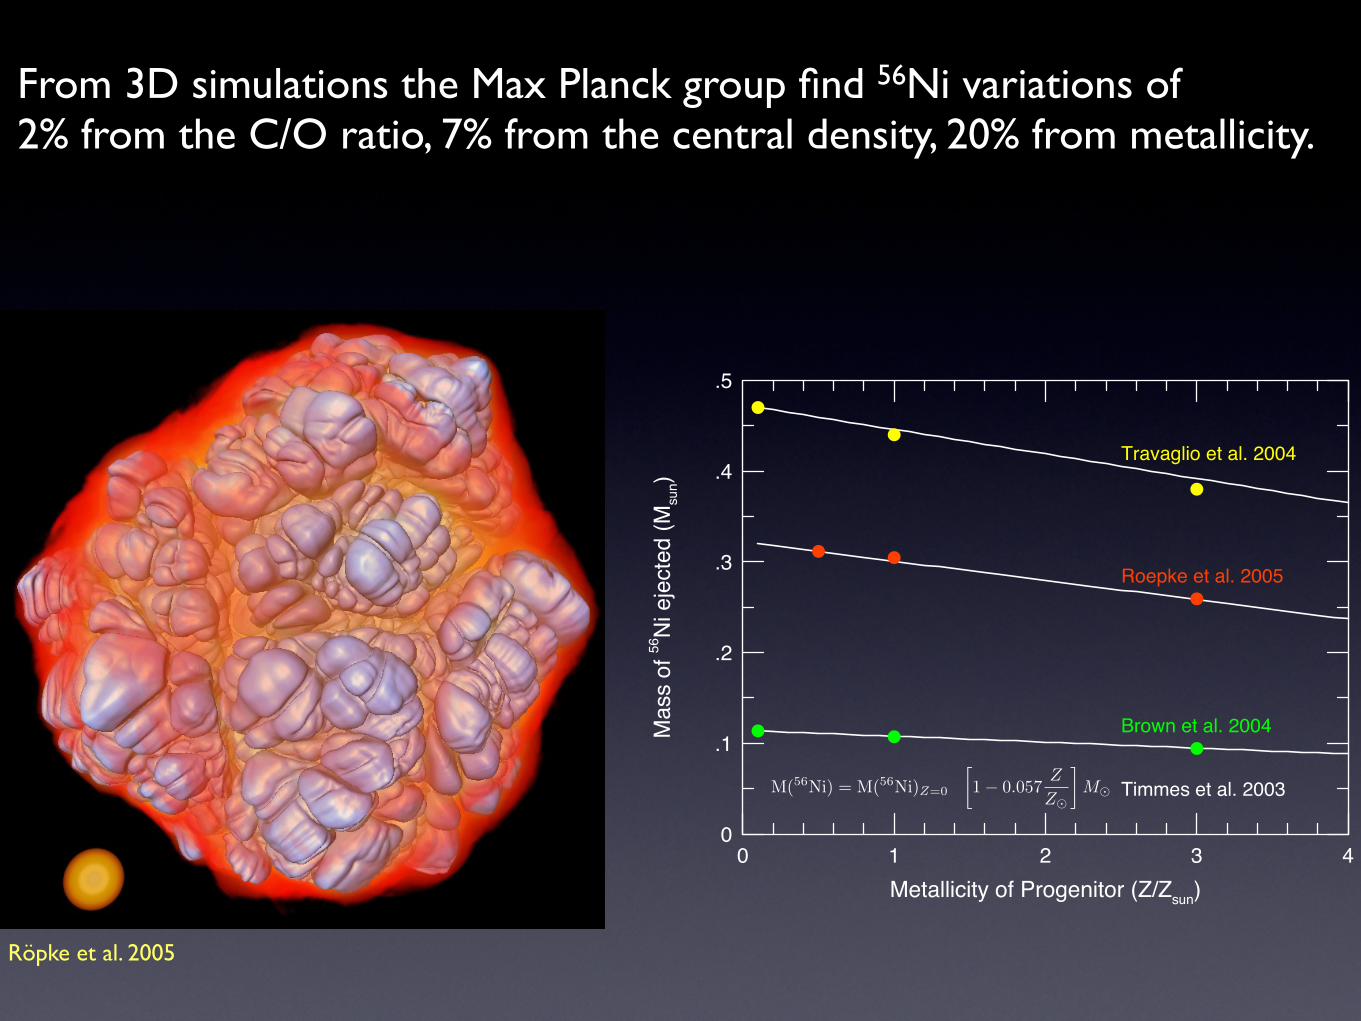
0 1 2 3 40
.1
.2
.3
.4
.5
Ma
ss o
f 56N
i e
jecte
d (
Msun)
Metallicity of Progenitor (Z/Zsun
)
Roepke et al. 2005
Travaglio et al. 2004
Brown et al. 2004
Timmes et al. 2003M(56Ni) = M(56Ni)Z=0
!1! 0.057
Z
Z!
"M!
From 3D simulations the Max Planck group find 56Ni variations of 2% from the C/O ratio, 7% from the central density, 20% from metallicity.
Röpke et al. 2005

0.5
1
1.5
2
2.5
8.4 8.6 8.8 9 9.2 9.4
m1
5(B
)
Log(O/H) + 12
E/S0 Galaxies
Spiral Galaxies
H00 Spiral Galaxies
H00 E/S0 Galaxies
Model Prediction
Gallagher et al 2005
From ~60 host galaxies, Ivanov et al (2000) and Gallagher et al (2005) suggest age rather than metallicity better expresses the observed trends.
Ivanov et al 2000

Podsiadlowski et al 2006 showed that electron captures on 22Ne during the simmering phase could magnify the effect of metallicity
Podsiadlowski et al 2006
15M = 0.8
M = 1.815
!cfirst parameter ( ?)
faint
brightseco
nd
par
amet
er (
Z?)
high!z sample
local sample
faint bright
"
"
X(56Ni) = 1!
0.1650.1110.058
Z
Z!
and examined the effects of metallicity on the determination of cosmological parameters.

Dursi & Timmes 2007
1e+09
2e+09
3e+09
4e+09
5e+09
6e+09
7e+09
8e+09
9e+09
0 0.005 0.01 0.015 0.02 0.025 0.03 0.035 0.04 0.045
Tem
p(K
)
Time (s)
Ignition Delay Time
Metallicity reduces the ignition time; even modest amounts of 22Ne can reduce the ignition time of CO mixtures 20-30% +
Ignition occurs at rare peaks in the tails of PDFs; 22Ne can greatly increase probability of points igniting.
Different state at ignition time for metal-rich WD?If so, may introduce a metallicity-central density entanglement.
7.0 7.5 8.0 8.5 9.0 9.5 10.0Log10 density
8.6
8.8
9.0
9.2
9.4
9.6
9.8
10.0
Log10 tem
pera
ture
never ignites million sec1000 sec
1 sec
1 sec 1 millisec
1 microsec
1 nanosec
1 picosec
7.0 7.5 8.0 8.5 9.0 9.5 10.0Log 10 dens
8.6
8.8
9.0
9.2
9.4
9.6
9.8
10.0
Lo
g 1
0 t
em
p
+2%
-2%
-2%-2%
-5%
-5%
-5% -5%
-10%
-10%-10%
-10% -10%
-20%
-20%
-20%
-30%
0.0 0.2 0.4 0.6 0.8 1.0
1-[Y12/max(Y12)]
0.000
0.002
0.004
0.006
0.008
0.010
Y
4He
22Ne
1H
28Si
20Ne
X 22 = 0.06
X 22 = 0.00
108 109
density (g cm-3)
0.1
1.0
10.0
100.0
1000.0
flam
e sp
eed (
km
s-1
)
TW92
130 nuclide
430 nuclide
Fit
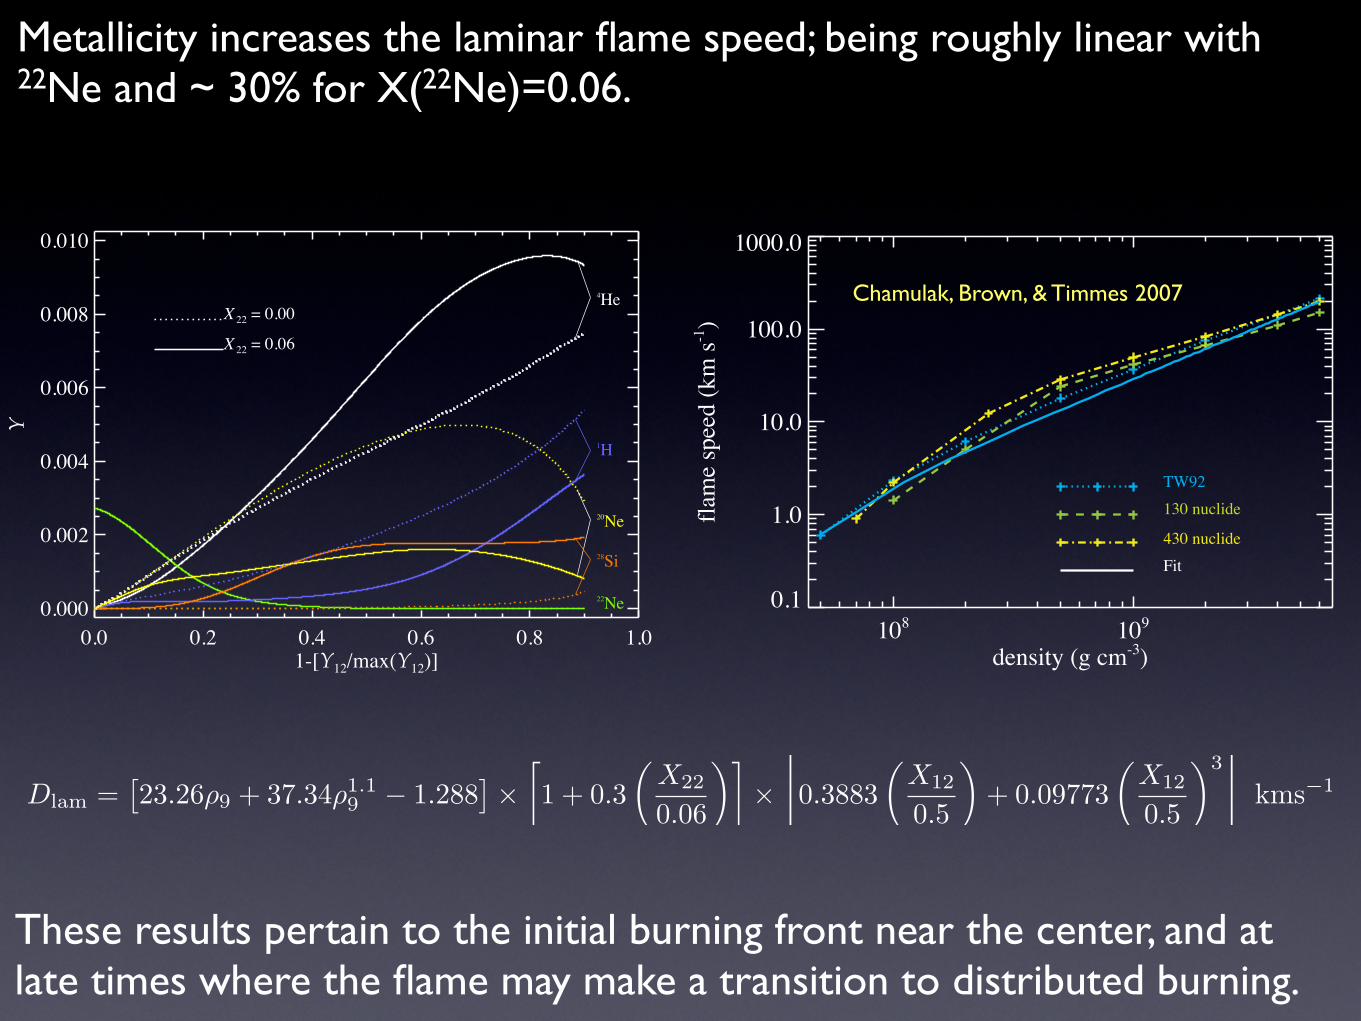
Chamulak, Brown, & Timmes 2007
Metallicity increases the laminar flame speed; being roughly linear with 22Ne and ~ 30% for X(22Ne)=0.06.
These results pertain to the initial burning front near the center, and at late times where the flame may make a transition to distributed burning.
Dlam =!23.26!9 + 37.34!1.1
9 ! 1.288""
#1 + 0.3
$X22
0.06
%&"
'0.3883
$X12
0.5
%+ 0.09773
$X12
0.5
%3(
kms!1

0.000 0.001 0.002 0.003
dY(12C)
0.0000
0.0002
0.0004
0.0006
0.0008
dYe
Can 22Ne be produced in-situ?
Yes, during the helium shell flashes in an AGB star. Falk Herwig and I are calculating some numbers.
Chamulak, Brown, & Timmes, in preparation,2007
Yes, during laissez-faire carbon burning during the simmering phase!
5.0-
0
5.0
1
5.1
2
5.2
3
5.3
4
5.4
5.345.45
log L
/L sun
Tgol ffe
Central Stars of Planetary Nebulae
WhiteDwarfs
AGB
RGB
post-AGB
main-sequence
ZAHB
9.1
8.3 7.7
6.4
2.73.7
shown: 6.8(9.7 to Teff=4200K)
Self-heating calculations suggest 12C(12C,p)23Na(e-,ν)23Ne and 12C(p,ϒ)13N(e-,ν)13C operate with enough vigor to make a Ye floor.
1/3 slope from 2 electron captures every 6 C12 consumed
burning timescale faster than weak timescale

HeraclitusSchool of Athens1510Raffaello Sanzio


![Fertiliziilg;,ligh- Traffic Turf - About SportsTurfsturf.lib.msu.edu/article/1988oct21.pdfFertiliziilg;,ligh-Traffic TurfBy Stephen T. Cockerham, Victor A. Gibeault and Mf;J.tff]f3w](https://static.documents.pub/doc/80x56/5ec8ebe50486163f9040319b/fertiliziilgligh-traffic-turf-about-fertiliziilgligh-traffic-turfby-stephen.jpg)


