The Highways Agency roadside air pollution monitoring network: 2002 by McCrae I S and Green J M UPR SE/020/04 HA Environment Research Framework 3/323F/R012 UNPUBLISHED PROJECT REPORT (Version 2.1)
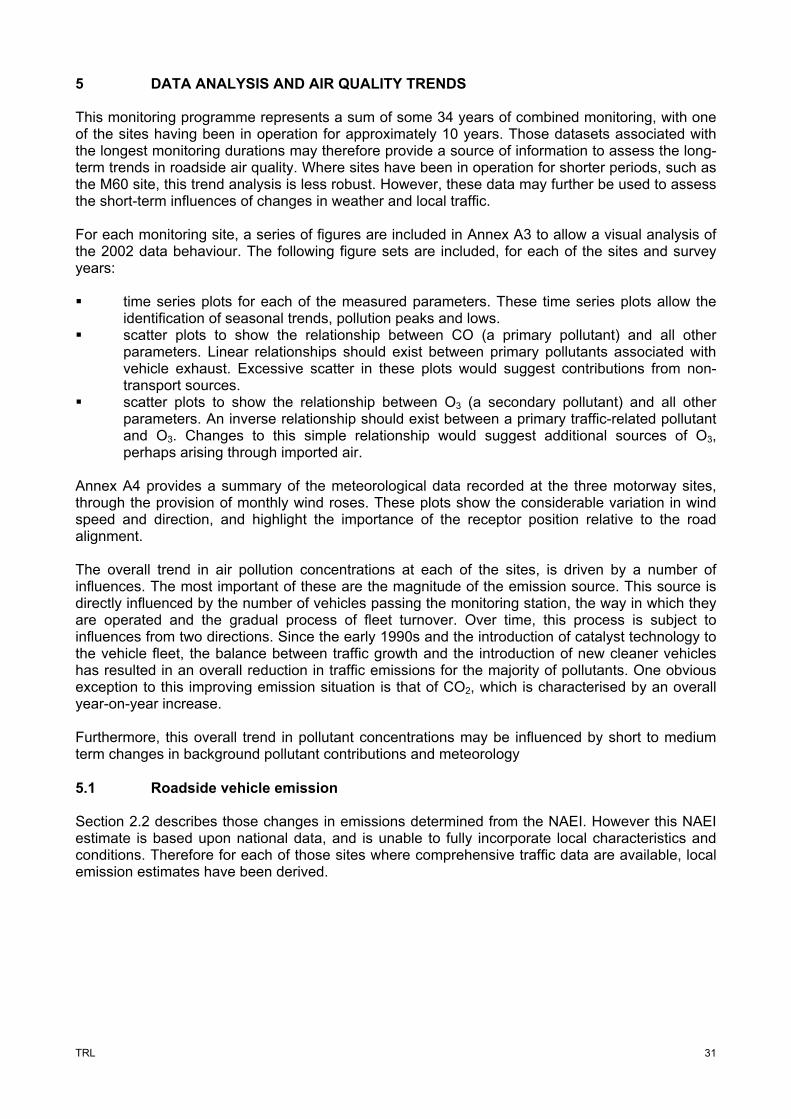
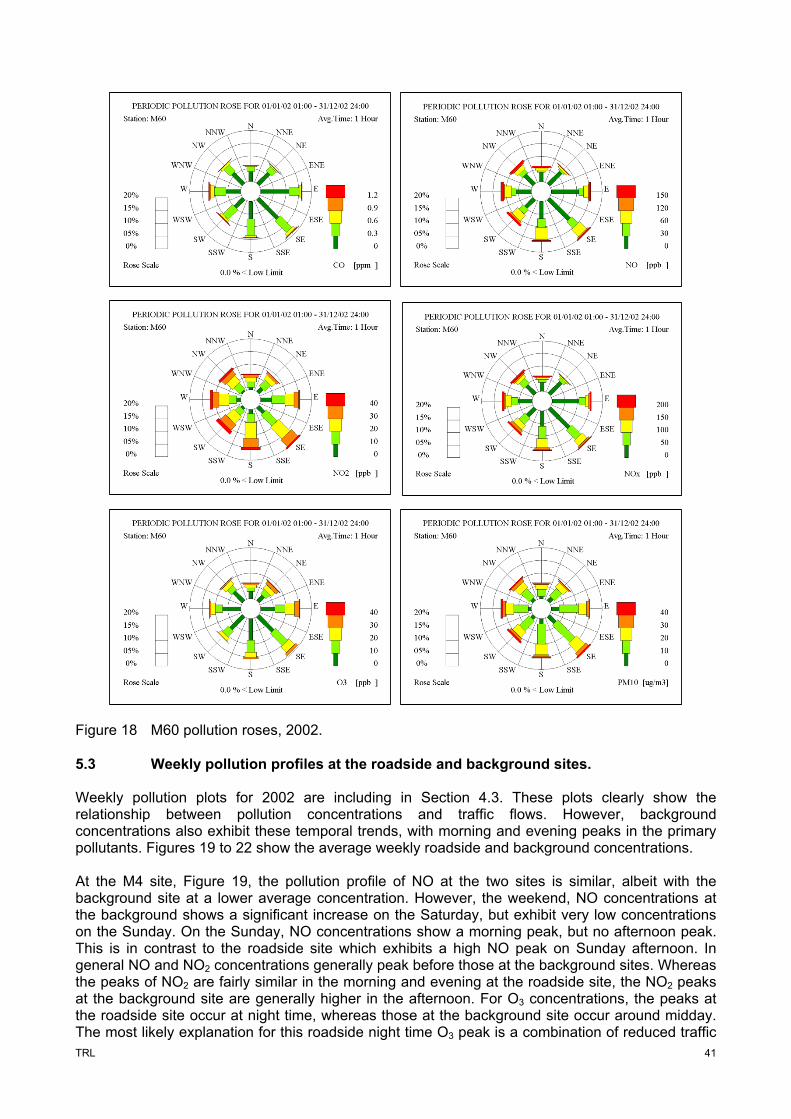
Transcript
The Highways Agency roadside air pollution monitoring network: 2002
by McCrae I S and Green J M
UPR SE/020/04 HA Environment Research Framework 3/323F/R012
UNPUBLISHED PROJECT REPORT (Version 2.1)
TRL Limited
UNPUBLISHED PROJECT REPORT PR SE/020/04
The Highways Agency roadside air pollution monitoring network: 2002 Version: 2.1
by McCrae I S and Green J M
Prepared for: Project Record: HA Environment Research Framework 3/323F/R012. Impact of reduced emissions upon air quality
Client: Highways Agency Michele Hackman
Copyright TRL Limited November 2004 This report has been prepared for Simon Price/Michele Hackman, Highways Agency, is unpublished and should not be referred to in any other document or publication without the permission of the Highways Agency. The views expressed are those of the authors and not necessarily those of the Highways Agency.
Approvals
Project Manager
Quality Reviewed
This report has been produced by TRL Limited, under/as part of a Contract placed by the Highways Agency. Any views expressed are not necessarily those of the Highways Agency. TRL is committed to optimising energy efficiency, reducing waste and promoting recycling and re-use. In support of these environmental goals, this report has been printed on recycled paper, comprising 100% post-consumer waste, manufactured using a TCF (totally chlorine free) process.
TRL
EXECUTIVE SUMMARY TRL operates, on behalf of the Highways Agency, a network of roadside air pollution monitoring stations. This facility was originally commissioned in the early 1990s, and thus some of the sites within this network have now been in operation for more than 10 years. This monitoring network provides a unique long term series of roadside air pollution measurements, which when combined with traffic and meteorological data allows insight into the impact of the operation of the trunk road network on the roadside environment. A full description of this monitoring network is available in McCrae and Green 2004. This report provides an analysis of those data measured during the calendar year 2002, and investigates these data for compliance with UK air quality regulations. These data are further combined with the historic data recorded at each of the sites, to allow the determination of the trends in individual pollutant concentrations. The monitoring network originally comprised one rural motorway site in Berkshire and one urban roadside site in London. Subsequently this network was extended to include roadside sites on the M25 in Surrey, the A40 in Cheltenham and the M60 north of Manchester. At each of the motorway sites, the air pollution measurements are combined with meteorological and traffic flow measurements. In October 2001 the Victoria Street, Central London site was removed from the HA network, largely to focus resources on the assessment of the HA trunk road network. Therefore within this report, no data are presented from the Victoria Street site, although this site remains in operation, but now funded by Transport for London.
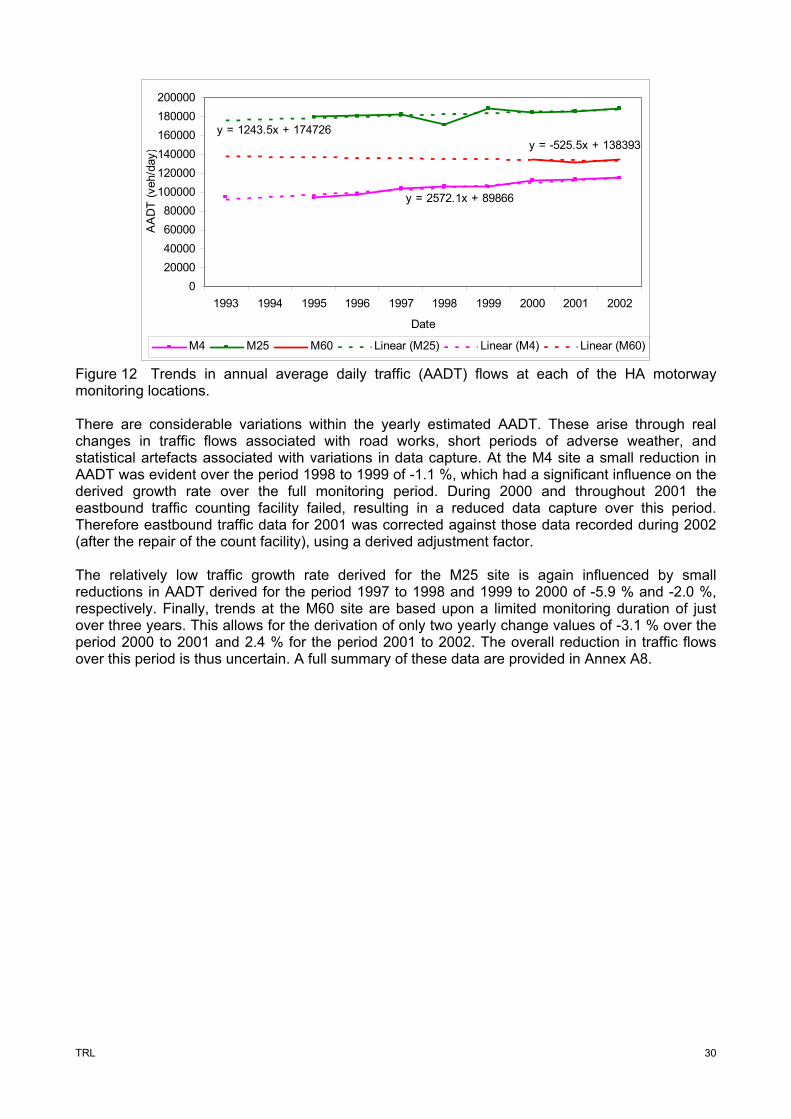
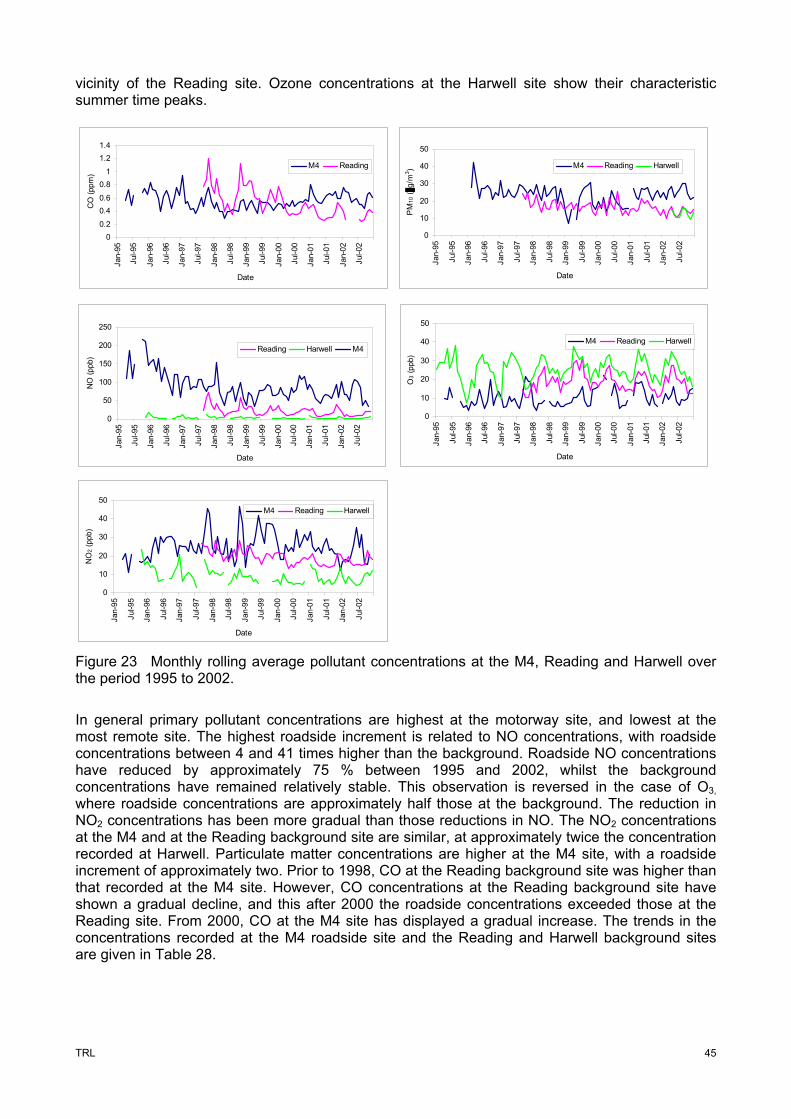
Roadside air pollution will be determined by inputs from traffic in the immediate vicinity of the site, other local sources (if any) and general background concentrations, and in the case of secondary pollutants through contributions arising from local and regional atmospheric chemistry. With respect to carbon monoxide (CO), primary inputs from the local traffic will dominate, whereas for NO2 and PM, a significant component will be from background and secondary sources. Throughout the period of monitoring, changes in the pollution arising from the local traffic have been two-fold: the traffic flows gradually increased and operational conditions during certain parts of the day may have changed (because of increasing congestion); conversely, the vehicle fleet is continuously renewed by the introduction of vehicles meeting more stringent emission standards, and the scrapping of the older models. Therefore the emissions generated by the local traffic are the sum of the increasing traffic flows, off-set by the introduction of cleaner vehicles meeting more stringent emission limits. Traffic flows vary considerably at the three motorway sites. The M25 site, which is one of the most heavily trafficked sections of the HA network, reported an annual average daily traffic (AADT) flow of 188,543 vehicles. This is significantly higher than the flows on the M60 and M4 motorways, with AADT flows of 134,377 and 114,974, respectively. The M4 and M25 sites have been operated for over 7 years, and the average traffic growth at these sites is 2.8 %/yr and 0.7 %/yr, respectively. Reported traffic flows at the M60 site, decreased in 2001, leading to an overall average traffic reduction of 0.4 %/yr between 2000 and 2002. Between 2001 and 2002, transport emission reduced at all sites and for all pollutants, except for NOX and PM10 at the M4 site. The M4 site has the highest increase in traffic flows, and this increase, particularly in the number of HGVs has off-set the overall reduction in emissions. Similar levels of emission reduction are estimated for CO, HC, NOX and PM10 at the M25 and M60 sites. In general, the air quality situation recorded between 1992 and 2002 demonstrates an improvement in air pollutant concentrations of all of the primary pollutants. This downward trend in annual average concentrations is punctuated by yearly deviations from this trend, largely driven by changes in meteorology. Although the 2002 data broadly complies with this downward trend, it is closer than expected to those concentrations recorded in 2001. At the M4 site CO and PM10 concentrations have actually increased over the last 3 years. This is also evident at the M25 site, albeit the rate of PM10 reduction has reduced, rather than increasing in real terms. At the
TRL
Cheltenham site, concentrations of CO, NO, NO2 and SO2 have all increased between 2001 and 2002. Similarly at the M60 site, whereas the annual average CO concentration reduced during 2002, all other pollutants witnessed a small increase in concentration. Throughout the monitoring period, a general increase in O3 concentrations is evident. This variation in pollutant concentration at these four sites, can be explained through variations not just in traffic flows, but also with respect to meteorology. In an attempt to remove the impact of meteorology from these measured concentrations, a local background air pollution monitoring station has been identified, and its data used to derive the roadside increment or pollution enhancement. As both the roadside and background sites would be largely affected by the same meteorology, this process extracts the impact of local meteorology. The extraction of this background data generally results in larger reductions in pollution concentrations, highlighting the masking effects of meteorology on roadside air pollution. The assessment of these measured data against the objectives contained within the UK Air Quality Strategy, and the limits associated with the EU air quality Daughter Directives must be treated with care. For the UK Air Quality Strategy, objectives are set for eight pollutants with compliance required by various introduction dates ranging from 31 December 2003 to 31 December 2010. Measured concentrations recorded in advance of these compliance dates, which exceed the proposed standards, are not deemed to be in exceedance of these objectives. In addition, these standards and objectives only apply in those situations where the public may be exposed, and as such these roadside locations are not currently encompassed by these regulations. An analysis of compliance against those air quality standards contained within the UK air quality strategy, confirms that concentrations of CO and SO2 measured during 2002 of are well within the proposed limits. However, these standards are exceeded for NO2 and O3. For NO2, no exceedance of the standard are recorded against the 1-hr mean value, but the M4 and the M60 sites marginally exceed the annual mean standard. Whereas the reported annual mean NO2 at Cheltenham is well within the standard at 18.5 ppb, the M25 marginally exceeds the limit associated with the 2005 objective, with an annual mean of 21.8 ppb. This report supplements an earlier report by McCrae and Green (2004) describing the development of this air pollution monitoring network, and those identified trends in air pollution between 1992 and 2001.
TRL
CONTENTS Page number 1 Introduction 1 2 Background 2 2.1 Transport activity 2 2.2 UK emissions 4 3 The Highways Agency monitoring strategy 8 3.1 Network development 8 3.2 Monitoring configuration 9 3.2.1 Operational issues 9 3.2.2 Network composition 10 4 Data presentation 11 4.1 Air pollution data summaries 11 4.1.1 M4 data summary 11 4.1.2 M25 data summary 13 4.1.3 Cheltenham data summary 15 4.1.4 M60 data summary 16 4.2 Meteorological data 17 4.3 Diurnal and weekly pollution profiles 21 4.4 Compliance with air quality criteria 24 4.5 Trends in air pollution concentrations 26 4.6 Trends in traffic flows 29 5 Data analysis and air quality trends 31 5.1 Roadside vehicle emissions 31 5.1.1 Emission estimation method 32 5.2 Influence of wind direction on pollution concentrations 38 5.3 Weekly pollution profiles at the roadside and background sites 41 5.4 Roadside enhancement 44 5.4.1 M4 site 44 5.4.2 M25 site 46 5.4.3 Cheltenham site 47 5.4.4 M60 site 48 5.4.5 Roadside increment 50 5.5 Seasonal fluctuations 52 5.6 The ratio of PM10 to PM2.5 53 5.7 The identification and influences of air pollution episodes during 2002 53 5.7.1 General air pollution episodes during 2002 54 5.7.2 The impact of bonfire night 58 6 Summary and conclusions 60 6.1 The 2002 air pollution environment 60 6.2 Recommendations 61 7 References 64 8 Acknowledgements 66 9 Annexure 67
TRL
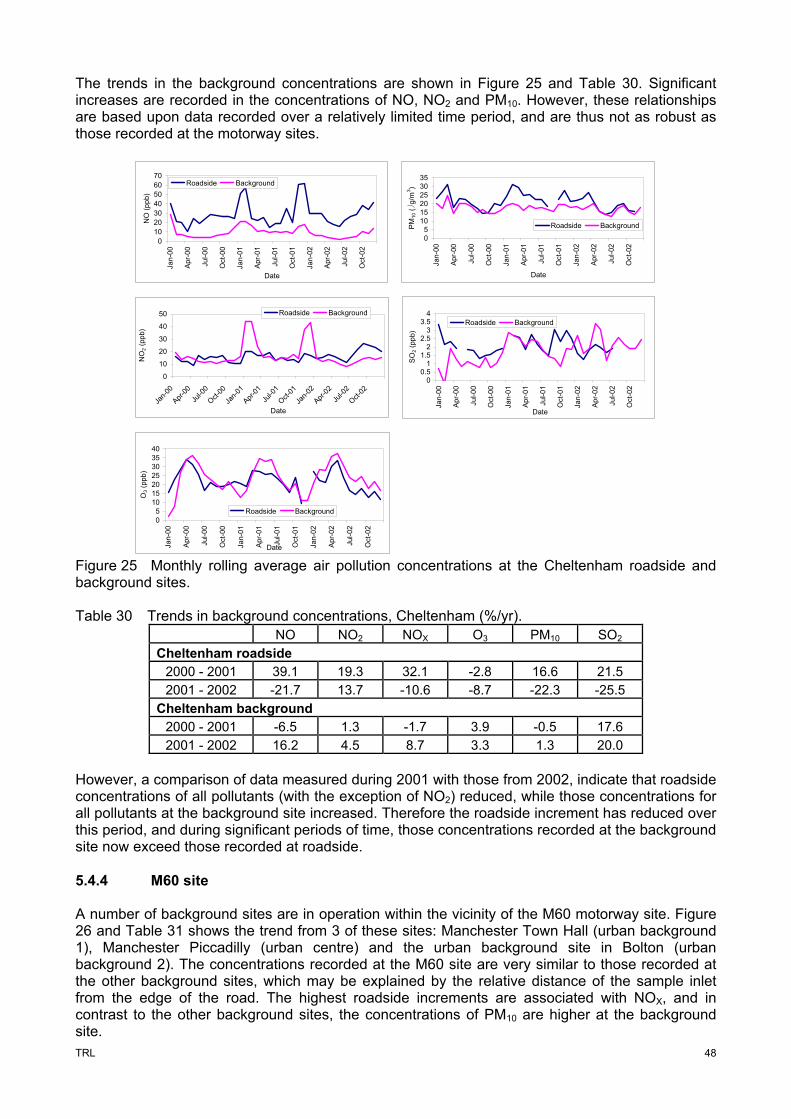
A1 Monitoring site specifications A2 Hourly data summary statistics, 1992 to 2002 A3 Hourly data plots, 2002 A4 Monthly wind roses A5 Wind speed analysis A6 Air quality objectives, standards and limits A7 Air quality compliance, 1992 to 2002 A8 Annual average daily traffic flows, 1993 to 2002
TRL
1
1 INTRODUCTION The Highways Agency’s (HA) responsibility towards the UK trunk road network has been subject to change over the last decade, through a combination of responses associated with regional government devolution, to the de-trunking programme. In the latter the HA is focusing its resources on the core strategic trunk road network. This is being achieved by transferring the management of parts of the non-core network, to local highways authorities. The HA remains responsible for the maintenance, operation and improvement of the core trunk road network in England, on behalf of the Secretary of State for Transport. This strategic network comprises some 8,255 km of road comprising single and dual carriageway all-purpose roads and two, three and four lane motorways. This network carries approximately one third of all road traffic in England, and up to two thirds of the heavy goods freight traffic. One of the key impacts of the use of this network are the emissions associated with vehicle operation, and the subsequent dispersion of these emissions into the roadside environment. In 1992, TRL Limited on behalf of the HA, developed a network of roadside air pollution monitoring stations, with the objective of monitoring the roadside concentrations of a range of vehicle associated pollutants. It was envisaged that this network would assist in the understanding of the relationship between emissions and roadside air quality, but also to assess the impact of the introduction of tighter exhaust emission and fuel standards over a period where vehicle growth was forecast to increase. This report provides a summary of the air pollution conditions recorded at the HA network of roadside air pollution monitoring stations, during 2002. It represents the first of series of annual reports supplementing a basic network descriptive report, which described the development of the monitoring network and those data monitored between 1992 and 2001 (McCrae & Green 2004). Chapter 2 therefore provides a summary of the changes in the UK vehicle fleet, and national emission estimates by various sources. Chapter 3 provides a description of the monitoring network development. Data derived from this monitoring network are presented in Chapter 4 and analysed in Chapter 5. An assessment is included which provides a comparison of those concentrations recorded up to the end of 2002, against the proposed standards contained within the Air Quality Strategy. A summary of the air pollution trends are provided in Chapter 6, combined with a series of recommendations on the operation and development of the monitoring network. In support of this analysis, annexes to this report provide statistical and graphical summaries of these monitoring data.
TRL
2
2 BACKGROUND The concentration of a pollutant at a roadside receptor will be dependent on the magnitude of the source, and the distance between the source and the receptor. In practice, this simple relationship is complicated by the presence of multiple sources, contributions from background concentrations, the role of atmospheric chemistry in the formation and transformation of pollutant species, and the over-ridding influence of meteorology. The HA long term monitoring sites were selected to represent typical trunk road locations. Each site is dominated by those emissions from the immediate road. On a short timescale (hours to weeks), roadside concentrations at these locations respond to changes in traffic characteristics and thus emissions, combined with the impact of meteorology. On a longer timescale (yearly), roadside concentrations are influenced by the combination of two parameters working in opposing directions. Firstly the road network is subject to traffic growth, which can contribute to increased emissions along specific links. Secondly the fleet is subject to a renewal, whereby the older more polluting vehicles are scrapped, and replaced by new, cleaner technologies. Over time, any specific link is therefore impacted by the growth in traffic, and off-set by the gradual renewal of the vehicle fleet. Long term measurements of traffic flow, meteorology and pollutant concentrations can provide insight into this complex relationship. 2.1 Transport activity Transport activity is the main source of a number of common air pollutants, and its contribution has tended to grow. Between 1952 and 2002 total passenger travel more than tripled from 218 billion passenger kilometres to 746 billion kilometres. Figure 1 shows the trend in passenger travel between 1992 and 2002. The majority of this growth has occurred in the road transport sector, with the distance travelled by car, approximately 10 times higher in 1999, when compared to 1952.
0
10
20
30
40
50
60
1992
1993
1994
1995
1996
1997
1998
1999
2000
2001
2002
Year
Oth
er m
odes
550560570580590600610620630640
Car
s, v
ans
& ta
xi
Bus & coach 2-w heeler Bicycle
Rail Air Car, van & taxi
Figure 1 Passenger transport trends by mode, between 1992 and 2002, expressed in billion passenger kilometres, (DfT, 2003). Prior to 1956 the dominant mode of passenger transport was bus and coach travel, representing some 40 % of total travel. This figure has reduced to a level of approximately 6 % in 2002. The use of public transport has been replaced by the desire for private transport, and in 2002 the use of the private car amounts to 85 % of all travel. Over the period 1992 to 2002 private car usage has increased by 7.7 %. Following the privatisation of the rail network, passenger patronage increased but between 2000 and 2002 has been relatively flat. Motorcycle travel has remained relatively constant, but has been subject to a small increase between 1999 and 2002. The total road transport use of gasoline and diesel has increased from 35.18 million tonnes in 1991 to 37.49 million tonnes in 2002 (DfT, 2003). The split between the various petroleum components (Figure 2) has been subject to considerable change over the last decade, largely driven by the
TRL
3
introduction of the Euro 1 emission standard1 into the UK fleet. This was achieved through the use of three-way catalyst after-treatment technology, which requires the use of unleaded fuels. Therefore the introduction of this technology has resulted in the rapid switch from leaded to unleaded fuels. Over this same period, the growth in the sale of diesel has dramatically increased, from 30 % of petroleum sales in 1992 to a value of approximately 50 % in 2002.
Figure 2 Road transport petroleum consumption, 1992 to 2002 (DfT 2003). In 1950 the total UK vehicle fleet was approximately 4 million licensed vehicles, of which some 50 % were passenger cars. In the early 1980s this had grown to over 20 million. In 2002, this figure had grown considerably to an estimated 30.56 million vehicles, of which some 85 % were private and light goods vehicles (PLG). The largest increase by vehicle class has thus been seen in the passenger car class, with approximately ten times more cars today than reported in 1950. The proportion of motorcycles in the UK vehicle fleet is currently relatively low, but has been subject to a gradual growth from 1997. Between 1992 and 2002, the motorcycle fleet has been subject to a rise of 30 %. The number of buses and HGVs within the UK fleet has remained relatively constant between 1992 and 2002 (Figure 3).
0
500
1000
1500
2000
2500
3000
1992
1993
1994
1995
1996
1997
1998
1999
2000
2001
2002
Year
All
othe
rs
0
5000
10000
15000
20000
25000
30000
Car
Other PLG 2-wheelers Bus HGV Car
Figure 3 Licensed motor vehicles, 1992 to 2002, expressed in units of thousand vehicles (DfT 2003). Although the trunk and principal motorways represent less than 1 % of the public road length in 20022, they carry a disproportionately high proportion of the traffic flow, as shown in Table 1. Traffic flows on the motorway network have increased from 68.2 billion veh.km in 1993 to 92.4 billion veh.km in 2002, representing an annual average growth of 3.4 %.
1 The Euro I standard is the common name given to the emission limits associated with the EU directive 91/441/EU. A history of development of these emission standards is given in McCrae & Green 2004, and comprehensively discussed in Haigh 2003. 2 The HA trunk and principal motorway network amounts to 3,477 km of road, while the total road network comprises some 391,653 km.
TRL
4
Table 1 Road traffic by vehicle class, expressed in billion vehicle kilometres (DfT 2003). Vehicle class Motorway All roads
In addition to the types of vehicles operating on the motorway network, the way in which they are driven also influences their emissions. Table 2 provides typical speed profiles on the motorway network, by vehicle category. As expected speed limit exceedences by the HGV component are low, largely as a consequence of the use of speed limiters. In contrast speed limit exceedence by cars and two-wheelers represents some 18 % and 27 % of the vehicles, respectively. Table 2 Typical vehicle speeds recorded on the UK motorway network, 2002. Data expressed in percent/mph/number of vehicles (DfT 2003).
2.2 UK emissions Yearly estimates for UK emissions of air pollutants are undertaken by the National Environmental Technology Centre (Netcen), on behalf of Defra, and are published as the National Atmospheric Emissions Inventory (NAEI). For each emission source, emission estimates are derived through the application of an emission factor to an appropriate activity statistic. For many pollutants the dominant source of emissions are the combustion of fossil fuels, particularly within the transport sector. Emissions of the major air pollutants, for each year between 1990 and 2002 are shown in Figure 4. Total emissions of CO reached a peak in 1973, and have subsequently demonstrated a gradual reduction. In 2002 total emissions represented a value of 42 % of those in 1970. Since 1990, CO emissions have reduced by approximately 8 % per year. In 1990 this rate of reduction was approximately 3.5 %/yr, but has gradually increased to a value of 12 %/yr in 2002. This may be credited to the introduction of the use of exhaust catalysts into the vehicle fleet, during the early 1990s. During the early 1990s road transport contributed approximately 73 % of the UK CO emissions. This has gradually reduced, and now represents a value of 60 %.
TRL
5
The largest sources of volatile organic compounds (VOC) emissions are associated with industrial processes and solvents (included within the ‘other’ category) representing some 60 % of the total in 1970, reducing to 50 % in 2002. Road transport represents the next largest category, and as with CO reached a peak in 1989. Emissions from transport have reduced by approximately 75 % between 1990 and 2002. In the early 1970's road transport exceeded power stations as the largest source of oxides of nitrogen (NOX). Emissions of NOX reached a peak in 1989, and have continued a reduction to 2002. Between 1990 and 2002 road transport related NOX emissions are estimated to have reduced by approximately 45 %. In 2002, road transport still dominates total UK NOX emissions, accounting for some 45 % of total UK emissions. Between 1970 and 2002 emissions of particulate matter (expressed as PM10), reduced by approximately 65 %, largely as a consequence of reduction in coal combustion. Road transport emissions reached a peak in the late 1980s and have subsequently been subject to an overall reduction, with a 43 % reduction between 1990 and 2002. A slightly smaller percentage reduction from the road transport component is evident in the PM2.5 fraction. Between 1970 and 1999 total methane (CH4) emissions reduced by approximately 30 %. Transport emissions increase from 16 kT in 1970, to a peak of 29 kT in 1990. Between 1990 and 2002, the proportion of CH4 emissions allocated to road transport reduced from 79 % to 55 % of the total UK emissions. Between 1990 and 2002, road transport CH4 emissions reduced by 60 %. Prior to 1990, insufficient data are available to provide estimates of emissions for benzene and 1,3-butadiene, and they are thus omitted from the NAEI. Total emissions for both pollutants have shown a reduction over the period 1990 to 2002, of approximately 70 % and 75 % for 1,3-butadiene and benzene, respectively. Although road transport remains the dominant source of these organic compounds, the reductions over this same period have been higher from the transport sector, at 74 % and 89 %, for 1,3-butadiene and benzene respectively. Emissions of sulphur dioxide are dominated by the power generation sector, albeit with a gradual decline since the early 1970s. Several peaks are evident in this decline (particularly 1973 and 1979), which may be attributed to particularly cold winters. Between 1970 and 2000 total emissions have reduced by approximately 80 %. Since the early 1990s this rate of decline has increased. With respect to road transport, SO2 emissions peaked in 1994, and have demonstrated a significant reduction of 80 % between 1994 and 2002. This reduction directly reflects the gradual reduction in the allowable sulphur in road fuels. Changes in carbon dioxide (CO2) emissions largely reflect fuel choice and fuel consumption changes. Total UK CO2 emissions have been declining since 1990, largely through the switch from coal to gas, within the power generation sector. Petrol consumption in 1998 was approximately one and a half times higher than that recorded in 1970, at 14.2 and 21.8 million tonnes respectively. This statistic masks the fact that petrol consumption has actually been in a decline since a peak during 1990. However, over this same period diesel (DERV) use has shown a gradual increase. In 1970 DERV consumption was at 5 million tonnes, increasing to 15.1 million tonnes in 1998. This demonstrates the importance of freight traffic, and again highlights the increase in the popularity of diesel cars. Between 1990 and 2002, total UK CO2 emissions have reduced by approximately 8 %. While this is a consequence of reduced CO2 emissions from most sectors, it is off-set by a 7 % increase in emissions from the road transport sector. It is evident from Figure 4 and Table 3, that road transport represents a significant source of many pollutants. The total emissions of many of these pollutants are in decline. In general, total UK road transport emissions peaked during the period 1988 to 1992, and those controlled through vehicle emission legislation exhibit estimated reductions from this period to the end of 2001.
TRL
6
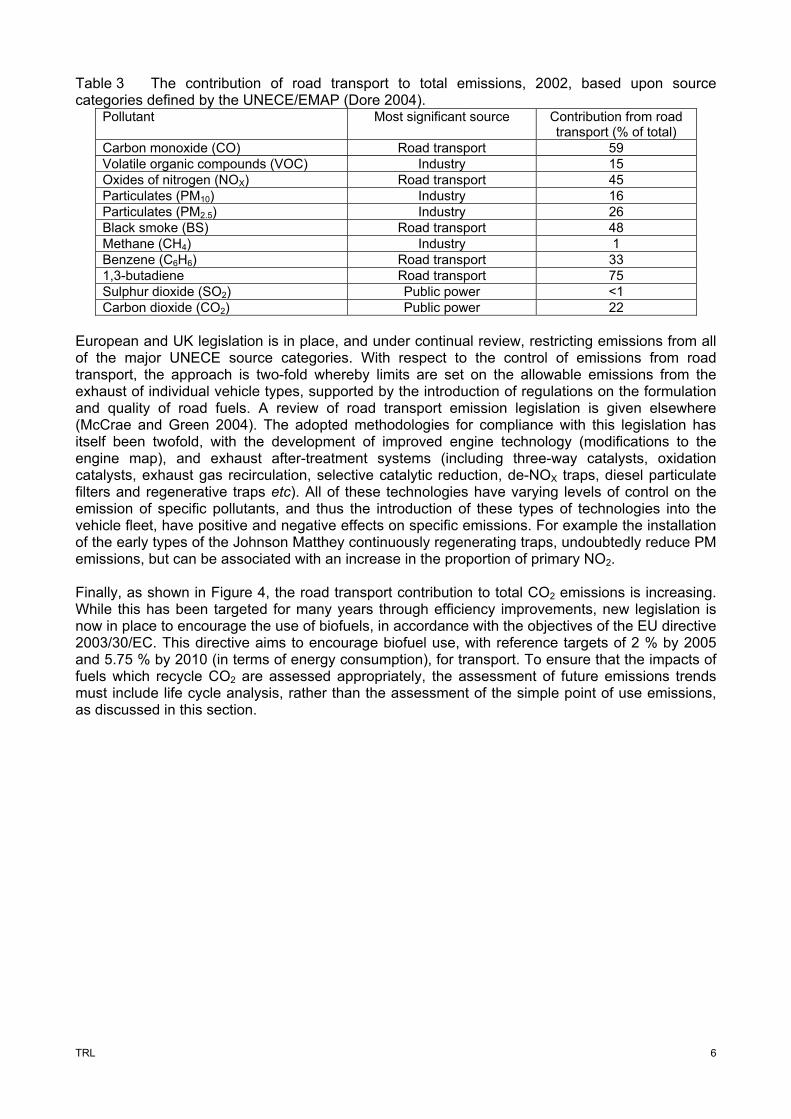
Table 3 The contribution of road transport to total emissions, 2002, based upon source categories defined by the UNECE/EMAP (Dore 2004).
Pollutant Most significant source Contribution from road transport (% of total)
Carbon monoxide (CO) Road transport 59 Volatile organic compounds (VOC) Industry 15 Oxides of nitrogen (NOX) Road transport 45 Particulates (PM10) Industry 16 Particulates (PM2.5) Industry 26 Black smoke (BS) Road transport 48 Methane (CH4) Industry 1 Benzene (C6H6) Road transport 33 1,3-butadiene Road transport 75 Sulphur dioxide (SO2) Public power <1 Carbon dioxide (CO2) Public power 22
European and UK legislation is in place, and under continual review, restricting emissions from all of the major UNECE source categories. With respect to the control of emissions from road transport, the approach is two-fold whereby limits are set on the allowable emissions from the exhaust of individual vehicle types, supported by the introduction of regulations on the formulation and quality of road fuels. A review of road transport emission legislation is given elsewhere (McCrae and Green 2004). The adopted methodologies for compliance with this legislation has itself been twofold, with the development of improved engine technology (modifications to the engine map), and exhaust after-treatment systems (including three-way catalysts, oxidation catalysts, exhaust gas recirculation, selective catalytic reduction, de-NOX traps, diesel particulate filters and regenerative traps etc). All of these technologies have varying levels of control on the emission of specific pollutants, and thus the introduction of these types of technologies into the vehicle fleet, have positive and negative effects on specific emissions. For example the installation of the early types of the Johnson Matthey continuously regenerating traps, undoubtedly reduce PM emissions, but can be associated with an increase in the proportion of primary NO2. Finally, as shown in Figure 4, the road transport contribution to total CO2 emissions is increasing. While this has been targeted for many years through efficiency improvements, new legislation is now in place to encourage the use of biofuels, in accordance with the objectives of the EU directive 2003/30/EC. This directive aims to encourage biofuel use, with reference targets of 2 % by 2005 and 5.75 % by 2010 (in terms of energy consumption), for transport. To ensure that the impacts of fuels which recycle CO2 are assessed appropriately, the assessment of future emissions trends must include life cycle analysis, rather than the assessment of the simple point of use emissions, as discussed in this section.
Industry Domestic Other Figure 5 Changes in the emission of common pollutants in the United Kingdom, 1990 - 2002, expressed in kilotonnes3 (Dore et. al. 2003, Dore 2004).
3 Source categories defined by UNECE/CORINAIR94, Volatile organic compounds exclude methane, oxides of nitrogen are expressed in terms of nitrogen dioxide equivalents, and carbon dioxide emissions are expressed in terms of the weight of carbon emitted.
TRL
8
3 THE HIGHWAYS AGENCY MONITORING STRATEGY 3.1 Network development The first HA long term air pollution monitoring station was established in 1992, and the network was subsequently expanded to include 5 roadside monitoring sites. Prior to the establishment of this network, HA air pollution monitoring activities were restricted to relatively short term campaigns, largely as a basis for data provision to scheme assessments. National air pollution monitoring activities during the late 1980s and early 1990s were dominated by 24-hour smoke and sulphur dioxide measurements. These activities were expanded by the UK Department of Environment to include an embryonic network of multi-pollutant automatic continuous air pollution monitoring stations, restricted largely to urban background locations. The establishment of this HA network therefore provided, and continues to provide, a unique series of measurements at high speed, roadside locations. Summary details of the HA long term monitoring network are described in Table 4, with full details of the sampling configuration given in Annex A1. By selecting locations very close to the road, it was intended that any observed trends in air pollution concentrations would be attributable mainly to changes in traffic emissions, and that they would not be unduly influenced by other changes that might take place concurrently (changing patterns of electricity generation, for example). The overall objective of this measurement campaign was to access the long term trends in roadside air quality, to assess the potential impact of the HA network on local and regional air quality, and to provide input for the development and improvement of the Highway Agency’s procedure for the air quality impact assessment of roads, currently detailed within Design Manual for Roads and Bridges (DMRB) (Highways Agency et. al. 2003). Table 4 A summary of the monitoring station network.
Site Commencement date
Road type Location Grid reference
Site 1 08/92 - 06/94
467500,169850 M4
Site 2 04/95
Rural motorway
Eastbound carriageway, between junction 11 and 12
469945,169435
M25 05/95 Rural motorway
Clockwise carriageway, between junction 13 and 14
502760,173450
Cheltenham 10/97 Urban Westall Green roundabout, A40
393872, 221657
M60 05/99 Suburban motorway
Eastbound carriageway, east of junction 17
381301, 405004
The full specification of each monitoring station is described elsewhere (McCrae & Green 2004). Each station is equipped with a range of continuous ambient gaseous and particulate monitors allowing the measurement of the major vehicular associated air pollutants. These pollutants are carbon monoxide (CO), oxides of nitrogen (NOX), hydrocarbons (HC) and particulate matter (PM). Furthermore, ground level ozone (O3) concentrations are recorded to aid in the interpretation of the formation of nitrogen dioxide. In addition to this basic suite of pollution measurements, a number of pollutant species (e.g. sulphur dioxide, hydrogen sulphide and a range of organic compounds) are monitored at some of the sites within the network. The three motorway sites are further supplemented by the local measurement of meteorological and traffic flow data.
TRL
9
3.2 Network configuration 3.2.1 Operational issues In accordance with the Defra monitoring site classification, the M4, M25, M60 and Cheltenham sites are all defined as roadside sites (Defra 2003b). Each of the monitoring stations contains essentially the same equipment and are operated under standard operating procedures, broadly in accordance with the operating procedures employed within the Defra automatic urban and rural network (AURN) (Telling 2003). The following variations exist between the two site configurations and operational regimes4:
• Other than the M60 site, the sample inlets in the HA network comprise a horizontal manifold and sample line, linking the kerbside to the gas analysers. This configuration allows the sampling of roadside air, irrespective of the position of the monitoring enclosure, at an inlet height of 1.5 m. The standard AURN configuration incorporates a vertical sample line and manifold, with samples taken at a height of 3.5 m.
• The majority of equipment installed in the HA network does not include internal zero and span (IZS) check facilities. These are normally achieved through the use of permeation tubes, which allow regular span performance checks. Within the HA network, equipment performance is assessed through the use of daily telematic instrument status checks combined with manual pollution data response and trend analysis. One disadvantage of this system is that equipment performance checks outside the working week are limited, and staff time requirements are high. The incorporation of IZS is currently under investigation.
• Routine equipment calibration is undertaken once every 2-weeks, through the introduction of zero and span gases.
- Zero gases are generated locally using an air compressor, combined with a series of air purifiers including a pair of Signal-Rotork AS80s, combined with a series of sorbent columns containing silica gel, hopcalite, purafil and activated charcoal.
- Span gas concentrations are generated locally through the dilution of a high concentration span gas with zero air, using a mass flow controller based Environics calibrator. This gas generation is regularly checked against low concentration calibration standards. The Environics also allow for ad-hoc instrument linearity checks. The original premise for the use of high concentration calibration gases was that they are more stable and easier to produce than low concentration gases.
• Original practice incorporated instrument zero and span setting adjustment during each calibration procedure to correct instrument output for zero and span drift. During the middle of 2002, this procedure was modified, whereby no instrument adjustment was made in response to the calibration check. All data correction was thus incorporated into the data ratification procedure. This change in procedure was designed to reduce instrument errors arising from potentially correct calibrations.
• During 2002, the calibration procedure was also modified to check and correct for the influence of soiled in-line instrument sample line filters. These filters are routinely replaced during each calibration visit. The modified calibration procedure records zero and span responses, both before and after the replacement of these filters.
• Data from each of the monitoring stations are polled, once every 24-hours. These data are inspected and archived as 15-minutes averages on a weekly basis, ratified and published as hourly averages in 6-monthly blocks (January to June, July to December).
• All data are corrected for zero and span drift, using certified reference gases. However, some additional data manipulation steps have been undertaken, whereby the 15-minute raw data have been converted to hourly data. This conversion incorporates the condition that hourly averages are only derived from hourly periods containing a minimum of 3 data points. Where this condition is not met, then these data are ignored in subsequent calculations and analysis. While this provides a robust series of hourly data, the data
4 A full description of the HA/TRL air pollution monitoring network is provided in McCrae and Green, 2004. All ratified data are uploaded to the TRL/HA air pollution archive, held at the following web address: http://www.trl.co.uk/1024/mainpage.asp?page=758
TRL
10
capture is reduced between the 15-minute to the hourly data sets. Subsequent data analysis involving daily statistics, again incorporate this 75 % data capture condition. In addition, whereas all monitoring data are collected on a consistent Greenwich Mean Time (GMT) bases, the subsequent annual data sets are corrected for British Summer Time (BST) daylight hour adjustments, with all data archives reported as ‘local’ times. The consequence of this adjustment is that there are two repeat hours at the start of BST, and a missing hour at the end. When analysing roadside air pollution data, this adjustment is essential as the traffic flows (and thus emissions) peak at the same time, regardless of season. Failure to adjust for the switch between GMT and BST would artificially off-set the air pollution data during the summer months.
• Data capture rates are set lower than those required within the AURN. Two levels of data capture are specified set at 90 % for CO, NO, NO2, O3 and PM10, and 75 % for all other pollutants. These lower data capture rates reflect the fact that these monitoring sites are not used for routine air quality reporting, but are primarily designed for the analysis of long term trends. In reality, expected data capture rates for all parameters are maintained in excess of 90 %.
• This lower level of data capture negates the necessity of holding duplicate ‘hot’ equipment for use as replacements during equipment failure. Equipment faults are routinely repaired off-site, and returned to service within 6 working days. Where service and repair activities are scheduled to take longer, spare replacement equipment are deployed to site. However, in this event the make and the model of equipment may not be consistent with the existing equipment.
3.2.2 Network composition During 2002, no changes were made to those pollutants and parameters recorded at each of the monitoring stations. However, in October 2001 the Victoria Site was removed from the HA monitoring network, to re-direct resources to the monitoring of those situations under the responsibility of the Agency. The Victoria Street site was established in 1993, at a time when there were very few roadside monitoring stations. Over the past decade the number of monitoring sites has increased with 8 kerbside sites and 38 roadside sites listed in the London Air Quality Network (LAQN), combined with 2 roadside sites directly funded by Defra (Fuller & Cue 2003). While these sites have not been in operation for as long as the Victoria Street site, or indeed do not monitor such a comprehensive range of pollutants, the growth in this traffic pollution monitoring network has allowed the release of this site from the HA responsibility. However, as this site had been in operation for nearly 10 years and thus represented a relatively unique time series record, measurements at this location have been continued, but funded directly by Transport for London (TfL)5.
5 Air pollution data from the Victoria Street site, prior to 2001 are held on the HA/TRL air quality archive. Air pollution measurements after 2001 are held on a dedicated TfL/TRL archive, available at the following site: http://www.trl.co.uk/1024/mainpage.asp?page=761
TRL
11
4 DATA PRESENTATION 4.1 Air pollution data summaries The following sections provide a summary of the air pollution data measured at each of the 4 monitoring sites during the calendar year 2002. These data are presented as annual and seasonal statistics6. The summary statistics for the full data series are included in Annex A2. Although all of the data within the HA/TRL air quality archive are adjusted for analyser zero and span drift, the data derived from the TEOM instruments remains unadjusted. All particle measurements undertaken within the HA network are derived through the use of a TEOM. However these measurements are not fully in compliance with the reference method as defined in the European Standard EN12341, whereby the super high volume sampler7 is usually regarded as the ‘primary standard’. All particulate sampling techniques will be subject to a combination of positive (e.g. increase in particle-bound water) and negative (e.g. loss of semi-volatile compounds) artefacts during sampling. In the specific case of the TEOM analyser, there is a requirement to hold the inlet and filter at an elevated temperature in an attempt to minimize errors associated with the evaporation and condensation of water vapour. At a location close to a source of combustion emissions, this operational regime can lead to the loss of the more volatile particulate components such as ammonium nitrate. Various studies have identified that the TEOM analyser generally reports lower PM10 concentrations than the European reference method (APEG 1999). In 1990, as part of the US EPA PM10 equivalency programme, a TEOM adjustment factor was introduced to account for measurement differences between the TEOM sampler and the high volume reference method. This internal factor is incorporated into all TEOM PM10 analysers sold in the UK. Although seasonality is evident in the ratio between the TEOM and reference method outputs, an additional adjustment factor of 1.3 is currently applied to UK TEOM data submitted to the EU as part of its national reporting8. Although it is accepted that the use of a constant correction factor is insufficient to accommodate all of the changing roadside conditions, it has been applied to those data contained in the data summary tables, to allow a direct comparison with air quality limits and objectives. Time series plots for all pollutants and all sites, for 2002, are included in Annex A3. In addition, this annex provides a series of scatter plots demonstrating the positive relationships between primary pollutants, and the inverse relationship with primary pollutants, O3, and wind speed. 4.1.1 M4 data summary Monitoring at the M4 commenced in August 1992, and thus 2002 represents the tenth year of monitoring. This monitoring was interrupted in 1994/95 as a consequence of the forced relocation of the facility to accommodate the construction of the Reading Motorway Service Area (MSA). Tables 5 to 7 provide the annual 2002 summary statistics for the M4 site, including an analysis by season. The annual data capture was lower than previous years at approximately 90 %, ranging from 83 % for NOX to 93 % for PM10. During August and September the site was subjected to a series of power supply interruptions, which impacted on the data capture for all data channels. Data losses were evident in the NOX and O3 analysers during April, arising from equipment failures. During May, the CO analyser displayed a number of system faults, which eventually took several weeks to fully rectify. Hourly traffic counts on the westbound carriageway were complete with a data capture approaching 100 %. However, the traffic counter on the eastbound carriageway was out of service from the beginning of the year until 28 March. This resulted in a reduced data capture for this directional flow and the derived total traffic flow, of approximately 76 %. 6 For this analysis, the winter season is taken as a combination of two 3-month periods (January to March 2002 and October to December 2002), and the summer as a continuous 6-month period (April to September 2002. 7 Normally referred to as the WRAC sampler (wide range aerosol classifier) 8 The internal instrument software gravimetric equivalent PM10 correction factor, incorporates a correction to 20 oC at 1 atmosphere as, TEOMraw * 1.03 + 3 µg/m3. This implies that the TEOM has zero off-set of 3 µg/m3. This adjusted output is then subject to the 1.3 factor, as recommended by the European PM working group.
TRL
12
During 2002, construction work continued on the commercial development on the northern edge of the M4 between the Reading MSA and junction 11, with the expansion of the Green Park business estate. Although the peak construction period occurred prior to 2002, significant emissions may be expected with the fitting out of buildings, parking and link road facilities. Table 5 M4 annual summary statistics of hourly data – 2002.
Pollutant Minimum Median Average Maximum Standard deviation
PM10 (µg/m3) (TEOM, data x 1.3) 0.1 27.4 30.1 236.6 16.0 100
Total traffic (veh/hr) 1631 4913 4651 5879 695 96
Annual average daily traffic (veh/day)
39141 118176 111743 137988 16463 95
For all pollutants other than CO and O3, average concentrations are highest during the summer periods. While this is statistically significant for CO, the difference between the winter and summer averages for O3 are insignificant. This situation is associated with the colder weather during the winter periods, and thus the possibility of some engines (more significantly exhaust after treatment systems), operating below optimum temperature. Both NO2 and PM10 which have a significant secondary component are highest during the summer months. In addition to the issue of meteorology, traffic flows during the summer period were approximately 4 % higher than those during the winter. Concentrations are dictated by a combination of changes in meteorology and traffic flows. This in part explains why the highest seasonal average may not coincide with the season in which the maximum concentration occurs. While these are consistent for CO, NO2 and PM10, the highest hourly NO occurs in the winter, but the highest seasonal average in the summer. Similarly for O3, the highest concentration occurs during the summer, but the winter seasonal average is slightly higher than that for the summer.
TRL
13
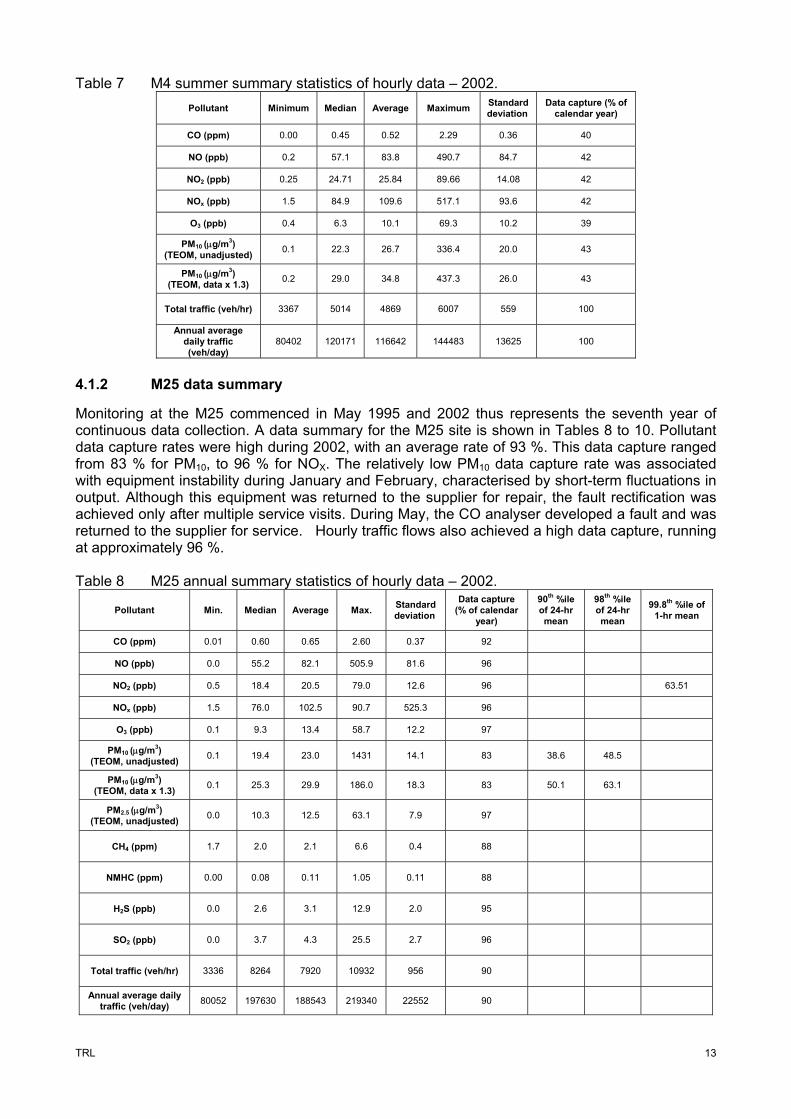
Table 7 M4 summer summary statistics of hourly data – 2002. Pollutant Minimum Median Average Maximum Standard
PM10 (µg/m3) (TEOM, data x 1.3) 0.2 29.0 34.8 437.3 26.0 43
Total traffic (veh/hr) 3367 5014 4869 6007 559 100
Annual average daily traffic (veh/day)
80402 120171 116642 144483 13625 100
4.1.2 M25 data summary Monitoring at the M25 commenced in May 1995 and 2002 thus represents the seventh year of continuous data collection. A data summary for the M25 site is shown in Tables 8 to 10. Pollutant data capture rates were high during 2002, with an average rate of 93 %. This data capture ranged from 83 % for PM10, to 96 % for NOX. The relatively low PM10 data capture rate was associated with equipment instability during January and February, characterised by short-term fluctuations in output. Although this equipment was returned to the supplier for repair, the fault rectification was achieved only after multiple service visits. During May, the CO analyser developed a fault and was returned to the supplier for service. Hourly traffic flows also achieved a high data capture, running at approximately 96 %. Table 8 M25 annual summary statistics of hourly data – 2002.
Pollutant Min. Median Average Max. Standard deviation
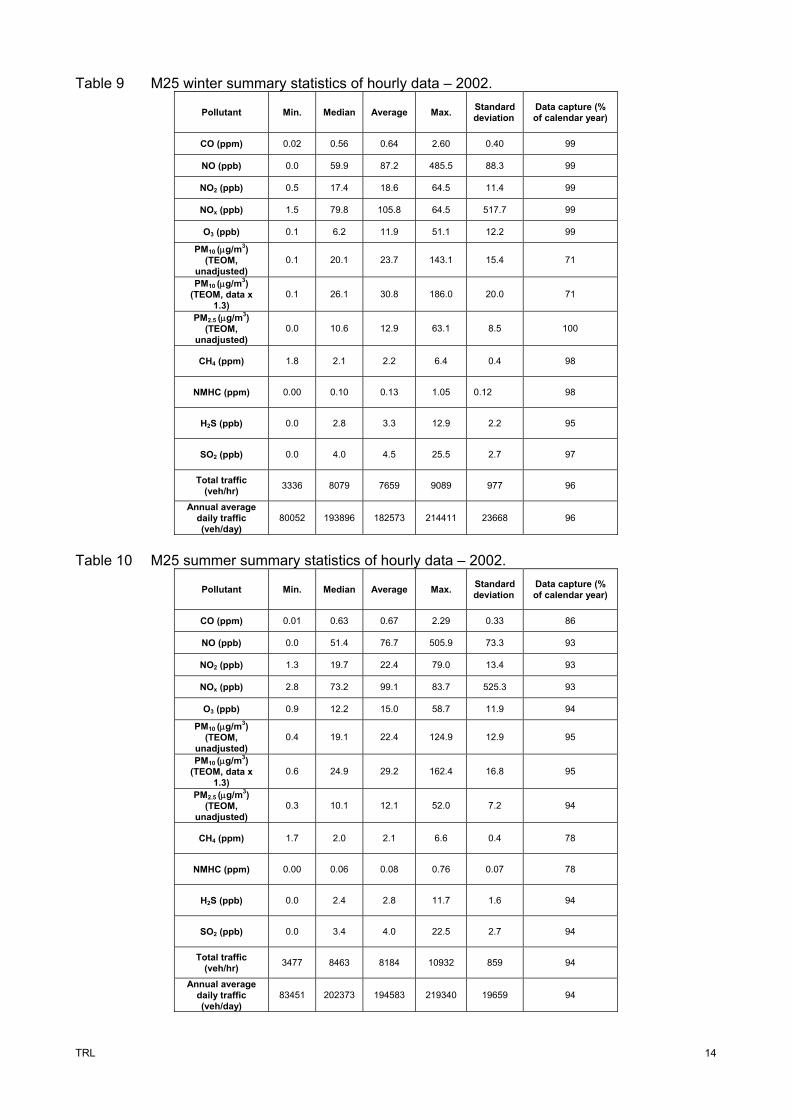
Table 9 M25 winter summary statistics of hourly data – 2002.
Pollutant Min. Median Average Max. Standard deviation
Data capture (% of calendar year)
CO (ppm) 0.02 0.56 0.64 2.60 0.40 99
NO (ppb) 0.0 59.9 87.2 485.5 88.3 99
NO2 (ppb) 0.5 17.4 18.6 64.5 11.4 99
NOx (ppb) 1.5 79.8 105.8 64.5 517.7 99
O3 (ppb) 0.1 6.2 11.9 51.1 12.2 99
PM10 (µg/m3) (TEOM,
unadjusted) 0.1 20.1 23.7 143.1 15.4 71
PM10 (µg/m3) (TEOM, data x
1.3) 0.1 26.1 30.8 186.0 20.0 71
PM2.5 (µg/m3) (TEOM,
unadjusted) 0.0 10.6 12.9 63.1 8.5 100
CH4 (ppm) 1.8 2.1 2.2 6.4 0.4 98
NMHC (ppm) 0.00 0.10 0.13 1.05 0.12 98
H2S (ppb) 0.0 2.8 3.3 12.9 2.2 95
SO2 (ppb) 0.0 4.0 4.5 25.5 2.7 97
Total traffic (veh/hr) 3336 8079 7659 9089 977 96
Annual average daily traffic (veh/day)
80052 193896 182573 214411 23668 96
Table 10 M25 summer summary statistics of hourly data – 2002.
Pollutant Min. Median Average Max. Standard deviation
Data capture (% of calendar year)
CO (ppm) 0.01 0.63 0.67 2.29 0.33 86
NO (ppb) 0.0 51.4 76.7 505.9 73.3 93
NO2 (ppb) 1.3 19.7 22.4 79.0 13.4 93
NOx (ppb) 2.8 73.2 99.1 83.7 525.3 93
O3 (ppb) 0.9 12.2 15.0 58.7 11.9 94
PM10 (µg/m3) (TEOM,
unadjusted) 0.4 19.1 22.4 124.9 12.9 95
PM10 (µg/m3) (TEOM, data x
1.3) 0.6 24.9 29.2 162.4 16.8 95
PM2.5 (µg/m3) (TEOM,
unadjusted) 0.3 10.1 12.1 52.0 7.2 94
CH4 (ppm) 1.7 2.0 2.1 6.6 0.4 78
NMHC (ppm) 0.00 0.06 0.08 0.76 0.07 78
H2S (ppb) 0.0 2.4 2.8 11.7 1.6 94
SO2 (ppb) 0.0 3.4 4.0 22.5 2.7 94
Total traffic (veh/hr) 3477 8463 8184 10932 859 94
Annual average daily traffic (veh/day)
83451 202373 194583 219340 19659 94
TRL
15
The highest hourly and seasonal concentrations coincided for NO2, O3, NMHC, PM10, PM2.5, H2S and SO2. For NO2, O3 these occurred during the warmer summer period, while for the others, these occurred during the winter. For CO the highest hourly peak occurred during the winter, but was characterised by a higher average summer concentration than during the winter. For NO and CH4, the highest hourly concentration occurs in the summer, but the average concentration during the winter is higher than that for the summer. Traffic flows during the summer period are significantly higher (approximately 6.6 %) than those in the winter. 4.1.3 Cheltenham data summary The Cheltenham monitoring site became operational in October 1997, with 2002 representing the fifth year of continuous monitoring. Relatively high data capture was achieved at this site, with an average capture rate of 90 %. This ranged from 99 % for CO and NOX to 52 % for SO2. The SO2 analyser was removed from site on 11 July, for redeployment to the M60 site. The TEOM failed on 15 November and due to problems with its subsequent repair, it was not reinstated until early 2003. No traffic or meteorological data are routinely collected at this site. Tables 11 to 13 provide a summary of those measurements recorded in 2002. Table 11 Cheltenham annual summary statistics of hourly data – 2002.
Pollutant Min. Median Average Max. Standard deviation
data x 1.3) 0.1 21.6 24.8 159.9 15.65 85 38.06 50.15
SO2 (ppb) 0.0 1.6 1.8 11.3 1.02 52
Table 12 Cheltenham winter summary statistics of hourly data – 2002.
Pollutant Min. Median Average Max. Standard deviation
Data capture (% of calendar
year)
CO (ppm) 0.00 0.58 0.72 5.57 0.55 100
NO (ppb) 0.0 15.8 33.8 403.3 46.0 100
NO2 (ppb) 0.1 18.0 19.3 64.6 12.3 100
NOx (ppb) 0.8 35.4 53.2 458.6 55.4 100
O3 (ppb) 0.4 17.6 17.7 54.4 12.1 91
PM10 (µg/m3) (TEOM,
unadjusted) 0.1 18.1 21.2 123.0 13.9 74
PM10 (µg/m3) (TEOM,
data x 1.3) 0.08 23.6 27.6 159.9 18.1 74
SO2 (ppb) 0.0 1.2 1.6 9.6 1.2 49
TRL
16
Table 13 Cheltenham summer summary statistics of hourly data – 2002.
Pollutant Min. Median Average Max. Standard deviation
Data capture (% of calendar
year)
CO (ppm) 0.00 0.62 0.68 2.89 0.41 100
NO (ppb) 0.0 12.6 22.2 280.9 26.5 100
NO2 (ppb) 0.3 15.2 17.6 68.1 11.2 100
NOx (ppb) 1.2 28.5 39.7 314.7 35.2 100
O3 (ppb) 0.6 21.4 22.7 76.2 13.4 100
PM10 (µg/m3) (TEOM,
unadjusted) 0.1 15.7 17.4 79.1 10.1 96
PM10 (µg/m3) (TEOM,
data x 1.3) 0.1 20.4 22.6 102.9 13.1 96
SO2 (ppb) 0.1 1.7 1.9 11.3 0.8 55
The highest average and peak hour concentration coincided for CO, NO, NO2 and PM10, all of which occurred in the winter. For O3 and SO2, the highest average and highest hourly concentration occurred during the summer months. In contrast to the other sites within the network, this site is predominantly urban in character, and thus there are a considerable number of other sources of local pollution. However, it is surprising that the highest NO2 concentrations occur in the winter while the highest SO2 concentration occurs in the summer. 4.1.4 M60 data summary Monitoring at the M60 site commenced in May 1999, and thus 2002 represents the third year of continuous measurements. A high level of data capture was achieved at this site, with an average rate of 96 %. This varied from 90 % for CO to 99 % for PM10. Several faults were reported with the CO analyser during January and February. Traffic counts during 2002 were subject to several data loses. Most significantly, no traffic data were available in both directions during January and February, and for the clockwise carriageway during the period 17 August to 11 September. These data losses result in data capture rates of 69 % for the clockwise direction and 75 % for the anticlockwise direction. Tables 14 to 16 provide a summary of the measurements recorded during 2002, at this site. Table 14 M60 annual summary statistics of hourly data – 2002.
Pollutant Min. Median Average Max. Standard deviation
data x 1.3) 0.3 22.2 24.6 181.8 13.18 99 35.95 52.23
Total traffic (veh/hr) 2022 6200 5680 8217 1091 65
Annual average daily traffic (veh/day)
48535 148831 134596 169042 26430 65
TRL
17
Table 15 M60 winter summary statistics of hourly data – 2002.
Pollutant Min. Median Average Max. Standard deviation
Data capture (% of calendar
year)
CO (ppm) 0.02 0.32 0.39 2.97 0.30 81
NO (ppb) 0.0 20.8 47.0 716.3 63.0 96
NO2 (ppb) 0.1 20.7 21.3 85.75 10.97 96
NOx (ppb) 2.2 42.1 68.4 795.7 70.7 96
O3 (ppb) 0.0 10.0 11.8 52.6 9.7 90
PM10 (µg/m3) (TEOM,
unadjusted) 0.3 18.0 19.7 139.8 10.5 98
PM10 (µg/m3) (TEOM, data x
1.3) 0.3 23.4 25.6 181.8 13.7 98
Total traffic (veh/hr) 2022 5978 5469 7201 1086 59
Annual average daily traffic (veh/day)
48535 141645 129255 167549 27006 59
Table 16 M60 summer summary statistics of hourly data – 2002.
Pollutant Min. Median Average Max. Standard deviation
Data capture (% of calendar year)
CO (ppm) 0.01 0.26 0.29 2.39 0.18 98
NO (ppb) 0.0 27.8 43.9 495.4 48.5 100
NO2 (ppb) 1.5 23.1 23.1 66.2 11.2 100
NOx (ppb) 2.3 52.4 67.0 554.8 56.4 100
O3 (ppb) 0.1 11.6 14.1 67.2 11.4 99
PM10 (µg/m3) (TEOM,
unadjusted) 0.8 16.3 18.2 95.4 9.7 100
PM10 (µg/m3) (TEOM, data x
1.3) 1.0 21.2 23.7 124.0 12.6 100
Total traffic (veh/hr) 3472 6401 5850 8217 1082 70
Annual average daily traffic (veh/day)
82911 152924 138632 169042 25568 71
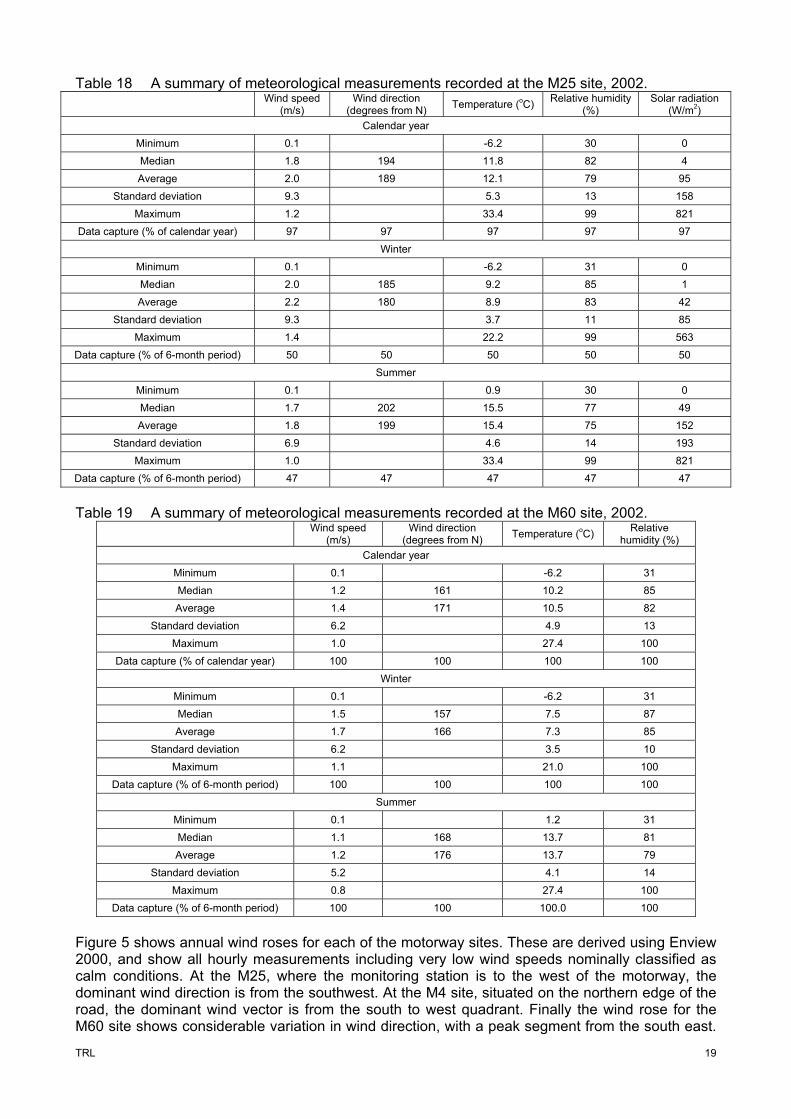
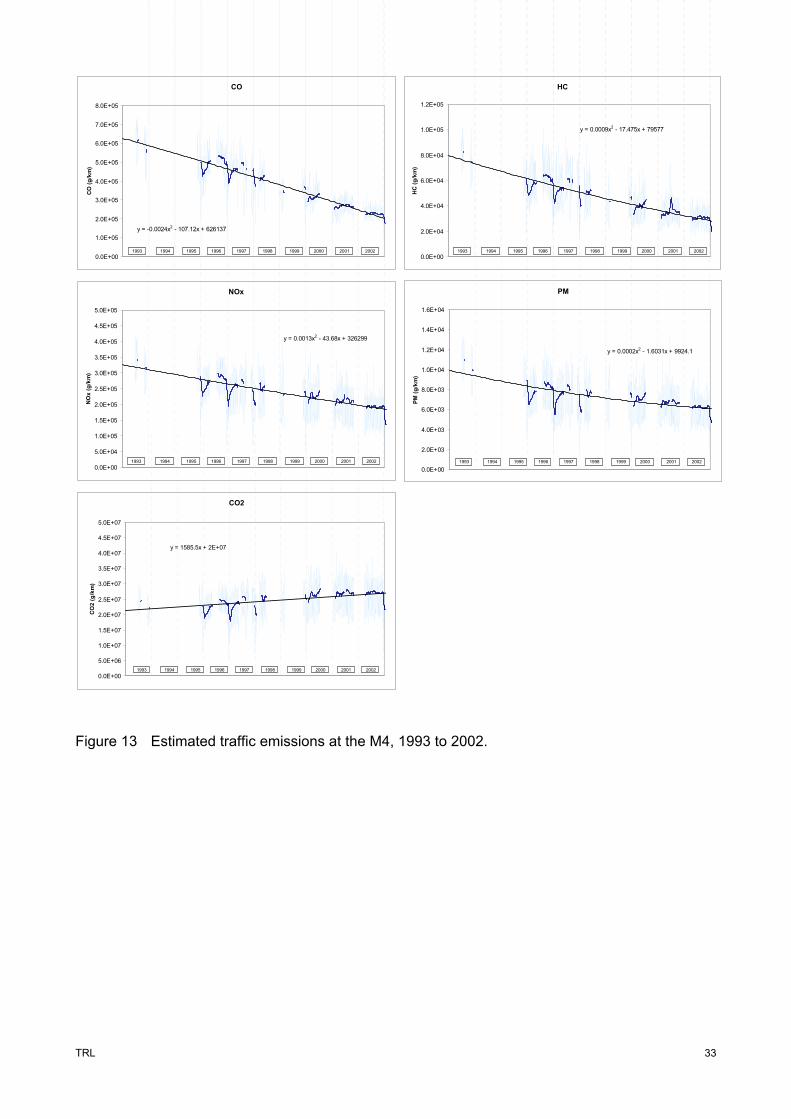
Highest concentrations of CO, NO and PM10 are associated with the winter period. As expected, the highest average O3 and NO2 concentrations occur during the warmer summer period. However, the maximum NO2 hourly concentration actually occurs during the winter period, and is thus likely to be associated with poor dispersion rather than solely increased photochemistry and secondary pollutant contribution. In common with the other network sites, AADT flows were approximately 7 % higher in the summer than those occurring during the winter period. 4.2 Meteorological data At the three motorway monitoring sites, continuous measurements are made of meteorological conditions including wind speed, wind direction, temperature and relative humidity. At the M25 site, measurements of solar radiation are also undertaken. Tables 17 to 19 provide a summary of these data. The inclusion of wind direction within these tables is for indication only, with these vector data more appropriately presented as a series of annual wind roses, in Figure 5, and as monthly plots in Annex A4. An analysis of wind speed calm9 conditions is included in Annex A5.
9 Calm conditions are defined as an apparent absence of motion of the air. In the Beaufort wind scale, this condition is reported when smoke is observed to rise vertically. This is routinely related to a wind speed of less than three knots. These calm conditions are not separated in the wind roses in Figure 5 or Annex A4, but are shown in Annex A5.
TRL
18
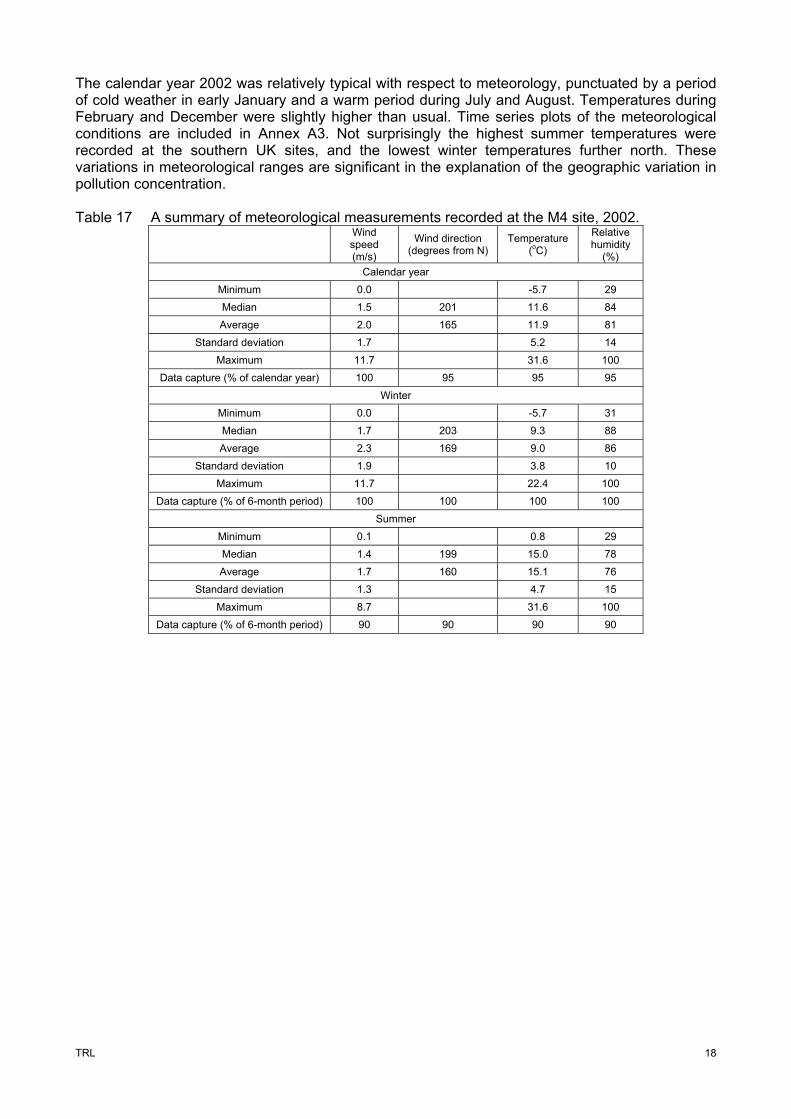
The calendar year 2002 was relatively typical with respect to meteorology, punctuated by a period of cold weather in early January and a warm period during July and August. Temperatures during February and December were slightly higher than usual. Time series plots of the meteorological conditions are included in Annex A3. Not surprisingly the highest summer temperatures were recorded at the southern UK sites, and the lowest winter temperatures further north. These variations in meteorological ranges are significant in the explanation of the geographic variation in pollution concentration. Table 17 A summary of meteorological measurements recorded at the M4 site, 2002.
Wind speed (m/s)
Wind direction (degrees from N)
Temperature (oC)
Relative humidity
(%) Calendar year
Minimum 0.0 -5.7 29 Median 1.5 201 11.6 84 Average 2.0 165 11.9 81
Standard deviation 1.7 5.2 14 Maximum 11.7 31.6 100
Data capture (% of calendar year) 100 95 95 95 Winter
Minimum 0.0 -5.7 31 Median 1.7 203 9.3 88 Average 2.3 169 9.0 86
Standard deviation 1.9 3.8 10 Maximum 11.7 22.4 100
Data capture (% of 6-month period) 100 100 100 100 Summer
Minimum 0.1 0.8 29 Median 1.4 199 15.0 78 Average 1.7 160 15.1 76
Standard deviation 1.3 4.7 15 Maximum 8.7 31.6 100
Data capture (% of 6-month period) 90 90 90 90
TRL
19
Table 18 A summary of meteorological measurements recorded at the M25 site, 2002. Wind speed
(m/s) Wind direction
(degrees from N) Temperature (oC) Relative humidity (%)
Solar radiation (W/m2)
Calendar year Minimum 0.1 -6.2 30 0 Median 1.8 194 11.8 82 4 Average 2.0 189 12.1 79 95
Standard deviation 9.3 5.3 13 158 Maximum 1.2 33.4 99 821
Data capture (% of calendar year) 97 97 97 97 97 Winter
Minimum 0.1 -6.2 31 0 Median 2.0 185 9.2 85 1 Average 2.2 180 8.9 83 42
Standard deviation 9.3 3.7 11 85 Maximum 1.4 22.2 99 563
Data capture (% of 6-month period) 50 50 50 50 50 Summer
Minimum 0.1 0.9 30 0 Median 1.7 202 15.5 77 49 Average 1.8 199 15.4 75 152
Standard deviation 6.9 4.6 14 193 Maximum 1.0 33.4 99 821
Data capture (% of 6-month period) 47 47 47 47 47
Table 19 A summary of meteorological measurements recorded at the M60 site, 2002.
Wind speed (m/s)
Wind direction (degrees from N) Temperature (oC) Relative
humidity (%) Calendar year
Minimum 0.1 -6.2 31 Median 1.2 161 10.2 85 Average 1.4 171 10.5 82
Standard deviation 6.2 4.9 13 Maximum 1.0 27.4 100
Data capture (% of calendar year) 100 100 100 100 Winter
Minimum 0.1 -6.2 31 Median 1.5 157 7.5 87 Average 1.7 166 7.3 85
Standard deviation 6.2 3.5 10 Maximum 1.1 21.0 100
Data capture (% of 6-month period) 100 100 100 100 Summer
Minimum 0.1 1.2 31 Median 1.1 168 13.7 81 Average 1.2 176 13.7 79
Standard deviation 5.2 4.1 14 Maximum 0.8 27.4 100
Data capture (% of 6-month period) 100 100 100.0 100
Figure 5 shows annual wind roses for each of the motorway sites. These are derived using Enview 2000, and show all hourly measurements including very low wind speeds nominally classified as calm conditions. At the M25, where the monitoring station is to the west of the motorway, the dominant wind direction is from the southwest. At the M4 site, situated on the northern edge of the road, the dominant wind vector is from the south to west quadrant. Finally the wind rose for the M60 site shows considerable variation in wind direction, with a peak segment from the south east.
TRL
20
At this location the monitoring site is to the south of the M60. It is evident from the ranges within the wind rose, that airflow over the M60 site is unrestricted by topography, whereas those at the M4 and M25 appear to be restricted by local topographic conditions. Annex A4 provides monthly wind roses for each of the three motorway sites. Temporal variations in roadside pollutant concentrations will be dependent on the magnitude of the source and background contributions, both of which are influenced by local traffic activity combined with the prevailing wind direction and speed. At the M4 site, significant contributions from northerly winds occur during March, April, May, September, October and December. Relatively low wind speed conditions occurred during the summer months. At the M25 site, less variation in wind conditions are evident. During a significant proportion of March, April and December winds are recorded from the north east. Lowest wind speeds are again associated with the summer months. Finally the M60 is characterised by significant variations in wind direction through out the year. Lowest wind speeds are again evident during the summer. In addition, a period of high wind speeds was recorded during February and March.
Figure 5 Annual wind rose plots for each of the three motorway monitoring sites.
TRL
21
4.3 Diurnal and weekly pollution profiles Sections 4.1 and 4.2 provide annual summaries of those data measured at the HA network. However, these data also have a temporal resolution, driven by changes in emissions and meteorology. In general the transport activity remains similar from week to week, as driving patterns are dominated by regular work and leisure routines. Typical weekly traffic activity and pollution profiles may be generated by averaging each hour of the week. Using this approach, each hour of the week is derived from the average of the 52 weekly values occurring over the year. Figures 6 to 9 show the weekly, 168-hour plots for each of the four monitoring sites for the calendar year 2002. Each plot shows a 7-day period commencing with the hour starting 00:00 on the Monday and ending with the hour starting 23:00 on the Sunday.
Figure 6 Average 168-hour data plots, M4 motorway, 2002 The profiles derived for the M4 show the typical weekday morning and evening traffic peaks, which are reflected in the measured concentrations of the primary pollutants CO and NO. Evening traffic peaks are generally higher than those in the morning, with the highest traffic flows occurring on a Friday evening. Traffic flows over the weekend period are lower than those recorded on weekdays, and are characterised by a single extended morning peak on the Saturday, and a small evening peak on the Sunday. Carbon monoxide concentrations are highly correlated with weekday traffic flows. However, although traffic flows over the weekend period are reduced, no corresponding reduction in CO is evident. Nitric oxide concentrations exhibit high morning peaks, with the concentrations recorded over the weekend period at approximately half of those during the weekday period. The secondary pollutant NO2 also displays a strong week day correlation with traffic flow. The highest concentrations of NO2 are associated with the afternoon traffic peak. The NO2 concentrations are mirrored by O3 concentrations. The highest O3 concentrations occur during the middle to late evening, and are particularly high on the Saturday and Sunday evenings. Particulate concentrations are highest on the Thursday, and lowest on the Sunday.
0.0
0.2
0.4
0.6
0.8
1.0
CO
(ppm
)
0
2000
4000
6000
8000
10000
12000
Traf
fic fl
ow (v
eh/h
)
CO Traffic
0
50
100
150
200
NO
(ppb
)0
2000
4000
6000
8000
10000
12000
Traf
fic fl
ow (v
eh/h
)
NO Traffic
0
5
10
15
20
25
30
35
NO
2 (pp
b)
0
2000
4000
6000
8000
10000
12000
Traf
fic fl
ow (v
eh/h
)
NO2 Traffic
0
5
10
15
20
O3 (
ppb)
0
2000
4000
6000
8000
10000
12000
Traf
fic fl
ow (v
eh/h
)
O3 Traffic
0
10
20
30
40
50
PM10
(g/
m3 )
0
2000
4000
6000
8000
10000
12000
Traf
fic fl
ow (v
eh/h
)
PM10 Traffic
TRL
22
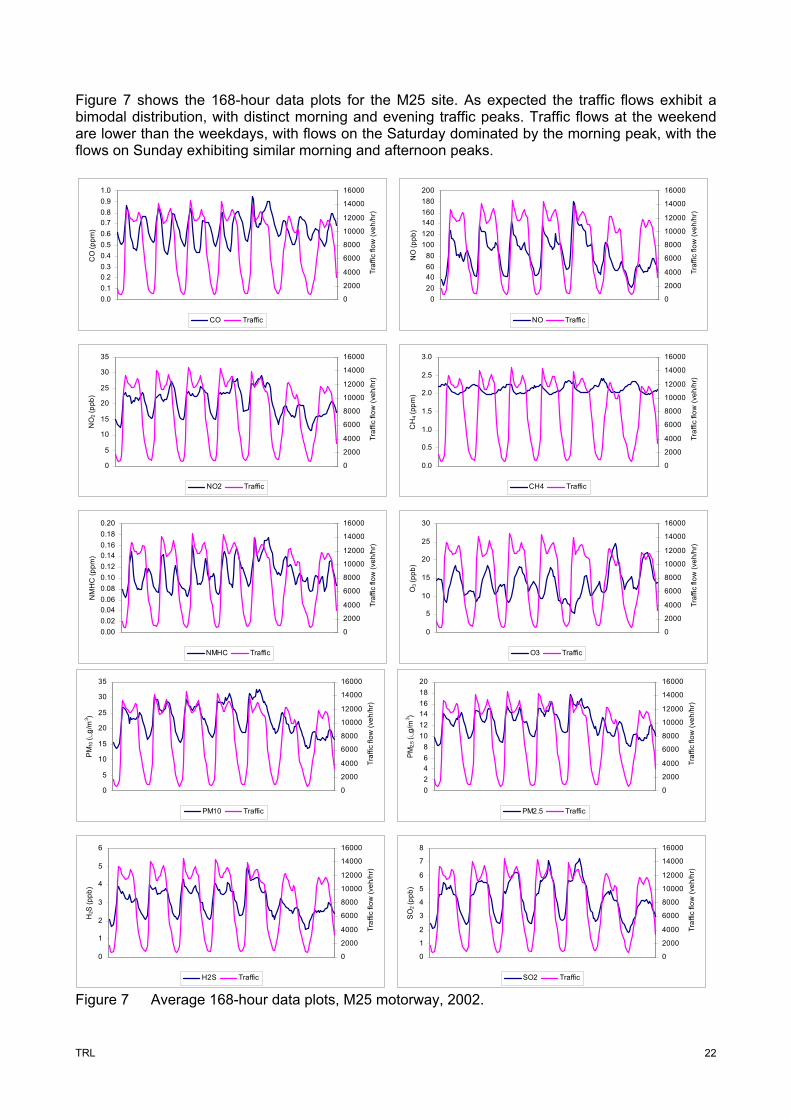
Figure 7 shows the 168-hour data plots for the M25 site. As expected the traffic flows exhibit a bimodal distribution, with distinct morning and evening traffic peaks. Traffic flows at the weekend are lower than the weekdays, with flows on the Saturday dominated by the morning peak, with the flows on Sunday exhibiting similar morning and afternoon peaks.
0.00.10.20.30.40.50.60.70.80.91.0
CO
(ppm
)
0
2000
4000
6000
8000
10000
12000
14000
16000
Traf
fic fl
ow (v
eh/h
r)
CO Traffic
020406080
100120140160180200
NO
(ppb
)
0
2000
4000
6000
8000
10000
12000
14000
16000
Traf
fic fl
ow (v
eh/h
r)
NO Traffic
0
5
10
15
20
25
30
35
NO
2 (pp
b)
0
2000
4000
6000
8000
10000
12000
14000
16000
Traf
fic fl
ow (v
eh/h
r)
NO2 Traffic
0.000.020.040.060.080.100.120.140.160.180.20
NM
HC
(ppm
)
0
2000
4000
6000
8000
10000
12000
14000
16000
Traf
fic fl
ow (v
eh/h
r)
NMHC Traffic
0
5
10
15
20
25
30
O3 (
ppb)
0
2000
4000
6000
8000
10000
12000
14000
16000
Traf
fic fl
ow (v
eh/h
r)
O3 Traffic
0.0
0.5
1.0
1.5
2.0
2.5
3.0
CH
4 (pp
m)
0
2000
4000
6000
8000
10000
12000
14000
16000
Traf
fic fl
ow (v
eh/h
r)
CH4 Traffic
0
5
10
15
20
25
30
35
PM
10 ( ∪
g/m
3 )
0
2000
4000
6000
8000
10000
12000
14000
16000
Traf
fic fl
ow (v
eh/h
r)
PM10 Traffic
02468
101214161820
PM2.
5 (∪g
/m3 )
0
2000
4000
6000
8000
10000
12000
14000
16000Tr
affic
flow
(veh
/hr)
PM2.5 Traffic
0
1
2
3
4
5
6
7
8
SO
2 (pp
b)
0
2000
4000
6000
8000
10000
12000
14000
16000
Traf
fic fl
ow (v
eh/h
r)
SO2 Traffic
0
1
2
3
4
5
6
H2S
(ppb
)
0
2000
4000
6000
8000
10000
12000
14000
16000
Traf
fic fl
ow (v
eh/h
r)
H2S Traffic
Figure 7 Average 168-hour data plots, M25 motorway, 2002.
TRL
23
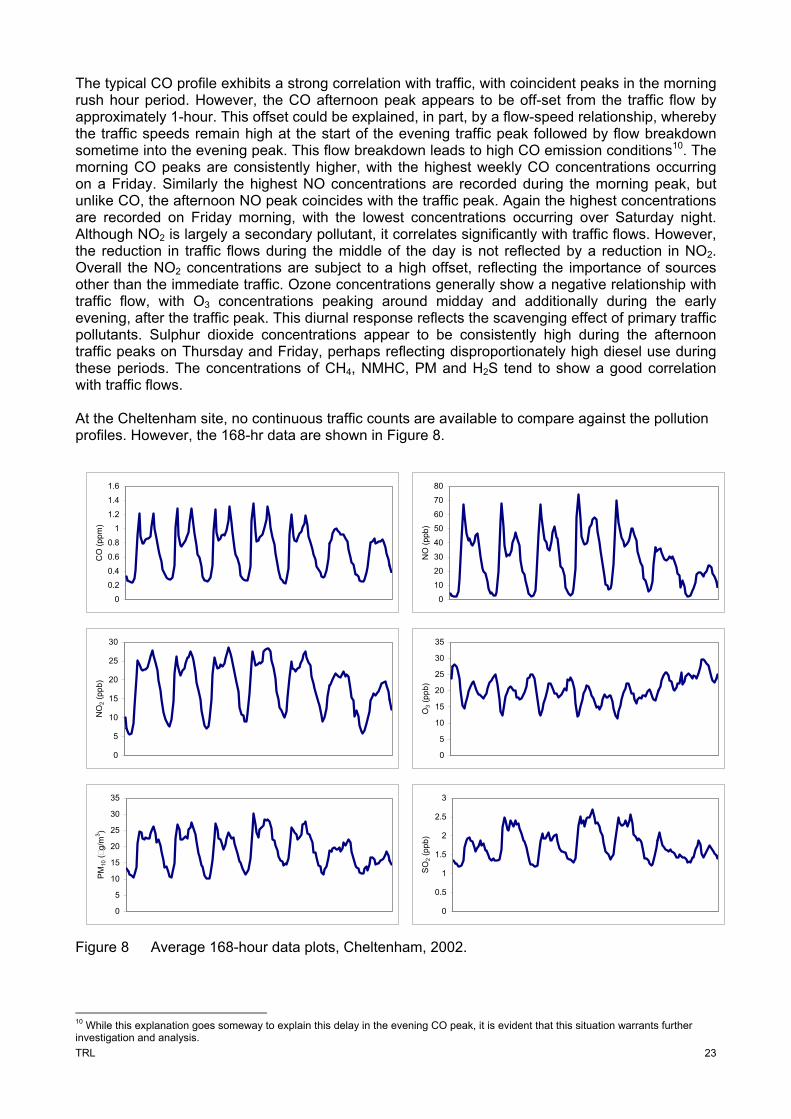
The typical CO profile exhibits a strong correlation with traffic, with coincident peaks in the morning rush hour period. However, the CO afternoon peak appears to be off-set from the traffic flow by approximately 1-hour. This offset could be explained, in part, by a flow-speed relationship, whereby the traffic speeds remain high at the start of the evening traffic peak followed by flow breakdown sometime into the evening peak. This flow breakdown leads to high CO emission conditions10. The morning CO peaks are consistently higher, with the highest weekly CO concentrations occurring on a Friday. Similarly the highest NO concentrations are recorded during the morning peak, but unlike CO, the afternoon NO peak coincides with the traffic peak. Again the highest concentrations are recorded on Friday morning, with the lowest concentrations occurring over Saturday night. Although NO2 is largely a secondary pollutant, it correlates significantly with traffic flows. However, the reduction in traffic flows during the middle of the day is not reflected by a reduction in NO2. Overall the NO2 concentrations are subject to a high offset, reflecting the importance of sources other than the immediate traffic. Ozone concentrations generally show a negative relationship with traffic flow, with O3 concentrations peaking around midday and additionally during the early evening, after the traffic peak. This diurnal response reflects the scavenging effect of primary traffic pollutants. Sulphur dioxide concentrations appear to be consistently high during the afternoon traffic peaks on Thursday and Friday, perhaps reflecting disproportionately high diesel use during these periods. The concentrations of CH4, NMHC, PM and H2S tend to show a good correlation with traffic flows. At the Cheltenham site, no continuous traffic counts are available to compare against the pollution profiles. However, the 168-hr data are shown in Figure 8.
0
10
20
30
40
50
60
70
80
NO
(ppb
)
0
0.2
0.4
0.6
0.8
1
1.2
1.4
1.6
CO
(ppm
)
0
5
10
15
20
25
30
NO
2 (pp
b)
0
5
10
15
20
25
30
35
O3 (
ppb)
0
5
10
15
20
25
30
35
PM
10 (
g/m
3 )
0
0.5
1
1.5
2
2.5
3
SO
2 (pp
b)
Figure 8 Average 168-hour data plots, Cheltenham, 2002.
10 While this explanation goes someway to explain this delay in the evening CO peak, it is evident that this situation warrants further investigation and analysis.
TRL
24
It is evident that all of the pollutants, except O3, have a strong positive correlation with traffic flow. Carbon monoxide concentrations exhibit a bimodal distribution, with a sharp morning peak. The afternoon CO peak is generally broader, with a shoulder at the start of this peak. The CO concentrations are lower at the weekend, and are generally characterised by a single daytime concentration plateaux. The highest CO concentrations are evident on the Thursday evening. Nitric oxide concentrations also exhibit this bimodal concentration profile, but in contrast to the CO concentrations are characterized by a pronounced morning peak. The concentrations distribution of NO2 is broadly similar to that of CO. Ozone concentrations show an inverse relationship with NO2. Finally PM10 concentrations exhibit a bimodal distribution, but in contrast to CO the dip in the mid-day pollution profile is less distinct. At the M60 motorway site, (Figure 9) traffic flows also show this typical bimodal distribution, with weekend traffic flows approximately 60 % of those during the week. Carbon monoxide and NO concentrations exhibit a sharp peak during the morning rush hour period, reflecting the high speed uninterrupted flows characteristic of this location. The concentrations of all pollutants, other than O3, exhibit low concentrations during the weekend periods. The weekly NO2 profiles exhibits narrow morning peaks, but wide afternoon peaks which extend into the early evening. Ozone concentrations are generally highest when traffic flows are lowest, with O3 peaks at the weekend, during the weekday midday traffic low and into the evening period. Particulate concentrations exhibit a small morning and evening peaks, with relatively low concentrations at the weekend.
0
20
40
60
80
100
120
NO
(ppb
)
0
2000
4000
6000
8000
10000
12000
14000
Traf
fic fl
ow (v
eh/h
)
NO Traffic
0
5
10
15
20
25
30
35
NO
2 (pp
b)
0
2000
4000
6000
8000
10000
12000
14000
Traf
fic fl
ow (v
eh/h
)
NO2 Traffic
0
5
10
15
20
25
O3 (
ppb)
0
2000
4000
6000
8000
10000
12000
14000
Traf
fic fl
ow (v
eh/h
)
O3 Traffic
0
5
10
15
20
25
30
PM
10 (
g/m
3 )
0
2000
4000
6000
8000
10000
12000
14000
Traf
fic fl
ow (v
eh/h
)
PM10 Traffic
0.0
0.1
0.2
0.3
0.4
0.5
0.6
0.7
CO
(ppm
)
0
2000
4000
6000
8000
10000
12000
14000
Traf
fic fl
ow (v
eh/h
)
CO Traffic
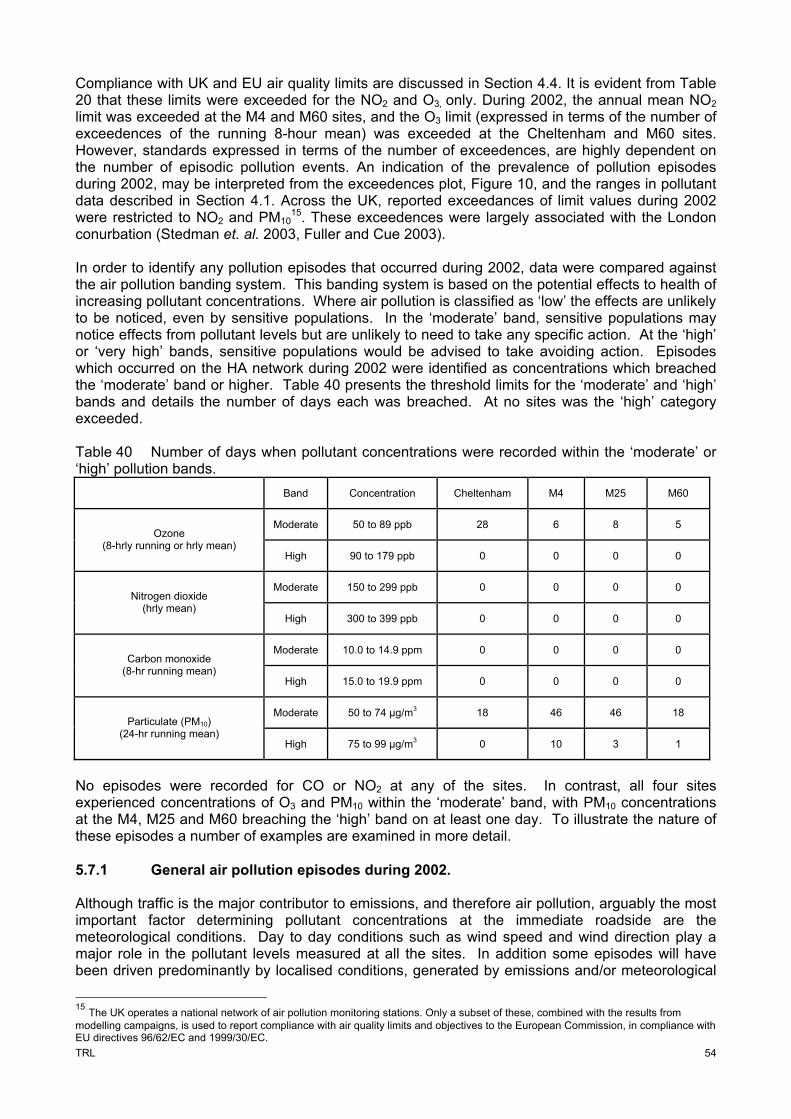
Figure 9 Average 168-hour data plots, M60, 2002. 4.4 Compliance with air quality criteria A summary of UK air quality objectives and EU limit values are given in Annex A6. With respect to the UK air quality objectives, compliance is required by a specified date, ranging from 2003 to 2010. Similarly compliance with EU limits is required by 2005 and 2010, dependent on the specific pollutant. Thus any assessment against these standards involving current or historic monitoring
TRL
25
data may only be through a comparison with the objective and limit values, rather than a strict assessment against compliance, as these standards and limits do not apply during the years in which these measured concentrations were obtained. Compliance may only be confirmed through modelling these future concentrations, and the comparison of these results with these standards and limit values at the relevant locations where people will be exposed. It is important to note that these objectives do not strictly apply at these HA roadside sites. Table 20 provides a summary of air quality compliance for 2002 data, for each of the four network sites. Exceedences of the proposed standards are highlighted in red. Concentrations of CO and SO2 are well within the proposed limits. However, limits are exceeded for NO2 and O3. For NO2, no exceedences are recorded against the 1-hr mean standard, but the M4 and the M60 sites marginally exceed the annual mean limit. Whereas the reported annual mean NO2 at Cheltenham is well within the limit at 18.5 ppb, the M25 almost exceeds the standard, with an annual mean of 21.8 ppb. Given the uncertainties associated with ambient monitoring, the M25 annual mean is too close to confirm its compliance during 2002, with the annual mean limit for 2005. Ozone compliance for those sites closest to the road are well within the limit, but for those with sample inlets situated a few metres from the edge of the road, (Cheltenham and the M60), excedences are estimated for 2002. This may be explained by the presence of large quantities of NO at receptors closest to the road, which act as sinks for the local O3. With increasing distance from the road (and thus the source) the amount of available NO reduces, and thus the scavenging of O3 is correspondingly reduced. The largest number of exceedences of the O3 limit occur at the urban Cheltenham site. All particulate PM10 data recorded within 2002 were undertaken using a heated TEOM. As discussed in Section 4.1, these data have been factored by 1.3 to ‘correct’ for volatile particulate loses, for direct comparison with the PM standards. Both the 24-hour and annual mean concentrations were well within the standard at all of the sites. The highest annual mean concentrations were recorded at the M4 site, with relatively low, but similar concentrations recorded at the Cheltenham and M60 sites. Table 20 Compliance with UK standards and EU air quality limits, 2002.
The air quality situation recorded between 1992 and 2002 demonstrates an improvement in air pollutant concentrations of all of the primary pollutants. This downward trend is punctuated by yearly deviations from this trend, largely driven by changes in meteorology. Although the 2002 data broadly complies with this downward trend, it is closer than expected to those concentrations recorded in 2001. Concentrations and thus compliance of NO2 has been relatively static over this period, and contrasts with an increase in O3 concentrations and exceedences. Figure 10 provides a time series representation of these trends in air quality compliance. Full compliance data are included in Annex A7.
TRL
26
Figure 10 Time series of pollutant compliance, at each of the four monitoring sites. 4.5 Trends in measured air pollution concentrations The pollutant time series plots included in Annex A3 highlight the variation in measurement data, much of which is driven by short-term changes in traffic flows, wind speed and direction. The determination of the underlying trends in these data must ignore these short-term fluctuations and are thus, within this study, based upon the rolling annual average. Figure 11 shows the rolling annual average concentrations, by pollutant, for each site. As a general rule, trends determined for periods of less than 5 years are considered uncertain and thus those derived for the Cheltenham and M60 sites, and for specific pollutants such as PM2.5 at the M25 will be subject to a large uncertainty. Figure 11 is further supported by Tables 21 to 24 which show the yearly change in average pollutant concentrations at each of the sites. These trends are described, by pollutant in the following sections: Carbon monoxide At the M4 and M25 sites, concentrations show a downward trend from the beginning of the monitoring to the end of 1999. After 1999 concentrations tend to increase each year. At the urban Cheltenham site, CO declines to the end of 2001, but also increases in 2002. Finally, at the M60 site, concentrations increase between 2000 and 2001, but show a downward trend in 2002.
0
20
40
60
80
100
1992
1993
1994
1995
1996
1997
1998
1999
2000
2001
2002
Year
NO
2 - N
o. o
f exc
eede
nces
of t
he
1-hr
mea
n
M4M25CheltenhamM60
Threshold 18
0123456789
10
1992
1993
1994
1995
1996
1997
1998
1999
2000
2001
2002
Year
CO
- M
ax. d
aily
runn
ing
8-hr
m
ean
(ppm
)
M4M25CheltenhamM60
Threshold 8.6 ppm
0102030405060708090
100
1992
1993
1994
1995
1996
1997
1998
1999
2000
2001
2002
Year
NO
2 - A
nnua
l mea
n (p
pb) M4
M25CheltenhamM60
Threshold 21 ppb
0102030405060708090
100
1992
1993
1994
1995
1996
1997
1998
1999
2000
2001
2002
Year
PM10
- N
o. o
f exc
eede
nces
of 2
4-hr
mea
n
M4M25CheltenhamM60
Threshold 35
05
101520253035404550
1992
1993
1994
1995
1996
1997
1998
1999
2000
2001
2002
Year
PM10
- an
nual
mea
n (
g/m
3 )
M4M25CheltenhamM60
Threshold 40 µg/m3
0
20
40
60
80
100
120
140
1992
1993
1994
1995
1996
1997
1998
1999
2000
2001
2002
Year
SO
2 - M
ax. 2
4-hr
& M
ax. 1
5-m
in
mea
n (p
pb) M25 24-hr mean
Cheltenham 24-hr meanM25 15-min meanCheltenham 15-min mean
Threshold 24-hr mean 47 ppb
Threshold 15-min mean 100 ppb
TRL
27
Nitric oxide At the M4 site, NO concentrations reduce from 1996 to the end of 1999, are then subject to an increase over the period 1999 to 2001, and subsequently show a reduction over the period 2001 to 2002. A similar trend is evident at the M25 site. At the Cheltenham site concentrations reduce to the end of 2000, but are subject to an increase over the period 2000 to 2002. At all sites, NO shows an overall downward trend in concentration. Nitrogen dioxide Annual average nitrogen dioxide concentrations have remained relatively unchanged at the start and end of the 1996 and 2002 period. However, this trend has been subject to fluctuations. At the M4 site concentrations increased considerably between 1996 and 199711, but then remained relatively constant to the end of 2000. Subsequently between 2000 and 2002, concentrations have reduced. Again a similar situation occurs at the M25 site. At the urban Cheltenham site concentrations have increased each year, except during the period 1999 and 2000. Concentrations at the M60 site, show a similar trend to the NO2 concentrations. Methane Methane measurements are recorded at the M4 and M25 sites. The percentage change at both sites has been relatively small, with fluctuations in one year generally being cancelled out by an opposite fluctuation the following year. Overall, little change in concentration between the start and end of the measurement period are evident. This is not surprising, as CH4 concentrations are dominated by regional background concentrations. Non-methane hydrocarbons Non methane hydrocarbon measurements are only recorded at the M4 and M25 sites. Significant reductions are evident at the M4 site between 1996 and 1999. Between 1999 and 2000 concentrations significantly increased, subsequently reducing in 2001. At the M4 site concentrations increased between 1996 and 1997, subsequently reduced during the period 1997 to 1999, and then increased over the period 1999 to 2000. Overall concentrations have reduced over the whole period, at both sites. Ozone Ozone concentrations at all of the sites have been subject to considerable fluctuations. Overall concentrations display an increase over the period 1996 to 2002. Between 2001 and 2002, reductions in O3 were recorded at all sites, other than the M60. Particulate matter Overall there has been an overall downward trend in PM10 and PM2.5 concentrations. In comparison with other pollutant species the yearly fluctuations are relatively small. Between 2001 and 2002, downward trends are recorded at each site, again with the exception of the M60 site. Sulphur dioxide Sulphur dioxide concentrations are recorded at the M25 and Cheltenham sites. Reductions in concentrations are evident at both sites between 1998 and 2001. Between 2001 and 2002, concentrations at both sites increased by approximately 4 %.
11 One explanation for this increase in pollutant concentrations may be associated with the construction activities associated with the development of the Madjeski sports stadium and the Green Park business estate, to the north of the M4 and the monitoring station. These activities commenced in 1996, and peaked between 2000 and 2002.
TRL
28
Hydrogen sulphide Measurements are only undertaken at the M25 site. After 1999, these measurements show a small reduction in concentration to the end of 2002.
0
5
10
15
20
Jan-
96
May
-96
Sep
-96
Jan-
97
May
-97
Sep
-97
Jan-
98
May
-98
Sep
-98
Jan-
99
May
-99
Sep
-99
Jan-
00
May
-00
Sep
-00
Jan-
01
May
-01
Sep
-01
Jan-
02
May
-02
Sep
-02
Year
PM
2.5 (
g/m
3 )
M 25
012345678
Jan-
96
May
-96
Sep
-96
Jan-
97
May
-97
Sep
-97
Jan-
98
May
-98
Sep
-98
Jan-
99
May
-99
Sep
-99
Jan-
00
May
-00
Sep
-00
Jan-
01
May
-01
Sep
-01
Jan-
02
May
-02
Sep
-02
Year
SO
2 (pp
b)
M 25 Chelt
01234567
Jan-
96
May
-96
Sep
-96
Jan-
97
May
-97
Sep
-97
Jan-
98
May
-98
Sep
-98
Jan-
99
May
-99
Sep
-99
Jan-
00
May
-00
Sep
-00
Jan-
01
May
-01
Sep
-01
Jan-
02
May
-02
Sep
-02
Year
H2S
(ppb
)
M 25
00.20.40.60.8
11.2
Jan-
96
May
-96
Sep
-96
Jan-
97
May
-97
Sep
-97
Jan-
98
May
-98
Sep
-98
Jan-
99
May
-99
Sep
-99
Jan-
00
May
-00
Sep
-00
Jan-
01
May
-01
Sep
-01
Jan-
02
May
-02
Sep
-02
Year
CO
(ppm
)
M4 M25 Chelt M60
0
50
100
150
200
250
Jan-
96
May
-96
Sep
-96
Jan-
97
May
-97
Sep
-97
Jan-
98
May
-98
Sep
-98
Jan-
99
May
-99
Sep
-99
Jan-
00
May
-00
Sep
-00
Jan-
01
May
-01
Sep
-01
Jan-
02
May
-02
Sep
-02
Year
NO
(ppb
)
M4 M25 Chelt M60
05
101520253035
Jan-
96
May
-96
Sep
-96
Jan-
97
May
-97
Sep
-97
Jan-
98
May
-98
Sep
-98
Jan-
99
May
-99
Sep
-99
Jan-
00
May
-00
Sep
-00
Jan-
01
May
-01
Sep
-01
Jan-
02
May
-02
Sep
-02
Year
NO
2 (pp
b)
M4 M25 Chelt M60
00.05
0.10.15
0.20.25
0.30.35
Jan-
96
May
-96
Sep-
96
Jan-
97
May
-97
Sep-
97
Jan-
98
May
-98
Sep-
98
Jan-
99
May
-99
Sep-
99
Jan-
00
May
-00
Sep-
00
Jan-
01
May
-01
Sep-
01
Jan-
02
May
-02
Sep-
02
Year
NM
HC
(ppm
)
M4 M25
00.5
11.5
22.5
3
Jan-
96
May
-96
Sep-
96
Jan-
97
May
-97
Sep-
97
Jan-
98
May
-98
Sep-
98
Jan-
99
May
-99
Sep-
99
Jan-
00
May
-00
Sep-
00
Jan-
01
May
-01
Sep-
01
Jan-
02
May
-02
Sep-
02
Year
CH
4 (pp
m)
M4 M25
0
50
100
150
200
250
Jan-
96
May
-96
Sep
-96
Jan-
97
May
-97
Sep
-97
Jan-
98
May
-98
Sep
-98
Jan-
99
May
-99
Sep
-99
Jan-
00
May
-00
Sep
-00
Jan-
01
May
-01
Sep
-01
Jan-
02
May
-02
Sep
-02
YearN
OX (p
pb)
M4 M25 Chelt M60
05
1015202530
Jan-
96
May
-96
Sep-
96
Jan-
97
May
-97
Sep-
97
Jan-
98
May
-98
Sep-
98
Jan-
99
May
-99
Sep-
99
Jan-
00
May
-00
Sep-
00
Jan-
01
May
-01
Sep-
01
Jan-
02
May
-02
Sep-
02
Year
O3 (
ppb)
M4 M25 Chelt M60
05
10152025303540
Jan-
96
May
-96
Sep-
96
Jan-
97
May
-97
Sep-
97
Jan-
98
May
-98
Sep-
98
Jan-
99
May
-99
Sep-
99
Jan-
00
May
-00
Sep-
00
Jan-
01
May
-01
Sep-
01
Jan-
02
May
-02
Sep-
02
Year
PM
10 (
g/m
3 )
M4 M25 Chelt M60
Figure 11 Rolling annual average pollutant concentrations.
TRL
29
Table 21 Percentage change in annual, rolling annual average concentration, M4 site.
Table 24 Percentage change in annual rolling annual average concentration, M60 site.
Year CO NO NO2 NOX O3 PM10 00-01 29.7 -10.3 -11.1 -10.7 -9.4 -0.1 01-02 -26.3 1.5 4.6 2.4 1.6 17.3
4.6 Trends in traffic flows Continuous traffic flows are recorded in the vicinity of each of the motorway sites12. These data are derived directly from the HA contractors responsible for area traffic count operations and are thus provided to TRL before full ratification and archive to the TRADS13 database. No continuous traffic data are recorded at the Cheltenham site, but throughout the monitoring period, ad-hoc short term counts have been undertaken. Since the establishment of the monitoring programme, AADT flows at the M4, M25 and the M60 sites have been typically 102,736, 182,809 and 133,663 vehicles/day, respectively. The average annual changes in these flows, over the full duration of the monitoring, show an increase at the M4 and M25 sites of 2.8 %/yr and 0.7 %/yr, respectively, and a reduction at the M60 site of 0.4 %/y (Figure 12).
12 Traffic data at each of the motorway sites are taken from the nearest HA induction loop sensors. At the M4 and M25 sites, these traffic count sites are operated on behalf of the HA by Babtie Group, while those at the M60 site are operated on behalf of the HA by WSP group. 13 The TRADS database is a UK archive of traffic counts and statistics, available through www.trads2.co.uk
TRL
30
y = 1243.5x + 174726
y = 2572.1x + 89866
y = -525.5x + 138393
020000400006000080000
100000120000140000160000180000200000
1993 1994 1995 1996 1997 1998 1999 2000 2001 2002
Date
AA
DT
(veh
/day
)
M4 M25 M60 Linear (M25) Linear (M4) Linear (M60)
Figure 12 Trends in annual average daily traffic (AADT) flows at each of the HA motorway monitoring locations. There are considerable variations within the yearly estimated AADT. These arise through real changes in traffic flows associated with road works, short periods of adverse weather, and statistical artefacts associated with variations in data capture. At the M4 site a small reduction in AADT was evident over the period 1998 to 1999 of -1.1 %, which had a significant influence on the derived growth rate over the full monitoring period. During 2000 and throughout 2001 the eastbound traffic counting facility failed, resulting in a reduced data capture over this period. Therefore eastbound traffic data for 2001 was corrected against those data recorded during 2002 (after the repair of the count facility), using a derived adjustment factor. The relatively low traffic growth rate derived for the M25 site is again influenced by small reductions in AADT derived for the period 1997 to 1998 and 1999 to 2000 of -5.9 % and -2.0 %, respectively. Finally, trends at the M60 site are based upon a limited monitoring duration of just over three years. This allows for the derivation of only two yearly change values of -3.1 % over the period 2000 to 2001 and 2.4 % for the period 2001 to 2002. The overall reduction in traffic flows over this period is thus uncertain. A full summary of these data are provided in Annex A8.
TRL
31
5 DATA ANALYSIS AND AIR QUALITY TRENDS This monitoring programme represents a sum of some 34 years of combined monitoring, with one of the sites having been in operation for approximately 10 years. Those datasets associated with the longest monitoring durations may therefore provide a source of information to assess the long-term trends in roadside air quality. Where sites have been in operation for shorter periods, such as the M60 site, this trend analysis is less robust. However, these data may further be used to assess the short-term influences of changes in weather and local traffic. For each monitoring site, a series of figures are included in Annex A3 to allow a visual analysis of the 2002 data behaviour. The following figure sets are included, for each of the sites and survey years: time series plots for each of the measured parameters. These time series plots allow the
identification of seasonal trends, pollution peaks and lows. scatter plots to show the relationship between CO (a primary pollutant) and all other
parameters. Linear relationships should exist between primary pollutants associated with vehicle exhaust. Excessive scatter in these plots would suggest contributions from non-transport sources.
scatter plots to show the relationship between O3 (a secondary pollutant) and all other parameters. An inverse relationship should exist between a primary traffic-related pollutant and O3. Changes to this simple relationship would suggest additional sources of O3, perhaps arising through imported air.
Annex A4 provides a summary of the meteorological data recorded at the three motorway sites, through the provision of monthly wind roses. These plots show the considerable variation in wind speed and direction, and highlight the importance of the receptor position relative to the road alignment. The overall trend in air pollution concentrations at each of the sites, is driven by a number of influences. The most important of these are the magnitude of the emission source. This source is directly influenced by the number of vehicles passing the monitoring station, the way in which they are operated and the gradual process of fleet turnover. Over time, this process is subject to influences from two directions. Since the early 1990s and the introduction of catalyst technology to the vehicle fleet, the balance between traffic growth and the introduction of new cleaner vehicles has resulted in an overall reduction in traffic emissions for the majority of pollutants. One obvious exception to this improving emission situation is that of CO2, which is characterised by an overall year-on-year increase. Furthermore, this overall trend in pollutant concentrations may be influenced by short to medium term changes in background pollutant contributions and meteorology 5.1 Roadside vehicle emission Section 2.2 describes those changes in emissions determined from the NAEI. However this NAEI estimate is based upon national data, and is unable to fully incorporate local characteristics and conditions. Therefore for each of those sites where comprehensive traffic data are available, local emission estimates have been derived.
TRL
32
5.1.1 Emission estimation method Total emissions of CO, HC, NOX, PM, and CO2 were estimated on an hourly basis at each of the air quality monitoring sites, where traffic data are available. Emissions were estimated using an adapted version of the calculation method contained within the DMRB (Highways Agency et. al. 2003). The DMRB method incorporates speed-related emission functions for the following four generic classes of vehicle: - Cars - Light-goods vehicles - Heavy-goods vehicles - Buses Within each generic vehicle class, separate emission functions are provided for sub-classes. These are defined in relation to emission control legislation (e.g. Pre-Euro I, Euro I, Euro II, etc.) and engine size. In the case of heavy-goods vehicles, a distinction is also drawn between those, which are rigid, and those, which are articulated. For each sub-class of vehicle, the functions are used to estimate baseline emissions in grammes per kilometre. In the DMRB, the baseline emission values are subsequently multiplied by year-dependent technological scaling factors, which take into account the effects of the penetration of improved fuels and other technologies such as the retrofitting of particulate traps and oxidation catalyst on some diesel vehicles. However, the effects of these scaling factors were negligible during the period covered by this Report. The baseline emission rates for the vehicle sub-classes are subsequently combined with fleet composition data to produce weighted average emission rates for the generic vehicle classes. The vehicle fleet model compiled for the NAEI by Netcen (Murrells, 2002) was used to provide the appropriate weightings. Where either no information or only limited information on traffic composition is available, the DMRB considers the traffic in two broad classes: light-duty vehicles (LDVs) (cars and light goods vehicles) and heavy-duty vehicles (HDVs) (heavy goods vehicles and buses). The emission factors derived in this way for LDVs and HDVs are then multiplied by the numbers of LDVs and HDVs in the traffic during the period of interest (in this case on an hourly basis). In order to calculate total hourly emissions, the DMRB estimation method therefore requires the following: mean hourly traffic speed, the hourly total number of light-duty vehicles, and the hourly total number of heavy-duty vehicles. During the study period, the total bi-directional traffic flow was recorded near the motorway pollution monitoring sites on an hourly basis. The only available hourly record of traffic speed and composition (the proportions of LDVs and HDVs) was that collected using MIDAS system on the M25. In the absence of specific speed and composition data for the M4 and M60, this MIDAS information, combined with the national statistical data discussed in Section 2.1, were also used at these sites. From the hourly emission estimates, daily total emissions of each pollutant were calculated14. In addition, the 28-day running mean values of the daily totals were determined. These estimated daily and running average values for the M4, M25 and M60 sites are shown in Figure 13 to 15. The estimated average daily emission estimates for each year of site operation, for the LDV and HDV components are further tabulated in Table 25. Table 26 provides a summary of the total daily road transport emissions.
14 Emission estimates were only undertaken for those periods were valid traffic data existed. Annex A8 provides details of the hourly traffic flow, data capture rates.
TRL
33
CO
y = -0.0024x2 - 107.12x + 626137
0.0E+00
1.0E+05
2.0E+05
3.0E+05
4.0E+05
5.0E+05
6.0E+05
7.0E+05
8.0E+05
CO
(g/k
m)
1993 2000199919981997199619951994 20022001
HC
y = 0.0009x2 - 17.475x + 79577
0.0E+00
2.0E+04
4.0E+04
6.0E+04
8.0E+04
1.0E+05
1.2E+05
HC
(g/k
m)
1993 2000199919981997199619951994 20022001
NOx
y = 0.0013x2 - 43.68x + 326299
0.0E+00
5.0E+04
1.0E+05
1.5E+05
2.0E+05
2.5E+05
3.0E+05
3.5E+05
4.0E+05
4.5E+05
5.0E+05
NO
x (g
/km
)
1993 2000199919981997199619951994 20022001
PM
y = 0.0002x2 - 1.6031x + 9924.1
0.0E+00
2.0E+03
4.0E+03
6.0E+03
8.0E+03
1.0E+04
1.2E+04
1.4E+04
1.6E+04
PM (g
/km
)
1993 2000199919981997199619951994 20022001
CO2
y = 1585.5x + 2E+07
0.0E+00
5.0E+06
1.0E+07
1.5E+07
2.0E+07
2.5E+07
3.0E+07
3.5E+07
4.0E+07
4.5E+07
5.0E+07
CO
2 (g
/km
)
1993 2000199919981997199619951994 20022001
Figure 13 Estimated traffic emissions at the M4, 1993 to 2002.
TRL
34
CO
y = -244.32x + 1E+06
0.0E+00
2.0E+05
4.0E+05
6.0E+05
8.0E+05
1.0E+06
1.2E+06
1.4E+06
CO
(g/k
m)
1993 2000199919981997199619951994 20022001
HC
y = -26.688x + 139531
0.0E+00
2.0E+04
4.0E+04
6.0E+04
8.0E+04
1.0E+05
1.2E+05
1.4E+05
1.6E+05
1.8E+05
HC
(g/k
m)
1993 2000199919981997199619951994 20022001
NOX
y = -80.322x + 594339
0.0E+00
1.0E+05
2.0E+05
3.0E+05
4.0E+05
5.0E+05
6.0E+05
7.0E+05
8.0E+05
NO
X (g
/km
)
1993 2000199919981997199619951994 20022001
PM
y = -1.8919x + 16870
0.0E+00
5.0E+03
1.0E+04
1.5E+04
2.0E+04
2.5E+04
PM (g
/km
)
1993 2000199919981997199619951994 20022001
CO2
y = 1172.8x + 4E+07
0.0E+00
1.0E+07
2.0E+07
3.0E+07
4.0E+07
5.0E+07
6.0E+07
7.0E+07
8.0E+07
CO
2 (g/
km)
1993 2000199919981997199619951994 20022001
Figure 14 Estimated traffic emissions at the M25, 1993 to 2002.
TRL
35
Figure 15 Estimated traffic emissions at the M60, 1993 to 2002. Table 25 Average daily emissions for each motorway site, subdivided into the LDV and HDV vehicle classes (g/km/day).
CO HC NOX PM CO2 M4 LDV HDV LDV HDV LDV HDV LDV HDV LDV HDV
Table 26 Combined average daily total emissions for each motorway site (g/km/day).
M4 CO HC NOX PM CO2
1993 588491 78516 330592 10485 23299399
1994 n/a n/a n/a n/a n/a
1995 496767 60617 291267 8871 22842372
1996 493090 58080 268026 7766 22458672
1997 457690 54123 253346 7501 23358393
1998 404274 48536 244630 7301 24399693
1999 345719 42208 222237 6984 24408405
2000 313720 39075 220706 6935 26111650
2001 262743 33766 204648 6515 26260628
2002 226153 29966 187047 6102 26550324
M25 CO HC NOX PM CO2
1993 n/a n/a n/a n/a n/a
1994 n/a n/a n/a n/a n/a
1995 998591 120374 531971 15663 42541459
1996 917532 107512 502566 14619 42048914
1997 815811 95904 456220 13483 41899077
1998 680493 76375 406421 11924 40374072
1999 611518 75532 401063 12559 43845504
2000 523313 65089 376625 11798 44201728
2001 436351 55930 346331 10979 44144537
2002 374153 48289 316998 10289 44555007
M60 CO HC NOX PM CO2
1993 n/a n/a n/a n/a n/a
1994 n/a n/a n/a n/a n/a
1995 n/a n/a n/a n/a n/a
1996 n/a n/a n/a n/a n/a
1997 n/a n/a n/a n/a n/a
TRL
37
1998 n/a n/a n/a n/a n/a
1999 450430 58234 289748 9195 32039575
2000 381242 48785 276383 8694 32432634
2001 302081 39239 241260 7638 30723718
2002 263496 35053 224169 7267 31488479 An analysis of the trends in these daily emission estimates is included in Table 27. Here the percentage change in total emissions, by pollutant is derived for each year. In general the emissions of all pollutants show a continuous downward trend. The largest yearly changes consistently occurred between 2000 and 2001. The emissions associated with the LDV component of the fleet are reducing a higher rate than that for the HDV section. Whereas CO, HC and NOX emissions are reducing at a similar rate, it is evident that reductions in PM emissions are lower for both the LDV and HDV components. Estimated HDV emissions at the M4 site between 2001 and 2002, show a consistent increase. This is partially a consequence of the relatively high traffic growth rate at this site, particularly in comparison those at the M25 and M60 sites. The relative changes in the apparent ratios between CO, NOX and PM emissions are also related to the gradual growth in popularity of compression ignition engines within the fleet. Table 27 Yearly percentage changes in emissions at the three motorway sites.
CO HC NOX PM CO2 M4 LDV HDV LDV HDV LDV HDV LDV HDV LDV HDV
5.2 Influence of wind direction on pollution concentrations As discussed earlier, the relative position of the monitoring station with respect to the road alignment and the prevailing wind conditions will heavily influence measured concentrations. At the M4 and M25 sites, the wind field is dominated by south westerly winds, while those recorded at the M60 site tend to be dominated by flows from the south-east, albeit with significant flows from all other sectors. At the M4 site, the monitoring station is to the north of the motorway, at the M25 site the road is to the east, while at the M60 site the road is to the north. Figures 16 to 18 provide annual pollution roses for the M4, M25 and M60 sites, respectively. These should be analysed with reference to the wind roses given in Figure 5.
Figure 16 M4 pollution roses, 2002.
TRL
39
TRL
40
Figure 17 M25 pollution roses, 2002. For primary pollutants, it is expected that the highest concentrations are recorded when the wind is blowing from the direction of the immediate road, towards the monitoring station. At the M4 site, this is indeed the case for CO, NO and NO2. However, for O3 and PM10 there is a considerable contribution from the north and north-east and in the case of PM10, may be associated with the construction activity to the north of the site. At the M25 site primary pollutant concentrations are generally highest when the wind is blowing from the southern and eastern sectors, whereby the emissions from the immediate road are transported towards the monitoring site. However, for O3 (and to a lesser degree for CH4 and NMHC), the highest concentrations are recorded from the west. The ingress of high concentrations of O3 from the south west is not unexpected, as there are a relatively limited number of downwind activities available to scavenge O3. Air transported from the east is likely to have passed over both the London metropolitan area and the M25 itself, which would lead to a scavenging of O3 concentrations. High concentrations of hydrocarbons from the south west are likely to be linked with local sources, including the industrial and residential units on Moor Lane. A significantly more complex situation is evident at the M60 site, with pollution sources from all directions. While this may in part be a consequence of the effect of the shallow cutting on the local wind field, it may also be indicative of multiple pollution sources, in addition to those from the M60 itself. These could be associated with the domestic and industrial sources on the northern and southern edges of the M60, combined with the emissions associated with the local road transport network.
C H4
N M HC
TRL
41
Figure 18 M60 pollution roses, 2002. 5.3 Weekly pollution profiles at the roadside and background sites. Weekly pollution plots for 2002 are including in Section 4.3. These plots clearly show the relationship between pollution concentrations and traffic flows. However, background concentrations also exhibit these temporal trends, with morning and evening peaks in the primary pollutants. Figures 19 to 22 show the average weekly roadside and background concentrations. At the M4 site, Figure 19, the pollution profile of NO at the two sites is similar, albeit with the background site at a lower average concentration. However, the weekend, NO concentrations at the background shows a significant increase on the Saturday, but exhibit very low concentrations on the Sunday. On the Sunday, NO concentrations show a morning peak, but no afternoon peak. This is in contrast to the roadside site which exhibits a high NO peak on Sunday afternoon. In general NO and NO2 concentrations generally peak before those at the background sites. Whereas the peaks of NO2 are fairly similar in the morning and evening at the roadside site, the NO2 peaks at the background site are generally higher in the afternoon. For O3 concentrations, the peaks at the roadside site occur at night time, whereas those at the background site occur around midday. The most likely explanation for this roadside night time O3 peak is a combination of reduced traffic
TRL
42
activity, thereby reduced NO and therefore a reduced scavenging rate of the O3, plus the transport of O3 rich air through the site, driven by the prevailing wind. Finally PM concentrations at the roadside site, show a characteristic response to traffic flows. However, at the background site, this response is not directly evident, with the highest PM peaks occurring in the early evening. This reflects, in part, the transport of contaminated air over the background site during the evening period. This contaminated air largely arises from regional traffic activity over the previous hours.
Figure 19 Average weekly pollution profiles recorded at the M4 roadside and the equivalent Harwell background site, 2002. The weekly plot derived for the M25 site (Figure 20), show the dominance of local traffic to those concentrations at the roadside site. However, although the Teddington site is classified as a background site, and exhibits significantly lower concentrations, the temporal pollution profiles is very similar to the roadside site. This demonstrates that a significant contribution of the Teddington air pollution is associated from traffic activity. In contrast to the M4 site, peak O3 concentrations occur during the mid-day period, coincident with those at the background site.
Figure 20 Average weekly pollution profiles recorded at the M25 roadside and the equivalent Teddington background site, 2002.
0
5
10
15
20
25
30
35
NO
2 (pp
b)
NO2 M25 NO2 Teddington
0
50
100
150
200
NO
(ppb
)
NO M25 NO Teddington
0
510
15
20
2530
35
40
O3 (
ppb)
O3 M25 O3 Teddington
0
12
3
4
56
7
8
SO2 (
ppb)
SO2 M25 SO2 Teddington
020406080
100120140160180
NO
M4
(ppb
)
0
1
2
3
4
5
6
7
NO
bkg
(ppb
)
NO M4 NO Bkg
0
5
10
15
20
25
30
35
NO
2 M4
(ppb
)
0
2
4
6
8
10
12
14
NO
2 bkg
(ppb
)
NO2 M4 NO Bkg
0
5
10
15
20
O3 M
4 (p
pb)
0510152025303540
O3 b
kg (p
pb)
O3 M4 O3 Bkg
05
1015202530354045
PM10
M4
(g/
m3 )
024681012141618
PM10
bkg
(g/
m3 )
PM10 M4 PM10 Bkg
TRL
43
Both of the Cheltenham sites appear to respond to traffic activity, although as expected the roadsides site has considerably higher concentrations of all pollutants, other than O3 and SO2. Ozone concentrations tend to be higher the weekend period, with peaks at both the roadside and background sites occurring at night time and around midday.
Figure 21 Average weekly pollution profiles recorded at the Cheltenham roadside and background sites, 2002. Concentrations at the M60 motorway site and all of the background sites show very similar responses to traffic activity. As with the M4 site, O3 peaks tend to occur at night time, and as with the other roadside sites, peaks are also evident during the middle of the day. These profiles are shown in Figure 22.
01020304050607080
NO
(ppb
)
NO-roadside NO-background0
0.2
0.4
0.6
0.8
1
1.2
1.4
1.6
CO
(ppm
)
0
5
10
15
20
25
30
NO
2 (pp
b)
NO2- roasdside NO2-background
05
10152025303540
O3 (
ppb)
O3-roadside O3-background
0
5
10
15
20
25
30
35
PM10
( g/
m3 )
PM-roadside PM-background
00.5
11.5
22.5
33.5
4
SO2 (
ppb)
SO2-roadside SO2-background
TRL
44
Figure 22 Average weekly pollution profiles recorded at the M60 roadside and background sites, 2002. 5.4 Roadside enhancement The roadside increment may be visualised as the additional pollutant burden arising from the traffic activity, above those pollutant concentrations recorded at a local background location. The determination of this roadside increment can be used to identify relative trends in roadside air quality, associated with the traffic in the immediate vicinity of the monitoring station, through the subtraction of the temporal changes in background air pollution, derived from a variety of more distant sources. For each of the monitoring sites, local background monitoring sites were identified, and compared to those concentrations recorded at the roadside. The selection of these background sites will undoubtedly be sub-optimum, as their locations are determined as part of the national network, and are established in isolation of the HA roadside network. 5.4.1 M4 site The nearest long-term background site to the M4 site, is the Reading urban background site. This is situated at a distance of approximately 15 km to the northwest of the M4 site. However, although the Reading site is described as a background site, it is in close proximity to a road carrying some 35000 vehicles per day. Therefore the M4 site is also compared to those concentrations recorded at the Harwell site, situated approximately 70 km to the west. Although the Harwell site is described as a rural site, it may also be externally influenced by its close proximity to Didcot power station. Figure 23 shows the monthly average concentrations recorded at the three sites. In general, it is evident that the concentrations at the M4 are in excess of those recorded at the other sites, with the obvious exception of O3 and periods of CO at the Reading site. The former is likely to result from the savaging of O3 in the vicinity of the road, and the latter due to local congested traffic in the
0
20
40
60
80
100
120
NO
(ppb
)
NO M60 NO Manchester NO Bolton
0.0
0.1
0.2
0.3
0.4
0.5
0.6
0.7
CO
(ppm
)
CO M60 CO Manchester CO Bolton
0
5
10
15
20
25
30
35
NO
2 (pp
b)
NO2 M60 NO2 Manchester NO2 Bolton
0
5
10
15
20
25
30
35
O3 (
ppb)
O3 M60 O3 Bolton
0
5
10
15
20
25
30
PM10
( ξg/
m3 )
PM10 M60 PM10 Bolton
TRL
45
vicinity of the Reading site. Ozone concentrations at the Harwell site show their characteristic summer time peaks.
00.2
0.40.6
0.81
1.21.4
Jan-
95
Jul-9
5
Jan-
96
Jul-9
6
Jan-
97
Jul-9
7
Jan-
98
Jul-9
8
Jan-
99
Jul-9
9
Jan-
00
Jul-0
0
Jan-
01
Jul-0
1
Jan-
02
Jul-0
2
Date
CO
(ppm
)
M4 Reading
0
50
100
150
200
250
Jan-
95
Jul-9
5
Jan-
96
Jul-9
6
Jan-
97
Jul-9
7
Jan-
98
Jul-9
8
Jan-
99
Jul-9
9
Jan-
00
Jul-0
0
Jan-
01
Jul-0
1
Jan-
02
Jul-0
2
Date
NO
(ppb
)
Reading Harwell M4
0
10
20
30
40
50
Jan-
95
Jul-9
5
Jan-
96
Jul-9
6
Jan-
97
Jul-9
7
Jan-
98
Jul-9
8
Jan-
99
Jul-9
9
Jan-
00
Jul-0
0
Jan-
01
Jul-0
1
Jan-
02
Jul-0
2
Date
NO
2 (p
pb)
M4 Reading Harwell
0
10
20
30
40
50
Jan-
95
Jul-9
5
Jan-
96
Jul-9
6
Jan-
97
Jul-9
7
Jan-
98
Jul-9
8
Jan-
99
Jul-9
9
Jan-
00
Jul-0
0
Jan-
01
Jul-0
1
Jan-
02
Jul-0
2
Date
O3
(ppb
)
M4 Reading Harwell
0
10
20
30
40
50
Jan-
95
Jul-9
5
Jan-
96
Jul-9
6
Jan-
97
Jul-9
7
Jan-
98
Jul-9
8
Jan-
99
Jul-9
9
Jan-
00
Jul-0
0
Jan-
01
Jul-0
1
Jan-
02
Jul-0
2
Date
PM
10 (
g/m
3 ) M4 Reading Harwell
Figure 23 Monthly rolling average pollutant concentrations at the M4, Reading and Harwell over the period 1995 to 2002.
In general primary pollutant concentrations are highest at the motorway site, and lowest at the most remote site. The highest roadside increment is related to NO concentrations, with roadside concentrations between 4 and 41 times higher than the background. Roadside NO concentrations have reduced by approximately 75 % between 1995 and 2002, whilst the background concentrations have remained relatively stable. This observation is reversed in the case of O3, where roadside concentrations are approximately half those at the background. The reduction in NO2 concentrations has been more gradual than those reductions in NO. The NO2 concentrations at the M4 and at the Reading background site are similar, at approximately twice the concentration recorded at Harwell. Particulate matter concentrations are higher at the M4 site, with a roadside increment of approximately two. Prior to 1998, CO at the Reading background site was higher than that recorded at the M4 site. However, CO concentrations at the Reading background site have shown a gradual decline, and this after 2000 the roadside concentrations exceeded those at the Reading site. From 2000, CO at the M4 site has displayed a gradual increase. The trends in the concentrations recorded at the M4 roadside site and the Reading and Harwell background sites are given in Table 28.
TRL
46
Table 28 Trends in concentrations recorded at the M4, Reading urban background and Harwell sites (%/yr).
5.4.2 M25 site The Teddington background site is one of the closest national long-term air pollution monitoring sites to the M25. It has been in operation since August 1996, and is equipped to measure NO, NO2, O3 and SO2. Concentrations of all pollutants, other than O3 are highest the roadside site. However, over the period from 1996 to 2002, concentrations at both sites have reduced, with the exception of O3. The rate of reduction has been higher at the roadside site, with a higher than average reduction between 2001 and 2002, evident in NO, NO2 and NOX. At the roadside site SO2 NO, PM10 and O3 concentrations exhibited an increase between 2001 and 2002. Trends in these concentrations are shown in Figure 24 and Table 29.
TRL
47
050
100150200250300350
Jan-
95
Jul-9
5
Jan-
96
Jul-9
6
Jan-
97
Jul-9
7
Jan-
98
Jul-9
8
Jan-
99
Jul-9
9
Jan-
00
Jul-0
0
Jan-
01
Jul-0
1
Jan-
02
Jul-0
2
Date
NO
(ppb
) M25 Teddington
05
1015202530354045
Jan-
95
Jul-9
5
Jan-
96
Jul-9
6
Jan-
97
Jul-9
7
Jan-
98
Jul-9
8
Jan-
99
Jul-9
9
Jan-
00
Jul-0
0
Jan-
01
Jul-0
1
Jan-
02
Jul-0
2
Date
NO
2 (pp
b)
M25 Teddington
05
10152025303540
Jan-
95
Jul-9
5
Jan-
96
Jul-9
6
Jan-
97
Jul-9
7
Jan-
98
Jul-9
8
Jan-
99
Jul-9
9
Jan-
00
Jul-0
0
Jan-
01
Jul-0
1
Jan-
02
Jul-0
2
Date
O3 (
ppb)
M25 Teddington
0
2
4
6
8
10
12
Mar
-96
Sep
-96
Mar
-97
Sep
-97
Mar
-98
Sep
-98
Mar
-99
Sep
-99
Mar
-00
Sep
-00
Mar
-01
Sep
-01
Mar
-02
Sep
-02
Dare
SO2 (
ppb)
M25 Teddington
Figure 24 Monthly rolling average air pollution concentrations recorded at the Teddington urban background site. Table 29 Trends in concentrations recorded at the M25 and Teddington background sites (%/yr).
5.4.3 Cheltenham site Cheltenham Borough Council operate a background site, approximately 1.5 km to the west of the HA site. It has been in operation for a few months longer than the HA site and is equipped to monitor NO, NO2, O3, PM10 and SO2. Although the average concentrations of all of the pollutants, with the exception of NO2, are higher at the roadside site, the roadside increment is small. This is likely to be a combination of two phenomena. Firstly the background site could be unduly influenced by local emission sources, and secondly the inlet position at the HA site is at a distance of 12 m from the edge of the nearest road, and thus some dilution has already occurred before sampling. The largest roadside increments are for NO and NOX. At the roadside site, elevated NO episodes occurred in January 2001 and January 2002. These are matched by similar secondary NO2 episodes at the background site.
TRL
48
The trends in the background concentrations are shown in Figure 25 and Table 30. Significant increases are recorded in the concentrations of NO, NO2 and PM10. However, these relationships are based upon data recorded over a relatively limited time period, and are thus not as robust as those recorded at the motorway sites.
05
101520253035
Jan-
00
Apr-
00
Jul-0
0
Oct
-00
Jan-
01
Apr-
01
Jul-0
1
Oct
-01
Jan-
02
Apr-
02
Jul-0
2
Oct
-02
Date
PM
10 (
g/m
3 )
Roadside Background
05
10152025303540
Jan-
00
Apr
-00
Jul-0
0
Oct
-00
Jan-
01
Apr
-01
Jul-0
1
Oct
-01
Jan-
02
Apr
-02
Jul-0
2
Oct
-02
Date
O3 (
ppb)
Roadside Background
0
10
20
30
40
50
Jan-0
0
Apr-00
Jul-0
0
Oct-00
Jan-0
1
Apr-01
Jul-0
1
Oct-01
Jan-0
2
Apr-02
Jul-0
2
Oct-02
Date
NO
2 (pp
b)
Roadside Background
010203040506070
Jan-
00
Apr-
00
Jul-0
0
Oct
-00
Jan-
01
Apr-
01
Jul-0
1
Oct
-01
Jan-
02
Apr-
02
Jul-0
2
Oct
-02
Date
NO
(ppb
)
Roadside Background
00.5
11.5
22.5
33.5
4
Jan-
00
Apr-
00
Jul-0
0
Oct
-00
Jan-
01
Apr-
01
Jul-0
1
Oct
-01
Jan-
02
Apr-
02
Jul-0
2
Oct
-02
DateS
O2 (
ppb)
Roadside Background
Figure 25 Monthly rolling average air pollution concentrations at the Cheltenham roadside and background sites. Table 30 Trends in background concentrations, Cheltenham (%/yr).
However, a comparison of data measured during 2001 with those from 2002, indicate that roadside concentrations of all pollutants (with the exception of NO2) reduced, while those concentrations for all pollutants at the background site increased. Therefore the roadside increment has reduced over this period, and during significant periods of time, those concentrations recorded at the background site now exceed those recorded at roadside. 5.4.4 M60 site A number of background sites are in operation within the vicinity of the M60 motorway site. Figure 26 and Table 31 shows the trend from 3 of these sites: Manchester Town Hall (urban background 1), Manchester Piccadilly (urban centre) and the urban background site in Bolton (urban background 2). The concentrations recorded at the M60 site are very similar to those recorded at the other background sites, which may be explained by the relative distance of the sample inlet from the edge of the road. The highest roadside increments are associated with NOX, and in contrast to the other background sites, the concentrations of PM10 are higher at the background site.
TRL
49
The most complete dataset are available for Bolton, and thus these are used to compare with the trends identified at the M60 motorway site. Throughout the monitoring period from 1999 to 2002, roadside pollutant concentrations have reduced. While those concentrations recorded at the Bolton site have also reduced, they are off-set by a general increase in pollution concentrations over the period 2000 to 2001. As noted in previous discussions of the other paired sites in the HA network, a general reduction in O3 concentrations is evident at the roadside and Bolton background sites. However, this reduction is reversed over the period 2001 to 2002, with a significant increase in O3 concentrations, particularly at the M60 roadside site.
Figure 26 Monthly rolling average air pollution concentrations recorded at the Manchester and Bolton urban background sites.
00.20.40.60.8
11.21.4
Jun-
99
Sep
-99
Dec
-99
Mar
-00
Jun-
00
Sep
-00
Dec
-00
Mar
-01
Jun-
01
Sep
-01
Dec
-01
Mar
-02
Jun-
02
Sep
-02
Dec
-02
Date
CO
(ppm
)
Suburban Motorway Urb Background 1Urb Centre Urban Background 2
5.4.5 Roadside increment The contribution of the immediate road and its traffic to local air pollution may be derived through the subtraction of the local background concentration. In practice the measurement of background concentrations are not normally linked or paired with an associated roadside site. The use of modelled background concentrations, such as those derived by Netcen, are limited by poor temporal resolution, with these background concentrations routinely being expressed in terms of annual average concentrations. At each of these sites a paired background site was identified, characterised by the longest duration and most complete coverage of pollutant monitoring. These were:
For the M4, the rural background site at Harwell, For the M25, the suburban background site at Teddington, For the Cheltenham, the local background site, and For the M60 the urban background site in Bolton.
The roadside increment was derived from the monthly average data, through the subtraction of the rolling annual average concentration at the background site from that occurring at the roadside site. A summary of these results, expressed in terms of both the total concentration change and the percentage change between years, is given in Tales 31 to 34. At the M4 site (Table 32) there has been a downward trend in the NO and NOX incremental concentrations, although the rate of reduction has considerably reduced from 2000 onwards. In contrast NO2 and O3 concentrations have increased over the period 1996 to 2000. From 2000, the NO2 incremental concentration has declined. Ozone concentrations have continued to increase, although interrupted by a significant reduction over the period 1999 to 2001.
TRL
51
Table 32 Trends in the annual average increment at the M4 site. NO NO2 NOX O3
2001 - 2002 -4.8 -6.5 -4.3 -23.3 -9.1 -9.8 -2.1 15.5 Table 33 shows the trend in this increment at the M25 site. Trends for 2002 indicate a general increase in the roadside incremental concentrations, with the largest percentage changes occurring in NO2. Table 33 Trends in the annual average increment at the M25 site.
2001 - 2002 6.1 8.9 1.9 36.1 8.0 10.9 -0.3 2.9 1.7 8.6 The yearly change in annual average increment at the Cheltenham site is shown in Table 34. In general the concentrations of NO, NO2 and NOX have increased. In contrast reductions are evident in O3 and SO2. Concentrations of PM10 are relatively stable. However, trend analysis from the Cheltenham site remains uncertain due to the limited monitoring duration. Table 34 Trends in the annual average increment at the Cheltenham site.
Similarly, air pollution monitoring at the M60 site has only been in operation for a relatively short time, having commenced in 1999. Therefore the determination of long term trends is less reliable than for those from the other sites in the HA network. The general trends over the two periods 2000 to 2001 and 2001 to 2002 reverse (Table 35). However, it is evident that the incremental concentration of PM10 has reduced and for O3 has increased over the period 2000 to 2002.
TRL
52
Table 35 Trends in the annual average increment at the M60 site. CO NO NO2 NOX O3 PM10
5.5 Seasonal fluctuations The annual average concentrations presented in Section 4.1, provide little information on seasonal impacts. The time of year can influence the roadside air pollution concentrations in a number of ways. Firstly, variations in sunrise and sunset can impact on the journey to work patterns, and in some circumstances influence the way in which vehicles are driven and thus their emission characteristics. Secondly, weather conditions are normally colder and wetter during the winter period. While inclement weather can modify driving characteristics, cold weather is also associated with an increased incidence of excess emission events associated with cold engines and exhaust catalysts. Finally, due to the increase in the number of sunlight hours and associated intensity during the summer period, photochemical activity is increased, resulting in elevated concentrations of O3, NO2 and PM. Tables 36 to 39 show the average ratio between winter and summer average concentrations for each of the monitoring years. In general average CO, NO and to a lesser extent NO2 and PM10 concentrations are higher during the winter months. At all sites there is a gradual decrease in the winter:summer ratio for CO. At both urban sites, this ratio is generally higher than those for the rural motorways sites. Finally, O3 concentrations are systematically higher during the summer months, by approximately 25 %. Table 36 The winter:summer ratio between seasonal average concentrations, measured at the M4 site. 1995 1996 1997 1998 1999 2000 2001 2002 AverageCO 1.19 1.25 1.44 1.23 0.89 1.02 1.06 1.31 1.17 NO 1.45 1.09 1.02 1.46 0.86 1.24 1.29 0.76 1.15 NO2 1.04 0.79 1.40 1.43 0.88 0.98 0.87 0.69 1.01 O3 0.53 0.72 1.61 0.86 0.92 0.87 0.78 1.11 0.92 CH4 0.99 1.04 0.94 0.87 0.97 0.98 n/a n/a 0.97 NMHC 0.63 1.23 1.38 1.07 0.99 1.54 n/a n/a 1.14 PM10 n/a 1.05 0.98 0.95 0.67 0.91 0.98 0.87 0.91 Table 37 The winter:summer ratio between seasonal average concentrations, measured at the M25 site.
5.6 The ratio of PM10 to PM2.5 The ratio of PM10 to PM2.5 can provide an indication of changes in the source of particulate matter. Whereas PM10 is measured at each of the sites, PM2.5 is only measured at the M25 site. Figure 27 shows the trend on this ratio at the M25, measured using a TEOM. To allow a direct comparison between these two particulate metrics, the PM10 data has not been corrected.
0
0.5
1
1.5
2
2.5
May
-99
Aug
-99
Nov
-99
Feb-
00
May
-00
Aug
-00
Nov
-00
Feb-
01
May
-01
Aug
-01
Nov
-01
Feb-
02
May
-02
Aug
-02
Nov
-02
Date
PM
10:P
M2.
5
Figure 27 The ratio of PM10 and PM2.5 measured at the M25 roadside site. Over the duration of the duplicate monitoring, the PM10 and PM2.5 concentrations are approximately 22 µg/m3 and 14 µg/m3, respectively. Therefore the proportion of the PM10 that is PM2.5 is approximately 57 %. However, there has been a gradual change in the relationship, with a value of 1.47 in 2000, rising to a value of 1.78 in 2002. As this site is very close to the roadside, this increase in the proportion of smaller particles may be related to the overall reduction in PM mass from the newest vehicles. However, it is likely that this change in ratio is driven by a variety of mechanisms. For example, this trend would also be driven by a reduction in coarse fraction, resuspended material from the road surface, which could be related to the capping of the previously exposed landfill areas to the northeast of the monitoring site. 5.7 The identification and influence of air pollution episodes during 2002 For each pollutant, limits may be described both in terms of the exceedence of a maximum concentration, but also by the number of exceedences of a prescribed limit. In the case of NO2, O3 and PM10, limits are expressed in terms of the number of exceedances of a 1-hr concentration limit.
TRL
54
Compliance with UK and EU air quality limits are discussed in Section 4.4. It is evident from Table 20 that these limits were exceeded for the NO2 and O3, only. During 2002, the annual mean NO2 limit was exceeded at the M4 and M60 sites, and the O3 limit (expressed in terms of the number of exceedences of the running 8-hour mean) was exceeded at the Cheltenham and M60 sites. However, standards expressed in terms of the number of exceedences, are highly dependent on the number of episodic pollution events. An indication of the prevalence of pollution episodes during 2002, may be interpreted from the exceedences plot, Figure 10, and the ranges in pollutant data described in Section 4.1. Across the UK, reported exceedances of limit values during 2002 were restricted to NO2 and PM10
15. These exceedences were largely associated with the London conurbation (Stedman et. al. 2003, Fuller and Cue 2003). In order to identify any pollution episodes that occurred during 2002, data were compared against the air pollution banding system. This banding system is based on the potential effects to health of increasing pollutant concentrations. Where air pollution is classified as ‘low’ the effects are unlikely to be noticed, even by sensitive populations. In the ‘moderate’ band, sensitive populations may notice effects from pollutant levels but are unlikely to need to take any specific action. At the ‘high’ or ‘very high’ bands, sensitive populations would be advised to take avoiding action. Episodes which occurred on the HA network during 2002 were identified as concentrations which breached the ‘moderate’ band or higher. Table 40 presents the threshold limits for the ‘moderate’ and ‘high’ bands and details the number of days each was breached. At no sites was the ‘high’ category exceeded. Table 40 Number of days when pollutant concentrations were recorded within the ‘moderate’ or ‘high’ pollution bands.
Band Concentration Cheltenham M4 M25 M60
Moderate 50 to 89 ppb 28 6 8 5 Ozone
(8-hrly running or hrly mean) High 90 to 179 ppb 0 0 0 0
No episodes were recorded for CO or NO2 at any of the sites. In contrast, all four sites experienced concentrations of O3 and PM10 within the ‘moderate’ band, with PM10 concentrations at the M4, M25 and M60 breaching the ‘high’ band on at least one day. To illustrate the nature of these episodes a number of examples are examined in more detail. 5.7.1 General air pollution episodes during 2002. Although traffic is the major contributor to emissions, and therefore air pollution, arguably the most important factor determining pollutant concentrations at the immediate roadside are the meteorological conditions. Day to day conditions such as wind speed and wind direction play a major role in the pollutant levels measured at all the sites. In addition some episodes will have been driven predominantly by localised conditions, generated by emissions and/or meteorological
15 The UK operates a national network of air pollution monitoring stations. Only a subset of these, combined with the results from modelling campaigns, is used to report compliance with air quality limits and objectives to the European Commission, in compliance with EU directives 96/62/EC and 1999/30/EC.
TRL
55
0
20
40
60
80
100
120
140
09-Sep
10-Sep
11-Sep
12-Sep
13-Sep
14-Sep
15-Sep
Date
Con
cent
ratio
n P
M10
(g/
m3 ) hourly mean 24-hr running mean
HIGH
MODERATE
factors in the vicinity of the monitoring site. Other episodes will have been forced by regional and trans-boundary influences. For example, the ‘high’ PM10 episode measured at the M60 site, Figure 28, was caused by events unrelated to the conditions found locally to the site. The peak hourly mean concentration of 124 µg/m3 on 12th September, resulted in a peak 24-hr running mean of 77 µg/m3, just within the ‘high’ band. This episode was also recorded at many other national sites, particularly those in northern England. The highest recorded 24-hour running mean over this period was 85 µg/m3, recorded in Scunthorpe. An analysis of pollution back trajectories during this period, linked this pollution episode with a number of widespread Russian forest and peak bog fires (Kent, 2002a). One unusual aspect of this episode was that there was no accompanying increase in CO or NOx concentrations which would be expected if the particulate matter derived from a combustion source. However, it is likely that during to the ten day period before the air mass reached the UK, the NOx and CO was removed. One possible mechanism for this pollutant removal could have involved the reaction of NOx with O3 creating NO3 and O2, and subsequently N2O5. This reaction chain could then lead to the formation of HNO3, which itself is readily removed by wet or dry deposition. Likewise CO reacts with OH radicals to create CO2 and hydrogen.
Figure 28 Concentration of PM10 measured at the M60 site during September 2002 (corrected PM10). In contrast to this September episode recorded at the M60 site, the highest O3 episode recorded at the M4 site was associated with local conditions. Figure 29 shows that the O3 concentrations at the M4 generally remain below those recorded at Harwell (a rural site) and Reading except for a peak of 69 ppb which occurs in the early hours of 29th April. The M4 regularly records O3 peaks during the night time, when traffic flows are lowest. This is an unusual pattern as sunlight is a requirement for the formation of O3 and as such O3 formation is reduced during the night. It is possible that the M4 site is measuring concentrations of O3 that have been formed during the day in other locations and which are being transported over the site before chemical reactions act to fully deplete the O3. The wind during this peak in O3 concentration was blowing from approximately the south west which is an area with few major roads and no large settlements. It is therefore possible that high O3 concentrations would have remained elevated during the day. If O3 concentrations are sufficiently high at night, there is a rapid conversion of NO to NO2 leading to a depletion of O3. Figure 30 shows an increase in NO2, as O3 concentrations fall. This resulted in a Monday morning peak of NO2 on 29th April commencing at 06:00 rather than at the more usual 09:00 associated with traffic activity during 2002. Finally a third episode is presented in Figure 31. On 5th April a peak hourly PM10 concentration of 162 µg/m3 was recorded at the M25 site. This lead to the 24-hr running mean concentration reaching a peak of 91 µg/m3, thus exceeding the ‘high’ banding threshold on two consecutive days. A second peak on 10th April of 115 µg/m3 resulted in the ‘moderate’ band being breached over three consecutive days.
TRL
56
0
10
20
30
40
50
60
70
26-Apr 27-Apr 28-Apr 29-Apr 30-AprDate
Con
cent
ratio
n O
3 (p
pb)
M4 Reading HarwellMODERATE
Figure 29 Concentrations of O3 measured at M4 and two comparison sites during April 2002.
0
10
20
30
40
50
60
70
80
26-Apr 27-Apr 28-Apr 29-Apr 30-AprDate
Con
cent
ratio
n (p
pb)
O3 NO2
Figure 30 Concentrations of O3 and NO2 at the M4, during April 2003.
TRL
57
0
20
40
60
80
100
120
140
160
01-Apr
02-Apr
03-Apr
04-Apr
05-Apr
06-Apr
07-Apr
08-Apr
09-Apr
10-Apr
11-Apr
12-Apr
13-Apr
14-Apr
Date
Con
cent
ratio
n P
M10
(g/
m3 )
Hourly mean 24-hr running mean
MODERATE
HIGH
VERY
Figure 31 PM10 concentrations at the M25 during an episode in April 2002. Arrows indicate wind direction blowing across the motorway towards the site.
The influence of wind direction can be seen in Figure 32. The PM10 concentrations are already elevated above background levels during the first few days of April when the wind was blowing across the motorway towards the monitoring site. However, a change of wind direction to a westerly wind on 3rd April resulted in a reduction in PM10 concentrations. At around midday on the 4th April, the wind direction reverted back to a south westerly driving PM10 concentrations to immediately increase. Particulate concentrations remained high until the wind direction changed again to a northerly wind. A similar pattern is evident with the episode which occurred on 10th April. The wind direction itself does not generate the peak pollutant concentrations and many other factors are involved. However the data demonstrates the strong role which meteorology plays in the occurrence of episodes.
0
20
40
60
80
100
120
140
160
01-Apr
02-Apr
03-Apr
04-Apr
05-Apr
06-Apr
07-Apr
08-Apr
09-Apr
10-Apr
11-Apr
12-Apr
13-Apr
14-Apr
Date
Con
cent
ratio
n P
M10
(g/
m3 )
0
45
90
135
180
225
270
315
360
Win
d di
rect
ion
(deg
rees
from
N)
Hourly mean 24-hr running mean Wind direction
Figure 32 PM10 concentrations and wind direction at the M25 during an episode in April 2002. Arrows indicate wind direction blowing across the motorway towards the site.
Several other episodes have been reported from the UK national networks. Notably, between July 26th and August 7th high O3 concentrations occurred across the country with the highest
TRL
58
M25
0
20
40
60
80
100
120
1 2 3 4 5 6 7 8 9 10 11
Date (November)
Con
cent
ratio
n (
g/m
3 )
PM10 Corrected PM10 PM2.5 24-hr mean (corrected PM10)
M60
020406080
100120140160180200
1 2 3 4 5 6 7 8 9 10 11
Date (November)
Con
cent
ratio
n (
g/m
3 )
PM10 Corrected PM10 24-hr mean (corrected PM10)
M4
0102030405060708090
1 2 3 4 5 6 7 8 9 10 11
Date (November)
Con
cent
ratio
n (
g/m
3 )
PM10 Corrected PM10 24-hr mean (Correct PM10)
Cheltenham
0
20
40
60
80
100
120
140
160
1 2 3 4 5 6 7 8 9 10 11
Date (November)
Con
cent
ratio
n (
g/m
3 )
PM10 Corrected PM10 24-hr mean (corrected PM10)
concentrations recorded in the South and the Midlands on 28th and 29th July (Kent, 2002b). This episode was driven by stable conditions, high pressure and weak winds associated with an air mass reaching the south east of the UK from mainland Europe bringing O3 precursors. Although all the HA network sites recorded O3 peaks on 28th and 29th July, only the M25 site experienced elevated concentrations which resulted in a breach of the ‘moderate’ band on 28th July. A similar episode occurred during the period 14th to 18th August (Kent, 2002c). High O3 concentrations were recorded over South East England, the East Midlands and the North East but were particularly high over East Anglia. Again this episode was driven by meteorological conditions and air masses reaching the UK from mainland Europe. The M60, M25 and Cheltenham all experienced episodes during this period. At the M25 site concentrations peaked at 55 ppb on 15th August; at the M60 site elevated levels were recorded on the 17th August with a peak concentration of 60 ppb; and at Cheltenham site, peaks of 62 ppb occurred on both of these days. 5.7.2 The impact of bonfire night In the specific case of PM10, the UK standard is set to accommodate the normal UK pollution profile, which is characterised by a high PM emission event associated with the celebration of bonfire night. As 5th of November occurred on a Tuesday in 2002, public celebrations were held over the weekends both before and after the 5th of November. In contrast with previous years, concentrations across the UK were relatively low throughout the period, which was almost certainly attributable to meteorology. The weather over this period was characterised as unsettled with moderate to strong westerly winds, providing relatively clean air from the Atlantic, and relatively good dispersion conditions. Most of this weekly period was characterised by heavy precipitation, which may also have reduced ambient PM concentrations (Kent, 2002d). At the relatively remote motorway sites, it may be expected that the impact of bonfire night would be less marked than at those locations included within the Defra AURN network. However, as indicated by Figure 33, it is evident there were a number of hourly exceedences of 50 µg/m3, at all of the roadside sites.
Figure 33 The impact of bonfire night celebrations on particulate concentrations. At the M4 site, high PM10 concentrations are evident around the 4th and 5th, combined with a higher short-term peak on the following Saturday evening of 81 µg/m3. At the neighbouring M25 site, a similar profile was recorded, again with a high Saturday evening pollution peak of 106 µg/m3.
TRL
59
During the period Sunday 1st to Sunday 10th of November, the ratio of PM10 to PM2.5 averaged at about 55 %. However, during the high pollution peaks, this ratio increased to over 75 %. This change in ratio indicates a change in pollution source from that routinely measured. At the Cheltenham site a peak was observed on the 4th of 142 µg/m3, but no corresponding peaks on either the 5th or over either of the weekend periods. Finally at the M60 site, an hourly peak was observed on the 5th of 182 µg/m3. This high hourly peak was sufficient to result in an exceedance of the 24-hr limit value. As indicated in Figure 10, this exceedence of the 24-hr limit only occurred at the M60 site.
TRL
60
6 SUMMARY & CONCLUSIONS 6.1 The 2002 air pollution environment This report provides a summary of the air pollution conditions measured during 2002, and provides an analysis of these data with respect to the long term pollution trends. During 2002, the HA network consisted of three motorway sites (M4, M25 and the M60), combined with an urban site on the A40 (Cheltenham). Annex A2 provides a statistical summary of these hourly data, and highlights overall data capture. At the M4 site pollutant data capture during 2002 was all above 90 %, with traffic data provision running at 75 %. At the M25 site, pollutant data capture in 2002 was largely in excess of 95 %. However, due to failures in the TEOMs, particulate matter data capture was limited to 80 %. At the Cheltenham site pollutant measurements during 2002 achieved a capture rate in excess of 95 %, but again with a reduced TEOM data capture rate of 85 %. Finally, at the M60 site pollutant data capture during 2002 was in excess of 97 %. However, the corresponding traffic data only achieved a 70 % data capture. In general all data capture was in excess of 75 % and is thus considered sufficient for trend and compliance analysis. Table 41 provides a summary of the percentage change in emission and pollution concentrations at each of the 4 sites, measured between the average conditions during 2001 and those within 2002. In general transport emissions have reduced at all sites, except for NOX and PM10 at the M4 site. The M4 site has the highest increase in traffic flows, and this increase, particularly in the number of compression ignition engines has off-set the overall reduction in emissions. Table 41 Changes in emissions and pollutant concentrations between 2001 and 2002, at each of the HA roadside sites.
Over the period 1992 to 2002, an analysis of annual average concentrations indicates that CO concentrations have slightly increased at the M4, M25 and Cheltenham sites, but have reduced at the M60 site. Reductions in NO2 and NOX are evident at the M4 and M25 sites, but have increased at the Cheltenham and M60 sites. Measured PM10 concentrations have increased by approximately 17 % at the M4 and M60 sites, but reduced by approximately 3 % at the M25 and Cheltenham sites. This variation in pollutant concentration at these four sites, can be explained through variations not just in traffic flows, but also with respect to meteorology. In an attempt to remove the impact of meteorology from these measured concentrations, a local background air pollution monitoring station has been identified, and its data used to derive the roadside increment or pollution enhancement. As both the roadside and background sites would be largely affected by the same meteorology, this process extracts the local impact of meteorology. The extraction of this background data generally results in larger reductions in pollution concentrations, highlighting the masking effects of the background contribution and meteorology to roadside air pollution. In contrast to earlier years, 2002 was marked by relatively few air pollution episodes. Notable secondary O3 episodes occurred during July and August. However an unusual PM10 episode occurred during September, which has been subsequently attributed to the long range transport of particulate matter associated with a series of forest fires on the Russian continent. An analysis of summary statistics, confirms that concentrations of CO and SO2 are well within the proposed Air Quality Strategy standards. However, the proposed standards are exceeded for NO2 and O3. For NO2, no exceedences are recorded against the proposed 1-hr mean standard, but the M4 and the M60 sites marginally exceed the annual mean standard. Whereas the reported annual mean NO2 at Cheltenham is well within the standard at 18.5 ppb, the M25 marginally exceeds this standard, with an annual mean of 21.8 ppb. 6.2 Recommendations A number of recommendations arise from the operation of the monitoring network and the analysis of the associated data. These recommendations are made on the basis of the development of other UK air pollution monitoring activities, and the likely requirements for future air pollution data to support HA environmental policy and the development of appropriate assessment and mitigation procedures. Network structure:
The HA network is biased to sites in the south east of the UK, and may not adequately encompass those areas with different background concentrations, or vehicle fleets. Consideration should be given to extending the network to include an additional roadside site in the north-east. Ideally this site should be associated with a strategic route for heavy-duty vehicles.
It is recommended that the evaluation of trends in air pollution data requires a minimum of 5 years of continuous data. Trends derived for the Cheltenham and M60 sites remain least certain.
Although the A40 at Cheltenham remains part of the HA trunk road network, its location on the Westall Green roundabout is complex, not just through the merging of several roads, but by the presence of the retail petrol station. Therefore the interpretation of data associated with this site is similarly complex. Consideration should be given to the appropriateness of this site, and the relative advantages in its relocation. In the event that this site is removed from the HA network, it is important that monitoring is terminated appropriately to allow full calendar year data reporting.
At the M4 and M25 sites, the gaseous sample inlet is positioned approximately 0.5 m from the edge of the hard shoulder of the motorway. In contrast, the M60 inlet is at a distance of 18 m from the hard shoulder. It is therefore recommended that an ancillary site is established at the M60 site to provide the continuous measurement of NO and NO2 at the edge of the hard shoulder. These data will assist in the interpretation of the air pollution measurements made at the existing static site.
TRL
62
The application of air pollution monitoring in roads tunnels has indicated that these environments can provide useful locations for both air pollution trend analysis, but also as a validation tool for road transport emission factors. Consideration should be given to the establishment of a long term tunnel air pollution monitoring network.
Implementation of the first EU daughter directive in the UK, encompassing PM10, has highlighted the importance of roadside monitoring, and thus the expansion of the UK roadside air pollution monitoring network. The HA network provides a significant contribution to this situation.
Pollutants:
The UK is subject to the adoption and compliance with EU air quality daughter directives. The fourth daughter directive is seeking to set limit values for a range of compounds including arsenic, cadmium, nickel and PAH. Consideration should be given to evaluate the contribution of the high speed road network to these compounds.
Consideration should be given to the measurement of pollutants associated with the newest vehicle technologies and fuels, including catalyst associated precious metals, and other oxidation and reduction products including ammonia, nitrous oxide and dioxins.
There is an increasing body of work, which indicates that there is no safe threshold for particulate matter. The EU, through its Clean Air for Europe (CAFÉ) Programme, is scheduled to review various pollutant objectives, including the latest evidence on PM10 and PM2.5. It is therefore recommended that monitoring of PM2.5 should be extended across the HA monitoring network. Consideration should also be given to the measurement of particle numbers and size.
The use of the heated TEOM to measure PM10 is widely used within the UK. Compliance of this measurement technique to the non-heated reference method requires the use of a correction factor. This correction factor has been developed as an average dominated by urban background sites. The use of this factor at roadside locations remains uncertain, particularly as the local sources of volatile components in the vicinity of a road is relatively high, and subject to rapidly fluctuations. In addition, no correction factor currently exists for PM2.5. An investigation of this correction factor at high-speed roadside locations is recommended.
It is also recommended that an investigation is undertaken to confirm the appropriateness of techniques to limit volatile component loss from TEOMs. A principal disadvantage of the TEOM is the requirement to hold the inlet and filter at an elevated temperature. This has led to reported differences in concentrations of particulate matter between the TEOM and the European reference, largely attributed to the loss of volatile species such as ammonium nitrate. Two innovations are now available to address this issue; the Sequential Equilibration System (SES) and the Filter Dynamics Measurement System (FDMS). The SES incorporates a Nafion dryer, which reduces the relative humidity of the sample stream. This allows the instrument to operate at the lower temperature of 30°C, thereby reducing the loss of volatile components. The FDMS independently measures the volatile component of the incoming air sample. The incoming air stream passes through a size selective inlet and a SES dryer before it is alternately switched every 6 minutes between the TEOM microbalance sensor unit and a purge filter system held at 4°C. The purge filter effectively removes aerosols from the sample stream, before it passes to the sensor unit. The system then adjusts the final mass concentration by reference to any mass change that occurred during the purge cycle (AQEG, 2004).
It is also evident that the composition of particulate matter and its source apportionment remains unclear. At a roadside location limited information is available on the impact of exhaust particulate filters, changes in fuels and the significance of non-exhaust particulates generated from the abrasion of tyres, brakes, road surfaces and street furniture. Furthermore the role and significance of resuspension remains unclear. These issues require investigation to ensure that the role of transport is appropriately assessed.
The motorway air pollution monitoring network is housed in secure roadside enclosures. These enclosures have sufficient room for the installation of additional equipment to
TRL
63
measure other environmental impacts. It is therefore recommended to extend this network to incorporate the measurement of the long-term trend in roadside noise.
Additional input requirements:
Although the number of roadside monitoring sites has increased, these are often limited by the omission of co-located O3, traffic and meteorological measurements. It is recommended that continuous traffic and meteorological monitoring is undertaken at the Cheltenham site.
In order to allow an analysis of the changes and trends in roadside air quality, additional data sources are required. Firstly, comprehensive traffic measurements should be undertaken to include continuous measurements of vehicle composition and speed, by direction and lane. Secondly, local meteorological conditions (wind speed, wind direction and rainfall) should be monitored. Thirdly continuous hourly estimates (measured or modelled) of background concentrations are required. The latter may be achieved through the identification of a suitable background air pollution monitoring site. It is recommended that all UK monitoring sites are paired, to allow the determination of pollution increments.
An improved understanding of vehicle behaviour and its consequence with respect to instantaneous vehicle emissions would assist in the analysis of short term changes in roadside air pollution. Additional research in this area would assist in the assessment of traffic management and operational regimes on the high speed road network.
Additional data analysis:
In addition to the further analysis of the roadside increment, it is recommended to investigate the temporal changes in short period averages (1 to 15 mins), to assist in the link between air pollution and exposure.
The impact of rainfall on roadside concentrations and dispersion is unknown. The impact of roadside vegetation planting regimes on dispersion is unknown. This is
particularly significant as the M25 and M4 sites are essentially flat and open, whereas the M60 site is within an area of roadside planting.
The height of the air pollution inlet, at 1.5 m, is approximately 1 m lower than that adopted within the Defra national network. It is unclear what impact this variation could have on roadside measurements.
TRL
64
7 REFERENCES AQEG (2003). The first report of the Air Quality Expert Group. Nitrogen dioxide in the UK. Defra, London. AQEG (2004). The second report of the Air Quality Expert Group. Particulate matter in the UK. Defra, London. APEG (1999). Source apportionment of airborne particulate matter in the United Kingdom. Airborne particles expert group. Department of the Environment, Transport and the Regions. London. Barlow (2001). Exhaust emission factors 2001: Database and emission factors. TRL report PR/SE/230/00. Transport Research Laboratory, Crowthorne. Defra (2003). Department of the Environment, Food and Rural Affairs in partnership with the Scottish Executive, The National Assembly for Wales and the Department of the Environment in Northern Ireland. Part IV of the Environment Act 1995. Local air quality management. Technical guidance. LAQM.TG(03). Publication PB7514. Defra, London. DfT (2002). Transport statistics. Transport statistics GB: 2002 edition. October 2002. The Stationery Office, London. DfT (2003a). Road traffic statistics Great Britain, 2003. 29th edition. October 2003. The Stationery Office, London. DfT (2003b). Transport trends 2002. A National Statistics publication produced by Transport Statistics, Department of Transport. The Stationery Office, London. DfT (2003c). Vehicle speeds in Great Britain 2002. Transport Statistics Bulletin. A National Statistics publication produced by Transport Statistics, Department of Transport. The Stationery Office, London. Dore C J, Goodwin J W L, Watterson J D, Murrels T P, Passant N R, Hobson M M, Haigh K E, Baggot S L, Thistethwaite G, Pye S T, Coleman P J and King K R (2003). UK emissions of air pollutants 1970 – 2001. National Atmospheric Emission Inventory revision. Report AEAT/ENV/R/1593, Netcen, Culham. Dore C J (2004). Personal communication and supply of 2002 NAEI estimates. Environment Canada (2003). 2001 national summary of ambient PM2.5 and ozone. Report prepared for the Joint Action Implementation Co-ordinating Committee. Environment Canada. Fuller G and Cue A (2003). Air quality in London 2002. The tenth report of the London air quality network. Environmental Research Group, Kings College, London. Haigh N (Ed) (2003). Manual of environmental policy: The EU and Britain. Institute for European Environmental Policy. Release 24. Maney, Leeds. Hickman A J (1999) (editor). Methodology for calculating transport emissions and energy consumption. Final report of the EU MEET project. Transport Research, 4th framework programme DGVII. Research for sustainable mobility. European Commission. Luxembourg. Highways Agency, Scottish Executive Development Department, National Assembly for Wales and the Department for Regional Development Government Department in Northern Ireland (2003). Design Manual for Roads and Bridges. Volume 11, environmental assessment. Part 3, Air quality. HMSO, London.
TRL
65
Kent A (2002a). Air Pollution Forecasting Ad-hoc report: PM10 episode (September 2002). Netcen, November 2002. http://www.airquality.co.uk/archive/reports/cat12/Ad-hoc_PM10_report_Sept2002.pdf Kent A (2002b). Air Pollution Forecasting: Ozone episode report (July/August 2002). Netcen, August 2002. http://www.airquality.co.uk/archive/reports/cat12/o3_episode_report_jul_aug_2002.pdf Kent A (2002c). Air Pollution Forecasting: Ozone episode report (August 2002). Netcen, September 2002. http://www.airquality.co.uk/archive/reports/cat12/o3_episode_report.pdf Kent A (2002d). Air pollution forecasting ad-hoc report: Bonfire night, 2002. Netcen, Culham. McCrae I S, Hickman A J and Price S (2002). The role of vehicle emission legislation and trends in roadside air quality. Transport and air pollution symposium. Graz, 19-21 June 2002. TRL Paper PA386/02. TRL, Crowthorne. McCrae I S and Green J M (2004). The Highways Agency roadside air pollution monitoring network: 1992 to 2001. TRL report PR SE/742/03. TRL, Crowthorne. Murrells (2002). Private communication with Mr A J Hickman at TRL. OJEC (1996). Directive on ambient air quality assessment and management. Directive 96/62/EC. Official Journal of the European Communities, L296/55, 21/11/96. OJEC (1998). Directive relating to the quality of petrol and diesel fuels and amending Council Directive 93/12/EEC. Official Journal of The European Communities, L350, 28.12.98. OJEC (1999). Directive relating to limit values for sulphur dioxide, nitrogen dioxide and oxides of nitrogen, particulate matter and lead in ambient air. Directive 1999/30/EC. Official Journal of the European Communities, L163/41, 26/6/1999. OJEC (2000). Directive relating to limit values for benzene and carbon monoxide in ambient air. Directive 2000/69/EC. Official Journal of the European Communities, L313/12, 13/12/2000. OJEC (2002). Directive relating to ozone in ambient air. Directive 2002/3/EC. Official Journal of the European Communities, L67/14, 9/3/2002. OJEC (2003). Proposal for a directive relating to arsenic, cadmium, mercury, nickel and polycyclic aromatic hydrocarbons in ambient air. Proposal COM(2003) 423 Final. Patashnick H and Rupprecht E G (1991). Continuous PM10 measurement using the tapered element oscillating microbalance. Journal of Air and Waste Management Association. Volume 41, pp 1079 – 1083. Stedman J R, Bush T J, Vincent K J and Baggott S (2003). UK air quality modelling for annual reporting 2002 on ambient air quality assessment under Council Directives 96/62/EC and 1999/30/EC. Report AEAT/ENV/R/1564, Netcen, Culham. Telling S (2003). Automatic urban and rural network: site operator’s manual. Report AEAT/ENV/R1595, Netcen, Culham.
TRL
66
8 ACKNOWLEDGMENTS The authors would like to acknowledge the important contribution of several TRL staff members who have participated in this research programme. They include Dr Paul Boulter for the estimation of vehicle emissions, and the various air pollution team members who have participated in the provision of equipment maintenance and support services during 2002, including Mike Ainge, Nigel Godfrey and Matt Sylvester. Finally, for Philip Jones of AQ Data Service’s for his assistance in the use of Enview2000 and the production of wind and pollution roses.