46
Factor LLC ● Colorado Springs, CO 80903 www.PeterLBrandt.com 1 The History of Gold Charts Gold – The Ultimate Charting Market Revised February 2016
Factor LLC ● Colorado Springs, CO 80903
www.PeterLBrandt.com 1
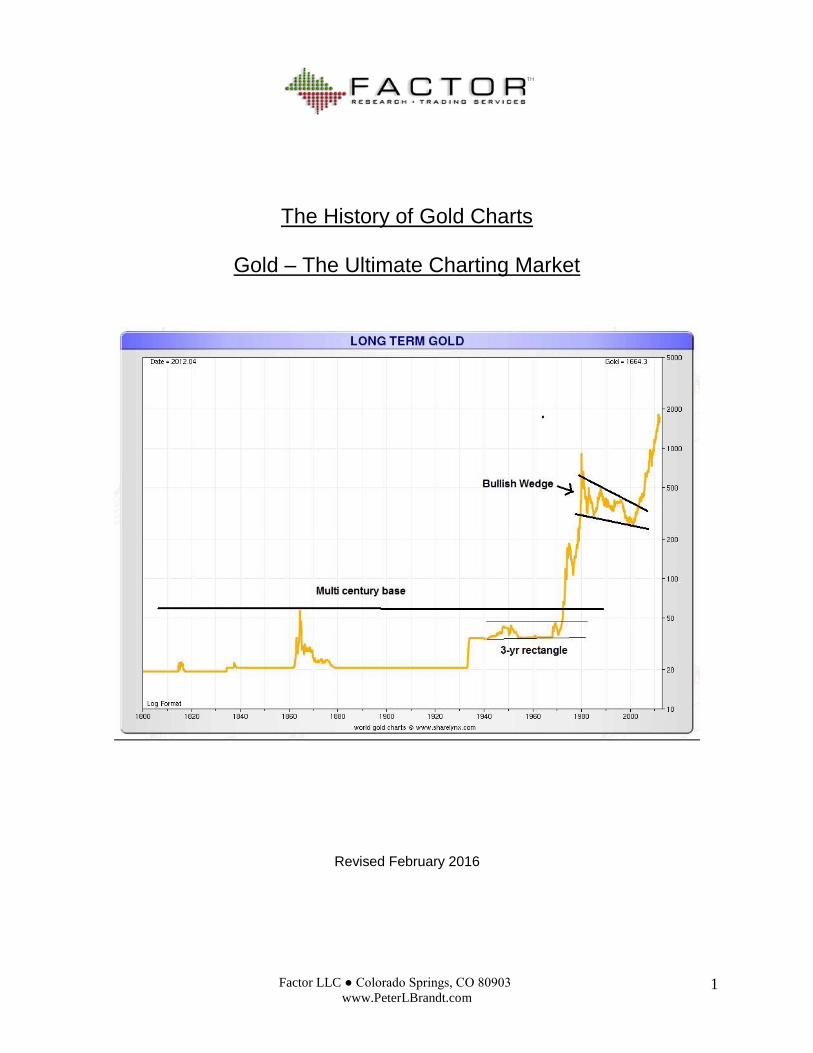
The History of Gold Charts
Gold – The Ultimate Charting Market
Revised February 2016
Factor LLC ● Colorado Springs, CO 80903
www.PeterLBrandt.com 2
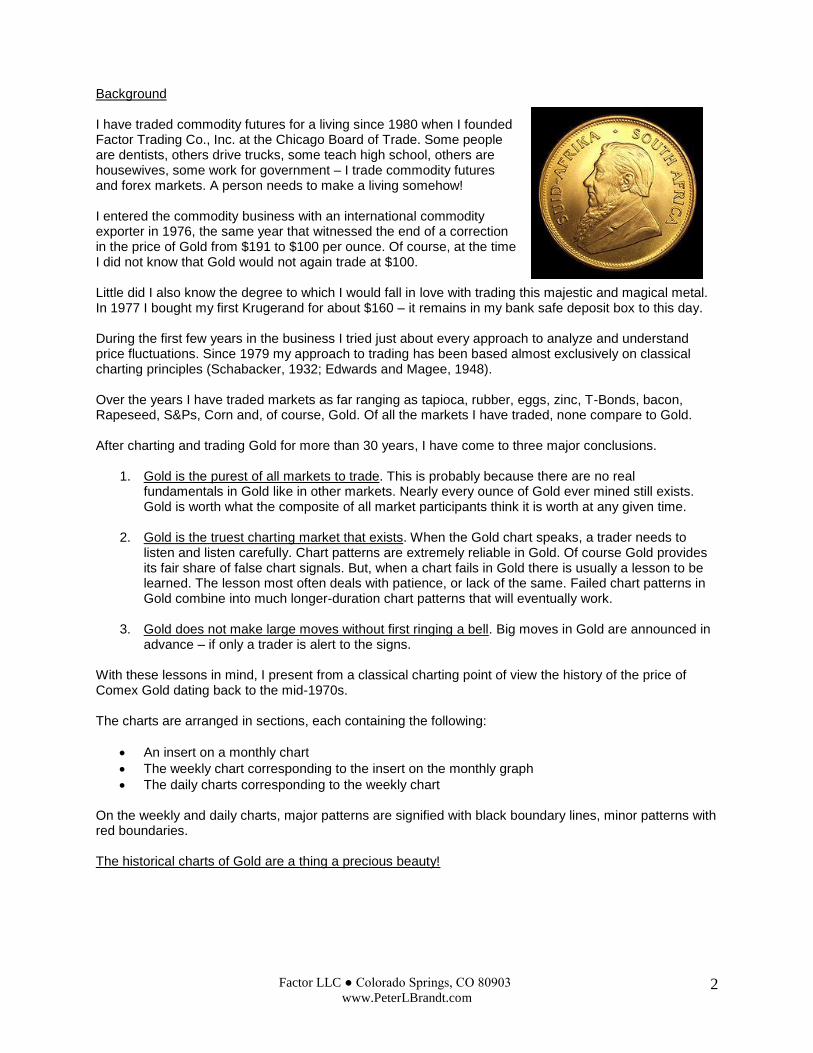
Background I have traded commodity futures for a living since 1980 when I founded Factor Trading Co., Inc. at the Chicago Board of Trade. Some people are dentists, others drive trucks, some teach high school, others are housewives, some work for government – I trade commodity futures and forex markets. A person needs to make a living somehow! I entered the commodity business with an international commodity exporter in 1976, the same year that witnessed the end of a correction in the price of Gold from $191 to $100 per ounce. Of course, at the time I did not know that Gold would not again trade at $100. Little did I also know the degree to which I would fall in love with trading this majestic and magical metal. In 1977 I bought my first Krugerand for about $160 – it remains in my bank safe deposit box to this day. During the first few years in the business I tried just about every approach to analyze and understand price fluctuations. Since 1979 my approach to trading has been based almost exclusively on classical charting principles (Schabacker, 1932; Edwards and Magee, 1948). Over the years I have traded markets as far ranging as tapioca, rubber, eggs, zinc, T-Bonds, bacon, Rapeseed, S&Ps, Corn and, of course, Gold. Of all the markets I have traded, none compare to Gold. After charting and trading Gold for more than 30 years, I have come to three major conclusions.
1. Gold is the purest of all markets to trade. This is probably because there are no real fundamentals in Gold like in other markets. Nearly every ounce of Gold ever mined still exists. Gold is worth what the composite of all market participants think it is worth at any given time.
2. Gold is the truest charting market that exists. When the Gold chart speaks, a trader needs to
listen and listen carefully. Chart patterns are extremely reliable in Gold. Of course Gold provides its fair share of false chart signals. But, when a chart fails in Gold there is usually a lesson to be learned. The lesson most often deals with patience, or lack of the same. Failed chart patterns in Gold combine into much longer-duration chart patterns that will eventually work.
3. Gold does not make large moves without first ringing a bell. Big moves in Gold are announced in
advance – if only a trader is alert to the signs.
With these lessons in mind, I present from a classical charting point of view the history of the price of Comex Gold dating back to the mid-1970s. The charts are arranged in sections, each containing the following:
An insert on a monthly chart
The weekly chart corresponding to the insert on the monthly graph
The daily charts corresponding to the weekly chart On the weekly and daily charts, major patterns are signified with black boundary lines, minor patterns with red boundaries. The historical charts of Gold are a thing a precious beauty!
Factor LLC ● Colorado Springs, CO 80903
www.PeterLBrandt.com 3
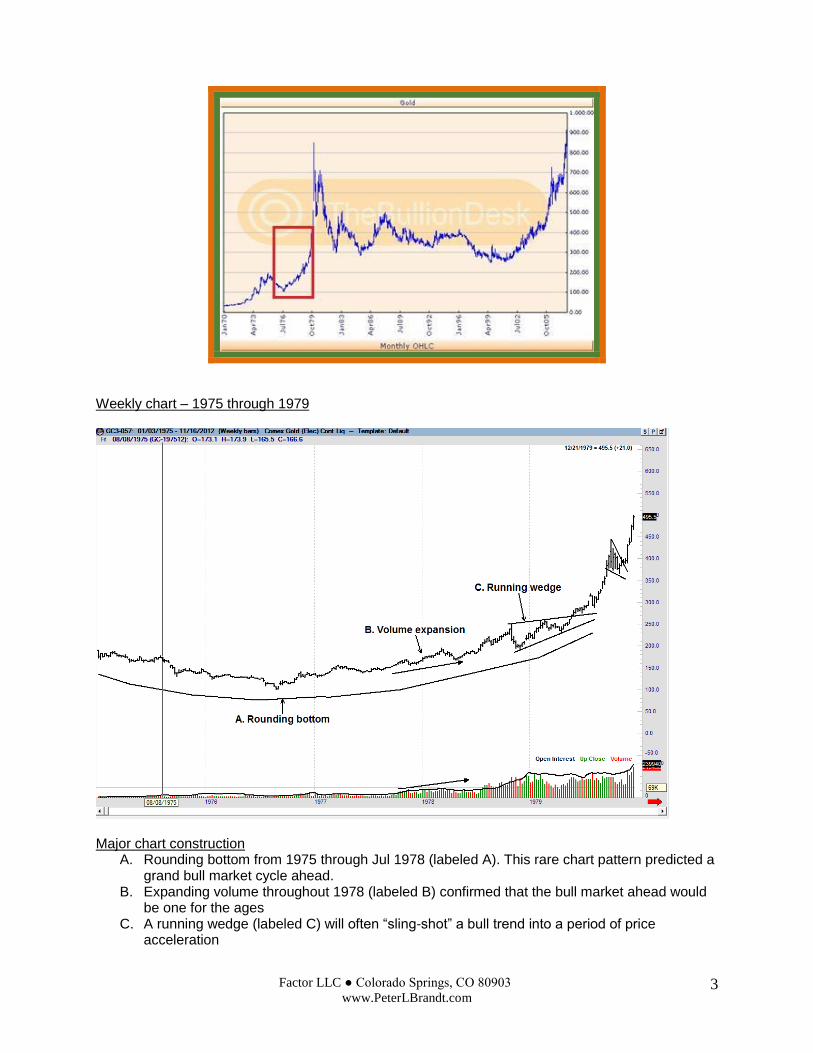
Weekly chart – 1975 through 1979
Major chart construction
A. Rounding bottom from 1975 through Jul 1978 (labeled A). This rare chart pattern predicted a grand bull market cycle ahead.
B. Expanding volume throughout 1978 (labeled B) confirmed that the bull market ahead would be one for the ages
C. A running wedge (labeled C) will often “sling-shot” a bull trend into a period of price acceleration
Factor LLC ● Colorado Springs, CO 80903
www.PeterLBrandt.com 4
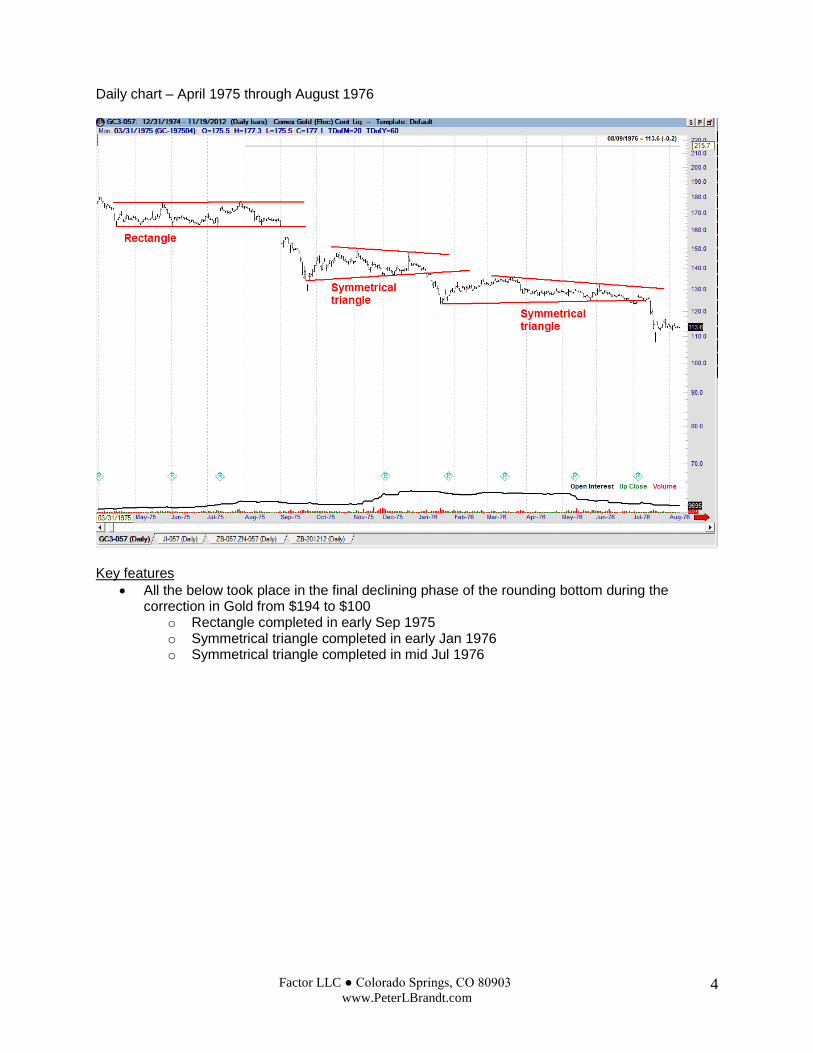
Daily chart – April 1975 through August 1976
Key features
All the below took place in the final declining phase of the rounding bottom during the correction in Gold from $194 to $100
o Rectangle completed in early Sep 1975 o Symmetrical triangle completed in early Jan 1976 o Symmetrical triangle completed in mid Jul 1976
Factor LLC ● Colorado Springs, CO 80903
www.PeterLBrandt.com 5
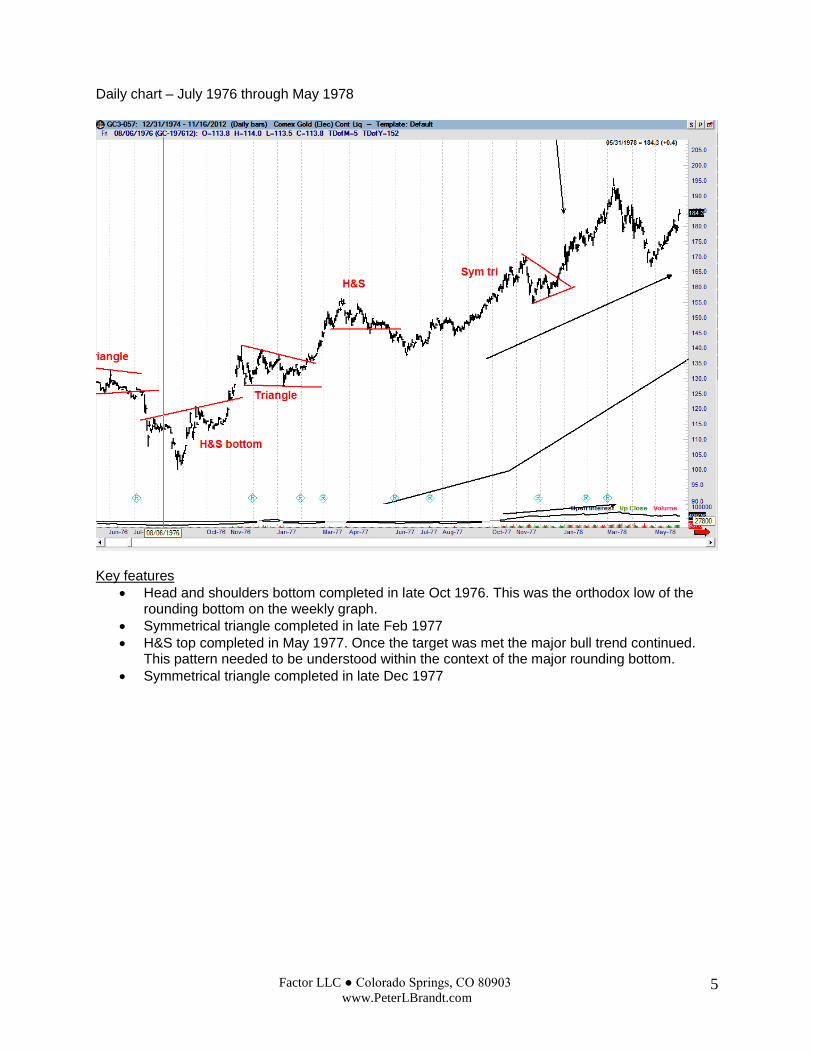
Daily chart – July 1976 through May 1978
Key features
Head and shoulders bottom completed in late Oct 1976. This was the orthodox low of the rounding bottom on the weekly graph.
Symmetrical triangle completed in late Feb 1977
H&S top completed in May 1977. Once the target was met the major bull trend continued. This pattern needed to be understood within the context of the major rounding bottom.
Symmetrical triangle completed in late Dec 1977
Factor LLC ● Colorado Springs, CO 80903
www.PeterLBrandt.com 6
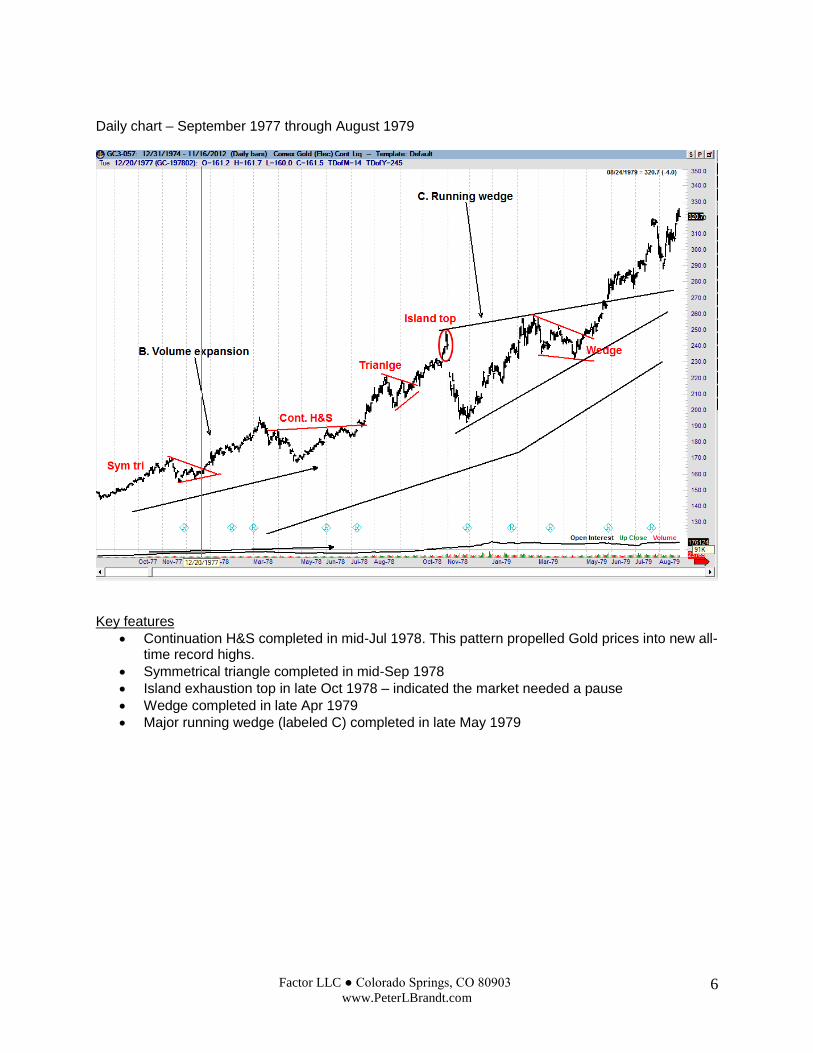
Daily chart – September 1977 through August 1979
Key features
Continuation H&S completed in mid-Jul 1978. This pattern propelled Gold prices into new all-time record highs.
Symmetrical triangle completed in mid-Sep 1978
Island exhaustion top in late Oct 1978 – indicated the market needed a pause
Wedge completed in late Apr 1979
Major running wedge (labeled C) completed in late May 1979
Factor LLC ● Colorado Springs, CO 80903
www.PeterLBrandt.com 7
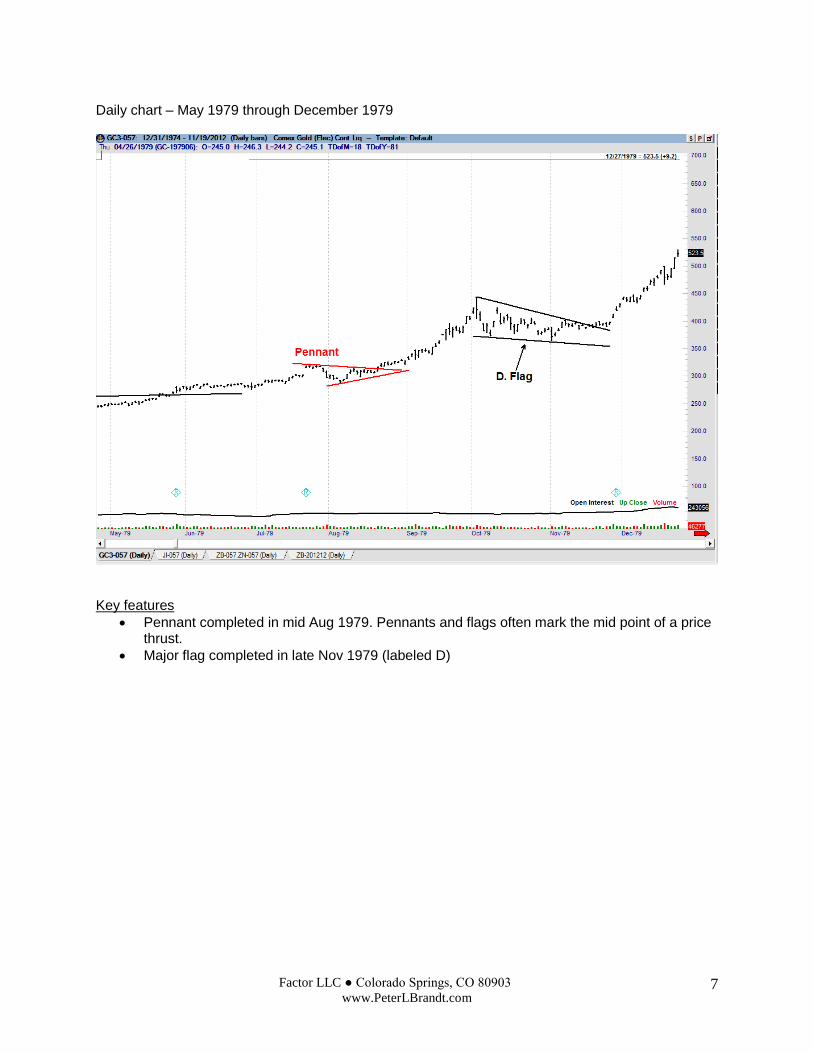
Daily chart – May 1979 through December 1979
Key features
Pennant completed in mid Aug 1979. Pennants and flags often mark the mid point of a price thrust.
Major flag completed in late Nov 1979 (labeled D)
Factor LLC ● Colorado Springs, CO 80903
www.PeterLBrandt.com 8
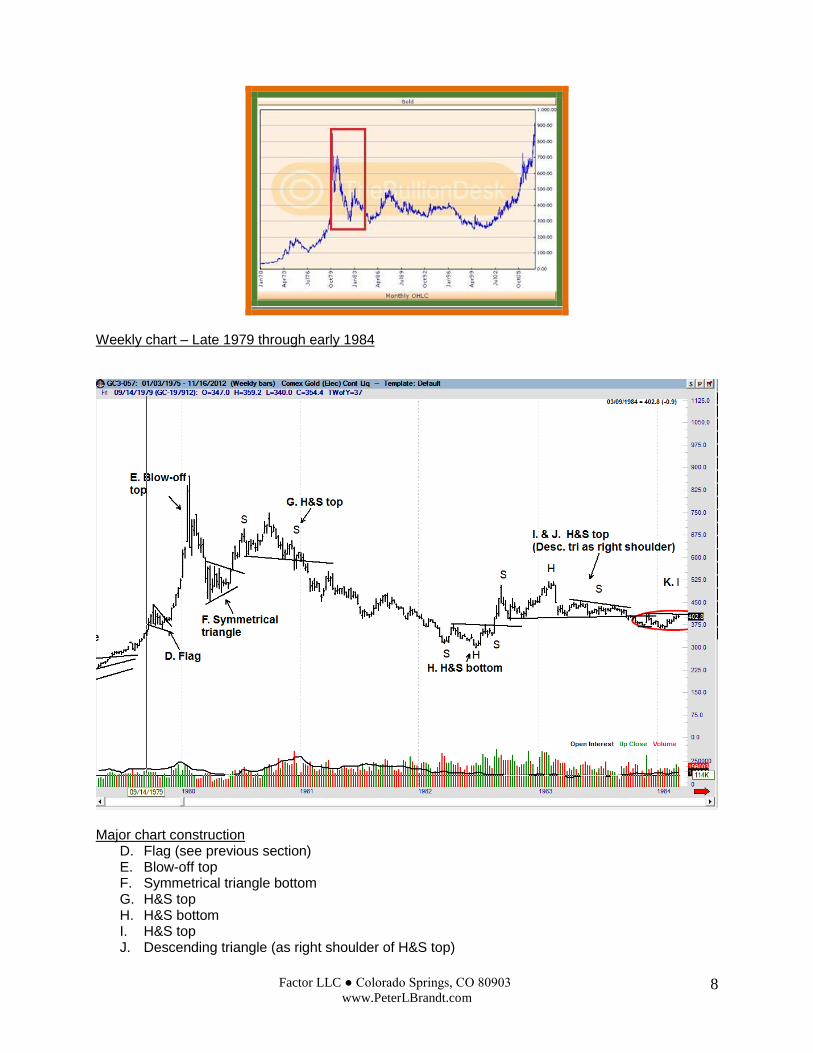
Weekly chart – Late 1979 through early 1984
Major chart construction
D. Flag (see previous section) E. Blow-off top F. Symmetrical triangle bottom G. H&S top H. H&S bottom I. H&S top J. Descending triangle (as right shoulder of H&S top)

Factor LLC ● Colorado Springs, CO 80903
www.PeterLBrandt.com 9
Daily chart – September 1979 through June 1980
Key features
Flag (labeled D) completed in Nov 1979 – see previous section
Half-mast flat completed in Jan 1980 (labeled E). This flag launched the final phase of the 1970s bull market.
Island top in mid Jan 1980
Descending triangle completed in early Mar 1980
Symmetrical triangle bottom (labeled F)
Pennant completed in late Jun 1980
Factor LLC ● Colorado Springs, CO 80903
www.PeterLBrandt.com 10
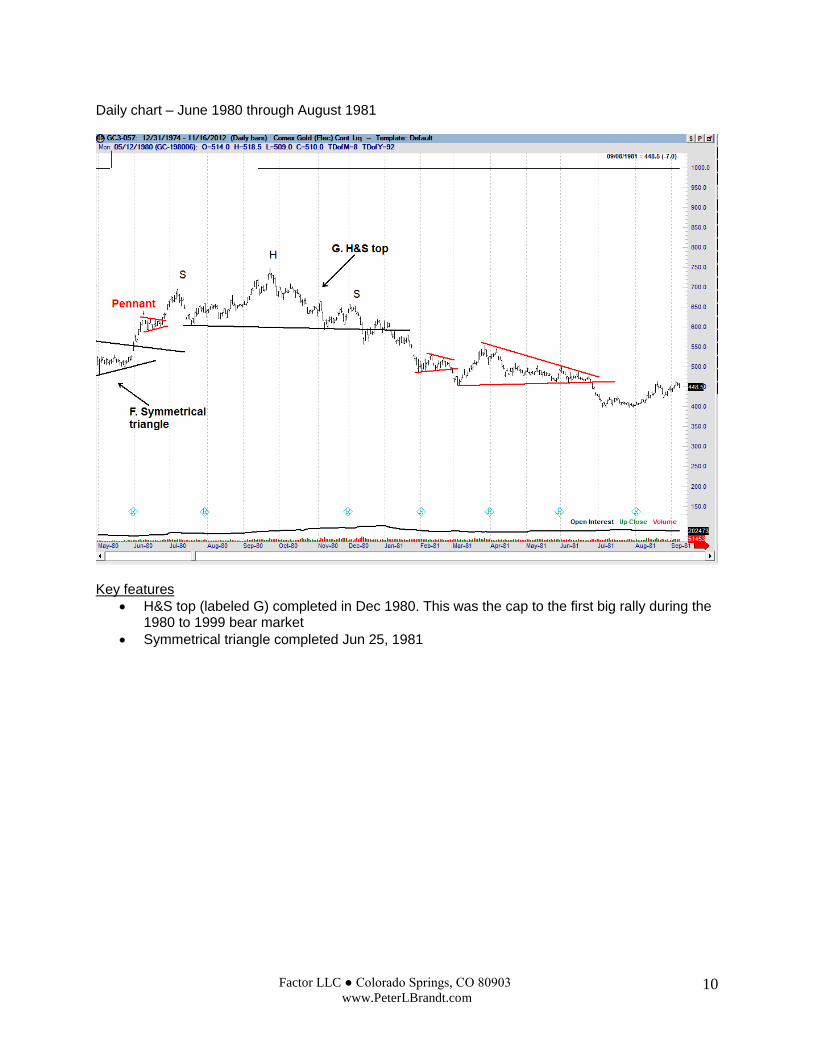
Daily chart – June 1980 through August 1981
Key features
H&S top (labeled G) completed in Dec 1980. This was the cap to the first big rally during the 1980 to 1999 bear market
Symmetrical triangle completed Jun 25, 1981
Factor LLC ● Colorado Springs, CO 80903
www.PeterLBrandt.com 11
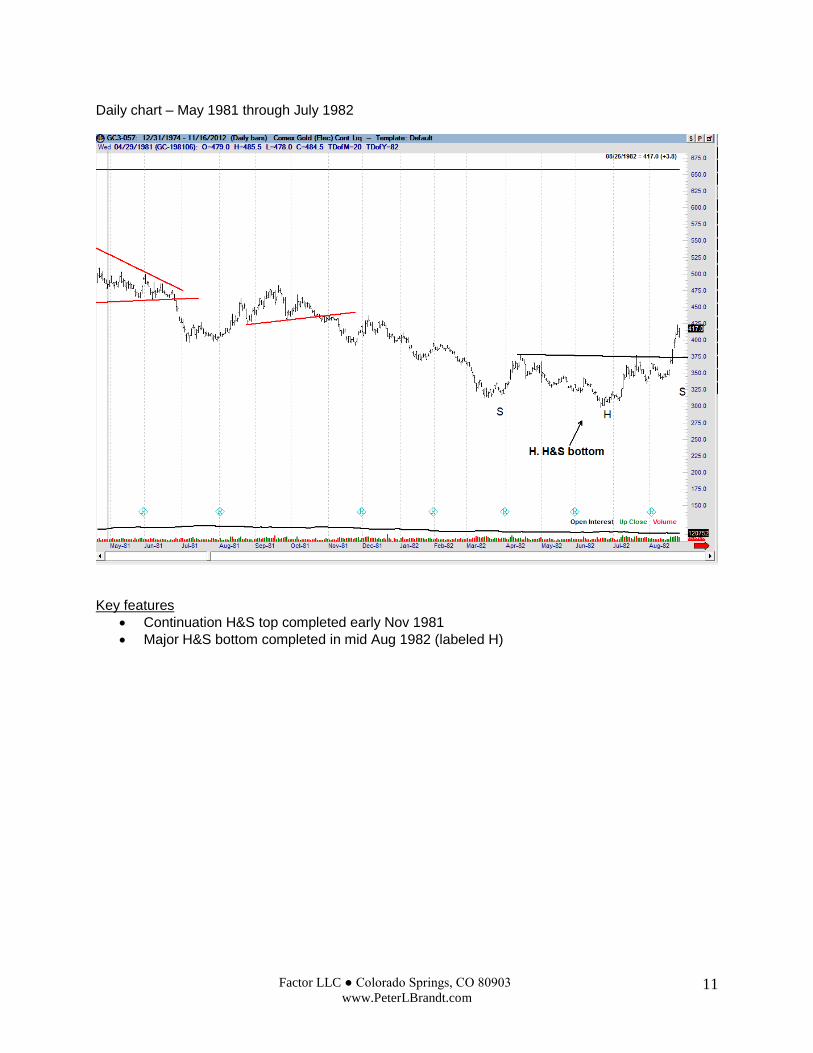
Daily chart – May 1981 through July 1982
Key features
Continuation H&S top completed early Nov 1981
Major H&S bottom completed in mid Aug 1982 (labeled H)
Factor LLC ● Colorado Springs, CO 80903
www.PeterLBrandt.com 12
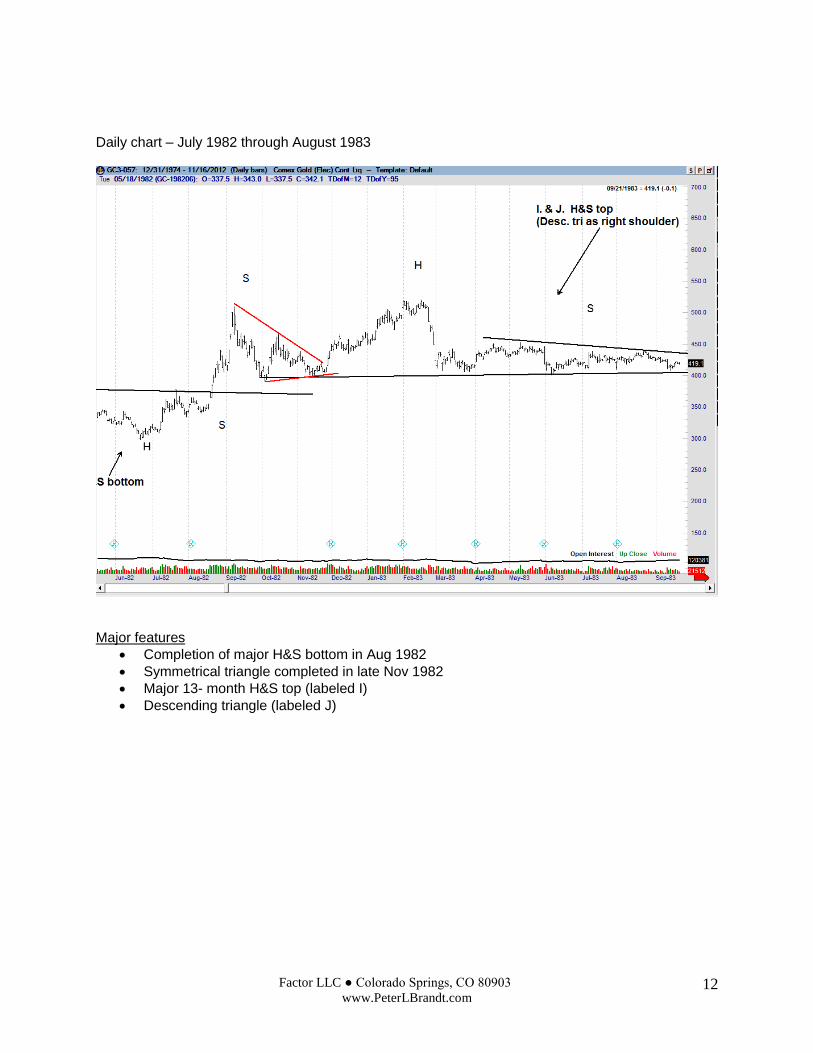
Daily chart – July 1982 through August 1983
Major features
Completion of major H&S bottom in Aug 1982
Symmetrical triangle completed in late Nov 1982
Major 13- month H&S top (labeled I)
Descending triangle (labeled J)
Factor LLC ● Colorado Springs, CO 80903
www.PeterLBrandt.com 13
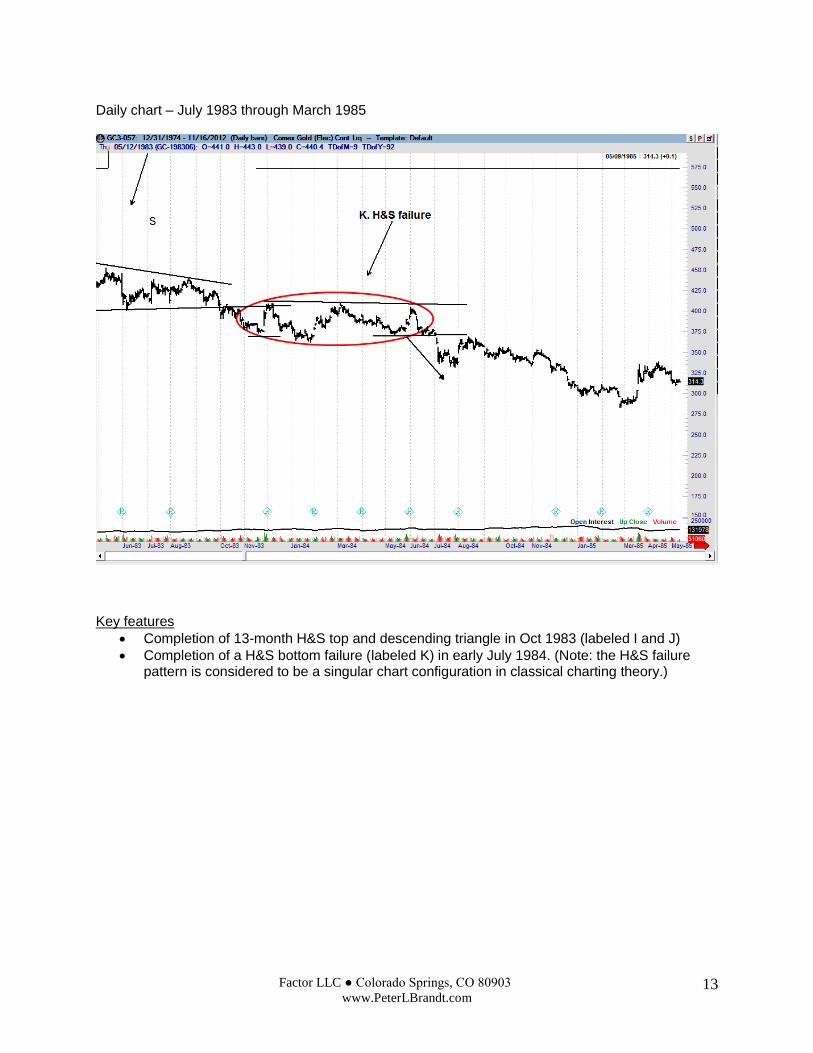
Daily chart – July 1983 through March 1985
Key features
Completion of 13-month H&S top and descending triangle in Oct 1983 (labeled I and J)
Completion of a H&S bottom failure (labeled K) in early July 1984. (Note: the H&S failure pattern is considered to be a singular chart configuration in classical charting theory.)

Factor LLC ● Colorado Springs, CO 80903
www.PeterLBrandt.com 14
Weekly chart – September 1983 through January 1988
Major chart construction
K. H&S failure completed in July 1984 L. Symmetrical triangle completed in early August 1986 M. Symmetrical triangle completed in early April 1987
Factor LLC ● Colorado Springs, CO 80903
www.PeterLBrandt.com 15
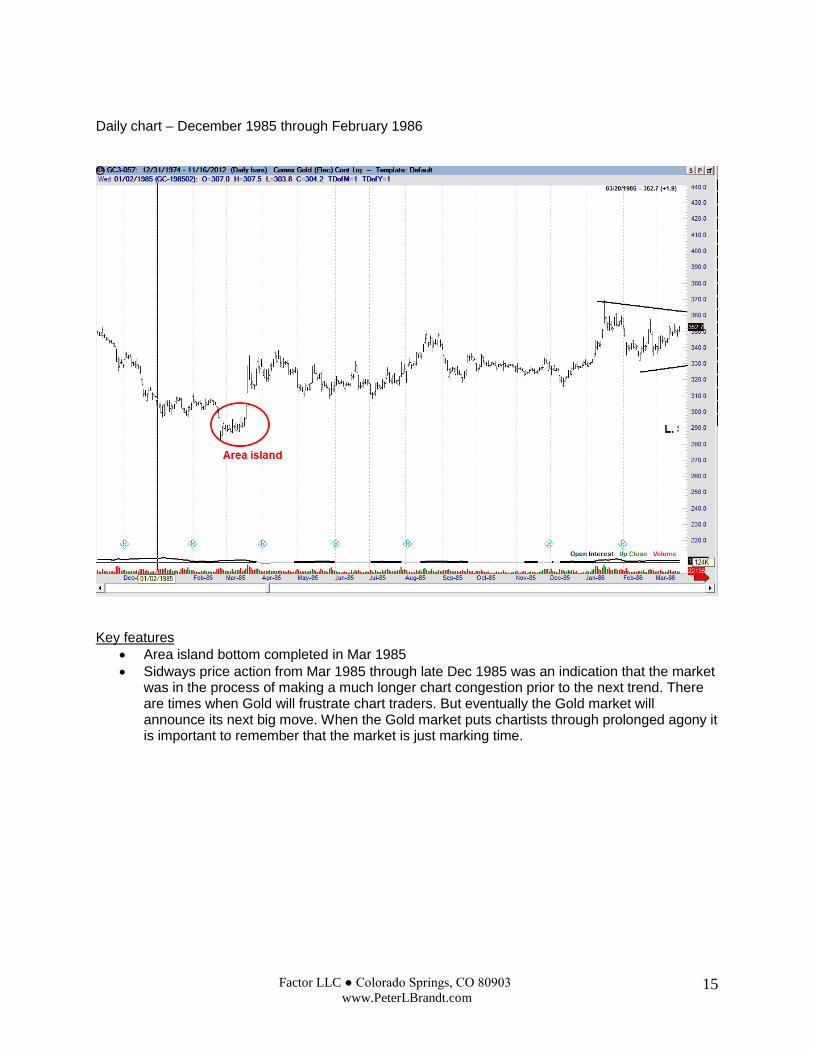
Daily chart – December 1985 through February 1986
Key features
Area island bottom completed in Mar 1985
Sidways price action from Mar 1985 through late Dec 1985 was an indication that the market was in the process of making a much longer chart congestion prior to the next trend. There are times when Gold will frustrate chart traders. But eventually the Gold market will announce its next big move. When the Gold market puts chartists through prolonged agony it is important to remember that the market is just marking time.
Factor LLC ● Colorado Springs, CO 80903
www.PeterLBrandt.com 16
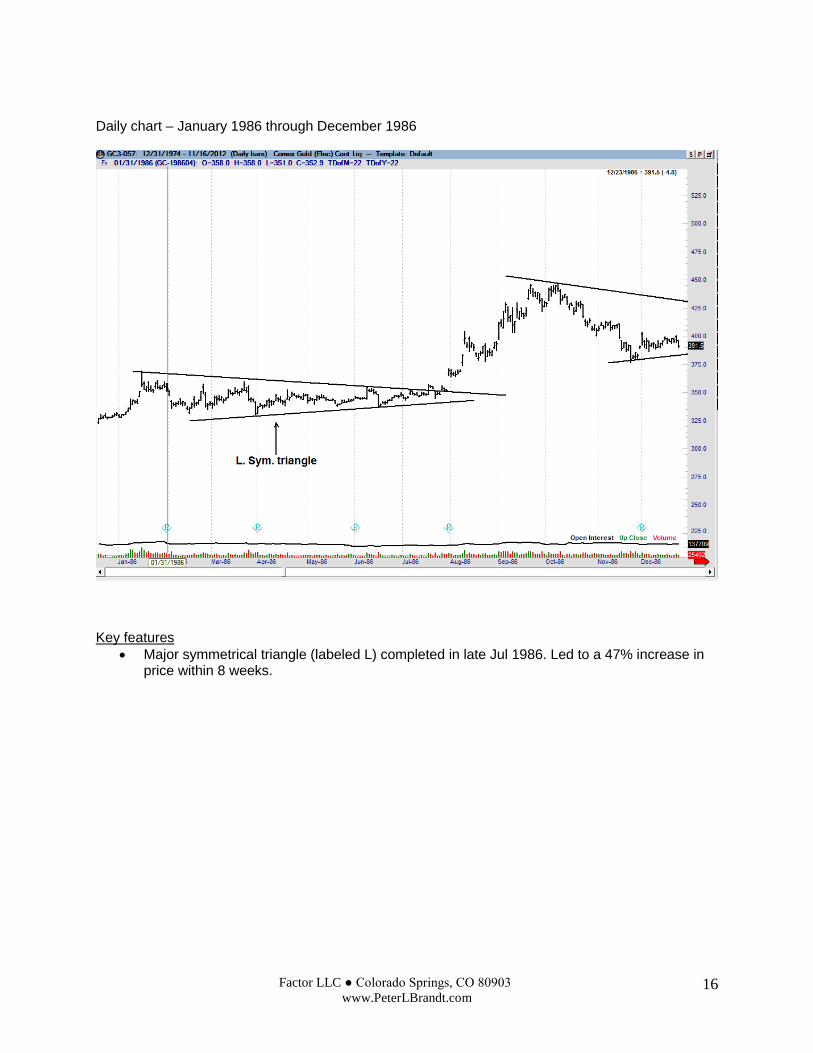
Daily chart – January 1986 through December 1986
Key features
Major symmetrical triangle (labeled L) completed in late Jul 1986. Led to a 47% increase in price within 8 weeks.
Factor LLC ● Colorado Springs, CO 80903
www.PeterLBrandt.com 17
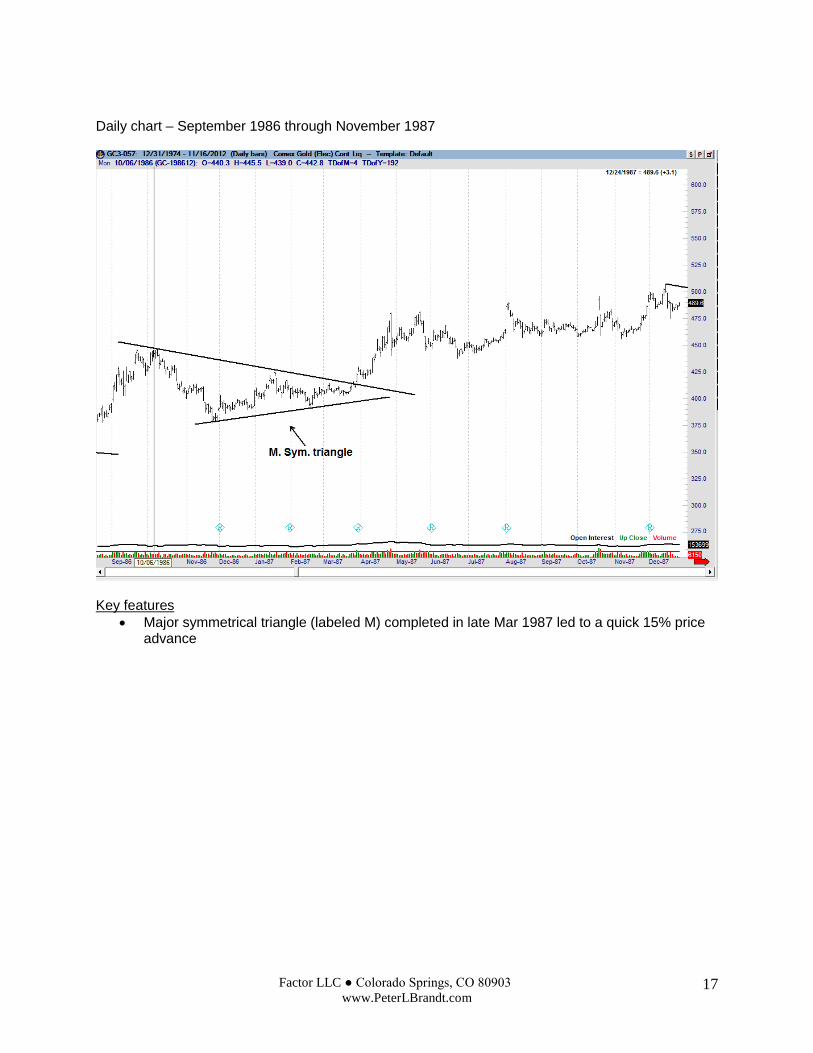
Daily chart – September 1986 through November 1987
Key features
Major symmetrical triangle (labeled M) completed in late Mar 1987 led to a quick 15% price advance
Factor LLC ● Colorado Springs, CO 80903
www.PeterLBrandt.com 18
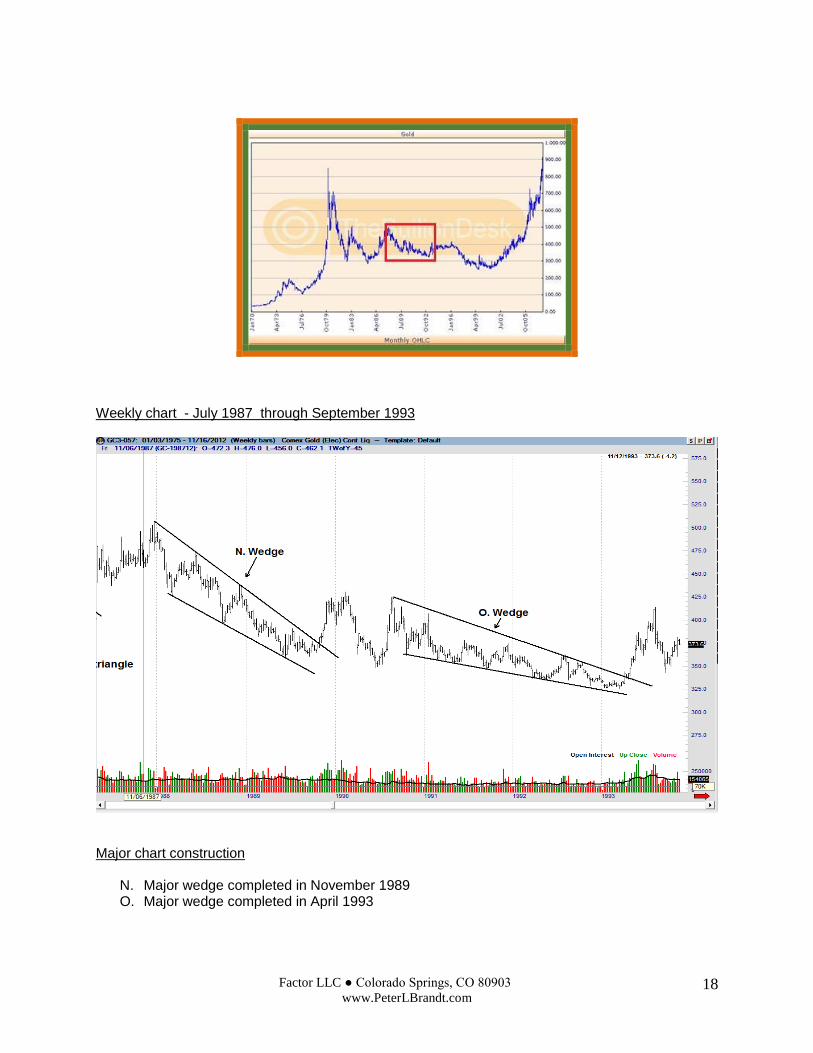
Weekly chart - July 1987 through September 1993
Major chart construction
N. Major wedge completed in November 1989 O. Major wedge completed in April 1993
Factor LLC ● Colorado Springs, CO 80903
www.PeterLBrandt.com 19
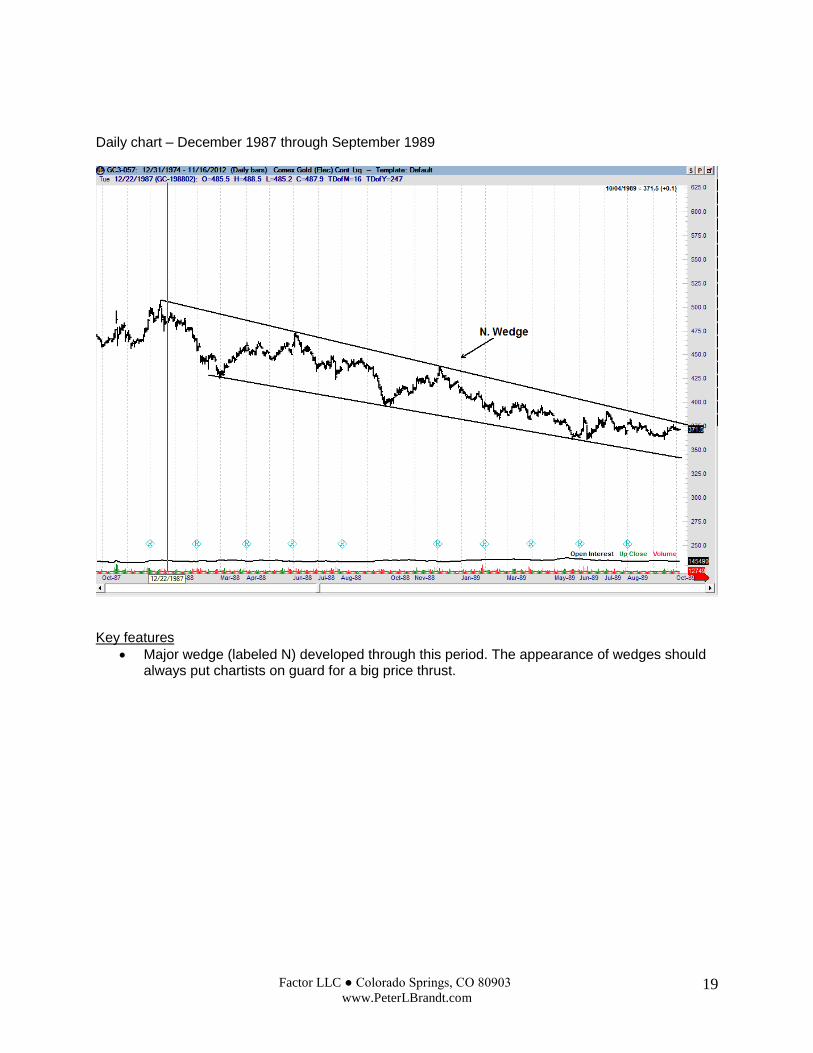
Daily chart – December 1987 through September 1989
Key features
Major wedge (labeled N) developed through this period. The appearance of wedges should always put chartists on guard for a big price thrust.
Factor LLC ● Colorado Springs, CO 80903
www.PeterLBrandt.com 20
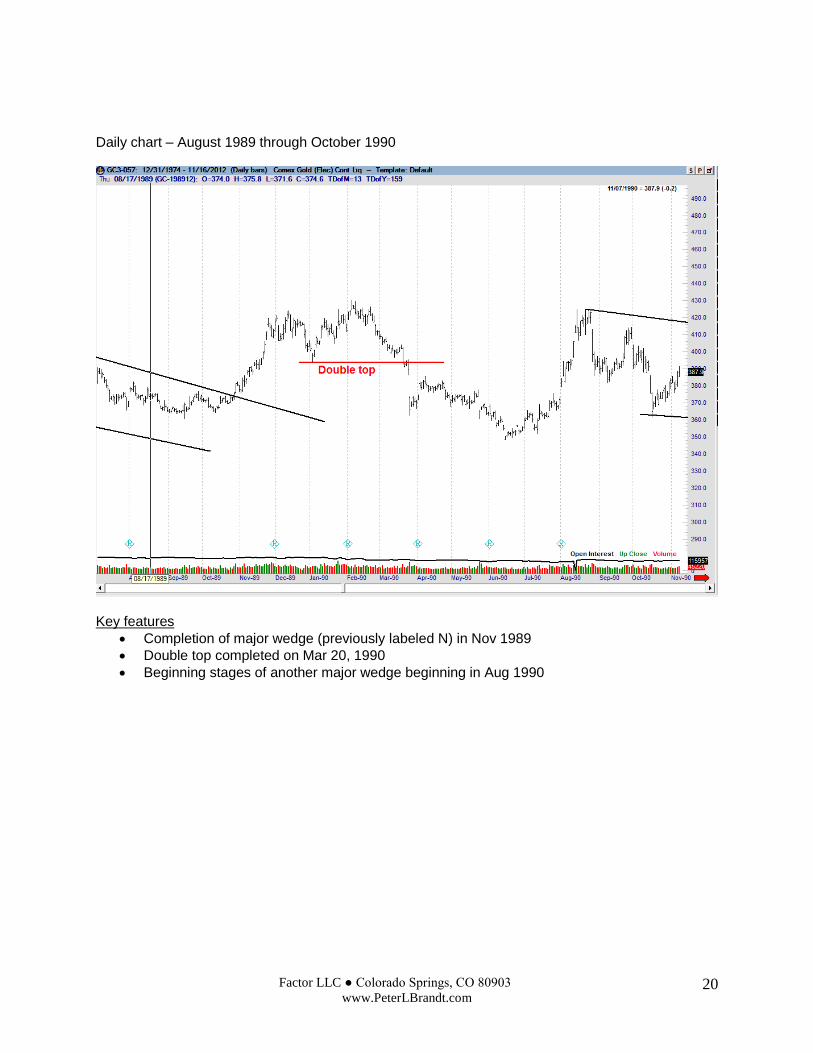
Daily chart – August 1989 through October 1990
Key features
Completion of major wedge (previously labeled N) in Nov 1989
Double top completed on Mar 20, 1990
Beginning stages of another major wedge beginning in Aug 1990
Factor LLC ● Colorado Springs, CO 80903
www.PeterLBrandt.com 21
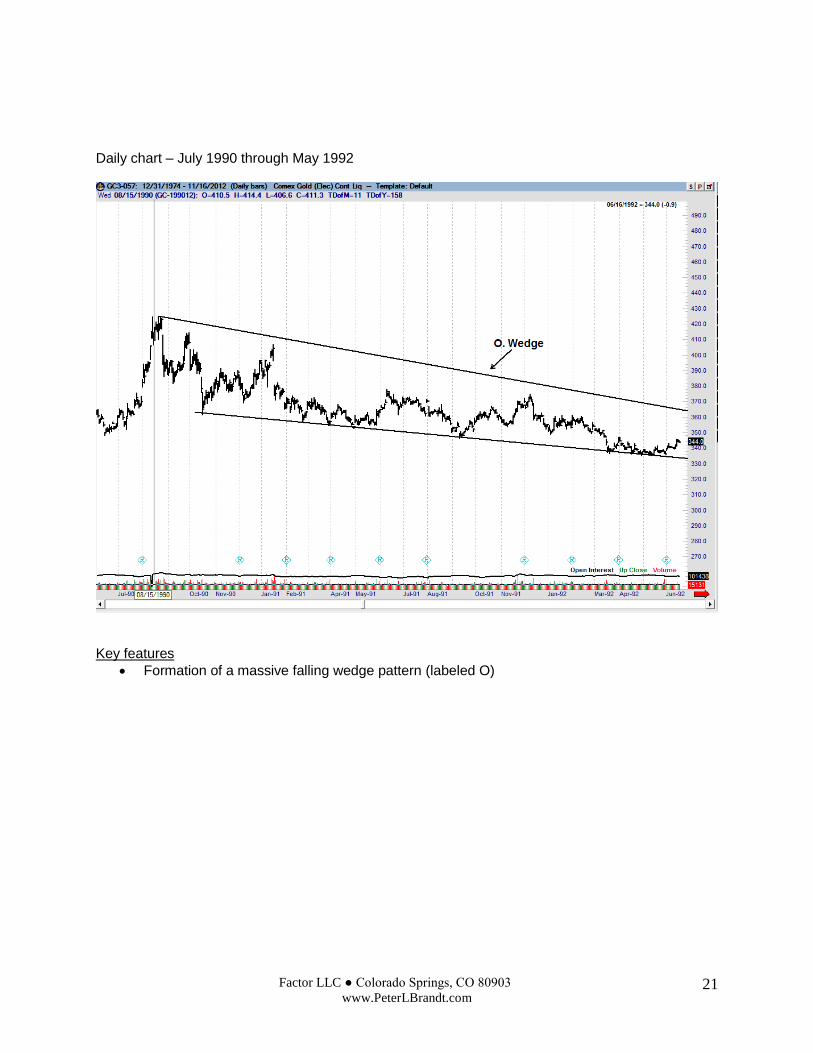
Daily chart – July 1990 through May 1992
Key features
Formation of a massive falling wedge pattern (labeled O)
Factor LLC ● Colorado Springs, CO 80903
www.PeterLBrandt.com 22
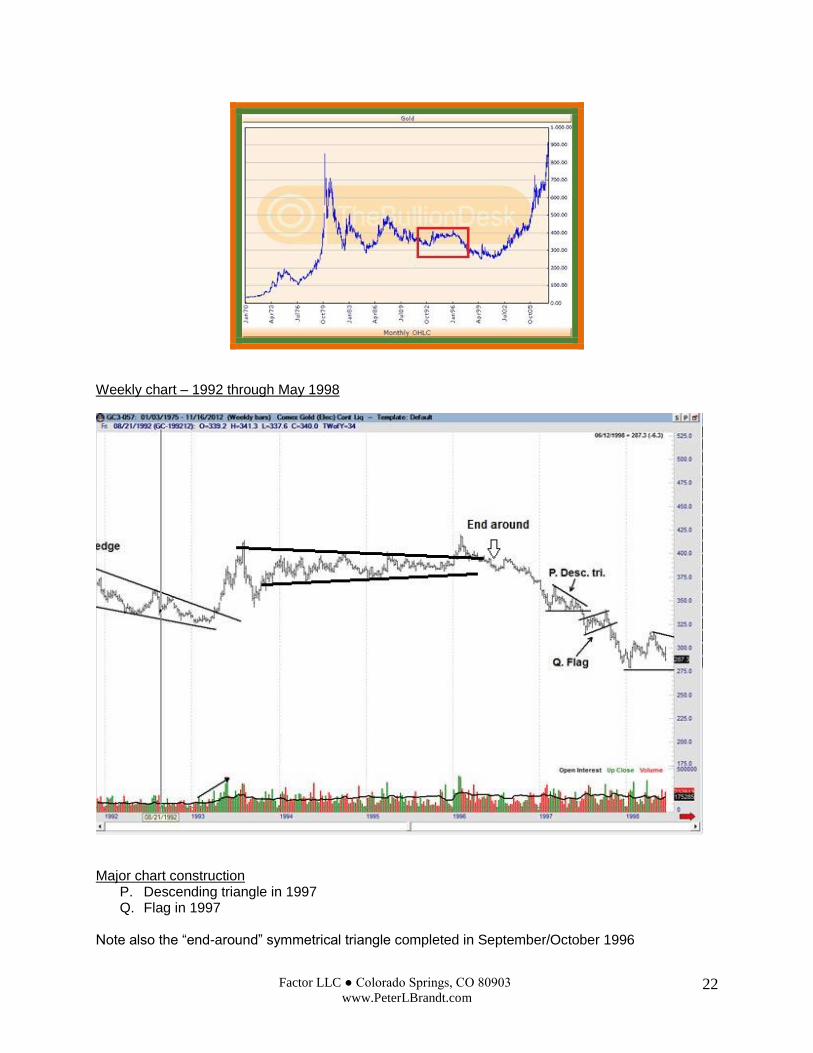
Weekly chart – 1992 through May 1998
Major chart construction
P. Descending triangle in 1997 Q. Flag in 1997
Note also the “end-around” symmetrical triangle completed in September/October 1996

Factor LLC ● Colorado Springs, CO 80903
www.PeterLBrandt.com 23
Daily chart – December 1992 – October 1994
Key features
Completion of major wedge in Apr 1993 (labeled O)
Beginning stages of an “end-around” symmetrical triangle failure sell signal
Factor LLC ● Colorado Springs, CO 80903
www.PeterLBrandt.com 24
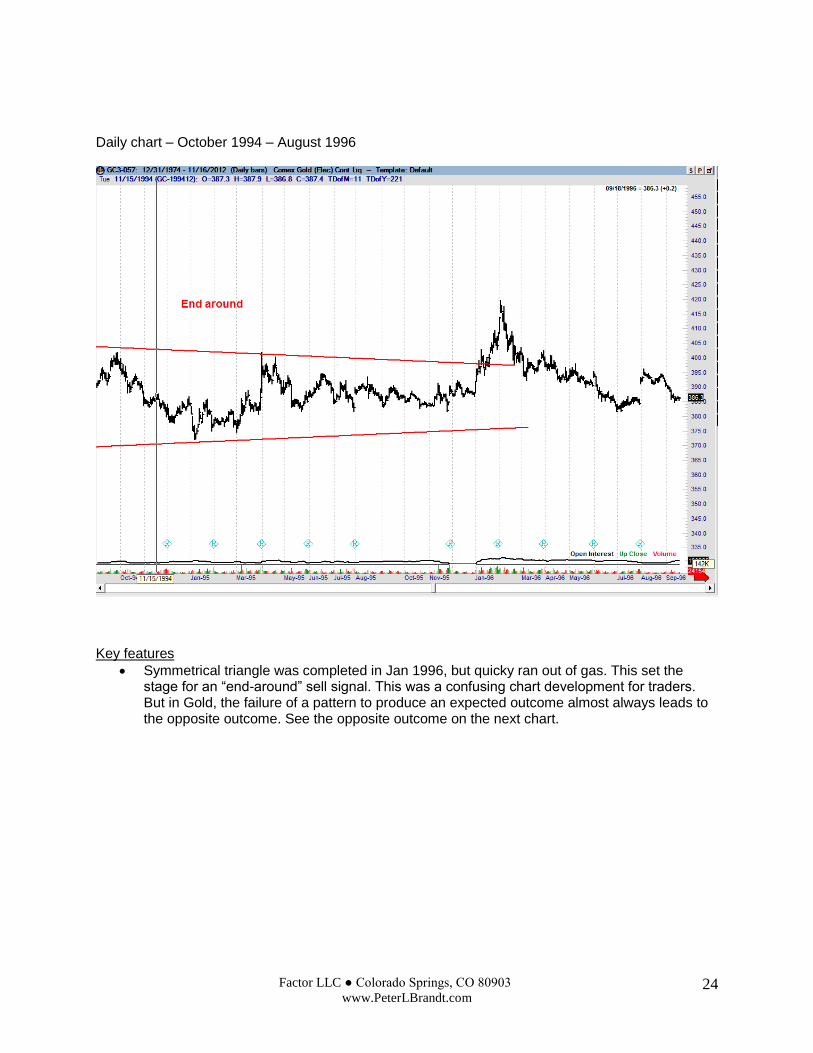
Daily chart – October 1994 – August 1996
Key features
Symmetrical triangle was completed in Jan 1996, but quicky ran out of gas. This set the stage for an “end-around” sell signal. This was a confusing chart development for traders. But in Gold, the failure of a pattern to produce an expected outcome almost always leads to the opposite outcome. See the opposite outcome on the next chart.
Factor LLC ● Colorado Springs, CO 80903
www.PeterLBrandt.com 25
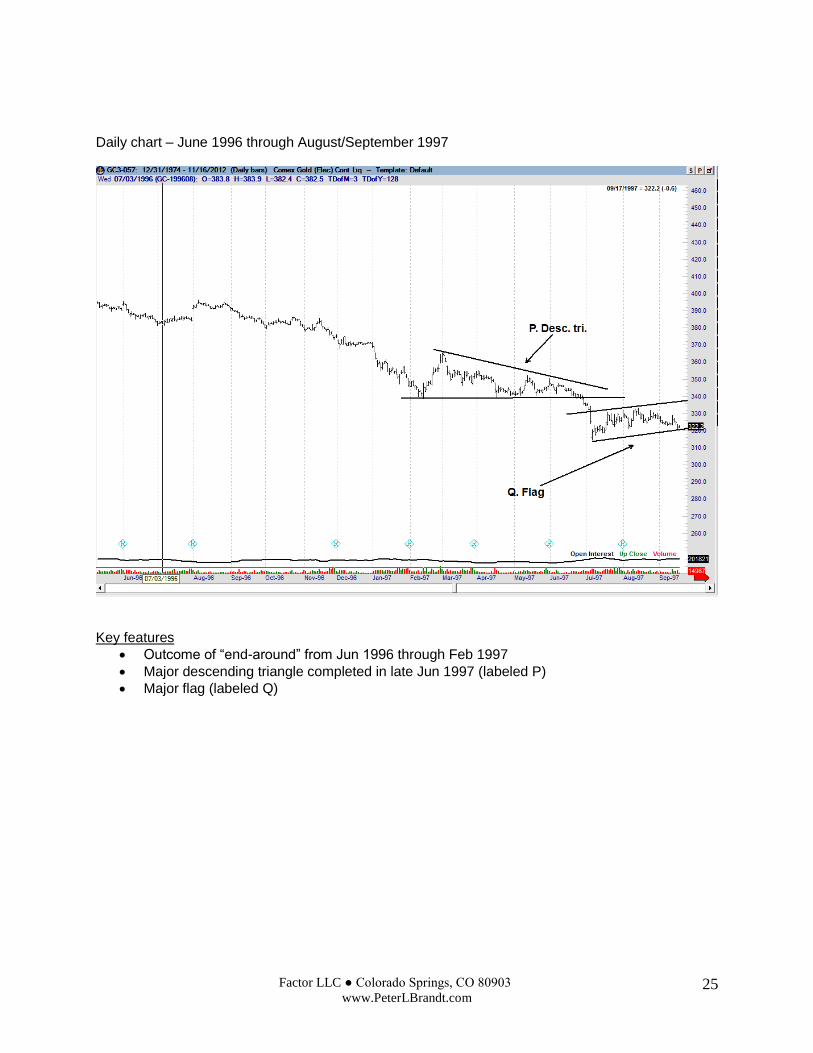
Daily chart – June 1996 through August/September 1997
Key features
Outcome of “end-around” from Jun 1996 through Feb 1997
Major descending triangle completed in late Jun 1997 (labeled P)
Major flag (labeled Q)
Factor LLC ● Colorado Springs, CO 80903
www.PeterLBrandt.com 26
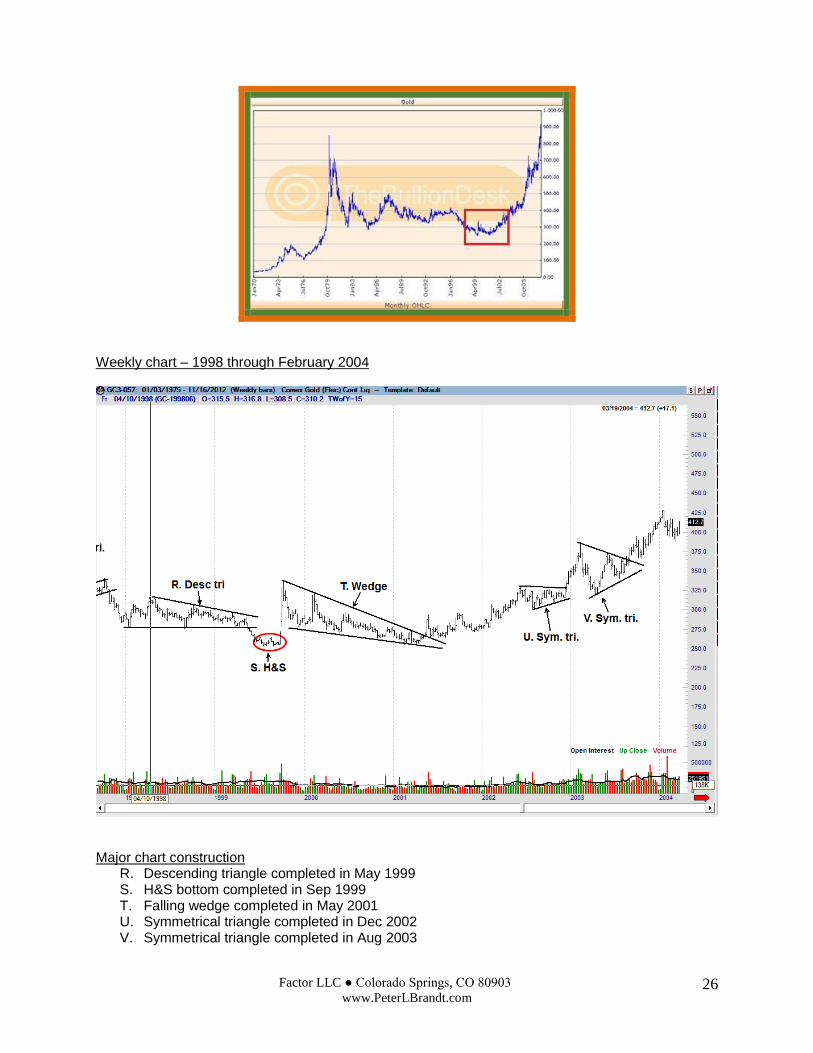
Weekly chart – 1998 through February 2004
Major chart construction
R. Descending triangle completed in May 1999 S. H&S bottom completed in Sep 1999 T. Falling wedge completed in May 2001 U. Symmetrical triangle completed in Dec 2002 V. Symmetrical triangle completed in Aug 2003
Factor LLC ● Colorado Springs, CO 80903
www.PeterLBrandt.com 27
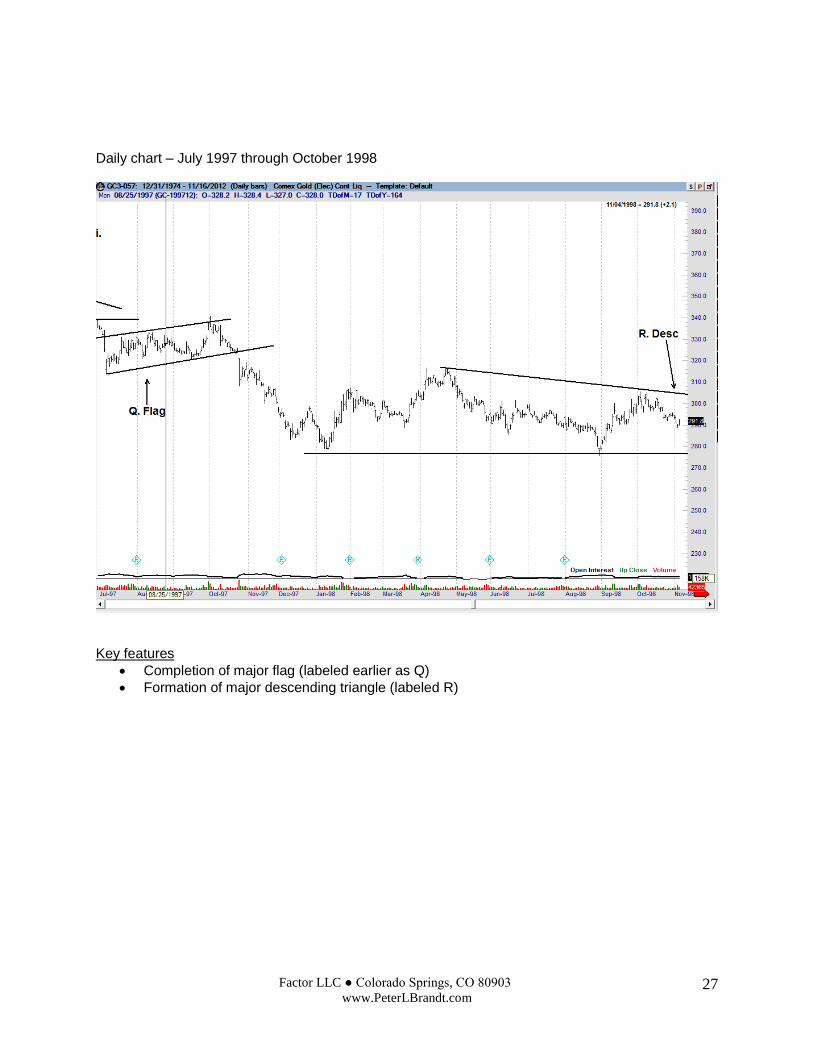
Daily chart – July 1997 through October 1998
Key features
Completion of major flag (labeled earlier as Q)
Formation of major descending triangle (labeled R)
Factor LLC ● Colorado Springs, CO 80903
www.PeterLBrandt.com 28
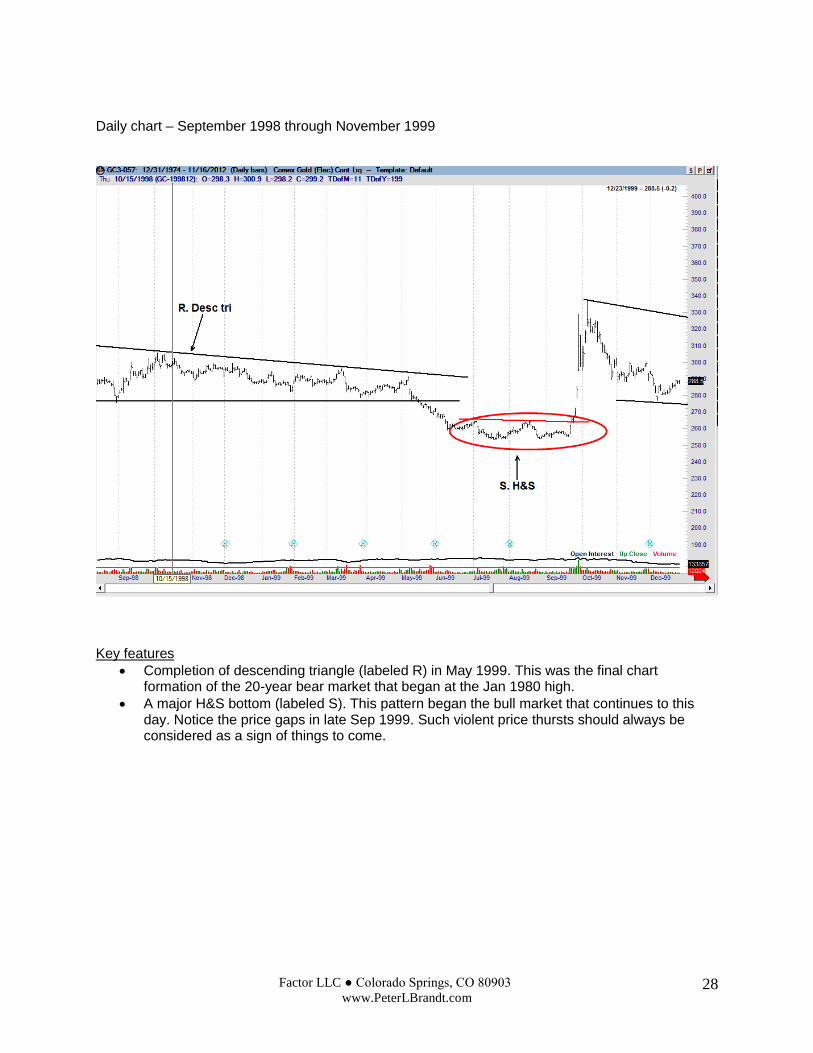
Daily chart – September 1998 through November 1999
Key features
Completion of descending triangle (labeled R) in May 1999. This was the final chart formation of the 20-year bear market that began at the Jan 1980 high.
A major H&S bottom (labeled S). This pattern began the bull market that continues to this day. Notice the price gaps in late Sep 1999. Such violent price thursts should always be considered as a sign of things to come.
Factor LLC ● Colorado Springs, CO 80903
www.PeterLBrandt.com 29
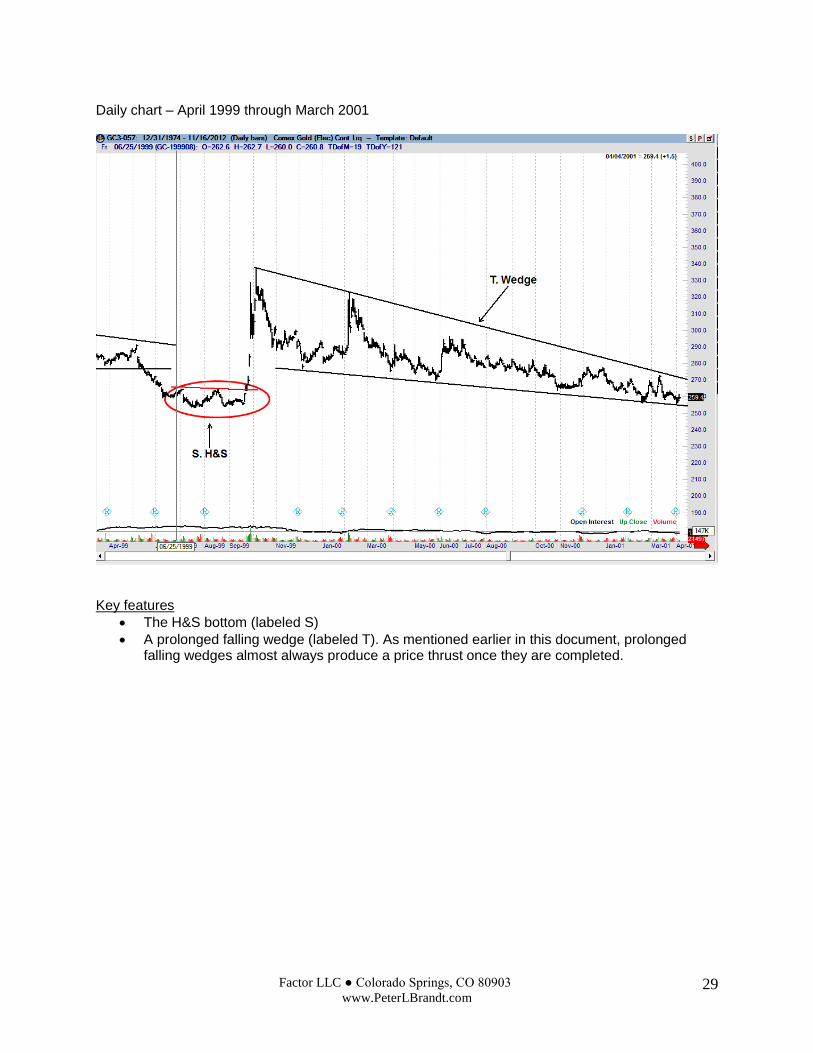
Daily chart – April 1999 through March 2001
Key features
The H&S bottom (labeled S)
A prolonged falling wedge (labeled T). As mentioned earlier in this document, prolonged falling wedges almost always produce a price thrust once they are completed.
Factor LLC ● Colorado Springs, CO 80903
www.PeterLBrandt.com 30
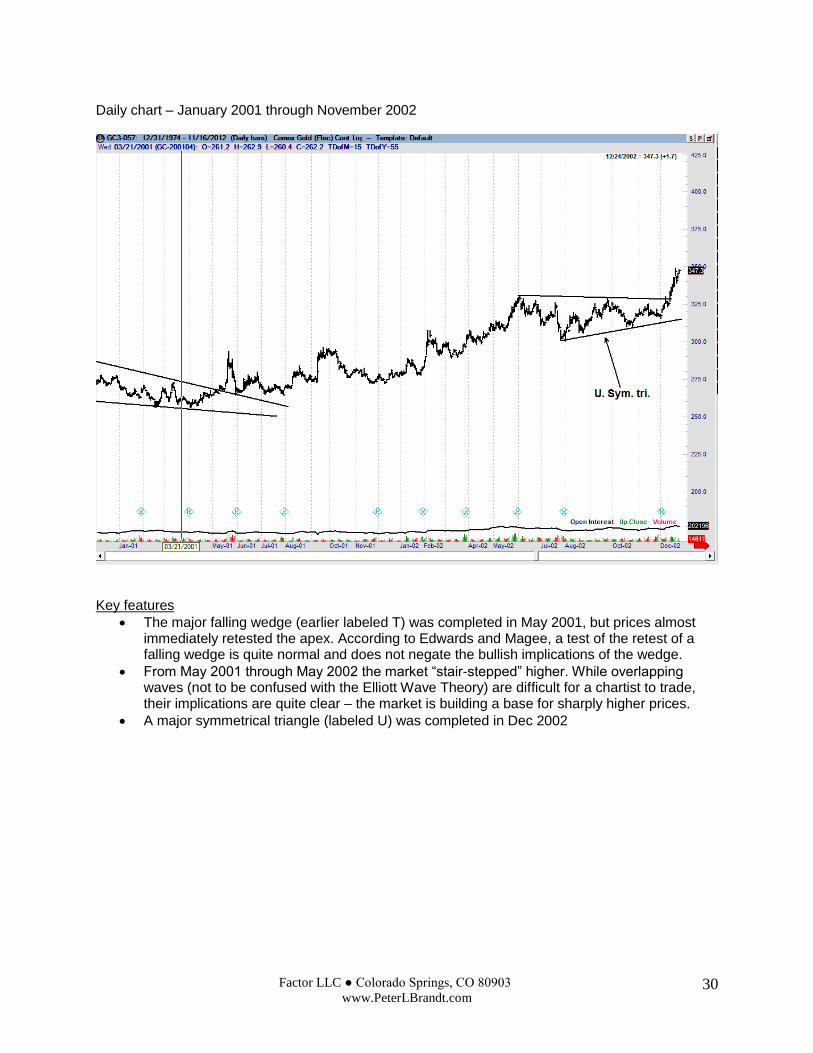
Daily chart – January 2001 through November 2002
Key features
The major falling wedge (earlier labeled T) was completed in May 2001, but prices almost immediately retested the apex. According to Edwards and Magee, a test of the retest of a falling wedge is quite normal and does not negate the bullish implications of the wedge.
From May 2001 through May 2002 the market “stair-stepped” higher. While overlapping waves (not to be confused with the Elliott Wave Theory) are difficult for a chartist to trade, their implications are quite clear – the market is building a base for sharply higher prices.
A major symmetrical triangle (labeled U) was completed in Dec 2002
Factor LLC ● Colorado Springs, CO 80903
www.PeterLBrandt.com 31
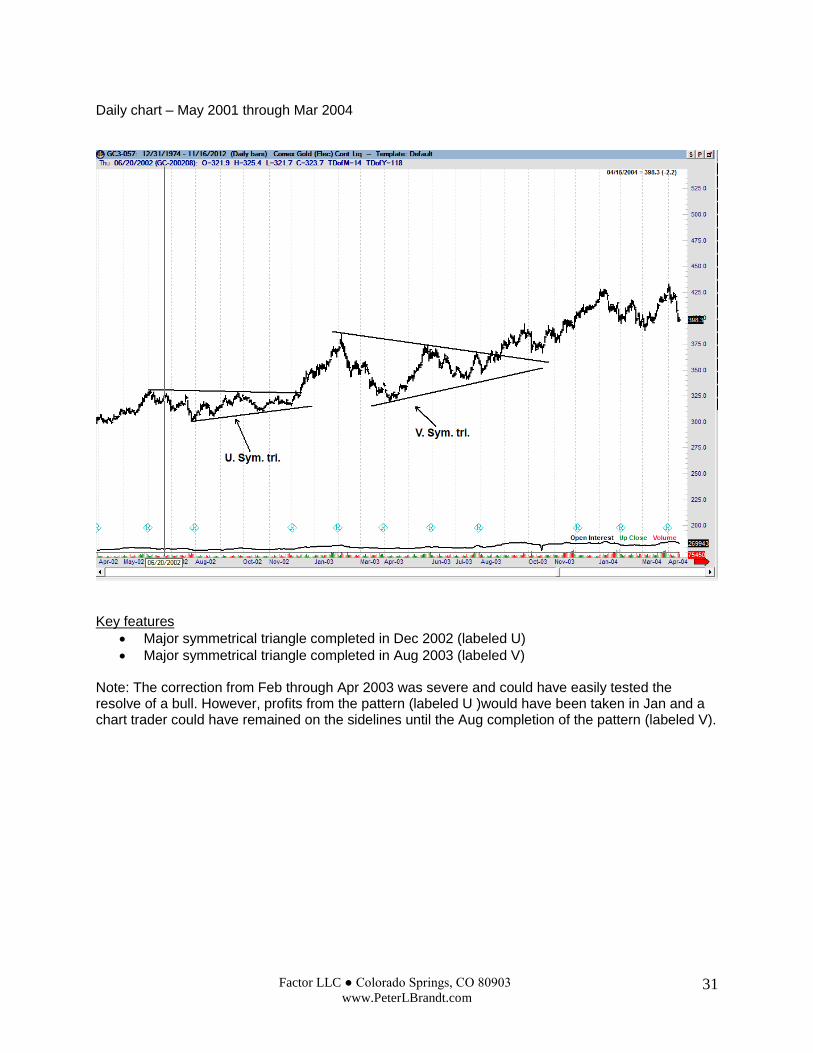
Daily chart – May 2001 through Mar 2004
Key features
Major symmetrical triangle completed in Dec 2002 (labeled U)
Major symmetrical triangle completed in Aug 2003 (labeled V) Note: The correction from Feb through Apr 2003 was severe and could have easily tested the resolve of a bull. However, profits from the pattern (labeled U )would have been taken in Jan and a chart trader could have remained on the sidelines until the Aug completion of the pattern (labeled V).
Factor LLC ● Colorado Springs, CO 80903
www.PeterLBrandt.com 32
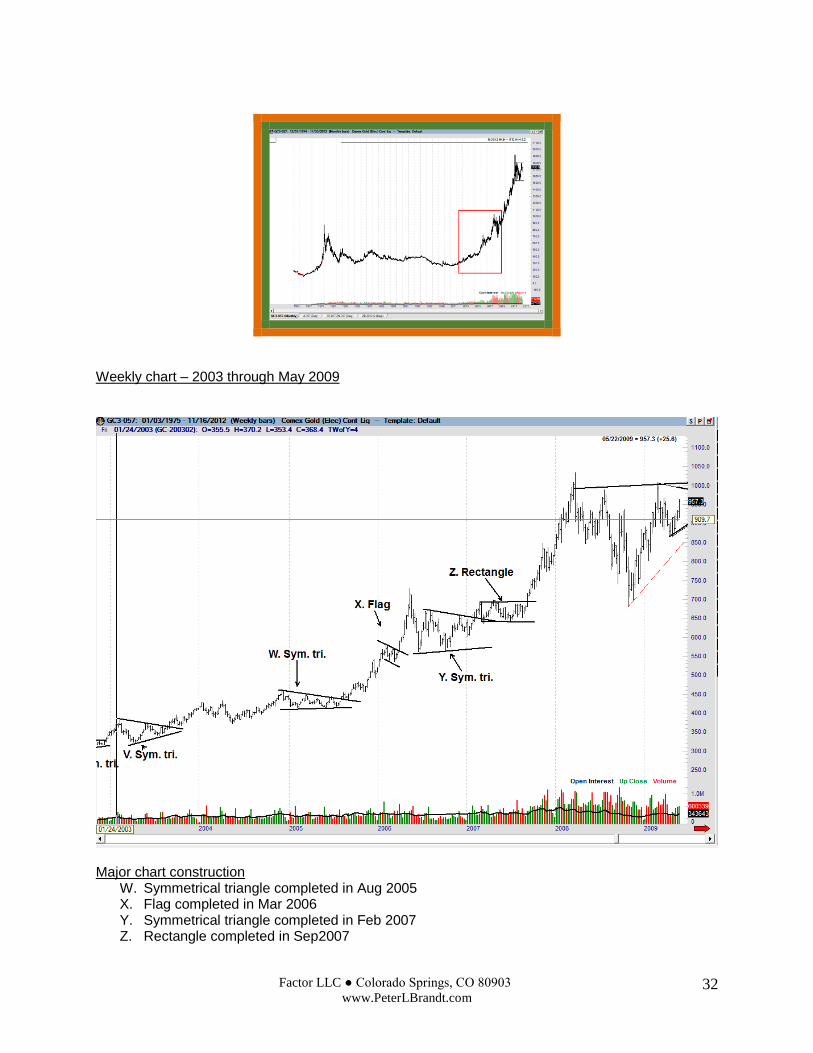
Weekly chart – 2003 through May 2009
Major chart construction
W. Symmetrical triangle completed in Aug 2005 X. Flag completed in Mar 2006 Y. Symmetrical triangle completed in Feb 2007 Z. Rectangle completed in Sep2007

Factor LLC ● Colorado Springs, CO 80903
www.PeterLBrandt.com 33
Daily chart – September 2004 through December 2005
Key features
8-month symmetrical triangle completed in Aug 2008. This pattern had a tricky retest, but serious damage did not occur to the pattern and the sharp rally the first day of Sep resolved any questions.
Factor LLC ● Colorado Springs, CO 80903
www.PeterLBrandt.com 34
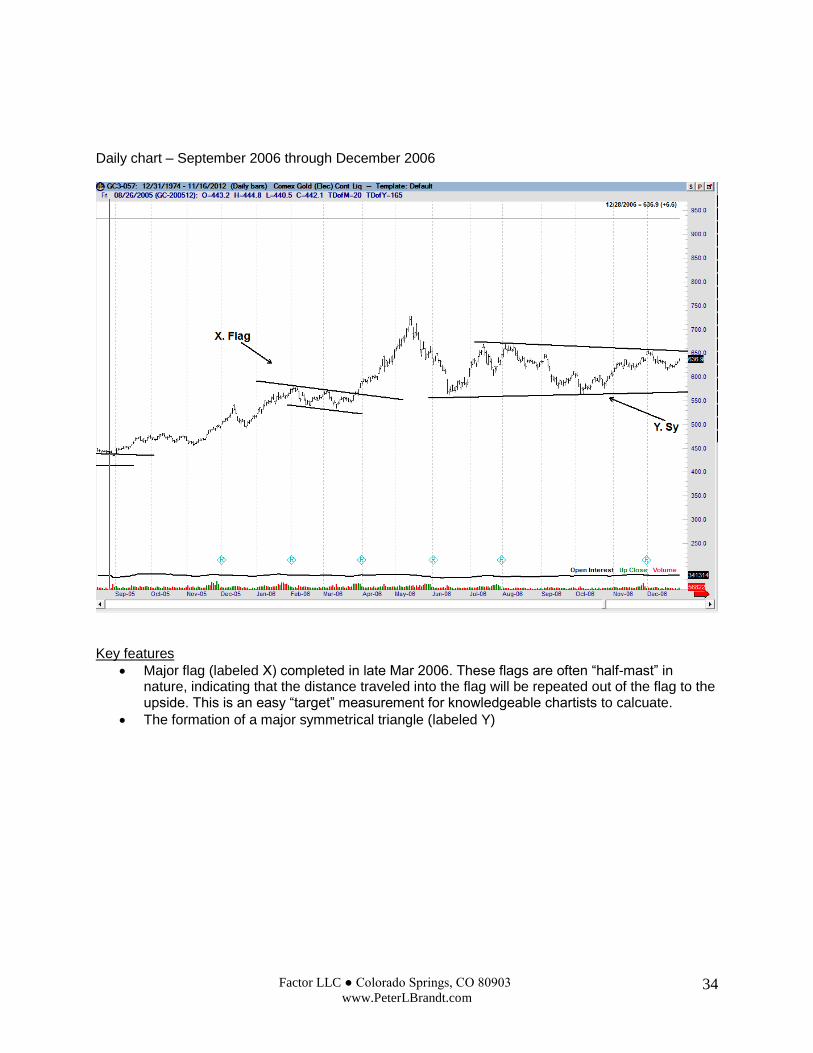
Daily chart – September 2006 through December 2006
Key features
Major flag (labeled X) completed in late Mar 2006. These flags are often “half-mast” in nature, indicating that the distance traveled into the flag will be repeated out of the flag to the upside. This is an easy “target” measurement for knowledgeable chartists to calcuate.
The formation of a major symmetrical triangle (labeled Y)
Factor LLC ● Colorado Springs, CO 80903
www.PeterLBrandt.com 35
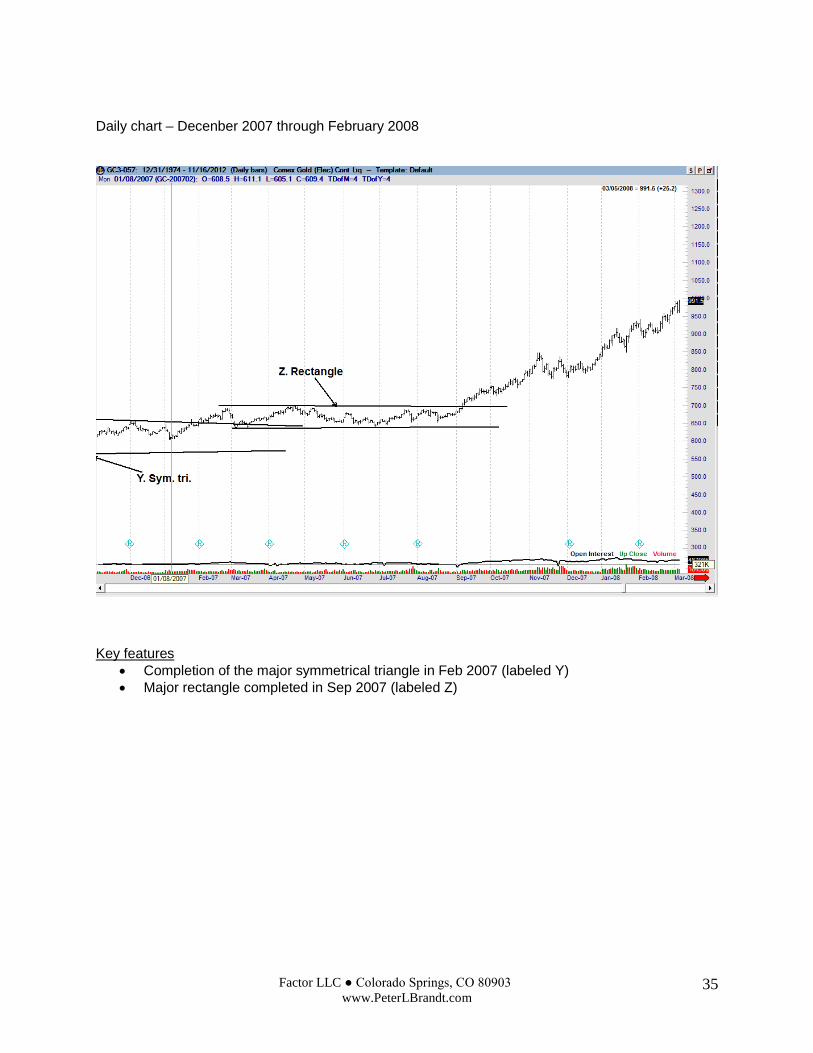
Daily chart – Decenber 2007 through February 2008
Key features
Completion of the major symmetrical triangle in Feb 2007 (labeled Y)
Major rectangle completed in Sep 2007 (labeled Z)
Factor LLC ● Colorado Springs, CO 80903
www.PeterLBrandt.com 36
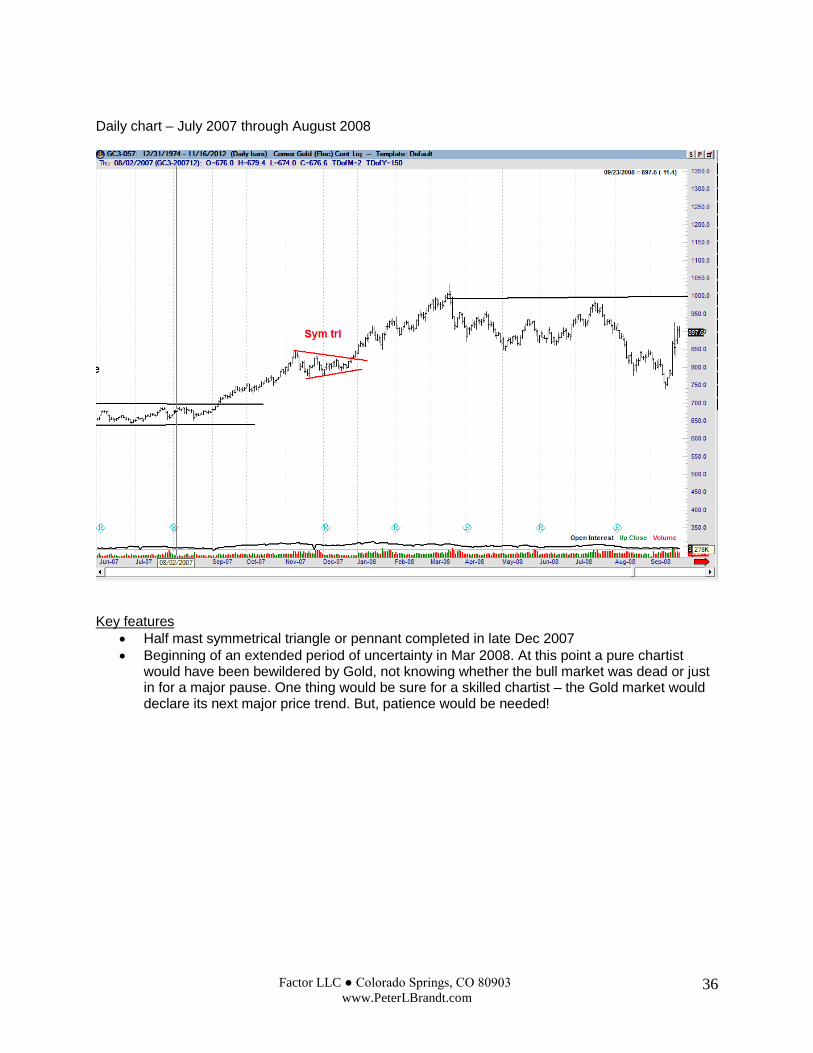
Daily chart – July 2007 through August 2008
Key features
Half mast symmetrical triangle or pennant completed in late Dec 2007
Beginning of an extended period of uncertainty in Mar 2008. At this point a pure chartist would have been bewildered by Gold, not knowing whether the bull market was dead or just in for a major pause. One thing would be sure for a skilled chartist – the Gold market would declare its next major price trend. But, patience would be needed!
Factor LLC ● Colorado Springs, CO 80903
www.PeterLBrandt.com 37
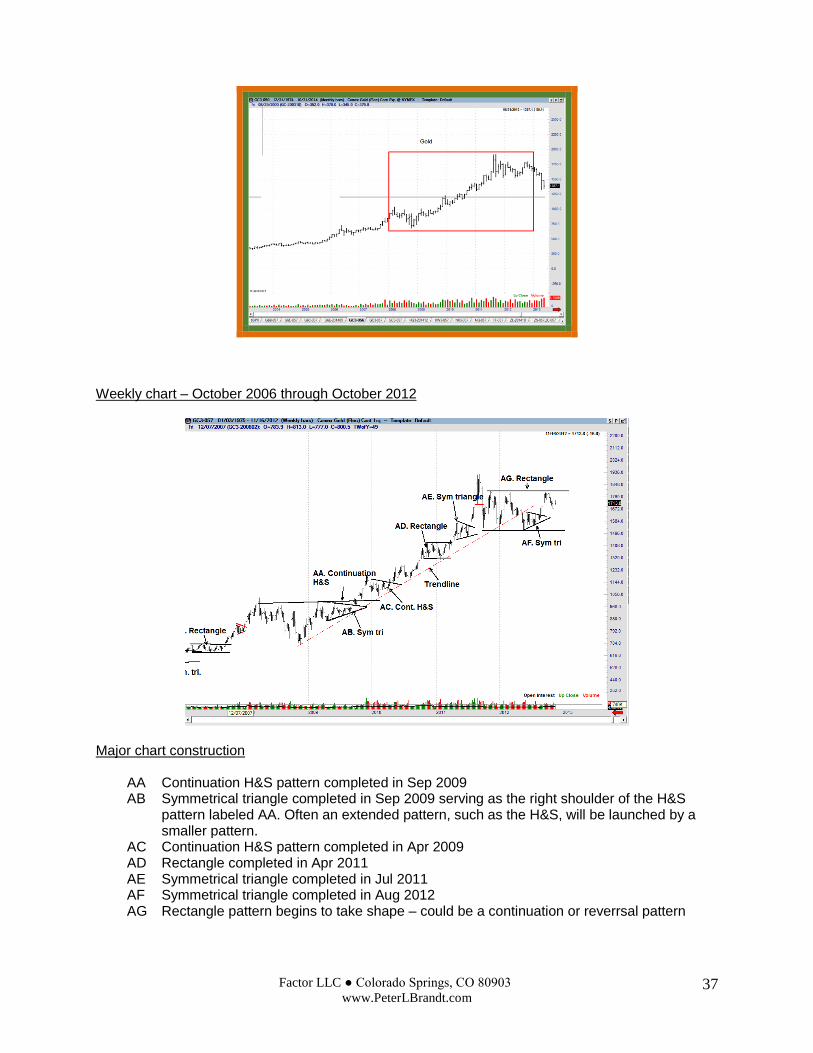
Weekly chart – October 2006 through October 2012
Major chart construction
AA Continuation H&S pattern completed in Sep 2009 AB Symmetrical triangle completed in Sep 2009 serving as the right shoulder of the H&S
pattern labeled AA. Often an extended pattern, such as the H&S, will be launched by a smaller pattern.
AC Continuation H&S pattern completed in Apr 2009 AD Rectangle completed in Apr 2011 AE Symmetrical triangle completed in Jul 2011 AF AG
Symmetrical triangle completed in Aug 2012 Rectangle pattern begins to take shape – could be a continuation or reverrsal pattern
Factor LLC ● Colorado Springs, CO 80903
www.PeterLBrandt.com 38
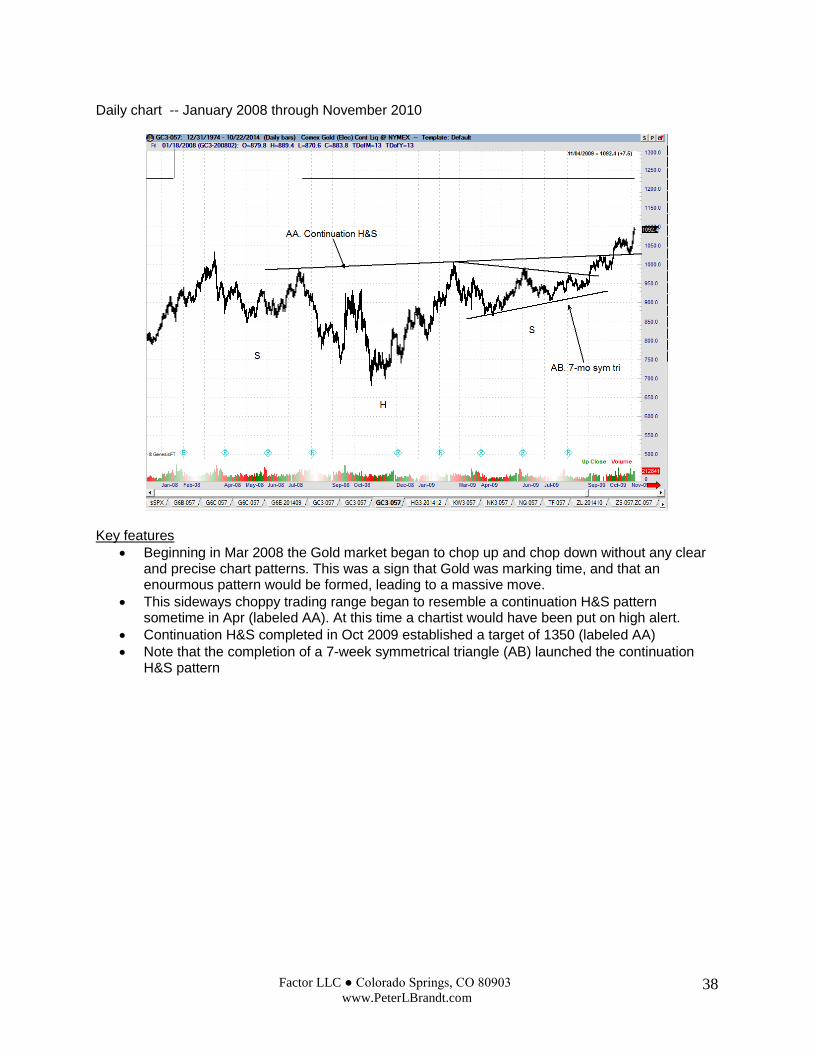
Daily chart -- January 2008 through November 2010
Key features
Beginning in Mar 2008 the Gold market began to chop up and chop down without any clear and precise chart patterns. This was a sign that Gold was marking time, and that an enourmous pattern would be formed, leading to a massive move.
This sideways choppy trading range began to resemble a continuation H&S pattern sometime in Apr (labeled AA). At this time a chartist would have been put on high alert.
Continuation H&S completed in Oct 2009 established a target of 1350 (labeled AA)
Note that the completion of a 7-week symmetrical triangle (AB) launched the continuation H&S pattern
Factor LLC ● Colorado Springs, CO 80903
www.PeterLBrandt.com 39
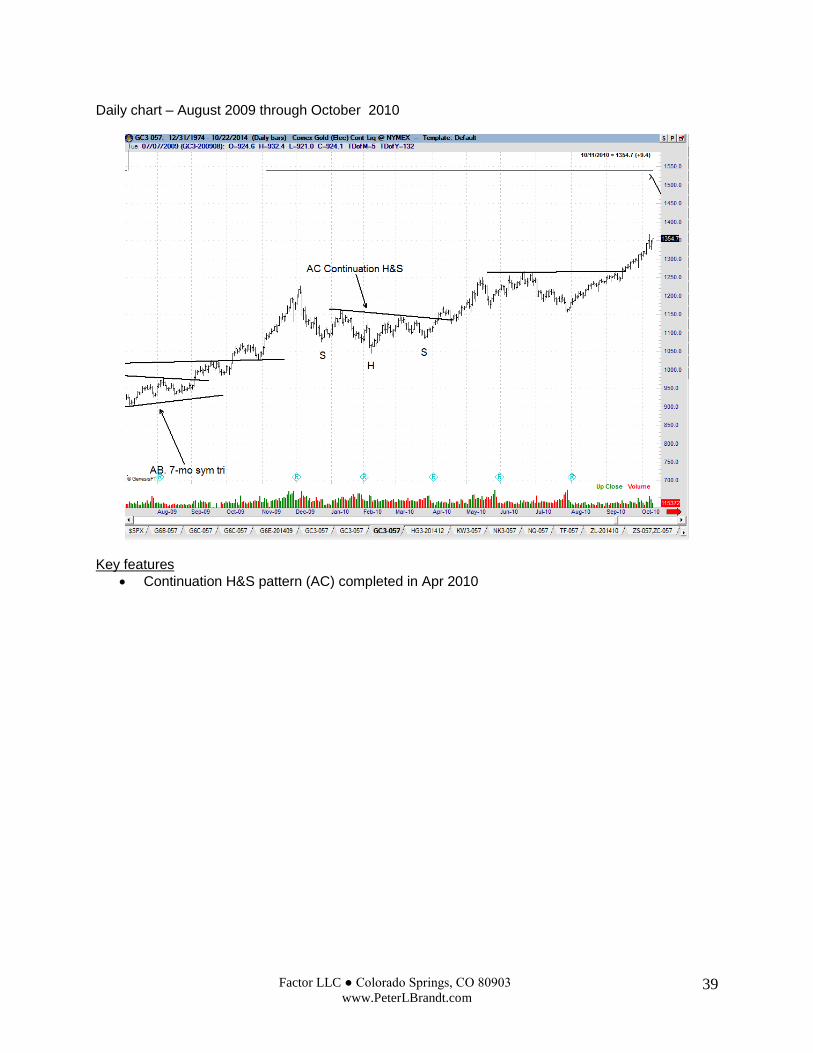
Daily chart – August 2009 through October 2010
Key features
Continuation H&S pattern (AC) completed in Apr 2010
Factor LLC ● Colorado Springs, CO 80903
www.PeterLBrandt.com 40
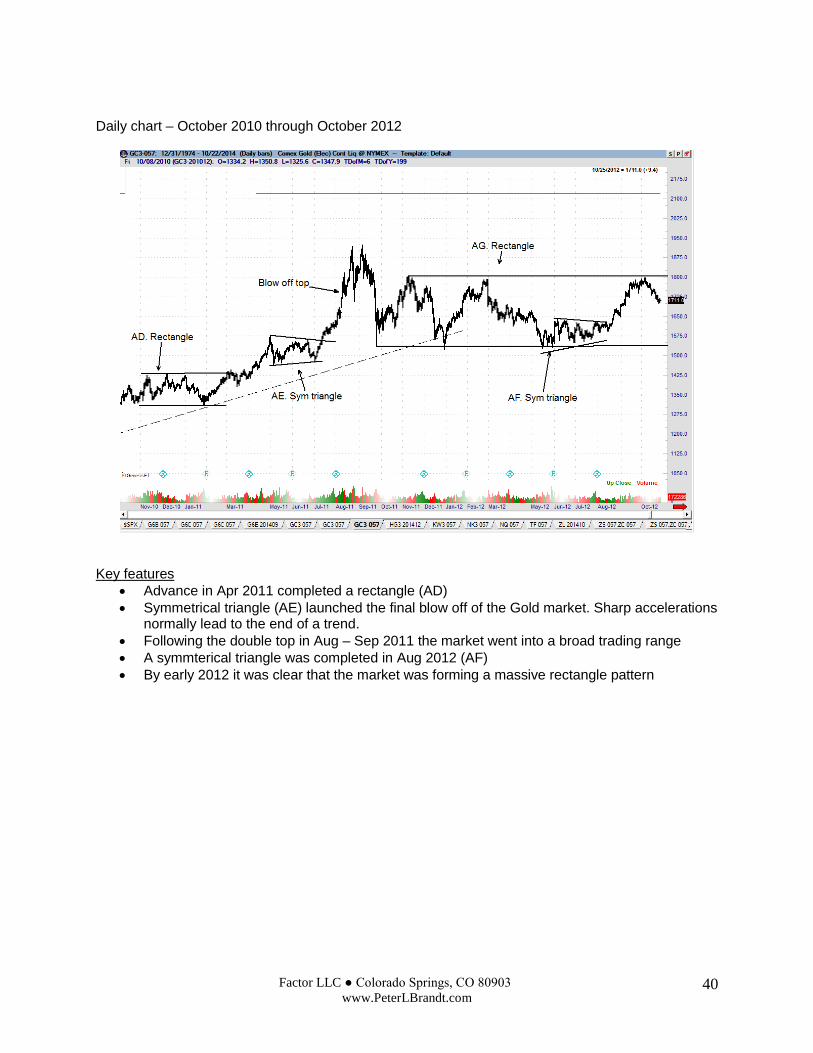
Daily chart – October 2010 through October 2012
Key features
Advance in Apr 2011 completed a rectangle (AD)
Symmetrical triangle (AE) launched the final blow off of the Gold market. Sharp accelerations normally lead to the end of a trend.
Following the double top in Aug – Sep 2011 the market went into a broad trading range
A symmterical triangle was completed in Aug 2012 (AF)
By early 2012 it was clear that the market was forming a massive rectangle pattern

Factor LLC ● Colorado Springs, CO 80903
www.PeterLBrandt.com 41
Weekly chart – October 2012 through December 2015
Major chart construction
Decline in Apr 2013 completed a major rectangle (AG). The target of 1230 was quickly met.
A “half-mast” symmetrical triangle was completed in Jun 2013
The mid 2013 low led to a rally into the Aug 2013 high. This rally did not constitute a chart bottom.
The decline from Aug 2013 through the Dec 2013 was a possible retest of the mid 2013 low – but this still did not constitute a bottom.
The rally to the March 2014 high turned many traders into “born-again” bulls. But, nothing on the charts has constituted a bottom.
Factor LLC ● Colorado Springs, CO 80903
www.PeterLBrandt.com 42
The rally from the May 2014 into the early July high constituted what might have become a H&S bottom, and represented the first time since the Oct 2012 high that the bulls had any hope
The decline below the May 2014 low in Sep 2014 represented the completion of a bearish H&S failure with a target of 1067. While the rally in early 2015 challenged this interpretation, the 1067 target was eventually met in Nov 2015.
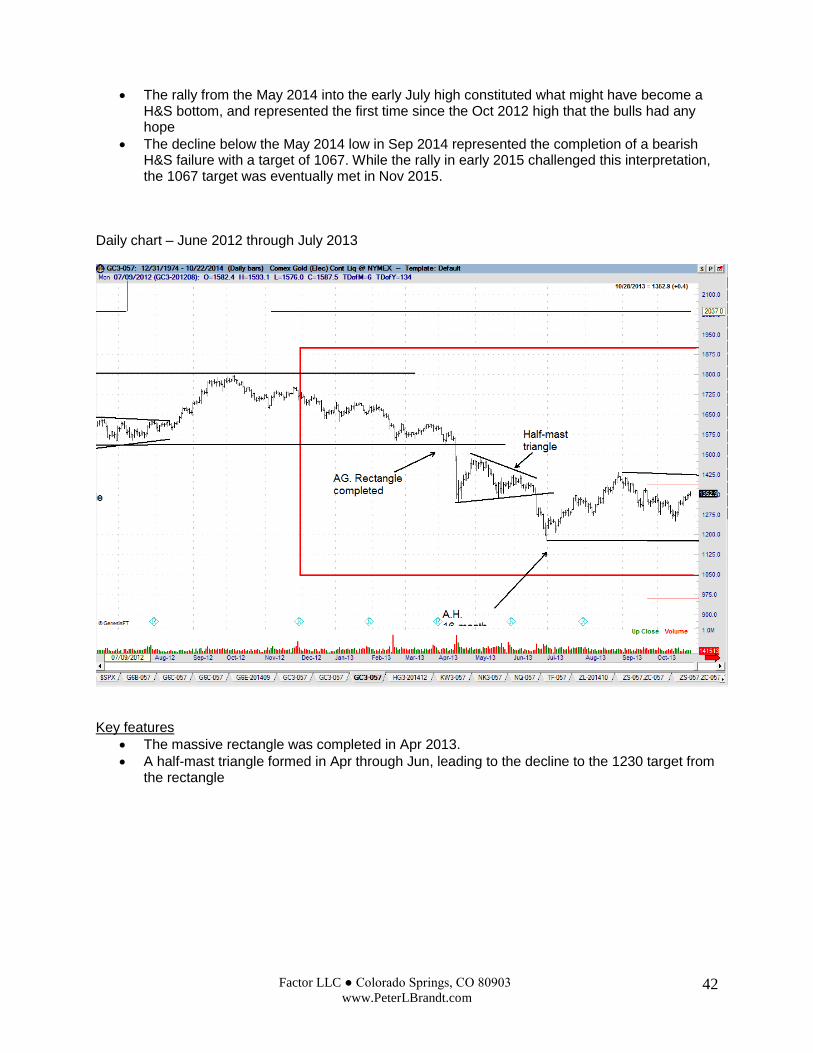
Daily chart – June 2012 through July 2013
Key features
The massive rectangle was completed in Apr 2013.
A half-mast triangle formed in Apr through Jun, leading to the decline to the 1230 target from the rectangle
Factor LLC ● Colorado Springs, CO 80903
www.PeterLBrandt.com 43
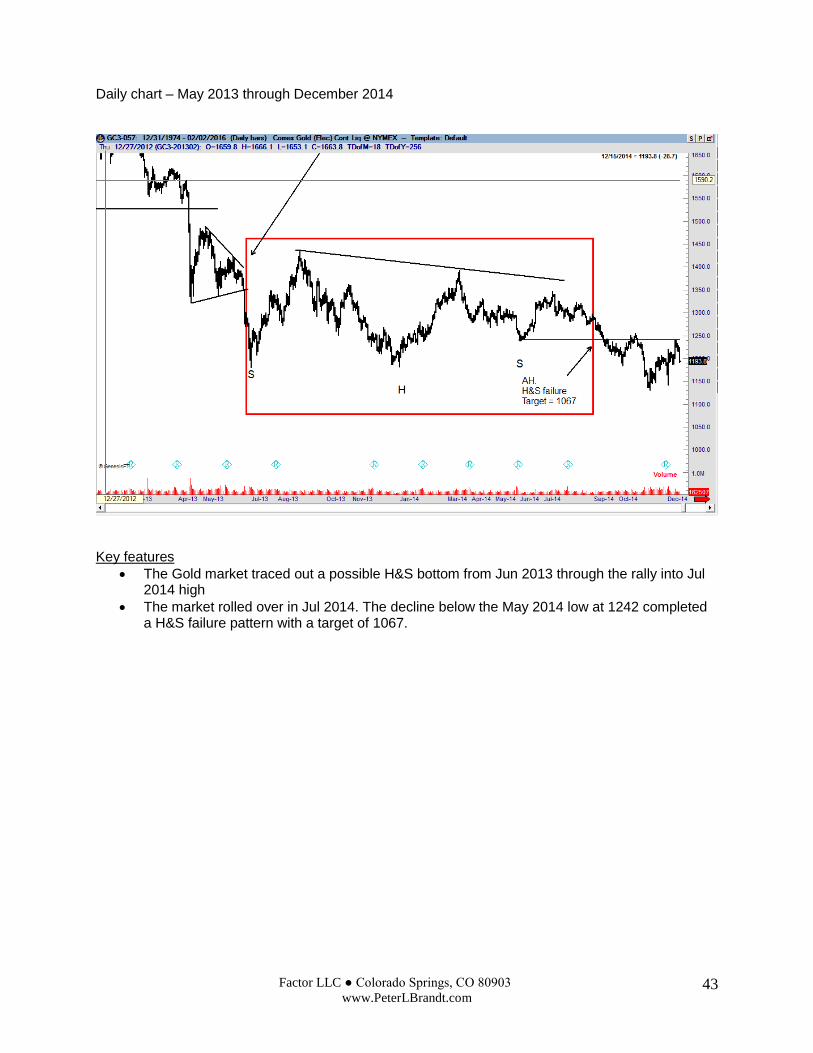
Daily chart – May 2013 through December 2014
Key features
The Gold market traced out a possible H&S bottom from Jun 2013 through the rally into Jul 2014 high
The market rolled over in Jul 2014. The decline below the May 2014 low at 1242 completed a H&S failure pattern with a target of 1067.
Factor LLC ● Colorado Springs, CO 80903
www.PeterLBrandt.com 44
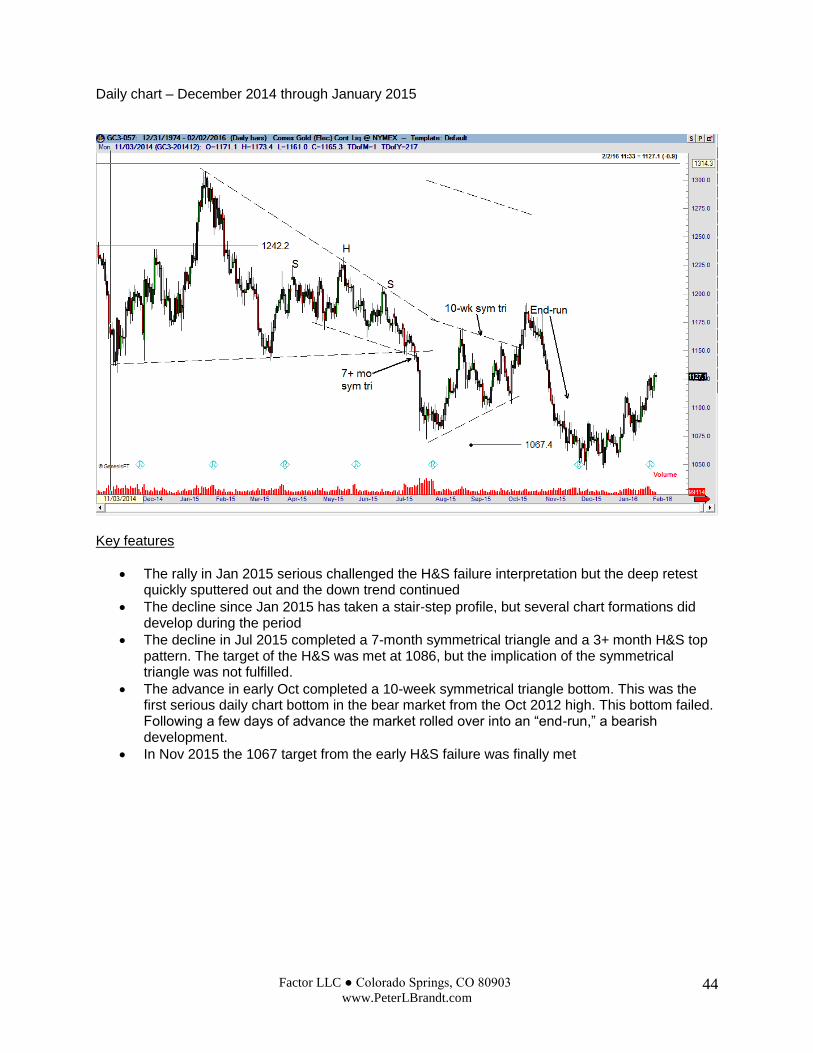
Daily chart – December 2014 through January 2015
Key features
The rally in Jan 2015 serious challenged the H&S failure interpretation but the deep retest quickly sputtered out and the down trend continued
The decline since Jan 2015 has taken a stair-step profile, but several chart formations did develop during the period
The decline in Jul 2015 completed a 7-month symmetrical triangle and a 3+ month H&S top pattern. The target of the H&S was met at 1086, but the implication of the symmetrical triangle was not fulfilled.
The advance in early Oct completed a 10-week symmetrical triangle bottom. This was the first serious daily chart bottom in the bear market from the Oct 2012 high. This bottom failed. Following a few days of advance the market rolled over into an “end-run,” a bearish development.
In Nov 2015 the 1067 target from the early H&S failure was finally met
Factor LLC ● Colorado Springs, CO 80903
www.PeterLBrandt.com 45
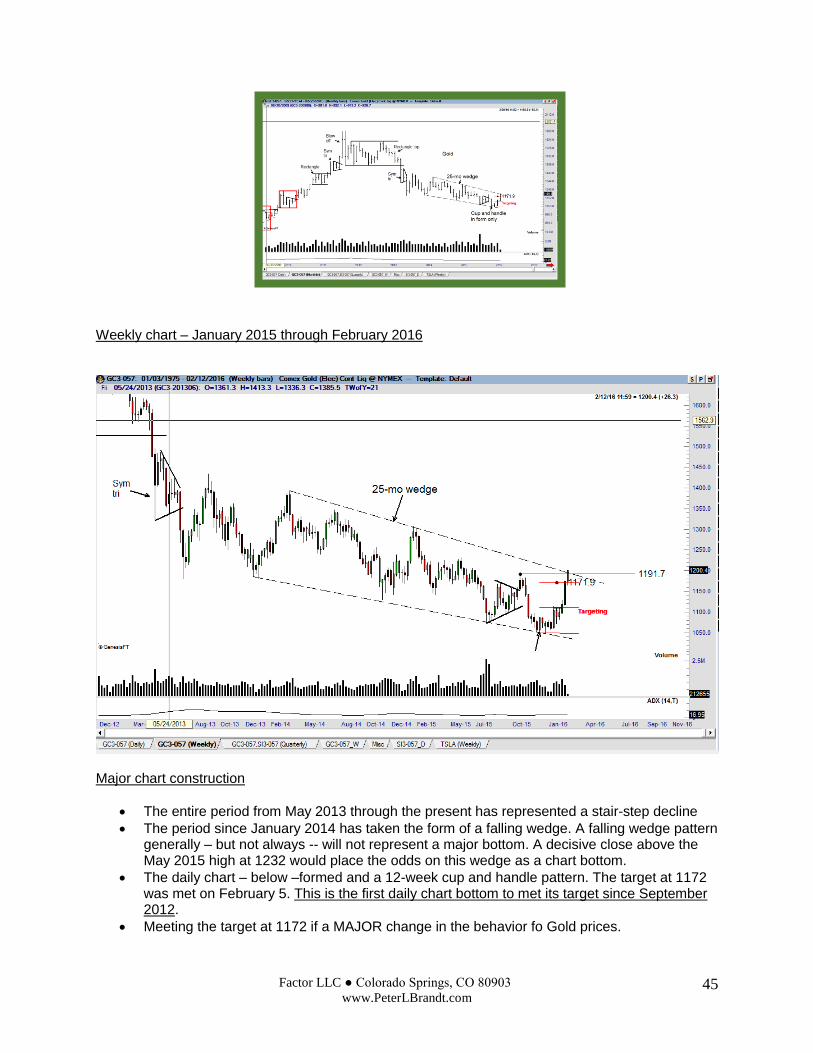
Weekly chart – January 2015 through February 2016
Major chart construction
The entire period from May 2013 through the present has represented a stair-step decline
The period since January 2014 has taken the form of a falling wedge. A falling wedge pattern generally – but not always -- will not represent a major bottom. A decisive close above the May 2015 high at 1232 would place the odds on this wedge as a chart bottom.
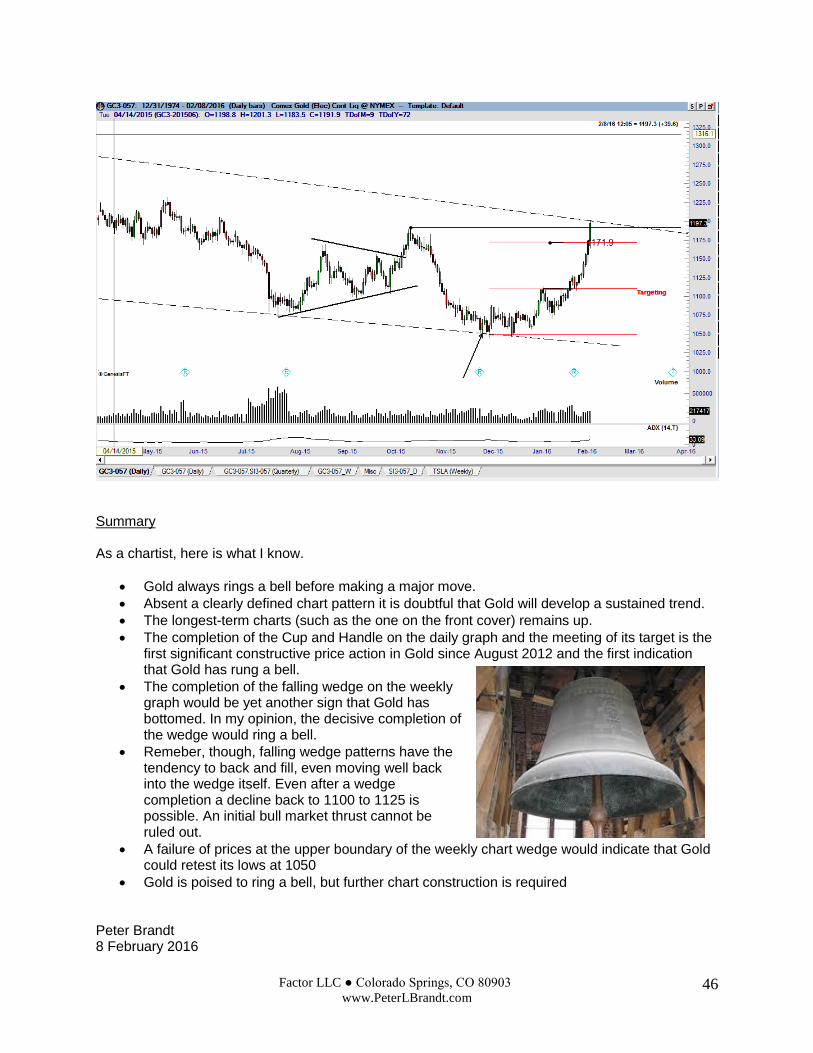
The daily chart – below –formed and a 12-week cup and handle pattern. The target at 1172 was met on February 5. This is the first daily chart bottom to met its target since September 2012.
Meeting the target at 1172 if a MAJOR change in the behavior fo Gold prices.
Factor LLC ● Colorado Springs, CO 80903
www.PeterLBrandt.com 46
Summary As a chartist, here is what I know.
Gold always rings a bell before making a major move.
Absent a clearly defined chart pattern it is doubtful that Gold will develop a sustained trend.
The longest-term charts (such as the one on the front cover) remains up.
The completion of the Cup and Handle on the daily graph and the meeting of its target is the first significant constructive price action in Gold since August 2012 and the first indication that Gold has rung a bell.
The completion of the falling wedge on the weekly graph would be yet another sign that Gold has bottomed. In my opinion, the decisive completion of the wedge would ring a bell.
Remeber, though, falling wedge patterns have the tendency to back and fill, even moving well back into the wedge itself. Even after a wedge completion a decline back to 1100 to 1125 is possible. An initial bull market thrust cannot be ruled out.
A failure of prices at the upper boundary of the weekly chart wedge would indicate that Gold could retest its lows at 1050
Gold is poised to ring a bell, but further chart construction is required Peter Brandt 8 February 2016


