24
The The HIV/AIDS HIV/AIDS Epidemic Epidemic © 2000 John B. Pryor © 2000 John B. Pryor Illinois State University Illinois State University
| Date post: | 21-Dec-2015 |
| Category: |
Documents |
| View: | 224 times |
| Download: | 4 times |

The The HIV/AIDS HIV/AIDS EpidemicEpidemic
© 2000 John B. Pryor© 2000 John B. Pryor
Illinois State UniversityIllinois State University

AIDS - AIDS - AAcquired cquired IImmune mmune DDeficiency eficiency SSyndromeyndrome
HIV - HIV - HHuman uman
IImmunodeficiencymmunodeficiency VVirusirus
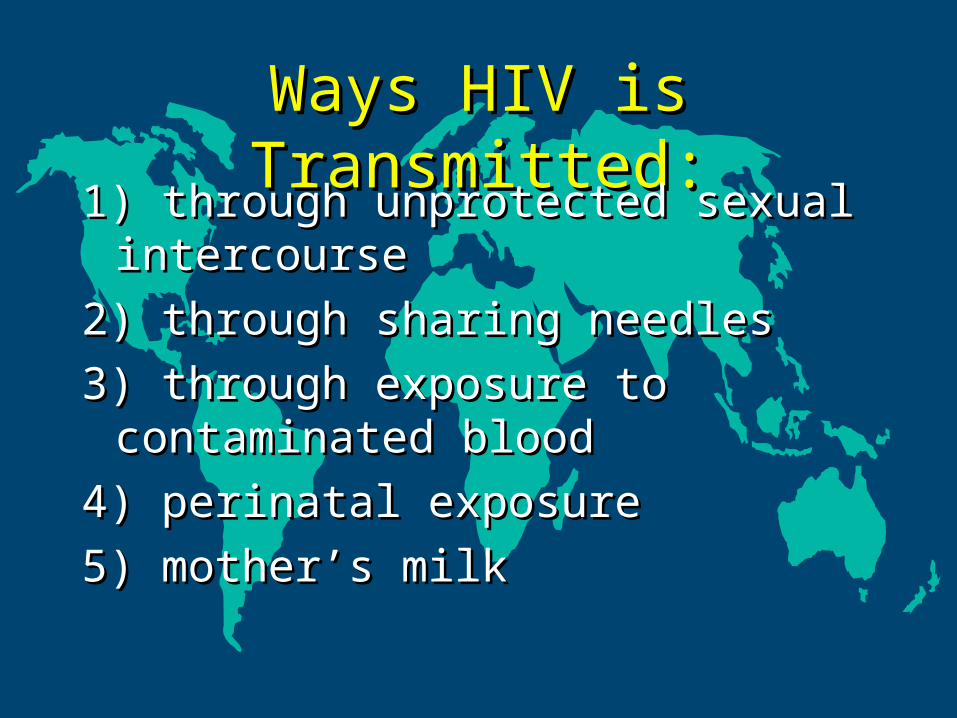
Ways HIV is Transmitted:Ways HIV is Transmitted:1) through unprotected sexual intercourse1) through unprotected sexual intercourse
2) through sharing needles2) through sharing needles
3) through exposure to contaminated 3) through exposure to contaminated bloodblood
4) perinatal exposure4) perinatal exposure
5) mother’s milk5) mother’s milk
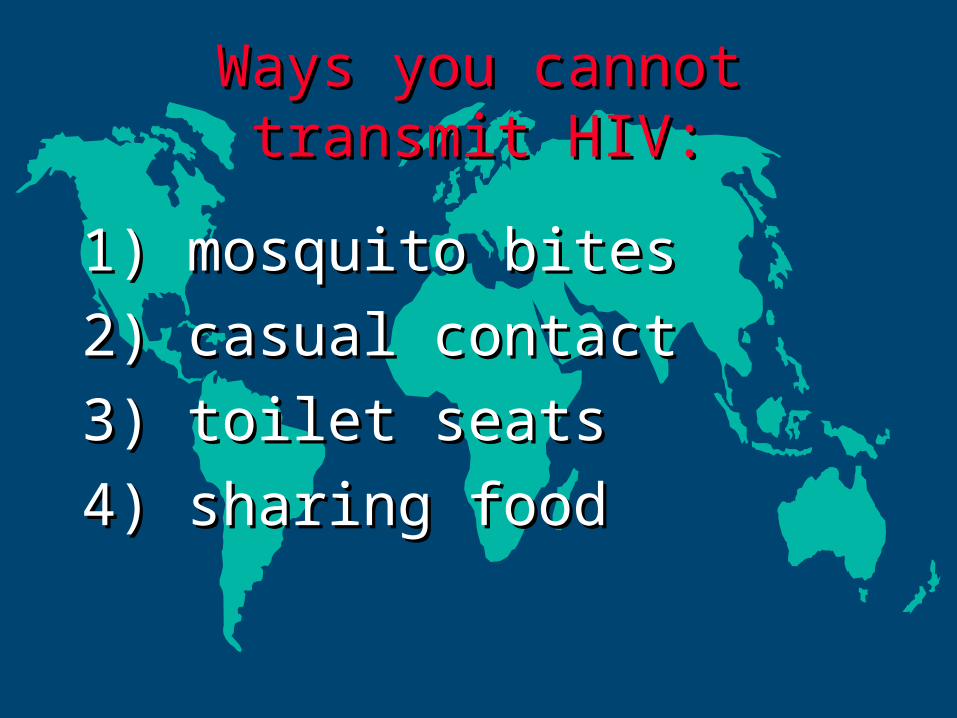
Ways you cannot transmit HIV:Ways you cannot transmit HIV:
1) mosquito bites1) mosquito bites
2) casual contact2) casual contact
3) toilet seats3) toilet seats
4) sharing food4) sharing food

Natural History of HIV/AIDSNatural History of HIV/AIDS
HIVHIVInfectionInfection
3-6 Weeks3-6 Weeks
Acute Acute HIVHIVSyndromeSyndrome
6 Months6 Months
PositivePositiveHIV TestHIV Test
9.8 Years9.8 Years 14.8 Years14.8 Years
ClinicalClinicalAIDSAIDS DeathDeath
May be extended by May be extended by new drug therapiesnew drug therapies
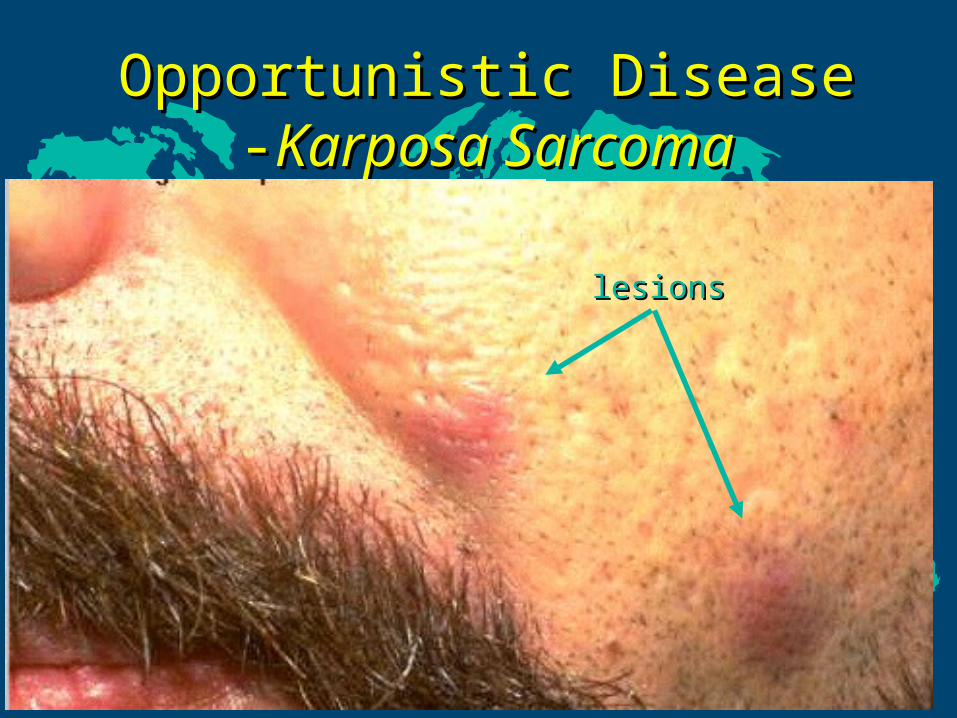
Opportunistic Disease -Opportunistic Disease -Karposa SarcomaKarposa Sarcoma
lesionslesions

HIV/AIDSHIV/AIDSGlobal TrendsGlobal Trends

GlobalGlobal AIDS epidemic AIDS epidemic 19901990−−2003 2003
0
10
20
30
40
50
1990 1991 1992 1993 1994 1995 1996 1997 1998 1999 2000 2001 2002 2003
Mill
ions
Number of people living with HIV and AIDS
0.0
1.0
2.0
3.0
4.0
5.0
Year
% HIVprevalence adult (15-49)
Source: UNAIDS/WHO, 2004
Number of people living with HIV and AIDS
% HIV prevalence, adult (15-49)
2004 Report on the Global AIDS Epidemic (Fig 1)

Adult prevalence %
15.0% − 39.0%5.0% − 15.0%1.0% − 5.0%0.5% − 1.0%0.1% − 0.5%0.0% − 0.1%not available
HIV prevalence in adults, end 2003HIV prevalence in adults, end 2003
38 million people [range: 35-42 million] living with HIV as of end 2003
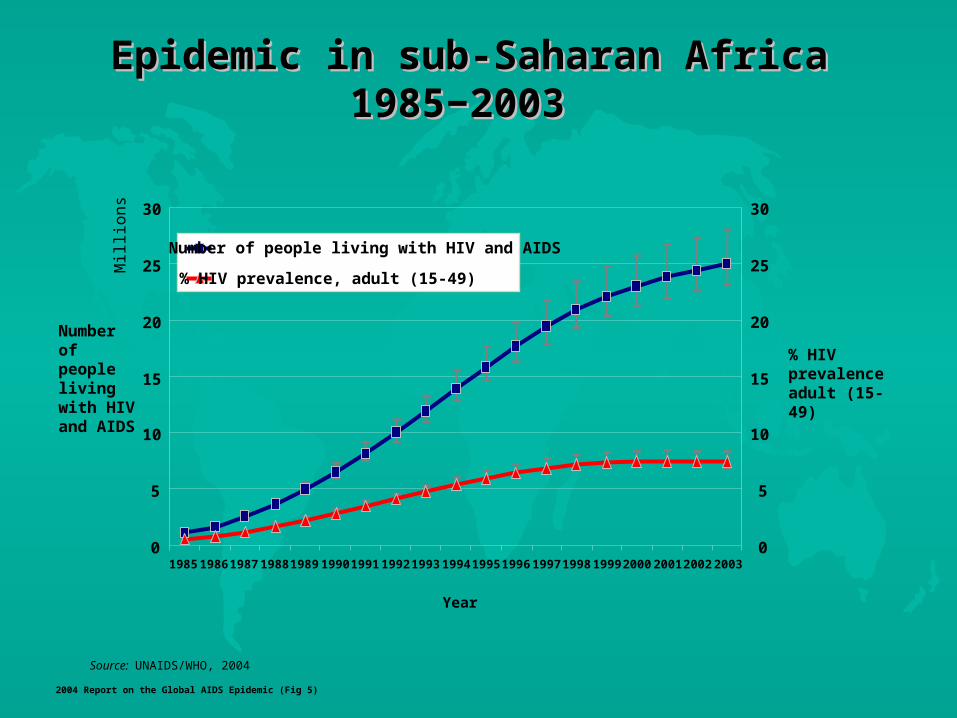
Epidemic in sub-Saharan Africa Epidemic in sub-Saharan Africa 19851985−−2003 2003
0
5
10
15
20
25
30
1985198619871988198919901991199219931994199519961997199819992000200120022003
Mill
ions
Number of people living with HIV and AIDS
0
5
10
15
20
25
30
% HIVprevalence adult (15-49)
Number of people living with HIV and AIDS
% HIV prevalence, adult (15-49)
Year
Source: UNAIDS/WHO, 2004
2004 Report on the Global AIDS Epidemic (Fig 5)

North Africa & Middle East1%
High-income countries2%
Latin America & Caribbean7%
Eastern Europe & Central Asia6%
Asia22%
Sub-Saharan Africa62 %
Total: 10 million
Source: UNAIDS/UNICEF/WHO, 2004
Young people (15−24 years old) living Young people (15−24 years old) living with HIV,with HIV,
by region, end 2003 by region, end 2003
2004 Report on the Global AIDS Epidemic (Fig 30)

400,000 people on treatment: 7% coverage
0
10
20
30
40
50
60
%
Source: UNAIDS/WHO, 2004
Antiretroviral therapy coverage for Antiretroviral therapy coverage for adults, adults,
end 2003 end 2003
Africa Asia Latin America and the Caribbean
Eastern Europe and Central Asia
North Africa and Middle East
2004 Report on the Global AIDS Epidemic (Fig 33)
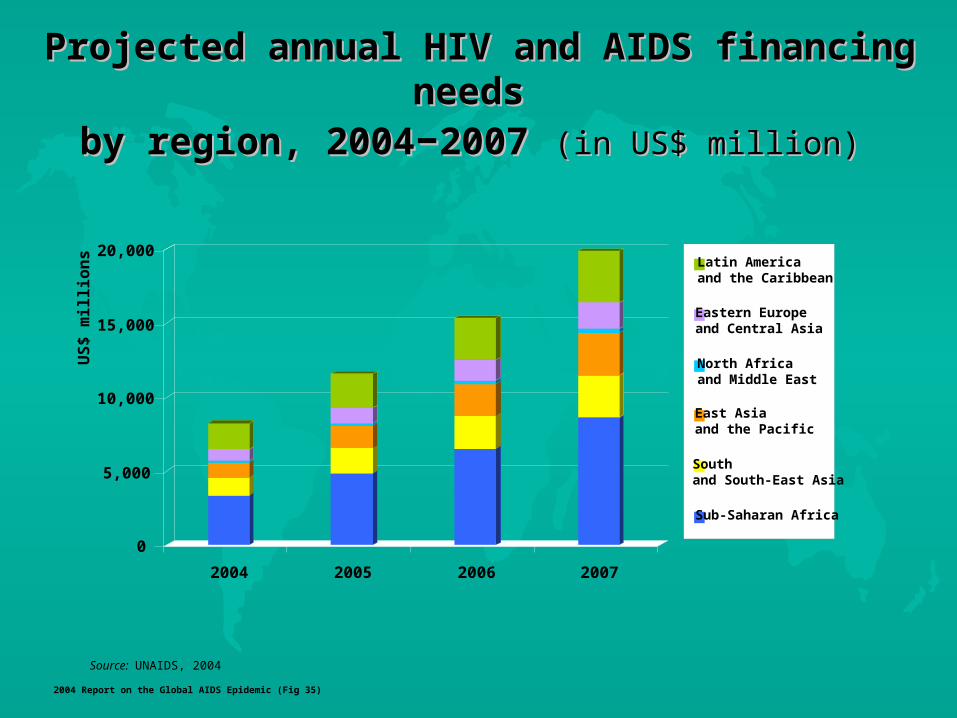
0
5,000
10,000
15,000
20,000
2004 2005 2006 2007
Latin America and the Caribbean
Eastern Europe and Central Asia
North Africa and Middle East
East Asia and the Pacific
South and South-East Asia
Sub-Saharan Africa
Source: UNAIDS, 2004
Projected annual HIV and AIDS financing Projected annual HIV and AIDS financing needs needs
by region, 2004by region, 2004−−20072007 (in US$ million) (in US$ million)
US
$ m
illion
s
2004 Report on the Global AIDS Epidemic (Fig 35)
HIV/AIDSHIV/AIDSGlobal TrendsGlobal Trends
in Childrenin Children

0
1
2
3
4
5
Central Africa
Eastern Africa
Southern Africa
Western Africa
Number of orphans(millions)
REGIONS
Orphans per region Orphans per region within sub-Saharan Africa, within sub-Saharan Africa,
end 2003end 2003
Source: UNAIDS, 2004
2004 Report on the Global AIDS Epidemic (Fig 15)

Growing role of grandparents Growing role of grandparents Relationships of double orphans and single orphans Relationships of double orphans and single orphans
(not living with surviving parent) to head of household, Namibia, (not living with surviving parent) to head of household, Namibia, 1992 and 20001992 and 2000
2000
Grandchild 61%
Adopted/foster-child 5%
Not related 6%
Son/daughter-in-law 3%
Brother/sister 4%
OtherRelative21%
1992
Adopted/foster-child 1%
Not related 11%
Son/daughter-in-law 3%
Brother/sister 2%
Source: UNICEF-MICS, Measure DHS, 1992 and 2000.
Grandchild 44%
OtherRelative39%
2004 Report on the Global AIDS Epidemic (Fig 16)

HIV/AIDSHIV/AIDSTrends in Trends in
AfricaAfrica

Spread of HIV in sub-Saharan Africa, 1987Spread of HIV in sub-Saharan Africa, 1987
Estimated percentage of Estimated percentage of adults adults
(15–49) infected with HIV(15–49) infected with HIV
Estimated percentage of Estimated percentage of adults adults
(15–49) infected with HIV(15–49) infected with HIV 16.0% – 32.0%16.0% – 32.0%
8.0% – 16.0%8.0% – 16.0%
2.0% – 8.0%2.0% – 8.0%
0.5% – 2.0%0.5% – 2.0%
0% – 0.5%0% – 0.5%
trend data trend data
unavailableunavailable
outside regionoutside region
16.0% – 32.0%16.0% – 32.0%
8.0% – 16.0%8.0% – 16.0%
2.0% – 8.0%2.0% – 8.0%
0.5% – 2.0%0.5% – 2.0%
0% – 0.5%0% – 0.5%
trend data trend data
unavailableunavailable
outside regionoutside region World HealthOrganizationWorld HealthOrganization UNAIDS–Addis–May 1999UNAIDS–Addis–May 1999

Spread of HIV in sub-Saharan Africa, 1997Spread of HIV in sub-Saharan Africa, 1997
Estimated percentage of Estimated percentage of adults adults
(15–49) infected with HIV(15–49) infected with HIV
Estimated percentage of Estimated percentage of adults adults
(15–49) infected with HIV(15–49) infected with HIV 16.0% – 32.0%16.0% – 32.0%
8.0% – 16.0%8.0% – 16.0%
2.0% – 8.0%2.0% – 8.0%
0.5% – 2.0%0.5% – 2.0%
0% – 0.5%0% – 0.5%
trend data trend data
unavailableunavailable
outside regionoutside region
16.0% – 32.0%16.0% – 32.0%
8.0% – 16.0%8.0% – 16.0%
2.0% – 8.0%2.0% – 8.0%
0.5% – 2.0%0.5% – 2.0%
0% – 0.5%0% – 0.5%
trend data trend data
unavailableunavailable
outside regionoutside region World HealthOrganizationWorld HealthOrganization UNAIDS–Addis–May 1999UNAIDS–Addis–May 1999

Life expectancy at birth in selected most Life expectancy at birth in selected most affected countries, 1980affected countries, 1980−−1985 to 1985 to
20052005−−20102010
Source: UN Population Division, World Population Prospects: the 2002 Revision
2004 Report on the Global AIDS Epidemic (Fig 12)
20
30
40
50
60
70
1980-1985 1985-1990 1990-1995 1995-2000 2000-2005 2005-2010
Years
Botswana
South Africa
Swaziland
Zambia
Zimbabwe
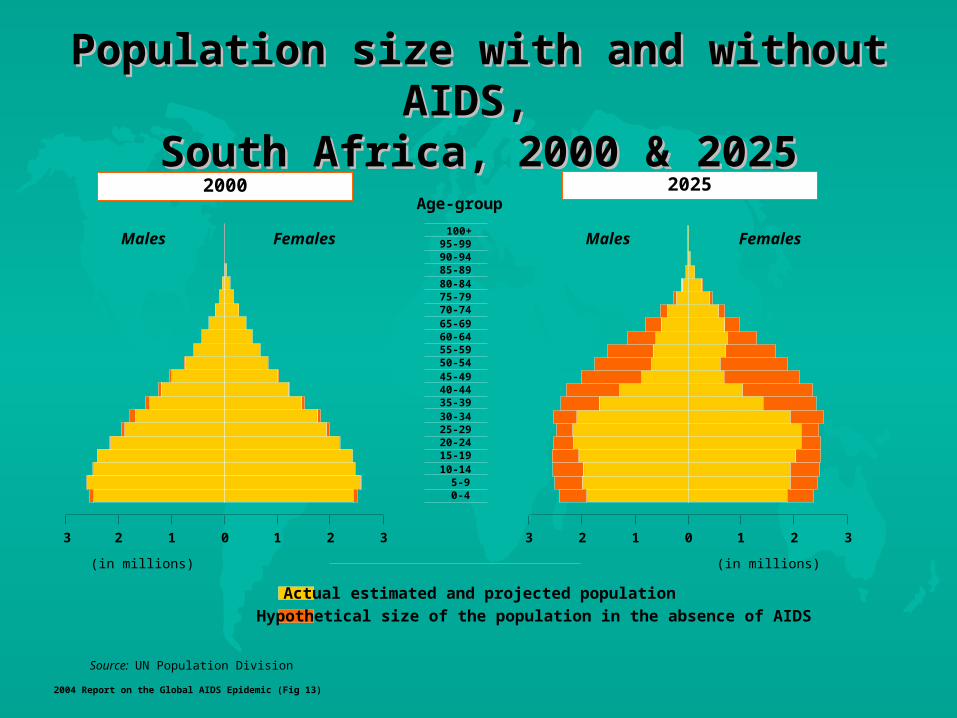
Population size with and without AIDS, Population size with and without AIDS, South Africa, 2000 & 2025South Africa, 2000 & 2025
Source: UN Population Division
0
Males Females
2000 2025
0-45-9
10-1415-1920-2425-2930-3435-3940-4445-4950-5455-5960-6465-6970-7475-7980-8485-8990-9495-99100+
03 2 1 1 2 3 3 2 1 1 2 3
Males Females
Age-group
Hypothetical size of the population in the absence of AIDSActual estimated and projected population
2004 Report on the Global AIDS Epidemic (Fig 13)
(in millions) (in millions)

HIV/AIDSHIV/AIDSTrends Trends
inin

Newly diagnosed HIV infections per million Newly diagnosed HIV infections per million population population
in Eastern European and Central Asian in Eastern European and Central Asian countries, countries, 1996—20031996—2003
Source: (1) HIV /AIDS Surveillance in Europe, EuroHIV mid-year report 2003, no. 69. (2) AIDS Foundation East West
0
200
400
600
800
1,000
1,200
1993 1994 1995 1996 1997 1998 1999 2000 2001 2002 2003
New HIV infection
per million population
EstoniaRussian Federation
UkraineBelarus
Moldova, Republic of
Latvia
KazakhstanUzbekistanKyrgyzstan
2004 Report on the Global AIDS Epidemic (Fig 9)

0.0 0.0 0.00.1 0.2
0.4
1.6
3.4
4.24.3
0.0
1.0
2.0
3.0
4.0
5.0
1994 1995 1996 1997 1998 1999 2000 2001 2002 2003
%
Number of HIV+ inmates 7 13 239 1,460 2,319 4,100 15,100 33,000 36,850 36,000
Number of inmates 929,000 1,018,0001,048,0001,018,3001,014,5001,060,400 925,100 980,200 877,400 830,400
HIV-positive inmates in the penal system HIV-positive inmates in the penal system of the Ministry of Justice in the Russian Federation, of the Ministry of Justice in the Russian Federation,
1994 through 2003 1994 through 2003
Source: Based on GUIN (Department of Penalty Execution) data - Main Directorate of Corrections of the Ministry of Justice
2004 Report on the Global AIDS Epidemic (Fig 23)


