http://hol.sagepub.com/ The Holocene http://hol.sagepub.com/content/early/2014/08/08/0959683614540958 The online version of this article can be found at: DOI: 10.1177/0959683614540958 published online 8 August 2014 The Holocene Fang Tian, Ulrike Herzschuh, Steffen Mischke and Frank Schlütz activity? Climate change or human - What drives the recent intensified vegetation degradation in Mongolia Published by: http://www.sagepublications.com can be found at: The Holocene Additional services and information for http://hol.sagepub.com/cgi/alerts Email Alerts: http://hol.sagepub.com/subscriptions Subscriptions: http://www.sagepub.com/journalsReprints.nav Reprints: http://www.sagepub.com/journalsPermissions.nav Permissions: http://hol.sagepub.com/content/early/2014/08/08/0959683614540958.refs.html Citations: What is This? - Aug 8, 2014 OnlineFirst Version of Record >> at Alfred Wegener Institute on August 28, 2014 hol.sagepub.com Downloaded from at Alfred Wegener Institute on August 28, 2014 hol.sagepub.com Downloaded from
Transcript
http://hol.sagepub.com/The Holocene
http://hol.sagepub.com/content/early/2014/08/08/0959683614540958The online version of this article can be found at:
DOI: 10.1177/0959683614540958
published online 8 August 2014The HoloceneFang Tian, Ulrike Herzschuh, Steffen Mischke and Frank Schlütz
activity? Climate change or human−What drives the recent intensified vegetation degradation in Mongolia
Published by:
http://www.sagepublications.com
can be found at:The HoloceneAdditional services and information for
at Alfred Wegener Institute on August 28, 2014hol.sagepub.comDownloaded from at Alfred Wegener Institute on August 28, 2014hol.sagepub.comDownloaded from
IntroductionMongolia’s seemingly endless green steppes are presumed to represent a cultural landscape formed by nomadic herders thou-sands of years ago (Lehmkuhl et al., 2011; Miehe et al., 2007; Rösch et al., 2005) with very few exceptions (Schlütz et al., 2008). However, the type and intensity of land use changed strongly in the course of the 20th century, particularly when Mongolia was transforming from a centrally planned to market economy in the early 1990s. On one hand, livestock privatization and market factors have given herders a strong incentive to keep more livestock and therefore stimulated the growth of livestock populations, and on the other hand, large amounts of cropland have been abandoned from cultivation (Wang et al., 2013). Previ-ous investigations have shown that about 70–80% of Mongolian pastures suffered from degradation of varying intensity (Batkh-ishig, 2011; Buren, 2011), as a result not only from overgrazing but also from the establishment and subsequent abandonment of cropland (Hirano and Batbileg, 2013; Wang et al., 2013). How-ever, other studies suggest that large-scale desertification is caused mainly by recent climate change (Batjargal, 1997; Hoshino et al., 2009; Liu et al., 2013). Indeed, because of its intermediate location, Mongolia can be expected to be highly vulnerable to climate change (Gomboluudev and Natsagdorj, 2004) as it is placed in the transition zone between the Siberian taiga and the central Asian deserts and between the monsoon-dominated southeastern Asia and the westerly dominated Sibe-ria. Hence, there remain open questions as to what extent the
vegetation cover has changed in recent decades and what is the main driving force.
Long-term monitoring studies that reflect the environmental change in the course of the 20th century in Mongolia are lacking. Lake records may therefore represent the most suitable archive for investigating past environmental conditions, and they have been successfully used for similar studies in Mongolia but focus-ing on changes at millennial (Felauer et al., 2012; Wang et al., 2009) and centennial time-scales (Tian et al., 2013). Studies from Central Asia demonstrate that pollen analyses of sediment cores from small and shallow dryland lakes are suitable for tracking short-term vegetation changes (Herzschuh et al., 2006; Zhao et al., 2008). Furthermore, modern pollen assemblages from Mongolia are found to be indicative of grassland systems that
What drives the recent intensified vegetation degradation in Mongolia – Climate change or human activity?
Fang Tian,1,2 Ulrike Herzschuh,1,2 Steffen Mischke2,3 and Frank Schlütz4
AbstractThis study examines the course and driving forces of recent vegetation change in the Mongolian steppe. A sediment core covering the last 55 years from a small closed-basin lake in central Mongolia was analyzed for its multi-proxy record at annual resolution. Pollen analysis shows that highest abundances of planted Poaceae and highest vegetation diversity occurred during 1977–1992, reflecting agricultural development in the lake area. A decrease in diversity and an increase in Artemisia abundance after 1992 indicate enhanced vegetation degradation in recent times, most probably because of overgrazing and farmland abandonment. Human impact is the main factor for the vegetation degradation within the past decades as revealed by a series of redundancy analyses, while climate change and soil erosion play subordinate roles. High Pediastrum (a green algae) influx, high atomic total organic carbon/total nitrogen (TOC/TN) ratios, abundant coarse detrital grains, and the decrease of δ13Corg and δ15N since about 1977 but particularly after 1992 indicate that abundant terrestrial organic matter and nutrients were transported into the lake and caused lake eutrophication, presumably because of intensified land use. Thus, we infer that the transition to a market economy in Mongolia since the early 1990s not only caused dramatic vegetation degradation but also affected the lake ecosystem through anthropogenic changes in the catchment area.
Keywordscentral Mongolia, grain size, human impact, lake eutrophication, pollen, vegetation degradation
Received 8 January 2014; revised manuscript accepted 12 May 2014
1Alfred Wegener Institute, Helmholtz Centre for Polar and Marine Research, Germany2University of Potsdam, Germany3Free University of Berlin, Germany4Lower Saxony Institute for Historical Coastal Research, Germany
Corresponding author:Fang Tian, Research Unit Potsdam, Alfred Wegener Institute, Helmholtz Centre for Polar and Marine Research, Telegrafenberg A43, Potsdam 14473, Germany. Email: [email protected]; [email protected]
540958 HOL0010.1177/0959683614540958The HoloceneTian et al.research-article2014
Research paper
at Alfred Wegener Institute on August 28, 2014hol.sagepub.comDownloaded from
result from varying types and intensity of human impact (Ma et al., 2008). Hence, it should be possible to investigate the tem-poral evolution of grassland degradation by high-resolution pol-len analysis of lake sediments which may additionally contain proxies for simultaneously occurring limnological changes.
In this study, we investigate the pollen assemblage, non-pollen palynomorphs (NPPs), grain size, carbon and nitrogen element concentrations, and stable isotope record for a short sediment core from a small lake (Lake Mo-33B, working name) in central Mon-golia. Our objectives are (1) to infer vegetation change since the mid-20th century; (2) to quantify the main drivers of vegetation variability: that is, human impact, climate, soil erosion; and (3) to detect the relationship between vegetation and lake-ecosystem change.
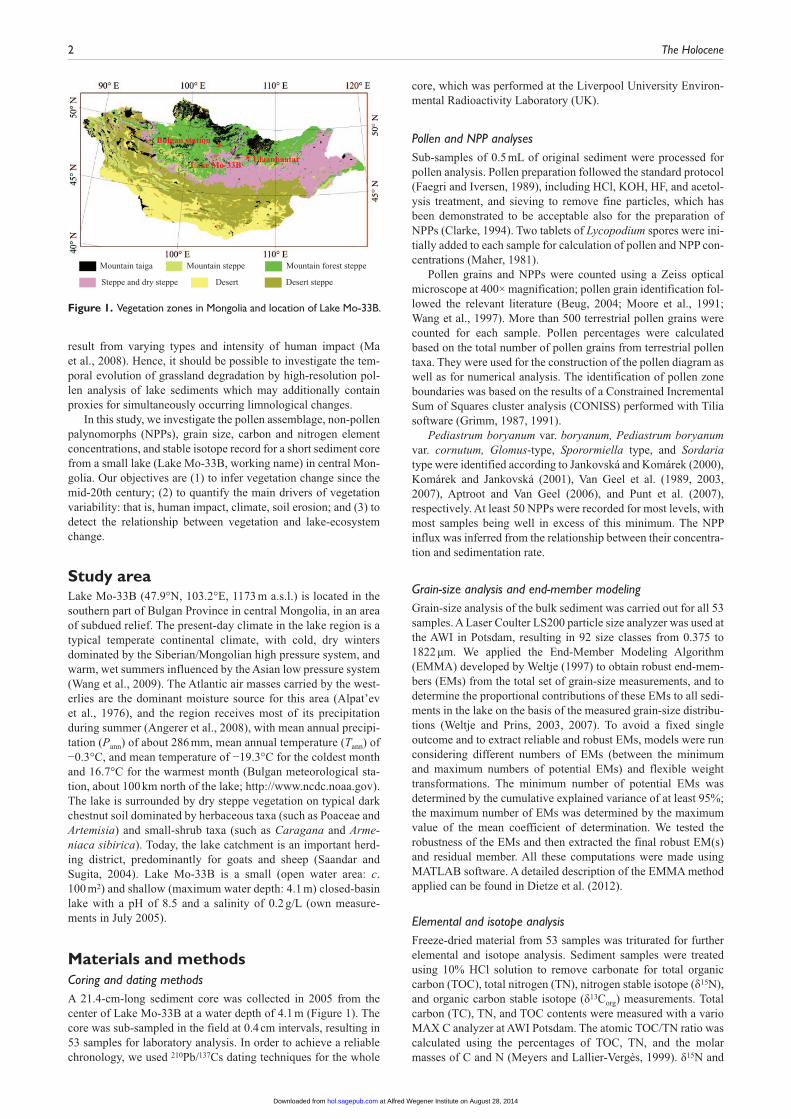
Study areaLake Mo-33B (47.9°N, 103.2°E, 1173 m a.s.l.) is located in the southern part of Bulgan Province in central Mongolia, in an area of subdued relief. The present-day climate in the lake region is a typical temperate continental climate, with cold, dry winters dominated by the Siberian/Mongolian high pressure system, and warm, wet summers influenced by the Asian low pressure system (Wang et al., 2009). The Atlantic air masses carried by the west-erlies are the dominant moisture source for this area (Alpat’ev et al., 1976), and the region receives most of its precipitation during summer (Angerer et al., 2008), with mean annual precipi-tation (Pann) of about 286 mm, mean annual temperature (Tann) of −0.3°C, and mean temperature of −19.3°C for the coldest month and 16.7°C for the warmest month (Bulgan meteorological sta-tion, about 100 km north of the lake; http://www.ncdc.noaa.gov). The lake is surrounded by dry steppe vegetation on typical dark chestnut soil dominated by herbaceous taxa (such as Poaceae and Artemisia) and small-shrub taxa (such as Caragana and Arme-niaca sibirica). Today, the lake catchment is an important herd-ing district, predominantly for goats and sheep (Saandar and Sugita, 2004). Lake Mo-33B is a small (open water area: c. 100 m2) and shallow (maximum water depth: 4.1 m) closed-basin lake with a pH of 8.5 and a salinity of 0.2 g/L (own measure-ments in July 2005).
Materials and methodsCoring and dating methodsA 21.4-cm-long sediment core was collected in 2005 from the center of Lake Mo-33B at a water depth of 4.1 m (Figure 1). The core was sub-sampled in the field at 0.4 cm intervals, resulting in 53 samples for laboratory analysis. In order to achieve a reliable chronology, we used 210Pb/137Cs dating techniques for the whole
core, which was performed at the Liverpool University Environ-mental Radioactivity Laboratory (UK).
Pollen and NPP analysesSub-samples of 0.5 mL of original sediment were processed for pollen analysis. Pollen preparation followed the standard protocol (Faegri and Iversen, 1989), including HCl, KOH, HF, and acetol-ysis treatment, and sieving to remove fine particles, which has been demonstrated to be acceptable also for the preparation of NPPs (Clarke, 1994). Two tablets of Lycopodium spores were ini-tially added to each sample for calculation of pollen and NPP con-centrations (Maher, 1981).
Pollen grains and NPPs were counted using a Zeiss optical microscope at 400× magnification; pollen grain identification fol-lowed the relevant literature (Beug, 2004; Moore et al., 1991; Wang et al., 1997). More than 500 terrestrial pollen grains were counted for each sample. Pollen percentages were calculated based on the total number of pollen grains from terrestrial pollen taxa. They were used for the construction of the pollen diagram as well as for numerical analysis. The identification of pollen zone boundaries was based on the results of a Constrained Incremental Sum of Squares cluster analysis (CONISS) performed with Tilia software (Grimm, 1987, 1991).
Pediastrum boryanum var. boryanum, Pediastrum boryanum var. cornutum, Glomus-type, Sporormiella type, and Sordaria type were identified according to Jankovská and Komárek (2000), Komárek and Jankovská (2001), Van Geel et al. (1989, 2003, 2007), Aptroot and Van Geel (2006), and Punt et al. (2007), respectively. At least 50 NPPs were recorded for most levels, with most samples being well in excess of this minimum. The NPP influx was inferred from the relationship between their concentra-tion and sedimentation rate.
Grain-size analysis and end-member modelingGrain-size analysis of the bulk sediment was carried out for all 53 samples. A Laser Coulter LS200 particle size analyzer was used at the AWI in Potsdam, resulting in 92 size classes from 0.375 to 1822 µm. We applied the End-Member Modeling Algorithm (EMMA) developed by Weltje (1997) to obtain robust end-mem-bers (EMs) from the total set of grain-size measurements, and to determine the proportional contributions of these EMs to all sedi-ments in the lake on the basis of the measured grain-size distribu-tions (Weltje and Prins, 2003, 2007). To avoid a fixed single outcome and to extract reliable and robust EMs, models were run considering different numbers of EMs (between the minimum and maximum numbers of potential EMs) and flexible weight transformations. The minimum number of potential EMs was determined by the cumulative explained variance of at least 95%; the maximum number of EMs was determined by the maximum value of the mean coefficient of determination. We tested the robustness of the EMs and then extracted the final robust EM(s) and residual member. All these computations were made using MATLAB software. A detailed description of the EMMA method applied can be found in Dietze et al. (2012).
Elemental and isotope analysisFreeze-dried material from 53 samples was triturated for further elemental and isotope analysis. Sediment samples were treated using 10% HCl solution to remove carbonate for total organic carbon (TOC), total nitrogen (TN), nitrogen stable isotope (δ15N), and organic carbon stable isotope (δ13Corg) measurements. Total carbon (TC), TN, and TOC contents were measured with a vario MAX C analyzer at AWI Potsdam. The atomic TOC/TN ratio was calculated using the percentages of TOC, TN, and the molar masses of C and N (Meyers and Lallier-Vergès, 1999). δ15N and
δ13Corg were analyzed at GFZ Potsdam using Finnigan DELTA-plusXL mass spectrometer equipped with a Carlo Erba elemental analyzer and a ConFlowIII gas split system.
Numerical analysesIn order to detect the factors underlying the variations in the pol-len percentages and to identify relationships between different taxa, Principal Component Analysis (PCA) was performed using Canoco version 4.5 (ter Braak and Šmilauer, 2002). Square-roots of 23 pollen taxa (those with percentages > 0.5% in at least three samples) were used in PCA (as correlation biplot with centering of species data); pre-1960 samples were included as supplemen-tary data in the PCA. A second PCA (as correlation biplot with centering and scaling of species data) was performed for lake data (Pediastrum boryanum var. boryanum, Pediastrum borya-num var. cornutum, TOC, TN, atomic TOC/TN, δ15N, and δ13Corg). For both PCAs, Pann, Tann, EM1 scores, EM2 scores, total sown area, and livestock number were included as supple-mentary components. For the PCA of lake data, the axis-1 and axis-2 scores derived from the PCA of pollen data were included as supplementary data.
Redundancy analysis (RDA) was run for pollen data with each environmental variable separately to qualify the influence of that variable on the pollen assemblages, and with all (or groups of the) six variables together to discern how much variation in the pollen assemblage is explained by these variable groups individually and together. The six environmental variables were grouped as cli-mate variables (Pann and Tann), soil-erosion variables (EM1 and EM2), and human-impact variables (livestock number and total sown area in Bulgan; NSO: http://www.nso.mn/v3/index2.php). For each environmental group, RDA was carried out with the other two groups as covariables, and for each of the two groups, RDA was run with the third subset as covariables. From the sum of eigenvalues in these 13 RDA runs, we calculated the propor-tions of variation in pollen data explained by two or three subsets together. A series of RDAs was performed for lake data similar to that of the pollen data but with two extra variables (PCA-1 and PCA-2 sample scores obtained from pollen data) that were taken as the fourth environmental group. As the climate and human-impact variables only have data for the post-1960 period, we used only the post-1960 samples for both RDAs. Statistical signifi-cance of all the RDA models was assessed by unrestricted Monte Carlo permutations (999). Computations were made using Canoco version 4.5 (ter Braak and Šmilauer, 2002).
Taxa richness was estimated using rarefaction analysis, a method to standardize and compare taxa richness from samples with different pollen count sums (Heck et al., 1975). The inverse Simpson index was calculated to best portray diversity changes in the vegetation. These two indexes were calculated using the diversity and rarefy functions, respectively, in the vegan package version 2.0-4 (Oksanen et al., 2012) for R 2.15.0 (R Core Team, 2012) based on the original pollen counting data.
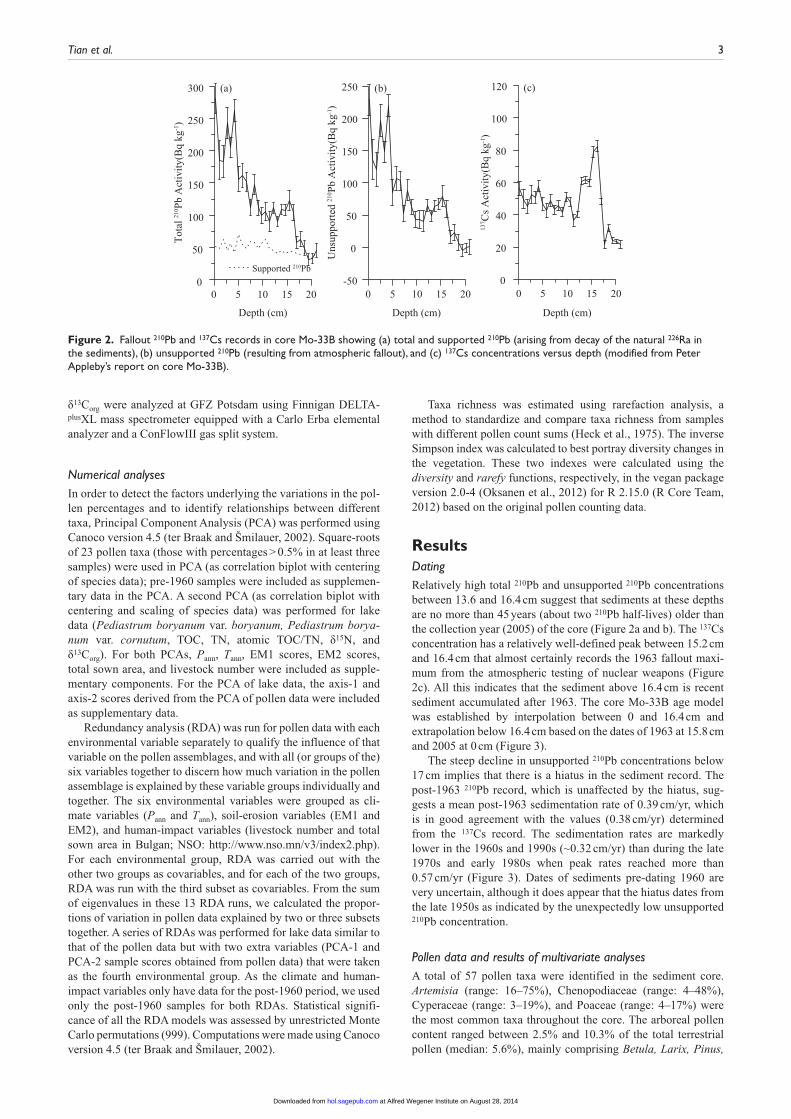
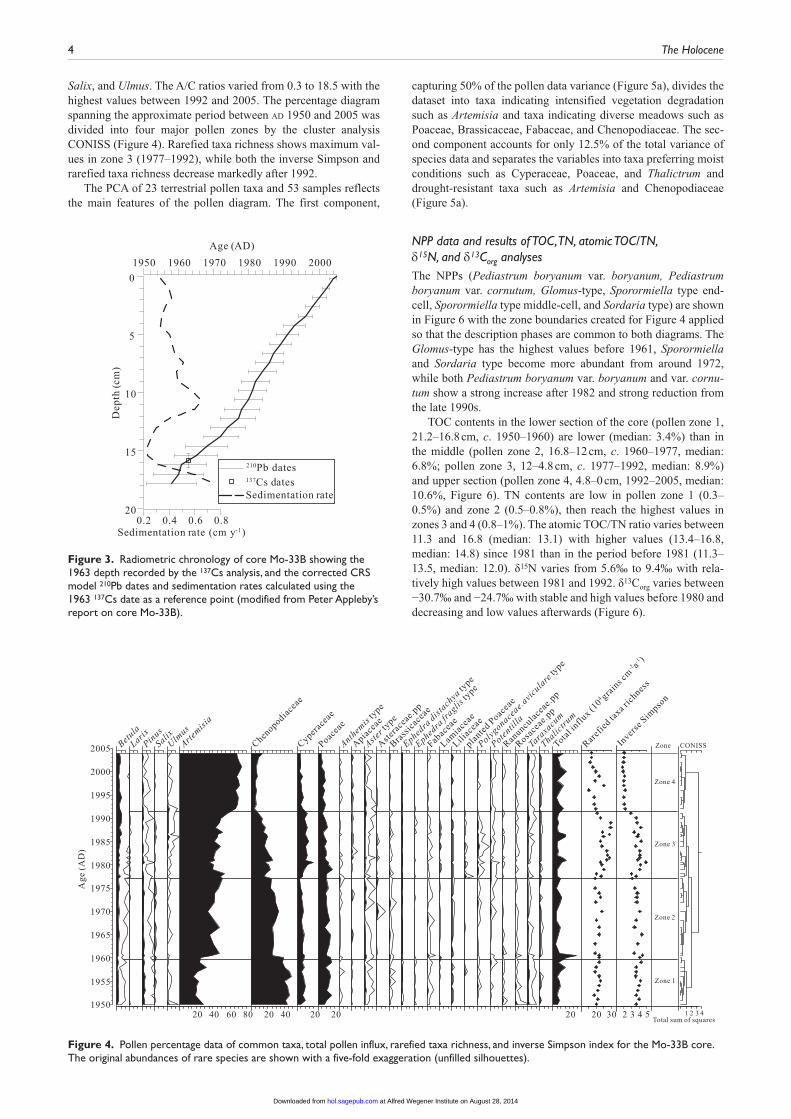
ResultsDatingRelatively high total 210Pb and unsupported 210Pb concentrations between 13.6 and 16.4 cm suggest that sediments at these depths are no more than 45 years (about two 210Pb half-lives) older than the collection year (2005) of the core (Figure 2a and b). The 137Cs concentration has a relatively well-defined peak between 15.2 cm and 16.4 cm that almost certainly records the 1963 fallout maxi-mum from the atmospheric testing of nuclear weapons (Figure 2c). All this indicates that the sediment above 16.4 cm is recent sediment accumulated after 1963. The core Mo-33B age model was established by interpolation between 0 and 16.4 cm and extrapolation below 16.4 cm based on the dates of 1963 at 15.8 cm and 2005 at 0 cm (Figure 3).
The steep decline in unsupported 210Pb concentrations below 17 cm implies that there is a hiatus in the sediment record. The post-1963 210Pb record, which is unaffected by the hiatus, sug-gests a mean post-1963 sedimentation rate of 0.39 cm/yr, which is in good agreement with the values (0.38 cm/yr) determined from the 137Cs record. The sedimentation rates are markedly lower in the 1960s and 1990s (~0.32 cm/yr) than during the late 1970s and early 1980s when peak rates reached more than 0.57 cm/yr (Figure 3). Dates of sediments pre-dating 1960 are very uncertain, although it does appear that the hiatus dates from the late 1950s as indicated by the unexpectedly low unsupported 210Pb concentration.
Pollen data and results of multivariate analysesA total of 57 pollen taxa were identified in the sediment core. Artemisia (range: 16–75%), Chenopodiaceae (range: 4–48%), Cyperaceae (range: 3–19%), and Poaceae (range: 4–17%) were the most common taxa throughout the core. The arboreal pollen content ranged between 2.5% and 10.3% of the total terrestrial pollen (median: 5.6%), mainly comprising Betula, Larix, Pinus,
0 10 15 20
Depth (cm)
0
50
100
150
200
250
300
Tot
al 21
0 Pb
Act
ivit
y(B
q kg
-1)
Uns
uppo
rted
210 P
b A
ctiv
ity(
Bq
kg-1)
Supported 210Pb
(a)
0 10 15 20-50
0
50
100
150
200
250 (b)
0 105 15 200
20
40
60
80
100
120
137 C
s A
ctiv
ity(
Bq
kg-1)
(c)
Depth (cm) Depth (cm)
55
Figure 2. Fallout 210Pb and 137Cs records in core Mo-33B showing (a) total and supported 210Pb (arising from decay of the natural 226Ra in the sediments), (b) unsupported 210Pb (resulting from atmospheric fallout), and (c) 137Cs concentrations versus depth (modified from Peter Appleby’s report on core Mo-33B).
at Alfred Wegener Institute on August 28, 2014hol.sagepub.comDownloaded from
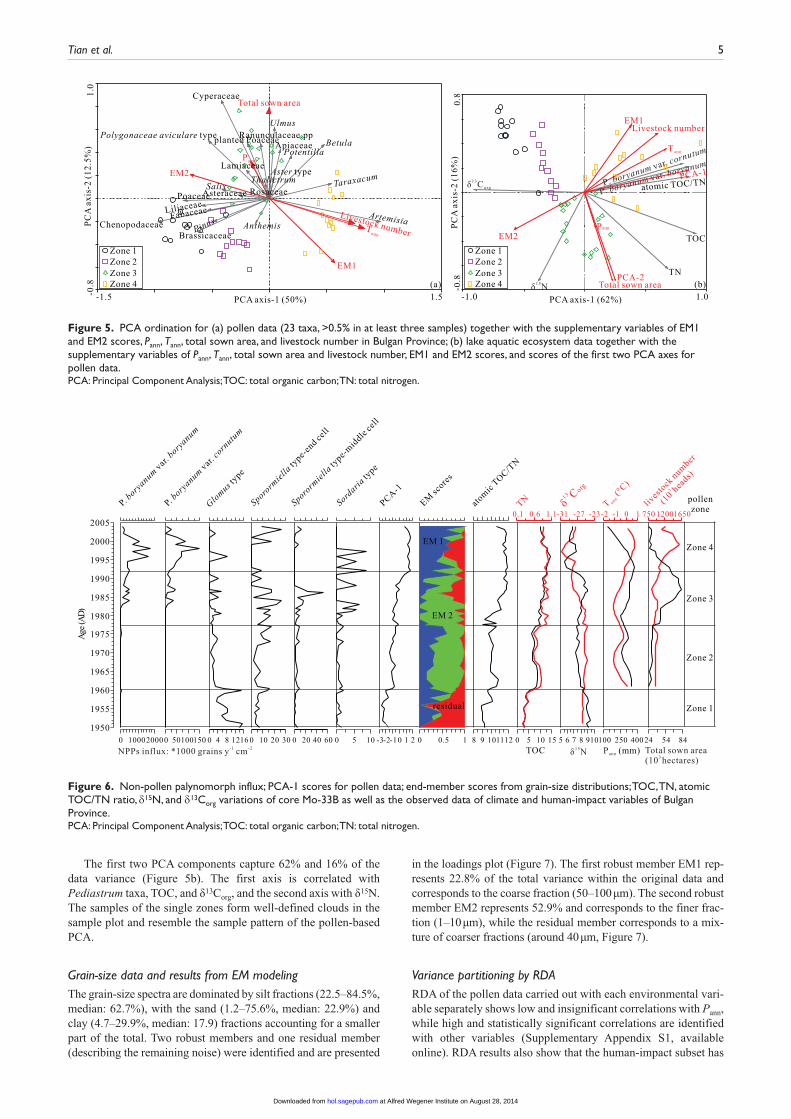
Salix, and Ulmus. The A/C ratios varied from 0.3 to 18.5 with the highest values between 1992 and 2005. The percentage diagram spanning the approximate period between ad 1950 and 2005 was divided into four major pollen zones by the cluster analysis CONISS (Figure 4). Rarefied taxa richness shows maximum val-ues in zone 3 (1977–1992), while both the inverse Simpson and rarefied taxa richness decrease markedly after 1992.
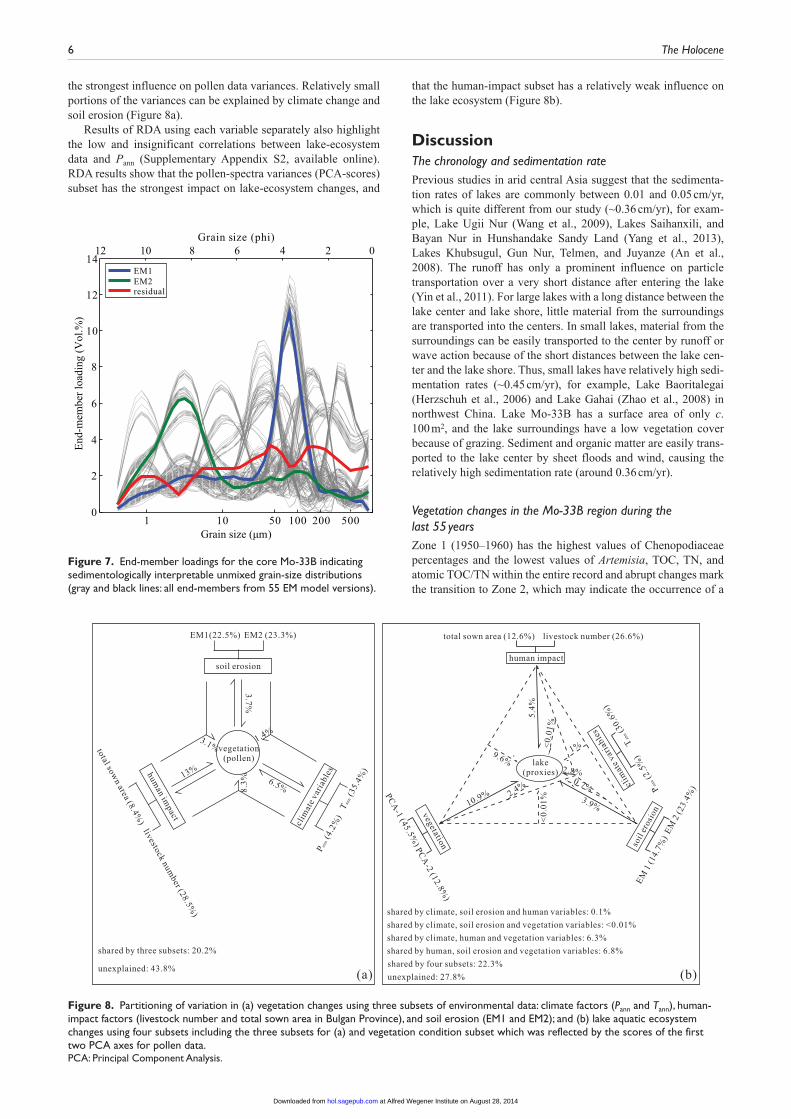
The PCA of 23 terrestrial pollen taxa and 53 samples reflects the main features of the pollen diagram. The first component,
capturing 50% of the pollen data variance (Figure 5a), divides the dataset into taxa indicating intensified vegetation degradation such as Artemisia and taxa indicating diverse meadows such as Poaceae, Brassicaceae, Fabaceae, and Chenopodiaceae. The sec-ond component accounts for only 12.5% of the total variance of species data and separates the variables into taxa preferring moist conditions such as Cyperaceae, Poaceae, and Thalictrum and drought-resistant taxa such as Artemisia and Chenopodiaceae (Figure 5a).
NPP data and results of TOC, TN, atomic TOC/TN, δ15N, and δ13Corg analysesThe NPPs (Pediastrum boryanum var. boryanum, Pediastrum boryanum var. cornutum, Glomus-type, Sporormiella type end-cell, Sporormiella type middle-cell, and Sordaria type) are shown in Figure 6 with the zone boundaries created for Figure 4 applied so that the description phases are common to both diagrams. The Glomus-type has the highest values before 1961, Sporormiella and Sordaria type become more abundant from around 1972, while both Pediastrum boryanum var. boryanum and var. cornu-tum show a strong increase after 1982 and strong reduction from the late 1990s.
TOC contents in the lower section of the core (pollen zone 1, 21.2–16.8 cm, c. 1950–1960) are lower (median: 3.4%) than in the middle (pollen zone 2, 16.8–12 cm, c. 1960–1977, median: 6.8%; pollen zone 3, 12–4.8 cm, c. 1977–1992, median: 8.9%) and upper section (pollen zone 4, 4.8–0 cm, 1992–2005, median: 10.6%, Figure 6). TN contents are low in pollen zone 1 (0.3–0.5%) and zone 2 (0.5–0.8%), then reach the highest values in zones 3 and 4 (0.8–1%). The atomic TOC/TN ratio varies between 11.3 and 16.8 (median: 13.1) with higher values (13.4–16.8, median: 14.8) since 1981 than in the period before 1981 (11.3–13.5, median: 12.0). δ15N varies from 5.6‰ to 9.4‰ with rela-tively high values between 1981 and 1992. δ13Corg varies between −30.7‰ and −24.7‰ with stable and high values before 1980 and decreasing and low values afterwards (Figure 6).
1950 1960 1970 1980 1990 2000
Age (AD)
20
15
10
5
0
0.2 0.4 0.6 0.8Sedimentation rate (cm y-1)
Dep
th (
cm)
210Pb dates137Cs datesSedimentation rate
Figure 3. Radiometric chronology of core Mo-33B showing the 1963 depth recorded by the 137Cs analysis, and the corrected CRS model 210Pb dates and sedimentation rates calculated using the 1963 137Cs date as a reference point (modified from Peter Appleby’s report on core Mo-33B).
Ephedra
dist
achya
type
Ephedra
fraglis
type
Polygonace
ae.avi
cula
rety
pe
Ulmus
Chenopodia
ceae
Cyperac
eae
Poacea
e
Apiace
ae
Astera
ceae
.pp
Brass
icac
eae
Fabac
eae
Lamia
ceae
Liliac
eae
lante
d Poacea
e
p Ranuncu
lace
ae.p
p
Rosace
ae.p
p
Tara
xacu
m
Thalictru
m
2005
2000
1995
1990
1985
1980
1975
1970
1965
1960
1955
1950
Age
(A
D)
Betula
LarixPin
us
Salix
20 40 60 80
Artemisi
a
20 40 20 20
type
Anthem
is
Aster ty
pe
Potentil
la
Zone
Zone 4
Zone 3
Zone 2
Zone 1
1 2 3 4Total sum of squares
CONISSInver
se S
impso
n
aref
ied ta
xa ric
hness
RTotal i
nflux (1
04 gra
ins c
m-2 a-
1 )
20 20 30 2 3 4 5
Figure 4. Pollen percentage data of common taxa, total pollen influx, rarefied taxa richness, and inverse Simpson index for the Mo-33B core. The original abundances of rare species are shown with a five-fold exaggeration (unfilled silhouettes).
at Alfred Wegener Institute on August 28, 2014hol.sagepub.comDownloaded from
The first two PCA components capture 62% and 16% of the data variance (Figure 5b). The first axis is correlated with Pediastrum taxa, TOC, and δ13Corg, and the second axis with δ15N. The samples of the single zones form well-defined clouds in the sample plot and resemble the sample pattern of the pollen-based PCA.
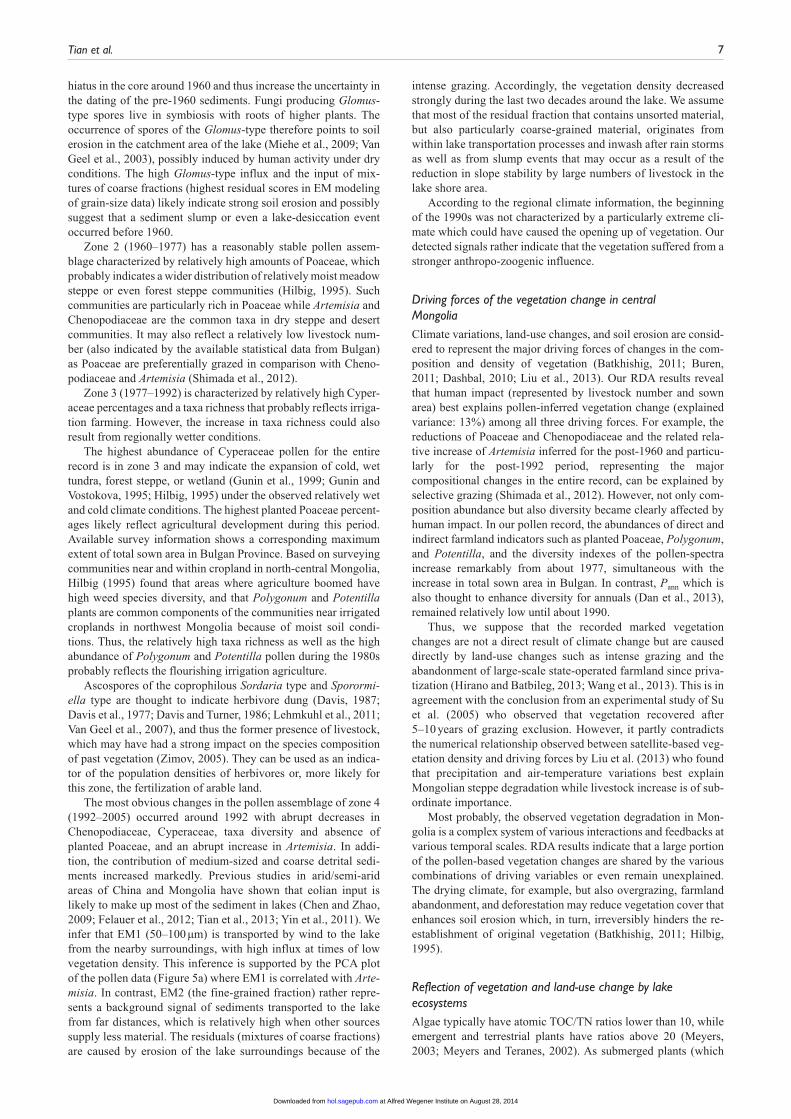
Grain-size data and results from EM modelingThe grain-size spectra are dominated by silt fractions (22.5–84.5%, median: 62.7%), with the sand (1.2–75.6%, median: 22.9%) and clay (4.7–29.9%, median: 17.9) fractions accounting for a smaller part of the total. Two robust members and one residual member (describing the remaining noise) were identified and are presented
in the loadings plot (Figure 7). The first robust member EM1 rep-resents 22.8% of the total variance within the original data and corresponds to the coarse fraction (50–100 µm). The second robust member EM2 represents 52.9% and corresponds to the finer frac-tion (1–10 µm), while the residual member corresponds to a mix-ture of coarser fractions (around 40 µm, Figure 7).
Variance partitioning by RDARDA of the pollen data carried out with each environmental vari-able separately shows low and insignificant correlations with Pann, while high and statistically significant correlations are identified with other variables (Supplementary Appendix S1, available online). RDA results also show that the human-impact subset has
Figure 5. PCA ordination for (a) pollen data (23 taxa, >0.5% in at least three samples) together with the supplementary variables of EM1 and EM2 scores, Pann, Tann, total sown area, and livestock number in Bulgan Province; (b) lake aquatic ecosystem data together with the supplementary variables of Pann, Tann, total sown area and livestock number, EM1 and EM2 scores, and scores of the first two PCA axes for pollen data.PCA: Principal Component Analysis; TOC: total organic carbon; TN: total nitrogen.
Figure 6. Non-pollen palynomorph influx; PCA-1 scores for pollen data; end-member scores from grain-size distributions; TOC, TN, atomic TOC/TN ratio, δ15N, and δ13Corg variations of core Mo-33B as well as the observed data of climate and human-impact variables of Bulgan Province.PCA: Principal Component Analysis; TOC: total organic carbon; TN: total nitrogen.
at Alfred Wegener Institute on August 28, 2014hol.sagepub.comDownloaded from
the strongest influence on pollen data variances. Relatively small portions of the variances can be explained by climate change and soil erosion (Figure 8a).
Results of RDA using each variable separately also highlight the low and insignificant correlations between lake-ecosystem data and Pann (Supplementary Appendix S2, available online). RDA results show that the pollen-spectra variances (PCA-scores) subset has the strongest impact on lake-ecosystem changes, and
that the human-impact subset has a relatively weak influence on the lake ecosystem (Figure 8b).
DiscussionThe chronology and sedimentation ratePrevious studies in arid central Asia suggest that the sedimenta-tion rates of lakes are commonly between 0.01 and 0.05 cm/yr, which is quite different from our study (~0.36 cm/yr), for exam-ple, Lake Ugii Nur (Wang et al., 2009), Lakes Saihanxili, and Bayan Nur in Hunshandake Sandy Land (Yang et al., 2013), Lakes Khubsugul, Gun Nur, Telmen, and Juyanze (An et al., 2008). The runoff has only a prominent influence on particle transportation over a very short distance after entering the lake (Yin et al., 2011). For large lakes with a long distance between the lake center and lake shore, little material from the surroundings are transported into the centers. In small lakes, material from the surroundings can be easily transported to the center by runoff or wave action because of the short distances between the lake cen-ter and the lake shore. Thus, small lakes have relatively high sedi-mentation rates (~0.45 cm/yr), for example, Lake Baoritalegai (Herzschuh et al., 2006) and Lake Gahai (Zhao et al., 2008) in northwest China. Lake Mo-33B has a surface area of only c. 100 m2, and the lake surroundings have a low vegetation cover because of grazing. Sediment and organic matter are easily trans-ported to the lake center by sheet floods and wind, causing the relatively high sedimentation rate (around 0.36 cm/yr).
Vegetation changes in the Mo-33B region during the last 55 yearsZone 1 (1950–1960) has the highest values of Chenopodiaceae percentages and the lowest values of Artemisia, TOC, TN, and atomic TOC/TN within the entire record and abrupt changes mark the transition to Zone 2, which may indicate the occurrence of a
0
2
4
6
8
10
12
14
Grain size (phi)12 10 8 6 4 2 0
Grain size (µm)501 10 100 200 500
End
-mem
ber
load
ing
(Vol
.%)
EM1EM2residual
Figure 7. End-member loadings for the core Mo-33B indicating sedimentologically interpretable unmixed grain-size distributions (gray and black lines: all end-members from 55 EM model versions).
vegetation(pollen)
soil erosion
clim
ate
vari
able
shuman
impact
3.7%
8.3%
13%
1.4%3.1%
6.5%
P(4
.2%
)
ann
T(3
5.4%
)
ann
total sown area (8.4%
)livestock
number (28.5%
)
EM1(22.5%) EM2 (23.3%)
unexplained: 43.8%
shared by three subsets: 20.2%
(a)
human impact
lake(proxies)
vegetation soil
eros
ion
10.9% 3.9%
5.4%
2.8%0.7%
<0.
01%
2.4%
1%9.6%
<0.
01%PC
A-1 (45.5%
)PC
A-2 (12.8%
)
total sown area (12.6%) livestock number (26.6%)E
M 1
(14.
7%)
EM
2 (2
3.4%
)
clim
ate
vari
able
s
P(2
.5%
)
ann
T(3
0.6%
)
ann
unexplained: 27.8%
shared by four subsets: 22.3%
shared by climate, soil erosion and human variables: 0.1%
shared by climate, soil erosion and vegetation variables: <0.01%
shared by climate, human and vegetation variables: 6.3%
shared by human, soil erosion and vegetation variables: 6.8%
(b)
Figure 8. Partitioning of variation in (a) vegetation changes using three subsets of environmental data: climate factors (Pann and Tann), human-impact factors (livestock number and total sown area in Bulgan Province), and soil erosion (EM1 and EM2); and (b) lake aquatic ecosystem changes using four subsets including the three subsets for (a) and vegetation condition subset which was reflected by the scores of the first two PCA axes for pollen data.PCA: Principal Component Analysis.
at Alfred Wegener Institute on August 28, 2014hol.sagepub.comDownloaded from
hiatus in the core around 1960 and thus increase the uncertainty in the dating of the pre-1960 sediments. Fungi producing Glomus-type spores live in symbiosis with roots of higher plants. The occurrence of spores of the Glomus-type therefore points to soil erosion in the catchment area of the lake (Miehe et al., 2009; Van Geel et al., 2003), possibly induced by human activity under dry conditions. The high Glomus-type influx and the input of mix-tures of coarse fractions (highest residual scores in EM modeling of grain-size data) likely indicate strong soil erosion and possibly suggest that a sediment slump or even a lake-desiccation event occurred before 1960.
Zone 2 (1960–1977) has a reasonably stable pollen assem-blage characterized by relatively high amounts of Poaceae, which probably indicates a wider distribution of relatively moist meadow steppe or even forest steppe communities (Hilbig, 1995). Such communities are particularly rich in Poaceae while Artemisia and Chenopodiaceae are the common taxa in dry steppe and desert communities. It may also reflect a relatively low livestock num-ber (also indicated by the available statistical data from Bulgan) as Poaceae are preferentially grazed in comparison with Cheno-podiaceae and Artemisia (Shimada et al., 2012).
Zone 3 (1977–1992) is characterized by relatively high Cyper-aceae percentages and a taxa richness that probably reflects irriga-tion farming. However, the increase in taxa richness could also result from regionally wetter conditions.
The highest abundance of Cyperaceae pollen for the entire record is in zone 3 and may indicate the expansion of cold, wet tundra, forest steppe, or wetland (Gunin et al., 1999; Gunin and Vostokova, 1995; Hilbig, 1995) under the observed relatively wet and cold climate conditions. The highest planted Poaceae percent-ages likely reflect agricultural development during this period. Available survey information shows a corresponding maximum extent of total sown area in Bulgan Province. Based on surveying communities near and within cropland in north-central Mongolia, Hilbig (1995) found that areas where agriculture boomed have high weed species diversity, and that Polygonum and Potentilla plants are common components of the communities near irrigated croplands in northwest Mongolia because of moist soil condi-tions. Thus, the relatively high taxa richness as well as the high abundance of Polygonum and Potentilla pollen during the 1980s probably reflects the flourishing irrigation agriculture.
Ascospores of the coprophilous Sordaria type and Sporormi-ella type are thought to indicate herbivore dung (Davis, 1987; Davis et al., 1977; Davis and Turner, 1986; Lehmkuhl et al., 2011; Van Geel et al., 2007), and thus the former presence of livestock, which may have had a strong impact on the species composition of past vegetation (Zimov, 2005). They can be used as an indica-tor of the population densities of herbivores or, more likely for this zone, the fertilization of arable land.
The most obvious changes in the pollen assemblage of zone 4 (1992–2005) occurred around 1992 with abrupt decreases in Chenopodiaceae, Cyperaceae, taxa diversity and absence of planted Poaceae, and an abrupt increase in Artemisia. In addi-tion, the contribution of medium-sized and coarse detrital sedi-ments increased markedly. Previous studies in arid/semi-arid areas of China and Mongolia have shown that eolian input is likely to make up most of the sediment in lakes (Chen and Zhao, 2009; Felauer et al., 2012; Tian et al., 2013; Yin et al., 2011). We infer that EM1 (50–100 µm) is transported by wind to the lake from the nearby surroundings, with high influx at times of low vegetation density. This inference is supported by the PCA plot of the pollen data (Figure 5a) where EM1 is correlated with Arte-misia. In contrast, EM2 (the fine-grained fraction) rather repre-sents a background signal of sediments transported to the lake from far distances, which is relatively high when other sources supply less material. The residuals (mixtures of coarse fractions) are caused by erosion of the lake surroundings because of the
intense grazing. Accordingly, the vegetation density decreased strongly during the last two decades around the lake. We assume that most of the residual fraction that contains unsorted material, but also particularly coarse-grained material, originates from within lake transportation processes and inwash after rain storms as well as from slump events that may occur as a result of the reduction in slope stability by large numbers of livestock in the lake shore area.
According to the regional climate information, the beginning of the 1990s was not characterized by a particularly extreme cli-mate which could have caused the opening up of vegetation. Our detected signals rather indicate that the vegetation suffered from a stronger anthropo-zoogenic influence.
Driving forces of the vegetation change in central MongoliaClimate variations, land-use changes, and soil erosion are consid-ered to represent the major driving forces of changes in the com-position and density of vegetation (Batkhishig, 2011; Buren, 2011; Dashbal, 2010; Liu et al., 2013). Our RDA results reveal that human impact (represented by livestock number and sown area) best explains pollen-inferred vegetation change (explained variance: 13%) among all three driving forces. For example, the reductions of Poaceae and Chenopodiaceae and the related rela-tive increase of Artemisia inferred for the post-1960 and particu-larly for the post-1992 period, representing the major compositional changes in the entire record, can be explained by selective grazing (Shimada et al., 2012). However, not only com-position abundance but also diversity became clearly affected by human impact. In our pollen record, the abundances of direct and indirect farmland indicators such as planted Poaceae, Polygonum, and Potentilla, and the diversity indexes of the pollen-spectra increase remarkably from about 1977, simultaneous with the increase in total sown area in Bulgan. In contrast, Pann which is also thought to enhance diversity for annuals (Dan et al., 2013), remained relatively low until about 1990.
Thus, we suppose that the recorded marked vegetation changes are not a direct result of climate change but are caused directly by land-use changes such as intense grazing and the abandonment of large-scale state-operated farmland since priva-tization (Hirano and Batbileg, 2013; Wang et al., 2013). This is in agreement with the conclusion from an experimental study of Su et al. (2005) who observed that vegetation recovered after 5–10 years of grazing exclusion. However, it partly contradicts the numerical relationship observed between satellite-based veg-etation density and driving forces by Liu et al. (2013) who found that precipitation and air-temperature variations best explain Mongolian steppe degradation while livestock increase is of sub-ordinate importance.
Most probably, the observed vegetation degradation in Mon-golia is a complex system of various interactions and feedbacks at various temporal scales. RDA results indicate that a large portion of the pollen-based vegetation changes are shared by the various combinations of driving variables or even remain unexplained. The drying climate, for example, but also overgrazing, farmland abandonment, and deforestation may reduce vegetation cover that enhances soil erosion which, in turn, irreversibly hinders the re-establishment of original vegetation (Batkhishig, 2011; Hilbig, 1995).
Reflection of vegetation and land-use change by lake ecosystemsAlgae typically have atomic TOC/TN ratios lower than 10, while emergent and terrestrial plants have ratios above 20 (Meyers, 2003; Meyers and Teranes, 2002). As submerged plants (which
at Alfred Wegener Institute on August 28, 2014hol.sagepub.comDownloaded from
have TOC/TN ratios in between) were lacking in the modern lake, we assume that our observed values between 10 and 20 are a rough measure for the ratio between allochthonous and autoch-thonous sources of organic matter. As atomic TOC/TN is nega-tively correlated with δ13Corg in our record, we assume that it likewise represents a source signal, which agrees with the finding that terrestrial plants from northeast China commonly have more depleted δ13Corg values (−28.5‰) than aquatic plants (average −24.9‰; Hong et al., 2001; Parplies et al., 2008). Carbon isotope discrimination related to algae productivity may be of minor importance as, in contrast to assumed higher δ13Corg values during periods of high productivity, the δ13Corg values are rather low at times of high Pediastrum abundance (Li et al., 2008). Accord-ingly, we infer a stepwise increase in terrestrial matter input, probably as a result of increased erosion from degraded vegeta-tion in the lake catchment.
Various factors can affect δ15N of lake sediments. It can be related to the different nitrogen sources as well with terrestrially derived organic matter having lower δ15N values than organic matter of aquatic origin (Pang and Nriagu, 1977). However, the nitrogen isotope signal in our case is probably controlled by changes in the nitrogen source of algae that have high values when nitrogen originates from waste water and livestock (Heaton, 1986). We consider that the high δ15N values during the 1980s originate from the fertilization of cropland as it corresponds tem-porally with the planted Poaceae curve and highest diversity in the pollen record and to the statistical information about sown area in Bulgan. Increased farm land use since about 1977 and herding since 1992 may also have driven the eutrophication of the lake as indicated by the Pediastrum data. Pediastrum boryanum var. boryanum and var. cornutum occur in a more or less wide range of eutrophic (but not very polluted) and usually slightly alkaline freshwaters as plankton and metaphyton of lakes, ponds, and swamps (Komárek and Jankovská, 2001). Mackay et al. (2013) ascribe the increase of Pediastrum spp. influx to nutrient enrichment in the Lake Baikal region because of increases in regional farming.
A strong relationship between land-use variables, vegetation transition, and change in the aquatic environment is also sup-ported by the RDA results, indicating that human impact is the major driving force of the present-day aquatic ecosystem.
Implications for interpreting millennial-scale environmental change recordsComparisons with land-use data revealed that our pollen and non-pollen data are highly sensitive to environmental change. In contrast, pollen spectra from Lake Baikal (water area: 31,494 km2; catchment area: 560,000 km2 with 336 inflow rivers) failed to trace known agricultural activities and forest clearance in the lake surroundings during the last four centuries (Tarasov et al., 2007). Such differences in the sensitivity to land-use changes are probably related to the different extent of the pollen source areas of the two lakes (Jackson, 1990; Sugita, 1993). The sediments from Lake Mo-33B (water area: c. 100 m2, without inflow river) should reflect the local to regional vegetation within a radius of a few kilometers while Lake Baikal has a sub-continental scale rel-evant pollen source area. If only our pollen record had been available, the supra-regional land-use activity would probably be over-estimated.
Although we infer that human impact is the major driver of the vegetation changes during the last 45 years, there is still an intrin-sic link between human activity and climate conditions reflected by the high shared proportions explained. The comparison of pol-len palynomorph and NPP data with climate, land-use, and ero-sion information indicates that environmental change was caused by an ensemble of various drivers that can barely be separated
from each other when no land-use information is available. Accordingly, tracing pre-historical human impact in steppe areas of Asia might be challenging as it is concomitant with climate change and causes similar pollen signals.
ConclusionThe multi-proxy record (pollen, NPP, atomic TOC/TN, δ15N, δ13Corg, grain-size data) from a small lake in the steppe area of central Mongolia revealed that remarkable changes of both the vegetation and the lake ecosystem occurred during the last 55 years. The highest vegetation diversity, probably related to cropland establishment, occurred between 1977 and 1992, while thereafter the vegetation is characterized by low diversity and an increase of Artemisia probably as a result of increased grazing pressure. Accordingly, we assume that vegetation changes were mainly caused by human impact, including cropland cultivation and herding which explain c. 13% of total variance in the pollen spectra while climate variables and soil erosion explain only 6.5% and 3.7%, respectively. Furthermore, land use and human-induced vegetation degradation enhanced nutrient import to the lake that caused intensified lake eutrophication.
AcknowledgementsWe thank Peter Appleby (Liverpool University, UK) for dating the short core and discussions of the record, Birgit Plessen for measuring carbon and nitrogen stable isotope, and Cathy Jenks for language corrections.
FundingThe doctoral research by Fang Tian is funded by the Helmholtz–China Scholarship Council (CSC) Young Scientist Fellowship (No. 20100813030). This research was supported by the German Research Foundation (Deutsche Forschungsgemeinschaft, DFG).
ReferencesAlpat’ev AM, Arkhangel’skii AM, Podoplelov NY et al. (1976)
Fizicheskaya geografiya SSSR (Aziatskaya chast’). Moscow: Vysshaya Shkola.
An CB, Chen FH and Barton L (2008) Holocene environmen-tal changes in Mongolia: A review. Global and Planetary Change 63: 283–289.
Angerer J, Han G, Fujisaki I et al. (2008) Climate change and ecosystems of Asia with emphasis on Inner Mongolia and Mongolia. Rangelands 30: 46–51.
Aptroot A and Van Geel B (2006) Fungi of the colon of the Yuka-gir Mammoth and from stratigraphically related permafrost samples. Review of Palaeobotany and Palynology 141: 225–230.
Batjargal Z (1997) Desertification in Mongolia. RALA Report 200: 107–113.
Batkhishig O (2011) Human impact and land degradation of Mongolia. Report of a Synthesis Workshop on Dryland Eco-systems in East Asia: State, Changes, and Future. Available at: http://research.eeescience.utoledo.edu/lees/NASA06/kai-feng2011/Batkhishig061511.pdf.
Beug HJ (2004) Leitfaden der Pollenbestimmung für Mitteleu-ropa und angrenzende Gebiete. München: Verlag Dr. Fried-rich Pfeil (in German).
Buren G (2011) Research on current status, causes and prospect of desertification in Mongolia. PhD Thesis, Inner Mongolia University (in Chinese with English abstract).
Chen YF and Zhao ZZ (2009) Preliminary study on excess 210Pb flux characteristic of lake sediment in arid regions and its implication for aeolian activity. Journal of Lake Sciences 21: 813–818 (in Chinese with English Abstract).
at Alfred Wegener Institute on August 28, 2014hol.sagepub.comDownloaded from
Clarke C (1994) Differential recovery of fungal and algal paly-nomorphs versus embryophyte pollen and spores by three processing techniques. In: Davis OK (ed.) Aspects of Archae-ological Palynology: Methodology and Applications (Contri-butions Series 29). Baton Rouge, LA: American Association of Stratigraphic Palynologists, pp. 53–62.
Dan S, Li HJ, Ping LY et al. (2013) Effects of climate change on vegetation in desert steppe Inner Mongolia. Natural Resources 4: 319–322.
Dashbal B (2010) Rangeland degradation in Mongolia: Changes in vegetation composition and biomass, and potential effect on soil carbon. Reykjavik: UNU-Land Restoration Training Programme, 32 pp.
Davis OK (1987) Spores of the dung fungus Sporormiella: Increased abundance in historic sediments and before Pleis-tocene megafaunal extinction. Quaternary Research 28: 290–294.
Davis OK and Turner RM (1986) Palynological evidence for the historic expansion of Juniper and desert shrubs in Ari-zona, U.S.A. Review of Palaeobotany and Palynology 49: 177–193.
Davis OK, Kolva DA and Mehringer PJ (1977) Pollen analysis of Wildcat Lake, Whitman County, Washington: The last 1000 years. Northwest Science 51: 13–30.
Dietze E, Hartmann K, Diekmann B et al. (2012) An end-member algorithm for deciphering modern detrital processes from lake sediments of Lake Donggi Cona, NE Tibetan Plateau, China. Sedimentary Geology 243–244: 169–180.
Faegri K and Iversen J (1989) Textbook of Pollen Analysis. 4th Edition. London: John Wiley & Sons.
Felauer T, Schlütz F, Murad W et al. (2012) Late Quaternary climate and landscape evolution in arid Central Asia: A mul-tiproxy study of lake archive Bayan Tohomin Nuur¢, Gobi desert, southern Mongolia. Journal of Asian Earth Sciences 48: 125–135.
Gomboluudev P and Natsagdorj L (2004) The impact of deserti-fication on Mongolian climate and its numerical study using regional climate model (RegCM3). In: Proceedings of the 3rd International Workshop on Terrestrial Change in Mongolia, Tsukuba, Japan, 2004, Tsukuba: University of Tsukuba, pp. 112–113.
Grimm EC (1987) CONISS: A FORTRAN 77 program for strati-graphically constrained cluster analysis by the method of incremental sum of squares. Computers & Geosciences 13: 13–35.
Grimm EC (1991) Tilia and Tilia-Graph Software. Springfield, IL: Illinois State Museum.
Gunin PD and Vostokova EA (1995) Ecosystems of Mongolia (map). Moscow: Joint Russian–Mongolian Complex Biologi-cal Expedition with assistance from UNEP.
Gunin PD, Vostokova EA, Dorofeyuk NI et al. (1999) Vegeta-tion Dynamics of Mongolia. Dordrecht: Kluwer Academic Publishers.
Heaton THE (1986) Isotopic studies of nitrogen pollution in the hydrosphere and atmosphere: A review. Chemical Geology 59: 87–102.
Heck KL, van Belle G and Simberloff D (1975) Explicit calcula-tion of the rarefaction diversity measurement and the deter-mination of sufficient sample size. Ecology 56: 1459–1461.
Herzschuh U, Kürschner H, Battarbee R et al. (2006) Desert plant pollen production and a 160-year record of vegetation and cli-mate change on the Alashan Plateau, NW China. Vegetation History and Archaeobotany 15: 181–190.
Hilbig W (1995) The Vegetation of Mongolia. Amsterdam: SPB Academic Publishing.
Hirano A and Batbileg B (2013) Identifying trends in the distribu-tion of vegetation in Mongolia in the decade after its transition
to a market economy. Japan Agricultural Research Quarterly 47: 203–208.
Hong YT, Wang ZG, Jiang HB et al. (2001) A 6000-year record of changes in drought and precipitation in northeastern China based on a δ13C time series from peat cellulose. Earth and Planetary Science Letters 185: 111–119.
Hoshino A, Tamura K, Fujimak H et al. (2009) Effects of crop abandonment and grazing exclusion on available soil water and other soil properties in a semi-arid Mongolian grassland. Soil and Tillage Research 105: 228–235.
Jackson ST (1990) Pollen source area and representation in small lakes of the northeast United States. Review of Palaeobotany and Palynology 63: 53–76.
Jankovská V and Komárek J (2000) Indicative value of Pediastrum and other coccal green algae in palaeoecology. Folia Geobotanica 35: 59–82.
Komárek J and Jankovská V (2001) Review of the Green Algal Genus Pediastrum: Implication for Pollen-Analytical Research (Bibliotheca Phycologica vol. 108). Berlin and Stuttgart: Cramer.
Lehmkuhl F, Hilgers A, Fries S et al. (2011) Holocene geomor-phological processes and soil development as indicator for environmental change around Karakorum, Upper Orkhon Valley (Central Mongolia). Catena 87: 31–44.
Li L, Yu Z, Moeller RE et al. (2008) Complex trajectories of aquatic and terrestrial ecosystem shifts caused by multiple human-induced environmental stresses. Geochimica et Cos-mochimica Acta 72: 4338–4351.
Liu YY, Evans JP, McCabe MF et al. (2013) Changing climate and overgrazing are decimating Mongolian steppes. PLoS One 8: e57599.
Ma Y, Liu KB, Feng Z et al. (2008) A survey of modern pollen and vegetation along a south-north transect in Mongolia. Journal of Biogeography 35: 1512–1532.
Mackay AW, Bezrukova EV, Boyle JF et al. (2013) Multiproxy evidence for abrupt climate change impacts on terrestrial and freshwater ecosystems in the Ol’khon region of Lake Baikal, central Asia. Quaternary International 290–291: 46–56.
Maher LJ (1981) Statistics for microfossil concentration measure-ments employing samples spiked with marker grains. Review of Palaeobotany and Palynology 32: 153–191.
Meyers PA (2003) Applications of organic geochemistry to paleolimnological reconstructions: A summary of examples from the Laurentian Great Lakes. Organic Geochemistry 34: 261–289.
Meyers PA and Lallier-Vergès E (1999) Lacustrine sedimentary organic matter records of late Quaternary paleoclimates. Journal of Paleolimnology 21: 345–372.
Meyers PA and Teranes JL (2002) Sediment organic matter. In: Last WM and Smol JP (eds) Tracking Environmental Change Using Lake Sediments: Physical and Geochemical Methods, vol. 2. Dordrecht: Kluwer Academic Publishers, pp. 239–269.
Miehe G, Miehe S, Kaiser K et al. (2009) How old is pastoralism in Tibet? An ecological approach to the making of a Tibetan landscape. Palaeogeography, Palaeoclimatology, Palaeo-ecology 276: 130–147.
Miehe G, Schlütz F, Miehe S et al. (2007) Mountain forest islands and Holocene environmental changes in Central Asia: A case study from the southern Gobi Altay, Mongolia. Palaeogeog-raphy, Palaeoclimatology, Palaeoecology 250: 150–166.
Moore PD, Webb JA and Collinson ME (1991) Pollen Analysis. 2nd Edition. Oxford: Blackwell Science.
Oksanen J, Blanchet FG, Kindt R et al. (2012) vegan: Community Ecology Package (Version 2.0-4). Available at: http://cran.r-project.org/web/packages/vegan//index.html.
at Alfred Wegener Institute on August 28, 2014hol.sagepub.comDownloaded from
Pang PC and Nriagu JO (1977) Isotopic variations of the nitro-gen in Lake Superior. Geochimica et Cosmochimica Acta 41: 811–814.
Parplies J, Lücke A, Vos H et al. (2008) Late glacial environment and climate development in northeastern China derived from geochemical and isotopic investigations of the varved sedi-ment record from Lake Sihailongwan (Jilin Province). Jour-nal of Paleolimnology 40: 471–487.
Punt W, Hoen PP, Blackmore S et al. (2007) Glossary of pollen and spore terminology. Review of Palaeobotany and Palynol-ogy 143: 1–81.
R Core Team (2012) R: A Language and Environment for Statistical Computing. Vienna: R Foundation for Statistical Computing.
Rösch M, Fischer E and Märkle T (2005) Human diet and land use in the time of the Khans–Archaeobotanical research in the capital of the Mongolian Empire, Qara Qorum, Mongolia. Vegetation History and Archaeobotany 14: 485–492.
Saandar M and Sugita M (2004) Digital atlas of Mongolian natu-ral environments (1) vegetation, soil, ecosystem and water. In: Proceedings of the 3rd International Workshop on Ter-restrial Change in Mongolia, Tsukuba, Japan. Available at: http://www.ied.tsukuba.ac.jp/wordpress/wp-content/uploads/pdf_papers/tercbull05s/t5supple_75.pdf.
Schlütz F, Dulamsuren C, Wieckowska M et al. (2008) Late Holo-cene vegetation history suggests natural origin of steppes in the northern Mongolian mountain taiga. Palaeogeography, Palaeoclimatology, Palaeoecology 261: 203–217.
Shimada S, Matsumoto J, Sekiyama A et al. (2012) A new spectral index to detect Poaceae grass abundance in Mongolian grass-lands. Advances in Space Research 50: 1266–1273.
Su YZ, Li YL, Cui JY et al. (2005) Influences of continuous graz-ing and livestock exclusion on soil properties in a degraded sandy grassland, Inner Mongolia, northern China. Catena 59: 267–278.
Sugita S (1993) A model of pollen source area for an entire lake. Quaternary Research 39: 239–244.
Tarasov P, Bezrukova E, Karabanov E et al. (2007) Vegetation and climate dynamics during the Holocene and Eemian inter-glacials derived from Lake Baikal pollen records. Palaeo-geography, Palaeoclimatology, Palaeoecology 252: 440–457.
ter Braak CJF and Šmilauer P (2002) CANOCO Reference Man-ual and CanoDraw for Windows User’s Guide: Software for Canonical Community Ordination (Version 4.5). New York: Microcomputer Power.
Tian F, Herzschuh U, Dallmeyer A et al. (2013) High environmen-tal variability in the monsoon–westerlies transition zone dur-ing the last 1200 years: Lake sediment analyses from central
Mongolia and supra-regional synthesis. Quaternary Science Reviews 73: 31–47.
Van Geel B, Coope GR and Van Der Hammen T (1989) Palaeo-ecology and stratigraphy of the lateglacial type section at Usselo (the Netherlands). Review of Palaeobotany and Paly-nology 60: 25–129.
Van Geel B, Zazula GD and Schweger CE (2007) Spores of coprophilous fungi from under the Dawson tephra (25,300 14C years BP), Yukon Territory, northwestern Canada. Palaeo-geography, Palaeoclimatology, Palaeoecology 252: 481–485.
Van Geel B, Buurman J, Brinkkemper O et al. (2003) Environ-mental reconstruction of a Roman Period settlement site in Uitgeest (The Netherlands), with special reference to coprophilous fungi. Journal of Archaeological Science 30: 873–883.
Wang J, Brown DG and Chen J (2013) Drivers of the dynamics in net primary productivity across ecological zones on the Mon-golian Plateau. Landscape Ecology 28: 725–739.
Wang FX, Qian NF, Zhang YL et al. (1997) Pollen Flora of China. 2nd Edition. Beijing: Science Press.
Wang W, Ma YZ, Feng ZD et al. (2009) Vegetation and climate changes during the last 8660 cal. a BP in central Mongolia, based on a high-resolution pollen record from Lake Ugii Nuur. Chinese Science Bulletin 54: 1579–1589.
Weltje GJ (1997) End–member modeling of compositional data: Numerical-statistical algorithms for solving the explicit mix-ing problem. Journal of Mathematical Geology 29: 503–549.
Weltje GJ and Prins MA (2003) Muddled or mixed? Inferring pal-aeoclimate from size distributions of deep-sea clastics. Sedi-mentary Geology 162: 39–62.
Weltje GJ and Prins MA (2007) Genetically meaningful decom-position of grain-size distributions. Sedimentary Geology 202: 409–424.
Yang XP, Wang XL, Liu ZT et al. (2013) Initiation and variation of the dune fields in semi-arid China - with a special refer-ence to the Hunshandake Sandy Land, Inner Mongolia. Qua-ternary Science Reviews 78: 369–380.
Yin Y, Liu HY, He SY et al. (2011) Patterns of local and regional grain size distribution and their application to Holocene climate reconstruction in semi-arid Inner Mongolia, China. Palaeo-geography, Palaeoclimatology, Palaeoecology 307: 168–176.
Zhao Y, Yu Z, Chen F et al. (2008) Sensitive response of desert vegetation to moisture change based on a near-annual reso-lution pollen record from Gahai Lake in the Qaidam Basin, northwest China. Global and Planetary Change 62: 107–114.
Zimov SA (2005) Pleistocene Park: Return of the mammoth’s ecosystem. Science 308: 796–798.
at Alfred Wegener Institute on August 28, 2014hol.sagepub.comDownloaded from