40
THE HORTON MACHINE FOR DATA ANALYSIS TO HELP SCIENTISTS… AND NOT ONLY Andrea Antonello, Silvia Franceschi HydroloGIS - gvSIG Association 13as Jornadas Internacionales gvSIG 18-20 Oct 2017
| Date post: | 21-Jan-2018 |
| Category: |
Engineering |
| Upload: | andrea-antonello |
| View: | 65 times |
| Download: | 0 times |

THEHORTONMACHINEFORDATAANALYSISTOHELPSCIENTISTS… ANDNOTONLY
AndreaAntonello,SilviaFranceschi
HydroloGIS-gvSIGAssociation
13asJornadasInternacionalesgvSIG
18-20Oct2017

WHOAMI?cofounderof
HydroloGISismemberof
CharterMemberandGFOSSadvocate
developandcoordinate
develop and coordinate the(formerJGrasstools)
working on integration of the HortonMachine andGeopaparazziingvSIG
HydroloGIS
GvSIGAssociation
Osgeo
Geopaparazzi
HortonMachine project

THEJGRASSTOOLSLIBRARY
SupportedovertheyearsbytheUniversitiesofTrento(prof.Rigon)andBolzano(prof.Tonon),HydroloGIS

JGRASSTOOLS?HORTONMACHINE?DuetohistoricalreasonsandduetothefirstreleasesofthegvSIG plugins in the last month the JGrasstools projectdecided to go back to its original name: The HortonMachine
Itisbeyondthescopeofthispresentationtodiscussfurtheraboutit.

THEHORTONMACHINEINGVSIGMostfunctionalitiescanbeaccessedfromthemainmenu:

THESPATIALTOOLBOX

THESPATIALTOOLBOX
TheGUI Modelsaregroupedbycategories:
HortonMachine:geomorphologyanalysis
Rasterandvectorprocessing
Mobiletools:supportforGeopaparazzi(digitalfieldmapping)
LESTO:LiDAREmpoweredScienceToolboxOpenSource

HORTONMACHINEMODULESDrainage direction,total contributing area, network andwatershed extraction, rescaled distances and hydrologicattributes, slope, curvatures, hydrologic indexes andgeomorphologicattributes.

STATISTICSInterpolation of meteorological data with Kriging (rainfalland temperature) and Jami (temperature, pressure,humidityandwind).

PEAKFLOWEvaluation of the maximum discharge for a givenprecipitation(worksalsowithstatisticalinformationrainfallIntensity-DurationCurves)

SAINTVENANT&HECRASSimplified1Dhydraulicmodel: it isbasedonSaintVenantequations,isGISbased,i.e.inputandoutputareGISlayers.
Waterdepthandvelocityarecalculatedforeachsectionandlateralcontributes(inflowandouttakes)arehandled.

SHALSTABHillslopestability:Shalstab Criticalrainfall
Thestabilityconditioniscalculatedforagivenprecipitation.

DEBRISFLOWTriggering,propagationinnetworkandfinalpropagationonthefan

LESTODeveloped in collaboration with the Free University ofBolzano.Atthemomentthetoolboxismainlydedicatedtoforestryanalysis.
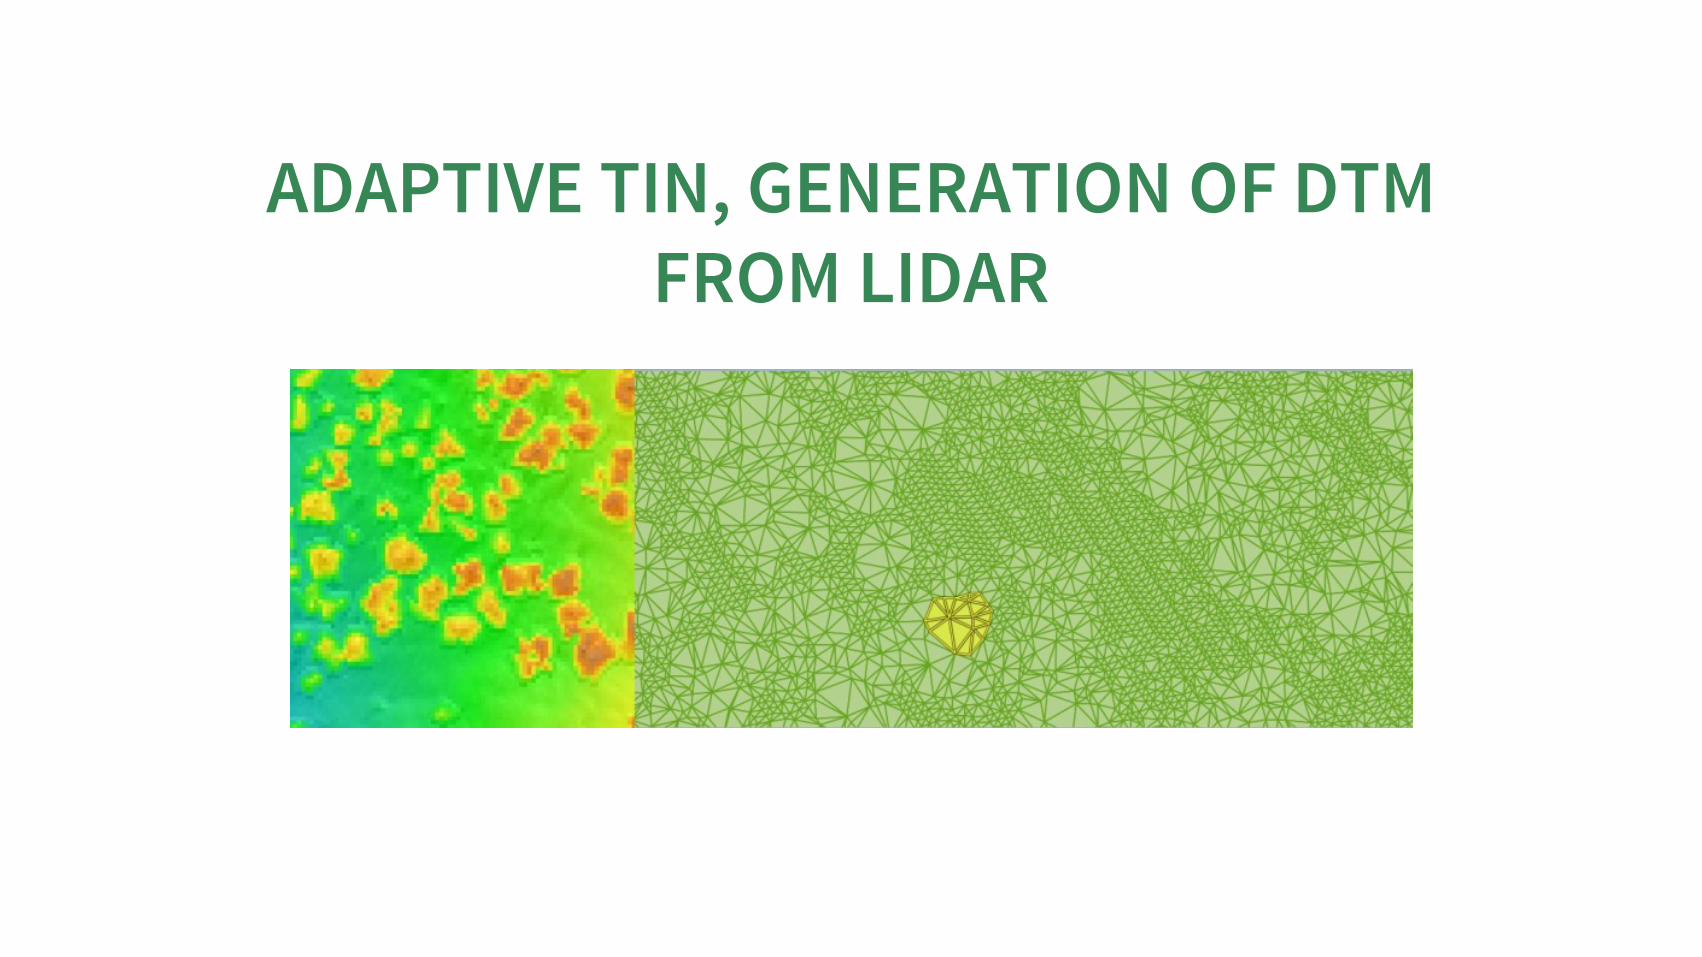
ADAPTIVETIN,GENERATIONOFDTMFROMLIDAR

EXTRACTIONOFBUILDINGSFROMLIDARDATASETS
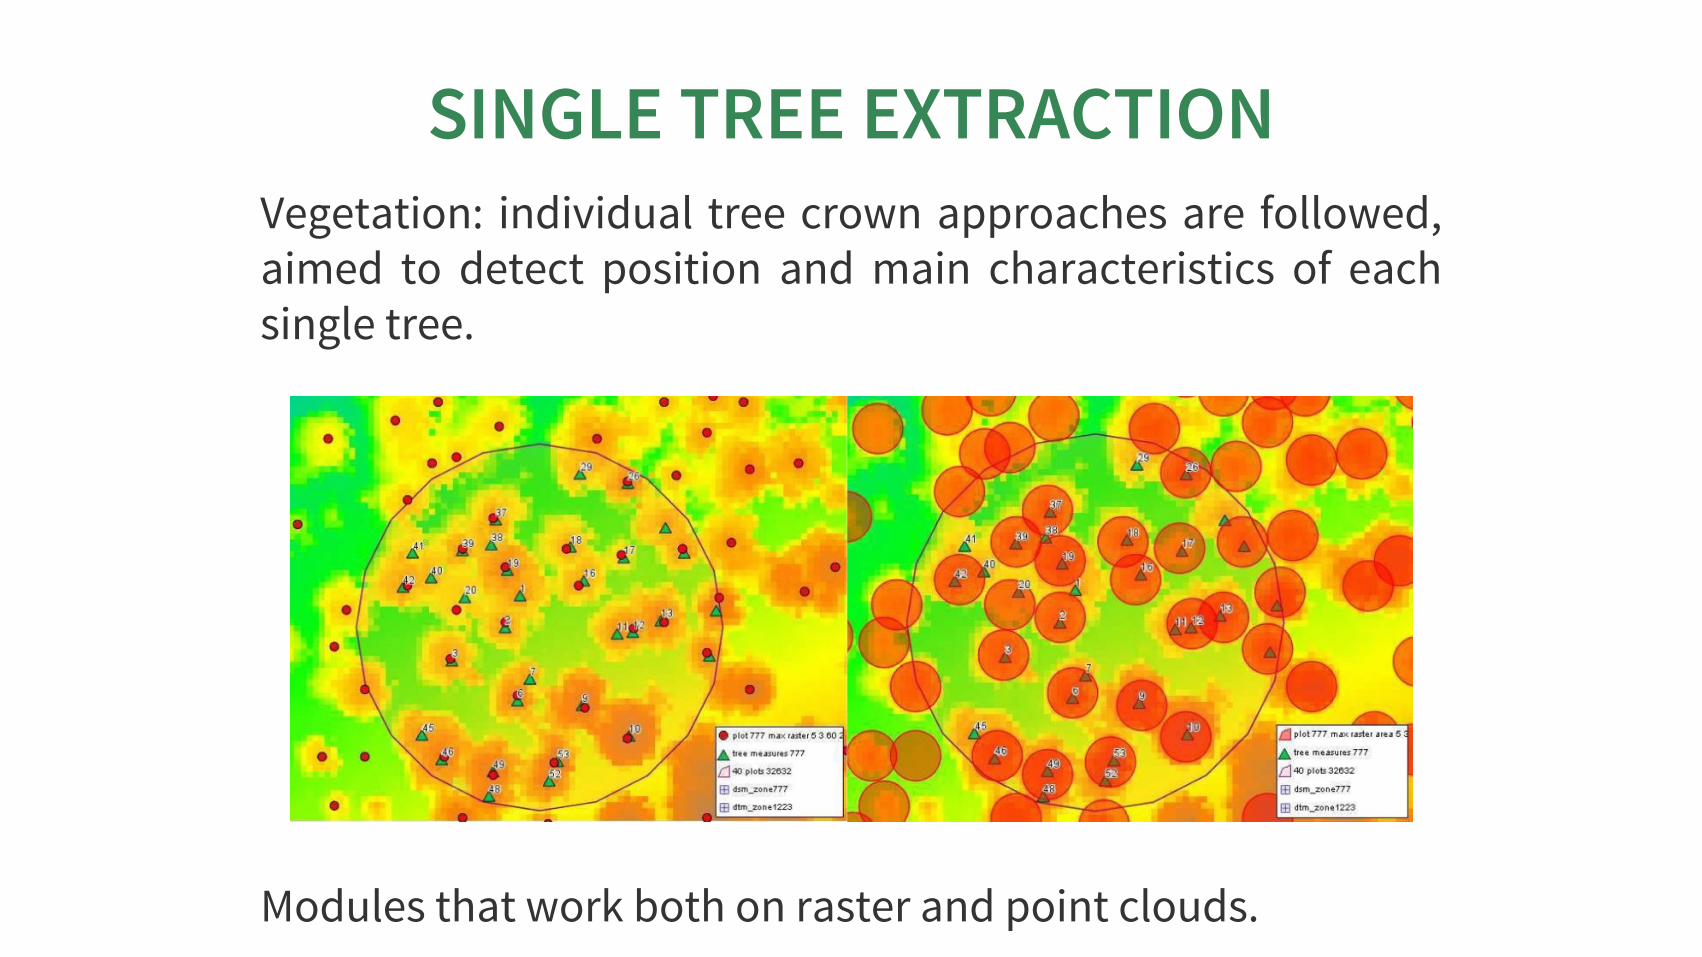
SINGLETREEEXTRACTIONVegetation: individual treecrownapproachesare followed,aimed to detect position andmain characteristics of eachsingletree.
Modulesthatworkbothonrasterandpointclouds.

THERASTERMAPCALCULATORThe mapcalc is a tool that can be use to perform mapalgebraonrastermaps.
Let’sassumeyouwant toknowwhichpartofanelevationmodelbetween1000and1300meterslookstowardssouth.
Once you calculated the aspect map with the SpatialToolbox,youcanuseamapalgebraformulalikethis:
if(dtm_all>1000&&dtm_all<1300&&aspect>160&&aspect<200){result=dtm_all;}else{result=-9999.0;}

THERASTERMAPCALCULATORThe GUI of the mapcalc looks like the following. And themapfromthepreviousformulaliketheoneinthemapview.

GEOPAPARAZZITOOLSFORGVSIGThe plugins contain a set of tools dedicated to theinteraction with the digital field mapping app for androidGeopaparazzi.
Itisbeyondthescopeofthispresentationtodescribethesetools.
TosummarizeingvSIGitispossibleto:
createthemapbackgrounddataas.mbtile
exportallthedatacontainedintheprojectasshapefiles
andbrowsetheimageslinkedintheshapefiles

EPANETEPANET is a powerful and well known software for watersupplysystemmanagement(analysis)anddesign.
Again,itisbeyondthescopeofthispresentationtodescribethesetools.

TOOLSANDUTILITIESTheHortonMachinepluginscontainasetofsmalltoolsandutilitiesthatcanbeusefulinanumberofsituation.
Weoftenneedthemwhenwecreatenewmodulesandneedtotestthemonlargerasters.
Mostofthemcanbeaccessedfromthemainmenu:

THEPOSITIONINFOTOOLThis tools allows the user to view the clicked coordinatesandseetheminadifferentprojectionandalsocopiesthemintotheclipboard:

WKTGEOMETRYTOOLOnecanselectageometryinthelayerandextracttheWKTrepresentation of the geometry. The same way one canwrite/pastesomeWKTgeometryandinsertitinthelayer.
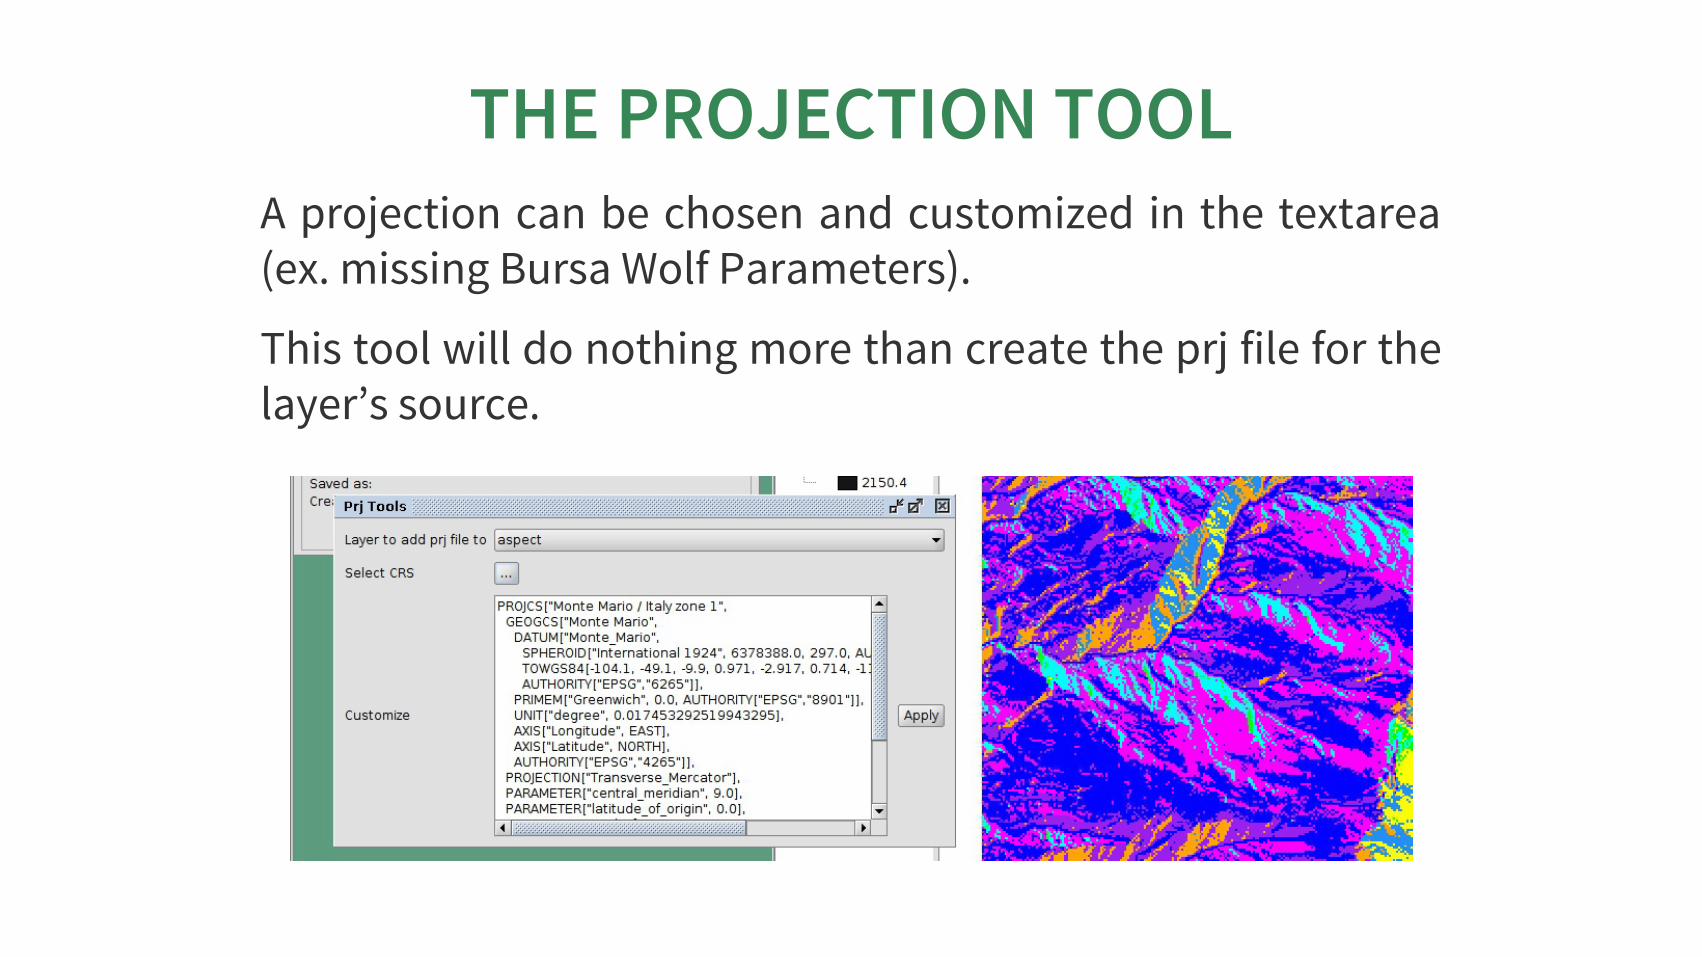
THEPROJECTIONTOOLAprojectioncanbechosenandcustomized in the textarea(ex.missingBursaWolfParameters).
Thistoolwilldonothingmorethancreatetheprjfileforthelayer’ssource.

THEFEATUREBROWSERThe feature browser is a simple yet very usefull toolwhenyouneedtocheckadataset.Thetoolputsthefeaturesinalistandallowstheusertobrowsethembackandforth.

THERASTERSTYLERThe raster styler can be accessed from themainmenu orfromthecontextmenu(rightclick)onrasterlayers:

THERASTERSTYLERRightnow,whenonedefinesacolortableforamap,hegets255colorrulesandanunreadablelegend.
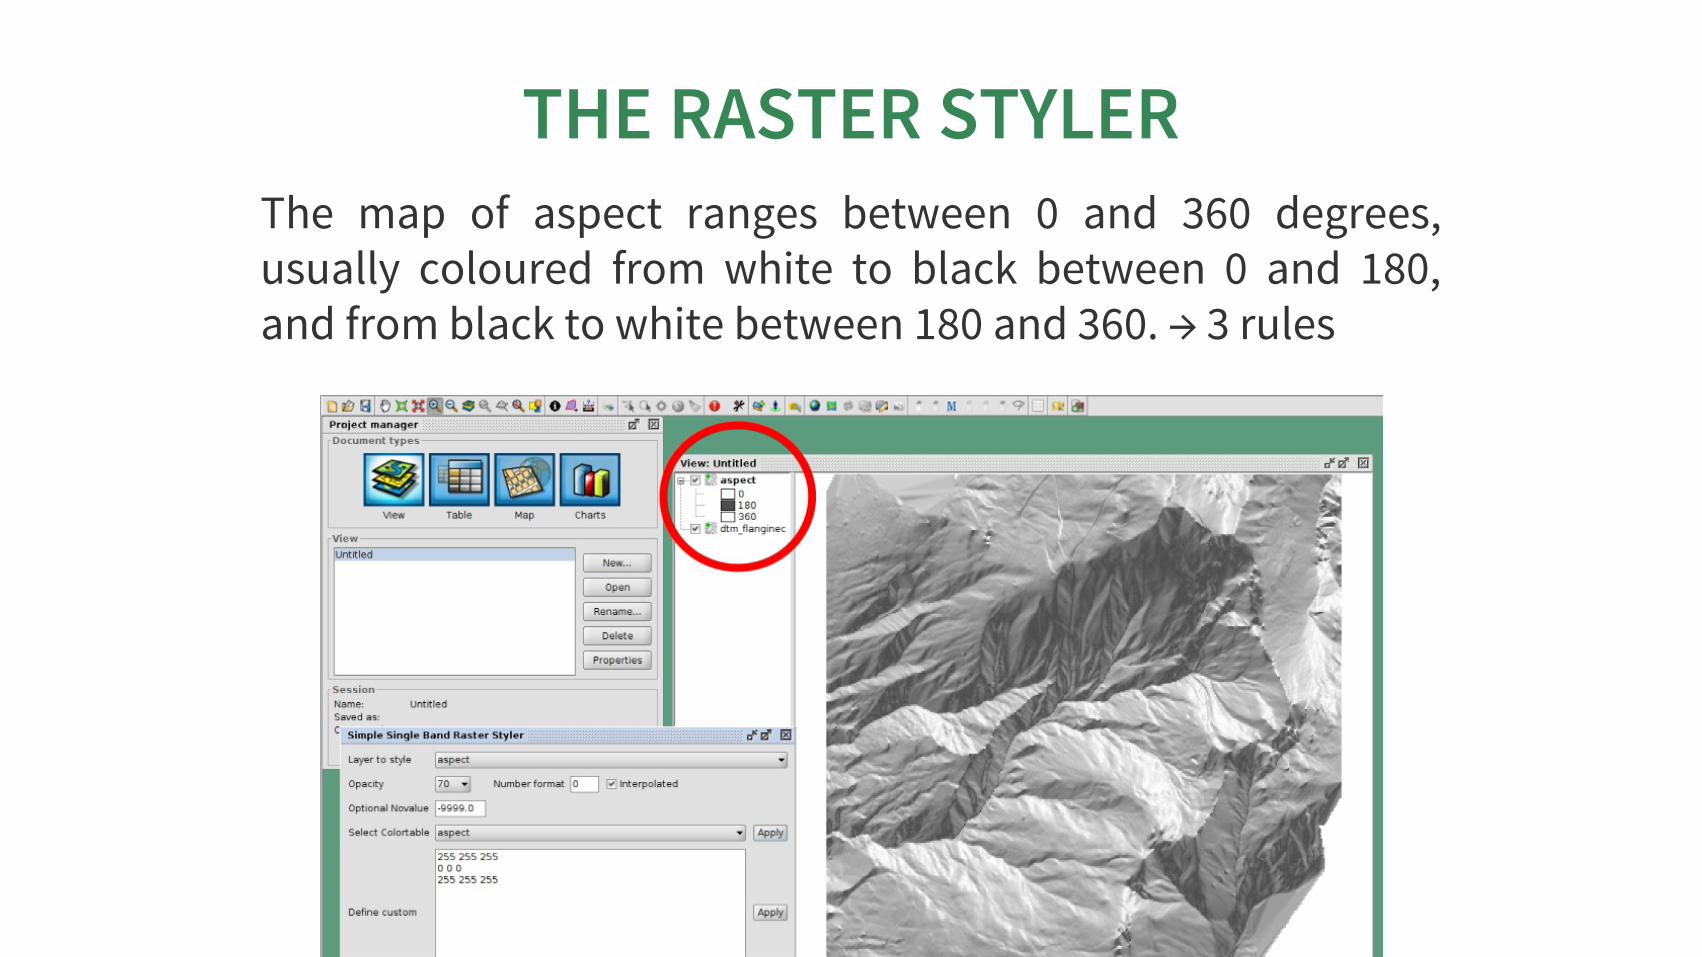
THERASTERSTYLERThe map of aspect ranges between 0 and 360 degrees,usually coloured from white to black between 0 and 180,andfromblacktowhitebetween180and360.→3rules

THERASTERSTYLERIf we style also an elevation model and add sometransparency,wegetanice3Dfeeling

THERASTERSTYLERAndthentherearemapsthatneedcategories.Ex.tonicelyread a map of flowdirections you need to have a legendshowingthedirections.

RASTERGRAPHICSVIEWWe often need to analize small portions of large rasters.Everything looks the same,due to the fact that thecolortable is calculated on the whole raster. A localcolortablewouldbehandy:
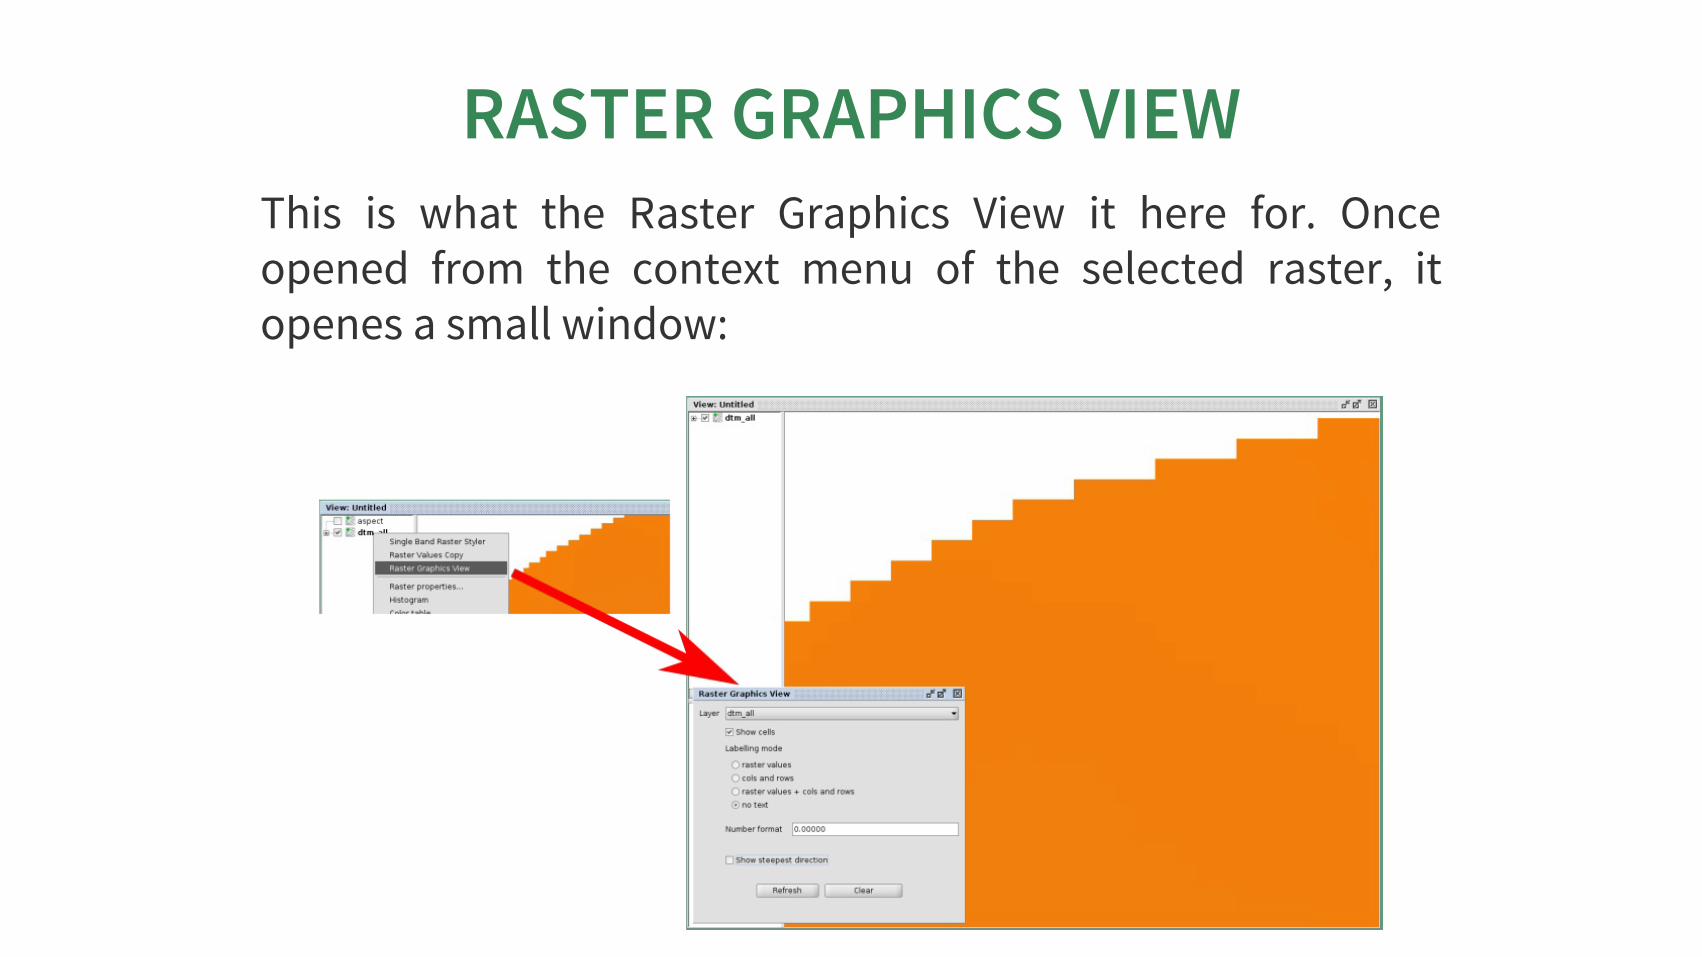
RASTERGRAPHICSVIEWThis is what the Raster Graphics View it here for. Onceopened from the context menu of the selected raster, itopenesasmallwindow:

RASTERGRAPHICSVIEWOnce selecting the options show cells and no text, it ispossibletoviewthelocalcolortable:

RASTERGRAPHICSVIEWItisalsopossibletoviewtherastervalues:

RASTERGRAPHICSVIEW… orthecols/rowsoftheloadedrasterfile… orboth.

RASTERGRAPHICSVIEWItisalsopossibletohavealookatthesteepestdirectionofeachcell.Pitsareshownasredfatdots.

RASTERVALUESCOPYHave you ever needed to analyze small portions of largerasters? And maybe extract those portions to fasterinvestigatethem?

RASTERVALUESCOPYOncetriggered,itcopiesthevisibleportionofthemapintothe system clipboard as an ascii raster map, ready to becopiedintoafileandbeused:

THANKSFORYOURATTENTION!Homepage:
Needhelp?JointheMailinglist.
Usefullinks:
http://www.hortonmachine.org
http://groups.google.com/group/jgrasstools
https://www.slideshare.net/search/slideshow?q=jgrasstoolshttp://jgrasstechtips.blogspot.it


