16
@ 2016 Deloite Financial Advisory 1 The Hotel Property Handbook Investment & Financing Keys Andalusia Snapshot Financial Advisory I Real Estate - Hospitality December 2017

@ 2016 Deloite Financial Advisory 1
The Hotel Property HandbookInvestment & Financing Keys
Andalusia Snapshot
Financial Advisory I Real Estate - Hospitality
December 2017

@ 2016 Deloite Financial Advisory 2
The Hotel Property HandbookAndalusia Snapshot
Javier García-Mateo, MRICS
PartnerFinancial Advisory ‖ Real Estate
[email protected]: +34 659 90 02 15
Leopoldo Parias
PartnerFinancial Advisory [email protected]: +34 629894186
Jose María Espejo
Senior ManagerFinancial Advisory ‖ Real Estate
[email protected]: +34 918 232 692
Jordi Schoenenberger
PartnerHospitality Industry [email protected]: +34 932 543 932
Fernando Baldellou
PartnerHead of Financial Advisory – Hospitality [email protected]: +34 914 432 514
@ 2016 Deloite Financial Advisory 3
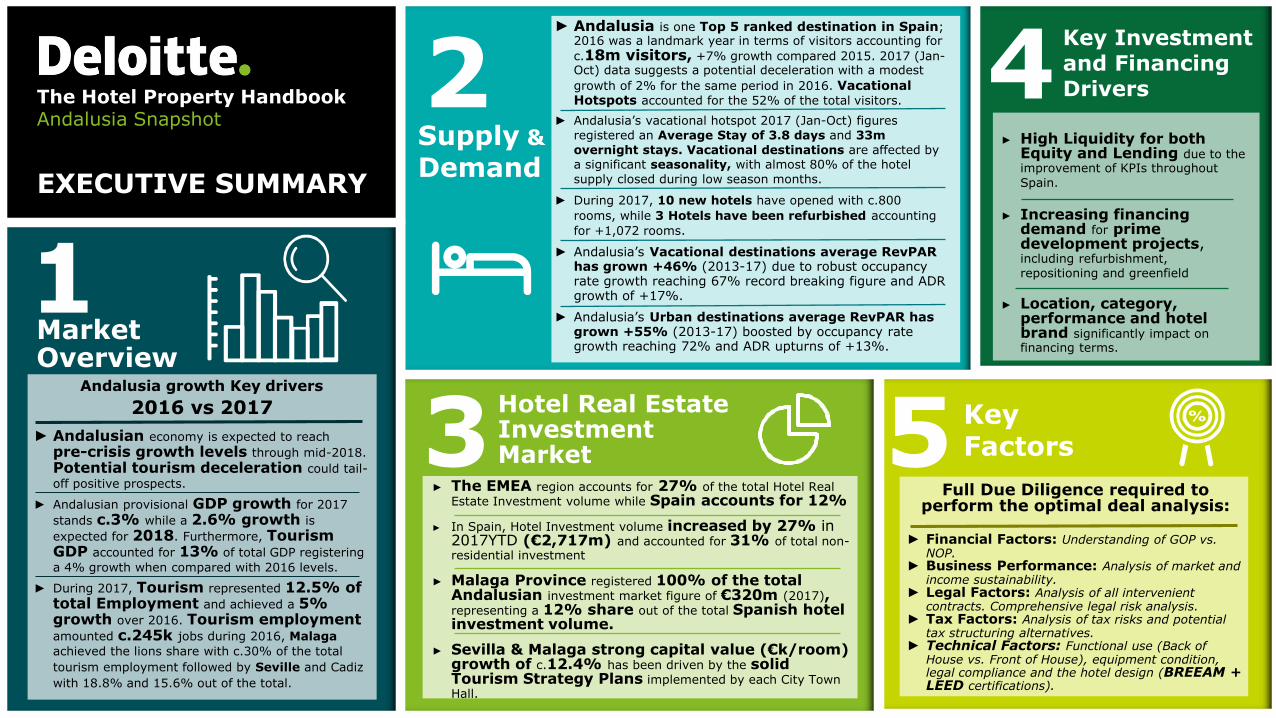
► Andalusia is one Top 5 ranked destination in Spain; 2016 was a landmark year in terms of visitors accounting for
c.18m visitors, +7% growth compared 2015. 2017 (Jan-Oct) data suggests a potential deceleration with a modest
growth of 2% for the same period in 2016. VacationalHotspots accounted for the 52% of the total visitors.
► Andalusia’s vacational hotspot 2017 (Jan-Oct) figures
registered an Average Stay of 3.8 days and 33m
overnight stays. Vacational destinations are affected by a significant seasonality, with almost 80% of the hotel
supply closed during low season months.
► During 2017, 10 new hotels have opened with c.800
rooms, while 3 Hotels have been refurbished accounting
for +1,072 rooms.
► Andalusia’s Vacational destinations average RevPAR has grown +46% (2013-17) due to robust occupancy rate growth reaching 67% record breaking figure and ADR growth of +17%.
► Andalusia’s Urban destinations average RevPAR has grown +55% (2013-17) boosted by occupancy rate growth reaching 72% and ADR upturns of +13%.
5 Key Factors
Full Due Diligence required to perform the optimal deal analysis:
► Financial Factors: Understanding of GOP vs. NOP.
► Business Performance: Analysis of market and income sustainability.
► Legal Factors: Analysis of all intervenient contracts. Comprehensive legal risk analysis.
► Tax Factors: Analysis of tax risks and potential tax structuring alternatives.
► Technical Factors: Functional use (Back of House vs. Front of House), equipment condition, legal compliance and the hotel design (BREEAM + LEED certifications).
Key Investment and Financing Drivers
► High Liquidity for both Equity and Lending due to the improvement of KPIs throughout
Spain.
► Increasing financing demand for prime development projects, including refurbishment, repositioning and greenfield
► Location, category, performance and hotel brand significantly impact on financing terms.
Market Overview
1
► Andalusian economy is expected to reach
pre-crisis growth levels through mid-2018.
Potential tourism deceleration could tail-
off positive prospects.
► Andalusian provisional GDP growth for 2017
stands c.3% while a 2.6% growth is expected for 2018. Furthermore, Tourism GDP accounted for 13% of total GDP registering
a 4% growth when compared with 2016 levels.
► During 2017, Tourism represented 12.5% of total Employment and achieved a 5% growth over 2016. Tourism employment amounted c.245k jobs during 2016, Malaga
achieved the lions share with c.30% of the total
tourism employment followed by Seville and Cadiz
with 18.8% and 15.6% out of the total.
2016 vs 2017
Andalusia growth Key drivers
2Supply &
Demand
4
3Hotel Real Estate Investment Market
The Hotel Property HandbookAndalusia Snapshot
EXECUTIVE SUMMARY
► The EMEA region accounts for 27% of the total Hotel Real Estate Investment volume while Spain accounts for 12%
► In Spain, Hotel Investment volume increased by 27% in 2017YTD (€2,717m) and accounted for 31% of total non-residential investment
► Malaga Province registered 100% of the total Andalusian investment market figure of €320m (2017),representing a 12% share out of the total Spanish hotel investment volume.
► Sevilla & Malaga strong capital value (€k/room) growth of c.12.4% has been driven by the solid Tourism Strategy Plans implemented by each City Town Hall.

@ 2016 Deloite Financial Advisory 4
(8.1%) (13.9%)
(6.2%)
(4.0%)
0.5% 1.7% 6.6% 13.9% (3.7%)
(1.1%)7.9% 11.0%
10.4% 12.4%
9.2% 3.2%
Cap
ital
Val
ues
Gro
wth
(%
)2
01
5-2
01
6
Capital Valu
e p
er
room
(2015-1
6)
€800k
€600k
€400k
€200k
€100k
The Hotel Property HandbookAndalusia Snapshot
EXECUTIVE SUMMARY
Drivers increase in cross-border
investments:
2
3
1
4
Yielding Assets are more attractive than Investment Grade Bonds
Strength of the dollar (For American investors) and weakness of the Euro since 2014
Political and financial uncertainly in certain countries is favouring Spain
Cap
ital
Val
ue
per
ro
om
Tr
end
20
06
-20
16
Max. Min (2006-16) 2015 2016
Source: HSV London
The Hotel Market: Unitary Values Analysis (€/room)
To take away: Malaga and Seville cities
Capital Values (€/room) growth has been gaining momentum through 2015-2016.
2017 growth is expected break record breaking
figures due to the strong effort on asset repositioning and solid Tourism Strategy Plans implemented by each City Town Hall.
Returns expected in Spain through hotel investment are above the European average
10 Year Bond
2016-2017(1 March 2017)
Yield 2016 – Dif. 10 years bond
2,12%▲ 50 bps
1,15%▼65 bps
0,92%▼4 bps
0,23%▼ 34 bps
2,12%▲ 50 bps
2,12%▲ 50 bps
1,67%▼17 bps
1,67%▼17 bps
0,34%▼ 43 bps
-0,22%▼ 22 bps
-0,22%▼ 22 bps
363 bps310 bps408 bps 477 bps388 bps 388 bps433 bps516 bps 538 bps522 bps547 bps 458 bps 458 bps 458 bps458 bps
1,67%▼17 bps
1,67%▼17 bps
1,67%▼17 bps
-
€200k
€400k
€600k
€800k
Pari
s
Lo
nd
on
Zü
ric
h
Ge
nev
a
Ro
me
Flo
ren
ce
Am
ste
rda
m
Ba
rcelo
na
Mila
n
Mu
nic
h
Mad
rid
Eu
rop
e
Sev
illa
Mála
ga
Gra
na
da
Có
rdo
ba
1,67%▼17 bps
4* hotel Category

@ 2016 Deloite Financial Advisory 5
644 687 365 867
2,297
1,894 3,769 2,420
750 576 519 607 932
2,702 2,145
2,717
1,467 591
571
751
2,242
1,263
660
571
1,460
1,056
544
807
2,520
5,313 4,895
1,993
150
279
88
120
596
674 930
1,143
4,470
3,189
2,087
3,151
8,587
11,845 12,398
8,845
-
2,000
4,000
6,000
8,000
10,000
12,000
2010 2011 2012 2013 2014 2015 2016 2017YTD
Top 10 Spanish single asset transactions:
A total pipeline investment volume of €800m is expected to be traded in Spain
Spanish Investment Market
Source: Deloitte
Source: Deloitte
EXECUTIVE SUMMARY
Total Hotel investment volume in Spain as at
2017YTD: €2,717m
Short Term Medium Term Long Term TOTAL
75%100%
17%
8%
In 2017YTD the Hotel investment volume has exceed by 27% the investment volume of 2016. Hotel typology represents 31% of the total investment volume, while Andalusia represents the 12% share.
# Asset UnitsPrice
(€m)Typology
1 Ritz-Carlton Abama 461 183 Vacational
2 Hotel Villaitana 390 101 Vacational
3 Jardin Tropical 390 101 Vacational
4 Sol Príncipe 799 89 Vacational
5 Hotel Silken 240 80 Urban
6 Hilton Diagonal Mar Barcelona (55%)238 80 Urban
7 Ritz-Carlton Abama 50% 461 75 Vacational
8 Sol Palmanova 653 73 Vacational
9 Silken Puerta de América 315 48 Vacational
10 AC Malaga Palacio 214 48 Urban
The Hotel Property HandbookAndalusia Snapshot
Source: Deloitte Data Base and third party sources
For more information see CHAPTER 3 (Investment Market)
31%Hotel
+27%
Hotels
Logistic
Retail High Street
Retail Shopping Centre
Offices
Andalusia
€320m Malaga region
accounted for the 100% of hotel
investment market
@ 2016 Deloite Financial Advisory 6
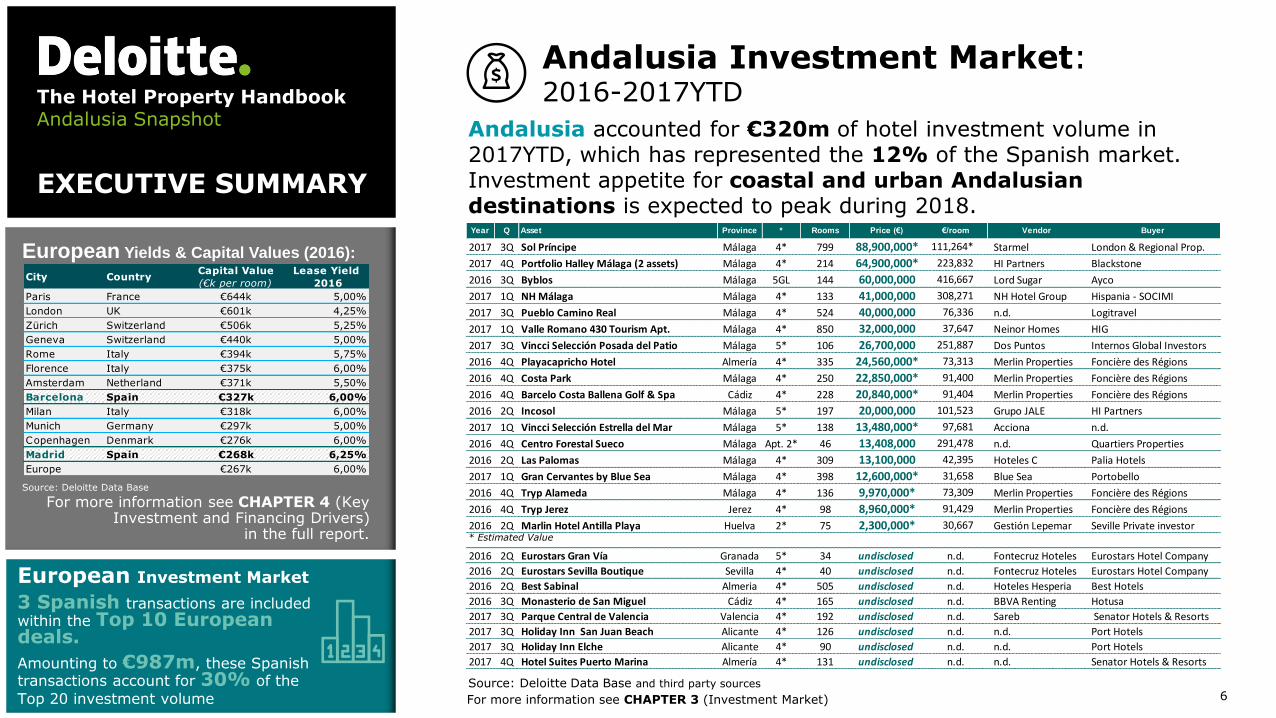
European Yields & Capital Values (2016):
For more information see CHAPTER 4 (Key Investment and Financing Drivers)
in the full report.
Source: Deloitte Data Base
EXECUTIVE SUMMARY
European Investment Market
3 Spanish transactions are includedwithin the Top 10 European deals.
Amounting to €987m, these Spanish transactions account for 30% of the
Top 20 investment volume
Andalusia Investment Market: 2016-2017YTD
Andalusia accounted for €320m of hotel investment volume in 2017YTD, which has represented the 12% of the Spanish market. Investment appetite for coastal and urban Andalusian destinations is expected to peak during 2018.
Source: Deloitte Data Base and third party sources
For more information see CHAPTER 3 (Investment Market)
City CountryCapital Value
(€k per room)
Lease Yield
2016
Paris France €644k 5,00%
London UK €601k 4,25%
Zürich Switzerland €506k 5,25%
Geneva Switzerland €440k 5,00%
Rome Italy €394k 5,75%
Florence Italy €375k 6,00%
Amsterdam Netherland €371k 5,50%
Barcelona Spain €327k 6,00%
Milan Italy €318k 6,00%
Munich Germany €297k 5,00%
Copenhagen Denmark €276k 6,00%
Madrid Spain €268k 6,25%
Europe €267k 6,00%
The Hotel Property HandbookAndalusia Snapshot
Year Q Asset Province * Rooms Price (€) €/room Vendor Buyer
2017 3Q Sol Príncipe Málaga 4* 799 88,900,000* 111,264* Starmel London & Regional Prop.
2017 4Q Portfolio Halley Málaga (2 assets) Málaga 4* 214 64,900,000* 223,832 HI Partners Blackstone
2016 3Q Byblos Málaga 5GL 144 60,000,000 416,667 Lord Sugar Ayco
2017 1Q NH Málaga Málaga 4* 133 41,000,000 308,271 NH Hotel Group Hispania - SOCIMI
2017 3Q Pueblo Camino Real Málaga 4* 524 40,000,000 76,336 n.d. Logitravel
2017 1Q Valle Romano 430 Tourism Apt. Málaga 4* 850 32,000,000 37,647 Neinor Homes HIG
2017 3Q Vincci Selección Posada del Patio Málaga 5* 106 26,700,000 251,887 Dos Puntos Internos Global Investors
2016 4Q Playacapricho Hotel Almería 4* 335 24,560,000* 73,313 Merlin Properties Foncière des Régions
2016 4Q Costa Park Málaga 4* 250 22,850,000* 91,400 Merlin Properties Foncière des Régions
2016 4Q Barcelo Costa Ballena Golf & Spa Cádiz 4* 228 20,840,000* 91,404 Merlin Properties Foncière des Régions
2016 2Q Incosol Málaga 5* 197 20,000,000 101,523 Grupo JALE HI Partners
2017 1Q Vincci Selección Estrella del Mar Málaga 5* 138 13,480,000* 97,681 Acciona n.d.
2016 4Q Centro Forestal Sueco Málaga Apt. 2* 46 13,408,000 291,478 n.d. Quartiers Properties
2016 2Q Las Palomas Málaga 4* 309 13,100,000 42,395 Hoteles C Palia Hotels
2017 1Q Gran Cervantes by Blue Sea Málaga 4* 398 12,600,000* 31,658 Blue Sea Portobello
2016 4Q Tryp Alameda Málaga 4* 136 9,970,000* 73,309 Merlin Properties Foncière des Régions
2016 4Q Tryp Jerez Jerez 4* 98 8,960,000* 91,429 Merlin Properties Foncière des Régions
2016 2Q Marlin Hotel Antilla Playa Huelva 2* 75 2,300,000* 30,667 Gestión Lepemar Seville Private investor
2016 2Q Eurostars Gran Vía Granada 5* 34 undisclosed n.d. Fontecruz Hoteles Eurostars Hotel Company
2016 2Q Eurostars Sevilla Boutique Sevilla 4* 40 undisclosed n.d. Fontecruz Hoteles Eurostars Hotel Company
2016 2Q Best Sabinal Almeria 4* 505 undisclosed n.d. Hoteles Hesperia Best Hotels
2016 3Q Monasterio de San Miguel Cádiz 4* 165 undisclosed n.d. BBVA Renting Hotusa
2017 3Q Parque Central de Valencia Valencia 4* 192 undisclosed n.d. Sareb Senator Hotels & Resorts
2017 3Q Holiday Inn San Juan Beach Alicante 4* 126 undisclosed n.d. n.d. Port Hotels
2017 3Q Holiday Inn Elche Alicante 4* 90 undisclosed n.d. n.d. Port Hotels
2017 4Q Hotel Suites Puerto Marina Almería 4* 131 undisclosed n.d. n.d. Senator Hotels & Resorts
* Estimated Value
@ 2016 Deloite Financial Advisory 7
EXECUTIVE SUMMARY
The Hotel Property HandbookAndalusia Snapshot
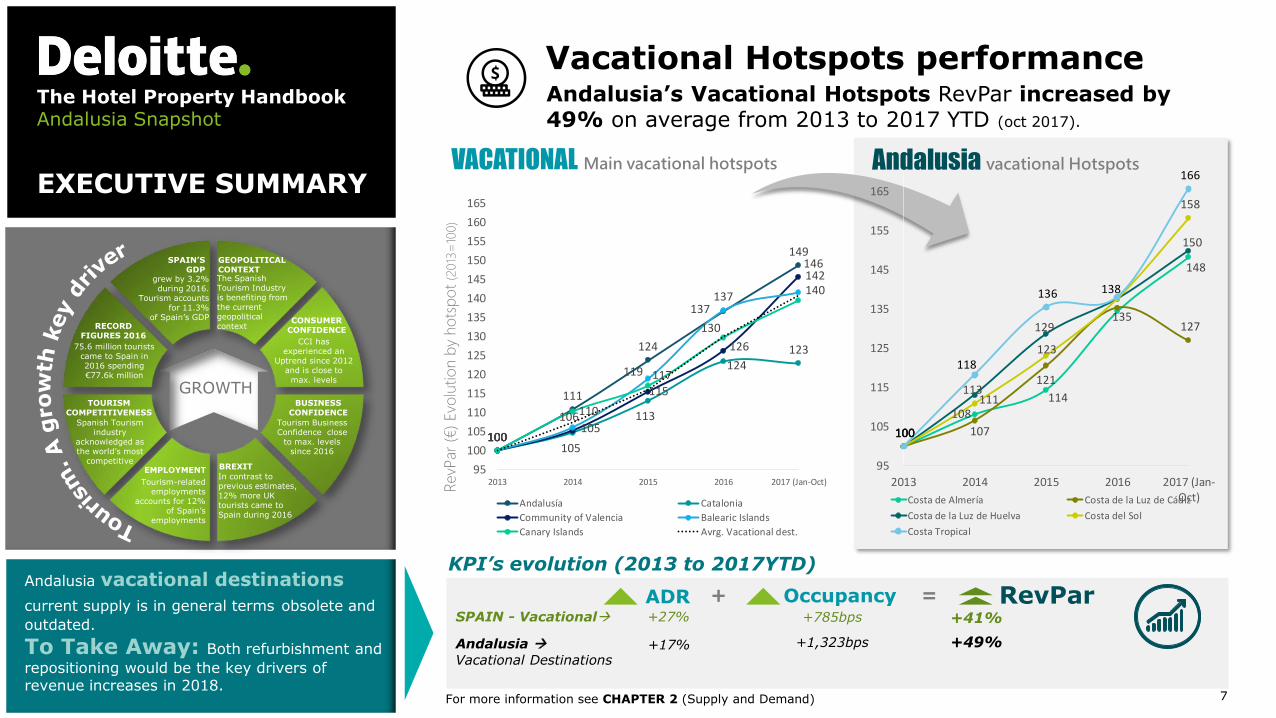
GROWTH
EMPLOYMENT
Tourism-related employments
accounts for 12% of Spain’s
employments
In contrast to previous estimates, 12% more UK tourists came to Spain during 2016
BREXIT
Tourism Business Confidence close
to max. levels since 2016
BUSINESS CONFIDENCE
CCI has experienced an
Uptrend since 2012 and is close to
max. levels
CONSUMERCONFIDENCE
The Spanish Tourism Industry is benefiting from the current geopolitical context
GEOPOLITICAL CONTEXT
grew by 3.2% during 2016.
Tourism accounts for 11.3%
of Spain’s GDP
SPAIN’S GDP
75.6 million tourists came to Spain in 2016 spending €77.6k million
RECORD FIGURES 2016
Spanish Tourism industry
acknowledged as the world’s most
competitive
TOURISM COMPETITIVENESS
Andalusia vacational Hotspots
RevP
ar(€
) Evo
lutio
n b
y ho
tsp
ot
(2013
=10
0)
VACATIONAL Main vacational hotspots
For more information see CHAPTER 2 (Supply and Demand)
Vacational Hotspots performanceAndalusia’s Vacational Hotspots RevPar increased by 49% on average from 2013 to 2017 YTD (oct 2017).
KPI’s evolution (2013 to 2017YTD)
ADR RevParOccupancy+ =SPAIN - Vacational +27% +785bps +41%
Andalusia
Vacational Destinations
+1,323bps +49%
Andalusia vacational destinations
current supply is in general terms obsolete and
outdated.
To Take Away: Both refurbishment and
repositioning would be the key drivers of revenue increases in 2018.
100
111
124
137
149
100105
113
124123
100105
115
126
146
100
106
119
137
142
100
110
117
130
140
95
100
105
110
115
120
125
130
135
140
145
150
155
160
165
2013 2014 2015 2016 2017 (Jan-Oct)
Andalusía Catalonia
Community of Valencia Balearic Islands
Canary Islands Avrg. Vacational dest.
100
108
114
135
148
100 107
121
127
100
113
129
150
100
111
123
158
100
118
136 138
166
95
105
115
125
135
145
155
165
2013 2014 2015 2016 2017 (Jan-Oct)Costa de Almería Costa de la Luz de Cádiz
Costa de la Luz de Huelva Costa del Sol
Costa Tropical
+17%
@ 2016 Deloite Financial Advisory 8
111
130
147
166
105
116
128
141
100
119
130
144
168
106
121
132
139
95
100
105
110
115
120
125
130
135
140
145
150
155
160
165
170
2013 2014 2015 2016 2017(Jan-Oct)
Sevilla Granada
Malaga Córdoba
Avrg. Urban destinations (Spain)
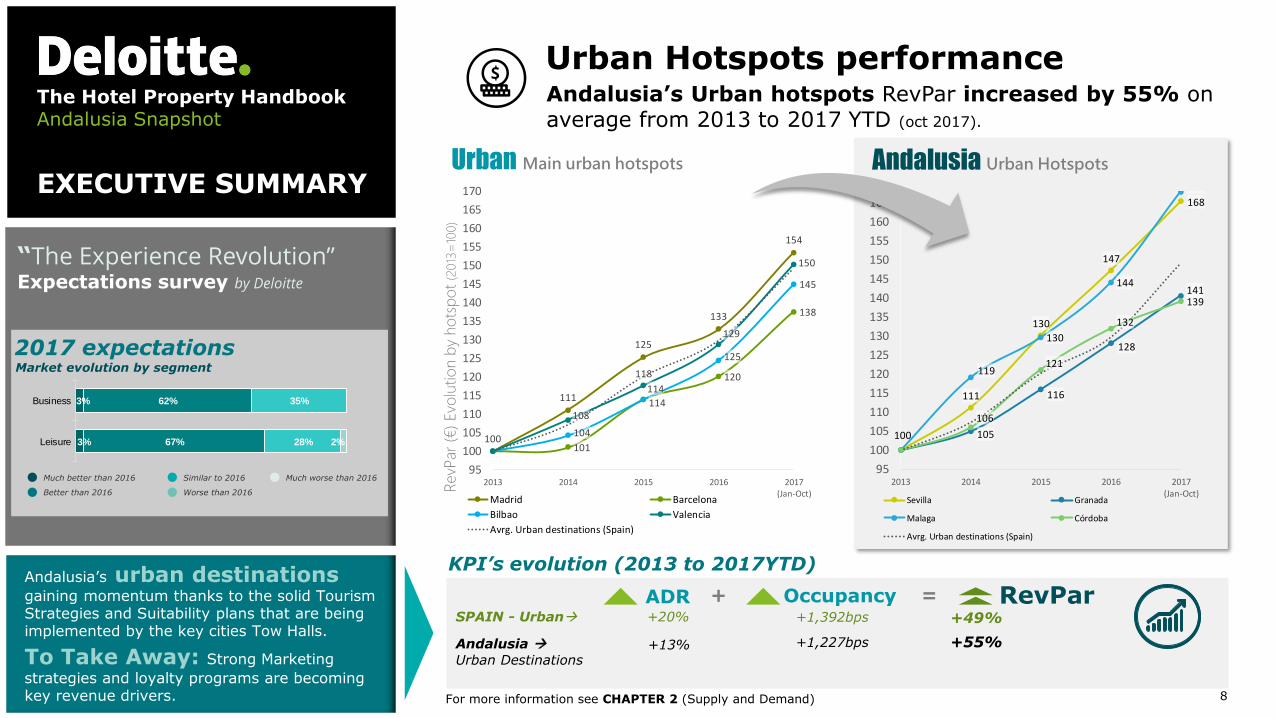
EXECUTIVE SUMMARY
The Hotel Property HandbookAndalusia Snapshot
Andalusia Urban Hotspots
RevP
ar(€
) Evo
lutio
n b
y ho
tsp
ot
(2013
=10
0)
Urban Main urban hotspots
For more information see CHAPTER 2 (Supply and Demand)
Urban Hotspots performanceAndalusia’s Urban hotspots RevPar increased by 55% on average from 2013 to 2017 YTD (oct 2017).
Andalusia’s urban destinations gaining momentum thanks to the solid Tourism Strategies and Suitability plans that are being implemented by the key cities Tow Halls.
To Take Away: Strong Marketing
strategies and loyalty programs are becoming key revenue drivers.
KPI’s evolution (2013 to 2017YTD)
ADR RevParOccupancy+ =SPAIN - Urban +20% +1,392bps +49%
Andalusia
Urban Destinations
+1,227bps +55%+13%
“The Experience Revolution” Expectations survey by Deloitte
3%
3%
62%
67%
35%
28% 2%
Business
Leisure
2017 expectations
Better than 2016
Much better than 2016
Worse than 2016
Similar to 2016 Much worse than 2016
Market evolution by segment
100
111
125
133
154
101
114
120
138
104
114
125
145
108
118
129
150
95
100
105
110
115
120
125
130
135
140
145
150
155
160
165
170
2013 2014 2015 2016 2017(Jan-Oct)
Madrid Barcelona
Bilbao Valencia
Avrg. Urban destinations (Spain)

@ 2016 Deloite Financial Advisory 9
New openings22%
Refurbishment7%
Chain/Brand Conversion
67%
Ongoing projects
4%
New openings20%
Refurbishment18%
Chain/Brand Conversion
51%
Ongoing projects
11%
82 62 68 57 56 34 54 50
6.907
5.3965.745
5.120
3.124 2.825
5.6974.973
0
2000
4000
6000
8000
10000
12000
-
20
40
60
80
100
120
140
160
180
200
2010 2011 2012 2013 2014 2015 2016 2017 YTD
New Hotels # rooms
EXECUTIVE SUMMARY
The Hotel Property HandbookAndalusia Snapshot
For more information see CHAPTER 2 (Supply and Demand)
Spanish hotel new openingsSignificant hotel openings during 2017YTD (Dec. 2017)
Hotel openings trend (2010-17 YTD) (number of hotels and rooms)
Source: Censo Alimarket Hoteles
Source: Censo Alimarket Hoteles (2017YTD – Dic. 2017)
New Openings
Refurbishment
Chain/Brand Conversion
Ongoing Projects
10 Hotelsc.818 Rooms
3 Hotels1,072 Rooms
31 Hotels3,840 Rooms
2 Hotels184 Rooms
AndalusiaFigures
Spain Andalusia
2017 YTD openings by type of project:
The main chains’ priorities are asset renovation, brand repositioning, innovation and
sustainability in order to overcome seasonality and foster client loyalty.

@ 2016 Deloite Financial Advisory 10
P&L reconstruction Restructuring of the Financial Sector
Improvement of fundamentals
Alternative to the fixed income / bond yields
Senior Debt: Yielding assets:
gathering momentum
MAIN DRIVERS FOR THE INCREASING LENDING DEMAND
Monetary Policy: QE, low funding costs, etc.
Excess of Liquidity: Increase in transactions
Entry of new sponsors
FINANCIAL SECTOR
REAL ESTATE INVESTMENT MARKET
MACROECONOMIC ENVIRONMENT
Yielding assets: Increasing lending demand due to the outstanding tourism industry performance
Financing MarketThe Hotel Property HandbookAndalusia Snapshot
EXECUTIVE SUMMARY
Source: Deloitte
For more information see CHAPTER 4 (Key Investment and Financing Drivers)
Main
Conditio
ns
LTV (1)
Upfront Fee
Spread
45-50% 45-55%
2015 2016
150-250bps 125-175bps
225-400bps 200-250bps
Framework
Main Players
Balloon (2) 60-80% 65-100%
Credit Access Constraints
Financing Upturn
Institutional Investors / Debt
Funds
Banking / Insurance Companies
2013-14
50-60%
100-150bps
175-225bps
70-100%
Location, category, performance, type of operating contract (and mandatory period duration)and hotel brand significantly affect financing terms.
2017YTD
50-65%
90-135bps
150-225bps
70-100%
(1) Sustainable LTV to deal with the debt service with high funding costs (A higher LTV will result in a greater debt service)(2) A Balloon is required to cover the high funding costs during the loan´s life (a lower balloon will result in a greater annual debt
service). Estimated balloon for a 5-7 years loan.
Development loans: Traditional lenders are
coming back

@ 2016 Deloite Financial Advisory 11
The Most active players are expected
to stay active in 2018:
Main Players:
Equity
Debt
2016 2017THE CORE PROFILE STILL DOMINATES THE MARKET:
Source: Deloitte
The Hotel Property HandbookAndalusia Snapshot
EXECUTIVE SUMMARY
Source: Deloitte
For more information see CHAPTER 4 (Key Investment and Financing Drivers)
Main Chains
NPLs portfolios
Local PlayersMore than 10,000 rooms in Spain
Miguel Sanchez Hoteles
Core
67%
Core+
29%
Value
Added4%
€mCore 1,822
Core+ 790
Value Added 105
Core
79%
Core+
11%
Value
Added10%
€mCore 1,702
Core+ 234
Value Added 209

@ 2016 Deloite Financial Advisory 12
The Hotel Property HandbookAndalusia Snapshot
WHAT IS
NEXT?

@ 2016 Deloite Financial Advisory 13
The Hotel Property HandbookAndalusia Snapshot
EXECUTIVE SUMMARY
Hotel
Property
Digital strategy
RenovationCustomised experiences
Brand repositioning
Innovation
SustainabilityBREEAM & LEED
BREEAM and LEED certifications are the
most significant sustainability certifications
worldwide. Both standards are
regularly updated in line with the market.
LEADING SUSTAINABILITY CERTIFICATIONS

@ 2016 Deloite Financial Advisory 14
The Hotel Property HandbookAndalusia Snapshot
EXECUTIVE SUMMARY
“Expectativas 2017The Experience Revolution”
Most significant value drivers for CEOs in 2017
Select the two most significant drivers to improve capital and asset efficiency in 2017#1
Incomeincrease
#2Operating margin improvement
#3Talent and brandmanagement
#4Asset and capital efficiency
35%
33%
28%
25%
23%
17%
15%
15%
7%
2%
Investment repositioning
Optimise and invest in asset maintenance
Systems investments
Non-profitable asset sales
Cash Management
Funding sources renegotiation
Accounts receivable and payable management
Acquisitions
Supplier and debtor management
CapEx optimisation

@ 2016 Deloite Financial Advisory 15
The Hotel Property HandbookAndalusia Snapshot
Javier García-Mateo, MRICS
PartnerFinancial Advisory ‖ Real Estate
[email protected]: +34 659 90 02 15
Leopoldo Parias
PartnerFinancial Advisory [email protected]: +34 629894186
Jose María Espejo
Senior ManagerFinancial Advisory ‖ Real Estate
[email protected]: +34 918 232 692
Jordi Schoenenberger
PartnerHospitality Industry [email protected]: +34 932 543 932
Fernando Baldellou
PartnerHead of Financial Advisory – Hospitality [email protected]: +34 914 432 514

@ 2016 Deloite Financial Advisory 16


