THE IMPACT OF TRADE OPENNESS ON EMPLOYMENT AND WAGES IN EGYPT’S MANUFACTURING SECTOR Tarek El-Ghamrawy Working Paper No. 176 April 2014 The author is indebted to Omneia Helmy (Director of Research, ECES) for her constructive comments. Acknowledgment also goes to Enas Zakaria, Mohamed Ali and Mohamed El-Meseidy (Research Analysts, ECES) for their valuable research assistance. All caveats apply.
Transcript
THE IMPACT OF TRADE OPENNESS ON
EMPLOYMENT AND WAGES IN
EGYPT’S MANUFACTURING SECTOR
Tarek El-Ghamrawy
Working Paper No. 176
April 2014
The author is indebted to Omneia Helmy (Director of Research, ECES) for her constructive comments.
Acknowledgment also goes to Enas Zakaria, Mohamed Ali and Mohamed El-Meseidy (Research Analysts, ECES)
for their valuable research assistance. All caveats apply.
1
1. INTRODUCTION
One of the issues that have recently been given great importance in economic literature is
inclusive growth. Inclusive growth refers to a growth process that is sectorally and
geographically broad-based and inclusive of the largest part of the country’s labor force
(Ianchovichina and Lundstrom 2009). As growth in most developing countries has shown to
be not necessarily favorable to income equality and poverty reduction (see, for example,
Kuznets (1955), Deininger and Squire (1996) and Forbes (2000)), a central policy question
has become not only how to generate rapid growth but also how to make growth beneficial to
all.
Meanwhile, for several decades, developing countries have been going through a
gradual process of trade liberalization in goods and services. There has been intense
controversy in the literature about the impact of trade and trade policy on growth.1 Though the
debate over the impact of trade on absolute growth remains open, economists have started to
integrate the notion of inclusive growth into this line of research. It is very important
nowadays to question the effect of trade liberalization on employment, wages, skills
upgrading, output structure, SME development, poverty reduction, etc.
This question gains particular importance in the case of Egypt, given the economic
reasons that triggered the Revolution of January 25, especially counter-poor growth,
unemployment and income inequality. Some recent works that tackle aspects of the question
have attempted to fill this gap. For instance, Said (2012) studies the impact of trade policy on
wages in the manufacturing sector using the labor surveys of 1998 and 2006 and using tariffs
as the main policy variable. She finds a positive impact of tariff reduction on wages. Zaki
(2011a) also explores the effect of trade policy on wage disparity in the manufacturing sector,
but focusing on non-tariff trade barriers, using the 2006 labor survey. He deepens the analysis
by disentangling that effect according to gender, region and qualification of workers. He
generally finds that trade liberalization raises wage disparity and the effect of reducing non-
tariff barriers is greater than that of tariff barriers. In another study, Zaki (2011b) explores the
nexus between trade, employment and gender. He finds that at the macroeconomic level
exports exert a positive effect on employment over the period 1960–2009. At the individual
1 See, for example, a review and critique of some of this literature in Rodríguez and Rodrik (1999). See also Baldwin (2003).
2
level, while exports affect males’ wages, they increase females’ probability of working. As
the author notes, “the adjustment on females’ labor market is done through quantities and the
one on males labor market is done through prices.” Yet he does not explain the reason behind
this difference between males and females. On the contrary, imports are always insignificant.
The present paper adds to this literature by studying the effect of exports and imports on
employment and wages, focusing on the manufacturing sector. Contrary to previous studies
that relied on individual data from labor surveys, the present one relies directly on CAPMAS
industrial data classified by sector, with a distinction between the public and private sectors,
and also between technology intensive and non-technology intensive industries based on
value added per worker. By simultaneously integrating exports and imports into the analysis,
the paper attempts to provide a comprehensive view of trade and eliminate the possibility of
influence of one of them via the other. It uses direct measures of exports and imports in
absolute values reflecting the outcome of policy changes, surmounting possible endogeneity
problems by using the appropriate techniques.
The main findings of the paper show that exports increase employment in both the
public and the private sectors with no effect on average wages. Imports, in turn, are
insignificant. Yet, when we split the sample according to technology intensity, results differ
between technology intensive and low technology, between private and public and between
employment and wages, as will be shown and interpreted in the paper.
The remainder of the paper goes as follows. Section 2 reviews the theoretical
foundations of the effect of trade on employment and wages and their empirical validity.
Section 3 runs the empirical model after presenting a brief description of the data’s main
features. Section 4 concludes.
2. THE THEORETICAL FOUNDATIONS AND THEIR CORRESPONDENCE WITH EMPIRICAL
EVIDENCE
The impact of trade liberalization on economic growth has been extensively debated in the
literature over the past two decades. However, as trade can have a positive impact on growth
while a small share of the population benefits from that growth, this has put an emphasis on
the effect of trade on employment and wages. The relationship between trade and
employment and wages was often tackled in international trade theory, but due to mixed
3
empirical evidence, it remained subject to controversy. This section sheds some light on the
evolution of this theoretical literature and its correspondence with empirical evidence.
Building on the Ricardian comparative advantage theory,2 the Heckscher-Ohlin (H-O)
model stipulates that relative endowments of factors of production (land, labor and capital)
determine a country's comparative advantage. Countries undertaking trade liberalization will
specialize in the goods and services that use their relatively abundant factor of production.
Similarly, they will import goods and services that are intensive in their relatively scarce
factor. This implies that developing countries, relatively labor-abundant, will specialize in
labor-intensive products while importing capital-intensive products. Consequently, with trade
liberalization, employment would increase in developing countries while the use of capital
will decrease, and vice-versa in developed countries. Nevertheless, there can be important
deviations from these theoretical bases, for instance if capital is subsidized in a labor abundant
country this will change the pattern of specialization in favor of capital-intensive industries.
The Stolper-Samuelson theorem (1941) (S-S) is a corollary of the H-O model that
considers what happens to factor returns. It relates the prices of goods to wages and return to
capital. The theorem states that a rise in the relative price of a good will lead to a rise in the
return to the factor that is used most intensively in the production of the good, and conversely,
to a fall in the return to the other factor. This implies that a developing country, as it exports
labor-intensive goods and imports capital intensive goods, under the assumption of full
employment, will witness a rise in wages and a fall in the return to capital.
Nevertheless, the empirical evidence for the H-O model and the S-S theorem is strongly
ambiguous. Although some studies confirm the H-O predictions, such as Bernhofen and
Brown (2011) for Japan during the 19th century, others do not. For instance, Bowen, Leamer
and Sveiskaus (1987), testing the predictions of the model on the trade of 27 countries in
1967, found no support for these predictions. Similarly, Trefler’s (1995) empirical tests reject
the generalized HOV3 model. The author finds important deviations from the pattern
2 The Ricardian Model assumed one factor of production in all countries (labor) while assuming that technology varies between countries exogenously. The Heckscher-Ohlin development assumed an identical technology function everywhere but added another factor of production, namely capital, making the variation of labor productivity endogenous to the model. 3 The generalization of the model was made by Vanek (1968). Vanek predicted that a country’s factor content of trade vector is predicted by a linear function of the country’s endowment vector. The HOV theorem in its generalized form states that a capital abundant country exports capital (Trefler 1995).
4
predicted by the model, which he calls the missing trade referring to the part of actual trade
that cannot be explained by the HOV model. Davis et al. (1997) remark that “the strict H-O-V
model performs poorly because it cannot explain the international location of production […].
However, when we relax the assumption of universal price equalization, results improve
dramatically.” A key assumption of the HOV theorem is that both countries face the same
commodity prices, because of free trade in commodities and use of the same technology for
production. Relaxing these assumptions allows different countries to use different production
techniques, thus helping explain real trade patterns in the framework of the HO model
concepts. This is why Trefler and Zhu (2000) reach the conclusion that the model is useful in
cases where trade patterns are solely determined by factor endowments and useless in cases
where technology differences play an important role.
A similar controversy arose about the S-S theorem. Tests were made on the difference
between wages of skilled versus unskilled labor as two distinct factors, with the underlying
assumption that developing countries are abundant in unskilled labor. In many instances, the
S-S predictions were realized. This is the case of Mexico (Robertson 2001) and Brazil
(Gonzaga, Filho and Terra 2006). In Mexico, for example, following adherence to the GATT
in 1986, the relative price of skill-intensive goods rose and the relative wage of skilled
workers rose as well. When Mexico further liberalized trade with Canada and the United
States in the NAFTA framework in 1994, which are two nations that are skilled-labor
abundant relative to Mexico, the relative price of skill-intensive goods fell and wages of
skilled labor fell subsequently, consistent with the S-S predictions.
On the contrary, in some countries the S-S predictions failed to be realized. This is for
instance the case of Bangladesh (Munshi 2008) and Chile (Beyer, Rojas and Vergara 1999)
where trade was not found to have an effect on skilled-unskilled wage gap. On the contrary, in
Chile it was found to widen it.
Therefore from the above paragraphs, we conclude that trade openness effects vary a lot
according to the context in which they occur.
Recent developments in the international trade theory, such as the works of Melitz
(2003) and Yeaple (2005) emphasize the role of firm heterogeneity within industries. The
impact of liberalization on employment and wages, according to this line of models, depends
on the level of productivity at the plant level. Liberalization will force the least productive
5
firms to exit and resources will be allocated towards the most productive ones that will
continue in the market. However, this line of models has yet to be empirically tested.
3. QUANTITATIVE ASSESSMENT OF THE IMPACT OF TRADE OPENNESS ON EMPLOYMENT
AND WAGES IN EGYPT
The aim of this section is to analyze the effect of trade openness, as reflected in the increase in
imports and exports, on employment and wages in the manufacturing sector. But first, we
present some description of the data.
3.1. Metadata
The data for sectoral employment, wages, production, value added and exports are drawn
from the CAPMAS Annual Industrial Statistical Bulletin and they are available for both the
public and the private sectors. They are provided in ISIC classification revision 3.1 before
2007 and revision 4 starting 2007. The necessary concordance was made between the two
classifications. Data for sectoral imports are based on the CAPMAS Foreign Trade Statistics,
available on CAPMAS website. We use a panel of 18 subsectors of the manufacturing sector
across the period 2005-2010. The manufacturing index number (base year 2002) was used as
a deflator to nominal figures. Table 1 shows summary statistics of our variables.
Table 1. Summary Statistics, 2005-2010, in Thousand LE at 2002 Prices (Except Employment, in Number of Employees)
Production Employment Wages Average wages
Net value added per employee
Exports Imports
Mean 4836669 35603.73 310221.2 12.1 .481 782655.8 3362314
St. deviation 7942521 52573.48 387870.2 7.4 .626 1236911 4809279
Table A1 in the appendix shows summary statistics for the public and the private
sectors separately. Figure 1 below displays the disaggregation of the mean of the preceding
variables in the public and the private sectors.
6
Figure 1. Mean Variables in the Public Sector vs. the Private Sector, 2005-20104
Source: Author’s illustration based on sample.
4 The reader can notice that the ratio of exports to production is higher for the public sector than for the private sector. This is due to the fact that the majority of the private sector being SMEs, which do not export in most cases. This is the same reason why total wages in the private sector are higher than in the public sector, while it is the opposite for average wages. The private sector is mostly constituted of SMEs and SMEs’ employment is mostly informal, which makes average wages in the private sector lower than in the public sector.
7
Figure 2 portrays the share of the public and private sectors in production, which shows
dominance of the private sector, due to the large share of SMEs in production, which are all
private (El-Ghamrawy and Amer 2011). When we calculated the average production by firm,
it was much larger in the public sector, as illustrated in Figure 3, which gives a comparison
about the average size of firms in each sector.
Figure 2. Share of the Public and Private Sectors in Production
Figure 3. Average Production by Firm
Source: Author’s illustration based on sample. Source: Author’s illustration based on sample.
Figures 4 and 5 below compare the sectoral structure of production, imports and exports
in the public and the private sectors respectively, illustrating the relationship between the
three variables.
In both sectors, the structure of imports is different from that of production. Apart from
some common sectors like pharmaceuticals, most of the other sectors have different shares in
production compared to imports. For instance, while electronic equipment and motor vehicles
have important shares in imports, they have minimal shares in production, whether in the
public sector or the private sector. This implies that imports are coming at a different pattern
with respect to production, which means little foreign competition to local production.
Similarly, several sectors that have important shares in the public sector’s production, such as
tobacco and food and beverages, do not have as significant shares in imports. The same is true
for the private sector, though differences are less strong in this case.
This weak competition from imports is confirmed by a correlation coefficient between
sectoral production and sectoral imports of 0.35 in the public sector and 0.58 in the private,
16%
84%
PublicPrivate
61,571.86
15,280.04
Public Private0
10000
20000
30000
40000
50000
60000
70000
Thou
sand
LE
8
respectively. A widely used measure of import competition is the import penetration rate,5
which varies between 0 and 1 and is proportional with competition. The average penetration
rate for our sample was found to be 0.5, which indicates relatively low competition.
Figure 4. Structure of Production, Imports and Exports in the Public Sector
Source: Author’s illustration based on CAPMAS data.
5 The import penetration rate = .
Tobacco14%
Textiles13%
Rubber and plastics1%
Non-metallic mineral products
3%
Basic metals27%Motor vehicles
2%
Food and beverages24%
Chemicals and pharmaceuticals
12%
Furniture0%
Other manufactures0%a. Real Production
Tobacco2% Textiles
7% Wood5% Paper products
2%Rubber and plastics
2%
Basic metals12%
Fabricated metal products5%
Other machinery5%
Electrical and electronic equipment
24%
Motor vehicles10%
Food and beverages9%
Chemicals and pharmaceuticals
15%
b. Real Imports
Tobacco9%
Textiles16%
Rubber and plastics1%
Non-metallic mineral products
3%Basic metals42%
Fabricated metal products1%
Electrical and electronic equipment
1%
Motor vehicles2%
Food and beverages15%
Chemicals and pharmaceuticals
10%
c. Real Exports
9
Figure 5. Structure of Production, Imports and Exports in the Private Sector
Source: Author’s illustration based on CAPMAS data.
Textiles7% Apparel
2% Paper products3%
Rubber and plastics4%
Non-metallic mineral products7%
Basic metals19%
Fabricated metal products3%
Other machinery3%
Electrical and electronic equipment
8%
Motor vehicles5%
Food and beverages
24%
Chemicals and pharmaceuticals
11%
a. Real Production
Tobacco2% Textiles
7%Leather products
1%Wood
5% Paper products2%
Rubber and pastics2%
Basic metals12%
Fabricated metal products5%
Other machinery5%
Electrical and electronic equipment
24%
Motor vehicles10%
Food and beverages9%
Chemicals and Pharmaceuticals
15%
b. Real Imports
Textiles14%
Apparel7%
Leather products2%
Paper products2%
Rubber and plastics4%
Non-metallic mineral products6%Basic metals
19%
Fabricated metal products2%
Other machinery2%
Electrical and electronic equipment
7%
Motor vehicles2%
Food and beverages15%
Chemicals and pharmaceuticals
14%
Other manufactures2%
c. Real Exports
10
In the same vein, comparing the structure of imports with that of exports, whether in the
public or the private s, shows that Egypt’s foreign trade is inter-industry, i.e., the sectoral
structure of imports is different from that of exports. This derives from the evidence that
production and imports are not similar and exports reflect production. The correlation
coefficient between sectoral exports and imports is 0.34 in the public sector and 0.55 in the
private.
Further, the Grubel-Lloyd index for intra-industry trade6 has a value of 0.28 in the
public sector and a value of 0.40 in the private sector. These figures represent the average of
the index for all industries. An index value of 0 indicates inter-industry trade while a value of
1 indicates intra-industry trade. Therefore, our index values reflect low values which indicate
that Egypt’s foreign trade is rather inter-industry. Table A.2 in the appendix shows the index
for each sector.
The previous findings that imports are different from production and exports make us
expect that imports will not have an overall strong impact on employment or wages, though
sectoral effects might differ from the overall impact. As for exports, the strong link between
production and exports suggests that exports might affect employment, wages or both.
Besides, it is noticed that there is some duality in Egypt’s production and export pattern.
The latter combines technology-intensive industries like basic metals and pharmaceuticals
along with less technology-intensive industries like textiles and rubber and plastic. The
available proxy7 of technology intensity in the framework of our data is the average value
added per worker (VAW). We assume that the higher the latter the higher is technology
intensity and we consider a sector to be technology intensive if its VAW exceeds the average
VAW for the manufacturing sector over the whole sample (see the appendix for a
classification of industries according to VAW). Although this duality is observable in the
public and the private sectors, it can be seen that it is high technology industries that are
6 The index is a measure of intra-industry trade of a particular good. It is calculated according to the following
where Xi are exports and Mi are imports of good i. The index takes values between 0 and 1. A value of 1 indicates fully intra-industry trade while a value of 0 indicates fully inter-industry trade. 7 Indeed, a high VAW could reflect other factors than just technology intensity. Yet, technology intensity is an important factor in raising workers’ productivity. Capital intensity would have been a good measure, had it been available.
11
dominant, namely, i) basic metals, ii) chemicals and pharmaceuticals, iii) motor vehicles, iv)
tobacco, v) electrical and electronic equipment and vi) food and beverages.8
In an extension of the quantitative analysis, we will study the effect of trade on
employment and wages in the group of technology intensive industries and the group of labor
intensive industries separately.
3.2. The Model
To assess the impact of foreign trade on employment and wages, we run panel regressions for
18 subsectors of the manufacturing sector over the period 2005–2010, where we regress each
of our two variables of interest—employment and average wages—on exports and imports.
The method used is the fixed effect method,9 which assumes that there are specific effects,
constant in time but varying across individuals (here the subsectors), that are correlated with
the regressors and affect the dependent variable. The fixed effects in our case allow taking
into account any specific features of the sectors that are constant in time.
The regression takes the following simple form:
, = + , + , + + (1)
where Z is either employment or wages, X is exports, M is imports, e is the sectors’ fixed
effect and is the random error. Subscript i refers to sectors, while t refers to years. Variables
are used in logarithms.
Since employment and wages can also affect exports and imports, we take the lagged
values of exports and imports in order to avoid reverse causality from employment and wages
to these variables. The rationale is that past values of these variables cannot be affected by
present values of employment and wages, whereas simultaneous variables can affect each
other. In all our regressions, we separate the public and private sectors to disentangle the
effects of trade in the two sectors. As mentioned before, we start by running the regressions
on the whole group of subsector, then on the high technology group of subsectors and the low
technology group separately. It would have been ideal to run the regressions for each
8 However, when we look at the sectoral structure of employment, we find it is concentrated in non-technology intensive industries. This discrepancy between the structure of production and that of employment is due to the low value added in the non-technology intensive industries. 9 As per Hausman test results, which show that the fixed effects give the best estimators in our case.
12
subsector separately, but unfortunately data for each subsector bears only 5 or 6 observations,
which does not allow an intra-sectoral analysis.
3.3. Aggregate Results
Results for the public and the private sectors are reported in Table 2.
Table 2. Effect of Trade on Employment and Average Wages
Source: Author’s calculations. Notes: All variables in logarithms. Robust standard errors in parentheses. * Significant at 10%, ** significant at 5%, *** significant at 1%.
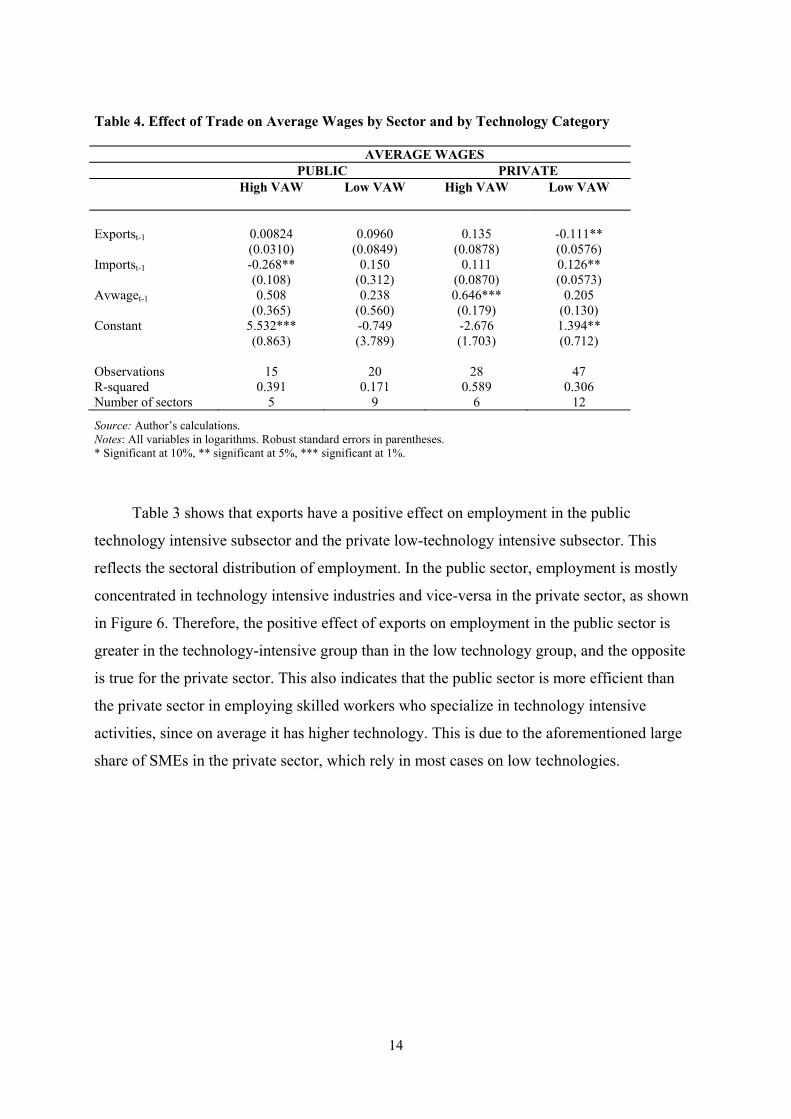
Table 3 shows that exports have a positive effect on employment in the public
technology intensive subsector and the private low-technology intensive subsector. This
reflects the sectoral distribution of employment. In the public sector, employment is mostly
concentrated in technology intensive industries and vice-versa in the private sector, as shown
in Figure 6. Therefore, the positive effect of exports on employment in the public sector is
greater in the technology-intensive group than in the low technology group, and the opposite
is true for the private sector. This also indicates that the public sector is more efficient than
the private sector in employing skilled workers who specialize in technology intensive
activities, since on average it has higher technology. This is due to the aforementioned large
share of SMEs in the private sector, which rely in most cases on low technologies.
15
Figure 6. Distribution of Employment in the Public and the Private Sectors
Source: Author’s illustration, based on CAPMAS data.
Besides, imports have a negative coefficient on employment in the private low
technology group, reflecting a degree of import competition in this cluster, contrary to the
case in the aggregated sample, where there was no import competition on average. Within this
cluster, it is noticeable that the coefficients of exports and imports on employment are close
(0.059 and -0.051) though the coefficient of exports is slightly larger in absolute terms,
reflecting a net positive effect of foreign trade on employment by around 0.008, which is
however a tiny impact: a 10 percent increase of exports and imports in the private low
technology group would entail an increase of employment by 0.08 percent.
Tobacco11%
Textiles20% Leather products
0%
Wood0% Paper products
1%Printing industry
0%
Rubber and plastics1%
Non-metallic mineral products
3%
Basic metals18%
Fabricated metal products3%
Other machinery5%
Electrical and electronic equipment
2%
Motor vehicles3%
Food and beverages
14%
Chemicals and pharmaceuticals
19%
Furniture0%
a. Public
Tobacco1% Textiles
11%
Apparel14%
Leather products1%
Wood0%
Paper products3%
Printing industry2%
Rubber and plastics4%
Non-metallic mineral products
12%Basic metals3%
Fabricated metal products4%
Other machinery
3%
Electrical and electronic equipment
6%
Motor vehicles3%
Food and beverages24%
Chemicals and pharmaceuticals
7%
Furniture2%
Other manufactures1%
b. Private
16
As for average wages, they are negatively affected by imports in the public technology
intensive group, indicating the presence of import competition with domestic production
within this cluster, contrary to the low technology group.
In the private sector, imports increase average wages while exports decrease them.
These effects stem from the effects on employment. Regarding imports, partial regressions10
showed that with imports, employment in worker categories “admins,” “workers” and
“specialists” declines whereas it stays the same in the category “others,” making the relative
share of the category “others” increase. This category comprises mostly seasonal workers
often with special skills like ginning workers.11 Though they are not highly skilled, these
workers are highly demanded by manufacturing firms. Their seasonality coupled with their
special skills makes their average wage relatively high compared to other workers. Therefore,
the increase of their share renders average wages higher.
In the same vein, exports in this cluster decrease average wages, because they cause an
increase in the number of workers and admins, which are two low-waged categories. Since
this is a low technology group, its expansion comes at the expense of high skilled categories.
Therefore, the weight of these categories increases with exports at the detriment of specialists,
decreasing the average wage as a whole.
These findings imply that exports in this cluster (private low tech) would be beneficial
to workers in particular. This is likely to occur in SMEs, which represent the majority of the
low technology private sector, and which are characterized by a high degree of flexibility in
wages and employment because of the large share of informal employment, as mentioned
before.
Yet it is also interesting to note here that the coefficients of exports and imports on
average wages in this cluster are very close, with different signs, reflecting an aggregate net
null effect of foreign trade on average wages in this cluster.
10 Regressions unreported. 11 According to CAPMAS staff.
17
4. CONCLUDING REMARKS
Results can be summarized as follows:
Table 5. Summary of the Impact of Exports and Imports on Employment and Average Wages in the Manufacturing Sector
Employment Average wages
Exports Public
Technology intensive + Low technology
Private Technology intensive Low technology + -
Imports
Public Technology intensive -
Low technology
Private
Technology intensive Low technology - +
Source: Author’s calculations.
In line with theory, exports have a positive impact on employment in the public sector
technology intensive group and the private sector low technology group. This is due to the
fact that labor is concentrated in these two groups. This implies that there is good potential in
these two groups to capitalize upon. Policy should aim at increasing the competitiveness of
these two groups. This is broadly in line with Zaki (2011b).
Meanwhile, this increase in employment in the private low-technology group entails a
change in the structure of employees’ skills and makes some less skilled categories more
demanded, which renders the average wage slightly lower. This implies that exports in this
group of sectors do not narrow the wage gap between sectors or between skills, in
contradiction with the S-S theorem and in line with Zaki (2011a) as well as new trends in
trade theory, which take into account the impact on skills. In order to narrow the gap, policy
should aim at upgrading skills through vocational education and training, hence raising less
skilled workers’ productivity and pay. This is in line with the voluminous literature on the
cruciality of upgrading education and training within the Egyptian labor market (see, for
instance, Reda 2012). This is also consistent with the fact that the lack of skills is already
often reported as a major problem in the Egyptian labor market (ECES Business Barometer,
various issues)
Regarding imports, it has been found they negatively affect average wages in the public
high-technology group, reflecting a degree of import competition therein. They also cause a
negative effect on employment in the private low technology sector, indicating competition in
18
this sector comprising mostly of SMEs. This makes it all the more urgent to make this sector
more competitive vis-à-vis imported products, which requires significant reform of SMEs.
Finally, effective policies have to be put in place to assimilate employees who incurred
losses from trade. Opportunities should be made available for those employees to acquire
skills and be able to compete in the job market. A partnership between the government and
the private sector is one way to provide such opportunities. The government could offer
privileges to firms that conduct training programs for their employees instead of replacing
them with new labor.
19
APPENDIX
Table A.1. Summary Statistics for the Public and the Private Sectors Separately, 2005-2010, in Thousand LE at 2002 prices (Except Employment, in Number of Employees)
Table A.2. Grubel-Lloyd Index for Inter-Industry Trade
Sector Grubel-Lloyd Index
Tobacco 0.24
Textile 0.615
Apparel 0.381
Leather 0.216
Wood 0.019
Paper 0.184
Printing 0.276
Rubber and plastic 0.445
Non-metallic minerals 0.509
Basic metals 0.626
Fabricated metals 0.193
Other machinery 0.19
Electrical and electronic equipment 0.07
Motor vehicles 0.123
Food & beverages 0.426
Chemicals and pharmaceuticals 0.295
Furniture 0.098
Other manufactures 0.461
20
REFERENCES
Baldwin R. 2003. “Openness and Growth: What’s the Empirical Relationship?” The National Bureau of Economic Research (NBER) Working Paper, no. 9578. Cambridge, MA: NBER.
Bernhofen, D. M., and J. C. Brown. 2011. "Testing the General Validity of the Heckscher-Ohlin Theorem: The Natural Experiment of Japan." Infor Institute Center for Economic Studies (CESifo) Working Paper, no. 3586. Munich: CESifo Group.
Beyer, H., P. Rojas, and R. Vergara. 1999. “Trade Liberalization and Wage Inequality.” Journal of Development Economics 59:103–123.
Bowen, H. P., E. Leamer, and L. Sveiskaus .1987. “Multicountry, Multifactor Tests of the Factor Abundance Theory.” American Economic Review 7, no. 5: 791–809.
Davis, D. R., D. E. Weintein, S. C. Bradford, and K. Shimpo. 1997. "Using International and Japanese Regional Data to Determine When the Factor Abundance Theory of Trade Works." American Economic Review 87, no. 3:421–446.
Deininger, K., and L. Squire. 1996. “A New Data Set Measuring Income Inequality.” World Bank Economic Review 10: 565–92.
ECES (Egyptian Center for Economic Studies). Business Barometer, various issues. Cairo: ECES.
El-Ghamrawy, T., and Z. Amer. 2011. “Public Wage Premium: A Mirage or Reality.” Egyptian Center for Economic Studies (ECES) Working Paper, no. 164. Cairo, Egypt: ECES.
Forbes, K. 2000. “A Reassessment of the Relationship between Inequality and Growth.” American Economic Review 90: 869–97.
Gonzaga, G., N. M. Filho, and C. Terra. 2006. “Trade Liberalization and the Evolution of Skill Earnings Differentials in Brazil.” Journal of International Economics 68, no. 2: 345–367.
Ianchovichina E., and S. Lundstrom. 2009. “Inclusive Growth Analytics: Framework and Application”. World Bank Policy Research Paper, no. 4851. Washington, D.C.: World Bank.
Kuznet, S. 1955. “Economic Growth and Income Inequality.” American Economic Review 45, no. 1: 1–28.
Melitz, M. 2003. "The Impact of Trade on Intra-Industry Reallocations and Aggregate Industry Productivity." Econometrica 71, no. 6: 1695–1725.
Munshi, F. 2008. “Does Openness Reduce Wage Inequality in Developing Countries? A Panel Data Analysis.” Göteborg University. School of Business, Economics and Law. Working Papers in Economics, no. 241. Sweden: Göteborg University.
21
Reda, M. 2012. “Enhancing Egypt’s Competitiveness: Education, Innovation and Labor.” Egyptian Center for Economic Studies (ECES) Working Paper, no. 167. Cairo: ECES.
Robertson, R. 2001. “Relative Prices and Wage Inequality: Evidence from Mexico.” Journal of International Economics 64, no. 2: 387-409.
Rodríguez F., and D. Rodrik. 1999. “Trade Policy and Economic Growth: A Skeptic’s Guide to the Cross-National Evidence.” The National Bureau of Economic Research (NBER) Working Paper, no. 7081. Cambridge MA: NBER.
Said, M. 2012. “Impact of Trade Policy on Wages.” In Europe and the Mediterranean Economy, edited by. J. Costa-Font. New York: Routledge and FEMISE.
Stolper, W. F. and P. A. Samuelson. 1941. "Protection and Real Wages." Review of Economic Studies 9, no. 1: 58–73.
Trefler, D. 1995. “The Case of the Missing Trade and Other Mysteries.” American Economic Review 85, no. 5: 1029–46.
Trefler, D., and Susan Chun Zhu. 2000. "Beyond the Algebra of Explanation: HOV for the Technology Age". American Economic Review 90, no. 2: 145–149.
Vanek, J. 1968. "The Factor Proportions Theory: the N-Factor Case." Kyklos 21: 749–756.
Yeaple, S. R. 2005. “A Simple Model of Firm Heterogeneity, International Trade, and Wages”. Journal of International Economics 65: 1–20.
Zaki, C. 2011a. “On Trade Policies and Wage Disparity: Evidence from Egyptian Microeconomic Data.” International Economic Journal 28, no. 1: 37–69.
———. 2011b. “On Trade, Employment and Gender: Evidence from Egypt.” Paper presented at the ICITE 3rd Regional Conference: Trade, Jobs and Inclusive Development in Africa, Tunisia, 2011.