THE IDENTIFICATION OF PONZI SCHEMES Can a Picture Tell a Thousand Frauds? Jacqueline M Drew and Michael E Drew * There is voluminous commentary on the origins of the global financial crisis (GFC), international attempts to limit the contagion and the Herculean effort to stop the global economy sliding into a depression. However, in the fast-moving world of the GFC, the debate shifted to the search for answers to the most challenging question: can we stop this from occurring again? To date, a number of responses have been formulated, including the need for a more holistic approach to regulating the global financial system, more stringent controls on banks and new financial products and reform of executive remuneration practices that encourage excessive risk-taking. This article suggests that an additional issue in the reform debate warrants consideration. The adequacy and implementation of fraud-detection systems in the financial services industry must be addressed. The monthly returns from the largest feeder fund in the US$65 billion Ponzi scheme overseen by Bernard L Madoff are analysed to demonstrate how the performance characteristics of investment schemes can be used as a potential ʻred flagʼ indicator in a broad system of fraud detection. It is argued that performance characteristic analysis is likely to play an important role as one tool within a collection of quantitative and qualitative assessment controls able to identify fraud perpetration in the financial services industry. Perhaps the most scandalous issue facing investors in the wake of the GFC has been the unearthing of a number of Ponzi schemes around the world. 1 The recent sentencing of Bernard L Madoff to 150 years in prison for his involvement in perhaps the largest, longest and most expansive Ponzi scheme in history (with fraud in the vicinity of USD$65 billion) 2 highlights the reality that white-collar crime is very much alive and well in the financial services industry. As policy-makers begin the difficult task of rethinking the regulatory framework that supports the global financial system, this study recommends that such deliberations will also need to consider the adequacy and implementation of current systems of fraud detection. In * Jacqueline M Drew is a Lecturer in the School of Criminology and Criminal Justice, Griffith University. Michael E Drew is Professor of Finance, Griffith Business School, Griffith University. We gratefully acknowledge the contribution of Managing Editor Kieran Tranter and the suggestions of the anonymous reviewers, which improved the article. We thank Robert Bianchi (Griffith), Evan Reedman (QIC) and Adam Walk (QIC) for their comments. 1 For a discussion regarding the design of these schemes, see Bhattacharya (2003). 2 See Benson (2009); Criminal Complaint, US v Bernard L Madoff, 08 Mag. 2735, SDNY; Complaint, SEC v Dipascali Jnr, (No 09 CIV 7085); US v Bernard L Madoff (09 CR 213) (DC), 29 June 2009.
Transcript
THE IDENTIFICATION OF PONZI SCHEMES Can a Picture Tell a Thousand Frauds?
Jacqueline M Drew and Michael E Drew*
There is voluminous commentary on the origins of the global financial crisis (GFC), international attempts to limit the contagion and the Herculean effort to stop the global economy sliding into a depression. However, in the fast-moving world of the GFC, the debate shifted to the search for answers to the most challenging question: can we stop this from occurring again? To date, a number of responses have been formulated, including the need for a more holistic approach to regulating the global financial system, more stringent controls on banks and new financial products and reform of executive remuneration practices that encourage excessive risk-taking. This article suggests that an additional issue in the reform debate warrants consideration. The adequacy and implementation of fraud-detection systems in the financial services industry must be addressed. The monthly returns from the largest feeder fund in the US$65 billion Ponzi scheme overseen by Bernard L Madoff are analysed to demonstrate how the performance characteristics of investment schemes can be used as a potential ʻred flagʼ indicator in a broad system of fraud detection. It is argued that performance characteristic analysis is likely to play an important role as one tool within a collection of quantitative and qualitative assessment controls able to identify fraud perpetration in the financial services industry.
Perhaps the most scandalous issue facing investors in the wake of the GFC has been the unearthing of a number of Ponzi schemes around the world.1 The recent sentencing of Bernard L Madoff to 150 years in prison for his involvement in perhaps the largest, longest and most expansive Ponzi scheme in history (with fraud in the vicinity of USD$65 billion)2 highlights the reality that white-collar crime is very much alive and well in the financial services industry. As policy-makers begin the difficult task of rethinking the regulatory framework that supports the global financial system, this study recommends that such deliberations will also need to consider the adequacy and implementation of current systems of fraud detection. In
* Jacqueline M Drew is a Lecturer in the School of Criminology and Criminal Justice, Griffith
University. Michael E Drew is Professor of Finance, Griffith Business School, Griffith University. We gratefully acknowledge the contribution of Managing Editor Kieran Tranter and the suggestions of the anonymous reviewers, which improved the article. We thank Robert Bianchi (Griffith), Evan Reedman (QIC) and Adam Walk (QIC) for their comments.
1 For a discussion regarding the design of these schemes, see Bhattacharya (2003). 2 See Benson (2009); Criminal Complaint, US v Bernard L Madoff, 08 Mag. 2735, SDNY;
Complaint, SEC v Dipascali Jnr, (No 09 CIV 7085); US v Bernard L Madoff (09 CR 213) (DC), 29 June 2009.
DREW AND DREW: THE IDENTIFICATION OF PONZI SCHEMES 49
advancing the debate, this article focuses on the analysis of performance characteristics of investment schemes as a potential red flag indicator of fraud detection. It is demonstrated, using the case of Madoff’s Ponzi scheme, how a critical evaluation of a fund’s performance characteristics can assist in the identification of fraudulent behaviour. Drawing on recent history and moving to a future focus, the article derives the key lessons that need to be learnt if frauds of this nature are to be prevented, or at the least minimised.
The study of the performance characteristics of various investment schemes in the financial services industry is a long-held tradition in the finance literature.3 Using the investment track record of the various schemes, these studies have largely focused on evaluating the skill (or otherwise) of the investment management industry. It is our conjecture that the potential for similar analysis, used as a technique within a system of fraud detection, has attracted comparatively little attention. Currently, even within the broader realms of criminological research, fraud risk detection remains an under-studied issue.4 The challenge for stakeholders in the financial services industry is to develop a coherent and specific set of tools that are systematically applied to fraud detection in a given context. As such, the goal of this article is to contribute to this area of research.
Prior to embarking on a detailed discussion of the statistical approach of analysing performance characteristics of Ponzi schemes, it is important to consider some contextual issues. The following discussion places our article in the broad context of the GFC, highlighting the role that the GFC played in the identification of fraud, in particular the identification of Ponzi schemes, and provides a brief introduction to the Madoff case.
The Context
The Role of the GFC in Fraud Detection: Ponzi Schemes and the Madoff Case The first documented Ponzi scheme can be traced back to the 1920s. Charles Ponzi offered Boston residents the opportunity to turn a $1000 investment into $1500 within a 45-day period.5 Instead of arbitraging ‘international rate differences in postal reply coupons’, early investors were paid their investment return using monies obtained from subsequent investors attracted to the scheme.6 It has been reported that Charles Ponzi successfully co-opted and subsequently ‘fleeced’ over 40 000 investors.7 This Ponzi scheme employs essentially the same approach as others that have followed. The originator of a Ponzi scheme raises money from investors who contribute cash to a scheme that (unbeknown to them) is based on no actual legitimate business or investment strategy. The Ponzi scheme creator engenders support from an ever-growing group of investors, usually with the
3 Sharpe (1966); Gruber (1996); Berk and Green (2004). 4 Duffield and Grabosky (2001). 5 Baker and Faulkner (2003). 6 Baker and Faulkner (2003), p 1601. 7 Benson (2009).
50 GRIFFITH LAW REVIEW (2010) VOL 19 NO 1
promise of high and consistent returns on investment. Investors who wish to liquidate their investment or seek to draw an income stream from their investment – as in the days of Charles Ponzi – are actually being paid by the contribution of new investors in the scheme. The Ponzi scheme inevitably comes to light when liquidity demands of investors exceed the ability of the Ponzi founder to source new investments.8
History shows that numerous individuals have followed in the path of Charles Ponzi.9 Madoff is arguably the most ‘successful’ Ponzi scheme operator, being able to manage and grow his scheme for almost two decades.10 The liquidity ‘crunch’ that saw the eventual demise of Madoff’s Ponzi scheme occurred, in part, as a result of the GFC. The GFC sparked a general run on investment withdrawals sparked by falls on the stockmarket and a worsening economic climate. Like investors worldwide, Madoff’s investors sought to consolidate and move out of the market.11 Madoff and his networks were unable to attract sufficient new investments to cover investor withdrawals.
Identification of Fraud-detection Factors It is important to consider whether the clues necessary to uncover Madoff’s Ponzi scheme could only have been found as a result of a significant shock to the market, such as that seen during the GFC. Based on recent complaints lodged by the US Securities and Investment Commission (SEC), litigation proceedings, trial documents and findings based on an investigation into the failure of the SEC to uncover the Madoff scheme, it is proposed that a number of indicators or red flags of fraud could have been identified much earlier.12 The SEC complaint details a number of operational red flags that should have been of immediate concern to investors, including the role of feeder funds; the culture of exclusivity surrounding entry into Madoff-related funds; the unique remuneration arrangements of the feeder funds13 and the lack of base-plus-performance fees of Madoff’s operation; alleged auditor shopping by the feeder funds; and the appointment of a small accounting practice to audit Madoff’s operations. As Gregoriou and Lhabitant neatly summarise, ‘some of the salient operational features common to best-of-breed hedge funds were clearly missing from Madoff’s operations’.14 8 Benson (2009). 9 For a summary of Ponzi schemes, see the interactive graphics provided by the Wall Street Journal,
available at http://online.wsj.com/article/SB122903010173099377.html. This reference also provides details of individuals awaiting trial for alleged Ponzi schemes.
10 Complaint, SEC v Madoff, Bernard L Madoff Investment Securities LLC (No 08 CIV 10791). 11 Benson (2009). 12 Complaint, SEC v Madoff, Bernard L Madoff Investment Securities LLC, (No 08 CIV 10791);
Complaint, SEC v Dipascali Jnr, (No 09 CIV 7085); Complaint, SEC v Cohmad Securities Corporation, Maurice J Cohen, Marcia B Cohen, and Robert M Jaffe (No 09 CIV 5680); Complaint, SEC v David G Friehling, Friehling and Horowitz, CPAs, PC (No 09 CV 2467); Office of Inspector General (2009).
13 A feeder fund is a type of an investment vehicle that may undertake the majority (or all) of its investment activity through a master fund.
14 Gregoriou and Lhabitant (2009) p 89.
DREW AND DREW: THE IDENTIFICATION OF PONZI SCHEMES 51
It has been proposed that fraud detection is maximised when red flags, indicating an increased likelihood that fraudulent behaviour has or is occurring, are accurately identified and appropriate action taken.15 Red flags are used to identify anomalies (variations from normal patterns of behaviour).16 In isolation, individual red flags may not be a ‘smoking gun’, but may act as a catalyst for more detailed investigation. As discussed by others, little authoritative guidance currently exists as to the process of combining red flags within a coherent and systematic system of risk and/or detection.17
To advance this discussion, it is appropriate to reflect on a criminological understanding of fraud. Applying routine activities theory, crime occurs as a function of the presence of a motivated offender, the availability of suitable targets and a lack of capable guardians.18 Fraud is motivated by a combination of an individual’s personality and situational factors.19
Fraud occurs when an opportunity for fraudulent activity exists and the perceived likelihood of detection is low.20 It has been argued that the world of finance is one that vulnerable and attractive in terms of fraudulent behaviour.21 Further, this context is one in which new opportunities for fraudsters appear to emerge almost daily.22 This statement is partly based in the notion that environments or situations can be categorised along a fraud-risk continuum, with some situations being low risk while others represent high-risk contexts.23 Firms within the financial services industry, by their nature, constitute a high-risk context where significant opportunities for fraud exist. Drawing from Cressey’s seminal work on embezzlement,24 major financial fraud is able to be committed by those who hold organisational positions that facilitate the fraud within a context of legitimacy: as often quoted, ‘the best way to rob a bank is to own one’.25
Organisations within the financial services industry are attractive for two key reasons. First, fraud perpetrated in such a context may involve significant financial rewards dependent on the size of the financial asset pool managed by the organisation.26 Second, individuals within the organisation, particularly senior management and chief executive officers (CEOs), can take the opportunities available to them as a function of their legitimate control over the organisational
15 Deshmukh et al (1997). 16 Duffield and Grabosky (2001). 17 For an illustrative example of the type of work that has been conducted, see Deshmukh et al
(1997). 18 Cohen and Felson (1979). 19 Duffield and Grabosky (2001). 20 Hillison et al (1999). 21 Coleman (2002). 22 Chapman and Smith (2001). 23 Duffield and Grabosky (2001). 24 Cressey (1955). 25 Crawford, cited in Black (2005), p 738. 26 Coleman (2002).
52 GRIFFITH LAW REVIEW (2010) VOL 19 NO 1
financial asset pool to perpetuate fraud and protect themselves from detection.27 Therefore, it may be argued that a robust fraud-detection system – in this case, one developed for the financial services industry – necessitates the tailoring of the detection system to this specific context, identifying the particular types of red flag indicators or anomalies that may be indicative of fraudulent behaviour. Grabosky and Duffield suggest that anomalies can be categorised in three broad areas: behavioural, statistical and organisational (see Table 1).28
Table 1: Anomalies as red flags29 Behavioural Statistical Organisational Unusual patterns of behaviour such as living beyond one’s means or, more generally, sudden changes in one’s activity.
Statistical incongruities, measures that begin to ‘stand out’. These irregularities may be entirely legitimate, but they may indicate something to the contrary.
Characteristics of an organisation that differ markedly from those generally regarded as best practice and departures from conventional standards.
We contend that, given the magnitude and complexity of the Madoff scandal,
it is beyond the scope of a single article to consider with appropriate depth all the behavioural, statistical and organisational anomalies surrounding the case. New research and analysis are being published almost daily, particularly in mainstream and specialist media outlets.30 To contribute to the current debate on regulatory reform of the global financial system, this article focuses on the statistical anomalies relating to the Madoff case. Statistical anomalies are defined as ‘statistical incongruities’.31 A statistical anomaly example provided by Grabosky and Duffield is when tax deductions actually exceed a reasonable proportion of income. As a general rule of thumb, statistical anomalies are those statistics or numbers that ‘stand out’ as not believable.32 In this article, statistical anomalies analysis provides an illustrative example of how specific tools chosen due to their particular relevance to the context being analysed may lead to earlier and more compelling discoveries of red flag markers of fraud.
Using the Madoff case, the key statistical irregularity identified in the article is the incongruity between the equity-like returns achieved over nearly two decades of investing, with an apparent absence of risk. The central source of data analysed in the study is the track record of one of Madoff’s key feeder funds, the Fairfield
27 Black (2005). 28 Grabosky and Duffield (2001). 29 Adapted from Grabosky and Duffield (2001). 30 One of the first to be published in a peer-reviewed journal on the case is a case study by Gregoriou
and Lhabitant (2009). This work explores, among other themes, many of the organisational issues that surround the Madoff case, including a detailed discussion of the salient operational features of the Ponzi scheme.
31 Grabosky and Duffield (2001), p 2. 32 Grabosky and Duffield (2001).
DREW AND DREW: THE IDENTIFICATION OF PONZI SCHEMES 53
Sentry Fund. The aim of the article is to use well-known, commonly employed evaluation techniques to consider the performance characteristics of a Ponzi fund. Others have highlighted that returns which are abnormally high, have little volatility and lack comparability to returns of others using similar investment strategies are potential red flags.33 However, little guidance has been provided regarding the tools needed to systematically assess these issues and what considerations need to be addressed to ensure that the analysis which is undertaken is actually appropriate.
In sum, the analysis presented in this article provides a reference point for those involved in undertaking due diligence of investment schemes. The article provides a set of potential external control indicators (or red flags) that may be part of a much larger system of fraud detection tailored to the needs of the financial services industry. The potential control indicators employed take the form of received statistical and quantitative techniques to complement qualitative due diligence.
Findings and Analysis
Fairfield Sentry Fund and the Split-strike Conversion In late 1990, Fairfield Greenwich Group launched a stand-alone split strike conversion fund, Fairfield Sentry. Bernard L Madoff Investment Securities LLC (Madoff Securities) acted as sub-advisor, running the fund’s investment strategy on behalf of the investment manager, as well as being prime broker and sub-custodian.34 The centrepiece of the new fund was its proprietary return-generating mechanism, the split-strike conversion. A fact sheet issued by Fairfield Greenwich Group in October 2008 on the Fairfield Sentry Fund outlines the specifics of the split strike conversion:
The establishment of a typical position entails (i) the purchase of a group or basket of equity securities that are intended to highly correlate to the S&P 100 Index, (ii) the purchase of out-of-the-money S&P 100 Index put options with a notional value that approximately equals the market value of the basket of equity securities and (iii) the sale of out-of-the-money S&P 100 Index call options with a notional value that approximately equals the market value of the basket of equity securities. The basket typically consists of between 40 to 50 stocks in the S&P 100 Index. The primary purpose of the long put options is to limit the market risk of the stock basket at the strike price of the long puts. The primary purpose of the short call options is to largely finance the cost of the put hedge and to increase the stand-still rate of return.35
33 For an example of such discussions, see Benson (2009). 34 This summary was provided by Barclays Wealth in a letter to investors dated December 2008,
available at http://extras.timesonline.co.uk/barc2.pdf. Reaction to the letter has been reported on by Robert Watts (8 February 2009) in the UK Sunday Times and is available at: http://business.timesonline.co.uk/tol/business/industry_sectors/banking_and_finance/article5683564.ece.
35 The Fairfield Sentry Fund factsheet is available filed in court documents lodged in Massachusetts, available at www.sec.state.ma.us/sct/sctfairfield/Fairfield_Exhibits_24.pdf. In short, the kind of
54 GRIFFITH LAW REVIEW (2010) VOL 19 NO 1
The Fairfield Sentry fund followed a market neutral strategy. Patton explains that market neutral funds attempt to generate returns that are uncorrelated with the returns on some market index, or a collection of market risk factors.36 The split-strike conversion is a very specific style of equity market neutral strategy that implements a vertical call spread.37
What is an Appropriate Proxy for Relative Performance? One of the key issues facing those undertaking due diligence is the selection of an appropriate benchmark (or reference rate) that provides some insight into the risk and reward characteristics of the investment scheme. The recent work of Bernard and Boyle and Clauss and colleagues replicates numerous iterations of the split-strike conversion (using differing strikes and volatility assumptions) on both the S&P100 and S&P500 to provide a set of return expectations generated in a lab.38 The conclusions of both studies are stark: the results from the hypothesised split-strike conversion for the period December 1990 through October 2008 suggest marginally favourable risk reward characteristics over the S&P500 (before transaction costs and any price impacts from trades). However, these hypothesised returns come with a commensurate level of risk. The correlation of the replicated strategies with the S&P500 was around 0.95 (split-strike strategy with no volatility skew ρ = 0.9480/with volatility skew ρ = 0.9514). These results are vastly higher than Fairfield Sentry’s correlation coefficient with S&P500, which we estimate at 0.32 (see Table 2).39 Table 2: Correlation matrix
These replication studies illustrated that, even with the addition of the collar to
long positions in up to 50 stocks, the hypothesised split strike conversion remains very tightly correlated with the S&P500 index.40 The low correlation between the monthly returns form Fairfield Sentry and the S&P500 (ρ = 0.32) is supported by a
investment strategy described seeks to take advantage of a directional movement in equity securities (either up or down), particularly over the short term.
36 Patton (2009). 37 A detailed discussion of the mechanics of the split strike conversion is provided in Bernard and
Boyle (2009); Clauss et al (2009). 38 Bernard and Boyle (2009); Clauss et al (2009). 39 The correlation estimate of ρ = 0.32 between the monthly returns from Fairfield Sentry and the
S&P500 has been independently confirmed by Bernard and Boyle (2009). 40 Bernard and Boyle (2009); Clauss et al (2009).
DREW AND DREW: THE IDENTIFICATION OF PONZI SCHEMES 55
fact sheet issued by Fairfield Sentry in October 2008, reporting that the correlation between the fund and the related S&P100 since inception was ρ = 0.35.41
This creates an immediate challenge for the process of due diligence. It seems appropriate that a proxy relating to the performance of peers from the equity market neutral universe of hedge funds is required to inform the analysis. We use the Hedge Fund Research, Inc. (hereafter referred to as HFRI) equity market neutral index in this study. We argue that the HFRI is appropriate as the index construction methodology is based on equally-weighted performance results. At its zenith, Fairfield Sentry was one of the largest equity market neutral funds in the world and, as such, heavily influenced peer indices that used a value-weighted (that is, FUM-weighted) methodology, hence our decision to opt for an equal-weighted benchmark. Next, the high correlation between the replicated returns from of the split strike conversion developed by Bernard and Boyle and Clauss and colleagues to the returns from the S&P500 Total Return Index (hereafter referred to as S&P500) warrants the inclusion of this benchmark in the analysis.42 The correlation of monthly returns of Fairfield Sentry, HFRI and S&P500 is provided in Table 2.
Visual Inspection of the Fairfield Sentry Track Record The track record of Fairfield Sentry since its inception through to October 2008 is provided in Table 3. Fairfield Sentry reported a total of 16 negative returns over almost 18 years of operation (a total of 215 months). As will be reported in the section below analysing winning versus losing months, Fairfield Sentry was batting at a success rate of 93 per cent – that is, only 7 per cent of all months in the track record recorded returns less than zero – over almost two decades of investing.
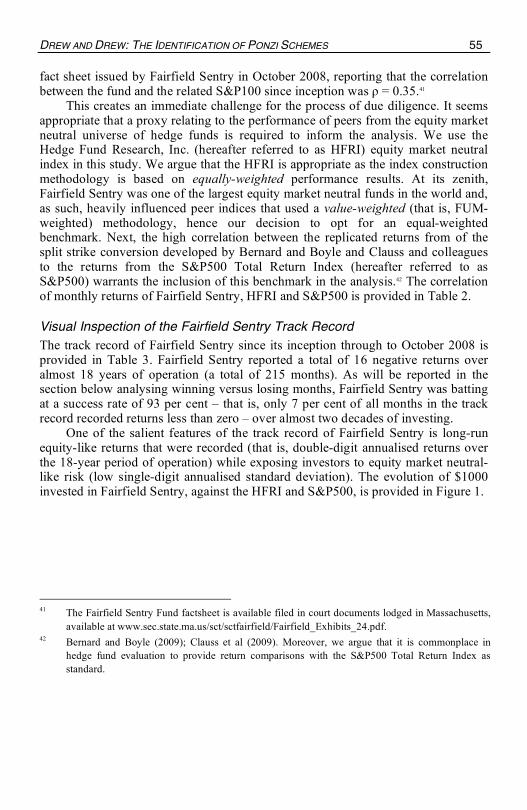
One of the salient features of the track record of Fairfield Sentry is long-run equity-like returns that were recorded (that is, double-digit annualised returns over the 18-year period of operation) while exposing investors to equity market neutral-like risk (low single-digit annualised standard deviation). The evolution of $1000 invested in Fairfield Sentry, against the HFRI and S&P500, is provided in Figure 1.
41 The Fairfield Sentry Fund factsheet is available filed in court documents lodged in Massachusetts,
available at www.sec.state.ma.us/sct/sctfairfield/Fairfield_Exhibits_24.pdf. 42 Bernard and Boyle (2009); Clauss et al (2009). Moreover, we argue that it is commonplace in
hedge fund evaluation to provide return comparisons with the S&P500 Total Return Index as standard.
Table 3: Fairfield Sentry Fund (Decem
ber 1990 through October 2008, n=215)
Jan
Feb M
ar Apr
May
Jun Jul
Aug Sep
Oct
Nov
Dec
2008 0.63
0.06 0.18
0.93 0.81
-0.06 0.72
0.71 0.50
-0.06
2007 0.29
-0.11 1.64
0.98 0.81
0.34 0.17
0.31 0.97
0.46 1.04
0.23
2006 0.70
0.20 1.31
0.94 0.70
0.51 1.06
0.77 0.68
0.42 0.86
0.86 2005
0.51 0.37
0.85 0.14
0.63 0.46
0.13 0.16
0.89 1.61
0.75 0.54
2004 0.88
0.44 -0.01
0.37 0.59
1.21 0.02
1.26 0.46
0.03 0.79
0.24
2003 -0.35
-0.05 1.85
0.03 0.90
0.93 1.37
0.16 0.86
1.26 -0.14
0.25
2002 -0.04
0.53 0.39
1.09 2.05
0.19 3.29
-0.14 0.06
0.66 0.10
0.00
2001 2.14
0.08 1.07
1.26 0.26
0.17 0.38
0.94 0.66
1.22 1.14
0.12 2000
2.14 0.13
1.77 0.27
1.30 0.73
0.58 1.26
0.18 0.86
0.62 0.36
1999 1.99
0.11 2.22
0.29 1.45
1.70 0.36
0.87 0.66
1.05 1.54
0.32 1998
0.85 1.23
1.68 0.36
1.69 1.22
0.76 0.21
0.98 1.86
0.78 0.26
1997 2.38
0.67 0.80
1.10 0.57
1.28 0.68
0.28 2.32
0.49 1.49
0.36 1996
1.42 0.66
1.16 0.57
1.34 0.15
1.86 0.20
1.16 1.03
1.51 0.41
1995 0.85
0.69 0.78
1.62 1.65
0.43 1.02
-0.24 1.63
1.53 0.44
1.03
1994 2.11
-0.44 1.45
1.75 0.44
0.23 1.71
0.35 0.75
1.81 -0.64
0.60
1993 -0.09
1.86 1.79
-0.01 1.65
0.79 0.02
1.71 0.28
1.71 0.19
0.39
1992 0.42
2.72 0.94
2.79 -0.27
1.22 -0.09
0.86 0.33
1.33 1.36
1.36
1991 3.01
1.40 0.52
1.32 1.82
0.30 1.98
1.00 0.73
2.75 0.01
1.56 1990
2.77
DREW AND DREW: THE IDENTIFICATION OF PONZI SCHEMES 57
Figure 1: Evolution of $1000 invested (Dec 1990 through Oct 2008)
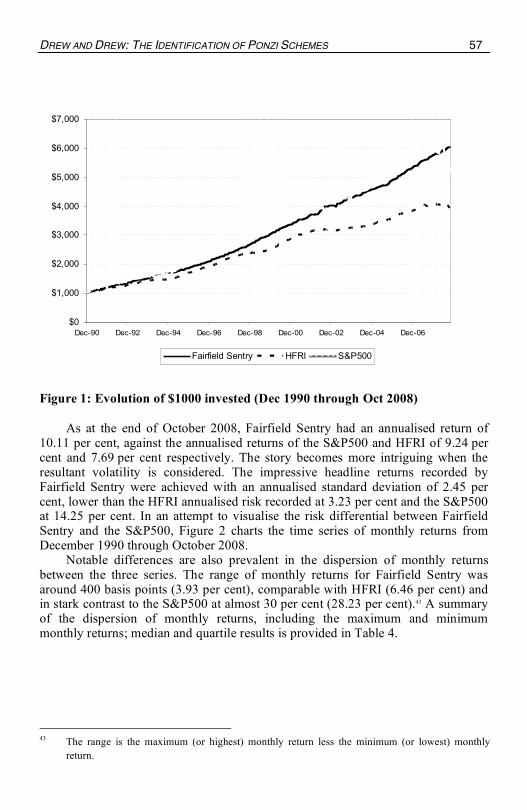
As at the end of October 2008, Fairfield Sentry had an annualised return of 10.11 per cent, against the annualised returns of the S&P500 and HFRI of 9.24 per cent and 7.69 per cent respectively. The story becomes more intriguing when the resultant volatility is considered. The impressive headline returns recorded by Fairfield Sentry were achieved with an annualised standard deviation of 2.45 per cent, lower than the HFRI annualised risk recorded at 3.23 per cent and the S&P500 at 14.25 per cent. In an attempt to visualise the risk differential between Fairfield Sentry and the S&P500, Figure 2 charts the time series of monthly returns from December 1990 through October 2008.
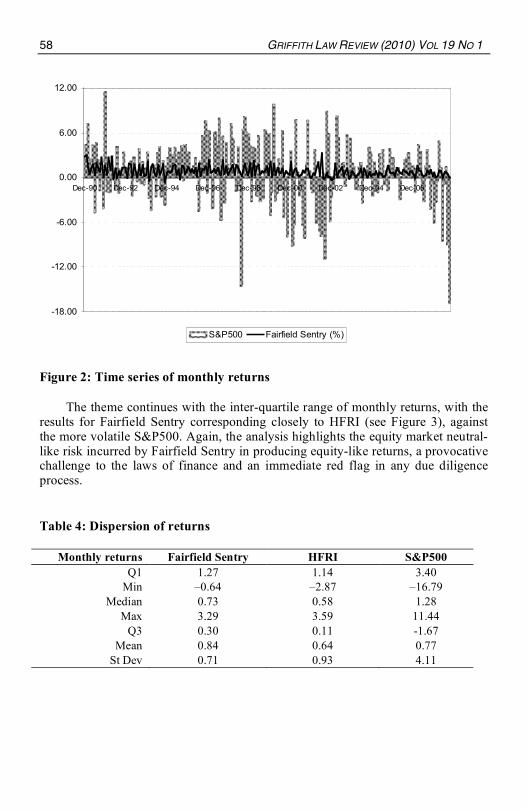
Notable differences are also prevalent in the dispersion of monthly returns between the three series. The range of monthly returns for Fairfield Sentry was around 400 basis points (3.93 per cent), comparable with HFRI (6.46 per cent) and in stark contrast to the S&P500 at almost 30 per cent (28.23 per cent).43 A summary of the dispersion of monthly returns, including the maximum and minimum monthly returns; median and quartile results is provided in Table 4.
43 The range is the maximum (or highest) monthly return less the minimum (or lowest) monthly
The theme continues with the inter-quartile range of monthly returns, with the results for Fairfield Sentry corresponding closely to HFRI (see Figure 3), against the more volatile S&P500. Again, the analysis highlights the equity market neutral-like risk incurred by Fairfield Sentry in producing equity-like returns, a provocative challenge to the laws of finance and an immediate red flag in any due diligence process.
DREW AND DREW: THE IDENTIFICATION OF PONZI SCHEMES 59
0.73 0.58
-4.00
-3.00
-2.00
-1.00
0.00
1.00
2.00
3.00
4.00
Fairfield Sentry HFRI
Q1 Min Median Max Q3
Figure 3: Box-and-whisker diagram
We turn our analysis to shape of the monthly return distribution, specifically skewness and kurtosis. The results presented in Table 4 highlight that the mean monthly return for Fairfield Sentry (84 bps) is greater than the median (73bps). The positive skewness of Fairfield Sentry returns is estimated at 0.78, against the perfect symmetry of a normal distribution. This is in contrast to the S&P500 where negative skewness of monthly returns is evident (mean 77bps versus median 128bps), resulting in an estimated skewness of –0.77. The peakedness of the monthly return distribution also highlights a number of differences. Estimates of excess kurtosis suggest only minor differences from the standard normal for Fairfield Sentry (0.47 versus zero for a Gaussian distribution) and HFRI (0.94), with the estimated excess kurtosis much higher for the S&P 500 (1.79). Like the vast majority of time series returns in finance, all three return series reject the assumption of normality of monthly returns; however, the positive skewness evident in the Fairfield Sentry track record is again seems somewhat anomalous.44
We provide an insight into the return experience of investors in Fairfield Sentry (as well as HFRI and S&P500) by providing a histogram of returns in Figure 4. Histograms allow for the visual representation of monthly returns, highlighting the positively skewed, low volatile experience of Fairfield Sentry at one end of the continuum, the more symmetrical returns of HFRI, through to the negatively skewed, highly dispersed experience of those exposed to the S&P500.
44 Deviation from normality is further confirmed by Jarque and Bera (1980) test statistics, which were
significant at the five per cent statistical level for all three series and the one per cent level for Fairfield Sentry and S&P500. The results of the Jarque-Bera tests were: Fairfield Sentry (23.81); HFRI (7.95); and S&P500 (49.50).
60 GRIFFITH LAW REVIEW (2010) VOL 19 NO 1
0%
4%
8%
12%
16%
-6 -5 -4 -3 -2 -1 0 1 2 3 4 5 6
Fairf ield (Bar) S&P500 (Line) HFRI (Line)
Figure 4: Histogram of monthly returns for Fairfield Sentry
Winning versus Losing As discussed previously, Fairfield Sentry was batting at a 93 per cent success rate in terms of the number of positive returns (compared with 79 per cent for HFRI and, relatively speaking, a monthly success rate of two-thirds, 65 per cent, for the S&P500). In other words, for every one month of negative returns, investors in Fairfield Sentry enjoyed over twelve months of positive returns over the 18-year period. This is in stark contrast to even HFRI, where for every month of negative returns, around four months of positive returns were recorded (3.78 months), and the S&P500, where a ratio of around one losing month to two winning months was recorded (1.83). A summary of these results is provided in Table 5.
To contextualise the anomalous nature of Fairfield Sentry’s winning form, we provide some of the more notable track records for your consideration: Warren Buffett (investor), annual out-performance of the S&P500 from 1965 through 2008, 38 out of 44 years (winning percentage 86 per cent);45 Wayne Bennett (Rugby League coach) 368 wins from 576 matches (winning percentage of 64 per cent);46 and Sir Alex Ferguson (football coach, Premier League only) 746 wins from 1277 matches (winning percentage of 58 per cent).47 A box-and-whiskers diagram of the distribution of returns in winning versus losing months for Fairfield Sentry is provided in Figure 7 (it is important to note that the median returns are reported, the average winning month return was recorded at 92bps, the average losing month was 17bps). For due diligence experts, the results of Figure 5, particularly in light of a 93 per cent winning record, defy the received positive, linear association between risk and reward. 45 Track record provided by Berkshire Hathaway: www.berkshirehathaway.com/letters/2008ltr.pdf. 46 Data provided by Wikipedia: http://en.wikipedia.org/wiki/Wayne_Bennett_(rugby_league). 47 Data provided by Wikipedia: http://en.wikipedia.org/wiki/Alex_Ferguson.
DREW AND DREW: THE IDENTIFICATION OF PONZI SCHEMES 61
Table 5: Comparison of winning versus losing months
Count 199 16 170 45 139 76 Percentage 93% 7% 79% 21% 65% 35% Ratio of Winning to Losing Months 12.44 3.78 1.83 Mean 0.92 -0.17 0.97 -0.59 3.12 -3.53 Ratio of average win to average loss 5.39 1.64 0.88 Q1 1.33 -0.06 1.35 -0.18 4.33 -1.57 Min 0.00 -0.64 0.01 -2.87 0.03 -16.79 Median 0.79 -0.10 0.81 -0.35 2.58 -2.44 Max 3.29 -0.01 3.59 -0.01 11.44 -0.36 Q3 0.38 -0.25 0.44 -0.95 1.32 -4.46 Note: Losing is defined as a monthly return less than zero.
0.79
-0.10
-2.00
-1.00
0.00
1.00
2.00
3.00
4.00
Winning Losing
Q1 Min Median Max Q3
Winning Month Average Return = 0.92
Losing Month Average Return = -0.17
Figure 5: Winning versus losing months, Fairfield Sentry
Drawdown and Downside Risk Given that the monthly returns from Fairfield Sentry, HFRI and S&P500 violate the assumption of normality, it may be appropriate to consider the downside risk of the respective series of returns. Drawdown captures the peak-to-trough declines that
62 GRIFFITH LAW REVIEW (2010) VOL 19 NO 1
occur in investment schemes as an alternative measure of risk.48 The maximum drawdown (hereafter referred to as max-draw) for the Fairfield Sentry fund over nearly two decades of operation was recorded at 64bps (December 1994). This compares with the HFRI max-draw of 580bps (October 2008; the previous max-draw was 272bps recorded in April 1999) and the S&P500 max-draw of 4,473bps (–44.73 per cent), which occurred in September 2002. (It is important to note that the data analysed in this study conclude at the end of October 2008; the S&P500 reached a new max-draw level at the height of the GFC in early 2009.) The analysis suggests that the max-draw of the peer proxy HFRI was around nine times larger than that of Fairfield Sentry. A further insight that can be drawn from the analysis is that the very difficult return period for equity market-neutral funds (using the HFRI index as a proxy) throughout 1998 and 1999 was of little concern to Fairfield Sentry – in fact, the fund did not report a single negative return month between September 1995 and December 2001 (an unbroken positive return streak of 76 months or over six years).49
Note: The y-axis has been adjusted to be a maximum value of three per cent to allow the small drawdowns in the Fairfield Sentry fund to be apparent in the diagram (again, the max-draw for the HFRI index in October 2008 was 5.80%). Figure 6: Drawdown Diagram, Fairfield Sentry and HFRI
48 Pardo (2008). 49 We have also calculated both historical and parametric estimates of value-at-risk, which again
highlight the very limited left tail risk reported by Fairfield Sentry as compared to HFRI and S&P500. For the sake of brevity, these have not been included in the article but are available on request from the authors.
DREW AND DREW: THE IDENTIFICATION OF PONZI SCHEMES 63
Conclusions and Future Directions Taking a broad view of the impact of the GFC on the financial services industry, this article sits within a growing body of work that has begun to focus on what can be learnt from the current crisis that can be used to insulate and prevent a repeat occurrence of similar, future shocks to the global financial system. This article is presented from the standpoint that the adequacy and implementation of fraud-detection systems in the financial services industry must be addressed as a key outcome of the GFC.
The preceding analysis focused on the statistical anomalies found in the Madoff case. The Madoff Ponzi scheme was used as a contemporary example to illustrate the tools and considerations that can be applied to identify red flags of fraudulent activity, and in particular the existence of a Ponzi scheme. The article was founded on the need to answer one simple question: were the returns reported for Madoff’s investment scheme simply too good to be true? While this question appears to be a seemingly simple one to answer given the analysis presented in this article, the issue of benchmark selection and the search for a reasonable proxy against which to evaluate performance remains controversial. However, it is argued that a pragmatic approach which includes peer-based and more traditional reference rates can provide important positive insights into performance characteristics.
Lessons to be Learnt: Implementing Robust Fraud-detection Systems It would be unwise to conclude on the basis of the findings here that the identification of statistical anomalies is the only answer to strengthening existing fraud-detection systems. While the statistical tools and considerations provided in this article are designed to support the further development of statistical controls in the identification of red flags of fraud, it is recognised that this development must be undertaken in concert with enhancements to existing behavioural and organisational controls.50
Evidence of the need to undertake the simultaneous evaluation across these three types of anomalous behaviours is in fact provided by the Madoff case itself. One of the intriguing features of this case is that there were some analysts who managed to detect the fraud some time before its eventual downfall. It is well documented that Madoff whistleblower Harry Markopolos first sounded the alarms regarding the Madoff track record in 1999 (and on a number of now well-documented occasions with regulators over the following decade).51 Hedge fund due diligence specialists Askia LLC recommended their clients not invest in Madoff’s feeder funds over a number of years due to a variety of operational red flags.52 While the two sets of analysis by Markopolos and Askia LLC took differing approaches, they both had one element in common: both parties took a multi-
50 Grabosky and Duffield (2001). 51 A summary of the analysis conducted by Harry Markopolos has been reported widely – for
instance, see the article by the Associated Press (19 December 2008 at www.msnbc.msn.com/id/28310980.
52 A copy of Askia LLC’s letter to clients following the demise of Madoff is available at the New York Times website: http://graphics8.nytimes.com/packages/pdf/business/Madoff.pdf.
64 GRIFFITH LAW REVIEW (2010) VOL 19 NO 1
dimensional approach to their respective systems of fraud detection – behavioural, statistical and organisational.
Employing a multi-dimensional approach to fraud detection is relevant to investors, due diligence experts, regulators and policy-makers who seek to determine the genuineness and authenticity of investment schemes. However, it is likely that the lessons drawn from the increasing numbers of Ponzi schemes that are being identified around the globe – a situation described by some as ‘rampant Ponzimonium’ and ‘Ponzi-Palooza’53 – will have the most significant impact on due diligence experts, regulators and policy-makers.
Preliminary evidence suggests that regulators are already moving to address a number of shortcomings that have been exposed as a result of high-profile cases such as the Madoff case. Recently, the SEC’s Office of Inspector General released a report detailing an investigation commissioned to identify the reasons why the SEC did not detect the Madoff fraud earlier.54 Pre-emptively, the SEC has reported that it is undertaking a number of reforms for the purpose of preventing future frauds and ensuring more timely fraud detection.55
The investigation conducted by the SEC’s Office of Inspector General found that:
the SEC received more than ample information in the form of detailed and substantive complaints over the years to warrant a thorough and comprehensive examination and/or investigation of Bernard Madoff and BMIS for operating a Ponzi scheme, and that despite three examinations and two investigations being conducted, a thorough and competent investigation or examination was never performed. The OIG found that between June 1992 and December 2008 when Madoff confessed, the SEC received six substantiative complaints that raised significant red flags concerning Madoff’s hedge fund operations and should have led to questions about whether Madoff was actually engaged in trading.56
Turning to the reforms that have recently been proposed by the SEC in light of the Madoff case, the reform agenda that has been proposed may result in some important steps forward. Whilst the SEC have proposed a multitude of reforms, of particular significance to this article are those reforms that seek to improve fraud-detection techniques of examiners; the recruitment of staff with specialised experience and skills such as financial and accounting experts; conducting risk-based examinations of financial firms; specialised training for SEC staff such as Certified Fraud Examiners and Certified Financial Analysts courses; and seeking greater resources by the SEC to hire more agency staff.57 53 Commissioner Bart Chilton of the US Commodity Futures Trading Commission; comments can be
assessed in an article by Jason Szep of Reuters (UK), available at http://uk.reuters.com/article/idUKTRE52J61R20090320; Ponzi-Palooza is a play on the word ‘Lollapalooza’, an American music festival featuring a long list of acts.
54 Office of Inspector-General (2009). 55 SEC (2009). 56 Office of Inspector-General (2009), p 1. 57 SEC (2009).
DREW AND DREW: THE IDENTIFICATION OF PONZI SCHEMES 65
The reforms recognise the complexity of financial fraud. Regulators and others must be able to employ tools and skills across a system of fraud detection that will identify statistical, behavioural and organisational red flag indicators of fraud. This aim can only be achieved if those seeking to identify fraud are sufficiently skilled in both financial analysis and fraud detection. Further, information once yielded needs to be acted upon. In sum, adequate resources must be available to either up-skill existing employees or employ financial experts who have the knowledge and skill to analyse complex financial dealings. Resources must also be available to support the enactment of thorough investigations and subsequent follow-up of investigative leads or red flags.
Due diligence experts, regulators and policy-makers all have a role in identifying potential fraud and are crucial contributors to the prevention of fraud. As recognised by the SEC, the challenge of fraud must be tackled head-on, and past mistakes and inadequacies exposed. In the Madoff case, discovered largely as a result of the GFC, previous failures must be translated into reform.
This article has provided a contribution to what is currently known about the skills and techniques that are required of those who seek to identify statistical anomalies as red flags of fraud in financial services industry. This is one set of skills that those charged with fraud detection need to develop. It is hoped that work will continue in further developing this area of detection, identifying the range of statistical approaches that may lead to fraud identification. In addition, similar work is needed in establishing new and more precise detection tools in the areas of behavioural and organisational anomalies.
We cannot turn back time: ‘ponzimonium’ as exposed by the GFC has occurred and in its wake it has left financial devastation for many. However, what can be salvaged are those key learnings and lessons about fraud detection that are now known. The type and enormity of fraud that was left relatively unchecked until the impact of the GFC must not be allowed an encore performance.
References
Secondary Sources WE Baker and RR Faulkner (2003) ‘Diffusion of Fraud: Intermediate Economic Crime and Investor
Dynamics’ 41(4) Criminology 1601. U Bhattacharya (2003) ‘The Optimal Design of Ponzi Schemes in Finite Economies’ 12 Journal of
Financial Intermediation 2. S Benson (2009) ‘Recognizing the Red Flags of a Ponzi Scheme’ 79(6) The CPA Journal 19. J Berk and R Green (2004) ‘Mutual Fund Flows and Performance in Rational Markets’ 112(6) Journal of
Political Economy 1269. C Bernard and P Boyle (2009) ‘Mr Madoff's Amazing Returns: An Analysis of the Split-Strike
Conversion Strategy’, Working Paper, http://ssrn.com/abstract=1371320. WK Black (2005) ‘“Control Frauds” as Financial Super-predators: How “Pathogens” Make Financial
Markets Inefficient’ 34 The Journal of Socio-Economics 734. A Chapman and RG Smith (2001) Controlling Financial Services Fraud, Trends and Issues in Crime
and Criminal Justice no 189, Australian Institute of Criminology.
66 GRIFFITH LAW REVIEW (2010) VOL 19 NO 1
P Clauss, T Roncalli and G Weisang (2009) ‘Risk Management Lessons from Madoff Fraud’, Working Paper, http://ssrn.com/abstract=1358086.
Lawrence Cohen and Marcus Felson (1979) ‘Social Change and Crime Rate Trends: A Routine Activity Approach’ 44 American Sociological Review 588.
James William Coleman (2002) The Criminal Elite: Understanding White-Collar Crime, 5th ed, Worth Publishers.
Donald Cressey (1955) Other People’s Money, Free Press. A Deshmukh, J Romine and PH Siegel (1997) ‘Measurement and Combination of Red Flags to Assess
the Risk of Management Fraud: A Fuzzy Set Approach’ 23(6) Managerial Finance 35. G Duffield and P Grabosky (2001) The Psychology of Fraud, Trends and Issues in Crime and Criminal
Justice no 199, Australian Institute of Criminology. G Gregoriou and F Lhabitant (2009) ‘Madoff: A Flock of Red Flags’ 12(1) Journal of Wealth
Management 89. P Grabosky and G Duffield (2001) Red Flags of Fraud, Trends and Issues in Crime and Criminal Justice
no 200, Australian Institute of Criminology. M Gruber (1996) ‘Another Puzzle: The Growth in Actively Managed Mutual Funds’ 51(3) Journal of
Finance 783. W Hillison, C Pacini and D Sinason (1999) ‘The Internal Auditor as Fraud-buster’ 14(7) Managerial
Auditing Journal 351. M Jarque and A Bera (1980) ‘Efficient Tests for Normality, Homoscedasticity and Serial Independence
of Regression Residuals’ 6(3) Economics Letters 255. Office of Inspector General (2009) Investigation of Failure of the SEC to Uncover Bernard L Madoff’s
Ponzi Scheme, US Securities and Exchange Commission. R Pardo (2008) The Evaluation and Optimization of Trading Strategies, Wiley Trading. A Patton (2009) ‘Are “Market Neutral” Hedge Funds Really Market Neutral?’ 22(7) Review of Financial
Studies 2495. Securities and Exchange Commission (2009) The Securities and Exchange Commission Post-Madoff
Reforms, www.sec.gov/spotlight/secpostmadoffreforms.htm. W Sharpe (1966) ‘Mutual Fund Performance’ 39(1) Journal of Business 119.
Cases SEC v Cohmad Securities Corporation, Maurice J. Cohen, Marcia B. Cohen, and Robert M. Jaffe, (No.
09 CIV 5680), www.sec.gov/litigation/complaints/2009/comp21095.pdf. SEC v David G. Friehling, Friehling & Horowitz, CPAs, PC (No 09 CV 2467),
www.sec.gov/litigation/complaints/2009/comp20959.pdf. SEC v Dipascali Jnr, (No 09 CIV 7085), www.sec.gov/litigation/complaints/2009/comp21174.pdf. SEC v Madoff, Bernard L Madoff Investment Securities LLC (No 08 CIV 10791),
www.sec.gov/litigation/complaints/2008/comp-madoff121108.pdf. US v Bernard L. Madoff, 08 Mag. 2735, SDNY. US v Bernard L Madoff, (09 CR 213) (DC), 29 June 2009,