The Impact of Web Portal Characteristics, Expectancies, and Negative Word of Mouth on Perceived Institutional Support and Organizational Citizenship Behavior By Oran Alston BBA Howard University MS Temple University Submitted to the Graduate Faculty of The Joseph M. Katz Graduate School of Business of The University of Pittsburgh in partial fulfillment of the requirements of the degree of Doctor of Philosophy The University of Pittsburgh 2005
Transcript
The Impact of Web Portal Characteristics, Expectancies, and Negative Word of Mouth on Perceived Institutional Support
and Organizational Citizenship Behavior
By
Oran Alston
BBA Howard University
MS Temple University
Submitted to the Graduate Faculty of
The Joseph M. Katz Graduate School of Business of
The University of Pittsburgh in partial fulfillment
of the requirements of the degree of
Doctor of Philosophy
The University of Pittsburgh
2005
ii
DISSERTATION COMMITTEE
Dennis Galletta, PhD, Co-Chair Katz Graduate School of Business
The University of Pittsburgh
Audrey Murrell, PhD, Co-Chair Katz Graduate School of Business
The University of Pittsburgh
Laurie Kirsch, PhD Katz Graduate School of Business
The University of Pittsburgh
Lawrence Feick, PhD Katz Graduate School of Business
The University of Pittsburgh
Jimmie Joseph, PhD College of Business Administration
The Impact of Web Portal Characteristics, Expectancies, and Negative Word of Mouth on Perceived Institutional Support
and Organizational Citizenship Behavior
Oran Alston, PhD
The Katz Graduate School of Business
The University of Pittsburgh, 2005
ABSTRACT
An organization's web portal is designed to support and represent the organization to key
stakeholders both inside and outside of the organization. In terms of those inside the
company, the web portal can be an important source of information and can contain work-
related tools that help members to be more effective in their roles within the firm.
Interestingly, management may not recognize all of the consequences of how the
website/portal is perceived by employees. As an agent of the organization, the perceived
usefulness and relevance of organizational technology can affect the degree to which
members believe they are valued by the organization. This dissertation takes a first step in
identifying how key perceptions of an organization’s website/portal, in terms of effort and
performance expectancies, can impact institutional support outcomes and perceptions of
institutional support by members of the organization. This study also examines the
moderating role of social influences, in this case negative word of mouth (WOM), and its
moderating effect on the impact of IT perceptions on organizational perceptions.
v
Using organizational support theory (OST) as a foundation, this dissertation predicts that two
IT beliefs, effort expectancy (EE) and performance expectancy (PE), will influence how an
organizational member perceives how he/she is valued by the organization measured through
perceived institutional support (PIS). This study also predicts that negative WOM will
moderate the impact of PE and EE on PIS, and that PIS will significantly influence the
organizational outcome of organizational citizenship behavior (OCB) intentions. Using both
regression analysis and partial least squares (PLS) analysis, this study shows that PE
significantly impacts PIS. The study also shows that PIS strongly predicts OCB intentions
and that PIS mediates the relationship of IT belief PE and PIS to OCB intentions.
The findings suggest that IT beliefs have critical outcomes other than
technology behavioral intentions and technology usage. IT beliefs have an impact on how
members perceive they are valued by the organization. Furthermore, the findings show that
IT beliefs can impact OCB, which represent behavioral intentions toward the organization.
vi
ACKNOWLEDGEMENTS
There are so many people who have supported me through this process, and I would
like to acknowledge them. First of all I’d like to thank my Chair, Dr. Dennis Galletta.
Dennis, I truly thank you for your patience, accessibility and your overall positive
disposition. I appreciate your responses to my emails regardless of where you were around
the globe. I would like to thoroughly and completely express my heart-felt gratitude to you,
and I look forward to our continued collaboration.
To my co-chair, Dr. Audrey Murrell; Audrey, I truly thank you for your support,
guidance, and knowledge transfer. Like a co-pilot who came along to help guide a ship
through the storm, you came through for me and went beyond the call of duty. Thank you for
the phone calls, emails, and for helping to shape and inspire this study. Thank you for
believing in me and investing in me.
To my committee members, Dr. Laurie Kirsch, Dr. Larry Feick, and Dr. Jimmie
Joseph, thanks to all of you. Laurie, I thank you for being there from day one. I have had the
opportunity to observe you and your career, and you have given me something to aim for. I
have learned so much from you. Larry, thank you for bringing your brand of expertise to the
table. Your perspective has definitely added value to my research, and I thank you for that.
Jimmie. I thank you for being a good colleague both as a fellow student and then as a
committee member. Thanks for remembering what the dissertation process is like, which
translated into support at the right time.
vii
To Dr. William R. King, thank you for your wisdom, and sharing that wealth
of knowledge. I truly value the advice that you have given me over the years. The next group
I would like to acknowledge is staff and other faculty at the Katz Graduate School. To the
doctoral staff, past and present, your support is deeply appreciated and is essential for getting
through this process. To Carrie Uzyak Wood, I truly thank you for your support. Even though
the Chairman of the doctoral program rotates, the one constant has been Carrie. Thanks for
your support over the years. I would also like to give special thanks to Olivia Harris, the
keeper of the gate. Thanks for your coordination and support. Dr. Daria Kirby, you were
very supportive from the beginning. Thank you for taking an interest in me. I wish you all the
best in your new position. Margie Jonnet, I thank God for you. You have truly been a
blessing to me. I cannot express in words how grateful I am for your support. To the
remainder of the IS faculty, thank you for your spirit of collegiality.
The KPMG PhD project members and managers have been very instrumental
in my academic career. I would like to give a special thanks to Dr. Bernie Milano and Tara
Perino for their vision, work, and continued effort to implement change. Keep up the good
work.
I would like to acknowledge the 241 crew, my Mervis Hall office mates past and
present. To Kathy H. and Wendy B., we had some good talks back in the day. Laquita,
thanks for being there for me, and thanks for being a good friend. Ray G. and Tom Z. thanks
for conversations, debates and exchanges of ideas. These exchanges were very critical to my
dissertation. Iryna, Jason B., Jason S, and Jonathon, I wish you all the best and I look forward
to working with you in the future. Dr. Virginia Kleist, thanks for being a good student
colleague, and thanks for keeping that collegiate spirit as a fellow faculty member. I look
viii
forward to working with you, Dr. Graham Peace and the rest of my new colleagues. Dr.
Cynthia Miree, God truly placed you in my path. I really value the time we spent together at
Katz.
Pastor Joseph and Sister Joseph, thank you for giving me a touch of home during my
stay in Pittsburgh. I know we will work together in the near future. To the members of AFC,
I thank you for your prayers, the fellowship, the studies, and for allowing me to be a part of
you. You just do not know how valuable you have been to me. Erika Cullen Jackson, who
would have thought that after so many years we would work together again? Thanks for your
skill-set. Nona, you’ve been there since undergrad. Thanks for your encouragement and
support, and thanks for being a friend.
To my family members, I could not have made it through this program without your
support and your prayers. Mom, you have been a calming force for me my entire life. You
truly inspire me to succeed, and I love you dearly. To all of my siblings, I owe a great deal to
you. Each one of you has blessed me and contributed to my growth in different ways. I love
you all. To all of my nieces and nephews, you are special to me, and it has been a pleasure
watching you grow and mature. I have also learned from you. I wish you all the best in your
life’s endeavors, and I pray that you fulfill God’s purpose on your life. Finally, I’d like to
dedicate this to the memory to my dearly departed sister Patty, my niece Gloria, and the
patriarch of the Alston family, Bill Alston. Patty and Gloria, I love you and miss you. Dad,
you are truly my hero. I finally have my union card into academia! I know all three of you
are watching down from above. I dedicate this to you and your memory. From the bottom of
my heart, thank you all.
ix
TABLE of CONTENTS
ACKNOWLEDGEMENTS ............................................................................................................................... 4 9 Hvi TABLE of CONTENTS ..................................................................................................................................... 5 0 Hix LIST OF TABLES.............................................................................................................................................. 5 1 Hxi 1 Introduction................................................................................................................................................ 5 2 H1
1.1 Research Objectives ........................................................................................................................... 5 3 H2 1.2 Objective 1: Understanding the Impact of Web Portal Perceptions on Individuals’ Attitudes about the Organization.................................................................................................................................. 5 4 H2 1.3 Objective 2: Understanding The Moderating Impact of Social Influences (Negative WOM) ........... 5 5 H3 1.4 Objective 3: The Mediating Impact of PIS on IT Perceptions and PIS Outcomes ............................. 5 6 H4 1.5 Research Contributions ...................................................................................................................... 5 7 H4
2 REVIEW OF THE LITERATURE.......................................................................................................... 5 8 H6 2.1 Perceptions of Support: The Institution and the Organization........................................................... 5 9 H6
2.1.1 Perceived Organizational Support ................................................................................................ 6 0 H6 2.1.2 Origins of Perceived Support ........................................................................................................ 6 1 H6 2.1.3 Antecedents to Perceived Support ................................................................................................. 6 2 H8 2.1.4 Perceived Support and IT ............................................................................................................ 6 3 H11 2.1.5 A Conceptual Model of Perceived Support.................................................................................. 6 4 H12 2.1.6 Perceived Support: From the Organization to the Institution .................................................... 6 5 H15
2.2 Technology Acceptance Model (TAM)............................................................................................ 6 6 H16 2.2.1 Performance and Effort Expectancies ......................................................................................... 6 7 H16 2.2.2 Empirical Findings and TAM ...................................................................................................... 6 8 H17
2.3 Word Of Mouth (WOM) .................................................................................................................. 6 9 H19 2.4 TAM and Perceptions of Support..................................................................................................... 7 0 H21
2.4.1 Perceived Support & IT: Defining Outcomes.............................................................................. 7 1 H22 3 THEORETICAL MODEL AND HYPOTHESES ................................................................................ 7 2 H23
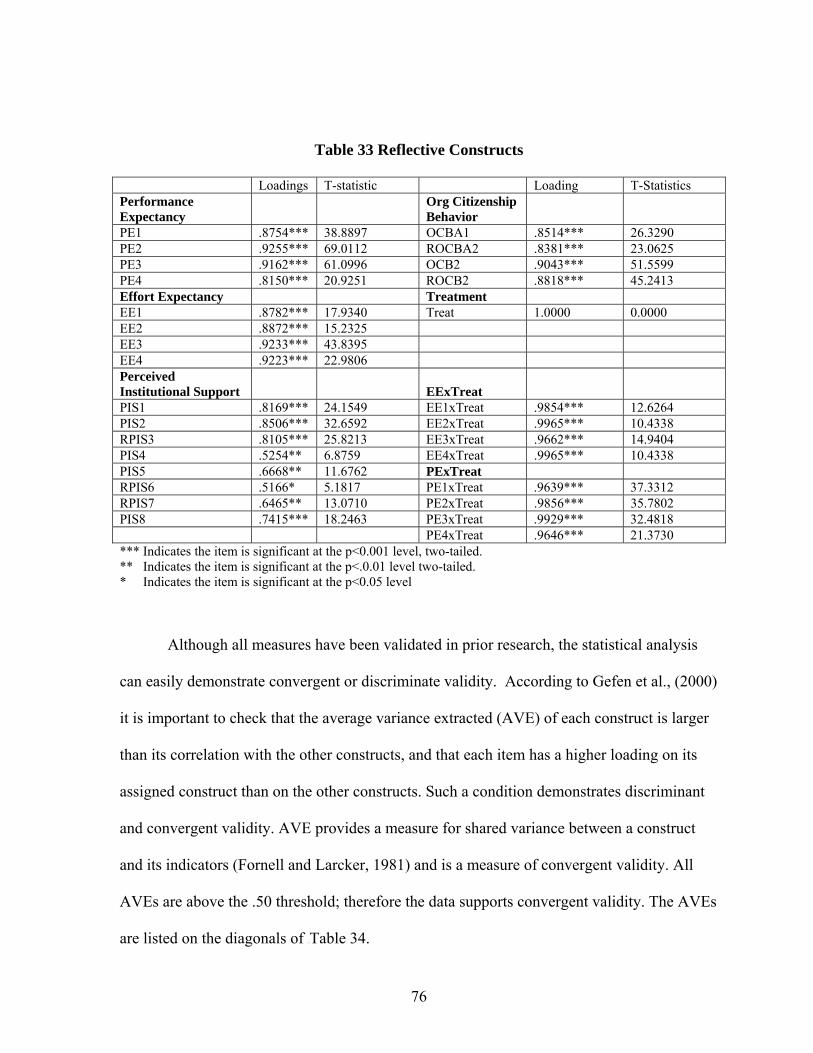
3.1 Technology and Perceptions of Support: Theoretical Framework ................................................... 7 3 H23 3.2 Research Model and Hypotheses...................................................................................................... 7 4 H24
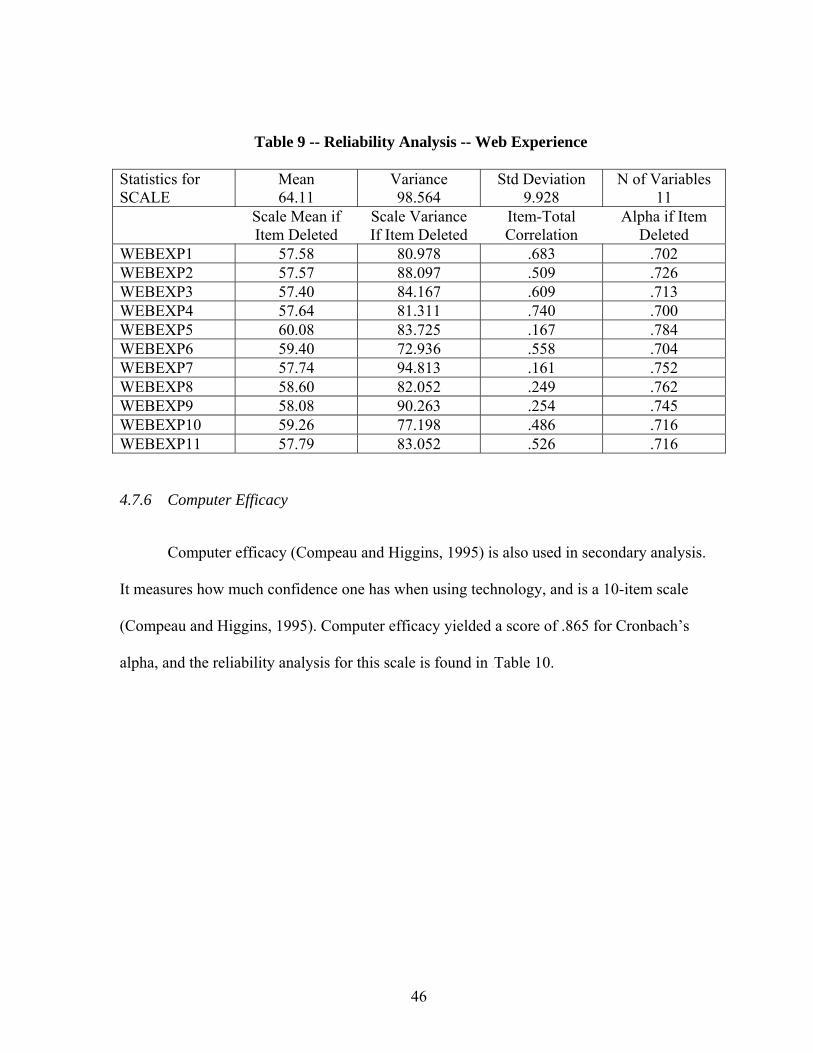
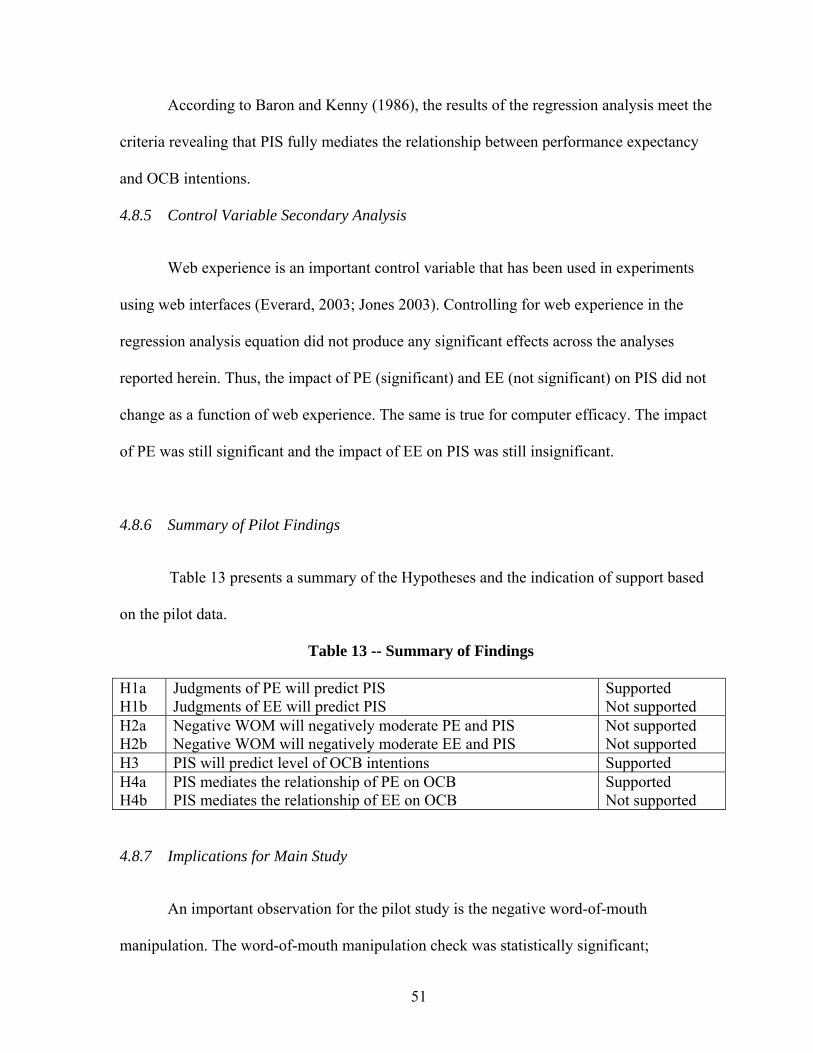
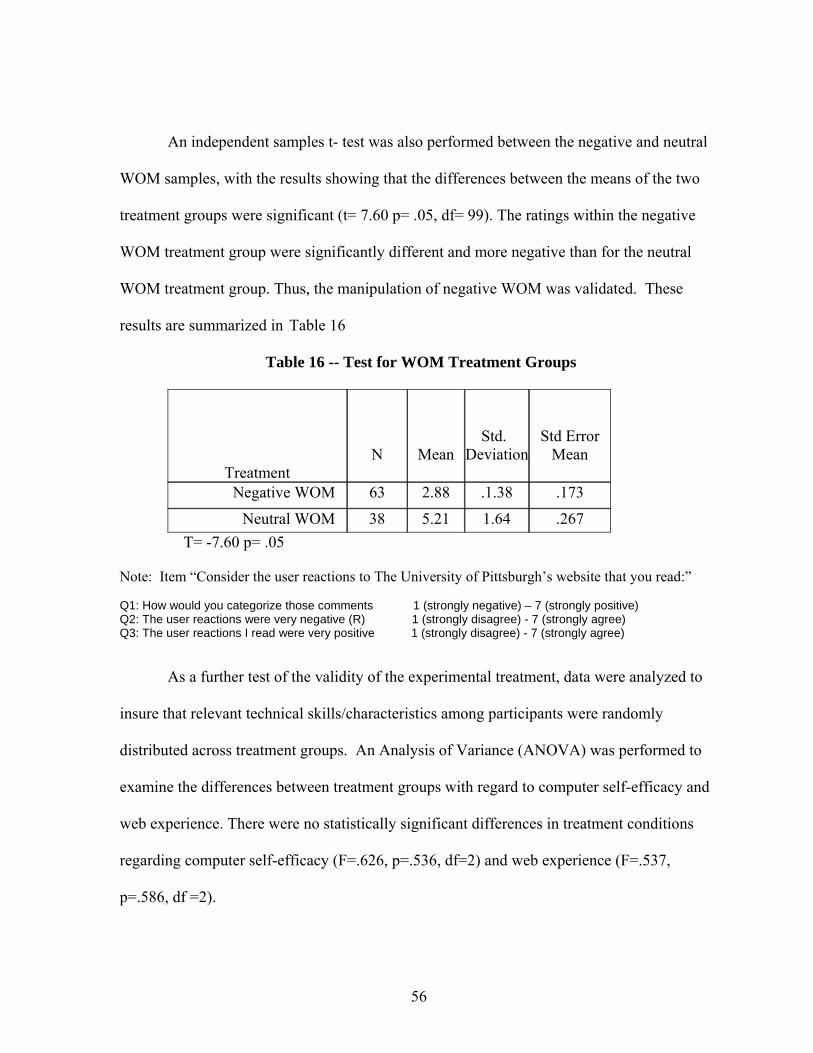
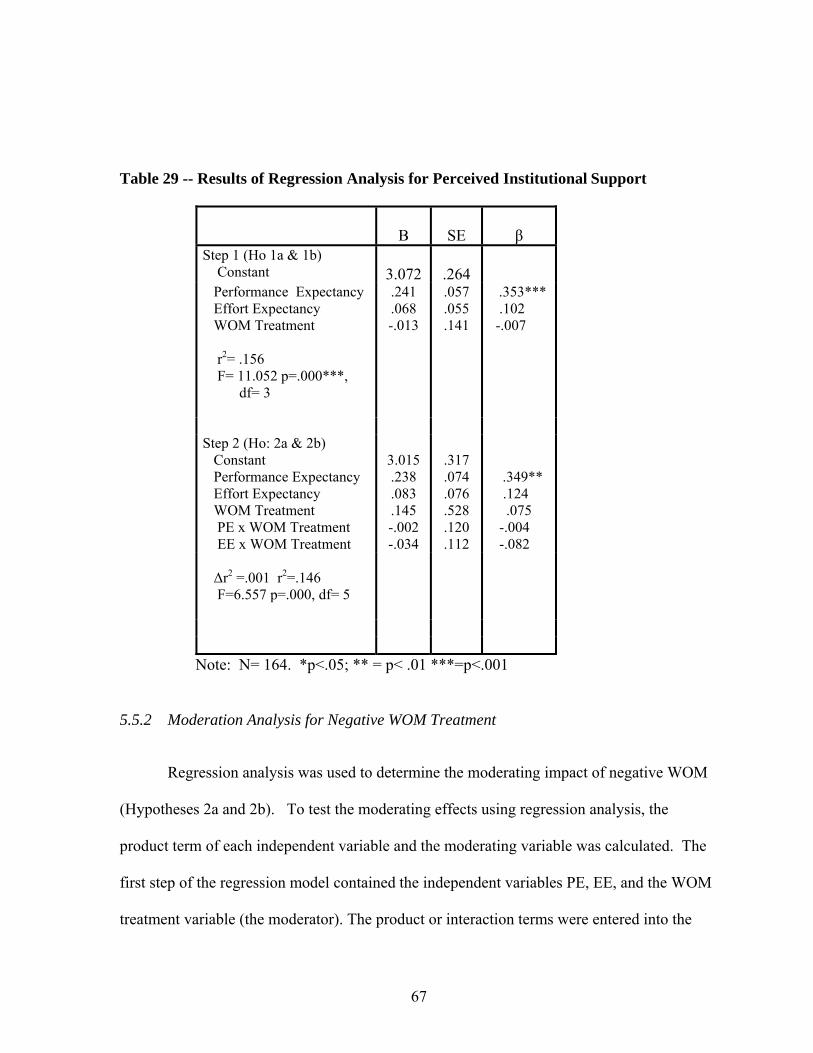
4.8 Data Analysis and Results ................................................................................................................ 9 5 H47 4.8.1 Main Effect .................................................................................................................................. 9 6 H47 4.8.2 Moderation Analysis for Negative WOM Treatment ................................................................... 9 7 H48 4.8.3 Perceived Institutional Support (PIS) and Organizational Citizenship Behavior (OCB) Intentions ..................................................................................................................................... 9 8 H49 4.8.4 Mediation Analysis for PIS.......................................................................................................... 9 9 H49 4.8.5 Control Variable Secondary Analysis.......................................................................................... 1 00 H51 4.8.6 Summary of Pilot Findings .......................................................................................................... 1 01 H51 4.8.7 Implications for Main Study ........................................................................................................ 1 02 H51
5 Main Data Analysis.................................................................................................................................. 1 03 H52 5.1 Main Study Sample Demographics .................................................................................................. 1 04 H52
LIST OF FIGURES 4 2 HFigure 1 -- Basic Conceptual Model of Perceived Support.................................................... 1 65 H15 4 3 HFigure 2 -- Research Model of Perceived Support ................................................................. 1 66 H25 4 4 HFigure 3 -- Research Model for PLS ...................................................................................... 1 67 H80 4 5 HFigure 4 -- Revised Model of IT Impact on Institutional Support and OCB.......................... 1 68 H85
1
1 INTRODUCTION
In this digital era, organizations rely on technology to help shape and manage their
relationships with both external and internal stakeholders. While one purpose of technology
implemented by the organization is to improve communication and knowledge transfer
between these two stakeholder groups, beliefs and perceptions about this technology may
prevent these improvements from being realized. In fact, the perceptions of an organization’s
website may have an impact on the organization’s overall relationships with its stakeholders.
For example, negative reactions and beliefs about a company’s website may lead to negative
perceptions about the organization’s reputation. Also, complex internal web portals that
contain information seen as irrelevant to employees may lead to negative attitudes that can
increase workplace stress, reduce job satisfaction and involvement, and could adversely
affect other important work-related attitudes. The purpose of this dissertation is to determine
the impact of information technology (IT) perceptions, as influenced by cues from the social
environment, on individual perceptions of the organization. This dissertation also examines
behavioral intentions that result from organizational perceptions. For this study IT refers to
the relevant aspects of the organization’s website, and the social influence studied is negative
word-of-mouth (WOM) from peers.
2
1.1 Research Objectives
1.2 Objective 1: Understanding the Impact of Web Portal Perceptions on Individuals’ Attitudes about the Organization
The first objective of this research is to investigate the impact of website perceptions
on individuals’ attitudes about the organization. In this dissertation, we focus on perceived
institutional support (PIS) (LaMastro, 2001). PIS is defined as the individual’s perception
that an institution values his/her contribution and cares about his/her well being. This
construct is an extension of the perceived organizational support (POS) construct and
literature (Eisenberger, et al., 1986; Eisenberger, Fasolo and LaMastro, 1990; George et al.,
1993) that describes how employees form global beliefs that an organization values and
supports their contributions. Both constructs rely on Organizational Support Theory (OST),
which describes the impacts of agents of an organization (e.g., supervisors, technicians,
instructors, etc.), who act on behalf of the organization and influence how its members
perceive the organization.
Organizational support theory asserts that members will form beliefs about the
actions of the organization, its agents, or its representatives (e.g. support they provide,
policies that are implemented, or treatment by supervisors or other organizational
representatives). This dissertation asserts that an organization’s technology is a mechanism
implemented by the organization to communicate its policies, to assist in managing the
members/employees, to represent the organization to its members, and to provide support for
daily tasks so that members may perform their tasks better. Therefore, much like
supervisors’ actions and organizational policies, technology can be viewed as an agent of the
organization and will shape the individual’s perceptions of organizational support. This
study investigates whether an individual’s perceptions of IT, in particular, perceptions of the
3
organizational web portal, will spill over onto employees’ global beliefs about the
organization.
This dissertation focuses on two IT perceptions that may help produce this spillover
effect: effort expectancy and performance expectancy (Venkatesh et al., 2003), formerly
termed “ease of use” and “usefulness,” respectively. Performance expectancy is defined as
the degree to which an individual believes that using a system will help him or her make
gains in task performance. Effort expectancy is defined as the degree of ease associated with
the use of the system. One of the key hypotheses examined in this proposed dissertation is
that high levels of performance expectancy (PE) and high levels of effort expectancy (EE)
will have a positive impact on perceived institutional support.
1.3 Objective 2: Understanding The Moderating Impact of Social Influences (Negative WOM)
A second major objective of this proposed dissertation is to examine the impact of
social influences within the organization on the perceived instrumentality of technology and
on perceptions of support. While aspects of technology may influence how employees see
the firm, these perceptions are not formed outside of the context of the organization and the
interaction among its members. Thus, the influence of negative word-of-mouth (WOM)
from other organizational members on expectancy relationships and perceived support is also
examined. Social dynamics are pertinent in this relationship because individuals are not only
influenced by formal structures and information received from agents of the organization, but
also by advice and input from informal peer sources which shape the context wherein
members interpret the actions of the organization.
Previous studies in the marketing and IS literatures have clearly shown the impact of
WOM on individuals’ perceptions, choices, and decision-making. Negative WOM has been
4
defined as interpersonal communication concerning the marketing of an organization or
product that denigrates the object of the communication (Bone, 1992; Laczniak et al., 2001,
Richins, 1984; Weinberger, et al., 1981) The current study proposes that negative word-of-
mouth (WOM) moderates the relationships between PE and EE and perceived institutional
support (PIS) such that when negative WOM is present, it decreases the positive impact of
PE and EE on perceived support. Using an experimental approach, negative WOM generated
from an electronic bulletin board is manipulated among a group of organizational members,
and its impact measured. The moderating role of negative WOM on the relationship between
the expectancies (PE and EE) and PIS is a second hypothesis tested in this thesis.
1.4 Objective 3: The Mediating Impact of PIS on IT Perceptions and PIS Outcomes
A third focus of this research is to determine the impact of IT perceptions on
perceived support outcomes (Eisenberger et al, in press; Rhoades and Eisenberger, 2002).
Prior research has shown that perceived support has numerous outcomes. One purpose of this
study is to understand not only how IT perceptions impact perceived institutional support, but
to understand how IT perceptions impact PIS outcomes. This study proposes and tests that
perceptions of IT work through PIS to impact PIS outcomes. In other words, PIS mediates
perceptions of IT and PIS outcomes.
1.5 Research Contributions
The study is intended to offer several contributions. First, this dissertation aims to
provide an understanding of the impact of performance expectancy and effort expectancy on
perceived institutional support. While the impacts of users’ perceptions on intentions and
performance have been demonstrated in prior IS research, the impacts of perceptions of an
organization’s website on the relationship between an individual and an organization have
received little attention. The dissertation attempts to establish an important link between
5
individuals’ perceptions of support by the organization and users’ perceptions of
organizational technology.
Furthermore, the dissertation intends to provide insight for understanding how the
impact of IT perceptions is altered in the presence of negative WOM. Prior research
(Galletta et al., 1995) demonstrated the impact of WOM on intent to use IT, but did not
include the impact on individuals’ perceptions of support by the organization sponsoring the
technology. As a key index of social influence, negative WOM surrounding IT should impact
how individuals perceive the technology and should spill over onto their judgments of the
organization. This dissertation highlights the power of social cues via the presence of
negative WOM on the perceptions of both technology used by the firm and employees’
judgments of their relationship to the firm.
Finally, this study brings the extensive literature on organizational support theory into
an IS context to enhance our understanding of the impact of IT beliefs on global attitudes
toward the firm. In doing so, this dissertation adds to the literature’s linkage between
research in IT, organizational behavior, and organizational psychology. This study aims to
demonstrate that researchers can use organizational support theory to gain additional
understanding of how IT can impact perceptions of the organization, thus stimulating interest
among IS scholars in the area of organizational support as a critical outcome variable worthy
of future research in the IS arena.
6
2 REVIEW OF THE LITERATURE
2.1 Perceptions of Support: The Institution and the Organization
To understand how perceptions about organizational technology can impact
perceptions of support, this dissertation focuses on institutional support. The perceived
institutional support (PIS) construct has its origins in the broader construct known as
perceived organizational support (POS). It is important to note that the outcome relationships
and predictor relationships of both the PIS and POS constructs can be explained by
organizational support theory (OST) (Eisenberger et al., 1986; LaMastro, 2001; Rhoades and
Eisenberger, 2002). The key distinction between perceptions of institutional support (PIS)
and perceptions of organizational support (POS) is the context surrounding the relationship
being examined. The POS construct is used when studying perceived support in an
employee-employer context, whereas PIS is used when studying perceived support in the
student-institution/university context. This will be covered in more detail in the upcoming
section.
2.1.1 Perceived Organizational Support
2.1.2 Origins of Perceived Support
Eisenberger and his colleagues developed the POS construct to more fully understand
the relationship between employees and the organization. Specifically, the POS construct
asserts that “employees develop global beliefs concerning the extent to which the
organization values their contributions and cares about their well-being” (Eisenberger et al.,
1986, p. 501). Early studies of POS focused on the antecedents and consequences of strong
versus weak support (e.g., Eisenberger et al., 1986; Eisenberger, Rhoades, and Cameron,
1999; Shore and Shore, 1995; for a review, see Rhoades and Eisenberger, 2002). These
7
empirical efforts generally showed that perceived fairness, supervisor support, organizational
rewards, and job conditions predicted employees’ perceptions of support from the
organization. This support is then reciprocated in the form of favorable or unfavorable
employee behaviors. Thus, high POS produces outcomes such as strong organizational
commitment, positive job-related affect, high job involvement, frequent citizenship
behaviors, strong loyalty, and infrequent withdrawal behaviors (see Rhoades and
Eisenberger, 2002).
Eisenberger et al. (in press) recently noted that an employee will be influenced by
organizational factors that are personally relevant to him/her and will form a perspective of
what the organization’s general orientation is toward him/her based on this judgment. These
factors include organizational policies and procedures, the availability of resources, and
interactions with the agents of the organization. Furthermore, these organizational factors
seem to contribute to the positive or negative orientation that members believe the
organization has toward them. A key point is that individuals use personally-relevant
organizational policies, programs, resources and interactions to form global beliefs about
whether or not they are valued and supported by the firm. This aspect of Eisenberger’s
model and OST provides a fundamental assumption for this dissertation. Specifically, it
implies that we can add organizational technologies to the list of factors that can shape
individuals’ perceptions of the firm and the level of support the firm provides them. Thus,
perceptions of institutional support are shaped by key aspects of how members evaluate
personally relevant technology that is sponsored or sanctioned by the firm. This means that
IT serves as another antecedent of POS within the Eisenberger framework.
8
2.1.3 Antecedents to Perceived Support
The basis for including technology as another antecedent for perceptions of support is
based on prior work outlined by Eisenberger and his colleagues. Rhoades and Eisenberger
(2002) identify three major categories of POS antecedents: fairness of treatment, human
resources practices, and support from organizational agents or representatives.
2.1.3.1 Antecedents to Perceived Support: Fairness
Fairness of treatment is discussed from two perspectives: distributive justice and
procedural justice. Distributive justice refers to the perceived equity in distributing rewards
to the employees, while procedural justice refers to equity in determining how these rewards
will be distributed. Clearly, if an organization is perceived as being fair when allocating and
distributing rewards, this would have a positive impact on the organization members. Shore
and Shore (1995) found empirical support that both types of fairness lead to high levels of
POS.
Also within the domain of fairness, Randall et al. (1999) examined organizational
politics as an antecedent to perceptions of support. Organizational politics is described as an
attempt to influence others in ways that promote self-interest, often at the expense of rewards
for individual merit or the betterment of the organization (Cropanzano et al., 1997; Kacmar
and Carlson, 1997; Nye and Witt, 1993). Randall and his colleagues found that perceived
politics also shape perceptions of support and affect a variety of outcomes for employees. In
addition to seeing perceived politics as an antecedent to POS, they found that taken together,
politics and POS have an impact on a variety of outcomes that shape an employee’s
9
perceptions of and behavior toward the firm. POS and perceived organizational politics
together give a unique perspective on how workers react to their environment. This suggests
that an employee’s perception of actions, events, or the distribution of resources within the
environment that are seen as helping versus hampering employees’ performance on required
work tasks are key drivers for perceptions of support. In addition, the informal process of
allocating organizational resources (e.g., “politics”) shapes perceptions of fairness which
impact POS. Clearly, one can argue that organizational technology can be seen as an
important work-related resource, distributed within the firm, and perceived either as helpful
or as obstacles to employees in the performance of their jobs. This view provides some
conceptual support for the idea explored in this dissertation that technology can also impact
employees’ perceptions of organizational support.
2.1.3.2 Antecedents to POS: Human Resources Practices
The second category of POS antecedents, Human Resource (HR) practices, refers to
standard organization-wide practices implemented to support, manage and reward
employees. These practices should have an impact on POS because they are specifically
geared toward employees and could be perceived as an investment in human capital by the
organization. This perception in turn could lead employees to perceive that they are valued,
thus resulting in a higher level of POS (Eisenberger, in press). For example, job security,
autonomy and training are a few of the specific HR practices that have been found to lead to
high levels of POS. Job security refers to the assurance that the employer wants to continue
to maintain the employee’s future membership. Autonomy focuses on employees’ perceived
control over how they perform their jobs. If employees believe that they have been entrusted
with higher levels of autonomy and security, they will be more likely to believe that the
10
organization values them. Thus, actions by the organization that enhance employees’
competency, autonomy or control should lead to high levels of perceived organizational
support. For example, training is an HR practice that has been shown to be an antecedent to
POS (Rhoades and Eisenberger, 2002; Wayne et al., 1997) because it is viewed as an
investment in human capital, and thus, it is a discretionary action by the firm. If an
employee believes the employer willingly invests in developing his/her potential by going
beyond the mere perception of upholding federal laws, regulations or industry standards, the
employee feels more valued and supported. Therefore, training as a specific example of HR
practices contributes to enhanced perceived support by employees of the organization
(Rhoades and Eisenberger, 2002).
2.1.3.3 Antecedents to POS: Support from Organizational Agents
Support from organizational agents is a key category of antecedents that shape POS.
According to Rhoades and Eisenberger, antecedents to POS are seen as an investment by the
firm in its employees. Actions taken by agents of the organization are interpreted as signals
that the organization cares about and values its employees, their performance and their
overall well-being. As a result, the presence of these antecedents strengthens employees’
perceptions of organizational support. Therefore, it would make sense to include some
aspects of technology made available to employees as an additional antecedent to POS.
Interestingly, many of the HR training activities and support in organizations today are
frequently mediated via technology. The growth in human resource information systems
(HRIS) has been substantial in recent years (Stanton and Coovert, 2004), giving rise to
additional evidence for the proposition that technology and perceptions of organizational
support are indeed connected.
11
2.1.4 Perceived Support and IT
Although little attention has been given to the impact of IT on perceived support,
there is some related work that provides an appropriate starting point for the proposed
research. Huang et al. (2004) examined the impact of business-to-employee (B2E) benefit
systems on POS and organizational citizenship behavior (OCB). The specific B2E system
examined was an online shopping portal that allows employees to purchase a variety of
products and services at discounted prices. An employee can rent a car, book a hotel room,
order books for personal use, or purchase a variety of other products that are sold at
discounted prices. To understand the impact of this system on POS, Huang et al. (2004)
measured end user satisfaction (Doll and Torkzadeh, 1988, Doll et al., 1994) along with
employees’ perceptions of organizational support. Their empirical findings indicate that
satisfaction with the B2E system was a strong antecedent to POS that subsequently impacted
organizational citizenship behavior through perceptions of support.
This is an important finding for establishing an initial link between individual
perceptions of IT and POS. Clearly, individuals’ experience with IT influenced perceptions
about the organization in the previous work. However, the focus of this dissertation varies
from the Huang study in terms of both the role and operationalization of IT. Huang’s
research focused on a benefit system which was not needed for the employees to accomplish
their work-related tasks. That is, the system examined in Huang’s study allowed employees
to purchase non-work-related items (shopping) and plan non-work-related trips. Thus, the
level of personal and work task relevance for individuals in Huang’s study may have been
somewhat limited. This dissertation advances the previous work by Huang and focuses on
technology that is valuable but not mandatory for individuals in order to accomplish tasks.
12
The impact of a university web portal is explored among a student population that
utilizes this technology for personally-relevant tasks such as obtaining information for
registration, searching library databases, or obtaining class information. These tasks may be
performed via other means (e.g., hard copy schedules); however, the availability of
technology-enhanced access can signal an investment by the institution in its key
stakeholders: students. This study argues that the perceptions of this personally-relevant
technology will drive students’ levels of perceived institutional support. While it may not be
appropriate to discuss technology in terms of “fairness” as in the case of organizational
policies and programs, it is appropriate to focus on the perceived usefulness of technology in
terms of supporting the work of the user. Thus, technology sponsored or sanctioned by the
organization becomes a proxy for or an agent of the organization by helping the individual
accomplish personally relevant work/school-related tasks. However, in order to fully
understand how technology and perceived usefulness drive employee perceptions of their
relationship to the organization, we must take a closer look at the theoretical framework of
organizational support theory.
2.1.5 A Conceptual Model of Perceived Support
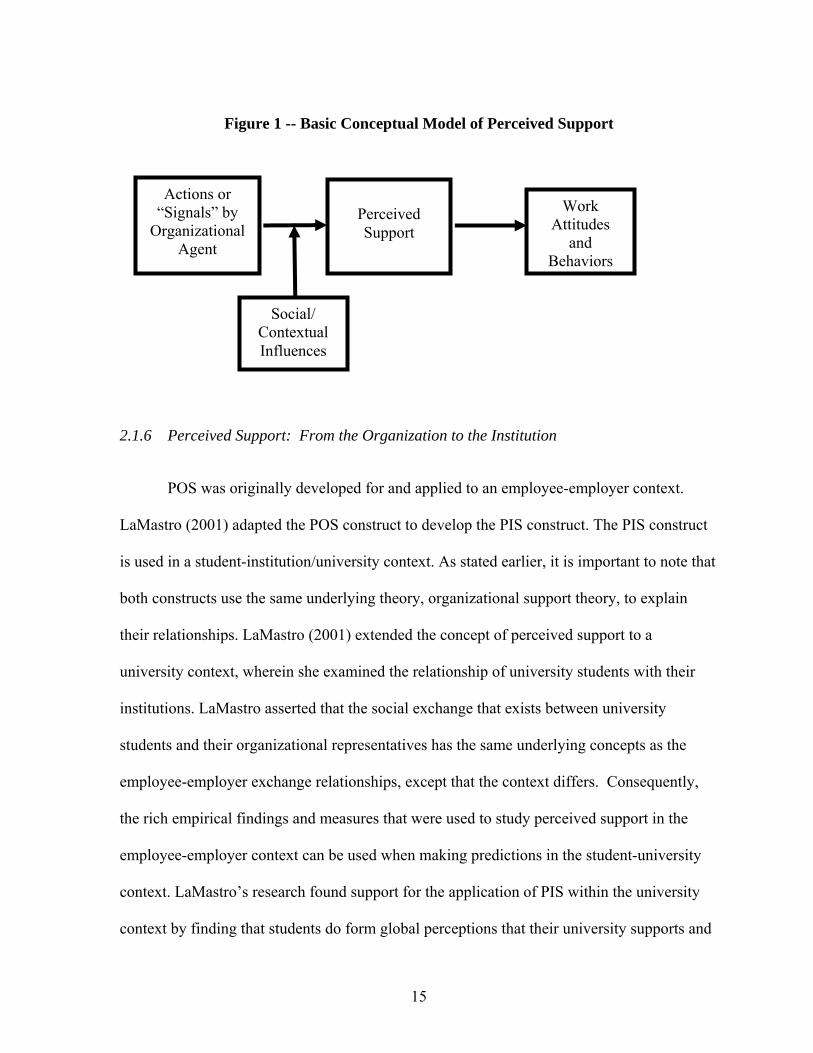
Organizational Support Theory (OST) explains the relationship between the
employee and the firm. It asserts that employees not only form opinions about the
organization, but also about organizational agents, its representatives and its actions (see
Figure 1). These agents can include supervisors, managers, executives, etc. The perceptions
formed about the organization are based on actions by these agents or representatives of the
firm. Employees make judgments or evaluations of these actions based on expectations,
13
individual beliefs and external factors (e.g., social norms, group dynamics). The interaction
of individual judgments and actions of the organization shape employees’ perceptions of
organizational support. Once formed, perceptions of support can have an impact on a wide
variety of outcomes such as work-related attitudes (e.g., satisfaction, commitment, and
involvement), work behavior (absenteeism, turnover, citizenship) and subsequent interactions
between employees and the firm (see Eisenberger (in press); Rhoades and Eisenberger,
2002).
The basis for organizational support theory is the social exchange [see Eisenberger (in
press), Rhoades and Eisenberger, 2002; LaMastro, 2001; Eisenberger et al., 1986] which
takes place between employees and agents of the firm. For example, leaders have direct
contact with their followers and engage in the processes of feedback, decision-making and
resource distribution on behalf of the organization. A leader’s favorable or unfavorable
action toward a follower is indicative not only of support by the leader, but also of support by
the organization that the leader represents (Rhoades and Eisenberg, 2002; Eisenberger et al.,
1986; Levinson, 1965). Prior research on leader-member exchange (LMX) clearly shows the
importance of the link between a leader as an agent of the organization and the follower.
LMX has also been linked empirically to employees’ level of POS (Wayne et al., 1997). Not
only do representatives of the organization help to form a member’s opinion about his or her
value to the organization, but also the interactions between the agents of the firm and the
employee enhance perceived support.
Additional empirical evidence for organizational support theory was found by
Eisenberger and his colleagues for the specific actions of a supervisor in the organization
(Eisenberger, Stinglhamer, Vanderberghe, Sucharski and Rhoades, 2002). Within this work,
14
Eisenberger and his colleagues explore the distinct role that perceptions of supervisor support
play contrasted with perceptions of organizational support. While this research showed that
perceived supervisor support (PSS) and perceived organizational support were distinct
constructs, it also showed that PSS was an antecedent to POS. Thus, perceptions of support
are driven by agents of the organization (e.g., leaders, supervisors, managers) to the extent
that these actions are relevant to the members, are perceived to be sanctioned by the
organization, and have significant impact on members’ work-related tasks or activities.
The interaction with the agents of the organization is of particular importance to the
current work. This study proposes that interacting with the organization’s website helps to
shape perceptions of the organization and its efforts to provide the needed resources and tools
for its members to accomplish their tasks. For example, slow response time when executing
a database query can bring about frustration for the employee, and can hinder him/her when
completing crucial assignments. This frustration, brought about by interacting with the
technology, could lead to low levels of POS. Thus, technology can be viewed as an agent of
the organization in that it is seen by employees as a form of support provided to them for
accomplishing personally relevant work tasks in the same manner that supervisory-
subordinate relationships operate within the LMX model. Figure 1 illustrates the basic model
addressed in this study.
15
Figure 1 -- Basic Conceptual Model of Perceived Support
2.1.6 Perceived Support: From the Organization to the Institution
POS was originally developed for and applied to an employee-employer context.
LaMastro (2001) adapted the POS construct to develop the PIS construct. The PIS construct
is used in a student-institution/university context. As stated earlier, it is important to note that
both constructs use the same underlying theory, organizational support theory, to explain
their relationships. LaMastro (2001) extended the concept of perceived support to a
university context, wherein she examined the relationship of university students with their
institutions. LaMastro asserted that the social exchange that exists between university
students and their organizational representatives has the same underlying concepts as the
employee-employer exchange relationships, except that the context differs. Consequently,
the rich empirical findings and measures that were used to study perceived support in the
employee-employer context can be used when making predictions in the student-university
context. LaMastro’s research found support for the application of PIS within the university
context by finding that students do form global perceptions that their university supports and
Work Attitudes
and Behaviors
Actions or “Signals” by
Organizational Agent
Perceived Support
Social/ Contextual Influences
16
values them. More specifically, she found that perceived institutional support (PIS) impacts
students’ level of involvement and satisfaction with the university.
The current study intends to follow the approach outlined by LaMastro and will
examine how perceptions of information technology within a university setting impact
student levels of PIS. As stated in regard to both institutional and organizational support
constructs, the current research recognizes that the infusion of technology by the university in
support of the students has significantly impacted the exchange process within the university
environment over the years. Therefore, it is necessary to gauge how IT is perceived by the
students as a validation that technology is regarded as an antecedent to perceptions of
support. If LaMastro’s application of the POS construct to the university setting is robust,
this research should find that perceptions of student-relevant IT can shape students’ levels of
PIS. Thus, perceptions of IT will be examined as key factors affecting the degree to which
organizational technology impacts student perceptions of institutional support. To fully
understand IT perceptions, and outcomes of those perceptions, the technology acceptance
literature is reviewed in the next section.
2.2 Technology Acceptance Model (TAM)
2.2.1 Performance and Effort Expectancies
Performance and effort expectancy were developed in the technology acceptance
literature (Davis, 1989; Davis et al., 1989; Venkatesh et al., 2003). Performance Expectancy
(PE) has evolved from the perceived usefulness (PU) construct, and Effort Expectancy has
evolved from the perceived ease of use (PEOU) construct (Davis, 1989; Davis, et al., 1989;
Venkatesh et al., 2003). The technology acceptance model (TAM) (Davis, 1989) was
developed to predict, explain, and increase acceptance and use of technology. Building on
17
the theory of reasoned action (Azjen and Fishbein, 1980; Fishbein and Azjen 1975), Davis
argued that beliefs about technology influence attitudes, which in turn influence intentions,
and subsequent technology usage.
Davis stated that perceived usefulness (PU) and perceived ease of use (PEOU) were
two important beliefs supported by IS research and practice that influence attitudes and
intentions. PU is defined as the user’s subjective probability that using a specific application
system will increase his or her job performance within an organizational context. PEOU
refers to the degree to which the prospective user expects the use of the target system to be
free of effort (Davis et al., 1989; Davis, 1989). Although PU and PEOU are distinct
constructs, they are conceptually and empirically related. In fact, a number of studies report
that PU is positively related to PEOU (Davis, 1989; Davis et al., 1989; Venkatesh et al.,
2003; Venkatesh and Davis, 2000). Furthermore, both PU and PEOU are positively related
to attitudes toward technology and intentions to use the technology (although PU’s effect on
intentions is stronger).
2.2.2 Empirical Findings and TAM
The TAM has been extensively studied in a variety of contexts, in work-related and
non-work-related tasks, with a variety of technology and by using a variety of
methodologies. For example, Lederer et al. (2000) examined technology acceptance of
World Wide Web (WWW) work-related tasks. Their study had two objectives. The first was
to validate TAM in the context of the web and to identify antecedents of web ease of use and
usefulness. Lederer et al. (2000) found support for the TAM in the context of the web. This
work also gave more insight into the relationship between PEOU and PU and acceptance of
18
web technology by users. The instrument they used was tailored specifically for web
applications and was found to be a valuable measure of technology perceptions.
A number of subsequent studies have been conducted that have advanced the theoretical and
empirical development of TAM. Recently, Venkentash et al. (2003) conducted an exhaustive
meta-analysis of technology acceptance research and categorized the majority of TAM
studies available in the extant literature. Venkentash and his colleagues identified several
“meta-constructs,” two of which are of particular relevance to the current study:
performance expectancy (PE) and effort expectancy (EE). PE is the extent to which an
individual believes that using the system will help him or her attain gains in task
performance. EE is the degree of ease associated with the use of the system. Both capture
the individual’s perceptions of technology and its fit for work-related activities. Because
Eisenberger et al. (in press) argues that POS is based on an individual’s experience with
personally relevant organizational policies and procedures, the receipt of resources and
interactions with agents of the organization, this research argues that PE and EE will enhance
POS for the students who utilize this tool and find the tool personally relevant. Because
students regularly interact with the university web portal, which is implemented on behalf of
the university to provide services and support, the students’ perceptions of this technology,
given that it is seen as useful and relevant to their work as students, will shape their views of
whether the institution supports them and cares about them. Thus, both factors (PE and EE)
will contribute to students’ overall view of how the institution supports them (PIS).
While the individual’s assessment of technology is a key factor, it is reasonable to conclude
that it is not the only driver of perceived support. Individuals’ perceptions of technology and
its impact do not take place in a vacuum. This point is particularly relevant in a student
19
context where peers and the social network play an important role in affecting attitudes,
decision making and other behaviors. Thus, it is reasonable to expect that social influences
also play a role in how individuals make judgments about key factors within their
environment. Thus, social forces that are relevant to individual judgments about the
institutional technology are also included in the proposed work. Specifically, the impact of
negative WOM on the relationship between perceived institutional support and the
expectancies (both PE and EE) is examined.
2.3 Word Of Mouth (WOM)
Perceptions of institutional technology are driven by one’s internal assessments and
by the social context of an individual. The social cues within the environment are important
sources of information that can shape individual judgments and attitudes. Both positive and
negative information could come from sources internal or external to the organization.
Furthermore, WOM exerts a powerful influence on attitudes and choices, and negative
information is often more salient within the decision-making process compared to positive
information. Thus, negative WOM from peers should have a significant impact on how the
organization’s agents or the university’s website is perceived.
The phenomenon of WOM is a very important force in the marketplace (Silverman
2001; Laczniak et al., 2001; Bone, 1992; Feick and Price, 1987; Richins, 1984; Arndtz, 1967)
and has been studied in a number of research disciplines such as psychology, communication
and marketing. Consumers rely on other consumers as informational sources and receive
information about products, services, or even organizations. Research over the years has
demonstrated that exchange of information among consumers is prevalent, and that this
exchange strongly influences consumer preferences and decisions (Laczniak et al., 2001;
Higie, Feick, and Price, 1987; Arndtz 1967). Some believe that WOM is the most powerful
20
force in the marketplace affecting consumer attitudes and perceptions (Silverman, 2001;
Webster, 1991).
In many cases consumers who experience a product or service will offer unsolicited
opinions, while in other cases, consumers contemplating a purchase may actively seek this
information. Obtaining WOM is a common method of reducing uncertainty, thus allowing
the consumer to make a more informed or educated decision. Over the years, WOM has
been studied both as an antecedent (Bone, 1995; Herr, Kardes and Kim, 1991; Sheth 1971)
and as an outcome variable (Laczniak et al., 2001; Feick and Price, 1987; Richins, 1983) in
consumer attitudes, preferences and choices.
A great deal of research within this area shows that negative WOM has a stronger
impact than positive WOM. For example, Herr, Kardes, and Kim (1991) studied the effects
of negative versus positive WOM, where positive WOM was described as communication
that is favorable: relating pleasant, vivid, or novel experiences, and generally good
recommendations to others (Anderson and Weitz, 1989); while negative WOM was
described as an exchange of comments, thoughts, and ideas that denigrates the object of the
communication. Herr, Kardes and Kim (1991) placed subjects in small groups where they
read a product description of a computer. While in the small group, a group member
(actually a confederate) would say that he or she owned a computer like that and loved it
(positive WOM) or hated it (negative WOM) depending on the treatment group. They found
that both positive and negative WOM had an impact on attitudes toward the product, but that
the impact of negative WOM was stronger than positive WOM. These findings are
important in showing the impact of negative WOM on individual attitudes, and lend support
21
to the relevance and feasibility of studying the impact of negative WOM in the proposed
dissertation.
2.4 TAM and Perceptions of Support
While most of the TAM work examines behavioral intentions and IT usage as key
outcomes, the PIS/POS literature focuses on a wide variety of individual outcomes that will
be detailed later. Whereas TAM research uses the theory of reasoned actions (Azjen and
Fishbein, 1980; Fishbein and Azjen 1975) to predict outcomes such as user intentions and
technology use, organizational support theory (OST) uses the norm of reciprocity (Gouldner,
1960) to theoretically support predicted behavioral and attitudinal outcomes of perceived
support.
Fundamental to applying the norm of reciprocity to explain perceived support
outcomes is OST’s acknowledgement of certain person-organizational interactions. In
particular is Levinson’s (1965) position that members of an organization view actions by
agents or representatives of the organization as not only actions of the agent, but also as
actions of the organization. Furthermore, OST suggests that an individual will personify the
organization and make inferences about the quality of the relationship, as they would in a
human social relationship, based on actions by the organization or its agents (Eisenberger et
al., 1986; LaMastro 2001; Rhoades and Eisenberger, 2002). These inferences or judgments
about the actions of the organization and/or its representatives/agents will lead to judgments
of how they and their contributions are valued by the organization, and are called perceived
support.
Because OST acknowledges that people personify organizations and respond to cues
in the relationship as they would in a human relationship, the norm of reciprocity can explain
behavioral and attitudinal outcomes of perceived support. The norm of reciprocity states that
22
people will treat others as they have been treated. Gouldner (1960) suggests that the norm of
reciprocity is universal, but is not unconditional. Furthermore, he adds it contains two
minimal but related demands: (1) people should help those who have helped them, and (2)
people should not injure those who have helped them. In the organizational context, a
member of the organization will interact with representatives of the organization and form
opinions about these interactions. An individual will also form opinions about the policies
and practices that are in place. The norm of reciprocity suggests that a favorable view of
these actions will result in favorable actions or attitudes by the individual on behalf of the
organization. In other words, high levels of perceived support will lead to favorable actions
by the organizational member towards the organization.
2.4.1 Perceived Support & IT: Defining Outcomes
Some specific perceived support outcomes studied in the OST literature include work
attitudes (satisfaction, involvement, commitment). Perceived support has been related to
behavioral outcomes such as absenteeism and voluntary turnover (Rhoades and Eisenberger,
2002; Eisenberger at al., in press). A key behavioral outcome of perceived support that is
related to outcomes within the TAM is organizational citizenship behavioral (OCB)
intentions. Behavioral intentions within the TAM model focus on intentions to act in a
manner that either benefits or hinders the organization. Within the previous work on
perceptions of support, citizenship toward the organization is studied in a similar vein. The
primary idea is that perceptions of support are not an end in themselves; rather, they facilitate
key behavioral outcomes that impact the organization or the institution.
23
OCB is defined as additional things employees do that are beneficial to the
organization, but are not required of the individuals (Huang et al., 2004; LaMastro, 2001;
Lambert 2001; Schnake, 1991; Smith et al., 1983; Konovsky and Organ, 1996). These
additional actions could include, for example, assisting another co-worker with a problem,
attending social functions of the organization, or contributing to the United Way campaign.
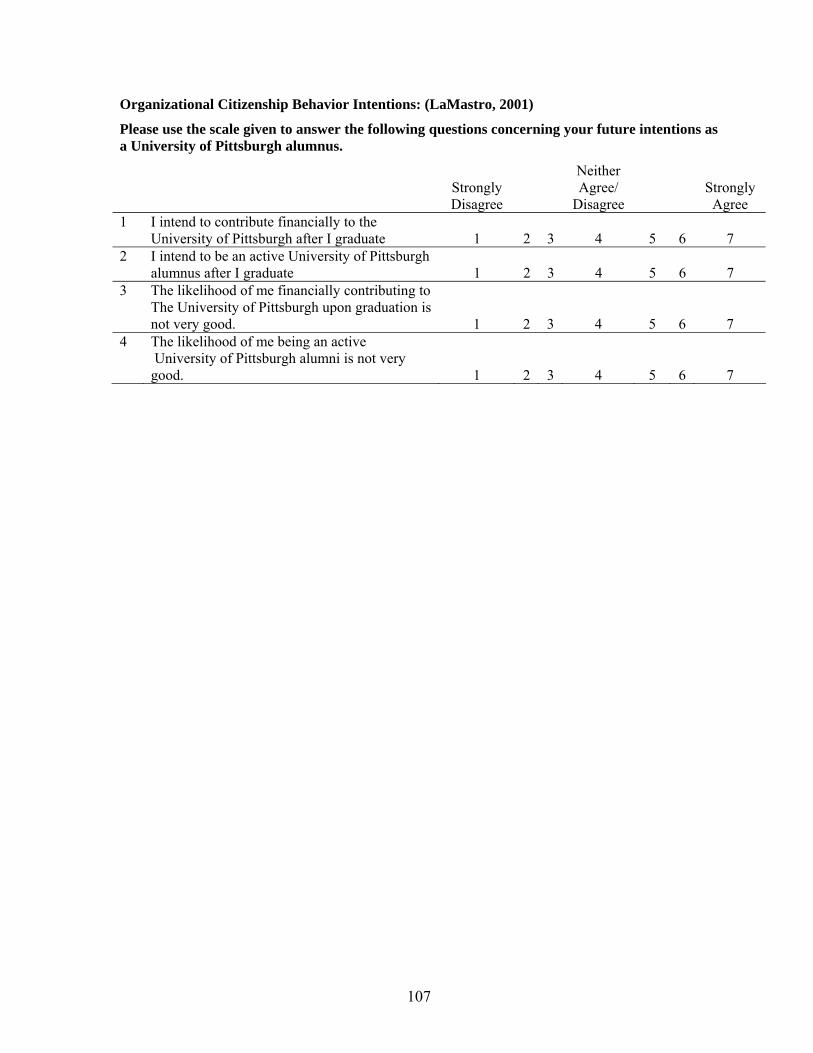
In a university context, LaMastro (2001) adapted the traditional concept of OCB to an
educational context and assessed students’ intent to contribute to the university as an
alumnus or intent to participate in alumni meetings. She found that high levels of perceived
institutional support predicted positive citizenship behavioral intentions. Thus, PIS not only
has an impact on attitudinal outcomes, but is also related to behavioral outcomes such as
OCB intentions, a notion consistent with previous TAM research.
3 THEORETICAL MODEL AND HYPOTHESES
3.1 Technology and Perceptions of Support: Theoretical Framework
This dissertation focuses on evaluations of organizational technology (the
organization’s website) and the impact of these judgments on perceptions of the organization,
namely perceived institutional support (PIS). Information technology (IT) can cover a wide
variety of software, hardware and/or processes. This research focuses on the organization’s
web portal and on members' perceptions of the website technology. The web portal was
chosen because of its pervasiveness in a wide variety of organizations. Websites are growing
in importance in many organizations and they are being used to provide a wide variety of
services to members of the organization. Understanding how perceptions of the website spill
over to perceptions of the organization can provide critical insights to researchers and
practitioners. To explain the relationship between IT perceptions and PIS, this study draws
24
on organizational support theory (OST) and the perceived organizational support construct
(Eisenberger et al., 1986; Rhoades and Eisenberger, 2002; Shore and Shore, 1995) and
applies them within an IT context.
This research builds on prior work in social psychology, organizational behavior and
management information systems to study the role of technology in shaping individual
attitudes and behavioral intentions. More specifically, technology acceptance research
demonstrates that two key IT beliefs, performance and effort expectancy, impact behavioral
intentions and eventually technology use. This dissertation attempts to go a step beyond
immediate consequences and illustrates the impact of IT beliefs on perceptions of the
organization; in particular, perceived institutional support. For instance, if an organization
provides its members with a sub-par website that is difficult to use or lacks usefulness, this
action of the organization could be viewed as neglectful, or even as an obstruction, and could
contribute to negative perceptions about the organization.
This act of providing sub-par technology could lead members to feel the organization
is not supporting them and does not care about them, thereby producing low levels of
perceived institutional support. The reverse should also be true in terms of positive
perceptions of the technology leading to high levels of perceived support. Thus, PE
(performance expectancy) and EE (effort expectancy), which address the usefulness of and
the ease of use of technology respectively, can be key antecedents that drive individual
perceptions of organizational and institutional support.
3.2 Research Model and Hypotheses
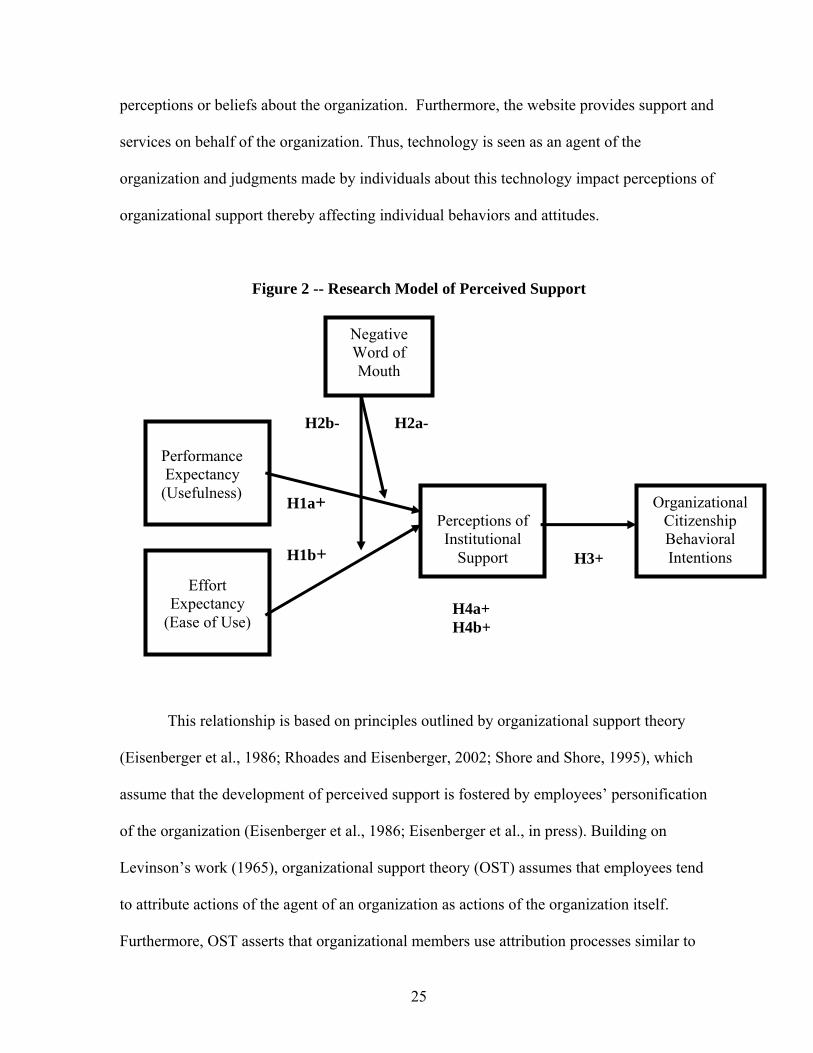
The research model for this dissertation is illustrated in Figure 2. This model tested
in this dissertation is based on the assumption that beliefs about IT spill over onto
25
perceptions or beliefs about the organization. Furthermore, the website provides support and
services on behalf of the organization. Thus, technology is seen as an agent of the
organization and judgments made by individuals about this technology impact perceptions of
organizational support thereby affecting individual behaviors and attitudes.
Figure 2 -- Research Model of Perceived Support
This relationship is based on principles outlined by organizational support theory
(Eisenberger et al., 1986; Rhoades and Eisenberger, 2002; Shore and Shore, 1995), which
assume that the development of perceived support is fostered by employees’ personification
of the organization (Eisenberger et al., 1986; Eisenberger et al., in press). Building on
Levinson’s work (1965), organizational support theory (OST) assumes that employees tend
to attribute actions of the agent of an organization as actions of the organization itself.
Furthermore, OST asserts that organizational members use attribution processes similar to
Organizational Citizenship Behavioral Intentions
Performance Expectancy (Usefulness)
H1b+ H3+
Perceptions of Institutional
Support
Negative Word of Mouth
H1a+
Effort
Expectancy (Ease of Use)
H2a- H2b-
H4a+ H4b+
26
those used in interpersonal relationships to determine how the organization values them.
Thus, positive actions of the organization or its agents toward its members could lead to
perceptions of being valued by the organization, thus having high levels of perceived
support. Conversely, actions by the organization or its agent that are perceived as negative
could lead to low levels of perceived support.
It is important to note that there is no direct link between negative WOM and PIS in
the model. The WOM in this study addresses the technology and not the institution. The
scope of each construct therefore implies moderation in this case.
As documented in the literature review of this dissertation, the organizational support
literature has studied many beliefs that organizational members hold about their organization
(e.g., perceived politics, perceived supervisor support, beliefs about organization policies,
and beliefs about leader-member exchange) and the impact these individual judgments have
on perceived organizational support. This dissertation argues that an individual will also
form beliefs about the IT that the organization provides its members. It is this judgment
about the information technology that can spill over onto perceptions about the organization.
This empirical study described in this document tests whether beliefs about information
technology are an additional source of influence that can help explain levels of perceived
institutional support in a university context
Thus, this dissertation examines the specific context of website perceptions, and its
impact on perceptions of institutional support among students. In the empirical model tested
by this dissertation (see Figure #2), individual expectancies (PE and EE) of the university
website should operate as an antecedent to perceived institutional support. This study
explores the idea that by its purpose, function and characteristics, the organizational website
27
is an agent of the organization, and as such, individuals’ perceptions of this agent should be
an antecedent to perceived support. In other words, interacting with the university website
will shape students’ perceptions about the quality of that interaction, and this could impact
how the students perceive they are supported by the university; thus influencing perceived
support.
Furthermore, in a university context, students may frequently interact with the
university website. This technology should be a useful tool to help students who must
complete personally-relevant tasks (e.g., registration, course-related research) and
accomplish individual goals (e.g., career planning, timely graduation). It is not simply the
mere presence of technology that creates a positive sense of organizational support.
However, it is the individuals’ perceptions of this technology that will also determine
whether or not this technology contributes to or detracts from PIS. It is important to
determine whether individuals perceive that this website helps the user better attain a goal,
PE, or is it perceived to be unproductive or difficult to use (captured through measuring EE).
Having a system that can help an individual complete his/her tasks or attain certain
gains is an important part of implementing technology. However, even if the system can
provide the needed information and functionality, these gains from the system may not be
utilized if the system is too cumbersome or too difficult to use. Hence, measuring effort
expectancy along with PE will yield a more complete set of antecedents of IT beliefs and can
help explain how these beliefs will impact PIS. According to organizational support theory
(OST), various forms of favorable treatment should contribute to higher levels of PIS.
Fairness, favorable treatment and interactions with organizational representatives, and
satisfactory conditions all contribute to PIS. Another concept that is important to
28
organizational support is the concept of discretionary actions. This is important because not
only is it relevant that organizational members are treated fairly, or that they are provided
with the tools they need to perform their tasks, but knowing that the organization did this
without being required to do so should increase levels of perceived support/PIS. Some may
view providing students with technology as an industry norm; therefore close to being a
requirement. However, if in addition to providing functionality this technology is also free of
effort, this may be viewed as a discretionary act by the organization and not just a required
act. Therefore, higher levels of EE should lead to higher levels of PIS.
Prior research suggests that ease of use and usefulness are related but distinct
constructs (Davis, 1989; Davis et al., 1989). This is also true about the recently developed
effort expectancy and performance expectancies (Venkatesh et al, 2003). The current study
suggests that technology that is perceived to have high levels of effort expectancy can be
perceived as the organization, in this case the university, giving an extra effort to
accommodate its members, in this case the students. Therefore we believe higher levels of
EE will lead to higher levels of PIS.
Higher levels of performance expectancy (PE), and effort expectancy (EE), will
produce higher levels of perceived institutional support (PIS).
Hypothesis #1a: Positive judgments of performance expectancy will have a positive
effect on level of perceived institutional support.
Hypothesis #1b: Positive judgments of effort expectancy will have a positive effect on
level of perceived institutional support.
Judgments about the organization are rarely made in a vacuum or outside of the social
context. Organizational support theory lends itself to the notion of contextual factors
29
influencing the relationship between perceived support and its antecedents. This dissertation
explores the important impact that social cues play in shaping perceived institutional support
in a university context.
Negative WOM from peers is examined and is expected to influence the impact of IT
beliefs, PE and EE, on perceptions of institutional support. Due to the social context of the
exchange relationship, there are factors in the social network that can influence the strength
of the exchange relationship and influence perceptions. These social influences could include
peers, fellow students, the press, or university sponsors. Due to the prevalence of peer
influence in a university environment, this study focuses on negative word-of-mouth (WOM)
communication and its moderating impact on the relationship between IT beliefs,
performance expectancy (PE) and effort expectancy (EE), and perceived institutional support
(PIS). Additionally, prior IT research (Galletta et al., 1995) suggests that negative WOM can
negatively influence IT attitudes and usage. Consistent with prior IT and marketing research,
negative WOM should have a negative impact in this context.
Impression formation (Fisk, 1980; Klein, 1996; Skowronski and Carlston 1987)
research in psychology suggests that when given positive and negative information about a
person, the subject forms an overall impression about that person using the negative
information (Ahluwalia et al., 2000). This behavior has been studied using products and
services to include technology. Furthermore, it is believed that this negative information, due
to its nature, usually more vivid and specific, can influence the positive information.
Therefore, when given negative WOM about the technology that the university provides, this
model predicts that the influence of PE or EE on PIS will be negatively moderated. Thus peer
input, along with the individual’s own judgments of the technology’s usefulness, should
30
result in moderating the impact of expectancies (performance and effort) on perceptions of
institutional support.
Hypothesis #2a: Negative WOM will negatively moderate the relationship between
performance expectancy and perceived institutional support.
Hypothesis #2b: Negative WOM will negatively moderate the relationship between
effort expectancy and perceived institutional support.
Perceptions of institutional support are critical because they have a range of
attitudinal and behavioral outcomes. Because organizational support theory (OST)
acknowledges the social exchange between the individual and the organization and has its
roots in the norm of reciprocity (Gouldner, 1960), as detailed in the literature review, it
assumes that individuals will treat others as they have been treated. In this context, OST is
assuming that an organizational member, the university student, will treat the university as
the university and/or its representatives have treated him/her. More specifically, the norm of
reciprocity gives theoretical support for predicting that PIS will directly influence OCB
intentions. That is, the more the individual perceives that the university cares about them and
values them, the more favorable non-mandatory actions he/she will demonstrate towards the
university. The reverse is also true, the less the individual feels they are valued by the
university, low levels of PIS, less favorable actions will be demonstrated towards the
university.
Thus, perceived support produces a range of outcomes (e.g., organizational
commitment, affective commitment, felt obligation, desire to remain, and organization
citizenship behavioral (OCB) intentions) that have been demonstrated in prior empirical
work (Eisenberger et al., in press; Eisenberger, et al., 2002; LaMastro, 2001; and Eisenberger
31
et al., 1997). To include a measure of behavioral intentions, this study focuses on
organizational citizenship behavioral (OCB) intentions that are reported by students in this
university context. If students perceive that the university is treating them well, then, based
on organizational support theory, students will have favorable intentions toward the
university. These favorable intentions are not required of the student, but are a result of high
levels of favorable treatment and support from the university. LaMastro (2001)
demonstrated that PIS has an impact on OCB intentions of university students and is
expected to have an impact in this study. Consistent with LaMastro’s work and prior
perceived support findings, perceptions of institutional support are expected to impact
citizenship intentions among students (see Figure #2).
Hypothesis #3: High levels of perceived institutional support will have a positive
effect on the level of organizational citizenship behavioral intentions.
The mediating impact of perceived support has also been demonstrated in the
literature (e.g., Rhoades et al., 2001; Moorman et al., 1998; Wayne et al., 1997). As
mentioned earlier, organizational support theory has as its foundation social exchange theory,
and specifically, the norm of reciprocity. OST explains how organizational members
personify an organization and ascribe human-like characteristics to that organization
(Eisenberger et al., 1986, Rhoades et al., 2001, Rhoades and Eisenberger, 2002).
Furthermore, the members will form beliefs about how the organization values them, defined
in this model as PIS. These beliefs will lead to favorable or unfavorable outcomes toward the
organization from the members, or OCB intentions. This attribution process provides the
theoretical explanation for predicting a mediating role of POS between perceived usefulness
of technology and behavioral outcomes.
32
Empirically, Rhoades et al. (2001) demonstrated that POS mediated the relationship
of organizational rewards, procedural justice and supervisor support with affective
commitment. The implications of these findings suggest that favorable work conditions
operate through POS to increase affective commitment. Similarly, Wayne et al. (1997) found
that POS mediated the relationship between a number of organizational experiences and
organizational citizenship behavior (OCB). Drawing on this theoretical and empirical
research, this dissertation proposes that PIS will mediate the relationship of IT expectancies
and OCB intentions in the university context where students access and make judgments of
the technology sponsored and provided by the institution.
Hypothesis #4a: Perceived institutional support will mediate the impact of
performance expectancy on organizational citizenship behavioral intentions.
Hypothesis #4b: Perceived institutional support will mediate the impact of effort
expectancy on organizational citizenship behavioral intentions.
The proposed model has several important implications for Information Systems (IS)
research and practice. The importance of technology and how IT beliefs can spill over and
impact individuals’ perceptions of and relationships with the organization is a significant
contribution. In addition, establishing the relevance of organizational support theory within
an IT context opens up a great deal of potential for future research to explore POS and its
impact on attitudes and behaviors concerning technology.
4 METHOD
4.1 Subjects and Design
To test the impact of negative WOM, EE (effort expectancy), and PE (performance
expectancy) on PIS (perceived institutional support), an experimental approach was used.
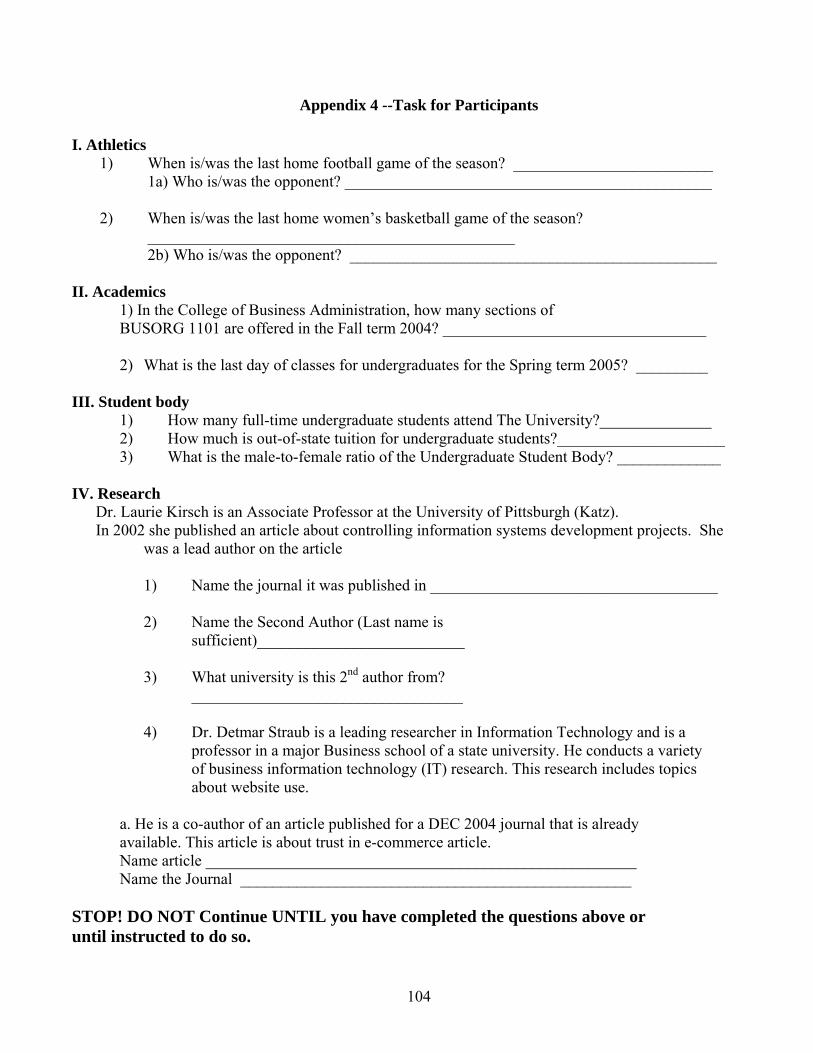
33
Participants were instructed to answer questions about the university by obtaining
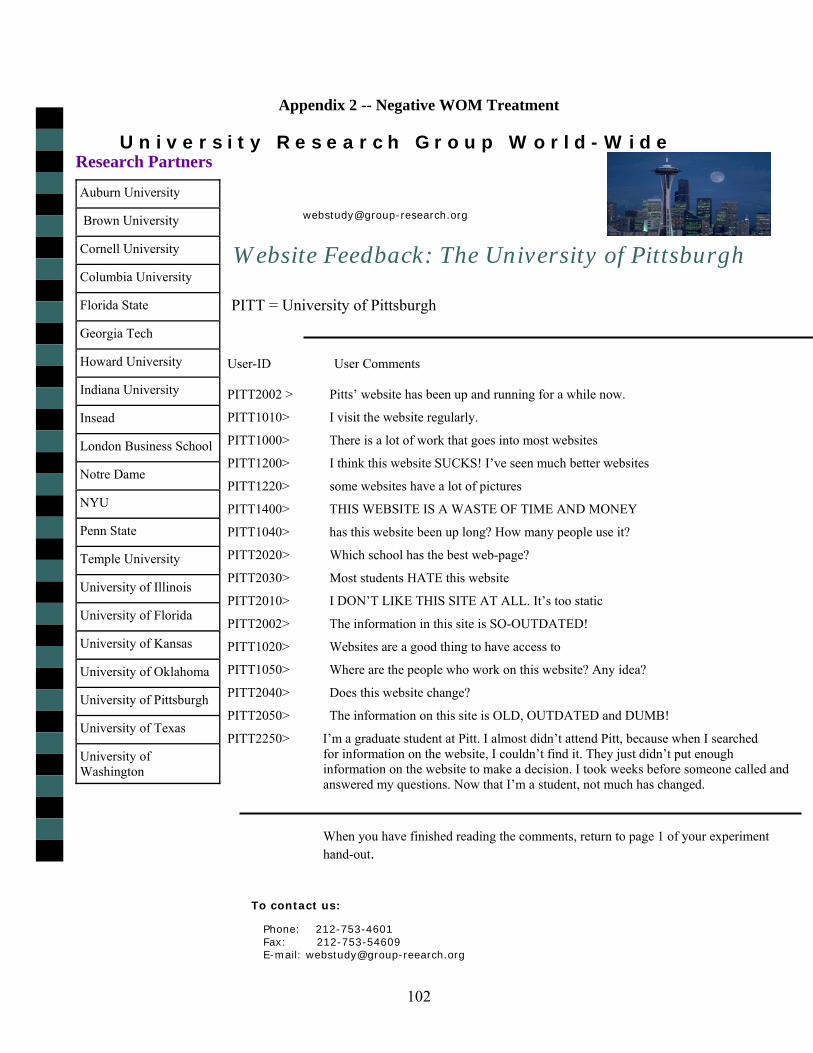
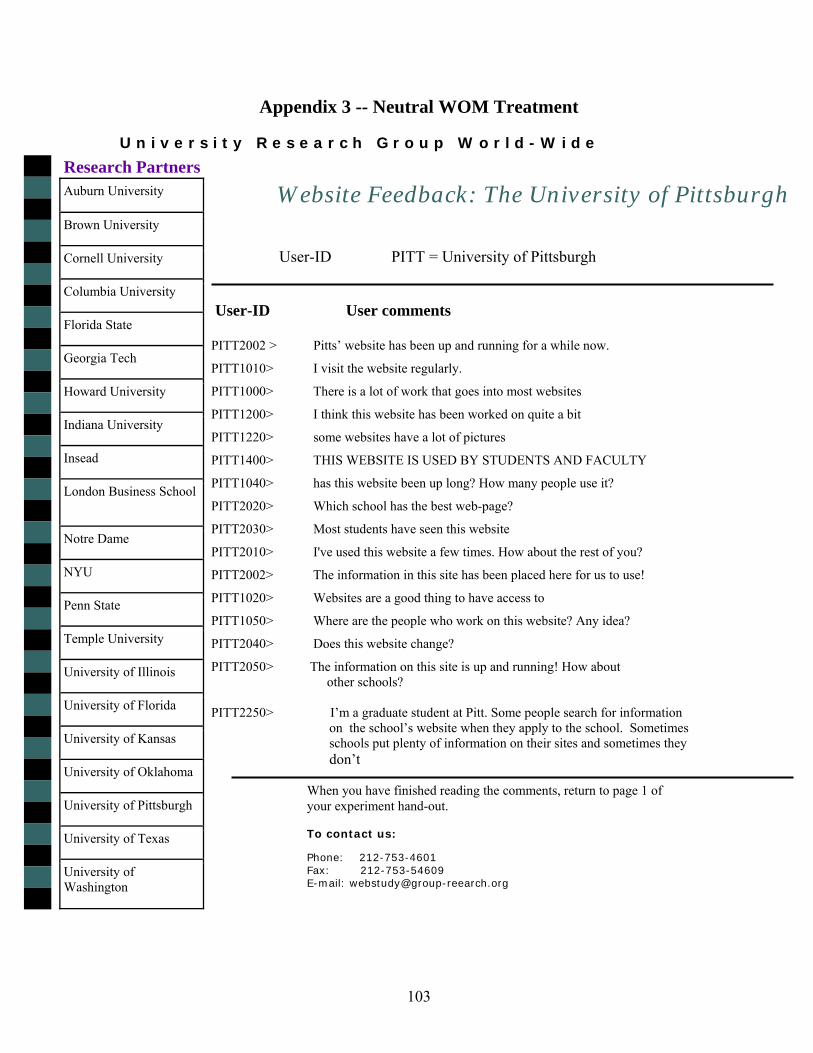
information from the university's website. A between-subjects design with three treatments
(negative WOM, neutral WOM, and a control group) was developed, using university
students as respondents. Each subject used his or her own university ID and password to log
on to the system in a public computer lab reserved solely for this experiment.
They were told not to log on until instructed to do so. Students were recruited from
an undergraduate introductory MIS class and were offered extra credit for their participation.
Additional participants were recruited from introductory psychology classes, and these
students were given credit toward their required experiment time. The presentation of the
experiment is divided into four phases: 1) preparation, 2) treatment, 3) performance, and 4)
measurement.
4.2 Experimental Procedures
Before the subjects logged on, they were instructed not to use the computer for any
other activities but the experimental tasks, and were told that doing other activities would
disqualify them from the experiment and they would forfeit their incentive. When all
students were seated at their workstations, with their instructions and task booklets, the
subjects were instructed to log on. Then the experiment moderator read the following two
paragraphs aloud.
“Welcome to the website utilization study. Please turn off all cell phones, pagers, PDAs and mobile devices at this time. During the next 45 minutes you will be asked to visit a website and to retrieve certain information. This information will be used to answer questions in your booklet. During this time we ask that you do not talk with anyone, and we ask that you work independently of your neighbor. You must follow all instructions. Failure to do so could disqualify you from the study and you will lose your incentive.”
During phase 2 the participants were given the appropriate experimental treatment
(either neutral WOM or negative WOM). No treatment was given for the control group.
34
WOM was manipulated through use of a simulated electronic bulletin board. Comments that
were said to come from University of Pittsburgh students were created and placed on a static
webpage. Students were told that these were actual comments from their student peers. The
participants were instructed to open two sessions of Internet Explorer. One session was
directed to the University of Pittsburgh’s home page and the other to the treatment page. The
following paragraph was read aloud.
“The university research group has evaluated university websites world-wide. We asked students such as you to give feedback on The University of Pittsburgh’s website. We randomly chose some of their comments from the electronic bulletin board, and placed them on a web page for you to view. Go to the web page and read the comments. Once you have read the comments, return to this hand-out. Proceed to the following webpage: ____________.”
Participants were initially given 3 minutes to read the comments. The web page
remained open during the experiment. Participants were welcome to refer back to the
comments through phase 3 (see Appendices 2 and 3).
The participants were instructed to answer questions about the University of
Pittsburgh (see Appendix #4). The questions were on page 2 of the booklet, and the
participants were instructed to find the answers to these questions using only the university’s
webpage, related Pitt sites, and the university’s on-line library databases. To standardize the
type of information that participants accessed during the experimental session, they were
instructed that Google and other search engines must not be used in order to standardize the
types of information that participants can access during an experimental session.
They were advised to write the answers in the booklet in the space provided next to
the questions. The questions to be answered by the subjects covered four categories which
are representative of the information that can be retrieved through any university’s website,
35
such as the type of information that students may need while on the campus. The categories
of questions were sports-related, academic- related, general student body questions, and
research questions (See Appendix 4 for specific questions). The questions were designed to
require students to consult various parts of the university website. The students were given
20 minutes to complete the task. Upon completion they were asked to complete the
remainder of the booklet, which led to phase 4.
In phase 4 of the experiment participants used the remainder of the time (25 minutes)
to complete the questionnaire. This was expected to be ample time, because pre-test subjects
only needed about 15 minutes to complete this task. Once phase 4 was completed, the
experiment was finished and the individual was free to leave after submitting the booklet and
reading a feedback sheet that explained the purpose of the study.
4.3 MEASURES
4.3.1 Independent Variables
Performance expectancy (PE) is defined as the degree to which an individual believes
that using the system will enhance his or her performance or ability to attain a work-related
goal. This is measured with a 4-item, Likert scale developed by Venkatesh et al. (2003), who
report a reliability of α= .92 for this scale (see Appendix 5 for items). This measure’s scale
ranges from 1-7, with 1 indicating strong disagreement with the statements (low PE), and 7
indicating high levels of PE.
Effort expectancy (EE) was also developed by Venkatesh et al. (2003). Effort
expectancy is defined as the degree of ease associated with the use of the system. This is also
a 4-item seven-point Likert scale. Venkatesh et al. (2003) report a reliability of α= .90 for
36
this scale that ranges from 1-7, with 1 indicating low levels of EE, and 7 indicating high
levels of EE.
Negative WOM is a manipulated variable represented by either negative or neutral
comments on the electronic bulletin board to which subjects are exposed during the treatment
phase. There are two manipulation check questions. The first asked if the comments have
been read, and the second asked about the valence of the WOM. These will be described
more fully below.
Perceived institutional support (PIS) was initially developed by LaMastro (2001). She
developed her scale by modifying the perceived organizational support scale to fit the
university context. PIS is defined as the individual’s perception that a relevant institution
values his or her contribution and cares about his or her well-being. Like LaMastro, this
study included the proper name of the university in the measures where appropriate (See
Appendix 5). PIS is an 8-item Likert scale with possible responses ranging from 1, indicating
low perceived support through 7, indicating high perceived support (with items 3 and 6
reverse coded). LaMastro (2001) reported a reliability of α= .71 for this scale. However,
other perceived support studies use the 8-item short form to capture POS and report higher
reliability for such items (see Eisenberger et al., 1997). This dissertation uses the short form
(the 8-item scale) and adapts the wording for the institutional context as outlined by
LaMastro (2001).
4.3.2 Dependent Variable
LaMastro (2001) examined three OCB intentions that are important to the university
context. These include the likelihood of attending the present university if a graduate
program of interest were offered; the likelihood of providing financial support to the
37
university as an alumnus, and the likelihood of becoming active in the alumni organization.
Not only are these behaviors non-mandatory, but they would also benefit the institution;
therefore, these behaviors fit the concept of citizenship behavior. When LaMastro measured
these OCBs they were single-item scales, and no reliability statistics are available. This
dissertation enhances the OCB scales and uses a two-item, 7-point Likert scale for each OCB
item.
4.3.3 Demographics and Control Variables
Other variables are collected to be used in secondary data analysis. One prominent
item that is relevant to the current study is computer efficacy (Compeau and Higgins, 1995).
Computer efficacy is defined as an individual’s belief about his or her ability to use
computers competently. This is a ten-item Likert scale with possible responses ranging from
1 – 7. A response of 1 exhibits no confidence in the respondent’s ability to use technology
(low computer efficacy), while 7 means that the subject is quite confident. This variable is
included as a potential control factor for different levels of knowledge or competency in
using technology which may impact subjects’ ability to locate and navigate through the
website during the experimental treatment phase.
Demographic variables are also collected, including gender, age, ethnicity, major, and
country of origin. Gender is a variable that may have an impact on the findings. Prior
research suggests that men and women have different reactions to technology (Venkatesh and
Morris, 2002). Thus, gender is an additional control variable that will be explored in
secondary analysis for this dissertation.
38
4.4 RESULTS FROM PILOT STUDY
4.5 Demographics
Participants for the pilot study were 42 university students, the vast majority of whom
were enrolled in the undergraduate management information systems course that all business
majors must take. The students were assigned extra credit for participating, and they were
told that they must be engaged in the experiment and answer the questions as honestly as
possible in order to receive the extra credit. Out of the 42 participants, the majority were
female, white and between the ages of 18-24. A profile of demographic information is
provided in 169 HTable 1.
The participants were randomly assigned to one of three experiment conditions; the
treatments were negative WOM (n=13), neutral WOM (n=14) and the control group (n=15).
As stated earlier, WOM was manipulated by showing the participants a static bulletin board
containing comments about the website from other students. The control group did not view
the bulletin board.
39
Table 1 -- Demographics for Pilot Sample
Negative WOM
Neutral WOM
Control Group
Total N Gender
13 (31.7%)
14 (33.3%)
15 (36.6%)
42
Male Female
2 (15.4%) 11 (84.6%)
6 (42.9%) 8 (57.1%)
7 (46.7%) 8 (53.3%)
15 (35.7%) 27 (64.3%)
Age 18-24 40-50 Ethnicity AA/Black American Caucasian/White American Asian American American Multi-Ethnic Asian/Pacific Islander Caucasian International Country of Origin US born Non US born
4.6 Experimental Treatment Randomization Manipulation Checks and Secondary Analysis
4.6.1 Randomization Check
In this study, subjects were randomly assigned to one of three treatment groups.
When participants signed up for an experiment time slot, they were not aware of any details
of the experiment and they were not aware which treatment was going to be administered.
This study will use gender to examine the randomness of the distribution of subjects to
treatment conditions.
40
Out of the 42 subjects, 15 were male (35.7%) and 27 (64.3%) were female. The 42
participants were dispersed among 3 treatments in the following manner: 13 subjects were
assigned to groups with the negative WOM treatment, 14 to the neutral WOM treatment, and
15 to the control group. For the negative WOM treatment, two of three conditions appeared
to be gender-balanced, as shown in 17 0 HTable 2. While the negative WOM condition did not
appear to be gender-balanced, the other two appeared more balanced. Chi-Square statistics
revealed that the possible imbalance is not significant, and random assignment of treatment
to each gender is not rejected.
Table 2 -- Gender Breakdown by Treatment Gender Total Female Male Negative WOM 11 2 13 Neutral WOM 8 6 14 Control Group 8 7 15 Total Total Expected
27 27
15 15
42 42
Pearson Chi-square (Df)
3.435 (1)
Sig (2-tailed)
.180
4.6.2 Manipulation Checks
There were two manipulation checks. The first check was a “yes” or “no” question
which asked whether or not the WOM comments were read. This was administered in the
response questionnaire to the neutral and negative WOM treatments. All participants of the
negative WOM and neutral WOM treatment groups checked yes. Therefore, no surveys
needed to be discarded at this point. If a participant checked no, the survey would have been
discarded.
41
However, to determine the effectiveness of the valence of the WOM comments, a 3-
item Likert scale was used to ask the participants how negatively or positively they perceived
the remarks/comments that were placed on an electronic bulletin board. The reliability of the
3-item negative WOM manipulation check yielded α= .749. The items are available in
Appendix 5 and below 17 1 HTable 3.
An independent samples t- test was also performed between the negative and neutral
WOM samples, with the results showing that the difference between the means of the two
treatment groups were significant (t= 7.692 p= .000, df= 24). The ratings within the negative
WOM treatment group were significantly different and more negative than for the neutral
WOM treatment group. Thus, the manipulation of negative WOM was validated. These
results are summarized in 1 72 HTable 3
Table 3 --T-Test for WOM Treatment Groups
Treatment
N
Mean
Std. Deviation
Std Error Mean
Negative WOM 12 2.5000 .47673 001
Neutral WOM 14 5.1786 1.11988 .022 T=7.692 p= .000 Note: Item “Consider the user reactions to The University of Pittsburgh’s website that you read:” Q1: How would you categorize those comments 1 (strongly negative) – 7 (strongly positive) Q2: The user reactions were very negative (R) 1 (strongly disagree) - 7 (strongly agree) Q3: The user reactions I read were very positive 1 (strongly disagree) - 7 (strongly agree) 4.6.3 Secondary Analysis: Web Experience and Computer Efficacy
As a further test of the validity of the experimental treatment, data were analyzed to
ensure that relevant technical skills among participants were randomly distributed across
treatment groups. An Analysis of Variance (ANOVA) was performed to examine the
42
differences between treatment groups with regard to computer efficacy and web experience.
There were no statistically significant differences in treatment conditions regarding computer
efficacy (F=1.337, p=.332, df= 2) and web experience (F=.531, p=.592, df= 2).
4.7 Correlations and Reliability Analyses
Correlations and reliability coefficients are also reported in 173 HTable 4. This includes the
independent variables, dependent variables and variables used for secondary analysis.
Note. N= 42. *p<.05; ** = p< .01; ***=p<.001; all r2 values are adjusted
51
According to Baron and Kenny (1986), the results of the regression analysis meet the
criteria revealing that PIS fully mediates the relationship between performance expectancy
and OCB intentions.
4.8.5 Control Variable Secondary Analysis
Web experience is an important control variable that has been used in experiments
using web interfaces (Everard, 2003; Jones 2003). Controlling for web experience in the
regression analysis equation did not produce any significant effects across the analyses
reported herein. Thus, the impact of PE (significant) and EE (not significant) on PIS did not
change as a function of web experience. The same is true for computer efficacy. The impact
of PE was still significant and the impact of EE on PIS was still insignificant.
4.8.6 Summary of Pilot Findings
1 87 HTable 13 presents a summary of the Hypotheses and the indication of support based
on the pilot data.
Table 13 -- Summary of Findings
H1a H1b
Judgments of PE will predict PIS Judgments of EE will predict PIS
Supported Not supported
H2a H2b
Negative WOM will negatively moderate PE and PIS Negative WOM will negatively moderate EE and PIS
Not supported Not supported
H3 PIS will predict level of OCB intentions Supported H4a H4b
PIS mediates the relationship of PE on OCB PIS mediates the relationship of EE on OCB
Supported Not supported
4.8.7 Implications for Main Study
An important observation for the pilot study is the negative word-of-mouth
manipulation. The word-of-mouth manipulation check was statistically significant;
52
therefore, no adjustments are required for the main study. However, the moderating effect of
negative WOM was not significant with a small number of subjects. If these results do not
change for the entire sample, additional explanations will need to be explored.
5 MAIN DATA ANALYSIS
This section presents the statistical analysis for the entire study. The data analysis was
conducted using two main approaches, multiple regression and structural equation modeling
(SEM) using partial least squares (PLS). Multiple regression is considered to be a first
generation data analysis technique, while SEM is considered second generation (Gefen et al.,
2000; Chin, 1998; Fornell, 1987). SEM permits complicated variable relationships and is a
more complete picture of the entire model (Gefen et al., 2000; Bullock et al., 1994, Hanushek
and Jackson, 1977). For this study, multiple regression will be used to test the hypotheses of
the study. SEM using PLS will be used to assess the overall structure of the model. The next
section will include demographics of the participants, manipulation checks, reliability and
correlation analysis, and statistical testing of the hypotheses using 1st generation analysis
multiple regression. This will be followed by analysis using 2nd generation PLS.
5.1 Main Study Sample Demographics
Participants of the study were 164 university students, the vast majority of whom were
undergraduate students between the ages of 18 and 24. There were slightly more females
than males, 51.8% and 48.2% respectively, and a majority of them (75.5%) identified
themselves as white. In terms of nationality, just over 90% of the participants were born in
the US. The vast majority of students came from an undergraduate MIS course (90%), and
the balance were either students from an undergraduate psychology course or other
volunteers. The MIS students were given extra credit for their participation. Psychology
53
students received course credit for their participation. The rest of the students were
volunteers who participated for a $10 incentive.
The participants were randomly assigned to one of three experimental treatments:
negative WOM (n=63), neutral WOM (n=63) and the control group (n=38). As in the pilot
study, WOM was manipulated by showing the participants a static bulletin board containing
comments about the website from other students. The control group did not view the bulletin
board. The demographics are reported in 18 8 HTable 15.
5.1.1 Randomization Check
As in the pilot study, the data will be examined to determine randomization across the
three treatment groups in terms of gender. On the surface, the numbers appear to be
balanced. There were a total of 85 (51.8%) women and 79 (48.2%) men in the study. The
distribution of gender across treatment groups is reported in Table 14. Chi-squared results
yield a value of .742 with a significance of .690. Therefore, the treatment groups appear to be
randomized in terms of gender. Crosstabs were run for computer self-efficacy and web
experience to determine equal distribution across treatment groups. In both cases, the chi-
square values were not significant.
Table 14 -- Gender Randomization Check
Gender Total Female Male Negative WOM 34 29 63 Neutral WOM 21 17 38 Control Group 30 33 63 Total Total Expected
85 85
79 79
164 164
Pearson Chi-square (Df)
.742 (1)
Sig (2-sided)
.690
54
5.2 Experimental Treatment Manipulation Checks
The manipulation checks were handled in the same manner as in the pilot study. For
the negative and neutral WOM treatment groups, the participants were asked if they read the
WOM comments on the bulletin board with a simple yes or no question. If a participant
would have responded negatively, then the questionnaire would have been discarded. All of
the participants in these two treatment groups responded in the affirmative However, to
determine the effectiveness of the valence of the WOM comments, a 3-item Likert scale was
used to ask the participants how they perceived the remarks/comments that were placed on an
electronic bulletin board. The reliability for the 3-item perceived WOM manipulation check
yielded a Cronbach’s alpha (standardized item alpha) of α= .858.
55
Table 15 -- Demographics for Main Study
Negative WOM
Neutral WOM
Control Group
Total
N Gender
63 (38.4%)
38 (23.2%)
63 (38.4%)
164
Male Female
29 (46.0%) 34 (54.0%)
17 (44.7%) 21(55.3%)
33 (52.4%) 30 (47.6%)
79(48.2%) 85(51.8%)
Age 18-24 25-30 30-40 40-50 Ethnicity* AA/Black American Caucasian/White American Hispanic/Latin American Asian American American Multi-Ethnic Asian/Pacific Islander Caucasian International Black/African Int’l Country of Origin US born Non US born Classification** Undergraduate Graduate/Professional Other
*1 respondent in the Negative WOM treatment did not respond to the ethnicity question.
** 1 respondent in the Negative WOM treatment did not respond to the classification question.
Rounding may have caused some percentage totals to be slightly over or under 100%
56
An independent samples t- test was also performed between the negative and neutral
WOM samples, with the results showing that the differences between the means of the two
treatment groups were significant (t= 7.60 p= .05, df= 99). The ratings within the negative
WOM treatment group were significantly different and more negative than for the neutral
WOM treatment group. Thus, the manipulation of negative WOM was validated. These
results are summarized in 1 89 HTable 16
Table 16 -- Test for WOM Treatment Groups
Treatment
N
Mean
Std. Deviation
Std Error Mean
Negative WOM 63 2.88 .1.38 .173
Neutral WOM 38 5.21 1.64 .267 T= -7.60 p= .05 Note: Item “Consider the user reactions to The University of Pittsburgh’s website that you read:” Q1: How would you categorize those comments 1 (strongly negative) – 7 (strongly positive) Q2: The user reactions were very negative (R) 1 (strongly disagree) - 7 (strongly agree) Q3: The user reactions I read were very positive 1 (strongly disagree) - 7 (strongly agree) As a further test of the validity of the experimental treatment, data were analyzed to
insure that relevant technical skills/characteristics among participants were randomly
distributed across treatment groups. An Analysis of Variance (ANOVA) was performed to
examine the differences between treatment groups with regard to computer self-efficacy and
web experience. There were no statistically significant differences in treatment conditions
regarding computer self-efficacy (F=.626, p=.536, df=2) and web experience (F=.537,
p=.586, df =2).
57
5.3 Correlation and Reliability Analyses
Correlations and reliability coefficients are reported in 190 HTable 17. This includes the
independent and dependent variables and variables used for secondary analysis. These scales
were taken from prior research and adhere to sound psychometric properties. This study
reports all reliabilities using Cronbach’s alpha (standardized item alpha) listed along the
The PIS construct was taken from LaMastro (2001) and is expected to have 1 factor.
using Varimax rotation, the criterion was set to extract Eigenvalues greater than 1. For the
PIS construct, factors ranged from .539 to .804 (See 19 9 HTable 25). As predicted, only one factor
emerged with the PIS construct.
63
Table 25 – PIS Factor Analysis Component 1 PIS1 The University of Pittsburgh strongly considers my goals and values. .804 PIS2 The University of Pittsburgh really cares about my well-being. .848 PIS3 (R) The University of Pittsburgh shows very little concern for me .808 PIS4 The University of Pittsburgh would forgive an honest mistake on my part. .545 PIS5 The University of Pittsburgh cares about my opinions as a student .697 PIS6 (R) If given the opportunity, The University of Pittsburgh would take advantage
of me .539
PIS7 Help is available from the University of Pittsburgh when I have a problem. .622 PIS8 The University of Pittsburgh is willing to help me when I need a special
favor. .737
N=163 Eigenvalue = 4.022 % of Variance Explained 61.467% The same analysis was conducted with the OCB intention construct. First the OCB
inter-item Pearson’s correlation matrix is examined. It shows that item correlations are
significant with the lowest correlation of .596 between items OCBFIN2 AND OCBALUM1
(See 200 HTable 26). All correlations are below the recommended .90 value (Field, 2005).
Step 2 Performance Expectancy (PE) WOM Treatment (WOM) PE x WOM
.742 .751 .977
.978
.978
.585
.101
.102
1.349 1.332 1.024
1.023 1.023
1.711 9.947 9.784
Equation IV: OCB Step 1: P. Expectancy (PE) WOM Treatment Step 2: P. Expectancy WOM Treatment PE x WOM Step 3: P. Expectancy WOM Treatment PE x WOM PIS
.978
.978 .
585 .101 .102
.585
.101
.102
.836
1.0231.023
1.7119.9479.784
1.7119.9479.7891.197
73
For regression analysis using grand mean centering, the dichotomous WOM
treatment variable was multiplied by centered independent variables PE and EE to obtain the
interaction term. When performing regression analysis, PIS on centered PE and centered EE,
the majority of the results, as expected, were the same as the regression analysis with non-
centered PE and EE. That is, the B, Std. Error and beta values were the same in both sets of
analysis (See 21 2 HTable 32). Also, the tolerance and VIF values were the same for the predictor
variables of both the centered analysis and the non-centered analysis. That is to say, with
centering, the tolerance values and the VIF values were both within acceptable limits.
The difference in the two sets of analysis can be found with the constants. That is to
say the B and the standard error values are different when using variables that have been
centered on the grand mean. Centering on the grand mean helps to make the intercepts more
interpretable. When grand mean centering is applied, the intercept refers to average level on
the predictor of a particular respondent. The B and standard error (SE) values are higher with
grand mean centering for the main effects (with centering B=4.248, SE=.087; without
centering B=3.072 SE=.264). This was also the case when the interaction terms were entered
into the equation on step 2. (with centering B= 4.347, SE= .088; without centering B= 3.015
and .317). The entire regression results with centering are presented in 21 3 HTable 32.
74
Table 32 -- Regression PIS on PE and EE and Treatment and Moderator using Grand Mean Centering
B
SE β
Step 1 (Ho 1a & 1b) (Constant)
4.348
.087
---
Centered P. Expectancy Centered E. Expectancy WOM Treatment r2= .156 F= 11.052 p=.000***, df= 3
.241
.068 -.013
.057
.055
.141
.353*** .102 -.007
Step 2 (Ho: 2a & 2b) (Constant) Performance Expectancy Effort Expectancy WOM Treatment Centered PE x Treatment Centered EE x Treatment
4.347 .238 .083 .145 -.002 -.034
.088 .076 .528 .120 .112
---
.349** .124
.075 -.004 -.082
Δr2 =.001 r2=.146 F=6.557 p=.000, df= 5
*** Indicates the item is significant at the p<0.001 level ** Indicates the item is significant at the p<.0.01 level * Indicates the item is significant at the p<0.05 level
5.6 Structural Equation Modeling (SEM)
As noted earlier, the use of SEM in information systems (IS) research is continuing
to grow in popularity (Gefen et al., 2000). Two SEM techniques that are prevalent in IS
research are LISREL and Partial Least Squares (PLS). When deciding which SEM technique
to use, this study examined the considerations mentioned by Gefen and his colleagues;
theoretical foundation, robustness of measures and sample size requirement. When using
75
established theories, both LISREL and PLS are appropriate. However, when building theory
or testing a newer theory, PLS may be more appropriate. Although this dissertation uses a
theory that has been rigorously tested over time, it is applied in an IT context in a relatively
novel manner. Therefore, PLS may be more appropriate for this research. The sample size is
more appropriate for PLS also. It is recommended to have 10 times the number of items in
the most complex construct (Gefen et al., 2000; Barclay et al. 1995). PIS is the most complex
construct in this study and there are 8 items. This study contains 164 valid subject responses,
which is well above the recommended number. Finally, all constructs in this dissertation are
reflective, and PLS, like LISREL, is appropriate for analyzing reflective measures. Thus
PLS was chosen as the SEM technique for this study using PLS Graph 3.0.
2 14 HTable 33 reports the latent variables (LVs), all of the measures or items, the loadings,
and the t-statistics for the loadings. The high loading and significant t-statistic for each item
of every construct are an early indication of sound psychometric measurement tools. Gefen
and Straub (2005) apply the standard used by Hair et al., (1998) to determine appropriate
item loadings. If a coefficient is below .40, it is considered to not load highly. If an item
loads above .60, the item loads highly. Latent variable PIS has some loadings below .60, but
Assessing the structural model involves determining the r2 value for each LV and
ascertaining the standard path coefficient for each relationship from exogenous variables to
endogenous variables. PLS offers two techniques to assess statistical significance; the
bootstrap and the jackknife techniques. The jackknife technique is a more cursory algorithm
and the hypotheses are tested by assessing statistical significance of the path coefficients.
This technique can be used to save resources and reduce execution time for large data sets.
Bootstrapping is a more exact calculation of measures. The statistical findings using the
bootstrap technique for the revised model are shown in Figure 3 with the path coefficients
along the arrows.
Depicting a model containing moderators with PLS differs from a traditional
representation of that kind of model. With a PLS model, the moderator, in this case WOM
treatment, is shown as an independent variable with a direct path to PIS. Interaction terms are
then calculated for each independent variable. These interaction terms are calculated by
multiplying every indicator in the moderator by every indicator in the independent variable
(Chin et al., 2003). Conceptually, these interaction terms are depicted as having a direct path
to PIS. The PLS model depicted in Figure 3 is conceptually equivalent to the research model
presented earlier in Figure 2. In Figure 3, the path loadings and the r2 values for each LV are
provided. The solid bold arrow represents the path loadings that are significant. The dashed
lines represent the loadings that are low or non-significant. In PLS, instead of focusing on
mediation, we consider direct effects, indirect effects, and total effects. Direct effects are
evaluated by examining the path from the independent variable to the outcome variable. In
this study, the direct effects are those paths from PE and EE to OCB Intentions. Indirect
80
effects are determined by the product of the path from the independent variable to the
mediator and the path from the mediator to the outcome variable. The total effect is the sum
of the direct and indirect effects. 2 18 HTable 36 gives a summation of the path analysis for the
PLS model.
Figure 3 -- Research Model for PLS
.381*** .195*
.491**
.086
.126
.101 -.070 -.045
= Supported hypotheses = Hypotheses not supported *** Indicates the item is significant at the p<0.001 level ** Indicates the item is significant at the p<.0.01 level * Indicates the item is significant at the p<0.05 level
Organizational Citizenship Behavioral Intentions
r2=.241
Perceptions of Institutional
Support r2=.175
Effort Expectancy
(EE)
Performance Expectancy
(PE)
Treatment
PExTreatment
EExTreatment
81
Table 36 -- Direct Effects -- Indirect Effects
PATH Standardized
Path Coefficient T-value for
Standardized Path Coefficient
Indirect effects Total Effects
PE PIS .381 4.679*** .381 EE PIS .118 1.117 .118
PE OCB .195 2.72* .187 .362 EE OCB .126 .174 .042 .168 PIS OCB .491 6.870*** .491
*** Indicates the item is significant at the p<0.001 level ** Indicates the item is significant at the p<.0.01 level * Indicates the item is significant at the p<0.05 level
As indicated in Figure 3, the path coefficient for performance expectancy (PE) to
perceived institutional support (PIS) is significant (t= 2.96, p<.05) and yields an r2 of .175.
Thus, perceptions of technology in terms of performance expectancy significantly predict
perceptions of institution support accounting for about 17% of the variance in participants’
attitudes toward the organization.
While performance expectancy contributes to perceptions of support, the PLS
analysis also shows a significant impact on organizational citizenship behavioral intentions.
The path coefficient between PIS and OCB is significant (t= 7.82, p<.01) with an r-squared
of .241. This illustrates a strong impact of perceptions of institutional support on level of
behavioral citizenship intentions (See Figure 3). The research model suggests that PE and
EE will not only predict PIS, but also OCB intentions. However, the impact of expectancies
on OCB intentions is expected to be indirect. That is, the expectancies are expected to
influence OCB intentions through PIS.
82
5.6.2 Summary of Statistical Analysis Multiple Regression and PLS
The statistical findings support some of the major hypotheses presented in the
research model. These findings are given even more support through two statistical methods;
regression analysis and PLS analysis. First of all, there was a main effect from performance
expectancy (PE) to perceived institutional support (PIS) as predicted by Hypothesis 1a. That
is, higher levels of PE yield higher levels of perceived support. This prediction was supported
both in the regression analysis and the PLS analysis. In the regression analysis, the impact of
PE on PIS was significant at the .00l level. With the PLS analysis the prediction of the
influence of PE on PIS was also significant at the .001 level. It was hypothesized (H1b) that
effort expectancy would have a similar influence on PIS. However, this hypothesis was not
supported. The research model also expected that negative WOM would moderate the impact
of both PE and EE on PIS. No support was found for these hypotheses (2a or 2b). That is,
negative WOM did not moderate the relationships of PE and EE on PIS. These predictions
were also insignificant in the PLS analysis. That is, the main effect of EE on PIS, and the
moderating impact of negative WOM were not supported.
One important comparison between the PLS analysis and the regression analysis is
the adjusted r2 values when examining step 2 of the regression analysis which covers
hypotheses 1a, 1b, 2a, and 2b, r2= .146. In the PLS analysis, where the main effects of PE
and EE are examined and the moderating effects of negative WOM are also in the model, r2=
.175, because of the different algorithms used in the statistical analysis, they do not agree
precisely. However it is clear that they are close.
83
There is strong support for the predicted relationships of PIS on OCB intentions. The
statistical analysis suggests that H3 is supported. That is to say, higher levels of institutional
support lead to higher levels of OCB intentions. This was also supported with both statistical
methods when comparing the r2 values, the r2= .239 with regression analysis (see step 3 of
2 19 HTable 30) and .r2 = .241 in the PLS model (see Figure 3).
And finally, the statistical analysis suggests support for the mediating role of PIS on
the relationship of PE on OCB intentions (H4a). Because EE did not have a significant
relationship on PIS, the mediation analysis for that hypothesized relationship (H4B) was
dropped. The findings of the statistical analysis for this dissertation are summarized in
2 20 HTable 37.
Table 37 -- Summary of Findings Hypothesis
Findings
H1a H1b
Judgments of PE will positively affect PIS Judgments of EE will positively affect PIS
Supported Not supported
H2a H2b
Negative WOM will negatively moderate PE and PIS Negative WOM will negatively moderate EE and PIS
Not supported Not supported
H3 PIS will positively affect level of OCB intentions Supported H4a H4b
PIS mediates the relationship of PE on OCB PIS mediates the relationship of EE on OCB
Supported Not supported
These findings were supported both in the regression analysis and the PLS analysis.
The statistical analysis clearly shows support for hypotheses 1a, 3 and 4a. The discussion
also shows some of the similarities in the findings between two statistical methods. Reporting
both statistical methods serves two purposes. First of all, it strengthens the findings by
showing that the predictions are consistent across different statistical analysis. These
statistical methods include the more traditional analysis of multiple regression and second
84
generation analysis of PLS, which is growing in use in the IS field. By providing findings
with regression analysis, it allows future researchers to build on prior research that utilizes
first generation techniques. The next section will discuss conclusions and contributions of
this dissertation.
6 DISCUSSION AND CONTRIBUTIONS OF RESEARCH
Results from the study provide some support for the role of technology on
perceptions of institutional support as well as citizenship behavioral intentions. The analyses
find support for Hypotheses 1a, 3, and 4a. Performance expectancy significantly predicts
perceptions of institutional support (Hypothesis 1a). These perceptions of support contribute
to organizational citizenship behavioral intentions by students who participated in this
research (Hypothesis 3). Most interestingly, perceptions of support mediate the relationship
between performance expectancy and citizenship intentions (Hypothesis 4a). That is to say,
the impact of IT perceptions on OCB works through PIS. Clearly, performance expectancy
rather than effort expectancy (Hypotheses 1b & 4b) is an important driver of how perceptions
of technology can impact the extent to which individuals feel supported by their institution.
While the findings provide some support for the role of technology perceptions on
perceptions of institutional support and organizational citizenship behavioral intentions, there
was no support found for the impact of negative word of mouth on perceptions of
institutional support or citizenship behavioral intentions (Hypotheses 2a & 2b). While the
manipulation check of negative word of mouth showed that students recognized the negative
information about the technology, this external feedback did not impact their views of the
technology or their attitudes toward the organization. Thus, perceptions of support were
85
driven by performance expectancy, which was not significantly influenced by the presence of
negative word of mouth within the current research.
Based on the statistical findings, a more useful research model would omit any
moderating impact of negative WOM (see Figure 4). The impact of effort expectancy on PIS
would also be eliminated from the model. When eliminating EE as a direct effect on PIS, the
r2 drops slightly from .175 to .168. The next sections will discuss the theoretical and practical
implications of the findings.
Figure 4 -- Revised Model of IT Impact on Institutional Support and OCB
.195* H3+ H1a+ .370* .491 ***
*** Indicates the item is significant at the p<0.001 level, two-tailed. ** Indicates the item is significant at the p<.0.01 level two-tailed. * Indicates the item is significant at the p<0.05 level
The finding that performance expectancy (PE) significantly influences PIS provides
initial support for the idea that beliefs about technology spill over onto beliefs about the
organization. Recall that PE measures organizational members’ perceptions of technology
that is sanctioned by the organization. To the extent that individuals feel that technology is
useful in helping them achieve performance goals and complete work-related tasks, they will
Perceived Institutional
Support (PIS) R2=.168
Organizational Citizenship Behavioral Intentions
r2=.241
Performance Expectancy
(PE)
86
conclude that the organization supports them. This finding validates the assumption within
this work that judgments about actions of the organizational technology contribute to
individual attitudes toward the organization itself. Thus, technology can be viewed as an
agent of the organization in much the same way as HR policies and programs are viewed.
This finding helps to provide an important theoretical link between the Theory of Reasoned
Action (TRA, Fishbein, M. and Azjen, 1975), which is the theoretical basis for TAM,
organizational support theory and PIS. Thus, the finding that PE, a belief, influences PIS
and eventually intentions (OCB), reveals that members see the usefulness of technology as an
indication of how the organization values them and cares about them.
The practical implication of this result for organizations suggests that firms must pay
attention to the perceived usefulness/ performance expectancy of the technology it adopts,
because it could negatively (or positively) impact individuals’ perceptions of support, which
drive citizenship behavioral intentions. As we know from previous work in this area,
perceptions of support can also have an impact on other work-related attitudes not measured
in this study (e.g., job satisfaction, organizational commitment, job involvement) and/or key
human capital outcomes (e.g., absenteeism, voluntary turnover). This provides evidence that
perceptions of technology are an important agent of the organization which should be
addressed by future research utilizing organizational support theory within an IT context
The importance of technology as an agent of the firm is highlighted by another
finding of this study. Results show that PIS influences organizational citizenship behavior
(OCB). When individuals perceive that the organization values them, they will return that
support with discretionary actions that benefit the firm known as organizational citizenship.
This finding is quite consistent with social exchange theory, and highlights the reciprocal
87
exchange that takes place between individuals and their institution. Because organizational
citizenship involves discretionary or non-mandatory actions that benefit the organization, it is
important to understand how these behaviors can be enhanced or obstructed. Previous
research has shown that HR policies, supervisory relationships, and perceptions of fairness
can impact this type of discretionary behavior. The current research represents a contribution
to this work by including organizational technology as an additional driver of OCB. If an
institution (e.g., a university) wants to build strong member relationships and increase non-
mandatory actions that benefit it, some attention should be paid to factors that drive
perceptions of support. The current research provides support that the perceived usefulness
of organizational technology is one of these important factors that deserves additional
attention.
One of the key findings within the current research is that PIS mediates the
relationship between PE and OCB. This means that within a university context, IT
perceptions play a role in how a university is perceived by the students. Furthermore, it
shows that the quality of the technology that is provided by a university is an indication of
whether students believe that the university values them. Perceptions of support play a
critical mediating role that should not be overlooked, especially within the context of
organizational technology. This finding suggests that it is not the perceptions of technology
that are driving whether or not the individual will act in a manner that supports the
organization, but it is the perception of support that drives these behavioral intentions.
Clearly, there is an inference that individuals draw from technology that is provided by the
organization. These favorable perceptions of technology can result in favorable OCB
outcomes such as strong alumni affiliation and long-term support of the institution.
88
While support was found for the importance of performance expectancy on
perceptions of institutional support, effort expectancy (EE) did not have a significant
influence on PIS. One possible explanation could be found in some of the previous work.
Based on the perceived ease of use construct (PEOU), the impact of perceived ease of use
(the predecessor of effort expectancy) on key behavioral outcomes has been somewhat
mixed. Some studies show that it has an impact on technology acceptance and use, while
other studies have found no impact (Venkatesh et al, 2003). In addition, some research has
found that over time ease of use becomes less important (Venkatesh et al., 2003). This
finding has relevance within the current research context. Because a majority of the
participants had some level of experience with the institution and its website (the majority
were juniors), it is reasonable to expect that EE may be less relevant for these individuals
than newcomers to the university. Thus, the more experience an individual has with the
technology, the less perceived ease of use is a factor in driving perceptions of support. It is a
reasonable explanation of the lack of significance or EE, and suggests that this aspect of
technology perception is more relevant with the adoption of new technology than
individuals’ evaluations of ongoing technology (e.g., website).
Most surprising is the lack of findings concerning negative word-of-mouth on the
impact of PE and EE on perceptions of institution support and organizational citizenship
behaviors. Prior research supported the expectation that negative information would be
salient to perceivers, and thus drive their overall evaluations within the situation. There are
several plausible explanations for the lack of support for the influence of negative WOM.
One possible explanation is the static nature of the way WOM was operationalized. Recall
that participants were directed to a static bulletin board that contained negative comments
89
from unknown students. However, some other research has used negative comments by a
face-to-face confederate to manipulate WOM (e.g., Galletta et al., 1995). Negative comments
that are delivered face-to-face might have a more powerful impact on perceptions of
technology feedback from static electronic communication. Negative WOM in the current
research not only occurred via a static medium, but also was provided by an unknown and
unseen student peer. Prior WOM research suggests that the strength of the social tie between
the sender and receiver has an impact on how the information is valued and acted upon.
Although the WOM “sender” was identified by a user ID that contained the university name,
this “student” was still anonymous and had no prior relationship or social tie to the student
participant. Without the presence of a clear social tie or salient group membership, subjects
may have recognized the negative comments, but disregarded them as important information
to be used when evaluating the technology and the organization. Thus, a follow-up research
endeavor would be to vary the type of WOM media (e.g., face-to-face) and the strength of
the social tie (unidentified student, acquaintance, friend) and measure the impact on
perceptions of technology and perceived institutional support. This type of future research
would provide a more rigorous test of the impact of negative WOM on perceptions of
technology and institutional support than did the current research.
6.1 Contributions, Limitations and Future Directions
This study offers several contributions to the field of IS and to our understanding of
individual-organizational interactions. First of all, we gain insight into how technology, such
as a university web portal, while designed to represent an organization and provide
organizational support to its members, may also impact perceptions about the organization
among its members. Prior to this study, little had been reported about how perceptions of the
90
organizational technology may spill over onto perceptions of the organization. Because of the
nature of the individual-organization social exchange, this implication is also relevant to the
employee-employer context. That is to say, perceptions of technology that an employer
provides for the employee to do his/her tasks may spill over to perceptions of the
organization.
The findings of this dissertation can be generalized, with caution, to a broader context
of the employee-employer environment. This generalization can be made both from a
theoretical and a practical perspective. From a theoretical perspective, the same theory,
organizational support theory (OST), that explains the employee-employer relationship, is
used to explain and understand the student-university/institution relationship. This extension
began with LaMastro (2001) and is continued with this dissertation. From a practical
perspective, the university is a social structure, much like the corporation is a social structure.
Some of the same social influences that would cause a member of a corporation, an
employee, to feel valued by a corporation may also influence the student, e.g., an
organizational member, in the university/institutional organization. According to LaMastro
(2001) the social exchange that exists between an employee and the organization also exists
between the student and the university.
Providing useful technology could lead to strong levels of perceived support by the
employee to the employer. High levels of perceived support can lead to other positive
outcomes for the organization. This study focused on OCB intentions. Prior IS research has
designated a number of important roles for technology within the organization. The current
research adds yet another important role to this critical list; technology as an agent of the
organization. Web portals within organizations often provide knowledge and services on
91
behalf of the organization. In fact, many of these services were once administered through a
human representative of the organization. Based on organizational support theory, this
dissertation contributes the additional finding that, under certain conditions, individuals may
treat technology as such an agent and respond toward that technology in a manner that also
impacts how they perceive and interact with a supervisor, another representative, or the
organization itself.
Another contribution this study offers is that it provides an additional theoretical
framework for the role of performance expectancy and its outcomes. Prior TAM research
demonstrated that IT beliefs impact behavioral intentions and technology usage. The current
work extends the outcomes of IT beliefs to now include the impact of IT beliefs on attitudes
toward the organization. This dissertation demonstrates that performance expectancy has
additional outcomes which warrant further investigation; namely perceived institutional
support (PIS). Future research should explore the possibility that organizational support
theory can be used to explain other IT beliefs and provide additional support for the impact
IT has on organizational perceptions and attitudes and ultimately perceived support
outcomes.
Another positive outcome of this study is that it contributes to the reference discipline
of organization behavior/industrial organizations. Prior research has demonstrated a number
of antecedents to perceived organizational support. The findings of this dissertation
demonstrate that technology can be viewed as an antecedent to perceived support.
Finally, this study also extends LaMastro’s work by examining the mediating impact
of perceived support in a university context. The findings show that, consistent with the
employee-employer context, perceived support also mediates key antecedents with key
92
outcomes of perceived support within a university setting. This provides evidence for the
robust nature of the perceived support construct to translate across specific domains (e.g.,
organization, institution, university). The current work, coupled with the previous work of
LaMastro, suggests that organizational support theory can generalize across many different
types of institutions. This idea has significant implications for future research. Notions of
technology acceptance and its impact on perceptions of support could be extended to other
types of organizations (e.g., governmental, non-profit, and for-profit firms) in various sectors
and industries. There is the potential for a rich agenda of research questions for future
scholars to address.
6.2 Conclusions and Limitations
The primary objective of this dissertation was to understand the impact of web portal
perceptions on organizational attitudes. The study shows that performance expectancy
influences perceived institutional support and impacts organizational citizenship behavior.
While the current model provides some support for this relationship, the magnitude of the
overall model was moderate. Findings show that PE explains 17.5% of the variance in PIS.
This implies that there are other factors that influence PIS, and thus a more complex model
should be developed. While WOM was explored in the current research, there are clearly IT
and non-IT influences that were excluded from the current model. Future research should
explore some of the additional factors that recent IT research has identified as being
important in explaining technology acceptance and utilization. These factors may also
influence PIS in a similar manner as PE. In addition, the inclusion of organizational support
theory suggests a number of non-IT variables that may play an important role that were not
examined by the current work.
93
While the context of this current work focused on a university web portal, the
subjects included in this study were exclusively students. Undoubtedly, an organization’s
web portal has an impact on a number of other members of the university not examined in
the current research. Faculty, staff, administrators and alumni all access and utilize the
website for various work-related and personal goals and objectives. One limitation of the
current work is that it focuses on a single stakeholder within the university context. A
balanced stakeholder approach would provide rich information for organizations who seek to
understand the role that technology plays in helping to facilitate versus obstruct their overall
effectiveness.
The experimental setting does not allow for studying the impact of IT on PIS over
time. Future studies may find that over time, perceptions of technology (both PE and EE)
may have more or less of an impact as the users become more familiar with the technology.
In addition, this study focuses on one aspect of organizational technology, the website. Other
forms of technology were excluded from the current work. These other forms, such as
chatrooms, instant messaging, etc., would be an interesting contrast to the relatively static
nature of an electronic bulletin board.
Additional operationalizations of IT could also add to this body of research. It might
be the case that other IT forms have different impacts on the development of and level of
perceived support. This study makes assertions about the influence of website perceptions on
PIS; however, the proposed relationships in this study may not be applicable to all types of
technology. This limitation could be explored in future research which would provide many
rich opportunities to expand this research stream.
94
This study provides several contributions to the field of IS. These contributions
include, 1) applying organizational support theory to an IS context; 2) demonstrating IT as an
agent of the organization; 3) showing that IT impacts PIS outcomes through PIS mediation;
4) demonstrating the strength of the predictions in both first and second generation statistical
analysis; and most importantly; 5) showing that IT belief outcomes go beyond intent to the
use of technology. This study gives empirical evidence that IT beliefs have an impact on
attitudes about the organization and behavioral intentions toward the organization. This study
will have an impact on future IS research for years to come.
95
References
Ahluwalia, R. Burnkrant, R., and Unnava, H (2000). Consumer response to negative
publicity: the moderating role of commitment, Journal of Marketing Research. Vol 37, 203-214.
Arndtz, J. (1967) Role of product-related conversations in the diffusion of a new product, Journal of Marketing Research, 4, 291-295.
Anderson, E. and Weitz, B. Fall (1989). Determinants of continuity in conventional industry channel dyads, Marketing Science, Vol. 8 No. 4, 310-323.
Azjen, I. and Fishbein, M. (1980). Understanding attitudes and predicting social behavior. Englewood Cliffs, NJ: Prentice-Hall.
Barclay, D., R. Thompson, and C. Higgins (1995). The Partial Least Squares (PLS) Approach to Causal Modeling: Personal Computer Adoption and Use an Illustration, Technology Studies (2) 2, pp. 285-309.
Baron, R. M., and Kenny, D. A. (1986). The moderator-mediator variable distinction in
social psychological research: Conceptual, strategic, and statistical considerations. Journal of Personality and Social Psychology, 51, 1173-1182.
Bickel, R. and Howley, C., (2003). Elementary Math Achievement for Rural Development:
Effects of Contextual Factors Intrinsic to the Modern World, Working Paper No. 15 Appalachian Collaborative Center for Learning, Assessment and Instruction in Mathematics, March 2003.
Bone, Paula, (1995). Word-of-Mouth Effects on Short-term and Long-term product
Judgments. Journal of Business Research, 32, 213-223.
Bone, Paula, (1992). Determinants of Word-of-Mouth communications during product consumption, Advances in Consumer Research Vol. 19, 579-583.
Bullock, H. E., Harlow, L.L., and Mulaik, S.A. (1994) Causation Issues in Structural Equation Modeling Research. Structured Equation Modeling (1) 3, pp. 253-267.
Chin, W. W. (2003), The partial least squares approach to structural equation modeling. In G. A. Marcoulide (Ed.): Mahwah, NJ: Lawrence Erlbaum., Modern methods for business research 295-336.
Chin, W. W. (1998). The partial least squares approach to structural equation modeling. In G. A. Marcoulide (Ed.): Mahwah, NJ: Lawrence Erlbaum., Modern methods for business research 295-336.
96
Compeau, D.R., and Higgins, C.Z. (1995). Computer self-efficacy: Development of a measure and initial test. MIS Quarterly, 19 (2), 189-211.
Cropanzano, R., Howes, J.C., Grandey, A.A. and Toth, P. (1997). The relationship of organizational politics and support to work behaviors, attitudes, and stress. Journal of Organizational Behavior, 22, 159-180.
Davis, F. (1989). Perceived usefulness, perceived ease of use, and user acceptance of information technology, MIS Quarterly 13 (3) 319-339.
Davis, F., Bagozzi, R., and Warshaw, P. (1989). User acceptance of computer technology: a comparison of two theoretical models, Management Science, Vol. 35, No 8, Aug., 982-1003.
Doll, W., and Torkzadeh, G. (1988). The Measurement of End-User Computing Satisfaction, MIS Quarterly, 12, 2 June, 259 – 274.
Eisenberger, R. Aselage, J., Sucharski, I. L., Jones, J. R. (In press). Perceived Organizational Support. In J. Coyle-Shapiro, L. Shore, and S. Taylor, and L. Tetrick (Eds.). The employment relationship: Examining psychological and contextual perspectives. Oxford University Press.
Eisenberger, R., Stinglhamer, F., Vandenberghe, C., Sucharski, I. Rhoades, L. (2002). Perceived Supervisor Support: Contributions to Perceived Organizational Support and Employee Retention. Journal of Applied Psychology, Jun, Vol. 87 Issue 3, 565 – 574.
Eisenberger, R., Rhoades, L., and Cameron, J. (1999). Does pay for performance increase or decrease perceived self-determination and intrinsic motivation? Journal of Personality and Social Psychology, 77, 1026-1040.
Eisenberger, R., Cummings, J., Armeli, S., and Lynch, P. (1997). Perceived organizational support, discretionary treatment, and job satisfaction. Journal of Applied Psychology, 82, 812-820.
Eisenberger, R., Fasolo, P., and Davis-LaMastro, V. (1990). Perceived organizational support and employee diligence, commitment, and innovation. Journal of Applied Psychology, 75, 51-59.
Eisenberger, R., Huntington, R., Hutchison, S., and Sowa, D. (1986). Perceived organizational support. Journal of Applied Psychology, 71, 500-507
Everard, A. (2003) The effect of presentation flaws in on-line store web sites on perceived quality and consumer trust of the on-line store and intention to purchase. Unpublished dissertation. The University of Pittsburgh.
Feick, L. and Price, L. (1987) The Market Maven: A diffusion of market place information, Journal of Marketing, 51 (January), 83-97.
97
Field, A. P. (2005). Discovering statistics using SPSS (2nd edition). London: Sage.
Fishbein, M. and Azjen, I. (1975). Belief, Attitude, Intention and Behavior, An Introduction to Theory and Research, Reading, MA: Addison-Wesley. 1975.
Fisk, S. (1980). Attention and weight in person perception: The impact of negative and extreme behavior, Journal of Personality and Social Psychology, 38 (6), 889-906.
Flouri, E. (2004). Parental Background and Political Attitudes in British Adults Journal of Family and Economic Issues, Vol. 25(2) Summer 2004.
Fornell, C. (1987). A second generation of multivariate analysis: classification of methods and implications for marketing research, Review of Marketing, M. J. Houston (ed.), American Marketing Association, Chicago, IL, 1987, pp. 407-450.
Fornell, C, and Larcker, D. (1981) Evaluating Structural Equation Models with Unobservable Variables and Measurement Error. Journal of Marketing Research (18), pp. 39-50.
Galletta, D.F., Ahuja, M., Hartman, A., Peace, A.G., and Teo, T. (1995) Social Influence and
End-User Training. Communications of the ACM, V. 38, N. 7, pp. 70-79.
4 6 HGarson, D, (2005) PA 765 Statnotes: An Online Textbook, 4 7 Hhttp://www2.chass.ncsu.edu/garson/pa765/statnote.htm.
Gefen, D. and Straub, D., (2005). A practical guide to factorial validity using PLS-Graph:
tutorial and annotated example, 91- 109.
Gefen, D., Straub, D., and Boudreau, M.-C. (2000). Structural Equation Modeling and Regression: Guidelines for Research Practice. Communications of AIS, Vol. 4, No. 7, pp. 1-80.
George, J. M., Reed, T. F., Ballard, K. A., Colin, J., and Fielding, J. (1993). Contact with AIDS patients as a source of work-related distress: effects of organizational and social support. Academy of Management Journal, 36, 157–171.
Gouldner, A. (1960) The norm of reciprocity: a preliminary statement, American Sociological Review, vol., 25, 151-178.
Hair, J., Anderson, R., Tatham, R., and Black, W. (1998). Multivariate data analysis with readings, 5th Edition. Englewood Cliffs, NJ; Prentice Hall.
Hanushek, E. A. and J. E. Jackson (1977) Statistical Methods for Social Scientists. Orlando, FL USA: Academic Press
Herr, P, Kardes, F., Kim, J. (1991). Effects of word-of-mouth and product-attribute information of persuasion: an accessibility-diagnosticity perspective, Journal of Consumer Research, Mar, Vol. 17 Issue 4, p454-462.
98
Higie, R, Feick, L, and Price, L. (1987). Types and Amount of Word-of-Mouth Communications about Retailers, Journal of Retailing, Vol. 36 No. 3, 260-278.
Huang, J, Jin, B, Yang, C. (2004). Satisfaction with business-to-employee benefit systems and organizational citizenship behavior: An examination of gender differences, International Journal of Manpower Vol. 25 No. 2, pp 195-210.
Jones, B. (2003). Assessing the effects of web-site control design on single-step navigation. Unpublished dissertation. The University Of Pittsburgh.
Kacmar, K, and Carlson, D (1997), Further validation of the perceptions of politics scale (POPS): multiple sample investigation, Journal of Management, Vol. 23, 627-658.
Kenny, D, Kashy, D, Bolger N. (1998) Data analysis in social psychology. In D. Gilbert, S. Fisk and G. Lindzey (eds.) Handbook of social psychology vol. 1. pp. 252-259. Boston: McGraw-Hill.
Klein, J. (1996). Negativity in impression of presidential candidates revisited: The 1992 election. Personality and Social Psychology, Bulletin, 22, March, 289-296.
Konovsky, M., and Organ, D. (1996). Dispositional and contextual determinants of organizational citizenship behavior. Journal of Organizational Behavior, Vo. 17 (3) 1996, 253-266.
Laczniak, R., DeCarlo, T.E., Ramaswami, S.N., (2001). Consumers’ Responses to negative word-of-mouth communication: an attribution theory perspective, Journal of Consumer Psychology, 11(1) 57-73.
LaMastro, V. (2001). Influence of perceived institutional and faculty support on college student’s attitudes and behavioral intentions Psychological Reports, Apr, Vol. 88 Issue 2, p567, 14p.
Lambert, S. (2001). Added benefits: the link between work-life benefits and organizational citizenship behavior, Academy of Management Journal, Vol. 43, pp. 801-15.
Lederer, A., Maupin, D., Sena, M., Zhuang, Y. (2000). The technology acceptance model and the World Wide Web. Decision Support Systems, 29, 269-282.
Levinson, H. (1965). Reciprocation: The relationship between man and organization. Administrative Science Quarterly, 9, 370-390.
Moorman, R. H., Blakely, G. l., and Niehoff, B. P. (1998). Does perceived organizational support mediate the relationship between procedural justice and organizational citizenship behavior? Academy of Management Journal, 41, 331-357.
Nye, L, and Witt, L. (1993) Dimensionality and construct-validity of the perceptions of organizational politics scale (POPS), Educational and Psychological Measurement, 53, 821-829.
99
Organ, D. and Konovsky, (1989). Cognitive versus affective determinants of organizational citizenship behavior. Journal of Applied Psychology, 74: 157-164.
Randall, D, Cropanzano, L, Bormann, C. and Birjulin, A.1(999,) Organizational politics and organizational support as predictors of work attitudes, job performance, and organizational citizenship behavior, Journal of Organizational Behavior, 20, 159-174.
Rhoades, L. and Eisenberger, R. (2002). Perceived organizational support: a review of the literature. Journal of Applied Psychology, 87, 698-714.
Rhoades, L. and Eisenberger, R., Armeli, S. (2001). Commitment to the organization: the contribution of perceived organizational support. Journal of Applied Psychology, Vol. 86 No. 5, 825-836.
Richins, M.L. (1984). Word of mouth communications as negative information. In T. Kinear (Ed.), Advances in consumer research XI, pp. 697-702. Provo, UT: Association for Consumer Research.
Schnake, M. (1991). Organizational citizenship: A review proposed model, and research agenda. Human Relations, 44: 735-759.
Sheth, J. (1971). Word-of-mouth in low-risk innovations, Journal of Advertising Research, Jun, Vol. 11 Issue 3, p15-18.
Shore, L.M. and Shore, T.H. (1995). Perceived organizational support and organizational justice. R.S. Cropanzano and K.M. Kacmar (Eds.), Organizational politics, justice, and support: Managing the social climate of the workplace (pp. 149-164). Westport, CT: Quorum
Silverman, G. (2001). The Power of Word of Mouth, Direct Marketing, Sep, Vol. 64 Issue 5, p4
Skowronski, J. and Calrston, D. (1987). Social judgment and social memory: the role of cue diagnosticity in negativity, positivity, and extremity biases, Journal of personality and social psychology, 52 (4), 6889-99.
Smith, C. A., Organ, D., and Near, J. (1983). Organizational citizenship behavior: its nature and antecedents. Journal of Applied Psychology, 68: 653-663.
Stanton, J. and Coovert, M (2004). Turbulent Waters”: The intersection of information technology and human resources, Human Resources Management, Summer/Fall, Vol. 43, Nos. 2 & 3, 121 – 125.
Venkatesh, V. and Davis, F. (2000). A theoretical extension of the technology acceptance model: four longitudinal field studies, Management Science, Feb, Vol. 46 Issue 2, p186 – 204.
100
Venkatesh, V. and Morris, M. (2002). Why don’t men ever stop to ask for directions? Gender, social influence and their role in technology acceptance and usage behavior, Decision Sciences, vol. 33 issue 2, 297 - 116 view, MIS Quarterly, Vol. 24 No. 1, 2000, 115 139.
Venkatesh, V., Morris, M, Davis, G., and Davis, F. (2003). User acceptance of information technology: toward an unified view, MIS Quarterly, Vol. 27, No. 3, 425-478
Wayne, S.J., Shore, L.M., Bommer, W.H., and Tetrick, L.E. (1997). The role of fair treatment and rewards in perceptions of organizational support and leader-member exchange. Journal of Applied Psychology, 87, 590-598.
Webster, C. (1991). Influences upon consumer expectations of services. Journal of Services Marketing 5, 1. Winter. pp. 5-17.
Weinberger, M. G., Allen, C. T., and Dillon W. R. (1981). The impact of negative marketing communications: the consumers’ union/Chrysler controversy. Journal of Advertising, 10, 20-28+,
101
Appendix 1-- Script and Procedures for Website Utilization Study
Procedures (don’t read --. Things to consider/do before Experiment begins) • All participants sitting at a computer • Consent forms will be checked for all participants. If the subject does not have a
consent form, one will be completed upon entering the lab. • Place book number on booklet • Have students sign the sign-in sheet. Record booklet number on sign-in sheet next to
the name. (Can be done on the way out also)
SCRIPT (READ THIS SECTION) Welcome to the website utilization study. Please turn off all cell phones, pager, PDAs and all mobile devices at this time. During the next 45 minutes you will be asked to visit a website and to retrieve certain information. During this time we ask that you do not talk with anyone and we ask that you work independently of your neighbor. Your rights as a participant: You have a right to terminate your participation at any time. Simply quietly approach the monitor and asked to be excuses. Please understand that early termination at any time, although it is your right to do so, will cause you to forfeit any chance of credit or other incentives
• You must follow instructions to receive your incentive (credit or other) • The coordinator has the right to terminate your participation if the rules are not
followed. • Do not browse the web for any other reason but for the research experiment
o Doing so could disqualify you from the study and you will forfeit your credit • At this time ensure you are logged. • Are you logged on? • Please open 2 sessions of Internet Explorer 1 to the University home page • Open the 2nd to the webpage in the center of page 1 of your booklet.
o If treatment I (neg-WOM I book A- green) upitt1.group-research.org o If treatment II (neutral Book C- pink) pitt2.group-research.org http://pittstudy3.group-research.org
• Read top of page 1 of booklet (out-loud) The University of Pittsburgh attempts to provide services for its students. We believe that the university website is a part of this process. Read along with me on page 2 of your hand-out entitled University Website Study. Using GOOGLE IS NOT AUTHORIZED.
102
Appendix 2 -- Negative WOM Treatment
U n i v e r s i t y R e s e a r c h G r o u p W o r l d - W i d e
PITT = University of Pittsburgh User-ID User Comments PITT2002 > Pitts’ website has been up and running for a while now.
PITT1010> I visit the website regularly.
PITT1000> There is a lot of work that goes into most websites
PITT1200> I think this website SUCKS! I’ve seen much better websites
PITT1220> some websites have a lot of pictures
PITT1400> THIS WEBSITE IS A WASTE OF TIME AND MONEY
PITT1040> has this website been up long? How many people use it?
PITT2020> Which school has the best web-page?
PITT2030> Most students HATE this website
PITT2010> I DON’T LIKE THIS SITE AT ALL. It’s too static
PITT2002> The information in this site is SO-OUTDATED!
PITT1020> Websites are a good thing to have access to
PITT1050> Where are the people who work on this website? Any idea?
PITT2040> Does this website change?
PITT2050> The information on this site is OLD, OUTDATED and DUMB!
PITT2250> I’m a graduate student at Pitt. I almost didn’t attend Pitt, because when I searched for information on the website, I couldn’t find it. They just didn’t put enough information on the website to make a decision. I took weeks before someone called and answered my questions. Now that I’m a student, not much has changed. When you have finished reading the comments, return to page 1 of your experiment hand-out.
103
Appendix 3 -- Neutral WOM Treatment
U n i v e r s i t y R e s e a r c h G r o u p W o r l d - W i d e
Auburn University
Brown University
Cornell University
Columbia University
Florida State
Georgia Tech
Howard University
Indiana University
Insead
London Business School
Notre Dame
NYU
Penn State
Temple University
University of Illinois
University of Florida
University of Kansas
University of Oklahoma
University of Pittsburgh
University of Texas
University of Washington
Website Feedback: The University of Pittsburgh
User-ID PITT = University of Pittsburgh
User-ID User comments PITT2002 > Pitts’ website has been up and running for a while now.
PITT1010> I visit the website regularly.
PITT1000> There is a lot of work that goes into most websites
PITT1200> I think this website has been worked on quite a bit
PITT1220> some websites have a lot of pictures
PITT1400> THIS WEBSITE IS USED BY STUDENTS AND FACULTY
PITT1040> has this website been up long? How many people use it?
PITT2020> Which school has the best web-page?
PITT2030> Most students have seen this website
PITT2010> I've used this website a few times. How about the rest of you?
PITT2002> The information in this site has been placed here for us to use!
PITT1020> Websites are a good thing to have access to
PITT1050> Where are the people who work on this website? Any idea?
PITT2040> Does this website change?
PITT2050> The information on this site is up and running! How about other schools?
PITT2250> I’m a graduate student at Pitt. Some people search for information on the school’s website when they apply to the school. Sometimes schools put plenty of information on their sites and sometimes they don’t
When you have finished reading the comments, return to page 1 of your experiment hand-out.
1) When is/was the last home football game of the season? _________________________ 1a) Who is/was the opponent? ______________________________________________
2) When is/was the last home women’s basketball game of the season?
______________________________________________ 2b) Who is/was the opponent? ______________________________________________
II. Academics
1) In the College of Business Administration, how many sections of BUSORG 1101 are offered in the Fall term 2004? _________________________________
2) What is the last day of classes for undergraduates for the Spring term 2005? _________
III. Student body 1) How many full-time undergraduate students attend The University?______________ 2) How much is out-of-state tuition for undergraduate students?_____________________ 3) What is the male-to-female ratio of the Undergraduate Student Body? _____________
IV. Research
Dr. Laurie Kirsch is an Associate Professor at the University of Pittsburgh (Katz). In 2002 she published an article about controlling information systems development projects. She
was a lead author on the article
1) Name the journal it was published in ____________________________________
2) Name the Second Author (Last name is sufficient)__________________________
3) What university is this 2nd author from?
__________________________________
4) Dr. Detmar Straub is a leading researcher in Information Technology and is a professor in a major Business school of a state university. He conducts a variety of business information technology (IT) research. This research includes topics about website use.
a. He is a co-author of an article published for a DEC 2004 journal that is already available. This article is about trust in e-commerce article. Name article ______________________________________________________ Name the Journal _________________________________________________
STOP! DO NOT Continue UNTIL you have completed the questions above or until instructed to do so.
105
Appendix 5 – Measures
Performance expectancy Items 1-4. Venkatesh et al., (2003) Effort Expectancy Items 5 -8 Venkatesh et al., (2003)
Strongly Disagree
Neither Agree/
Disagree Strongly
Agree PE1 I find the system useful while being a student 1 2 3 4 5 6 7 PE2 Using the system enables me to accomplish
tasks more quickly as a student 1 2 3 4 5 6 7 PE3
Using this system increases my productivity 1 2 3 4 5 6 7
PE4 If I use the system I will increase my chances of performing better as a student 1 2 3 4 5 6 7
EE1 Learning to operate the system would be easy for me. 1 2 3 4
5 6 7
EE2 It would be easy for me to become skillful at using the system. 1 2 3 4 5 6 7
EE3 I would find the system easy to use 1 2 3 4 5 6 7
EE4 Learning to operate this system is easy for me 1 2 3 4 5 6 7
Perceived Institutional Support LaMastro, (2001) Eisenberger et al., (1997) Items 3 and 6 are reverse coded
Strongly Disagree
Neither Agree/
Disagree Strongly
Agree 1 The University of Pittsburgh strongly considers
my goals and values. 1 2
3
4
5 6 7 2 The University of Pittsburgh really cares about
my well-being. 1 2
3
4
5 6 7 3 The University of Pittsburgh shows very little
concern for me. 1 2
3
4
5 6 7 4 The University of Pittsburgh would forgive an
honest mistake on my part. 1 2
3
4
5 6 7 5 The University of Pittsburgh cares about my
opinions as a student 1 2
3
4
5 6 7 6 If given the opportunity, The University of
Pittsburgh would take advantage of me. 1 2
3
4
5 6 7 7 Help is available from the University of
Pittsburgh when I have a problem. 1 2
3
4
5 6 7 8 The University of Pittsburgh is willing to help
me when I need a special favor. 1 2
3
4
5 6 7
106
Appendix 5 (cont’d) Negative WOM manipulation check Consider the user reactions to The University of Pittsburgh’s website that you read earlier 4 8 Hhttp://upitt1.group-research.org)
14 The user reactions I read were very positive 1 2 3 4 5 6 7
Computer Efficacy (Compeau and Higgins, 1995) Please complete the following sentence. “I could complete most tasks using an unfamiliar software package…”
Not at all confident
Neutral
Totally Confident
1 If there was no one around to tell me what to do as I go
1
2
3
4
5
6
7
2
If I had never used a package like it before 1 2
3
4
5 6 7
3
If I had only the software manual for reference 1 2
3
4
5 6 7
4 If I had seen someone else using it before trying it out myself 1 2
3
4
5 6 7
5
If I could call someone for help if I got stuck 1 2 3 4 5 6 7
6
If someone else would help me get started 1 2 3 4 5 6 7
7 If I had a lot of time to complete the job for which the software was provided 1 2 3 4 5 6 7
8 If I had just the built-in help facility for assistance 1 2 3 4 5 6 7
9
If someone showed me how to do it first 1 2 3 4 5 6 7
10 If I had used similar packages before this one to do the same job 1 2 3 4 5 6 7
Strongly negative
Neither Positive/ Negative
Strongly Positive
12 How would you categorize those comments 1 2 3 4 5 6 7
Strongly Disagree
Neither Agree/
Disagree Strongly
Agree 13 The user reactions I read were very negative 1 2 3 4 5 6 7