Introduction: 22@ as a necessary condition to increase worldwide competitiveness through the size of the supply and consolidated clusters At the end of 2000, a major redevelopment operation started with the definitive approval of the Modification of the Metropolitan General Plan to redevelop industrial areas of Poblenou, the 22@ Barcelona district of activities, which covers an area equivalent to 113 blocks of Cerdà’s Eixample and has a potential of close to 4 million m 2 of gross floor space (GFS). This operation was to be carried out in a tradi- tional industrial area that was occupied by around 1.4 mil- lion m 2 of built floor space in varying states of physical and functional obsolescence and with a manufacturing zoning designation (22a). In general, the existing constructions underutilized a very central area that is just 15 minutes from the centre of Barcelona. Over 4,600 dwellings were also located in the 198-ha area. These dwellings, which were not fully legal, were kept in the new plan. The 22@ development increases the hous- ing stock by around 4,000 dwellings for affordable housing and on ceded land, with a GFS equivalent to 10% of the total development (0.3 FAR - floor space area ratio), which will be transferred to the City Council from the develop- ment by law and as its share in the planning gains. Thus, a potential 3.2 million m 2 GFS for economic activ- ities was put on the market for building high-density offices (3 FAR in the blocks 1 ), as corresponds to a central business district. This is a necessary condition for competing in the global real estate market and attracting new economic activ- ity to the central city, which, without the critical mass of 22@ and the opportunity to create clusters, would have had to mainly locate activities in the outskirts of the metropolitan area in a more dispersed way. This highlights the role of Barcelona as the central server in a system of metropolitan towns and cities, and the focus of directional activities. The block is the basic unit for planning and for manag- ing private initiatives, if there is agreement among over 50% of the land owners. This unit facilitates the distribution of profits and charges resulting from the development plan, which is in proportion with the land ownership by existing companies. It also provides sufficient flexibility to adapt the supply to the needs of the real estate market. The plan that the City Council began to implement in four predetermined areas and the move of activities to the district are additional incentives for the development of private initiative. From an economic perspective, the plot ratio incentive (up to 2.7 FAR for @ activities in the new economy and 2.2 FAR for other service sector uses, such as hotels, excluding manufacturing activity and storage) generates planning gains to cover compensation for relocations (around €600 per m 2 of existing floor space), demolitions, compensation for existing buildings (around €200 per m 2 of existing floor space), the costs of city and internal infra- The impact of 22@ on urban development and real estate: Barcelona’s future central business district Sara Mur and Joaquim Clusa Consulting economists, www.murclusa.cat Revista Econòmica de Catalunya 27 (*) The authors are grateful for the interest of the BSAV. The map was includ- ed thanks to Albert Viladomiu Mangrané, Director of Urban Planning of the BSAV, and it was drawn up by: [email protected]1. The FAR (floor space area ratio) of 3 m 2 of gross floor space/m 2 of land is equivalent to a building area of around 36,000 m 2 of floor space above grade in a block of the Eixample (12,000 m 2 of land). This is almost equiv- alent, for example, to building a Mapfre Tower (approximately 42,000 m 2 of gross floor space above grade) or an average-sized Corte Inglés of 7 floors above grade of around 45,000 m 2 of gross floor space) and explains the type of building in the blocks with new constructions.
Transcript
Introduction: 22@ as a necessary condition to
increase worldwide competitiveness through the size
of the supply and consolidated clusters
At the end of 2000, a major redevelopment operation
started with the definitive approval of the Modification of
the Metropolitan General Plan to redevelop industrial areas
of Poblenou, the 22@ Barcelona district of activities, which
covers an area equivalent to 113 blocks of Cerdà’s Eixample
and has a potential of close to 4 million m2 of gross floor
space (GFS). This operation was to be carried out in a tradi-
tional industrial area that was occupied by around 1.4 mil-
lion m2 of built floor space in varying states of physical and
functional obsolescence and with a manufacturing zoning
designation (22a). In general, the existing constructions
underutilized a very central area that is just 15 minutes from
the centre of Barcelona.
Over 4,600 dwellings were also located in the 198-ha
area. These dwellings, which were not fully legal, were kept
in the new plan. The 22@ development increases the hous-
ing stock by around 4,000 dwellings for affordable housing
and on ceded land, with a GFS equivalent to 10% of the
total development (0.3 FAR - floor space area ratio), which
will be transferred to the City Council from the develop-
ment by law and as its share in the planning gains.
Thus, a potential 3.2 million m2 GFS for economic activ-
ities was put on the market for building high-density offices
(3 FAR in the blocks1), as corresponds to a central business
district. This is a necessary condition for competing in the
global real estate market and attracting new economic activ-
ity to the central city, which, without the critical mass of 22@
and the opportunity to create clusters, would have had to
mainly locate activities in the outskirts of the metropolitan
area in a more dispersed way. This highlights the role of
Barcelona as the central server in a system of metropolitan
towns and cities, and the focus of directional activities.
The block is the basic unit for planning and for manag-
ing private initiatives, if there is agreement among over 50%
of the land owners. This unit facilitates the distribution of
profits and charges resulting from the development plan,
which is in proportion with the land ownership by existing
companies. It also provides sufficient flexibility to adapt the
supply to the needs of the real estate market. The plan that
the City Council began to implement in four predetermined
areas and the move of activities to the district are additional
incentives for the development of private initiative.
From an economic perspective, the plot ratio incentive
(up to 2.7 FAR for @ activities in the new economy and
2.2 FAR for other service sector uses, such as hotels,
excluding manufacturing activity and storage) generates
planning gains to cover compensation for relocations
(around €600 per m2 of existing floor space), demolitions,
compensation for existing buildings (around €200 per m2
of existing floor space), the costs of city and internal infra-
The impact of 22@ on urban developmentand real estate: Barcelona’s future centralbusiness district
Sara Mur and Joaquim ClusaConsulting economists, www.murclusa.cat
Revista Econòmica de Catalunya27
(*) The authors are grateful for the interest of the BSAV. The map was includ-ed thanks to Albert Viladomiu Mangrané, Director of Urban Planning ofthe BSAV, and it was drawn up by: [email protected]
1. The FAR (floor space area ratio) of 3 m2 of gross floor space/m2 of land isequivalent to a building area of around 36,000 m2 of floor space above
grade in a block of the Eixample (12,000 m2 of land). This is almost equiv-alent, for example, to building a Mapfre Tower (approximately 42,000 m2
of gross floor space above grade) or an average-sized Corte Inglés of 7floors above grade of around 45,000 m2 of gross floor space) and explainsthe type of building in the blocks with new constructions.
sara
Resaltado
GFS
structure and the proportional contribution to financing
the redevelopment of the entire area, according to the
specifications of the Special Infrastructure Plan (PEI) and
which accounts for less than €80 per m2 of floor space
above grade that the corresponding tax ordinance deter-
mines per unit of land area.
The concept of PEI is also an innovation in the man-
agement and private financing of the redevelopment of
the entire area. It determines a high standard of quality
for the electricity supply, telecommunications and waste
collection. Thus, the planning gains also finance most of
the infrastructure of the city, with only a minimum con-
tribution of general investment from the City Council’s
current revenue. This funding mechanism was subse-
quently applied to the infrastructure of La Marina del Prat
Vermell and is planned for La Verneda. It could be applied
in the implementation of urban development plans in the
entire municipality, to finance the city infrastructure that
cannot be assigned to specific sectors.
Naturally, the blocks that have already been trans-
formed or those that are more likely to be transformed in
the future are those that are less dense and close to the
average plot ratio for the previous use (around 1 FAR), as
less compensation needs to be paid. Therefore, the time it
takes to infill the area will depend on the market condi-
tions at each moment to pay the compensation, so the
densest blocks are likely to take longer to develop.
The development of the blocks could be delayed if dis-
agreements arise between landowners that are not part of
the initial majority initiative. Such disagreements are gen-
erally due to compensation, as the financing of the new
development could be covered by property developers
who buy the land from the current landowners. Although
the compensation committees have legal instruments for
paying compensation to the minority owner, this does
not mean that arguments will not arise that could delay
the development of the whole block or sector.
Development in blocks also helps to surpass the min-
imum standards of general urban planning regulations, as
20% of the block or area is set aside for open spaces and
10% for all kinds of facilities, including newly created
ones that are of a 22@ nature.
Free land transfers are neutral in relation to the sale
price of the real estate product, as the residual unit value
of the plots is the derived demand based on the the sale
price of the final product. The business costs, the profit
from the promotion, and the absolute price of plots only
depends on the plot ratio attributed in the plans and the
unit price.
The dimension of the 22@ district can be compared to
La Défense in Paris2, which is advertised as the biggest
international business district in Europe and is centrally
situated3. In an area of 564 ha4, a total of 3.4 million m2 of
offices, 0.95 M m2 of commercial floor space and 0.95 M
m2 of dwellings have been constructed in this area since
the 1960s. There is a total of 4.4 M m2 GFS for economic
activity, 185,000 jobs and 20,000 residents. Today, the
headquarters of 12 of the 50 biggest multinational com-
panies in the world are located in the Île-de-France area,
with 50 million m2 of offices.
The 3.2 M m2 GFS of 22@ represents 72% of the floor
space for economic activity in La Défense and could
house 133,000 jobs in the future using an equivalent stan-
dard (24 m2 GFS per job). Although the total area will
only be 35% of that of La Défense and the average plot
ratio will be around double, the comparison is appropri-
ate as it highlights the scope and development opportu-
nities of 22@. The dimensions of office space in towns in
the Barcelona metropolitan area, with 12.2 M m2(5) (of
which 7.3 M m2 GFS corresponds to the municipality of
Barcelona), are smaller than the 50 million m2 in Île-de-
France stated in information on La Défense, given the
differences in the level of rent, the degree of tertiarization
of the economy, and the effect of its capital status.
All the main urban agglomerations in the world aim
to expand their central business districts in locations as
close to the centre as possible. This is also the case of
Madrid, which in 2009 initially approved a zoning plan
28 Revista Econòmica de Catalunya
2. http://www.ladefense-seine-arche.fr/les-lieux-du-projet/la-defense.html.Document ‘Enjoy La Défense Seine Arche’. May 2011.
3. They advertise that the district is 10 minutes from the centre of Paris and30 minutes from the airports in public transport.
4. With 31 ha of open area and 11 ha of green spaces.5. Information from the Land Registry Office, Technical Programming Unit,
July 2009.
for the extension of La Castellana under the slogan ‘The
economic heart of Madrid’6. The 312-ha area has a poten-
tial 3.05 million m2 GFS, 45% of which would be for hous-
ing and 55% for economic activity (2.4 M m2 GFS). The
Madrid model differs from that of Paris and Barcelona
basically in the proportions of housing and economic
activity, which are almost equivalent. However, this is an
issue that could be considered in future plans for
Barcelona or in the modification of current plans.
Consequently, 22@ is a plan with a vision for the
future. It was drawn up to make more floor space avail-
able for the offices the market required, and to encour-
age the location of the advanced technology activities
that the new economy needed and continues to need. It
has dimensions, location, quality of city infrastructure
and innovative systems of financing and management
that are comparable to the best initiatives carried out
worldwide.
The recession that began in the second half of 2007
has substantially changed the rate of applications for 22@
building permits. The rate of annual approval of permits
for the 2008-2010 period (133,105 m2 GFS per year) was
23-27% lower than that in 2002-2007 (122,933 m2 GFS
per year if 7 years are considered and 143,422 m2 GFS
from 2002 to 2003). The duration of the low demand will
naturally affect the absorption rate, both in 22@ and in
the other operations in Barcelona that are currently sup-
plied or in the planning and development stages.
Given that construction in 22@ has taken place in four
and a half years of expansion and three and a half years of
contraction, we could consider that the medium-term
demand is in the order of 100,000 m2 GFS per year in
approved building permits and around 4,200 new jobs per
year, using the average standard of La Défense in Paris.
In this article, we deal successively with the following
topics: the forecasts in the initial economic and financial
study in relation to the current results (Section 1); the
supply in 22@ in the context of competing operations in
Barcelona ‘river to river’ (Section 2); the situation of com-
petitive prices and the parameters and opinions in reports
by real estate agents, with reference to some internation-
al prices (Section 3); reference to the economic feasibility
of the development, according to the influence of the dif-
ferent components of the prices and particularly to the
compensation and costs of the city infrastructure (Section
4); the potential building area in 22@ up to 2020 (Section
5); the impact of 22@ on the rest of the construction
dynamics in Barcelona, as reflected by the approved
building permits above and below grade (Section 6).
The concluding chapter (Section 7) refers to the
dimension that will be attained by 22@ and the opera-
tions around the La Sagrera station when completed, in
the context of floor space for tertiary activities in the var-
ious districts of Barcelona and according to the land reg-
istry records. This section supports the hypothesis that the
floor space for economic activity, and certainly the occu-
pation, will surpass that of the districts of Ciutat Vella and
the Eixample, which form the old business centre of
Barcelona.
Forecasts and economic hypotheses in the
Modified Metropolitan General Plan (MPGM):
20 years, absorption of 135,000 m2 GFS per year
and economic feasibility of compensation
‘The main aim of this Economic and Financial Study is
to ensure that the forecasts in the development plan are
met, and to demonstrate that the distribution of charges
and profits is feasible, meets the provisions established in
planning regulations, and is in line with the situation in
the real estate market. In particular, the aim is to highlight
that the development of the “zones”, at the current and
foreseeable value of the real estate market, and public
investment and that from other sources can adequately
finance the “systems” (infrastructure, compensations, city
infrastructure and facilities for the community) required
for the urban development.
This document refers particularly to the following
points:
1. Dimension of the new supply of floor space for eco-
nomic activities resulting from the development plan.
Revista Econòmica de Catalunya29
6. http://www.madrid.es/portales/munimadrid/es
2. Demand for floor space for economic activities in
Barcelona and Poblenou.
3. Feasibility of the new urban development
charges, to be financed with the increase in plot ratio.
4. Assessment of the feasibility in real estate terms
of the transformation operations (special plans).’ (From
the amended text for definitive approval of the
Modification of the Metropolitan General Plan,
September 2000, pages 1 and 3).
With respect to the first aspect, the study’s summa-
ry table gives the following figures for potential: ‘If we
add the 509,976 m2 GFS of existing housing and local
and @ facilities, the total potential is just over 3,500,000
m2 GFS. The fulfilment of the potential is foreseen in 20
years in 2019, at an average rate of 133,000 m2 of floor
space for economic activities per year and the construc-
tion of around 4,000 affordable dwellings.’
The following statement was made on the job
potential: ‘The new urban planning also provides the
opportunity to increase the number of jobs located in
Poblenou, which is currently at around 31,000 people,
according to the register for 1996. With an optimistic
forecast of a density of 25 m2 of floor space per job,
the new production district will house over 91,000
jobs.’7
The following should be highlighted: ‘...given that
the annual growth in GDP in these years has been
2.5% on average; a rate that we can reasonably expect
to maintain in the next ten years and at least enables
us to forecast various economic growth scenarios.’
On the assessment of the supply for economic activ-
ity in Barcelona in 1999, the study stated: ‘For these rea-
sons, Poblenou’s share in the dynamics of the munici-
pality is between a minimum of 40% and a maximum of
60%. If we apply these percentages to the trend of
387,854 m2 GFS per year for all types of tertiary activities,
the potential demand in Poblenou is between 155,034 m2
and 232,550 m2 of new floor space per year, with an aver-
age forecast of 194,000 m2 of new floor space per year.
[...] Barcelona currently has a stock of 4 million m2 of
offices, which is 56% of the stock of Madrid and 16%
that of London. [...] The City Council must ensure the
transformation of Poblenou regardless of the economic
and real estate cycle. [...] The vision must be for 15-20
years. [...] Currently, 35-45% of the stock of offices is
considered obsolete and does not meet the users’
requirements. [...] The estimation of the total absorption
of offices of an “international level” in Barcelona and the
metropolitan area is estimated [...]to be 197,000 m2 per
year. The share of Poblenou in the most optimistic fore-
cast would be situated, according to this study, at 69% of
the total absorption in the metropolitan area, that is,
135,930 m2 per year. [...] The operation in Poblenou is
presented as a unique opportunity to re-centralize a
Metropolitan process that is excessively decentralised.’
On the economic feasibility of private operations,
the document stated that: ‘An operation shall be prof-
itable when the difference between the value of the
resulting plots that have to be developed and the total
costs of developing them is positive and this difference
30 Revista Econòmica de Catalunya
7. More recently, the figure of 150,000 potential jobs has been estimated by22@ (2009), ‘22@Barcelona project. A social, urban and economic urbanrenewal’, Mimeo, p. 24.
Plan of stages
Development of a new potential floor space for production activities
Encumbrances = <38,000 pts/ potential m2 of gross floor space 901,626 180,324 360,651 180,325 180,326
Encumbrances = > 38,000 pts/potential m2 of gross floor space 607,395 91,109 121,479 212,588 182,219
TOTAL 2,659,654 616,884 942,464 738,164 362,545
100% 23% 35% 28% 14%
reaches a percentage of the total investment that is
equal to or higher than the ordinary returns in the real
estate sector.’
The justification of the economic feasibility of private
operations was supported by detailed accounts that were
submitted for three types of blocks of different densities
and with the final conclusion that ‘...we obtained resid-
ual values of land at the start of the operation [...] that in
all cases were above the €601/m2 of land (€100,000/m2 of
land) that correspond to a plot ratio of 1 FAR before the
expectations of reclassification’.
The considerable innovation in the redevelopment
of the sector and its financing was described as follows:
‘Barcelona City Council shall draw up a special infra-
structure plan to define and specify the standard of the
aforementioned urban development services and the
characteristics of other required infrastructures and
services, both those planned for the public domain and
those planned for private land’. In accordance with the
suppositions of city infrastructure drawn from the
progress in the PEI, the economic feasibility study
(EEF) of the MPGM estimated that the unit cost of the
investment required in the area of the MPGM is
€180/m2 of road (30,000 pta/m2) and the total invest-
ment is €119 M (19.780 billion pta). The planned
financing is 70% from the owners of the land under
transformation (1,269,409 m2 of land counted) and 30%
from the public services providers. The resulting cost to
landowners is €24/m2 GFS in areas with a plot ratio of
2.2 FAR and €30/m2 GFS in those of 2.7 FAR’.
After 10 years of urban development and economic
management that is in line with the forecasts both in
terms of the rate of transformation, demand, city infra-
structure and public-private financing in a cycle of
expansion, the development of the innovative 22@ dis-
trict since 2000 should be adapted to the recession,
which increases the length of time needed to attain the
proposed objectives.
Concurrent and competitive operations:
12.4 M m2 GFS, a surplus of 207,500 jobs and a short-
fall of 198,600 dwellings
Barcelona started this century with a limited supply of
offices. However, this changed with the approval of the
22@ project in 2000, with a total floor space of
approximately 4 million m2, of which around 3.2 M m2
GFS are for economic activity. The project represented a
major quantitative and qualitative change in supply that
put Barcelona in a competitive position in the global
market.
This supply for economic activity competes today with
the operations in the Plaça d’Europa in Hospitalet
(0.2 M m2 GFS), the Forum (0.6 M m2 GFS) and Fira de
Barcelona (0.2 M m2 GFS), with a potential of around
26,000 jobs8.
In the future, the supply in 22@ will have to compete
with that of La Marina del Prat Vermell (0.3 M m2 GFS), La
Verneda (0.3 M m2 GFS), Biopol (0.3 M m2 GFS), BZ
Barcelona Innovation Zone (1 M m2 GFS)9, with a potential
for approximately 52,700 jobs, and particularly the supply
around the future central station of La Sagrera-Prim
(0.5 M m2 GFS), with an estimated potential for 18,400 jobs,
according to the information in the attached tables10.
The potential floor space above grade in 22@ has
been updated with documents and information provid-
ed by 22@ Barcelona S.A.U. The below grade figures
have been kept as in the MPGM.
Given its significance, we should also refer to the poten-
tial supply of the operation in the Centre Direccional de
Cerdanyola - Parc de l’Alba, whose plans were approved in
2005. This supply could be considered in a complementary
market to the operations in the city centre. It will meet a dif-
ferent demand for economic activity in terms of the charac-
teristics, location and price. It covers an area of 340 ha and
has a potential floor space of 1.9 million m2, of which
1.5 M m2 GFS are for economic activity.
Revista Econòmica de Catalunya31
8. The number of potential jobs is calculated by considering the same plans withapproximate standards of 20 m2 of gross floor space per job in offices, 40 m2
of gross floor space/job in retail, 60 m2 of gross floor space/job in facilities,60-100 m2 of gross floor space/job in logistic activities and industries and2,500 m2 of gross floor space/job in car parks.
9. The incorporation of the major suppply from the plans for El Prat de Llobregat
(La Seda, Enkalene, etc.), Gavà, Viladecans (DeltaBCN Aerospace and MobilityPark, etc.), Sant Boi de Llobregat, Badalona and Santa Coloma de Gramanetthat should be taken into account are beyond the scope of this article.
10. The city infrastructure operations in La Marina and La Verneda areplanned in three phases. In the BZ Barcelona Innovation Zone, a firstphase of city infrastructure of 30 ha is already planned.
Total 931.6 4,277,097 7,120,897 11,397,995 1,226,710 12,624,705 2,697,339
(22@/Total) 21% 9% 44% 31% 32% 31% 35%
(22@ + La Sagrera and surroundings)/Total 32% 32% 51% 44% 53% 45% 53%
(22@ + La Sagrera and surroundings)/Total BCN 36% 34% 61% 50% 60% 51% 62%
Source: drawn up by authors using the information available in planning documents and reports.Note: (P.D.A.: pending definitive approval; P.P.A.: pending provisional approval)
Major urban operations 2000-2030: 1,182 ha - 11.4 M m2 GFS (excluding facilities)
Source: base plan provided by Barcelona Sagrera Alta Velocitat. Data compiled by authors.
To date, urban infrastructure has been carried out, as
well as the construction of a synchrotron. As a result, the
Barcelona metropolitan area has a quality supply for dif-
ferent types of high-tech industrial activities in an area of
approximately 600 km2, which is equivalent to the area of
the municipality of Madrid.
In the case of 22@, the average standard in the eco-
nomic feasibility study for the MPGM was 25 m2 GFS per
job in the district, with an estimated total of 91,000 jobs.
However, the number of potential jobs has been updated to
an estimated potential figure of 150,000 (22@, op. cit. p. 24).
The major operations considered, together with other
operations in the 2011 housing programme11, have a total
potential of 11.4 M m2 GFS, 7.1 M m2 GFS for economic
activity, and include a considerable potential supply of new
dwellings (56,000 units), with a high percentage reserved
for affordable housing. Some of these operations are high-
ly self-sufficient in the ratio of the active population/poten-
tial jobs, as is the case of La Marina del Prat Vermell and La
Verneda12.
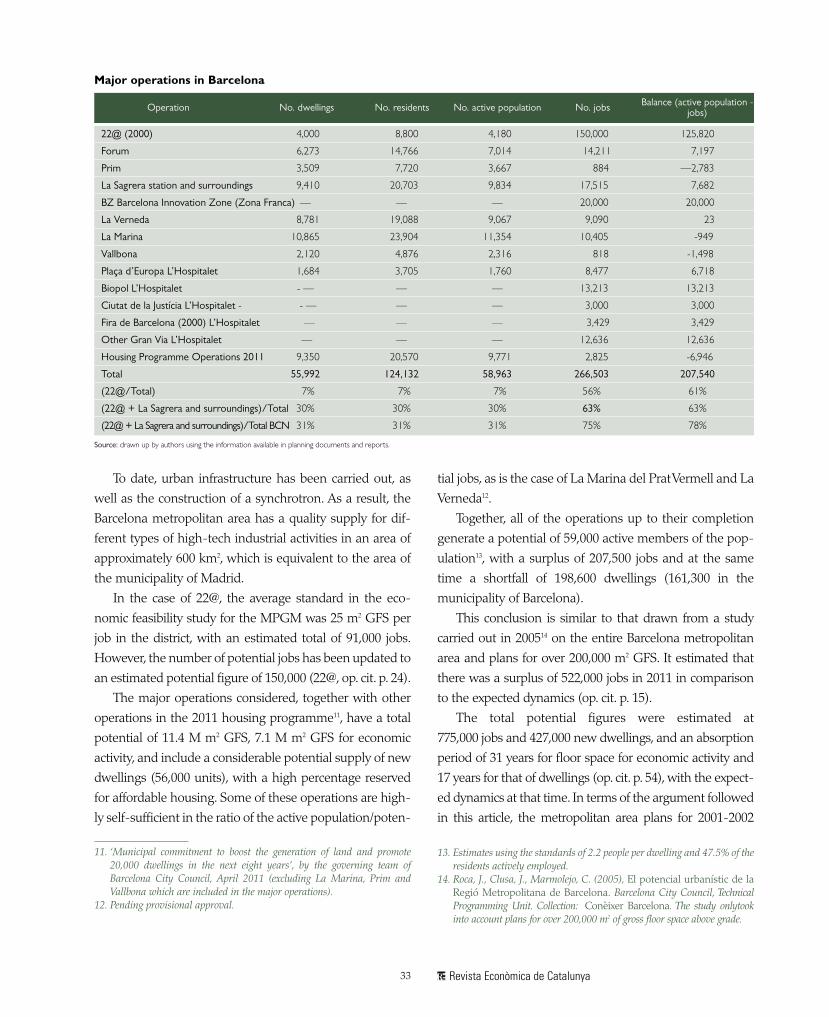
Together, all of the operations up to their completion
generate a potential of 59,000 active members of the pop-
ulation13, with a surplus of 207,500 jobs and at the same
time a shortfall of 198,600 dwellings (161,300 in the
municipality of Barcelona).
This conclusion is similar to that drawn from a study
carried out in 200514 on the entire Barcelona metropolitan
area and plans for over 200,000 m2 GFS. It estimated that
there was a surplus of 522,000 jobs in 2011 in comparison
to the expected dynamics (op. cit. p. 15).
The total potential figures were estimated at
775,000 jobs and 427,000 new dwellings, and an absorption
period of 31 years for floor space for economic activity and
17 years for that of dwellings (op. cit. p. 54), with the expect-
ed dynamics at that time. In terms of the argument followed
in this article, the metropolitan area plans for 2001-2002
Revista Econòmica de Catalunya33
Major operations in Barcelona
No. dwellings No. residents No. active population Balance (active population -jobs)No. jobsOperation
22@ (2000) 4,000 8,800 4,180 150,000 125,820
Forum 6,273 14,766 7,014 14,211 7,197
Prim 3,509 7,720 3,667 884 —2,783
La Sagrera station and surroundings 9,410 20,703 9,834 17,515 7,682
BZ Barcelona Innovation Zone (Zona Franca) — — — 20,000 20,000
La Verneda 8,781 19,088 9,067 9,090 23
La Marina 10,865 23,904 11,354 10,405 -949
Vallbona 2,120 4,876 2,316 818 -1,498
Plaça d’Europa L’Hospitalet 1,684 3,705 1,760 8,477 6,718
Biopol L’Hospitalet - — — — 13,213 13,213
Ciutat de la Justícia L’Hospitalet - - — — — 3,000 3,000
Fira de Barcelona (2000) L’Hospitalet — — — 3,429 3,429
(22@ + La Sagrera and surroundings)/Total 30% 30% 30% 63% 63%
(22@ + La Sagrera and surroundings)/Total BCN 31% 31% 31% 75% 78%
Source: drawn up by authors using the information available in planning documents and reports.
11. ‘Municipal commitment to boost the generation of land and promote20,000 dwellings in the next eight years’, by the governing team ofBarcelona City Council, April 2011 (excluding La Marina, Prim andVallbona which are included in the major operations).
12. Pending provisional approval.
13. Estimates using the standards of 2.2 people per dwelling and 47.5% of theresidents actively employed.
14. Roca, J., Clusa, J., Marmolejo, C. (2005), El potencial urbanístic de laRegió Metropolitana de Barcelona. Barcelona City Council, TechnicalProgramming Unit. Collection: Conèixer Barcelona. The study onlytookinto account plans for over 200,000 m2 of gross floor space above grade.
would have a surplus of 329,000 jobs or, alternatively, a
potential shortfall of 315,000 dwellings.
Therefore, the supply of new floor space for economic
activity in 22@ (3.2 M m2 GFS), together with the supply in
La Sagrera-Prim (0.5 M m2), comprises 51% of the supply
of land for economic activities ‘from river to river’ and
would ensure a wide supply for over 20 years according to
the past dynamics, which have been temporarily disrupted
by the recession. We cannot guarantee the same situation
with respect to housing needs, whose forecasts will defi-
nitely have to be reconsidered in the current economic sit-
uation and the periods required for coverage and comple-
tion will have to be lengthened.
Today, the operations of the Forum, Ciutat de la Justícia,
Fira de Barcelona and Plaça d’Europa are practically com-
pleted, whilst other operations that have been approved
more recently, such as La Marina (2005), have not been
sufficiently developed.
The potential available in 22@ and La Sagrera-Prim will
constitute in coming years the main supply for economic
activity (around 2.1 M m2 GFS and around 96,600 jobs), but
it will have to compete with the supply in the rest of the cen-
tral city, as it will account for approximately 47% of the total
for the major operations considered.
22@ in the market of offices and hotels according
to real estate reports: new business district
with economical prices
Offices are the most common type of building in 22@.
They represent 51% of the floor space above grade in build-
ing permits approved from 2000 to 2010 (487,637 m2 GFS
out of a total of 959,846 m2 GFS). The next biggest use is
that of affordable housing, which amounts to 18% of the
approved floor space above grade. This is followed by
hotels, with 13% of the approved floor space above grade.
The area for car parks (441,753 m2 GFS) increases floor
space above grade associated with uses above grade by
46%. Therefore, the three main real estate markets for 22@
are offices, affordable housing and hotels.
The Forcadell report indicates that the average office
rent in what are known as the ‘new business centres’
(22@, Plaça d’Europa in Hospitalet, Plaça Cerdà-Passeig
de la Zona Franca) stood at €13.90 /m2 GFS at the end of
2010 and maximum rents of €18.95 /m2 GFS, although the
closing prices (or ‘expert opinion’ prices, in the words of the
report) are estimated at €7 and €13 /m2 GFS. The ‘new
business centres’ have prices lower than those in the prime
zones, the business district and the central zone, but above
the price of offices in the outskirts of the city.
Rents in 22@ are 22% below those in the prime zone at
€17.56/m2/month on average and a closing price of
between €15 and €19/m2/month. It is notable that the clos-
ing prices are more similar to the asking prices than in
other zones.
According to the same report, the sale prices in 22@
are €3,325/m2 floor space (with closing prices of €2,200-
2,700/m2 GFS) and are 37% lower than in the prime zone
(€5,250/m2 GFS).
The rates of return (yields) that reflect the risk of invest-
ing in each location of the city for new business centres and
for the outskirts stand at between 7 and 8% per year, com-
pared to 5.5-6.5% in the prime zones. In addition, the avail-
ability rates are higher the further from the centre, compared
to the average of 13% for all of Barcelona, which is far from
the 7% found in 2007.
The report states that the drop in prices compared to
previous years is greater the further from the centre,
although ‘...in 2010 most of the operations were carried out
in decentralized zones, unlike in 2009, which was dominat-
ed by the prime zone and the business district’.
According to the Forcadell report, office rental in
Barcelona amounted to 3.4 million m2 from 2000 to 2010,
with an average of 305,500 m2 GFS per year. The year with
the lowest office rental was 2001 (212,000 m2, as shown in
the first graph), whilst with the recession already underway,
a total of 225,300 m2 were rented in 2009 and 239,100 m2 in
2010. The average for the 8 years of expansion is 320,000 m2
and that of the 3 years of recession is 268,000 m2, with an
average for the 11-year period of 306,000 m2.
The Savills report of 2010 states that the net absorp-
tion of offices in 2010 was 274,000 m2 GFS, which coin-
cides almost exactly with the rental figures in the
Forcadell report. Although the rental volume cannot be
directly related with the number of building permits
34 Revista Econòmica de Catalunya
approved, the share for 22@ can be estimated by relat-
ing the area for which permits were granted with the
area rented in the period of expansion (122,933 m2 GFS,
compared to the aforementioned 320,000 m2 GFS). This
gives a share of 39% of the market of offices built exclu-
sively in Barcelona and L’Hospitalet.
In this context, the 22@ district is in an intermediate
position in terms of its attractiveness in Barcelona’s real
estate market , despite the competitive prices that it
offers. The reports by estate agents for offices show that
there is a good rate of office rental in Plaça d’Euro pa and
that this can be attributed to the good public transport
Prime rentals at Dec. 2010 prices €/m2 of floor space per month
Prime rentals BCN nominal rents €/m2 of floor space per month
‘Prime rentals’ in Barcelona offices in 3/m2 of gross floor space/month 1985-2010. Nominal rents every year and constant rents at December 2010 prices
Source: Savills 2011 (nominal prices) and compiled by authors for the conversion to constant prices.
sara
Resaltado
GFS
sara
Resaltado
GFS
connections with the rest of the city, and particularly with
the airport.
The evolution of office prices in relation to economic
cycles can be clearly illustrated using statistics and graphs
from the Savills report15 for the second half of 2011, from a
26-year perspective beginning in 1984, which was the start
of what was known as the bubble of 1986-1991, as shown
in the enclosed graph.
The recession of 1991 began with very high rents that
were recovered, in nominal values, in 2008. However, the
real values have still not surpassed the 1991 levels. Only
57% of the constant rentals of 1991 have been obtained,
which illustrates the dimension of the 1986-1991 bubble,
particularly in the market of offices16, and the sensitivity of
this market to economic cycles that do not always coin-
cide with the cycle of housing prices.
In terms of hotels as a second real estate open market
in 22@, the 2009 report on hotel real estate by CB Richard
Ellis is notable. In reference to 2008, the report states:
...there is a considerable increase in new projects in the
Sant Martí district, specifically in the 22@ zone and its
area of influence. In practice, this relocation highlights
the sector’s definitive commitment to this zone of busi-
ness development. Gradually, the major chains have
begun to set up this area, which is starting to become one
of the city’s important business enclaves. Forty per cent
of new projects are located in this zone, which also ben-
efits from greater land availability and from the fact
that the prices are noticeably lower that in more consol-
idated and central zones...
This preference for locating hotels in 22@, even though
they cannot benefit from the maximum plot ratio for @
activities of 2.7 FAR, can be explained, regardless of the
capacity to purchase plots, by the fact that the sector is
growing and the @ part of the building area (0.5 FAR) can
be transferred to the rest of the development.
As a reference, office rents in Paris, according to informa-
tion provided by the promotion of La Défense, are as follows:
- Prime rents = €750 per m2 GFS and year
(€63 /m2 GFS/month)
- La Défense = €515 per m2 GFS and year
(€43 /m2 GFS/month)
- Seine Arche = €330 per m2 GFS and year
(€28 /m2 GFS/month)
Rents in La Défense are 32% lower than the prime
rents in the centre of Paris, whilst the figure of €14 per m2
of gross floor space and month in 22@ is 28% lower than
rents for the best locations in the centre of Barcelona. This
indicates comparable positions within the city with
respect to the central business district (CBD), as would be
expected with similar public transport distances.
If we compare the prime rents in Barcelona for the sec-
ond half of 2011 (€19.50/m2 GFS/month), we find that
Paris prices are 3.2 times higher than those of Barcelona.
Rents in La Défense are 3.1 times those of 22@, whilst
those of the Seine Arche, which is in a less central posi-
tion, are only two times higher. However, in central posi-
tions of 22@ the prime rents of Barcelona can be achieved,
which indicates the value and real estate interest in this
zone, and the different rents within the district.
Although low prices can be considered a positive factor
in terms of competitiveness and attraction, the stable
prices of real estate products reflect companies’ interest in
being located in a specific city or place within a city, and at
the same time reflects the payment capacity of the compa-
nies that move there. Therefore, comparatively high real
estate prices that are maintained by stable demand are
good news for a city’s economy.
Majority private financing for quality re-urbanisation:
economic feasibility of the development of blocks
with affordable contributions
The construction and renovation of a city requires pub-
lic and private investment in city infrastructure and con-
struction, financed by the planning gains for building
determined in the urban development plan in use by the
territory’s governing authorities. The recovery of planning
gains finances the infrastructure. The trend is for each
36 Revista Econòmica de Catalunya
15. The average rents in the ‘prime’ zone in the Forcadell report (€17.56 ) onlydiffer by approximately 10% from those in the Savills report.
16. The Mapfre Tower was not fully occupied until 2002, although its con-struction was completed in 1992.
development to cover all of the direct and indirect costs
incurred by the city, and to provide reserves for affordable
housing. Here we present the two aspects of financing,
analysed from the perspective of the public sector (through
the Special Infrastructure Plan (PEI)) and private promo-
tion (through the example of an economic feasibility study
(EEF) in the urban planning stage).
The Special Infrastructure Plan (PEI) for Poblenou-
22@, which is designed as an urban development instru-
ment that covers the entire area of the MPGM, also
includes the connecting infrastructure required for the
area to operate and assesses other actions that ‘...are still
not located within the area of the Plan and are not works
carried out to connect it, but are considered important for
the development of the zone’ (EEF of the PEI, 2000).
The total investment that was initially expected was 329
million euros,17 of which €210 M (64%) corresponds to
investments in the area of 22@, €10 M (3%) to connection
areas and €109 M (33%) to areas outside of the Plan. By type
of activity, the main investment is the €154 M in mobility
(47% of the entire investment), which is located mainly out-
side of the area of the Plan (approximately 70%) and
involves two important actions: the Avinguda Diagonal
tram and the Front Marítim tram. The two next largest sys-
tems in terms of investment are: energy (24% of the total)
and public space (15% of the total), followed by telecom-
munications (7%), cleaning and waste treatment (4%) and
the water cycle (3%).
The financing of investment in 22@ and connecting
infrastructure, which in total is estimated to amount to
Revista Econòmica de Catalunya37
Distribution of investment in the PEI by areas (€M)
Total 22@area; 210.3
Connectinginfrastructure; 10.3
Outside of Plan's scope; 108.7
Investment in the PEI by type of actions (€M)
Total energy 77.9
Total telecommu-nications21.7
Total water cycle 10.1
Cleaning and waste treatment 14.7
Public space 50.8
Total mobility 154.0
Investment in PEI by type of actions (%)
Total energy 24%
Total telecomu-nicacions 7%
Total water cycle 3%
Cleaning and waste treatment 4%
Public space 15%
Total mobility 47%
Financing of the investment in 22@ and connections
Development 8%
City Council8%
Other 14%
Operators 32%
Urban planning encumbrances 38%
17. The updated amount is €376.8 M. The use of information from the docu-ment approved in 2000 is justified as it includes details of financing bythe public sector, companies and property developers.
18. In 2006, the transfer of 10% of the development to the City Council wasnot free of encumbrances; this was a precept of State Land Law 8/2007.
€221 M, is expected to be met as follows: 38% from city
infrastructure, 32% from service operators, 8% directly
from municipal budgets, 8% from property developers (in
addition to the charges for city infrastructure) and the
remaining 14% from the other financiers who are involved.
The cost forecasts in the PEI that are included as pri-
vate charges in the corresponding land compensation
projects are likely to be lower than current requirements
in state and Catalan planning regulations referring to
connecting infrastructures and participation to compen-
sate for the shortfall in public transport. The EEF of the
MPGM estimated a unit cost of €24 or €30 /m2 GFS, for
plot ratios of 2.2 and 2.7 FAR, respectively.
Private financing of the urban transformation also
includes the costs of compensation for relocation of exist-
ing activities and rehousing of those in existing dwellings,
demolitions and the infrastructure of the interior of
blocks, as well as the construction costs and all spending
on the management of city infrastructure and construc-
tion processes. The compensation costs may vary consid-
erably depending on the degree of consolidation of the
different sectors within the area of the MPGM. However,
it is the real estate prices that must make the transforma-
tion possible in each case.
A report from 2006 on the financial viability of a private
development proposal in the planning stage for two blocks
in 22@ clearly illustrates the order of magnitude of private
financing and the parameters of the development’s finan-
cial viability. The operation involved considerable compen-
sation costs for construction, relocation of activities and
rehousing as the area was highly consolidated, with a real
plot ratio before the transformation of 1.5 FAR, which is far
above the average of 1 FAR in the entire MPGM.
The operation was based on an expectation of average
real estate prices of €3,000 /m2 GFS for economic activity
classified as @. It required the relocation of existing activity
with considerable compensation costs of around €13 M,
which translates to costs for the potential floor space of
€189/m2 GFS. The entire process was expected to take
6 years, from the purchase of the land to the sale of the built
floor space.
The basic data and results were as follows:
Plot ratio: 2.7 FAR and 0.3 FAR transferred to the City
Council for affordable housing
Sale price for @ activities = €3,000/m2 GFS
Sale price for affordable housing = €1,456/m2 GFS
Average sale price = €2,850/m2 GFS
Average construction cost: €986/m2 GFS
Schedule: 6 years
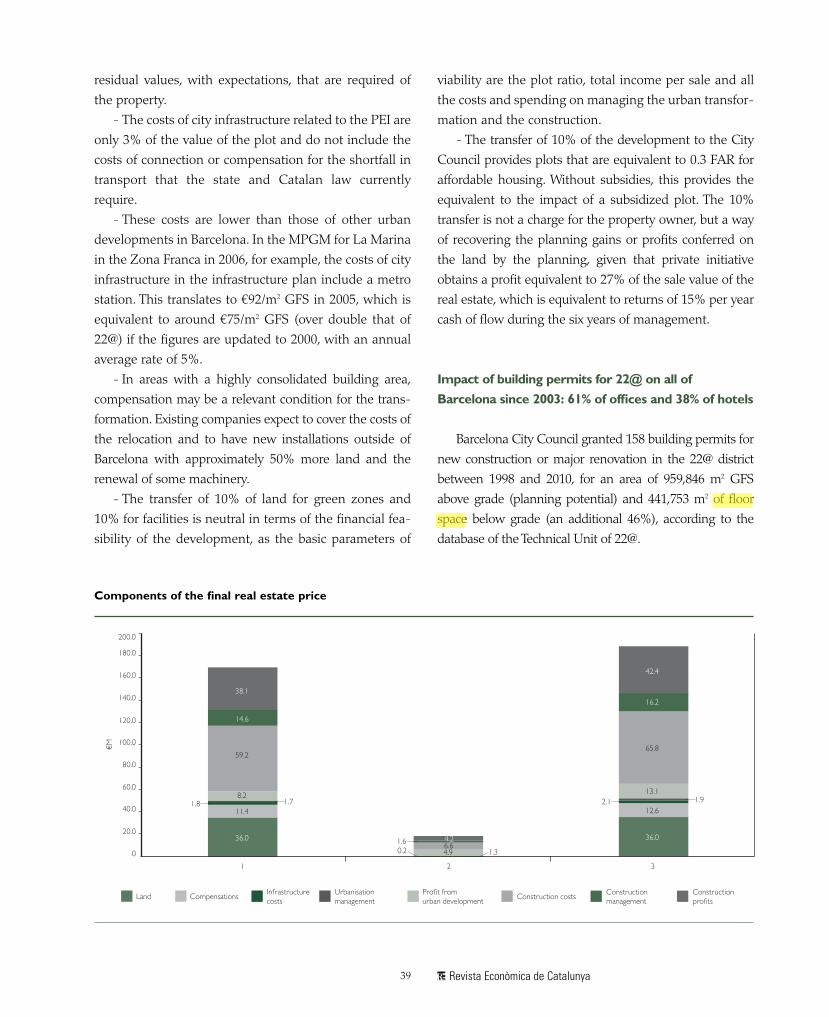
In relation to the real estate price:
- Average land value: €986/m2 GFS (35%)
- Construction and management (includes marketing):
€1,228/m2 GFS (43%)
- Profit: €635/m2 GFS (22%)
- Annual yield rate: 15%
In relation to plot value (€986/m2 GFS):
- Plot prior to urban development: €600/m2 GFS (61%)
- Compensation: €189/m2 GFS (19%)
- City infrastructure (PEI): €32/m2 GFS (3%)
- Management (includes 4% of PEI and marketing):
€28/m2 GFS (3%)
- Profit: €137/m2 GFS (14%)
- Annual yield rate: 15%
The price of the built real estate product covers all of the
costs and spending in the stages of city infrastructure and
construction, with an annual yield rate of 15% in each
stage, and total city infrastructure charges of €250/m2 of
land and payment for the land prior to urban development
at €1,620/m2 of land. These values are average for plots
developed in Barcelona, according to statistics in the
Forcadell report for the third quarter of 2006 (€1,315-
1,800/m2). This value is equivalent to a cost of €600/m2 GFS,
which is 61% of the average land cost of €986/m2 GFS.
The graph below shows a diagram of the components of
the real estate value of the property, the transfer to the City
Council of 10% of the development18, and the complete
operation.
The following conclusions can be made about the
financial viability of private development:
- The transactions are adapted to the mechanism of
derived demand in each case. The market price of the
final products ‘withstands’ high compensation and high
38 Revista Econòmica de Catalunya
sara
Resaltado
m2 GFS
residual values, with expectations, that are required of
the property.
- The costs of city infrastructure related to the PEI are
only 3% of the value of the plot and do not include the
costs of connection or compensation for the shortfall in
transport that the state and Catalan law currently
require.
- These costs are lower than those of other urban
developments in Barcelona. In the MPGM for La Marina
in the Zona Franca in 2006, for example, the costs of city
infrastructure in the infrastructure plan include a metro
station. This translates to €92/m2 GFS in 2005, which is
equivalent to around €75/m2 GFS (over double that of
22@) if the figures are updated to 2000, with an annual
average rate of 5%.
- In areas with a highly consolidated building area,
compensation may be a relevant condition for the trans-
formation. Existing companies expect to cover the costs of
the relocation and to have new installations outside of
Barcelona with approximately 50% more land and the
renewal of some machinery.
- The transfer of 10% of land for green zones and
10% for facilities is neutral in terms of the financial fea-
sibility of the development, as the basic parameters of
viability are the plot ratio, total income per sale and all
the costs and spending on managing the urban transfor-
mation and the construction.
- The transfer of 10% of the development to the City
Council provides plots that are equivalent to 0.3 FAR for
affordable housing. Without subsidies, this provides the
equivalent to the impact of a subsidized plot. The 10%
transfer is not a charge for the property owner, but a way
of recovering the planning gains or profits conferred on
the land by the planning, given that private initiative
obtains a profit equivalent to 27% of the sale value of the
real estate, which is equivalent to returns of 15% per year
cash of flow during the six years of management.
Impact of building permits for 22@ on all of
Barcelona since 2003: 61% of offices and 38% of hotels
Barcelona City Council granted 158 building permits for
new construction or major renovation in the 22@ district
between 1998 and 2010, for an area of 959,846 m2 GFS
above grade (planning potential) and 441,753 m2 of floor
space below grade (an additional 46%), according to the
database of the Technical Unit of 22@.
Revista Econòmica de Catalunya39
200.0
180.0
160.0
140.0
120.0
0
100.0
80.0
60.0
40.0
20.0
€M
Land
1
38.1
14.6
59.2
8.21.71.8
11.4
36.0
2
4.26.61.64.90.2 1.3
3
42.4
16.2
65.8
13.1
12.6
36.0
1.92.1
Compensations Infrastructurecosts
Urbanisation management
Profit from urban development Construction costs Construction
managementConstruction profits
Components of the final real estate price
sara
Resaltado
GFS
40 Revista Econòmica de Catalunya
Most permits were approved between 2003 and 2007
(72% of the total area). The evolution of the figures over
time reflects the need in the early years (1998-2002) to
carry out the land planning and management (18% of
the total) and, from 2007 onwards, the general slow-
down in the real estate market (10% of the total). In
comparison to the whole of Barcelona, we can consider
that the activity in 22@ took off in 2003, when previous
permits were accumulated. There were two peaks in
2005 and 2007, with 39% of the total floor space.
From 2001 to 2007, the average built area per year was
172,106 m2 GFS, whilst in the following three years it was
only 33,105 m2 GFS. Between 2003 (accumulated) and
2010, on average 120,000 m2 of floor space above grade
were approved per year. This trend could be taken as an
optimistic forecast of growth in the next few years, as the
period includes four and a half years of expansion and
three and a half years of recession. However, a pessimistic
trend could be situated at 100,000 m2 GFS per year.
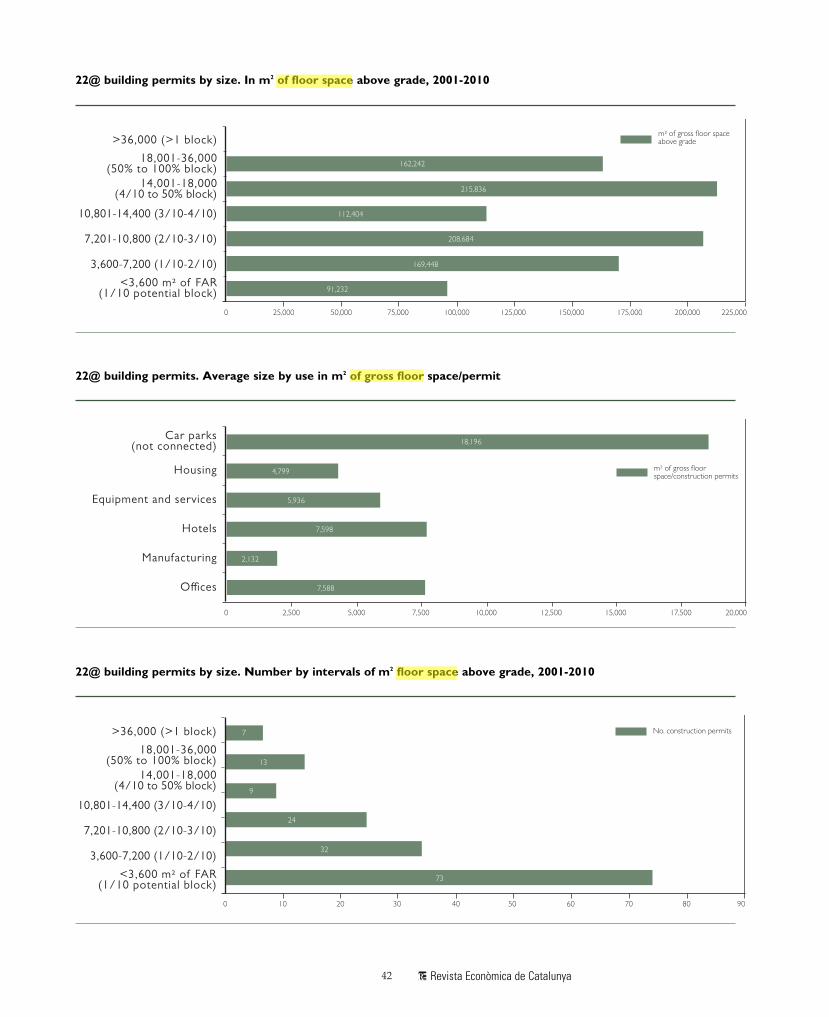
The main building type is offices, which represent
51% of the floor space above grade in the approved per-
mits (488,000 m2 GFS out of a total of 960,000 m2 GFS).
This is followed by affordable housing (173,000 m2 GFS
and around 2,200 dwellings) at 18%, and then by hotels
(150,000 m2 GFS and around 2,300 rooms) at 13%.
The average area in permits for offices, dwellings,
hotels and facilities is between 5000 and 7000 m2 GFS
above grade, with the exceptions of manufacturing
(2,100 m2 GFS) and two permits for independent car
parks (18,000 m2 and around 720 parking spaces). A
total of 46% of permits are for under 3,600 m2 GFS,
which is equivalent to approximately a tenth of the
potential of a block. Only 20 permits (13%) are for over
a quarter of the potential of a block. The average permit
is for 6,050 m2 GFS above grade.
The estimate of jobs that the approved permits could
represent was calculated on the basis of the standards that
result from combining Barcelona’s land registry informa-
tion with information on jobs from the magazine Barcelona
Economia, which presents information on employment in
32 subsectors, as well as the authors’ own hypotheses19.
The average standards are as follows:
- Storage: 74 m2 per job
- Retail trade: 86 m2 per job
- Personal services (excluding health) and education:
45 m2 per job
1999
200,000
180,000
160,000
140,000
2001 2003 2005 2007 20102000 2002 2004 2006 2008
120,000
100,000
0
Total permits 22@ m2 of gross floor space above grade
Total o"ces 22@ m2 of gross floor space above grade
80,000
60,000
40,000
20,000
2009
22@ building permits. In m2 of floor space above grade, 2001-2010
19. This is part of a wider study underway on the urban and real estateimpact of 22@.
O"ces Manufacturing Hotels Equipment and services Housing
47,664 47,664
405,338
21,712 16,020
34,112
4,485
124,687
12,395
16,020
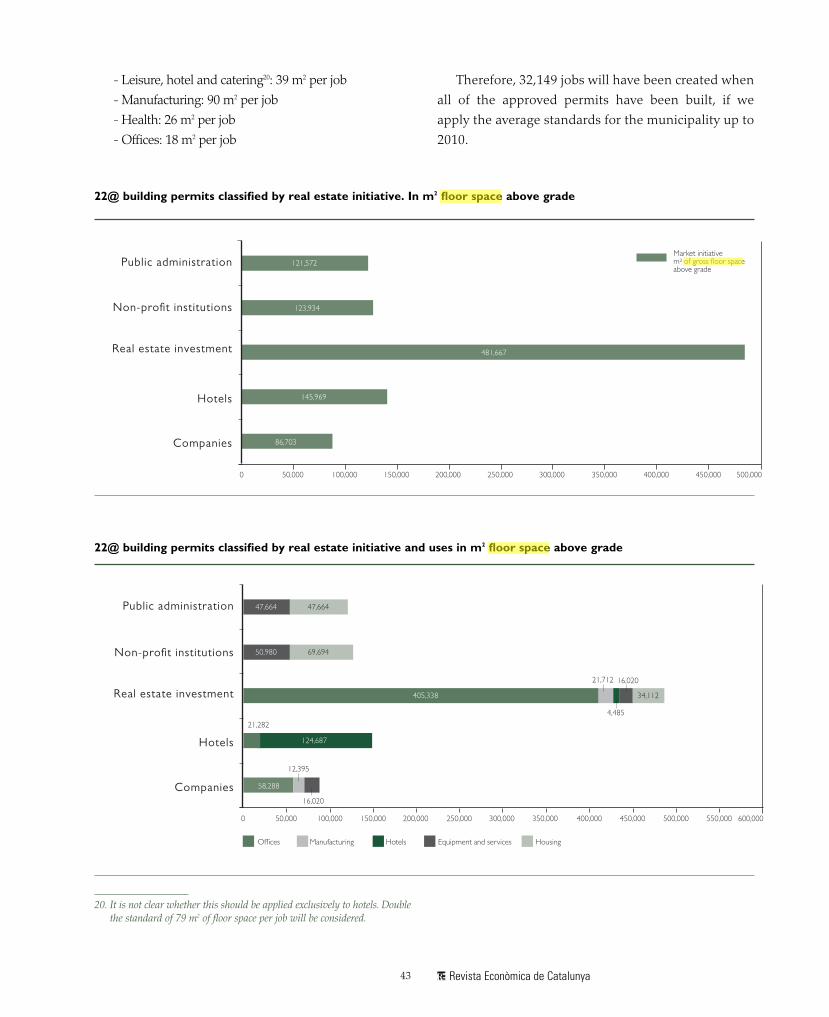
22@ building permits classified by real estate initiative. In m2 floor space above grade
22@ building permits classified by real estate initiative and uses in m2 floor space above grade
- Leisure, hotel and catering20: 39 m2 per job
- Manufacturing: 90 m2 per job
- Health: 26 m2 per job
- Offices: 18 m2 per job
Therefore, 32,149 jobs will have been created when
all of the approved permits have been built, if we
apply the average standards for the municipality up to
2010.
20. It is not clear whether this should be applied exclusively to hotels. Doublethe standard of 79 m2 of floor space per job will be considered.
sara
Resaltado
GFS
sara
Resaltado
GFS
sara
Resaltado
GFS
21. This has been classified according to the name of the permit holder. In addi-tion, the 22@ technical services were questioned to ascertain the distinctionbetween ‘real estate investment for rent’ or ‘specific company’, which werethe concepts that were most difficult to assign. The distinction between‘non-profit institutions’ corresponds mainly to trade union estate agents inthe case of housing and institutions in the case of facilities. ‘Lofts’ areassigned to ‘real estate investment’ in dwellings.
In the real estate market21, most applications for per-
mits have been for investment and rental (50.2% of the
approved area), mainly for the development of offices.
Specific hotel initiatives, which are also considered a pri-
vate real estate investment, represent 15% of the approved
floor space. Government buildings, together with the
The results indicate that 22@ is the most important sin-
gular operation in Barcelona in terms of offices (61% of the
total since 2003) and that, at the same time, it has played an
essential role in the location of new hotels (38%), to address
the growing demand resulting from the constant increase in
visitors to the city.
The results also highlight that 22@ combines and com-
petes with other areas of the city that have considerable
dynamism in the years of expansion, one of which is the
important area of the Forum, which is adjacent to the dis-
trict of Sant Martí. In addition, the synergic effects of clusters
should be considered as a single operation, to which La
Sagrera central station and the surrounding area shall soon
be added.
Building potentials for 22@ and the expected time
it will take to infill the area: up to 2014, with
100,000 m2 GFS absorbed annually and potential for
85,000 jobs.
The figures are based on data available for 22@, today,
which are (in m2 GFS above grade) as follows:
- Listed buildings for which no permit
has been requested.............................................................108,163
- Other buildings that remain .................................198,193
- Consolidated façades for housing .................137,085
Revista Econòmica de Catalunya45
22. In relation to the comparison with information on 22@ building permits byuses, the problem in the new-build statistics in Barcelona Economia is thathotels are classified with facilities. The comparison could also be biased byyears, because there is a time lag between the date of the City Council’sapproval and the favourable information provided by the 22@ technical serv-ices. Therefore, we can assume that the proportion of the two uses is the sameas that in the statistics on total major building works.
In terms of the total 198.3 ha of land, this represents a
total plot ratio of 1.96 FAR. In terms of the 116.0 ha of land
to be transformed (42% of land in roads, green zones and
other systems), this represents a net plot ratio of 3.3 FAR.
A total of 1,842,243 (47% of the total floor space) can
be considered consolidated floor space, and only
959,847 m2 GFS (57% of the consolidated floor space) in
granted permits is still pending construction. A plausible
hypothesis is that building has not yet begun on only
approximately 95,000 m2 GFS in building permits granted
between 2008 and 2009.
The considerable planning and management effort in
22@ is clearly revealed by the building potential with com-
pleted planning and management, which stands at 60% of
the total potential (2.3 million m2 GFS compared to the
total of 3.9 M m2 GFS).
We could consider that the areas that are pending
planning and management (480,137 m2 GFS) will be
developed in the short- to medium-term when the market
conditions are suitable, and that this will be the first poten-
tial area for which construction permits shall be sought.
The main issue is to determine which part of the
1,570,373 m2 GFS with no planning or management, equiv-
alent to 40% of the total potential, will be put on the market
due to demand, after excluding the industrial plots that have
a high ratio of m2 of gross floor space/m2 of land and thus
involve high transformation costs. These plots cannot be
considered as potential supply to be transformed in the
medium term.
Due to a lack of further information, we have used the
proportion indicated in the economic and financial study
of 2000 for blocks with built areas of less than 38,000 m2
GFS in the ‘optional development’ category (59.7%). The
development potential will probably be 1,417,650 m2 GFS
(937.513 m2 GFS added to the 480,137 m2 GFS with plan-
ning and management).
Consequently, the infill of the area will be completed in
12 years (2022), with an optimistic forecast of permits
being granted for 120,000 m2 GFS per year, or in 14 years
(2024), with the pessimistic forecast of permits for
100.000 m2 GFS per year, according to past trends.
If we make combined forecasts for occupation, taking
into account that part of the new developments will be allo-
cated to dwellings and also assuming the average standard
of 30 m2 GFS per new job (including housing), the pending
potential development is likely to house 52,446 jobs, in
addition to those estimated from the permits that have
already been granted (32,14923). This gives an approximate
total of 85,000 jobs24 derived from new development in 22@,
which can be added to the existing jobs for activities that will
not be transformed.
The 22@ district, the central station of La Sagrera
and the Forum: Barcelona’s central business district
in 2025-2030
The central business district (CBD) of a metropolitan
urban area is the part of the territory, generally in a very
central position, where there is the highest concentra-
tion of directional activities providing services to com-
panies, with maximum added value per job. For simplic-
ity, the boundaries of the CBD in Barcelona are
considered to be the Eixample and Ciutat Vella districts,
although a more precise delimitation would be more
linear along Passeig de Gràcia and Avinguda Diagonal,
46 Revista Econòmica de Catalunya
23. However, in another study based on a census of companies, the number ofnew workers in 22@ economic area (extended) was estimated at 44,600in December 2009.
24. Using the standards of La Défense (24 m2 per job in offices and retail) thiswould be 99,062 jobs.
sara
Resaltado
suprimir. Disculpes error en l'original
as shown on the maps in reports by the main real estate
agents.
The urban development proposed in the transforma-
tion of industrial Poblenou into the 22@ district has a
potential of around 3.2 million m2 GFS above grade (and
approximately 1.3 M m2 GFS below grade, based on pro-
portions derived from approved permits) and will alter the
concentration of current tertiary activities and the metro-
politan centres.
The municipality of Barcelona had 118.99 million m2 of
registered floor space in February 2005, both above grade
and below grade in car parks, according to the City
Council’s Institute for Fiscal Studies. In December 2009, it
had 121.29 M m2, according to information from the Land
Registry Office of Catalonia. Therefore, there was an incre-
ment of 1.93%, and the breakdown of uses did not coin-
cide exactly with the initial information.
The Sant Martí district represented 12% of the total
registered floor space of Barcelona (14.6 M m2 GFS) in
2005. However, it housed 20% of manufacturing (2.7 M m2
GFS) and 6% of offices (0.4 M m2 GFS) and government
buildings. In contrast, the Eixample district represented
27% of the total registered floor space (23.9 M m2 GFS)
and housed 45% of the offices and public administration
buildings (2.5 M m2 GFS) and 14% of the manufacturing
of Barcelona (1.7 M m2 GFS). Although the increase in the
number of offices would have been very different in other
districts, we do not have enough land registry information
to document it accurately25.
The combined districts of Eixample and Ciutat Vella
that are considered the current CBD account for 45% of
the floor space of offices and government buildings in
Barcelona, with 3.5 million m2 GFS in 2005.
To the dimensions of 22@ (3.2 M m2 GFS above grade
for activity and an allocation below grade -assuming that
industrial activities can coexist that are progressively trans-
formed within the same sector of activity into activities that
are more compatible with other uses - and around 1.2 M m2
GFS below grade), we should add the potential economic
activity in the operation of the Forum (0.6 M m2 GFS above
grade and around 0.1 M m2 GFS below grade) and in the
area surrounding the central station of La Sagrera (0.4 M m2
GFS above grade and 0.1 M m2 GFS below grade). The total
activity in the three operations together would be 4.2 M m2
GFS of activity above grade and 1.4 M m2 GFS below grade,
compared to 3.5 M m2 GFS in the districts of Ciutat Vella
and the Eixample, in 2005.
We can conclude, therefore, that the completion of the
major economic activity operations in the districts of Sant
Martí and Sant Andreu (4.2 M m2 GFS above grade), which
Revista Econòmica de Catalunya47
25. This is a serious statistical problem that affects the assessment of thephysical and economic dimensions of cities, that is probably caused by thecentralized management of the land register.
Land Register BCN (above and below grade) 2005.
In millions of m2 GFS
Ciutat Vella 8.13%
Eixample 23.99%
Sants-Monjuïc 15.22%
Les Corts 8.32%Sarrià-Sant Gervasi 14.90%
Gràcia 8.36%
Horta-Guinardó 9.25%
Nous Barris 7.45%
Sant Andreu 8.81%
Sant Martí 14.56%
Land Register BCN, Offices-Public Administration, 2005.
In millions of m2 GFS
Ciutat Vella 1.3
Eixample 2.49
Sants-Monjuïc 1.21
Les Corts 0.78
Sarrià-Sant Gervasi 0.82
Gràcia 0.51
Horta-Guinardó 0.11
Nous Barris 0.10
Sant Andreu 0.29
Sant Martí 14.56%
Source: Institute for Fiscal Studies, Barcelona City Council, Ciutat Vella Source: Institute for Fiscal Studies, Barcelona City Council, Ciutat Vella
are close together and will therefore facilitate clustering
and synergies when economic conditions allow, will sur-
pass or at least equal in size and in knowledge-based and
new technology activities the dimensions of the districts of
Eixample and Ciutat Vella (3.5 M m2 GFS, in 2005), and will
modify in any case the central areas in the city.
However, there is still the question of whether more
dwellings are needed than those envisaged in the plans for
these major operations in the east of Barcelona, to create the
balance of a compact and complex city and meet the addi-
tional needs of accessibility and public transport that mod-
ern CBD require. In any case, the main commercial centre of
the city will continue to be the traditional, historic CBD.
Summary and conclusions
1. The 22@ district, which has a potential of almost
4 million m2 of buildable area (GFS), boosts the knowledge
economy by providing companies with externalities to
compete better. It also offers an additional plot ratio of 0.5
FAR, which acts as an implicit subsidy in comparison with
other zones with lower plot ratios. The location in the 22@
district of universities and technology centres and a com-
mitment to clustering means that those who move to the
district do so not only for the prices, but also for the posi-
tion in innovation, the ‘current critical mass’ and because
it is the largest central supply. One of the advantages in
terms of real estate is that construction can begin immedi-
ately, unlike in other competing operations that are still in
the planning stage.
2. The 22@ district competes with operations around the
world of a similar scale that are in central locations, such as
La Défense in Paris or the extension of La Castellana in
Madrid. Its advantage is that it is a knowledge economy
cluster, and its disadvantage is that it has a lower critical
mass and regional and international rail networks are not
highly accessible from the district today. Furthermore, the
prices and rents are higher than those of Barcelona, which
reflects the greater attractiveness of world cities. The district
benefits from the iconic Agbar Tower, the Biomedical
Research Park and the new Telefónica tower on Avinguda
Diagonal, which is outside its urban area.
3. The MPGM predicts that it will take 20 years to com-
plete the development. The annual absorption rate will be
135,000 m2 GFS. The compensation for relocation of indus-
trial activities is economically feasible and 70% of the infra-
structure plan will be covered. The development was well in
line with expectations up to the change in economic and
real estate cycle that began in 2007, and permits have been
granted for only 33,000 m2 GFS on average per year.
4. Concurrent and competing current and future oper-
ations have a total building area of 11.4 mm2 GFS for activ-
ities and housing, generate a surplus of 207,500 jobs and a
shortfall of 198,600 dwellings in the city ‘from river to
river’, and their development shall increase metropolitan
mobility.
5. The potential area available in 22@ combined with
the future potential of La Sagrera-Prim shall continue to
be the main supply for economic activities in the coming
years. However, it will only represent 47% approximately
of the potential. The supply that shall be in most compe-
tition with 22@ will be the Innovation Zone in Zona
Franca in the former SEAT factory, which will provide
around 1 million m2 GFS with a plot ratio similar to that
of 22@, and with very competitive rental prices. The city
infrastructure of this area has just begun. To differentiate
the supply, it is essential to ensure specialization by sec-
tors in each territory.
6. The second main metropolitan supply for economic
activity, in terms of size and quality of the city infrastruc-
ture, is that of the Centre Direccional de Cerdanyola-Parc
de l’Alba, which is currently available. We can consider
that this supply complements that of 22@, as it meets a
different demand for activity, in terms of characteristics,
location and price. The two areas strengthen each other to
attract international demand. They cover an area of 340 ha
and have a potential floor space of 1.9 million m2 GFS, of
which 1.5 M m2 GFS are for economic activity.
7. The 22@ district has been a successful operation
because 61% of the total new office buildings in Barcelona
have been located there since 2003, and 38% GFS of new
hotels, for which there is increasing demand due to the
constant rise in the number of visitors to the city. Without
the 22@ district, these activities would have had to be
located in the wider metropolitan area, which would have
48 Revista Econòmica de Catalunya
presented fewer opportunities to create urban economic
clusters.
8. The permits approved up to the end of 2010 would
lead to the creation of 32,000 jobs, using the city’s aver-
age standards of density by use. However, in the wider
economic area of 22@, around 44,000 new jobs shall have
been created in 2010.
9. The development of 22@ has been driven by the
location of public facilities, universities and non-profit
institutions, given the supply of land for affordable
housing that represents 26% of the total floor space in
the approved permits. The real estate interest is clear:
50.25% of the approved areas are for buildings for
investment and rent, mainly for offices. Specific hotel
initiatives, which should also be considered private real
estate investment, represent 15% of the approved floor
space. Direct investment by start-ups or existing compa-
nies only accounts for 9% of the approved floor space to
date; consequently this area should be promoted in the
future.
10. From 2001 to 2007, the average area constructed
per year was 172,106 m2 GFS, whilst in the three last
years it has been only 33,105 m2 GFS. Between 2003
(accumulated) and 2010, an average of 120,000 m2 GFS
above grade was approved per year. This trend could be
taken as an optimistic forecast for the coming years, as it
includes four and a half years of expansion and three and
a half years of recession. A pessimistic forecast would be
100,000 m2 GFS absorbed per year.
11. The forecast costs of the Special Infrastructure
Plan that are to be financed by the developments are too
low in comparison to what is currently required in the
Spanish and Catalan planning regulations on connecting
infrastructure and on participation to redress the shortfall
in public transport. The economic accounts for the oper-
ations could include higher city infrastructure costs.
12. The 22@ district is an operation that enables plan-
ning gains to be recovered through the financing of city
infrastructures and through the transfer of land for
affordable housing, which is compatible with private
returns on the operations, due to the plot ratio. Private
real estate initiative has provided profits of approximate-
ly 27% of the real estate sale value and returns of 15%
per year in cash flow for an average management period
of six years from planning to sale.
13. The potential area that is pending development in
22@ (1.4 million m2 GFS) shall be completed in 12 years
(2022) in the optimistic forecast of permits being granted
for 120,000 m2 GFS or in 16 years (2026) in the pessimistic
forecast of 100,000 m2 GFS per year, according to past
trends.
14. The total potential number of jobs is estimated at
85,000 (99,000 using the standards of La Défense, Paris),
with current standards of density. These jobs will be
added to those of activities that will not be transformed.
15. The completion of major economic activity opera-
tions in the districts of Sant Martí and Sant Andreu
(4.2 M m2 GFS above grade) will facilitate the formation of
clusters and synergies when economic conditions are
right, due to their proximity. Combined, these operations
will surpass in size and in knowledge- and technology-
based activity the dimensions of offices for directional
activities in the current CBDs of the Eixample and Ciutat
Vella (3.5 M m2 GFS, in 2005), and shall become the new
CBD of Barcelona by 2025-2030.
16. From the perspective of urban development and
real estate, we can consider whether more dwellings are
needed than those envisaged in the plans for for these
major operations in the east of Barcelona. This would help
to create the balance of a complex and compact city, and to
meet the additional needs for internal accessibility through
public transport of the most contemporary CBD, which
could be funded by the new development. Nevertheless,
the main commercial centre continues to be the tradition-


![[4Fe-4S]2+/+ Reduction Pote](https://static.documents.pub/doc/80x56/5868f2ec1a28abd9158b468b/4fe-4s2-reduction-pote.jpg)
