49
The Impact of a ‘Financial Incentive Program’ on Employee Performance: The HRC case Degree Thesis Degree Programme in International Business 2015

The Impact of a ‘Financial Incentive Program’ on Employee Performance: The HRC case
Degree Thesis Degree Programme in International Business
2015

2
Arcada Degree Programme: International business Identification number: 15440 Author: Anastasia Kuznetsova
Title: The impact of a “Financial Incentive Program” on the employee performance: The HRC Helsinki case
Supervisor (Arcada): Milden Peter Commissioned by: Hard Rock Café Helsinki Abstract:
The purpose of this thesis is to investigate the impact of the Financial Incentive Program introduced at HRC Helsinki on the employee performance. The research is based on three theories of motivation: Vroom’s Expectancy Theory, Adam’s Equity Theory and Locke’s & Latham’s Goal-Setting Theory.
The research is implemented through analyzing the sales reports of 2 months before and after the introduction of the incentive program and, the HRC staff survey conducted by the author. The monetary data obtained from the sales reports allows the author to examine the employee performance during the incentive program, compare it with the performance before the program and indicate a change in the key areas. Conduction of the HRC staff survey provides the research with the overall attitude of the personnel towards the experimental financial incentive program, and the level of their motivation.
The outcome of the Financial Incentive program shows contradicting results after 2 months of analysis in terms of sales and employee performance. The results help to indicate important failures in the design of the program and its ways of assessing the actual employee performance. The HRC staff survey outlines overall negative attitude of the staff towards the program due to certain aspects including fairness of the program.
The analysis of the results helps the author to draw certain conclusions and come up with the recommendations for the future programs, which will be implemented at Hard Rock Café Helsinki. Therefore, the author concludes that the incentive program is not effective due to its multiple design failures, which makes it impossible to assess an actual employee performance, and it does not address the issues of fairness and equality. Moreover, the program has a lack transparency and clarity, which causes negative opinions among the staff. By taking into consideration the issues mentioned above and improving them, the company will be able to create better incentive programs for the personnel in the future.
Keywords: Employee motivation, motivational theories, employee performance, financial incentive
Number of pages: 49 Language: English Date of acceptance: 15.12.2015

3
Contents:
1. Introduction……………………….……………………………….………..………………4-‐8 1.1 Background………………….……..……………………………………………..…………4 1.2 About the Company.….….………………………………………………….….…..…4-‐6 1.3 Aim of the Research…..………………………………………………………………….6 1.4 Thesis Statement and Research Questions………………………….....…….…6 1.5 Significance of the Research………………………………………………….…........7 1.6 Limitations………………………………………………….…………………...…..…...7-‐8
2. Key Definitions………………………………………………………………….………..8-‐9 3. Theoretical Framework……………………………………………………..……..9-‐13 3.1 Vroom’s Expectancy Theory………………………………………….….…...9-‐10 3.2 Adam’s Equity Theory………………………………………………….….…..10-‐11 3.3 Locke’s and Latham’s Goal-‐Setting Theory…………………….……..11-‐12 3.4 Hypotheses………………………………………………………………….……..12-‐13 4. Methodology and Material……………………………………………….………13-‐17 4.1 Experiment; New FOH Financial Incentive………………….………..13-‐16 4.2 Hard Rock cafe Helsinki Staff Survey………………………….….……..16-‐17 5. Results………………………………………………………………………………….…17-‐31 5.1 Monetary Results of the Sales………………………………………….…..17-‐27 5.2 The results of the Hard Rock Café Helsinki Staff Survey…….….27-‐31 6. Discussion and Analysis………………………………………………………….31-‐45 6.1 Expected Results versus Obtained Results…………………………..31-‐38 6.2 Percentage Numbers versus the Absolute Numbers……………38-‐40 6.3 Disturbance of the Experiment…………………………………………..40-‐42 6.4 The attitude of the staff towards the Program………………….....42-‐45 7. Conclusion and Recommendations…………………………………..….. 46-‐47 8. References…………………………………………………………………………….48-‐49

4
1. Introduction 1.1 Background
In modern fast paced businesses, it is crucial for the organization to properly
motivate and engage the employees in order to stay competitive. Motivation and
engagement has been the key for the successful performance of many
businesses, and it has been shown that a satisfied employee will help a business
reach their goals. Many popular behavioral and workplace psychologists such as
Edwin A. Locke (1990), John Stacey Adams (1965) and Victor Vroom (1964)
have proven that job motivation leads to more satisfied and as a result better
performing employees.
It is obvious that motivation within an organization is crucial for success.
However, what is not so obvious is how it is possible to motivate each of your
employees day in and day out.
Different companies follow different theories of motivation and utilize different
tools to motivate their workers (Forbes, July 5, 2015). Some think that if they pay
more attention and support their staff more, the workers will perform better,
others think that empowering the workers is the key to success. The truth is that
what works for one company does not necessarily works for another, especially
if they are operating in different industries; e.g. there are certain ways to
motivate a car factory worker, implementing the same tasks everyday and a
restaurant worker, who has to deal with various types of people every day and
face the unexpected situations.
Hospitality business is rather complex in terms of motivation of the employees
due to the high turnover and the lack of long-‐term career perspective. The
workers of the hospitality industry usually face serious problems with self-‐
motivation. It is very hard to find an employee who considers working at a
restaurant as his or her future career without any promotion. The only way to
increase employee retention and improve employee performance is proper
motivation and management involvement (International Labor Organization,
2010, p.13-‐18).

5
1.2 About the company
Hard Rock Café is rather large corporation, which pays a lot of attention to the
employee motivation and their overall well-‐being by introducing various
competitions and financial incentives.
HRC has started as a single restaurant in London, which opened its doors on the
14th of June 1971. Now it is a chain of theme restaurants, which has over 198
locations, including restaurants, hotels, casinos and live music venues in 63
countries. During its 44-‐year history, the company has had its successful
moments and failures, but still managed to stay competitive and keep the status
of a restaurant giant (Hard Rock Corporate/Hard Rock History, July 9, 2015).
The author has concentrated on the HRC Helsinki, which operates as a franchise.
Helsinki location has been officially opened on the 15th of October in 2012 and is
still operating as part of the Nordic Group Cafes including other locations such as
Stockholm, Gothenburg and Oslo (Hard Rock Café Helsinki; Location Supplement,
July 10, 2015). The restaurant is located at the very heart of Helsinki, on the
main shopping street, and consists of two floors, where on the first floor its retail
department is located and the second floor includes a big 240 seats dining area
and a bar zone (Location Supplement, July 10, 2015). At the beginning of its
business operation Hard Rock Café Helsinki experienced big inflows of money
due to the fact that it was new, exciting for locals and completely different from
the rest of the restaurants in the area.
Even though Hard Rock Café Helsinki is a franchise, it still has to meet all the
high standards of the corporate and respect the brand of the company.
Therefore, the initially hired employees had to go through a serious selection
process, which was followed by intensive 2-‐ week training in the classroom and
on the premise. 150 people were carefully selected and trained in order to
provide the guests with an unforgettable customer service experience.
However, after almost 3 years, the amount of employees at the Hard Rock Café
Helsinki has reduced to a number of around 25 people working on the “floor”.
With time, the sales of the restaurant have gone down as well since it wasn’t any
longer new and unfamiliar. The guests knew what to expect and the employees
started to loose their motivation to boost the sales or meet the standards of the
company. That is why the senior managers had no choice but to come up with

6
various ideas to restore the motivation of their employees and improve their
performance. In 2014 a big number of employee competitions and incentives
were introduced. Unfortunately, none of them brought the expected results due
to various reasons. Recently, the restaurant’s management has become very
concerned about the company’s high labor turnover, the average sales of certain
items and the mediocre performance of the employees. Therefore, the
management of the company has raised a serious question regarding the
performance of their workers, and wanted to improve it through the
introduction of a new incentive.
1.3 Aim of the Research
The Hard Rock Café Helsinki management has recently introduced a completely
new financial incentive program in order to increase sales of certain items and
improve the motivation and the performance of their employees. The manager
responsible for the incentive and the author have collaborated to analyze the
results of the incentive program, its effect on the motivation of the employees,
the change in performance and sales by comparing them to the sales before the
implementation of the incentive program. It was agreed to introduce the
incentive for two months only, July and August 2015. If the incentive brought
positive changes in the employee performance, it would be run longer by the
management team.
1.4 Thesis Statement
The purpose of the thesis is to analyze the impact of the new financial
incentive program on the employee performance at HRC Helsinki
The Research Questions
How did the new financial incentive program introduced by the
management of HRC affect the employee performance?
Did the sales of certain items at HRC improve after the introduction of the
incentive program?
Did the employees of HRC feel motivated to improve their performance in
order to obtain the bonuses offered by the incentive program?

7
1.5 Significance of the Research
The management of HRC has been trying to improve the situation regarding the
employee performance and motivation multiple times but the results were either
insignificant or lasted for a very short period of time. Due to the problems with
the employee performance, the sales targets of the restaurant haven’t been
reached.
After a careful analysis of the previous incentive programs and their results, the
senior management decided that there was an urgent need for the creation of a
new improved incentive program in order to boost the sales of the most difficult
to sell restaurant menu items. On the 1st of July the new financial incentive
program for the front of the house (servers and bartenders) was introduced by
the senior manager with the author’s collaboration. The responsible manager
had high expectations towards the outcome of the incentive program.
The research and analysis of the result of the incentive program conducted in
this thesis will be beneficial for the company, as the topic of employee
motivation and performance in the restaurant industry is widely discussed by
many workplace psychologists. The topic is considered to be rather complicated
and controversial, which is why it is suitable as a thesis topic. The goal is to find
out whether or not it was possible to improve the employee performance at a
restaurant via financial incentive program.
1.6 Limitations
The concept of employee motivation at a workplace is talked about by
psychologists all over the world. Multiple motivational theories have been
suggested in order to better understand how to motivate people onto better
performance.
Even though the concept of employee motivation was included into the thesis,
the work mainly focused on the analysis of the employee performance before
and after the implementation of the financial incentive program in the company.
Employee motivation was measured by the qualitative survey during the effect
of the incentive. Therefore, the core focus of the thesis was to analyze the
correlation between the new financial incentive program and the employee
productivity.

8
The limitations of the research in this case referred to the limitations of the
experiment implemented in the company (introduction of the new financial
incentive program), meaning that certain employees could improve their
performance despite the incentive program through putting an extra effort or
working on their motivation. It is important to note that all the front house
employees were scheduled differently, which means that certain employees’
results could be better simply due to their working timetable (normally the sales
of the cocktails are higher on Saturday evening than on Monday morning).
Moreover, certain events happening in the city such as Gymnastrada 2015 (held
from 12th of July to 19th of July) affected the restaurant’s routines. Due to this, the
sales of the certain items of some employees may have boosted even without
them putting an extra effort to reach the target set by the incentive program.
The author analyzed the sales of the employees within a 3 –month period, from
May to August 2015. This time limit helped to conduct a more detailed analysis
and keep the thesis more focused.
2. Key Definitions
The main definitions and concepts utilized throughout the thesis are explained in
more details below:
Motivation (Employee Motivation): according to professor R. Kretiner (1998)
a term motivation comes from a Latin word “movere”, which means to move. It
refers to a “psychological process that causes the arousal, direction and
persistence of voluntary actions that are goal-‐oriented”. Motivation can also be
defined as “the willingness to exert high levels of effort toward organizational
goals, conditioned by the effort’s ability to satisfy some individual need”
(Ramlall, 2004).
Employee Performance: refers to the job or task related activities required or
expected of a worker by the employer. It is important for every company to
conduct the employee performance evaluation on a regular basis in order to spot
the suggested areas for improvement.

9
Financial Incentive: the term can be defined as the program aimed at
improvement of individual’s performance via financial bonuses. Financial
Incentive programs refer to extrinsic motivation of employees rather than
intrinsic.
3. Theoretical Framework
The experiment, internally known as the New Financial Incentive started at the
Hard Rock Café Helsinki on the 1st of July 2015 was based on 3 motivational
theories. The 3 motivational theories are as follows: Vroom’s Expectancy theory,
Adam’s Equity Theory and Locke’s Goal Setting Theory. A survey, conducted by
the researcher among the staff members was based on the key aspects of the
abovementioned theories of motivation. With the help of the theories,
management of the Hard Rock Café Helsinki expected certain results from the
New FOH (front of the house) financial incentive program, such as the
improvement in the employee performance and employees, who were motivated
to reach the sales targets set by the program.
In order to be able to emphasize the relevance of the research to the theories of
motivation, the researcher described each theory more in details below.
3.1 Vroom’s Expectancy Theory
Victor Vroom’s expectancy theory outlines the importance of motivation in the
organization. The theory analyses motivation from the perspective of why
people choose a certain action or behavior (Lee Seongsin., 2007)
According to Vroom (1964), the theory consists of 3 main components, which
create a motivational force.
The components of the theory are:
Motivational Force = Expectancy * Instrumentality * Valence
Expectancy: refers to a person’s estimation of the probability that an effort will
lead to a successful performance. In other words, expectancy can be defined as a
monetary belief followed by a particular outcome. The expectancy range of an
individual is measured from 0 to 1. Zero means that a person or an employee
does not expect that his or her act will be followed by a positive outcome, while 1
means that a person believes that an act will be followed by a positive outcome.
The expectancy is high if a person thinks that utilizing his skills and capacities

10
will lead to a better performance. In other words, from the employee’s
perspective the expectancy is high if the employee thinks that if he works harder,
it will bring better results and improve the performance.
Instrumentality: refers to the person’s perception of the probability that
performance will lead to a specific outcome. In other words, the person believes
that “if he behaves in a certain way, he will get certain things” (in this particular
case, a financial reward).
Valence: is defined as “ affective orientations toward particular outcomes”.
According to the theory, “an outcome is positively valent when the person
prefers attaining it to not attaining it” and “an outcome has a valence of zero
when the person is indifferent to attaining or not attaining it”. In other words, an
individual has to value the outcome in order to implement a certain act to reach
it.
Vrooms Expectancy Theory is depicted in the figure below.
Figure 1: Vroom’s Expectancy Theory (Lee Seongsin., 2007):
The Expectancy Theory of Victor Vroom is used in the New Financial Incentive
and author’s analysis of its results to. The theory explains how an individual can
be motivated to improve his or her performance through having a target and get
certain (valuable for the individual) reward for reaching it.
3.2 Adam’s Equity Theory
The equity theory is based on an individuals’ belief that rewards are allocated
amongst themselves in proportion to their contributions (Deutsch, 1985).
According to Adam’s equity theory (1965), a social exchange relationship is
considered to be fair if an individual believes that the ratio of his/her outcomes

11
(rewards) to inputs (contribution) equals to corresponding outcome (reward) to
input (contribution) ratio of a comparison counterpart. (P.A Fadil, R.J. Williams,
W. Limpaphayom, C. Smatt; 2005). Equity Theory does not only include two
components such as “inputs” and “outcomes”, it also outlines the importance of
the choice of the other referent. Therefore, it proposes that an individual will
compare his perception of the ratio of “outcomes” to “inputs” to those of a similar
other (Festinger; 1954). The way an individual chooses the other referent is still
rather unclear.
Adam’s Equity theory suggests that when a person becomes aware of inequity, it
will cause tension, which will motivate a person to reduce inequity. Adams
claimed that equity can be restored through altering the individual’s or referent
other’s inputs and outcomes or by choosing another referent other.
The theory suggests that the employees should perceive the relationship
between their contribution and reward for it as fair. The employees should also
perceive the New Financial Incentive as fair towards each employee in the
company; the ratio of outcomes to inputs should be equal to everyone.
According to the theory, the Incentive to be created so, that the employees get
the reward based on their contribution (percentage of sales of certain items),
those who do not contribute, should not get any reward. Every employee gets no
extra, but what they have sold, based on exactly the same counting system, which
makes it transparent and fair towards every worker.
3.3 Locke’s and Latham’s Goal Setting Theory
According to Edwin Locke and Gary Latham, the leaders of Goal Setting Theory
(1990), the goal is what an individual consciously trying to achieve. The
scientists claim that goals tend to affect the behavior of the individual and direct
attention and action. The theory suggests that challenging goals mobilize energy,
lead to higher effort and increase persistent effort (F.C Lunenberg “ Goal-‐Setting
Theory of Motivation”). Moreover, the theory proposes that having the certain
set of goals will motivate the individual to perform at the level required to
achieve the goals. Accomplishment of the goals may lead to further motivation to
perform better, and failure to achieve the goals can lead to a decrease of the
motivation of the individual.

12
It is very important to consider that implemented under right conditions, a Goal-‐
setting theory can be a powerful technique that will help the management to
motivate their employees into reaching the certain targets (2011., F.C Lunenberg
“Goal-‐Setting Theory of Motivation; Implications for Practice”). DuBrin (2012),
Greenberg (2011) and Newstrom 2011 have proposed the following
specifications to the theory in order to improve motivation and performance:
ü Goals need to be specific
ü Goals must be difficult but attainable
ü Goals must be accepted
ü Feedback must be provided on goal attainment
ü Goals are more effective when they are used to evaluate performance
ü Deadlines improve the effectiveness of goals
ü A learning goal orientation leads to higher performance than a
performance goal orientation
ü Group goal-‐setting is as important as individual goal-‐setting
According to DuBrin, Greenberg and Newstrom these aspects are crucial in
improving the employee performance and keep them motivated for further
improvement.
Without doubts, Latham and Locke provide a clear and effective theory of
motivation, which emphasizes an important relationship between the goals,
motivation and performance. The theory outlines the crucial significance of
stimulating employees by setting certain goals in order to achieve the
improvement in employee performance in selling certain menu items. Even
though not all the aspects of the theory have been followed throughout the
implementation of the financial incentive, experiment and research rely, to a
large extent, on the propositions of the Goal-‐Setting Theory.
Based on the theories of motivation, the following hypotheses were developed
by the author:
Hypothesis 1: The personnel should be motivated to put an effort to
improve their performance in order to reach the target and get the bonus

13
Hypothesis 2: In order to be motivated the employees should perceive the
financial incentive program as fair towards each employee in the company
Hypothesis 3: The personnel is motivated when the goals set by the
management are clear, transparent, challenging but attainable
4. Methodology and Material
This section will consist of two parts, which are the following:
1. Experiment; New FOH (front of the house) Financial Incentive
2. Hard Rock Café Helsinki Staff Survey
Each section will explain the details of exact methods that were utilized by the
author.
4.1 Experiment; New FOH (front of the house) Financial Incentive
The operations manager Keith Thompson created the financial incentive
program at the Hard Rock Café Helsinki. The author also contributed to the
creation of the program. The financial incentive program was created in order to
improve the employee performance and improve the sales of the certain items
on the Menu such as Cocktails, Desserts, Sides and Add-‐ons (additional). After a
detailed analysis of the sales statistics of each Front of the House employee
(servers and bartenders), the management came up with the following model of
a financial incentive program, which was introduced on the 1st of July 2015:
The incentive was based on Targets for each item type, measured as a
percentage of the employee’s total sales over a monthly period. As everything
was taken as % of the individual’s sales mix, it was supposed to make the
conditions fair towards everyone.
Under these conditions if a staff member reached the target percentage, their
prize was a “cash” bonus added to their paycheck. The bonus amount awarded
was a percentage cut of the employee’s total monthly sales for that particular
item type.
The item targets and the bonus % associated with them were as follows:
For Servers:
1. 5% Desserts= 5% bonus
2. 10% Cocktails and Special Coffees = 10% bonus
3. 2% Add-‐ons % Sides= 5% bonus

14
4. 3% Add-‐ons % Sides= 10% bonus
For Bartenders:
1. 5% Desserts= 10% bonus
2. 25% Cocktails and Special Coffees= 10% bonus
In other words, an example of the financial incentive program in action is
presented below:
If Linda’s total sales in June were 30000e and desserts sales made up 1500 e of
that, she hit the 5% dessert target and received a bonus of 75 euros (5% of
1500e). If she also sold 3000e worth of cocktails and special coffees in June, she
would also get a bonus of 300e (10% of 3000e) as well.
The management team of the Hard Rock Café Helsinki was fully prepared to help
and advice every employee in the technique of suggestive selling and
recommending the items. The managers were sure that by practicing the
upselling techniques, the front of the house employees would manage to increase
the sales in the key areas and make some extra money on top of their regular pay
checks.
With the assistance of the operations manager/ the manager responsible for the
incentive, Keith Thompson (July 5th, 2015), the author got the sales performance
of the employees for two months before the implementation of the incentive
program (May and June). The sales for mix May and June is presented below:
Table 1: Sales Mix May 2015
Employee Dessert
Sales as % of total sales
Cocktails/Sp.Coffees as % of total sales
Add Ons/Sides as % of total sales
Server 1 5.78 % 3.67% 1.28% Server 2 4.05% 6.09% 1.41% Server 3 3.29% 4.62% 1.28% Server 4 4.44% 5.50% 1.75% Server 5 4.36% 5.88% 1.10% Server 6 2.13% 3.05% 0.78% Server 7 4.18% 6.53% 2.14% Server 8 3.45% 6.63% 1.18% Server 9 3.96% 5.60% 1.37%

15
Server 10 3.91% 5.22% 2.86% Server 11 4.90% 3.36% 1.03% Server 12 3.17% 2.85% 1.67% Average 3.97% 4.92% 1.49% Bartender 1 3.17% 16.67% Bartender 2 4.29% 18.46% Bartender 3 3.35% 14.81% Bartender 4 3.52% 7.19% Bartender 5 3.64% 20.18% Bartender 6 2.64% 14.71% Average 3.43% 15.33% Table 2: Sales Mix June 2015
Employee Dessert Sales as % of total sales
Cocktails/Sp.Coffees as % of total sales
Add Ons/Sides as % of total sales
Server 1 3.46% 4.71% 1.63% Server 2 5.54% 5.39% 1.53% Server 3 2.94% 4.95% 1.47% Server 4 4.59% 6.22% 1.86% Server 5 3.80% 5.28% 1.24% Server 6 0.00% 2.75% 1.01% Server 7 4.05% 5.93% 2.25% Server 8 5.89% 5.69% 1.71% Server 9 5.72% 5.48% 1.80% Server 10 3.21% 4.75% 2.56% Server 11 4.17% 5.85% 1.44% Server 12 2.88% 4.52% 2.21% Server 13 4.25% 5.28% 1.43% Average 3.85% 5.13% 1.72% Bartender 1 1.84% 27.42% Bartender 2 2.23% 22.36% Bartender 3 3.00% 16.93% Bartender 4 7.48% 8.53% Bartender 5 2.93% 25.65% Bartender 6 3.29% 20.10% Average 3.46% 20.16%
Utilizing the data obtained from the management team of Hard Rock Cafe
Helsinki, the author analyzed the dynamics of the sales of the employees in the
key areas (Cocktails, Desserts, Special Coffees, Add-‐ons and Sides) before and
after the implementation of the New FOH (front of the house) Financial Incentive

16
program. In order to be more precise, the author looked at the sales mixes within
a 4-‐month period, which was two months before the incentive (May and June)
and two months after the incentive (July and August). The sales mix for July and
August will be presented in the section “Results”. The author will analyze the
sales mixes for four months comparing the sales results in key areas before and
after the incentive in order to define whether the sales of certain items have
improved or not. The results will show how efficient the New FOH Financial
Incentive was, and whether it actually helped to improve the employee
performance on selling certain menu items.
The researcher created graphs corresponding to the results obtained from the
HRC employee sales mix provided by the management team for the months of
May, June, July and August of the year 2015. Moreover, in order to check the
reliability of the results, the author analyzed and compared the sales mix for the
same months of the year 2014 in order to possess the control group for the
experiment. The Total sales figures for the period May-‐August 2014 are
presented below (Musto Roope; Sales and Marketing Manager HRC Helsinki;
August 1st, 2015), In order to keep confidential nature of the company’s business
operations the numbers in the table are presented as a ratio of the mean. The
mean number was taken as 100.
Table 3. Total Sales in Euros May-‐August 2014
May 2014 June 2014 July 2014 August 2014
Total Sales in
€
108
97.34
87.7
107.05
Mean= 304883 euros =100
4.2 Hard Rock Café Helsinki Staff Survey
In addition to the introduction of the New Financial Incentive, the researcher
conducted a survey in order to define the attitudes of the employees towards the
new financial incentive program and find out whether or not the workers were
motivated to reach the targets set by the management team. The survey, which

17
consists of 7 questions, was based on the motivational theories, which were:
Vroom’s Expectancy Theory, Adam’s equity theory and Locke’s and Latham’s
Goal-‐Setting Theory. The researcher decided to conduct the survey in order to
supplement the experiment. The questionnaire that was handed out to the
employees of the front of the house is presented below:
The answers to the questions should be answered Yes or No:
1. Do you find the New Financial Incentive fair towards everyone?
2. Do you feel that your efforts in reaching the targets will be/are being
appreciated by the management team?
3. Do you find the reward/outcome valuable for you?
4. Does the expectation of the bonus/reward motivate you into higher
performance?
5. Do you find it challenging to reach the bonus related targets?
6. Do you feel that the goal can be achieved with extra effort?
7. Do you feel motivated to achieve the target?
In total, 15 employees of the front of the house participated in the survey. The
answers were analyzed in detail by the author and are presented in the
“Results” section.
5. Results
The “Results” section consists of 2 parts, the first part is describing monetary
results of the program, and the second part is describing the results of the
survey.
5.1 Monetary Results of the Incentive Program
The graphs created by the author based on the sales reports helped to analyze
the dynamics of the sales within a 4 month period (2 months before the
incentive, and 2 months after its implementation), to identify decrease,
stagnation or improvement of the sales in the key areas and the employees
performance in terms of their sales in the same areas.
Firstly, the author analyzed the sales reports for the months July and August,
which were the months being monitored by the management and the author

18
after the implementation of the New FOH (front of the house) Financial incentive
program on the 1st of July 2015.
The Sales Reports for the months July and August are presented below
(Thompson Keith; Operations Manager HRC Helsinki; August 9th, 2015):
Table 4: Sales Mix July 2015
Employee Dessert Sales as % of total sales
Cocktails/Sp.Coffees as % of total sales
Add Ons/Sides as % of total sales
Server 1 3.66% 4.98% 1.24% Server 2 3.50% 5.46% 1.36% Server 3 2.56% 3.01% 1.26% Server 4 4.64% 6.53% 2.47% Server 5 2.98% 2.63% 1.46% Server 6 4.16% 5.39% 0.98% Server 7 3.60% 5.72% 1.65% Server 8 3.53% 3.87% 1.79% Server 9 3.57% 4.17% 2.20% Server 10 4.88% 4.09% 1.24% Server11 3.84% 4.63% 1.86% Server 12 3.62% 3.79% 2.33% Average 3.41% 4.21% 1.46% Bartender 1 1.53% 22.55% Bartender 2 3.36% 17.15% Bartender 3 3.32% 21.47% Bartender 4 2.85% 24.44% Bartender 5 4.27% 27.14% Bartender 6 3.40% 15.55% Average 3.12% 21.38%
Table 5: Sales Mix August 2015 (Thompson Keith; Operations Manager HRC
Helsinki; September 9th, 2015)
Employee Dessert Sales as % of total sales
Cocktails/Sp.Coffees as % of total sales
Add Ons/Sides as % of total sales
Server 1 4.05% 4.98% 1.63% Server 2 6.03% 7.91% 1.24% Server 3 4.30% 3.67% 1.58% Server 4 4.58% 10.03% 1.85% Server 5 3.39% 4.58% 1.14% Server 6 4.52% 6.79% 1.49%

19
Server 7 3.92% 6.71% 1.92% Server 8 3.45% 6.29% 2.26% Server 9 4.58% 5.16% 1.09% Server 10 3.16% 4.74% 1.42% Server11 3.75% 5.38% 1.60% Server 12 4.48% 4.32% 1.53% Server 13 3.90% 6.38% 2.53% Average 3.50% 5.07% 1.30% Bartender 1 4.67% 24.69% Bartender 2 4.97% 23.72% Bartender 3 4.85% 26.00% Bartender 4 4.56% 18.58% Bartender 5 2.03% 30.64% Bartender 6 3.23% 21.85% Average 4.05% 24.25%
The sales reports present the sales of all the employees of the Front of the House
(servers and bartenders) both together and individually displaying their the % of
the sales in the key areas as an average together and for each single employee.
The author has added one more aspect to the sales reports, “Total sales”,
standing for total sales in euros for each department for the months May, June,
July and August. This was done in order to expand the research and analyze the
dynamics of the sales not only in the key areas, but also the dynamics of the total
amount of the business in the restaurant within that certain time period. This
helped to emphasize the connection between the dynamics of the sales in the key
areas and the sales in total.
The results of the New FOH ( front of the house) Financial Incentive in terms of
Sales dynamics are presented below and divided into 2 departments, the
Restaurant and the Bar:

20
Restaurant
Total Sales of the company in the restaurant department from May to August are
presented in the graph below.
Figure 2: Total sales in Euros for the period May-‐August 2015
The graph of the Total Sales showed that there was a drastic growth in sales
during July (comparing to the sales in June) just after the Financial Inventive
program was introduced by the management team. Even though the
implementation of the program continued during August, the results showed the
decrease in total sales compared to the sales in July. According to the graph it
appeared to be that June and July were the least successful months in terms of
sales for the company.
0
50000
100000
150000
200000
250000
300000
350000
May June July August
Total Sales in €
Total Sales in €
Linear (Total Sales in €)

21
Figure 3: Average Dessert Sales as % of Total Sales, May-‐August 2015
Despite the fact the total sales of the company had an increase in July, the
average dessert percentage of total sales was at its lowest in the same month.
Moreover, it kept decreasing throughout May, June and July, decreasing from
3.97% dessert sales as percentage of total sales in May to 3.41% dessert sales of
total sales in July after the incentive program was introduced on the 1st of July.
Unlike the total sales’ drop in August compared to July, the dessert sales
percentage increased from 3.41% dessert sales of total sales to 3.50% dessert
sales of total sales.
3.10% 3.20% 3.30% 3.40% 3.50% 3.60% 3.70% 3.80% 3.90% 4.00% 4.10%
may june july august
Average desserts as %
av. Desserts as %
Linear (av. Desserts as %)
22
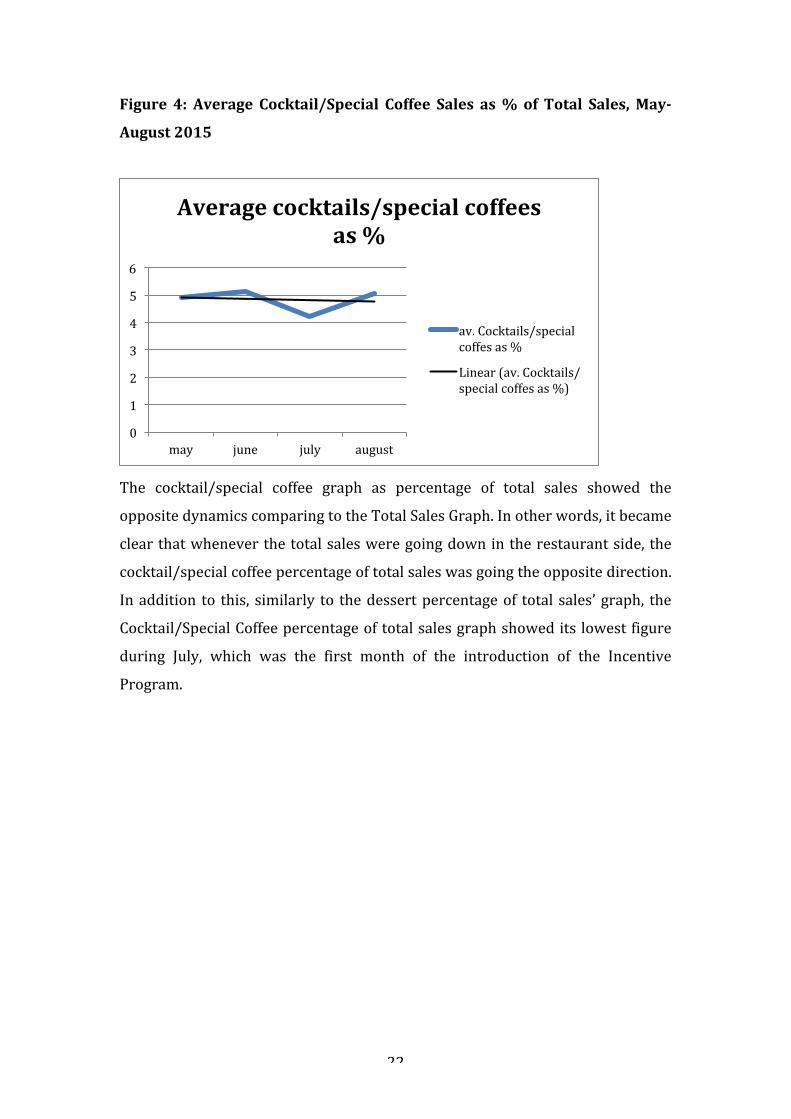
Figure 4: Average Cocktail/Special Coffee Sales as % of Total Sales, May-‐
August 2015
The cocktail/special coffee graph as percentage of total sales showed the
opposite dynamics comparing to the Total Sales Graph. In other words, it became
clear that whenever the total sales were going down in the restaurant side, the
cocktail/special coffee percentage of total sales was going the opposite direction.
In addition to this, similarly to the dessert percentage of total sales’ graph, the
Cocktail/Special Coffee percentage of total sales graph showed its lowest figure
during July, which was the first month of the introduction of the Incentive
Program.
0
1
2
3
4
5
6
may june july august
Average cocktails/special coffees as %
av. Cocktails/special coffes as %
Linear (av. Cocktails/special coffes as %)

23
Figure 5: Average Add-‐on/Side Sales as % of Total Sales, May-‐ August 2015
According to the results obtained from the sales report, the add-‐ons/sides
percentage of total sales reached its highest point in June despite the fact that the
Total Sales of the company were at it’s lowest in June. Starting from June the
Add-‐ons/Sides percentage of total sales dropped significantly. July showed the
results of 1.46% add-‐ons/sides sales of total sales, while August reached even a
lower figure of 1.30%, which was a lot lower than the June’s number of 1.72%
add-‐ons/sides of total sales.
Bar
Total sales of the company in the bar department from May to August are
presented in the graph below.
0 0.2 0.4 0.6 0.8 1
1.2 1.4 1.6 1.8 2
may june july august
Average add-‐ons/sides as %
av. Add-‐ons/sides as %
Linear (av. Add-‐ons/sides as %)

24
Figure 6: Total Sales in Euros for the period May-‐August 2015
The graph of total sales in euros in the bar department showed the same pattern
as the graph of the total sales in the restaurant side. The results showed that July
was the most successful month in terms of sales for the company’s bar
department, reaching 69193 euros, while June has had the lowest sales of only
38981 euros. Even though after the implementation of the incentive program,
the sales in the bar department grew during July, August did not show
sustainability of the progress with its sales dropping from July’s 69193 euros to
42830 euros.
Figure 7: Average Dessert Sales as % of Total Sales, May-‐August 2015
0
10000
20000
30000
40000
50000
60000
70000
80000
May June July August
Total Sales in €
Total Sales in €
Linear (Total Sales in € )
0 0.5 1
1.5 2
2.5 3
3.5 4
4.5
may june july august
Average desserts as %
av. Desserts as %
Linear (av. Desserts as %)

25
The results for dessert percentage of Total Sales showed that the most
unsuccessful month in terms of sales was July, when the percentage of desserts
sold as percentage of total sales was 3.12 %. This graph showed the same
tendency as the dessert sales percentage of total sales in the restaurant side,
which had the lowest figure in July and the increase in August. The dessert sales
percentage increased from July’s result of 3.12% to 4.05% in August.
Figure 8: Average Cocktail/Special Coffee Sales as % of Total Sales, May-‐
August 2015
The results of Cocktails/Special Coffees sales as percentage of total sales were
the only ones showing positive tendency before and throughout the
implementation of experiment. The percentage of this particular key area’ sales
grew in a sustainable way, reaching an average 24.25% of Total Sales, in August
while the May’s Result was 15.33%. The improvement of sales percentage in this
particular key area in the whole Front of the House was the most significant.
In order to be able to get the full understanding of the results of the Financial
FOH Incentive Program, the author decided to take a look not only at the total
sales and percentages of total sales in the key areas, but at the absolute numbers
(sales in Euros) as well.
0
5
10
15
20
25
30
may june july august
Average cocktails/Special coffees as %
av. Cocktails/special coffees as %
Linear (av. Cocktails/special coffees as %)

26
The researcher thought that if the dynamics of the sales percentage of total sales
in the key areas showed certain results, it was not necessary that the absolute
numbers were going to show the same dynamics. Therefore, the sales of the key
area items are presented below, and are divided into 2 departments as well. In
order to keep confidentiality of the company’s business operations, the numbers
represented in the table are not real sales in Euros, but they are presented as a
ratio of May figures. The sales in May, in their turn, were taken as 100 for all the
key areas.
Table 6: Sales in the Key Area in the restaurant department; May-‐August
2015
Sales May June July August
Desserts 100
87.05
101.89
94.48
Cocktails/Special
Coffees
100
91.58
98.41
101.24
Sides/Add-‐ons in 100
100.8
128.1
94.9
The absolute numbers representing the sales in the key areas showed different
dynamics from the sales percentage of total sales. Sales of the desserts in the
restaurant department were the highest in July, which was the first month of the
implementation of the program. August showed a slight decrease from 101.89 in
July to 94.48 in August. Even though the sales in August decreased, both July and
August still showed higher sales than May and June altogether.
The sales of Cocktails/Special Coffee showed its highest results in August, two
months after the implementation of the program. Just like the dynamics of total
sales in the restaurant side, the sales in this particular key area showed an
increase in July to 98.41 from June’s 91.58. In fact, the sales of the
Cocktails/Special Coffees showed an improvement since the implementation of
the program with the sustainable progress.
The sales of Sides/Add-‐ons showed a sustainable increase throughout May, June
and July with an improvement from 100 in May to 128.1 in July. August though
showed a drastic decrease in sales from July’s number 128.1 to August’s 94.9.

27
Bar
The numbers in the table below are presented as a ratio of May sales, which
were taken as 100.
Table 7: Sales in the Key Areas; May-‐August 2015
Sales in Euros May June July August
Desserts in
Euros
100
60.32
98.12
84.05
Cocktails/Special
Coffees in Euros
100
84.20
158
111.31
The Dessert Sales in the bar department did not show the same tendency as the
sales percentage of total sales. According to the results obtained, May and July
showed the lowest percentage of dessert sales as percentage of total sales,
whereas the actual Dessert sales showed the highest numbers for the same
months; May and July, which were 100 in May and 98.12 in July.
Unlike the Dessert Sales, the Cocktails/Special Coffees Sales in the Bar
department showed the same tendency as the results of Total Sales in Euros in
the Bar. The results showed the overall increase in sales of cocktails and special
coffees for the months July and August after the implementation of the financial
incentive. July showed a particularly drastic increase in sales, reaching 158
comparing to June’s 84.20 sales.
5.2 Hard Rock Café Helsinki Staff Survey
The responses of the participants of the survey were divided according to their
departments: Bar and Restaurant.
The chart showing the results of the servers’ responses is presented below:

28
Figure 9: The Survey answers of the staff; Restaurant Department
The results showed that to the first question whether or not the employees
(servers) of the front of the house found the New FOH Financial Incentive fair
towards each employee, the majority workers answered no. To be precise, out of
10 servers asked, only 2 of them answered positively and found that the financial
incentive program was fair towards everyone, which was only 20% of the
restaurant department respondents. 80% of the servers thought that the
Financial Incentive was not objective.
Question 2, which asked whether or not the servers felt that their efforts to reach
the targets were being or would be appreciated by the management team, had
more positive responses. In fact, 6 out of 10 servers that participated in the
survey thought that their efforts in reaching the targets were or would be
appreciated by the managers. Only 40 % of respondents answered negatively to
this question.
Question 3, which checked whether or not the reward/bonus was valuable for
the employees, had the same response as question 2. 60% of respondents found
the reward valuable for them, while 40% of the servers saw no value in it.
Question 4, which asked whether or not the expectation of the bonus motivated
the employees into higher performance, had the most controversial results
among the servers than any other question. The results obtained were the
following: 50% answers were positive and 50% of the answers were negative,
dividing the servers into two groups: those who were motivated to improve their
performance by the expecting a bonus, and those who were not.
0 1 2 3 4 5 6 7 8 9
Num
ber of respondents
Answer Yes
Answer No

29
Question 5 asked whether or not the targets set by the management team were
challenging to reach from the servers’ perspective. To this particular question
the researcher got the response that 80% of the participants said that the targets
were challenging and 20% stated that they didn’t find them challenging to reach.
With the help of question 6 the researcher tried to find out whether or not the
servers thought that it was possible to reach the target with an extra effort. The
answers to this question gave the following results: 7 out of 10 servers
participated said that the goal could be achieved with an extra effort, whereas 3
servers thought that even with an extra effort it was not possible to reach the
goal.
The final question 7 was designed to summarize the whole survey and outline
the main point of it. The servers were supposed to answer whether or not they
felt motivated to reach the target set by the management in the financial
incentive program. 60% of the respondents answered positively to this
particular question confirming the positive effect of the program, while 4 (40%)
of the servers said that the new financial Incentive did not motivate them to
reach the targets set in the key areas of the sales.
Bar
The bar department had considerably less employees than the restaurant side.
Therefore, the chart below presents the responses of the five bartenders that
participated in the survey:

30
Figure 10: The Survey Answers of the Staff; Bar Department
The employees of the bar department were asked the same 7 questions as the
restaurant department employees. The chart shows that the respondents could
only answer Yes or No to the questions.
According to the chart, the answers to the first question showed that out of five
bartenders three of them thought that the New FOH (front of the house)
Financial Incentive Program was unfair towards all the employees, which was 60
% of the employees of the bar department. Only 40% of the bar workers saw the
incentive program as fair.
Question 2 gave the results of 80% of respondents answering positively,
meaning that they felt that their efforts in reaching the targets were being
appreciated by the management team. Only 1 bartender out of 5 that
participated answered to this certain question negatively.
Question 3, which asked whether or not the bartenders found the reward being
valuable for them, 4 out of 5 bartenders answered positively, stating that the
reward was valuable for them. 1 bartender answered negatively to this question.
Question 4 asked whether the expectation of the bonus was motivating the
employees to a higher performance or not. 60% (3 out of 5 bartenders) of the
bartenders stated that the expectation of a bonus did not motivate them into a
higher performance, which meant that only 40% (2 out of 5 bartenders) were
0 0.5 1
1.5 2
2.5 3
3.5 4
4.5 Num
ber of respondents
Answer Yes
Answer No

31
motivated to improve their performance by the financial bonus set by the
management.
Question 5 was designed by the researcher in order to find out whether or not
the employees thought that reaching the targets was challenging for them.
According to the results, 60 % of the bartenders found the targets challenging to
reach, while 40% did not think that it was challenging at all to achieve the level
of sales set by the management.
Question 6 was asking the participants whether or not they thought that the
targets could be reached by putting in an extra effort. This question gave exactly
the same results as Question 5, meaning that 60% of respondents said that the
goal could be achieved with an extra effort, while 40% of the bartenders thought
that putting an extra effort would not help them to achieve the desirable result.
And the last question, but not the least question was asking the employees if they
felt motivated to reach the targets. The researcher got a result of 80% of
respondents answering to this particular question negatively. Only 1 bartender
out of 5 said that he/she felt motivated to reach the targets set by the
management team.
6. Discussion and Analysis
According to the researcher and management team of the Hard Rock Café
Helsinki, the New Financial Incentive’s outcome depended greatly on how well
the aspects of the motivational theories have been taken into consideration and
implemented in the real-‐life example. The Vroom’s Expectancy Theory, Adam’s
Equity Theory and Locke’s and Latham’s Goal-‐Setting Theory have been selected
on the basis of relevance to the actual research. The propositions of the theories
and the outcome of the New Financial Incentive program and HRC Staff Survey
are brought under the analysis in this section of the thesis. The validity of the
hypotheses developed by the author is examined in this section as well.
6.1 Expected Results versus Obtained Results
As it has been mentioned earlier the whole experiment implemented at the Hard
Rock Café Helsinki, called The New FOH (front of the house) Financial Incentive
was aimed at increasing the sales in the key areas of the business through
improving employee productivity and boosting their motivation. The creation of

32
the experiment was partially based on the three motivational theories, which
were Vroom’s Expectancy Theory, Adam’s Equity Theory and Locke’s and
Latham’s Goal Setting Theory. The main concepts of the theories were described
in the part “Theoretical Framework” in detail. In order to be able to support the
experiment with more qualitative data, researcher decided to conduct a survey
among the staff of the front of the restaurant (restaurant and bar department)
and investigate their opinions towards the new financial program.
Therefore, the author and the management team of the HRC Helsinki expected
certain outcomes from the experiment. According to Vroom’s Expectancy Theory
of Motivation, the fact that the employees were to be given a certain financial
bonus if the reached the required percentage level of sales, was supposed to
make them want to improve their performance and put additional effort in to
reaching the target. Equity Theory, the concept of which was about fairness and
equal ratio between the input of the employees and the outcome they were
getting was supposed to improve the performance of the workers by making
them understand that the higher their input was, the bigger their bonus would
be. The aspect of fairness was also supposed to play an extremely important role
in the Financial Incentive Program, since before implementing it, the
management of the HRC Helsinki was trying to make sure that the program was
completely fair towards every single employee and the distribution of the
bonuses was equal among the workers. The third theory that the experiment was
based on was Locke’s and Latham’s Goal Setting Theory, which claimed that
when an individual had a goal, it directed his or her actions and behavior
because the individual wanted to reach the goal. The goals set by the
management though had to be challenging but attainable at the same time, which
the management team of HRC Helsinki thought Financial Incentive Program’s
goals were.
After the introduction of the Financial Incentive Program, the management team
of Hard Rock Café Helsinki expected that the sales would increase and reach the
targets set by the management as a percentage of total sales. According to the
results obtained, the key area items’ as percentages of total sales did not show
positive or sustainable dynamics.

33
Due to this result the researcher decided to analyze the results of each item
category separately. First, the author took a look at the results of desserts as
percentages of total sales for the Bar and the Restaurant. According to the terms
of the Financial Incentive Program, the employees were supposed to reach the
target of 5% of dessert sales as percentages of total sales to get certain bonuses.
However, when the author analyzed the results, they showed the following
dynamics:
Figure 11: Dessert Sales as Percentage of Total Sales; Bar and Restaurant
Department; May-‐August 2015
Even though July was the first month of the implementation of the program, both
departments showed a drastic decrease of the dessert sales as percentage of
total sales. In fact, July, was the only month showing extremely low figures
during the whole period analyzed (May-‐August), which completely failed the
management team’s expectations. According to the sales report for July, there
was not even a single employee out of 15, who had reached the target during the
first month of the Incentive program, which might have had a negtaive effect on
the motivation of the workers. Even though July was a failure of the experiment,
the second month of the implementation of the incentive program showed better
results, indicating an increase in both departments. Hovewer, the avreage
percentage of dessert sales as percentage of total sales increased for the month
August, the sales report for August identified only one server reaching the target
of 5% set by the management team. The results of the second month of the
0 0.5 1
1.5 2
2.5 3
3.5 4
4.5
may june july august
% of Total Sales
Month
Desserts as % of Total Sales
Restaurant
Bar

34
program were rather alarming for the management team because they showed
how challenging it actually was to reach the targets for the employees. Tha fact
that after two months after the introduction of the program, only one employee
had reached the target could decrease the level of employee motivation and
make them think that it was simply too challenging to reach the target. At the
same time, a slight improvement during August could mean that employees
needed time to adjust to the program’s terms and fully understand what they
were supposed to do and where to put an effort to succeed and get the bonus.
Another key area, where the sales were supposed to be improved according to
the expectations of the management team was Cocktals/Special Coffees. In order
to be able to get the full picture of the dynamics of the Cocktails/Special Coffees,
the author has combined the results for both departments the Restaurant and
the Bar and obtained the following dynamics:
Figure 12: Cocktails/Special Coffees Sales as Percentage of Total Sales; Bar
and Restaurant Department; May-‐August 2015
For this certain key area the management team had set different goals for both
departments; the servers were supposed to reach the sales of 10%
Cocktails/Special Coffees of Total Sales, while bartenders were supposed to
reach the sales of 25% Cocktails/Special Coffees of Total Sales in order to get the
bonuses.
When the researcher and the management team received the results of the
Financial Incentive program, they were confused by how different the figures
0
5
10
15
20
25
30
may june july august
% of Total Sales
Month
Cocktails/Special Coffees as % of Total Sales
Restaurant
Bar

35
and the dynamics were. It could be noticed that just like the sales percentage of
percentge of total sales for the Desserts category in both departments, July again
showed the lowest figure for the Cocktails/Special Coffees key area in the
restaurant department. The dynamics of average percentage numbers in the
restaurant department was very slow in general, not showing a lot of
improvement since the program was introduced. On the contrary,
Cocktails/Special Coffees sales percentage dropped during the first month of the
introduction and only slightly improved during August, showing undesirable
results for the management. In addition, it was very important to notice that the
average sales percentgae of total sales figures were considerably lower than the
target set by the management. So, the management set the target of 10% to be
reached by the employees, while the average percentage numbers for May and
June were 4.92% and 5.13% respectively in the restaurant department.. That
gave the researcher a thought that the target were simply too high to reach and
completely unattainable for almost all employees. The sales reports for the
months May and June were sent to all the employees together with the terms of
the Financial Incentive Program before its introduction, meaning that all the
workers could see their personal avreage percentage numbers and the target set
by the management, which was almost double the average percentage number
before the programs. Therefore, the staff of the restaurant side could have
simply thought that it was not possible or extremely hard to reach the target and
it was not worth trying. It could have been a very realistic thought of the staff
since the average percentage numbers after the implementation of the program
were the following: 4.21% and 5.07% for July and August respectively, indicating
no improvement comparing to the months before. There was only one employee
in the restaurant department, who was able to reach the target of 10% and
achieved the number of 10.03% in August, while the rest of the servers were
extremely far from the target. According to Locke’s and Latham’s Goal Setting
Theory, the goal set by the management have to be difficult but attainable,
otherwise the targets or the whole program might have a demotivating effect on
the staff.
The Bar depratment, in its turn, has shown rather positive dynamics, indicating
the sustainable growth throughout the four-‐month period taken for analysis ,

36
and improvement after the implementation of the Financial Incentive Program.
Comparing the average percentage number in May, which was 15.33%, to the
avreage percentage in August, which was 24.25%, the obvious improvement has
occurred in the key area, which boosted the performanve of the employees. As it
has been mentioned earlier the target for the Bar department was 25%, which
was obviously higher than the restaurant side, because bartenders tend to sell
more alcohol rather than food. Despite the fact that the target was higher, it was
not as difficult to be reached as the target for the same key ares set by the
management team. According to the sales reports provided by the management
team for the month June, there were already 2 employees out of 5 in total in the
bar, who reached 25% sales of cocktails/special coffees of total sales. In other
words, even before the implementation of the Financial Incentive Program, it
was clear that the target was challenging but possible to reach, which could have
positively affected the employee motivation as the sales reports for May and June
were sent to bartenders as well before the introduction of the program.
Therefore, one bartender reached the target of 25% in July and two bartenders
accomplished it in August. Nevertheless, Cocktails/Special Coffees in the bar
department was the only key area, which sales that had been improved since the
introduction of the Financial Incentive Program ans showed growth throughout
both months of the program’s functioning. The author and the management team
proposed several options explaining the improvement. One of them was that Bar
Department employees did get motivated by the Financial Incentive Program
more than the Restaurant Department employees due to the fact that they were
more passionate about making the cocktails and selling them rather than servers
who were not engaged into the creation of them. Vroom’s Expectancy Theory
could explain that in the way that bartenders felt that if they were going to put
more effort, they were going to improve their performance, if they were going to
improve their performance, they were going to get a financial bonus and
managemnet team’s recognition. Another explanation could simply be more
attainable targets set by the management team for the bar department rather
than for the restaurant department, since even before the implementation of the
program, the sales reports showed that some employees had already reached the
targets and some of them were close to reaching them, which made the whole

37
experiment more realistic. Moreover, bartenders could have had better chances
to succeed in upselling the cocktails to the guests due to the deeper knowledge of
the drinks. It has always been compulsary for the staff at the HRC Helsinki to
know the recepies of the food as well as the drinks, but it was obvious that
bartenders had posessed deeper and better knowledge of the drinks and the
servers had posessed deeper knowledge of food items. That could have given
bartenders better chances for successful suggestive selling and recommendation
of the items and, as a result, greater cocktails’ sales.
The last key area that was involved in the Financial Incentive Program was
Sides/Add-‐ons sales as percentage of total sales. The sales of side dishes and
additional items to the food items have always been the most challenging and
difficult to improve. The price of them has never been high, varying from 1.50
euros for the addittional dressing to 5.95 euros for side ceasar salad.
Neveretheless, guests at the HRC Helsinki seemed to have negative response
towards the purchase of any sides or add-‐ons after paying rather high price for
food and drinks. Management team hoped that with the help of the Financial
Incentive Program the staff could improve their suggestive selling and
recommend more add-‐ons or sides to the guests, which would improve the sales
of that certain key areas as percentage of total sales. After obtaining all the
results, the researcher discovered the following dynamics:

38
Figure 13: Add-‐ons/Sides Sales as Percentage of Total Sales; Restaurant
Department; May-‐August 2015
According to the graph, the add-‐ons/sides sales as percentage of total sales
dropped after the Financial Incentive Program was introduced in July, and it
continued to decrease throughout the second month of functioning of the
program. Judging by the terms of the program, the employees were supposed to
reach the target of 2% in order to get a 5% bonus or 3% target in order to get
10% bonus of the sales in the key area.
As it has been mentioned earlier, sides and add-‐ons were never very expensive
and even if the employee reached the target, the bonus that he or she was
supposed to get would not be very big. Neveretheless, there were 5 employees
who could manage to reach the target of 2% and get 5% of the bonus. The
decrease in avreage percentage of total sales could happen due to the fact that
the bonus that the employees were to receive was simply too insignificant
comparing to the rest of the key areas and the bonus they could get there due to
higher prices of those items. For example, a bartender who reached the target in
the area of cocktails/special coffees in August got 217 € bonus, while a server
who reached the target in the areas of add-‐ons/sides got a bonus of 18 €.
According to Vroom’s Expectancy Theory, an individual had to value a reward in
order to choose a certain behaviour. In other words, the outcome would be
positively valent if the indivudal preferred attaining it to not attaining. In this
case, the reason of the negative dynamics of the add-‐ons/sides sales as
0 0.2 0.4 0.6 0.8 1
1.2 1.4 1.6 1.8 2
may june july august
Average add-‐ons/sides as %
av. Add-‐ons/sides as %

39
percentage of total sales could be that the servers did not find the bonus
attractive or valuable enough for them to put an extra effort to reach the target.
It was also very important to notice that the Financial Incentive Program for that
particular area was introduced only in the restaurant side even though the bar
department was also selling food items. The program should have been
introduced for both departments equally giving the employees equal chances to
get a bonus.
6.2 The Percentage numbers versus the Absolute numbers; Comparing the
Dynamics
According to the analysis of the percentage number dynamics, Financial
Incentive program did not cause an improvement of the sales in the key area as
the percentage of total sales. As it has been mentioned before, bar department
was the only department showing an improvement after the introduction of the
program in only one key area; cocktails/special coffees.
Even though Financial Incentive program was based on the percentage numbers,
the author decided to look into the absolute numbers, which were the actual
sales in Euros for the period from May to August.
While implementing the analysis, the researcher discovered that the actual sales
in Euros showed a different dynamics from percentage numbers. The results
indicated a similar pattern between the Total Sales graphs for both departments
and The Sales in Euros numbers for both departments. The figures showed that
the sales have improved since the introduction of the program in all key areas in
both departments. Hence, some of the numbers in August were insifnificantly
lower than the numbers in May for the same key area. Interestingly enough, the
author discovered that July’s sales in Euros showed the opposite dynamics to the
percentage numbers for the same month. In other words, when July showed the
lowest percentage figures in 3 key areas out 5 for both departmetns, the same
month showed the highest figures in Euros. For example, the restaurant side
indicated the highest sales in July for desserts and Add-‐ons and sustainable
improvement in sales in Euros for cocktaiils/special coffees, while the
perecentage numbers for the restaurant side showed its lowest figure in July for
the Desserts and Cocktails/Special Coffees and even lower in August for

40
Sides/Add-‐ons. The bar department showed almost the same pattern with July
indicating the lowest percentage number for Desserts and almost the highest
number for the same month in sales in Euros. Cocktails/Special Coffees in the bar
department though showed the improvement in sales in Euros and in percentage
numbers.
Judging by the results, researcher became very concerned about the overall
design and terms of the financial incentive program, which was supposed to
improve the employee performance and boost the employee motivation. So,
while analyzing the results, the author came up with the idea to connect the
percentage numbers of total sales that were being measured by the management
team and the Total Sales numbers.
After the analysis of the Total Sales numbers, it became clear that July’s sales in
Euros were a lot higher than the sales for the rest of the months for both
departments. Even though the total sales in euros showed the best sales results
in July, it has been mentioned before that the same month showed the lowest
figures in percentage. After realising that the percentage results and total sales
numbers in Euros and sales in Euros in the key areas showed almost the
opposite dynamics, the researcher made a particular conclusion.
Even though the management team was trying to design the financial incentive
program to be fair and assess the real employee performance and conduct the
sales monitoring in the key areas, its design had one obvious mistake. It was
discovered and noticed that the more food items employees used to sell, the
more items from the key areas they were obliged to sell in order to reach the
target. Since the target was measured as the certainn percentage of total sales,
the higher the sales of the employee were, the more complicated and challenging
it was for him to actually reach the target. It explains the opposite dynamics of
the percenatge numbers and total sales numbers. It was also noticed by the
researcher that when the total sales started to drop in August after drastic boost
in July, the percentage numbers started to recover in 4 key areas for both
departments, except for Add-‐ons/sides. The percentage drop in the key area in
August could be explained by the fact that the total sales decreased, which meant
that less food items were sold, and add-‐ons/ sides could only be sold together
with the food items.

41
Judging by the analysis conducted by the researcher, there was a certain
connection establesd between the total sales, sales in euros in the key areas and
the percentage numbers in the key areas. The relationsip indicated the results of
the financial incentive program as unreliable and invalid in terms of actual
emploee performance due to the facts discovered during the obtained results’
analysis.
6.3 Disturbance of the experiment
As it has been mentioned in the section “Limitations”, July’s data might have
been disturbed by rather significant even happening during that month. The
event was called “Gymnastrada” (gymnastics competetition for all ages), and it
brough approximately 25000 people to Heslinki for the whole week in July. The
event brought an enormous wave of new customers, who needed to eat
somewhere where they could fit big groups of people. Hard Rock Café helsinki
had to experience the busiest week of the whole year during that time. The
restauant had to constantly take reservations of 60 people almost every day,
sometimes several times a day. Even though the author was working the entire
time of the “Gymnastrada”, she decided to take a look at the Total Sales for the
same period of time from the last year in order to be able to compare the
numbers and identify any kind of disturbance that may have occurred in 2015.
The numbers were the following:
Table 8: Total Sales in Euros May-‐August 2014 and 2015
Month Total Sales 2014 Total Sales 2015
May 329137 € 351005 €
June 296784 € 275544 €
July 267243 € 402066 €
August 326369 € 306734 €

42
According to the comparison of the results obtained for the year 2014 and 2015
for the same period of time and for both departments, it became obvious that
July’s data was disturbed significantly. There were slight differences in the
figures between the years 2014 and 2015 but July’s numbers for the year 2015
increased by almost 50%. There was no doubt that Gymnastrada influenced the
figure of Total Sales in July 2015.
However, Gymnastrada influenced not only the Total Sales Numbers but also the
pace the staff was working with. Since majority of the personnel was taking their
vacation during July, the situation with having enough employees working had
already been rather bad. Gymnastrada made it even worse putting the restaurant
into the position of operating completely understaffed, and servers and
bartenders working 10-‐12 hours every day within 8 days. It was obvious that
during that week, it was very hard for the staff to perform at their best, handling
80 customers at a time. Clearly, there was no time for suggestive selling or even
thinking of reaching any targets, the staff had no time to even get the dessert
menus to the guests or recommend any items. That situation could have
negatively influenced July’s percentage numbers and caused a drastic drop in
almost all the key areas. In addition to that, the fact that Gymnastrada was a
sport event did not make it any easier for the staff to be able to upsell the
alcoholic drinks or high on calories desserts. Moreover, the restaurant was
taking many reservations during that particular week using preodered menus
such as Golden, Platinum and Gold. Even though those menus did include
desserts in them, they were still counted in the system as ordinary food items.
So, if the server was to take that kind of reservation, it would be registered on his
or her card, which would mean that the server would only sell food items and
decrease his chances to reach the targets by increasing the total sales.
That is why the author considered that event important to mention during the
reserch. The event was one of the reasons why the management team decided to
extend the Financial Incentive Program for another month.

43
6.4 The attitude of the staff towards the Financial Incentive Program; HRC
Staff Survey
The decision to conduct the survey was made by the author in order to
investigate the overal attitude of the staff towards the experiment, and with the
help of the theories of motivation, find out whether the program improved
employee motivation and performance or had no impact on it. Even though the
results of the survey were divided into two departments: restaurant and bar, the
researcher made a decision to analyze them together.
When the results were obtained, the management team was especially shocked
to find out that 11 out of 15 front of the house employees thought that the
program was unfair towards each employee. During the process of the creation
of the experimental program, the management team was sure that they
considered all the drawbacks of the previous incentive programs and created the
one that was the most fair of them all. Clearly, they were wrong! The staff had
another opinion, which they expressed in the answers of the survey. Moreover,
the author as the part of the team had a perfect insight of the atmosphere inside
of it. Therefore, the staff was not afraid to express their honest opinion and say
that the program was very subjective and did not consider things like differences
in the schedules, restaurant’s sections and pure coincidence. In other words,
some of the employee complained that they were only working morning shifts,
weekday shifts or lunch shifts, when the possibility to upsell the cocktails or
desserts was a lot lower than during evenings or weekends. Furthermore, when
the employees were to arrive to work the whole restaurant was didvided into
sections by the management team. So, some employees got the sections with
smaller tables for 2 people and others got tables reserved for big groups of 7 or
10 people. According to the servers’ opinion it has always been easier to
implement suggestive selling on bigger groups of guests rather than the smaller
ones. The bar department also had their own rotation of some bartenders
serving the tables and others only working behind the bar, which means the they
were selling mostly drinks and alsmost no food was sold by them, which made
their percentage higher than those, who were selling the food items. Fairness is
an extremely important factor in implementing any incentive programs.
According to Adam’s Equity theory, the rewards should be allocated among

44
themselves to their contributions. In addition to that, an employee participated
in the program should have seen the fairness in alloctaion of the rewards not
only to their contributions, but the referent other. In other words, the Financial
Incentive program was supposed to be deisigned in the way, that all the
employees would see it as fair and equal among them. The survey indicated the
failure of the management team to create an incentive program that could be
seen as fair in the eyes of all the employees. Therefore, it could have led to the
loss of the motivation or desire to imrove their performance.
The author also had concerns about the expected effect of the Financial Incentive
program while analyzing and connecting together answers to the question 3 and
4. According to the answers 10 out of 15 employees found the bonus valuable for
them, which was rather promising, because Vroom’s Expectancy Theory of
motivation explained that the reward or the the outcome was supposed to be
valuable for an employee in order for them to direct their behavior to attaining
it. At the same time the answers to the Question 4 showed that the majority of
the front of the house employees (8 out of 15) were not motivated to improve
their performance by the expectation of the bonus. In other words, that meant
that the bonus was not valuable enough or it was simply not attractive enough
for the workers. In addition to that, it was possible that that there was simply
nothing that could motivate workers at the Hard Rock Café Helsinki, because
they were not happy about their job in general. While interviewing employees of
HRC Helsinki author also discovered that some front of the house workers did
not want to seem pushy towards the guests by trying to upsell certain items.
Moreover, some of them also said that tips that they were getting from the
customers were far more important to them than a bonus that was offered by the
Financial Incentive Program. So their priority was to please the guest rather than
make the customer feel uncomfortable with suggestive selling techniques.
While analyzing the results of the survey, the author also discovered that majoity
of the employees, exactly 10 out 15, have stated that the target could be reached
with putting an extra effort, which means that they believed that if they tried
reaching the target, the bonus would have been possible. However, the answers
to the last question showed that 8 out 15 employees of the front of the house
were not motivated to reach the target. Even though the rest of the workers said
45
that they were motivated, it still means that the program was not working the
way it was supposed to. It did not boost employee performance or indicate
positive attitude from the personnel.
The reasons of unsuccessful performance of the program to motivate the
employees into higher performance could be vary from its unfairness and
enequality to the value of it for the employees and their willingness to put an
effort for the company.
In addition to that, financial incentive programs, also known as extrinsic
motivators, are not considered to be as the most effective or the long-‐lasting
ones by many behaviorist scientists. Different incentives have a different
meaning for the employees. Intrinsic motivation such as pleasure obtained from
the job activities is considered to be extremely crucial for the company’s success
and employee job satisfaction and, as a result, employee performance (Essi
Huttu; “The effect of Incentives on performance and job satisfaction” ; Tampere
University of Technology). Therefore, it is important to introduce the
combination of financial and non-‐financial incentive programs for the employees
in order to reach a sustainable improvement rather than short-‐term success.
According to The Cognitive Evaluation Theory of motivation introduced by Deci
and Ryan in 1985, extrinsic motivators can undermine intrinsic motivators if
they are seen as controlling by the employees and do not provide enough
autonomy and feeling of competence. Furthermore, not only tangible rewards,
but also threats, deadlines, directives and competition pressure undermine
intrinsic motivation. According to CET, people experience them as controllers of
their behavior (Richard M, Ryan and Edward L. Deci; “Intrinsic and Extrinsic
Motivations: Classic Definitions and New Directions”; University of Rochester).
Therefore, it can be said that the employees of Hard Rock Café Helsinki were
under a lot of pressure from the management team to reach the targets and fit
into the deadlines. Moreover, while interviewing the employees the author was
repeatedly getting the negative or indifferent attitude of the employees towards
any kind of competition or incentive program introduced by the management
team.

46
7. Conclusion and Recommendations
The target of the research was to investigate the impact of the Financial
Incentive Program introduced by the management team at the Hard Rock Café
Helsinki. In order to be able to answer the main research question the author
utilized quantitative and qualitative data obtained from the experimental
Fnancial incentive program and HRC Staff Survey. The author based the research
on 3 theories of motivation, which allowed management team and the author to
formulate certain hypotheses regarding the program. In addition to that, the
survey was conducted by the researcher in order to investigate how motivated
the employees were by the Financial Incentive Program.
After detailed analysis of quantitative and qualitative data received during the
research, the author and the management team did not get the outcome they
were expecting to get from the experiment. The design of the Financial Incentive
program had too many limitations and did not consider certain important
factors, which influenced the results. The Experimental program failed to asses
the employee performance in a fair way as it was only measuring the sales as the
percentage of total sales not taking into consideration absolute numbers and real
sales, which were contradicting each other. While the real sales of the employees
in the key area were improving, the percentage numbers were showing a decline.
It brought the Financial Incentive Program under a serious question of validity
and reliability in terms of real employee performance. Moreover, there was
rather significant disturbance of the results during the first month of the of the
program’s functioning. In fact, the results showed that the program not only
failed to assess the employee performance properly but also did not boost
employee motivation. The results of the survey showed that majority of the
employees were not motivated to reach the targets set by the Financial Incentive
Program. In addition to that, great majority of them stated that the program was
designed in an unfair way, which did not make the staff want to put an effort to
reach the targets.
Therefore, the author concluded that due to multiple failures in design, it was
very hard to claim that the Financial Incentive Program had an impact on
employee performance. Moreover, due to contradicting results it was hard to
identify either the improvement or decline in the sales in the key area. The

47
survey, which was meant to support the research did not identify high
motivation of the employees to reach the targets. Overall, the research conducted
by the author may be helpful to the management team in designing better
Incentive Programs in the future.
After analysing all the drwbacks of the existing Financial Incentive Program, the
author decided to recommend another model of it to the management team of
Hard Rock Café Helsinki. While interviewing the staff, the author noticed that a
lot of staff members had difficulties understanding the Financial Incetnive
Program itself and all the measurements it included. Some of the employees
asked the author to explain it to them again, even though it was already in work
process, which simply meant that it was too complicated for the staff to
understand. Moreover, the staff had no opportunity to count the bonuses
themselves or keep track of how many key areas’ items they sold, since all the
targets were in the percentages. So, obviously the design of the program lacked
transparency and clarity.
An improved incentive program would be one that is clear and simple, where
every employee can calculate the bonus themseleves and know in advance the
amount they are going to be paid. It needs to be fair for each employee
considering the fact that the they work different shifts and are assigned to
different sections. The researcher thinks, that management team should pick the
most challenging items on the menu to sell from the Appetisers, Entrees,
Desserts and the Lunch Menu and award a simple monetarty bonus everytime
the items are sold. Therefore, depending on the amount of these key items sold,
the employee gets a financial bonus to the pay check. In this case the sales of
these items are not related to the factors of table section or shift rotation. In
addition to that, it gives the employees a real opportunity to practice their
suggestive selling skills and challenge themselves.

48
8. References
Anonymous. (2015). How America’s Top CEOs Motivate Employees-‐ And Get
Results., What are the best ways to motivate your people? Forbes Magazine.
Retrieved from
http://www.forbes.com/pictures/gkig45efh/behrooz-‐abdi-‐ceo-‐invense/
Deci, L. E., & Ryan, R. M. (2000). Intrinsic and Extrinsic Motivations: Classic
Definitions and New Directions. Contemporary Educational Psychology, 25, 54-‐67.
doi:10.1006. Retrieved from
http://www.selfdeterminationtheory.org/SDT/documents/2000_RyanDeci_IntE
xtDefs.pdf
Fadil, P. A., & Williams, R. J., & Limpaphayom, W., & Smatt, C. (2005). A
conceptual Examination of the Influence of Individualism/Collectivism on the
Cross-‐Cultural Application of Equity Theory.
Cross Cultural Management: International Journal, Equity or Equality? Retrieved
from
http://www.emeraldinsight.com.ezproxy.arcada.fi:2048/doi/pdfplus/10.1108/
13527600510798114
Hard Rock Corporate. Hard Rock History. Retrieved from
http://www.hardrock.com/corporate/history.aspx
Hard Rock Café Helsinki. (2011). Location Supplement. Employee Handbook.
Retrieved from Private Employee Material
International Labour Organization. (2010). Sectoral Activities Program:
Developments and Challenges in the hospitality and tourism sector.
Global Dialogue Forum for the Hotels, Catering, Tourism Sector.
Retrieved from
http://www.ilo.org/wcmsp5/groups/public/@ed_norm/@relconf/documents/
meetingdocument/wcms_166938.pdf

49
Lee, S. (2007). Vroom’s Expectancy Theory and the Public Library Customer
Motivation model. Library Review, 56, 788-‐796. doi:
10.1108/00242530710831239
Lunenburg, F. C. (2011). Goal-‐Setting Theory of Motivation.
International Journal of Management, Business, and Administration, 15. Retrieved
from
http://www.nationalforum.com/Electronic%20Journal%20Volumes/Lunenburg
,%20Fred%20C.%20Goal-‐
Setting%20Theoryof%20Motivation%20IJMBA%20V15%20N1%202011.pdf
Musto R. Sales Reports for the period May-‐August 2014.
Sales and Marketing Manager at Hard Rock Café Helsinki
Ramlall, S. (2004). A Review of Employee Motivation Theories and Their
Implications for Employee Retention within Organizations. Journal of American
Academy of Business, 52. Retrieved from
ftp://ip-‐118-‐139-‐161-‐
3.ip.secureserver.net/pub/moodledata/113/Ramlall_2004.pdf
Thompson K. Sales Reports for the period May-‐August 2015. Operations
Manager at the Hard Rock Café Helsinki.


