The Impact of Better Work A Joint Program of the International Labour Organization and the International Finance Corporation 26 SEPTEMBER 2016 Drusilla Brown Rajeev Dehejia Ann Rappaport Elyse Voegeli Mary Davis Raymond Robertson Laura Babbitt Samira Manzur Tarek Makawi Gabriel Róndon Ichikawa Shuyuan Hu Shulin Jiang Xirong Lin Claire Schupmann Ana Antolin Dana Kaufman Nitya Agrawal Janet Rubin Dirayati Djaya Lei Zhu Claire Sleigh Emily Rourke Avni Mittal Riddhima Sharma
Transcript
The Impact of Better Work A Joint Program of the International Labour Organization and the International Finance Corporation
26 SEPTEMBER 2016
Drusilla Brown Rajeev Dehejia Ann Rappaport Elyse Voegeli Mary Davis Raymond Robertson Laura Babbitt Samira Manzur
Tarek Makawi Gabriel Róndon Ichikawa Shuyuan Hu Shulin Jiang Xirong Lin Claire Schupmann Ana Antolin Dana Kaufman
List of Figures iii List of Tables viii Acronyms xiii Preface xiv Executive Summary xvii Chapter 1 Introduction and Methodology 1 1.1 Identification Strategy 1 1.2 Impact Indicators 3 1.3 Occupational Safety and Health 3 1.4 Nicaragua 3 1.5 Verbal Abuse 3 1.6 Sexual Harassment 5 1.7 Wages and Hours 6 1.8 Coercion, Abuse, Human Trafficking and Deportation Threats 8 1.9 Deceptive Pay Practices 9 1.10 Training 9 1.11 Human Development 9 1.12 Firm Performance 9 1.13 Sourcing Practice 10 1.14 Performance Enhancement Consultative Committees 10 1.15 Better Factories Cambodia 11 1.16 Haiti Case Studies 11 Chapter 2 Better Work Compliance Trends 12 2.1 Better Work Vietnam 12 2.2 Better Work Indonesia 19 2.3 Better Work Jordan 45 2.4 Better Work Haiti 53 Chapter 3 Occupational Safety and Health 61 3.1 Better Work Occupational Safety and Health Vietnam 63 3.2 Better Work Occupational Safety and Health Indonesia 71 3.3 Better Work Occupational Safety and Health Jordan 76 3.4 Better Work Occupational Safety and Health Haiti 83 Chapter 4 Nicaragua 89 Chapter 5 Verbal Abuse 110 Chapter 6 Sexual Harassment 136 Chapter 7 Wages and Hours 160 Chapter 8 Coercion, Human Trafficking, Abuse and Deportation Threats
174
Chapter 9 Deceptive Pay Practices 186 Chapter 10 Training 200 Chapter 11 Millennium Development Goals 201 Goal 1: Eradicate Extreme Hunger 201 Goal 2: Achieve Universal Primary Education 211 Goal 3: Promote Gender Equality and Empower Women 225 Goal 5: Improve Maternal Health 218
ii | P a g e
Child Health 230 Chapter 12 Better Work and Firm Performance 232 Chapter 13 Sourcing Practices and Compliance 235 Chapter 14 Performance Improvement Consultative Committees (PICCs)
252
Chapter 15 Cambodia 295 Chapter 16 Haiti Case Studies 299 16.1 Innovation 299 16.2 Occupational Safety and Health 314 Haiti Case Study References 345 Chapter 17 Conclusions 349 17.1 Identification Strategy 349 17.2 Compliance Trends 349 17.3 Occupational Safety and Health 350 17.4 Nicaragua 351 17.5 Verbal Abuse 351 17.6 Sexual Harassment 352 17.7 Wages and Hour 353 17.8 Coercion, Abuse, Human Trafficking and Deportation Threats 353 17.9 Deceptive Pay Practices 353 17.10 Training 353 17.11 Millennium Development Goals 354 17.12 Better Work and Firm Performance 354 17.13 Sourcing Practices 354 17.14 Performance Improvement Consultative Committees (PICCs) 355 17.15 Cambodia 355 17.16 Haiti Case Studies 355 Appendix 1 Compliance Trends Vietnam 357 Appendix 2 Compliance Trends Indonesia 366 Appendix 3 Compliance Trends Jordan 383 Appendix 4 Compliance Trends Haiti 394 Appendix 5 Compliance Trends Nicaragua 398
iii | P a g e
List of Figures
Figure 1.5.1 Verbal Abuse and the Price-Cost Ratio Vietnam 4 Figure 1.6.1 Sexual Harassment and Firm Profits in Vietnamese Apparel Factories
Figure 2.3 Fire Detection and Alarm System Compliance Vietnam 16 Figure 2.4 Trained to Use Machines and Equipment Compliance Vietnam
16
Figure 2.5 Emergency Exits Unlocked During Work Hours Compliance Vietnam
17
Figure 2.6 Daily Limits on Overtime Compliance Vietnam 17 Figure 2.7 Work Time Records Actual Hours Worked Compliance Vietnam
18
Figure 2.8 Posted Safety Warnings Compliance Indonesia 23 Figure 2.9 Written OSH Policy Compliance Indonesia 23 Figure 2.10 Requirements on HIV/AIDS Compliance Indonesia 24 Figure 2.11 Correct Pay for Overtime and Rest Days Compliance Indonesia
24
Figure 2.12 Overtime Voluntary Compliance Indonesia 25 Figure 2.13 Correct Pay for Overtime on Public Holidays Compliance Indonesia
25
Figure 2.14 Pay for 1st and 2nd Menstruation Days Compliance Indonesia
26
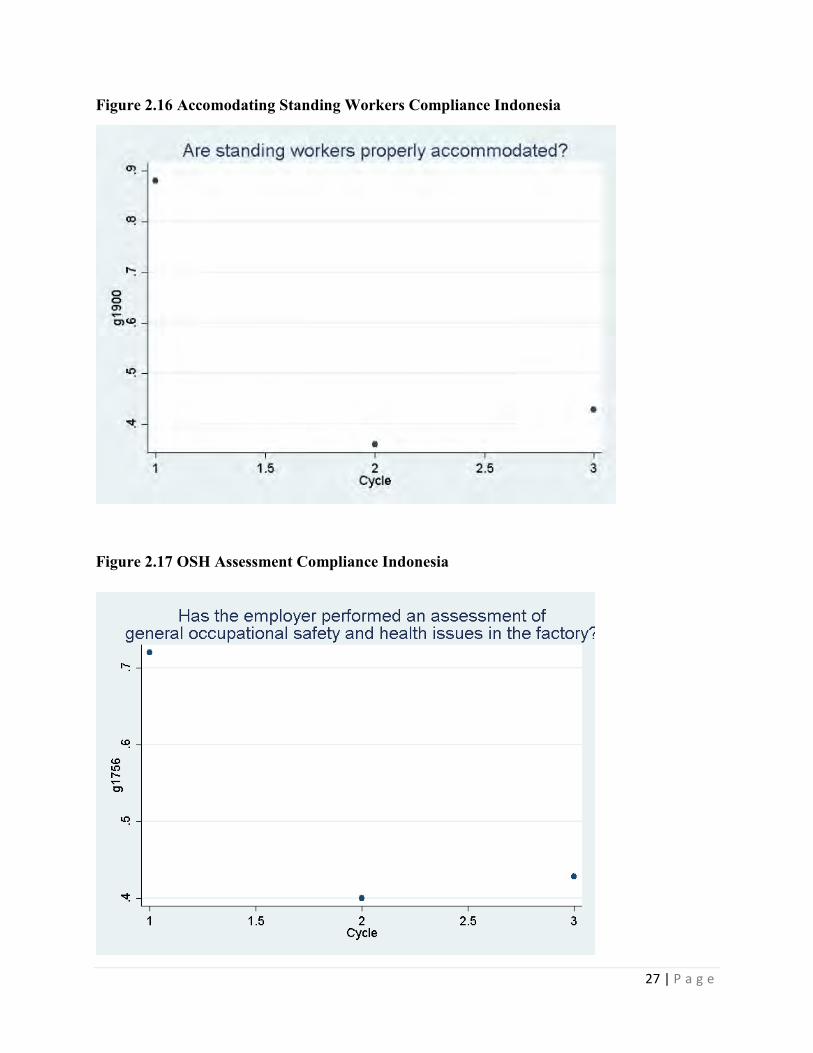
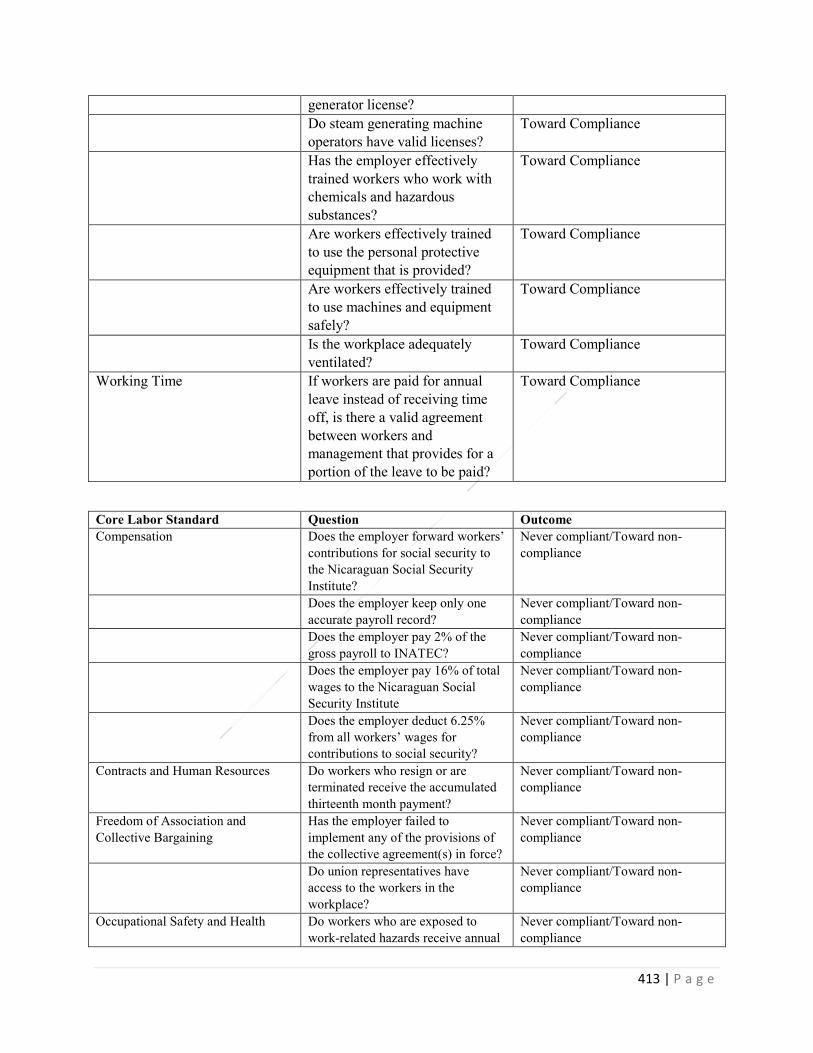
Figure 2.15 OSH Committee Compliance Indonesia 26 Figure 2.16 Accomodating Standing Workers Compliance Indonesia 27 Figure 2.17 OSH Assessment Compliance Indonesia 27 Figure 2.18 Necessary PPE Compliance Indonesia 28 Figure 2.19 Emergency Exits Marked Compliance Indonesia 28 Figure 2.20 Emergency Exits Unlocked Compliance Indonesia 29 Figure 2.21 Correct Pay for Ordinary Overtime Compliance Indonesia 29 Figure 2.22 Acurate Time Records Compliance Indonesia 30 Figure 2.23 Regular Hours 40 Per Week Compliance Indonesia 30 Figure 2.24 Regular Hours Legal Limits Compliance Indonesia 30 Figure 2.25 Regular Overtime 14 Hours per Week Compliance Indonesia
31
Figure 2.26 Breastfeeding Breaks Compliance Indonesia 32 Figure 2.27 Safe Building Legal Permits Compliance Indonesia 32 Figure 2.28 Machine Guards Compliance Indonesia 33 Figure 2.29 Eating Areas Compliance Indonesia 33 Figure 2.30 Record Accidents and Disease Compliance Indonesia 34 Figure 2.31 Dessiminate CBA Compliance Indonesia 34 Figure 2.32 Suitable Chairs Compliance Indonesia 35 Figure 2.33 Discipline Legal Compliance Indonesia 35 Figure 2.34 Adequate Toilets Compliance Indonesia 36
iv | P a g e
Figure 2.35 Hazardous Chemicals Properly Stored Compliance Indonesia
36
Figure 2.36 Washing Facility Compliance Indonesia 37 Figure 2.37 Trained Workers in Fire Fighting Equipment Compliance Indonesia
37
Figure 2.38 Trained First Aid Officers Compliance Indonesia 38 Figure 2.39 Work Agreements Compliance Indonesia 38 Figure 2.40 Termination Benefits Compliance Indonesia 39 Figure 2.41 3 Months Maternity Leave Compliance Indonesia 39 Figure 2.42 Acceptable Temperature Compliance Indonesia 40 Figure 2.43 Sub-Contracted Workers Compliance Indonesia 40 Figure 2.44 Trained to Use PPE Compliance Indonesia 41 Figure 2.45 Chemicals Inventory Compliance Indonesia 41 Figure 2.46 Training Safe Machine Operation Compliance Indonesia 42 Figure 2.47 Correct Leave Pay Compliance Indonesia 42 Figure 2.48 Labor Law Compliance Indonesia 43 Figure 2.49 Work Agreement in Bahasa Compliance Indonesia 43 Figure 2.50 Regular Overtime 3 Hours per Day Compliance Indonesia 44 Figure 2.51 Weekly Rest Compliance Indonesia 44 Figure 2.52 Accommodation Protected from Animals Compliance Jordan
48
Figure 2.53 Ventilation Compliance Jordan 48 Figure 2.54 Medical Staff Compliance Jordan 49 Figure 2.55 Machine Guards Compliance Jordan 49 Figure 2.56 PPE Provided Compliance Jordan 50 Figure 2.57 Trained to Use Machines Safely Compliance Jordan 50 Figure 2.58 Legal Factory Bylaws Compliance Jordan 51 Figure 2.59 OSH Committee Compliance Jordan 51 Figure 2.60 Seniority Bonus Compliance Jordan 52 Figure 2.61 Legal Requirements for Disabled Workers Compliance Jordan
52
Figure 2.62 Correct Pay for Weekly Rest Compliance Haiti 55 Figure 2.63 Pay for Annual Leave Compliance Haiti 55 Figure 2.64 Working Time Records Accurate Compliance Haiti 56 Figure 2.65 Pay for Sick Leave Compliance Haiti 56 Figure 2.66 One Payroll Record Compliance Haiti 57 Figure 2.67 30 Minute Daily Breaks Compliance Haiti 57 Figure 2.68 Unauthorized Deductions Compliance Haiti 58 Figure 2.69 Union Access to Workplace Compliance Haiti 58 Figure 2.70 Valid Termination Compliance Haiti 59 Figure 2.71 Legal Internal Rules Compliance Haiti 59 Figure 2.72 Legal Disciplines Compliance Haiti 60 Figure 2.73 Physical Punishment Compliance Haiti 60 Figure 3.1 Fatigue Treatment by Cycle Vietnam 65 Figure 3.2 Stomach Pain Treatment by Cycle Vietnam 65 Figure 3.3 Water Satisfaction, Treatment by Cycle Vietnam 66
v | P a g e
Figure 3.4 Chemical Smells Treatment by Cycle Vietnam 66 Figure 3.5 Injury Treatment by Cycle Indonesia 72 Figure 3.6 Fatigue Treatment by Cycle Jordan 77 Figure 3.7 Headache Treatment by Cycle Jordan 77 Figure 3.8 Hunger Treatment by Cycle Jordan 78 Figure 3.9 Thirst Treatment by Cycle Jordan 78 Figure 3.10 Water Satisfaction Treatment by Cycle Jordan 79 Figure 3.11 Injury Treatment by Cycle Jordan 79 Figure 3.12 Thirst Treatment by Cycle Haiti 84 Figure 3.13 Hunger Treatment by Cycle Haiti 84 Figure 4.1 Suitable Chairs Compliance Nicaragua 97 Figure 4.2 PPE Compliance Nicaragua 97 Figure 4.3 Information about Wages Payments and Deductions Compliance Nicaragua
98
Figure 4.4 INATEC Contributions Compliance Nicaragua 98 Figure 4.5 Emergency Plan Compliance Nicaragua 99 Figure 4.6 Chemicals Labeled Compliance Nicaragua 99 Figure 4.7 Weekly Pay USD Distribution Nicaragua 100 Figure 4.8 Weekly Hours Distribution Nicaragua 100 Figure 5.1 Verbal Abuse Treatment Months Vietnam 114 Figure 5.2 Verbal Abuse Treatment by Cycle Vietnam 114 Figure 5.3 Verbal Abuse Intensity Treatment Months Vietnam 115 Figure 5.4 Verbal Abuse Intensity Treatment by Cycle Vietnam 115 Figure 5.5 Verbal Abuse Treatment Months Indonesia 118 Figure 5.6 Verbal Abuse Treatment by Cycle Indonesia 118 Figure 5.7 Verbal Abuse Intensity Treatment Months Indonesia 119 Figure 5.8 Verbal Abuse Intensity Treatment by Cycle Indonesia 119 Figure 5.9 Verbal Abuse Treatment Months Jordan 123 Figure 5.10 Verbal Abuse Treatment by Cycle Jordan 123 Figure 5.11 Verbal Abuse Intensity Treatment Months Jordan 124 Figure 5.12 Verbal Abuse Intensity Treatment by Cycle Jordan 124 Figure 5.13 Verbal Abuse Treatment by Cycle Haiti 128 Figure 5.14 Verbal Abuse Intensity Treatment by Cycle Haiti 128 Figure 5.15 Verbal Abuse Treatment Months Nicaragua 132 Figure 5.16 Verbal Abuse Intensity Treatment by Cycle Nicaragua 132 Figure 6.1 Sexual Harassment Treatment Months Vietnam 140 Figure 6.2 Sexual Harassment Treatment by Cycle Vietnam 140 Figure 6.3 Sexual Harassment Intensity Treatment Months Vietnam 141 Figure 6.4 Sexual Harassment Intensity Treatment by Cycle Vietnam 141 Figure 6.5 Sexual Harassment Treatment Months Indonesia 144 Figure 6.6 Sexual Harassment Treatment by Cycle Indonesia 144 Figure 6.7 Sexual Harassment Intensity Treatment Months Indonesia 145 Figure 6.8 Sexual Harassment Intensity Treatment by Cycle Indonesia 145 Figure 6.9 Sexual Harassment Treatment Months Jordan 149 Figure 6.10 Sexual Harassment Treatment by Cycle Jordan 149 Figure 6.11 Sexual Harassment Intensity Treatment Months Jordan 150
vi | P a g e
Figure 6.12 Sexual Harassment Intensity Treatment by Cycle Jordan 150 Figure 7.1 Histogram Weekly Hours Vietnam 162 Figure 7.2 Histogram Weekly Pay USD Vietnam 162 Figure 7.3 Weekly Hours Better Work Treatment Months Vietnam 163 Figure 7.4 Weekly Hours Better Work Treatment by Cycle Vietnam 163 Figure 7.5 Weekly Pay USD Better Work Treatment Months Vietnam 164 Figure 7.6 Weekly Pay USD Better Work Treatment by Cycle Vietnam 164 Figure 7.7 Histogram Weekly Hours Indonesia 165 Figure 7.8 Histogram Weekly Pay USD Indonesia 165 Figure 7.9 Weekly Hours Better Work Treatment Months Indonesia 166 Figure 7.10 Weekly Hours Better Work Treatment by Cycle Indonesia 166 Figure 7.11 Weekly Pay USD Better Work Treatment Months Indonesia 167 Figure 7.12 Weekly Pay USD Better Work Treatment by Cycle Indonesia
167
Figure 7.13 Histogram Weekly Hours Jordan 168 Figure 7.14 Histogram Weekly Pay USD Jordan 168 Figure 7.15 Weekly Hours Better Work Treatment by Cycle Jordan 169 Figure 7.16 Weekly Pay JD Better Work Treatment by Cycle Jordan 169 Figure 7.17 Histogram Weekly Hours Haiti 170 Figure 7.18 Histogram Weekly Pay USD Haiti 170 Figure 8.1 Jordan Human Trafficking, Crying 176 Figure 8.2 Jordan Human Trafficking, Fearful 176 Figure 8.3 Jordan Human Trafficking, Lack of Agency 177 Figure 8.4 Jordan Human Trafficking, Deportation Punishment 177 Figure 8.5 Jordan Human Trafficking, Passport Punishment 178 Figure 8.6 Jordan Human Trafficking, Airfare 178 Figure 8.7 Jordan Human Trafficking, Debt 179 Figure 9.1 Better Work Intervention Decision Tree 191 Figure 12.1 Price Cost Ratio Better Treatment by Cycle Vietnam 233 Figure 12.2 Time to Target Friday Hours Treatment by Cycle Vietnam 233 Figure 13.1 Purchasing Terms by Assessment Cycle Vietnam 241 Figure 13.2 Verbal Abuse Concern 241 Figure 13.3 Serious Challenges to Business Success Vietnam 242 Figure 13.4 Major Challenges to Business Success Vietnam 242 Figure 13.5 Correlates of Supervisor Stress Vietnam 243 Figure 13.6 Change in Noncompliance by Treatment Cycle OSH Unions Work Hours Vietnam
243
Figure 16.1 Sustainable Development 311 Figure 16.2 Capacity factors, elements and connections 311 Figure 16.3 View from case company toward neighboring factory showing fence line in government-owned industrial park
312
Figure 16.4 Detail of physical barrier created by case company to block heat, noise and fumes from neighboring factory in government-owned industrial park
312
Figure 16.5 Percent Non-Compliance on OSH Compliance Points 337 Figure 16.6 Background Snapshot at Perimeter of Apparel Factory near 339
vii | P a g e
Cite Soleil – May 26, 2015 Figure 16.7 Factory Snapshot during Tour of Port au Prince Case Study Location – May 26, 2015
Table 5.1 Variable Definitions 112 Table 5.2 Vietnam Verbal Abuse by Cycle 116 Table 5.3 Vietnam Summary Statistics 116 Table 5.4 Verbal Abuse Factory Averages, Vietnam, Cycle and Dose 117 Table 5.5 Indonesia Verbal Abuse by Cycle 120 Table 5.6 Indonesia Summary Statistics 121 Table 5.7 Verbal Abuse Factory Averages, Indonesia, Cycle and Dose 122 Table 5.8 Jordan Verbal Abuse by Cycle 125 Table 5.9 Jordan Summary Statistics 126 Table 5.10 Verbal Abuse Factory Averages, Jordan, Cycle and Dose 127 Table 5.11 Haiti Verbal Abuse by Cycle 129 Table 5.12 Haiti Summary Statistics 130 Table 5.13 Verbal Abuse Factory Averages, Haiti, Cycle and Dos 131 Table 5.14 Nicaragua Verbal Abuse by Cycle 133 Table 5.15 Nicaragua Summary Statistics 134 Table 5.16 Verbal Abuse Factory Averages, Nicaragua, Cycle and Dose 135 Table 6.1 Variable Definitions 138 Table 6.2 Vietnam Sexual Harassment by Cycle 142 Table 6.3 Vietnam Summary Statistics 142 Table 6.4 Sexual Harassment Factory Averages, Vietnam, Cycle and Dose
143
Table 6.5 Indonesia Sexual Harassment by Cycle 146 Table 6.6 Indonesia Summary Statistics 147 Table 6.7 Sexual Harassment Factory Averages, Indonesia, Cycle and Dose
148
Table 6.8 Jordan Sexual Harassment by Cycle 151 Table 6.9 Jordan Summary Statistics 152 Table 6.10 Sexual Harassment Factory Averages, Jordan, Cycle and Dose
153
Table 6.11 Haiti Sexual Harassment by Cycle 154 Table 6.12 Haiti Summary Statistics 155 Table 6.13 Sexual Harassment Factory Averages, Haiti, Cycle and Dose 156 Table 6.14 Nicaragua Sexual Harassment by Cycle 157 Table 6.15 Nicaragua Summary Statistics 158 Table 6.16 Sexual Harassment Factory Averages, Nicaragua, Cycle and Dose
159
Table 7.1 Wages and Hours Better Treatment Effects Vietnam 171 Table 7.2 Wages and Hours Better Treatment Effects Indonesia 172 Table 7.3 Wages and Hours Better Treatment Effects Haiti 173 Table 8.1 Variable Construction 180 Table 8.2 Summary Statistic 181 Table 8.3 Agency Better Work Treatment Effects Jordan 183 Table 8.4 Deportation and Passport Restrictions Better Work Treatment Effect Jordan
184
Table 8.5 Inability to Return Home Better Work Treatment Effects Jordan
185
x | P a g e
Table 9.1 Compliance Points for Pay Practices 192 Table 9.2 Variable Summary Statistics 194 Table 9.3 Compliance Variables Summary Statistics 195 Table 9.4 Weekly Pay and Time to Target with and without Revenue 196 Table 9.5 Compliance on Accurate Payroll, Minimum Wages, Overtime and Personal Leave
198
Table 9.6 Cycle and Dose Interactions with Pay and Productivity 199 Table 11.1 Hunger by Cycle Nicaragua 204 Table 11.2 Hunger Better Work Treatment by Cycle Nicaragua 204 Table 11.3 Hunger by Cycle Haiti 205 Table 11.4 Hunger Better Work Treatment by Cycle Haiti 206 Table 11.5 Hunger by Cycle Jordan 207 Table 11.6 Hunger Better Work Treatment by Cycle Jordan 208 Table 11.7 Hunger by Cycle Indonesia 209 Table 11.8 Hunger Better Work Treatment by Cycle Indonesia 210 Table 11.9 Children Out of School by Cycle Nicaragua 213 Table 11.10 Pre-school Children Safe by Cycle Nicaragua 213 Table 11.11 Children not in School for Financial Reasons by Cycle Haiti 213 Table 11.12 Children not in School for Financial Reasons Better Work Treatment by Cycle Haiti
214
Table 11.13 Children in School by Age Cycle Vietnam 215 Table 11.14 Girls in School Better Work Treatment by Cycle Vietnam 215 Table 11.15 Boys in School Better Work Treatment by Cycle Vietnam 216 Table 11.16 Children not in School for Financial Reasons by Cycle Indonesia
216
Table 11.17 Children not in School for Financial Reasons Better Work Treatment by Cycle Indonesia
217
Table 11.18 Prenatal Postnatal Care in Factory Clinic by Cycle Nicaragua
220
Table 11.19 Health Services for Pregnant Women in Factory Clinic by Cycle Haiti
220
Table 11.20 Health Services for Pregnant Women in Factory Clinic Better Work Treatment by Cycle Haiti
221
Table 11.21 Health Services for Pregnant Women in Factory Clinic by Cycle Vietnam
222
Table 11.22 Health Services for Pregnant Women in Factory Clinic Better Work Treatment by Cycle Vietnam
222
Table 11.23 Health Services for Pregnant Women in Factory Clinic by Cycle Jordan
223
Table 11.24 Health Services for Pregnant Women in Factory Clinic Better Work Treatment by Cycle Jordan
223
Table 11.25 Health Services for Pregnant Women in Factory Clinic by Cycle Indonesia
224
Table 11.26 Health Services for Pregnant Women in Factory Clinic Better Work Treatment by Cycle Indonesia
224
Table 11.27 Pay by Gender Cycle 1 Nicaragua 226
xi | P a g e
Table 11.28 Pay and Hours by Gender Better Work Treatment by Cycle Nicaragua
226
Table 11.29 Pay and Hours by Gender Better Work Treatment by Cycle Haiti
227
Table 11.30 Pay and Hours by Gender Better Work Treatment by Cycle Vietnam
228
Table 11.31 Pay and Hours by Gender Better Work Treatment by Cycle Indonesia
229
Table 11.32 Child Health Status Vietnam 231 Table 12. 1 Better Work Treatment by Cycle Time to Target Friday Vietnam
234
Table 13.1 Compliance Visits Better Work Treatment Effects 244 Table 13.2 Sourcing Practice Correlates of Supervisor Stress Vietnam 245 Table 13.3 Order Size Most Important Customer Productivity Controlled Vietnam
246
Table 13.4 Order Size Most Important Customer Vietnam 247 Table 13.5 Order Size from Second Most Important Customer Productivity Controlled Vietnam
248
Table 13.6 Order Size Second Most Important Customer Vietnam 249 Table 13.7 Compliance Systems 250 Table 13.8 Compliance Systems and Sourcing Practices Vietnam 250 Table 13.9 Sourcing Practices and Work Outcomes Vietnam 251 Table 14.1 Variables for Analysis 255 Table 14.2 Summary Statistics 260 Table 14.3 PICC and Outcome Variable Relationships 262 Table 14.4 PICC and Comfort Seeking Help from Supervisor 263 Table 14.5 PICC and Willingness to Seek Help From a Supervisor 264 Table 14.6 PICC and Satisfaction with Complaint Outcome 265 Table 14.7 PICC and Willingness to Seek Help from the Trade Union Representative
266
Table 14.8 PICC and GM Belief that PICC Could Help Solve Problems 267 Table 14.9 PICC and GM Belief that a Worker Committee Could Help Solve Problems
268
Table 14.10 PICC and Verbal Abuse Binary 269 Table 14.11 PICC and Verbal Abuse Average 270 Table 14.12 PICC and Verbal Abuse Scale 271 Table 14.13 PICC and Verbal Abuse Category 272 Table 14.14 PICC and Supervisor Stress 273 Table 14.15 PICC and GM Belief that the Union Could Help Solve Problems
274
Table 14.16 PICC and Clinic Rating 275 Table 14.17 PICC and Fatigue 276 Table 14.18 PICC and Dizziness 277 Table 14.19 PICC and Ache 278 Table 14.20 PICC and Thirst 279 Table 14.21 PICC and Health Clinic 280
xii | P a g e
Table 14.22 PICC and Canteen Quality 281 Table 14.23 PICC and Toilet Facilities 282 Table 14.24 PICC and Air Quality Concern 283 Table 14.25 PICC and Chemicals 284 Table 14.26 PICC and Restlessness 285 Table 14.27 PICC and Fearful 286 Table 14.28 PICC and Sad 287 Table 14.29 PICC and Crying 288 Table 14.30 PICC and Hopeless 289 Table 14.31 PICC and Collective Bargaining 290 Table 14.32 PICC and Freedom of Association 291 Table 14.33 PICC and Nondiscrimination and Interference with the Union
292
Table 14.34 PICC and Union Operations 293 Table 14.35 PICC and Water Satisfaction 294 Table 16.1 Comparison of challenges to innovations in 2015 313 Table 16.2 Number of Case Study Factories Participating in OSH-related Training since Previous Case Study Report
341
Table 16.3 Manager Survey Results for All BWH Factories 342 Table 16.4 Worker Survey Results for All BWH Factories 343 Table 16.5 PM2.5 Concentrations across Locations in Haiti 344
xiii | P a g e
Acronyms BFC Better Factories Cambodia BWH Better Work Haiti BWI Better Work Indonesia BWJ Better Work Jordan BWN Better Work Nicaragua BWV Better Work Vietnam CBA Collective Bargaining Agreement CAT Compliance Assessment Tool CHR Contracts and Human Resources FACB Freedom of Association and Collective Bargaining IFC International Finance Corporation ILO MFA
International Labor Organization Multi-Fiber Arrangement
OSH Occupational Safety and Health PICC Performance Improvement Consultative Committee PPE Personal Protective Equipment
xiv | P a g e
Preface
The impact evaluation of Better Work was born of a chance conversation nearly a decade ago in the halls of the World Bank. Amy Luinstra and I were discussing the age old question: Do successful factories choose humane working conditions or do humane working conditions make factories successful? Without some random assignment to good and bad working conditions and measurement before the assignment occurred, we would have a very hard time answering that question. As luck would have it, Amy left the very next day for Geneva to join the team that would develop Better Work, the seed of an RCT planted in her mind. We would attempt a randomized controlled trial of humane working conditions.
Such an experiment, of course, is not without its ethical challenges. We originally envisioned recruiting 300 Vietnamese apparel factories to a program with the capacity to initiate Better Work in 100 factories each year. A baseline would be collected on all factories. Each year, 100 factories would be randomly selected to begin Better Work. Unfortunately for identification, over-subscription never occurred. We were forced to a fallback. Enterprise assessments were to occur on average once per year, but there would be a window of 10 to 13 months in which an unannounced annual assessment might occur. To provide a second layer of exogenous variation, participating firms would be randomly assigned to the month for a data collection following an assessment. Therefore, the timing of the assessment itself would be quasi-random and the time that elapsed between an assessment and a data collection would be random.
Our ambitions for the experiment grew until we were collecting data in seven countries, involving hundreds of firms and thousands of workers.
Obtaining data was a great challenge. How do you collect credible information from thousands of workers about potentially abusive conditions of work? Alice Tang and Scott Sughrue, in the Tufts Medical School, were developing the Audio Computer Assisted Self-Interview (ACASI) and applying the methodology in Vietnamese medical clinics. Rich Lerner, in the Tufts Department of Child Study and Human Development, was using mobile data collection for his study of youth development. Then, in 2009, small computers first emerged on the market. The ACASI on a small computer could be used to allow many workers to provide their views securely, completely and confidentially, though not without some ups and downs. When data collection began in Nicaragua, touchscreen tablet computers had just entered the market, with the significant challenge that the screen would only respond the touch of a Q-tip.
It is crushingly beautiful to see a room full of workers gamely experimenting with a mouse for the first time. Nearly all persisted and became mouse experts by the time they were midway through the survey. One Vietnamese woman will stick in my memory forever. She was older, not as quick as younger workers to pick up the technology. After one hour, we asked if she needed help or wanted to stop. “No,” she said. She was determined to finish. And she did. When a data collection in Haiti ran up against the end of the workday, we told the workers they needed to stop. “No,” they protested. “We want to stay.”
It is difficult to convey the complexity of the project; data collection teams in every country coordinating with the Tufts team, the ILO, the factories and the CTAs and EAs in each country program, all interlacing with program delivery. It is even more difficult to convey my
xv | P a g e
astonishment and gratitude for their willingness to execute a data collection program about which they had many misgivings. We extend particular thanks to the factory managers and their customers who agreed to participate in our joint venture and the funders who kept the electrons flowing, without which the project never would have been completed.
We are especially grateful to Ros Harvey, the founding Director of Better Work, Amy Luinstra and Briana Wilson for initiating the adventure and Better Work Director Dan Rees and our partners at the International Finance Corporation for supporting our work through to the end. We were also aided at critical moments by the unending optimism of Conor Boyle, the exceptional talents of Phil Fishman and Tara Rangarajan and the support of Stephanie Barrientos and the Better Work Advisory Committee.
Operational control of the evaluation would ultimately rest in the extraordinarily able hands of Arianna Rossi. Without Arianna’s intellect, creativity and persistence, it is unlikely that we would have reached a successful conclusion.
The evaluation was intended to be interdisciplinary from the start. One worker commented after completing the survey, “You asked about everything,” which we did. The breadth of the evaluation reflects the intellectual contributions and guidance provided in the early stages by Ann Rappaport, Beth Rosenberg, Fran Jacobs, Jayanthi Mistry and Sharun Mukand. Formalizing the measurement of the interactions between factory structure and social context was greatly advanced when Laura Babbitt joined the senior team in 2012. Laura’s intellectual contribution would transition the project from one that was cross-disciplinary to one that was deeply interdisciplinary.
Tufts Economics, International Relations and Fletcher students and graduates were essential to the execution of the data collection and processing. Yulya Truskinovsky programmed the survey instruments, Selven Veeraragoo and George Domat developed the database, Yibing Li, Reuben Levy, Jeff Eisenbraun, Kelley Cohen and Elyse Voegeli were instrumental in project management and dozens of undergraduates edited audio files and processed the thousands of data files coming in from the field. Yibing would teach me about mobile data collection, Reuben would teach me that it really is possible to work for six straight days on 12 hours of sleep, Jeff would rise to the challenge of bringing order to the wild wild west of data labs and Elyse would update data collection procedures, database management and analysis, create the website and supervise the many undergraduates in the lab.
Tufts Economics undergraduate and graduate students played a critical role in developing the theoretical framework that emerged from the evaluation. Over a period of four years we worked with Emily Rourke, Janet Rubin, Megan Miller, Xirong Lin, Claire Schupmann, George Domat, Ben Glass, Liana Abbott, Paris Adler, Shuyuan Hu and Gabe Rondón Ichikawa on the theoretical framework that would eventually guide the analysis. It was also particularly striking that the evidence would affirm the conceptualization of Better Factories Cambodia as formulated by Sandra Polaski.
Many contributors essential to the project have gone unnamed but their value is still greatly appreciated. Individuals who created and administer Better Work at the ILO, the IFC and the country programs and staff at Tufts, the ILO, the IFC, the country programs and the data
xvi | P a g e
collection firms were instrumental in keeping the many moving parts of the extraordinary undertaking of Better Work and its impact evaluation functioning smoothly.
And of course, all of us have received the unending support of our partners and families. During the course of the project, some Better Work babies have grown from youngsters to adults and others from babies to teenagers, with still others soon to arrive. These little people know one constant in their lives: They can awake any morning to find a parent on the other side of the globe. The frantic pace and intense complexity of the work prompted one spouse to comment, “So this is better work?” with an exquisite mix of incredulity and sarcasm.
Above all, we thank the workers who participated in the data collection. It is our fondest hope that our findings will provide evidence and the needed courage to advance your dignity at work.
The findings presented below represent more a middle than an end. It is our hope that the work contained herein will provide an intellectual foundation for a next generation of scholars who seek to untangle the economic and social interactions of workers and firms in global supply chains and the consequences those interactions have for the lives of workers, their families and communities.
Drusilla Brown 26 September 2016
Medford, MA USA
xvii | P a g e
Executive Summary
1. Evaluation Design. The evaluation of Better Work employs a multi-disciplinary approach. The impact evaluation began in 2009 with key informant interviews in each country. Key informants included Better Work staff, government officials, the ILO, union organizations, manufacturer’s associations and workers. Data for analysis includes survey and interview data collected from workers, supervisors and firm managers. Case methodology is used to explore managerial practices and occupational safety and health in Haiti. A randomized controlled trial is used to analyze a supervisory skills training program in Cambodia, Indonesia, Vietnam, Lesotho, Jordan, Nicaragua and Haiti. Quasi-experimental methodology is used to analyze the broader impact of Better Work in Indonesia, Vietnam, Jordan, Nicaragua and Haiti. Quasi-experimental data collection is ongoing in Cambodia. Analysis begins by exploring the empirical relevance of the theory underlying Better Work. Analysis of the impact evaluation data begins with a theory developed to isolate the determinants of each working condition or collection of working conditions that are jointly determined. Better Work impact evaluation data is then employed to test the theory and determine whether Better Work is disrupting processes that lead to poor work outcomes and supporting processes that promote humane work outcomes. The analysis also yields information on the impact of compliant behavior on firm performance.
2. Compliance Trends. Country compliance trends in Better Work enrolled factories are observed using enterprise assessment data in conjunction with the annual Compliance Synthesis Reports. A Compliance Assessment Tool (CAT) with broad categories – freedom of association and collective bargaining (FACB), occupational safety and health (OSH), contracts and human resources (CHR), discrimination, forced labour, child labour, compensation and working time – is used. Very little or no evidence of noncompliance under Child Labour is observed across all countries. Although there is variation in areas of highest noncompliance, overall, OSH remains an area of major noncompliance. In Vietnam, lowest noncompliance is found in questions under Child Labour, Forced Labour and Discrimination. Although factories continue to show high noncompliance, there have been some improvements in the FACB, Compensation, CHR and Working Time clusters. Noncompliance is highest in the OSH cluster, although trends in questions vary. In Indonesia, significant improvements are observed in the Child Labor, Compensation and CHR clusters. In Jordan, areas of greatest noncompliance are observed in questions relating to migrant workers, including providing accommodation for migrant workers and unauthorized recruitment fees. In contrast, noncompliance in Compensation and CHR is very low for Jordanian workers. Although noncompliance in the OSH cluster remains high, there is a trend toward compliance for some OSH questions, including no noncompliance findings in temperature observed in cycle 4. In Haiti, the Compensation, CHR and Work Time clusters have high noncompliance but significant improvements are observed in some questions regarding FACB.
3. Occupational Safety and Health. Questions relating to OSH are evaluated for Better Work factories in Vietnam, Indonesia, Jordan and Haiti. Among the commonly reported health symptoms, headache is persistent across all countries. In Vietnam, a small treatment effect is observed in the perception of water quality (0.18) on a 4-point scale and on the proportion of workers concerned with chemical smells (-0.05). In Indonesia, a treatment effect is observed in
xviii | P a g e
concerns with injury. The proportion of workers reporting injury concern declines by 0.24. Relatively stronger treatment effects are observed in Jordan, with declines in headache by 0.59, hunger by 0.78 and thirst by 0.37 on a 4-point scale. The proportion of workers reporting injury concern declines by 0.32.
4. Nicaragua. Empirical evidence indicates a strong but focused program effect for Better Work Nicaragua. Mental health improves after the 1st and 2nd assessments. Workers are less likely to feel restless and less likely to feel sad. However, the beneficial effects dissipate. In the months following the 3rd assessment workers are more likely to report bouts of crying. BWN does not increase union membership or increase the role of unions in solving problems within the factory. However, by the 3rd assessment, workers are more likely to feel comfortable seeking help from their supervisor and no longer believe that joining a union will lead to employment termination. BWN has a significant effect on pay practices. By the 3rd assessment, workers are less likely to be concerned with late payments, low wages and a broken punch clock. Workers in BWN factories are less likely to be injured at work. Worker concerns with excess overtime decline, with the strongest effect at the 3rd assessment. Pay practices with regard to overtime improve. At the 2nd assessment, factories that were not paying for overtime transition to paying for overtime but only after the production target is complete. At the 3rd assessment, factories are more likely to pay overtime for hours above 48 per week. Importantly, there is reduced gender discrimination in wages by the 3rd cycle. BWN reduced hours in the period between the 1st and 2nd assessments. However, the effect dissipated after the 2nd assessment. BWN reduced the gender disparity in hours worked between the 1st and 2nd assessments. Female employees report working 3.282 fewer hours per week than male employees. However, the effect dissipates between the 2nd and 3rd assessments.
5. Verbal Abuse. Verbal abuse is one strategy used to elicit work effort in apparel firms. Verbal abuse is most common when firms employ high powered incentives for supervisors with low powered incentives for workers. In Vietnam, the Better Work treatment effect reduces the proportion of workers reporting any type of verbal abuse by 0.13 after four assessment cycles. The Better Work treatment effect for Indonesia reduces the proportion of workers reporting some form of verbal abuse by 0.09 by the 4th assessment cycle, though there is some decay in treatment effect following the 3rd and 4th assessments. The intensity of reported verbal abuse falls by an average of 1.0 point on a 7-point scale by the beginning of the 4th assessment, though with some decay after the 3rd and 4th assessments. The Better Work Jordan treatment effect reduces the proportion of workers reporting some form of verbal abuse by 0.42 after the 5th assessment cycle and the intensity of reported verbal abuse falls by 1.4 on a 7-point scale. Haiti does not exhibit a Better Work treatment effect. For Nicaragua, the treatment effect for Better Work is mixed. There is no effect on the proportion of workers reporting verbal abuse, but the intensity declines by 0.67 on a 7-point scale at the 3rd assessment.
6. Sexual Harassment. Sexual harassment is most common in factories that lack an organizational norm prohibiting sexual harassment and in factories in which workers have high powered incentives and supervisors have low powered incentives. Sexual harassment declines overtime and with assessment cycle in Better Work factories. In Vietnam, reports of sexual harassment are rare with fewer than four percent of respondents reporting some level of concern
xix | P a g e
at the 1st assessment. By the 5th assessment cycle, nearly all respondents report no concern and the improvement is entirely attributable to a Better Work treatment effect. Sexual harassment reports in Indonesia are far more common. Better Work appears to have had a significant treatment effect in the first three assessment cycles, accounting for a decline of 0.13 in the proportion of participants reporting concern. Average intensity rises at the 4th cycle by 0.25 but rise is caused by increased voicing to the HR manager and union. Similarly for Jordan, the proportion of workers reporting some concern declines by 0.18 and the intensity of concern declines by 0.58 on a 7-point scale, though decay occurs after the 3rd, 4th and 5th cycles, suggesting persistent challenges to sustainability. No Better Work treatment effects are found in Haiti and Nicaragua associated with duration of exposure to Better Work. However, both countries exhibit a pronounced decline in concern over time. Between 2011 and 2015, the proportion of participants concerned with sexual harassment declined by 0.52 in Haiti. Between 2012 and 2015, the proportion of participants concerned with sexual harassment in Nicaragua declined by 0.28.
7. Wages and Hours. Estimated Better Work treatment effects reduced weekly hours in Vietnam by 2.5 at the 4th assessment and raised weekly pay by USD 15.33 by the 5th assessment. Indonesia exhibits a treatment effect reducing weekly hours by 3.3 and increasing weekly pay by USD 7.38 at the 4th assessment. Hours in Jordan rose, particularly for Jordanian workers. However, there is a treatment effect of JD 9.43 on weekly pay by the 6th assessment. Haiti also exhibits a treatment effect of USD 4.50 per week at the 10th assessment.
Theory indicates that factories move through a series of pay and hours practices in order to achieve a desired level of overtime work. The most preferred strategy is to either force overtime or induce workers to voluntarily choose overtime through the practice of low base pay. If Better Work eliminates the forced overtime and low-base pay strategies, firms will opt for the dismissal threat strategy. If Better Work enforces compliance on contract duration, a firm will opt for deceptive recording of overtime hours worked. Better Work moved factories through the cascade of compliance related to hours worked, reducing total hours and raising total pay for hours worked. However, factories remained fundamentally out of compliance on overtime hours and appear to achieve excess hours by deception related to correctly recording overtime hours.
8. Coercion, Abuse, Human Trafficking and Deportation Threats. Theory indicates firms engage in coercive behavior, including human trafficking, abusive treatment and deportation threat to induce work effort from migrant workers. Crying is more common in factories that are noncompliant on deportation threats. When factory strategy is measured from the perspective of the worker, human trafficking and deportation threat both predict crying. In particular, workers who are not permitted to return home report increased incidence of crying by over 1 point on a 5-point scale. Abusive treatment, loss of control of passport, debt and a family not allowing a worker to return home predict a feeling of fearfulness. Better Work treatment effects on incidence of crying and fear are strong and persistent. Coefficients on each Better Work cycle of inspection are negative and typically becoming larger in absolute value over time. By cycle 6, the incidence of crying or fear decline by 0.57 points on a 5-point scale. Better Work also reduces the proportion of workers not able to return home due to debt by 0.15 or lack of airfare by 0.26.
xx | P a g e
9. Deceptive Pay Practice. Deceptive pay practices are modeled as the result of a prisoner’s dilemma in which firms fail to pay as promised and workers exert low effort. The prisoner’s dilemma emerges even though both the worker and the firm would be better off when firms pay as promised and the worker exerts high effort. Theoretical predictions of the model are confirmed. Workers are more likely to exert high effort in factories that share firm revenue with workers in the form of higher pay. Better Work compliance specifically related to the payment of the minimum wage is correlated with a mutually preferred outcome of high pay and high effort. Better Work appears to initially help Vietnamese firms transition to a cooperative outcome. However, decay occurs at later cycles. It is possible that deception particularly related to overtime pay emerges as a strategy for achieving targeted overtime. (See Pay and Hours for further discussion.)
10. Training. See Babbitt, Voegeli and Brown (2016).
11. Millennium Development Goals. Better Work Nicaragua diminishes extreme hunger in the months after the 2nd assessment. However, the beneficial effect decays in the 3rd cycle. Better Work Jordan exhibits strong treatment effects alleviating hunger. When asking workers to rate their intensity of hunger, cycles 3, 4 and 5 have negative and statistically significant coefficients. Importantly, the coefficients increase in absolute value with each passing cycle, indicating that the Program effect is sustained and no decay occurs at later stages. The coefficient of the dose2 variable is also negative and significant, indicating curing after the 2nd assessment. There is also evidence of a decline in extreme hunger at cycle 3. Better work Vietnam increases schooling for girls in the months following the 1st assessment. The estimated effects for all of the cycle variables and all the dose5 variable are positive, but not statistically significant. However, the lack of a sustained treatment effect is not surprising given the high school attendance rates in Vietnam preceding the introduction of the Program. A similar pattern emerges for boys in Indonesia. Better Work Haiti may have expanded access to pregnancy-related health care. Cycle7, dose9 and cycle10 treatment variables are positive and statistically significant. In the case of Vietnam, treatment effects are observed for prenatal care at the 1st and 2nd assessments. The dose1 variable is positive and significant, as is cycle2. Similar effects are observed for Indonesia. More pronounced pregnancy related Program effects are in evidence for Jordan, a significant effect in light of the low incidence of pregnancy-related health care in Jordan. At the time of the 4th and 5th assessments, and for exposure to Better Work in the months after the 5th assessment, the probability of having access to both types of pregnancy care increases. Better Work had a pronounced impact on gender disparities in pay in Haiti, Nicaragua and Vietnam. Program effects are particularly distinctive for Haiti and Vietnam. Prior to Better Work, Haitian women worked longer hours for less pay, even when controlling for position and demographic characteristics. Worker wellbeing is positively correlated with compliance along some dimensions.
12. Better Work and Firm Performance. Better Work increases the mark-up of revenue over cost by 24 percent at the 4th assessment in Vietnamese factories. Better Work also reduces the time necessary to reach the daily production target by 1.29 hour in Vietnam. Supervisory skills training lowers manpower turnover and lowers the time needed to reach an hourly production target. Buyers reward some points of compliance with larger orders. Though, order size is
xxi | P a g e
positively related to noncompliance on excess overtime. Better Work helps workers and firms coordinate on a high pay-high productivity equilibrium, escaping a prisoner’s dilemma of low pay and low effort. Sexual harassment and verbal abuse reduce productivity and raise wages. The only exception is trafficked workers who lack a sense of agency. Better Work helps firms reduce verbal abuse and sexual harassment. Compliance along some dimensions increases the mark up of revenue over average cost.
13. Sourcing Practices. Evidence for Vietnam indicates that with each passing Better Work assessment cycle, firms are increasingly likely to report that their main customer is stopping their own social audits. Firms are increasingly likely to report that their main buyers are contacting them about their Better Work assessments. Factory managers report tougher purchasing terms by Better Work assessment cycle. Supervisor stress, driven by sourcing practices, is a contributing factor to verbal abuse. Variations in technical requirements, variations in social compliance requirements, late delivery penalties, changes in technical requirements, late delivery penalties, defect penalties, replenishment orders and uncertain orders are all moderate drivers of manager reports of supervisor stress. Uncertain orders, late penalties, change in technical requirements and defect penalties are rated a serious challenge by 40-50 percent of factory managers. Only 10-12 percent of factory managers do not see such issues as a business challenge. The conflict between social compliance and sourcing is most striking when considering excess overtime. Uncertain orders make production planning involving multiple work shifts challenging. Firms with uncertain orders employ excess overtime rather than multiple shifts to manage large orders. Over 50 percent of firms report uncertain orders as a serious business challenge. Only 14 percent of factories report that uncertain orders is not a business challenge. Buyers appear to be rewarding firms with better compliance reports. However, while buyers may be rewarding overall compliance, there appears to be an exception for excess overtime. Buyers appear to be rewarding longer hours with larger orders. Manager concerns with payment terms predict low pay and low job satisfaction. Manager concerns with late fines predict long hours and low job satisfaction.
14. Performance Improvement Consultative Committees. (PICCs). The findings indicate that workers are generally positively impacted by the presence and quality of PICCs. Workers most strikingly benefit from a reduction in verbal abuse and health symptoms such as dizziness. The story for managers is more complicated. The mere presence of a PICC or union is not positively seen by managers. Managers become most positive about the PICCs when unions and women are fairly represented, workers are freely able to choose their representatives and when minutes of the meeting are taken and distributed to workers. Managers see PICCs less constructively when control of the PICC is passed from Better Work to a bipartite chair. And curiously, the more often the PICC meets the less likely a manager is to see the PICC as playing a constructive problem solving role.
15. Cambodia. Compliance in Cambodian factories trends up over each successive compliance assessment. Through public disclosure of points of noncompliance, BFC helped Cambodian firms coordinate on a high compliance equilibrium. Cambodia maintained market share after the end of the MFA as a consequence of their reputation for humane working conditions. The choice of Cambodian firms to become newly compliant after the 1st assessment predicts survival of the
xxii | P a g e
2008-09 financial crisis. BFC achieved higher compliance than reputation sensitive buyers and improved conditions in firms lacking a reputation sensitive customer.
16. Haiti Case Studies. Information collected between 2011 and 2015 from a five-year longitudinal survey is used to build case studies on management innovation and OSH in Haiti’s apparel industry. Observations from the case companies suggest a limited yet possible scope for factories to innovate and tackle challenges, even in the face of large systematic challenges, and the need for larger interventions to tackle challenges like poor infrastructure and conflict over labor codes. Factories are observed to be using LED lighting to lower energy consumption and workplace temperature. Factories are also seen to be investing in new machineries and combating air pollution and noise exposure. Preliminary recommendations include supporting efforts to increase worker-management communication, supporting environmental data collection, facilitating communication between the Haitian government and apparel factories and exploring the impact of piece rate on OSH perception and behavior.
1 | P a g e
Chapter 1 Introduction and Methodology
The impact evaluation of Better Work employs a multi-disciplinary approach. The analytical framework incorporates economics, social psychology and engineering to model work outcomes and firm choice related to human resource management and code compliance choice.
The evaluation began in 2009 with key informant interviews in each country. Key informants included Better Work staff, government officials, the ILO, union organizations, manufacturer’s associations and workers. Data for analysis includes survey and interview data collected from workers, supervisors and firm managers. Case methodology is used to explore managerial practices and occupational safety and health in Haiti. A randomized controlled trial is used to analyze a supervisory skills training program in Cambodia, Indonesia, Vietnam, Lesotho, Jordan, Nicaragua and Haiti. Quasi-experimental methodology is used to analyze the broader impact of Better Work in Indonesia, Vietnam, Jordan, Nicaragua and Haiti. Quasi-experimental data collection is ongoing in Cambodia. Analysis of the impact evaluation data begins with a theory developed to isolate the determinants of each working condition or collection of working conditions that are jointly determined. Better Work impact evaluation data is then employed to test the theory and determine whether Better Work is disrupting processes that lead to poor work outcomes and supporting processes that promote humane work outcomes. The analysis also yields information on the impact of compliant behavior on firm performance.
1.1 Identification Strategy
Establishing a causal relationship between Better Work assessments, advisory services and training requires that there be some randomness in the exposure to Better Work at the point when data is collected. Random exposure to Better Work would be most directly accomplished by employing a randomized controlled trial. In the case of supervisory skills, it was possible to randomly assign supervisors to one of two treatment groups. However, most of the Better Work intervention is a factory level treatment. Random assignment to the broader Better Work program was not possible.
One source of random exposure is generated by the timing of enterprise assessments. Each assessment is unannounced and typically occurs in a window of 10 to 13 months after the preceding assessment. The impact of an assessment can be detected by performing a data collection after one factory has received an assessment but before a second similar factory has had an assessment.
A second source of random exposure can be introduced through the timing of the data collection. The impact of exposure to months of treatment can be detected by randomly assigning factories to the number of months that elapse between two data collections.
The sequence of data collection is depicted in the figure to the right. A factory will have an assessment that is referred
2 | P a g e
to as a cycle. Some months after the assessment, a data collection will occur. The time that elapses between the assessment and the data collection is the dose. The dose measures the number of months of treatment following the assessment.
The identification strategy is indicated in the two figures below. Consider four factories that have been in Better Work for about 24 months. All are ready for their 3rd assessment.
In the panel on the left, both factories receive their 3rd assessment at about the same time. Factory 1 then receives a data collection shortly thereafter. Factory 2 receives a data collection several months latter. Comparing the data for factory 2 relative to factory 1, controlling for year and month, provides a measure of the impact of months of exposure to Better Work.
In the panel on the right, Factory 3 receives its 3rd assessment 11 months after the 2nd assessment. Factory 4, receives its 3rd assessment 13 months after its 2nd assessment. If a data collection occurs in the intervening period, comparing the data for factory 3 relative to factory 4, controlling for year and month, provides a measure of the impact of the 3rd assessment.
Cycle and dose effects are estimated with the following equation:
where 𝑋𝑋𝑖𝑖𝑖𝑖 is the outcome variable of interest for factory i at time t, the cycle variables are binary and the dose variables are months elapsed since the last assessment. The equation is controlled for month and year to acount for secular events and firm characteristics Z.
A classic treatment effect would be indicated if the coefficients on the cycle variables are increasing in magnitude with each assessment and the coefficients of the dose variables have the same sign as the coefficients of the cycle variables. If the cycle coefficients increase in size, then the treatment effect is rising with each successive assessment. If the coefficients on the dose variables are the same sign as for the cycle variables then the treatment effect is curing in the months following the assessment. However, if the sign on the coefficient of the dose variable is opposite the sign for the cycle variable, then the treatment effect is decaying following an assessment.
A factory level panel estimator with random effects is used to estimate the equation above.
24 months: Factory 3&4 data collection
Factory 3 Assessment 3
Factory 4 Assessment 3
Assessment 3: Factory 1&2
Factory 1 Data Collection
Factory 2 Data Collection
3 | P a g e
1.2 Impact Indicators
Several levels of indicators are collected to measure program impact. Firm managers are queried on supply chain position, products, costs, revenue, production system, human resource system and measures of firm performance. Workers are queried on basic demographics, perceptions of working conditions and human develop indicators.
Manager and worker perceptions of working conditions are merged with compliance and training data. Each worker is a record in the data. Corresponding to the worker is the worker’s own reports of working conditions, business and working conditions perceptions of managers, Better Work assessments at the most recent previous assessment and training completed.
Better Work treatment is measured by the cycle, dose and training variables. There is one binary cycle variable for each assessment cycle. There is one dose variable corresponding to each assessment cycle. The dose measures the number of months that have elapsed since the most recent previous assessment. Training is a binary variable indicating whether the factory received each type of training prior to the data collection and how much time has elapsed since training. Response to elapsed time since training indicates whether curing or decay in the period following training.
1.3 Occupational Safety and Health
Enterprise assessments collect information concerning compliance with a set of questions related to occupational safety and health. The impact evaluation survey asks whether workers perceive an improvement in health symptoms. Workers are asked to rate the frequency of work-related health symptoms such as fatigue, headache, backache, stomach pain, skin problems, dizziness, hunger and thirst. Responses are coded on a scale of 1=Never to 4=Everyday. The evaluation then turns to concerns workers might have about environmental working conditions. The workers are first asked to rate their satisfaction with workplace facilities including water, the toilet, the canteen and the dormitory. Responses are coded on a scale of 1=Not satisfied at all to 4=Very Satisfied. Ambient working conditions are assessed by asking whether workers in the factory have concerns about temperature, injuries, air quality, chemical smells and dangerous equipment. Responses are coded as 0 = not concerned or 1 = some level of concern. The concern variables are averaged across workers within a factory.
1.4 Nicaragua
Better Work Nicaragua is assessed on compliance trends and the program’s impact on mental health, problem solving, freedom of association and collective bargaining, abusive treatment, pay practices, occupational safety and health, physical health symptoms and wages and hours.
1.5 Verbal Abuse
Theory and empirical evidence indicate that verbal abuse has three principle causes. Compensation structures that do not align incentives within an organization are a principle driver. Supervisors may lack the skills to employ positive motivational techniques. Production pressure augmented by delivery penalties increase stress among supervisors, undermining attempts by supervisors to employ the skills they do have.
4 | P a g e
Rourke (2014) has demonstrated that factories characterized by verbal abuse are less profitable than other firms.1 The negative relationship between verbal abuse and firm profits is illustrated in Figure 1.5.1 for Vietnamese firms. Verbal abuse reports averaged within a factory are indicated on the horizontal axis. Verbal abuse is coded as 0=No Verbal Abuse and 1=Yes Verbal Abuse. The ratio of revenue to cost is indicated on the vertical axis. As can be seen by the density of points close to the origin, many factories have few reports of verbal abuse, both high performing and low performing firms. However, among the factories that have significant reports of verbal abuse, as the number of verbal abuse reports rises, revenue relative to cost declines. Such a relationship indicates that removing verbal abuse will not guarantee an increase in profits but it is a necessary condition. High performance firms do not have high incidence of verbal abuse.
Better Work impact is measured by surveying workers on whether verbal abuse is a concern for workers in their factory. Workers are offered seven possible responses: (1) no, not a concern, (2) yes, discussed with co-workers, (3), yes discussed with supervisor or HR manager, (4) yes, discussed with trade union representative, (5) yes, considered quitting, (6) yes, almost caused a strike and (7) yes, caused a strike. Responses are coded in two ways. A binary variable is created and coded as 0 if the worker responds that verbal abuse is not a concern or 1 if the worker responds with any form of concern. Alternatively, an intensity variable is created ranging from 1 if the worker responds “no, not a concern” to 7 if the worker responds “yes, caused a strike.” For the purpose of the analysis reported below, factory averages of each measure are used as the dependent variable.
Figure 1.5.1 Verbal Abuse and the Price-Cost Ratio Vietnam
1 Rourke, Emily. 2014. “Is There a Business Case Against Verbal Abuse? Incentive structure, verbal abuse, productivity and profits in garment factories.” Better Work Discussion Paper Series: No. 15, September.
0
1
2
3
4
5
6
7
8
9
10
0 0.05 0.1 0.15 0.2 0.25 0.3 0.35 0.4
Profitability and Verbal Abuse
5 | P a g e
1.6 Sexual Harassment
Theory and empirical evidence indicate that sexual harassment has two principle causes. The absence of an organizational norm deterring sexual harassment encourages those with a predisposition to take advantage of opportunities available. An opportunity to sexually harass is created when workers have high powered incentives and their supervisors have low powered incentives.
Lin, Babbitt and Brown (2014) have demonstrated that factories characterized by sexual harassment are less profitable than other firms.2 The negative relationship between verbal abuse and firm profits is illustrated in Figure 1.6.1 for Vietnamese firms. Sexual Harassment reports averaged within a factory are indicated on the horizontal axis. Sexual Harassment is coded as 0=No Sexual Harassment and 1=Yes Sexual Harassment. Firm profit, as measured by the ratio of revenue to cost, is indicated on the vertical axis. As can be seen by the density of points close to the origin, many factories have few reports of sexual harassment, both high performing and low performing firms. However, among the factories that have significant reports of sexual harassment, as the number of sexual harassment reports rises, profits decline. Such a relationship indicates that removing sexual harassment will not guarantee an increase in profits but it is a necessary condition. High performance firms do not have high incidence of sexual harassment.
Better Work impact is measured by surveying workers on whether sexual harassment is a concern for workers in their factory. Workers are offered seven possible responses: (1) no, not a concern, (2) yes, discussed with co-workers, (3), yes discussed with supervisor or HR manager, (4) yes, discussed with trade union representative, (5) yes, considered quitting, (6) yes, almost caused a strike and (7) yes, caused a strike. Responses are coded in two ways. A binary variable is created and coded as 0 if the worker responds that sexual harassment is not a concern or 1 if the worker responds with any form of concern. Alternatively, an intensity variable is created ranging from 1 if the worker responds “no, not a concern” to 7 if the worker responds “yes, caused a strike.” For the purpose of the analysis reported below, factory averages of each measure are used as the dependent variable.
2 Lin, Xirong, Laura Babbitt and Drusilla Brown. 2014. “Sexual Harassment in the Workplace: How does it affect firm performance and profits?” Better Work Discussion Paper Series: No. 16, November.
6 | P a g e
Figure 1.6.1 Sexual Harassment and Firm Profits in Vietnamese Apparel Factories
1.7 Wages and Hours
Workers are asked how often they are paid and how much they received the last time they were paid. This information can be used to calculate weekly pay, converted into U.S. dollars. They are also surveyed on which days of the week they usually work and start and end times for each day. This information can be used to calculate weekly hours. We then estimate a weekly pay equation and a weekly hours equation. Both equations are controlled for demographic characteristics, year and month. The weekly pay equation is controlled for by weekly hours.
A theoretical model exploring the relationship between wages, hours, dismissal threats and verbal abuse predicts that firms will proceed through a cascade of noncompliance related to overtime.3 Profits are maximized using a strategy of low base pay or forced labor. If workers experience a lost sense of agency when subject to coercive behavior, firms will also employ a strategy of verbal abuse. When firms are deterred from the low base pay and forced overtime strategies by Better Work, they will substitute dismissal threats against workers who refuse overtime. All three strategies are complemented by verbal abuse. Verbal abuse declines when factories move to a dismissal threat strategy, but return again if firms are constrained in their ability to use dismissal threats.
Empirical evidence is consistent with the theoretical predictions. The compliance profile in Vietnam is consistent with the theoretically predicted cascade.
3 Rubin, Janet, Laura Babbitt, Drusilla Brown and Rajeev Dehejia. 2015. “Wages, Hours and the Cascade of Non-Compliance.” Tufts University.
0
1
2
3
4
5
6
7
8
9
10
0 0.02 0.04 0.06 0.08 0.1 0.12 0.14 0.16 0.18
Profitability and Sexual Harassment
7 | P a g e
Noncompliance with minimum wage law and forced overtime are initially low and decline nearly to zero over five assessment cycles. Fewer than 15 percent of Vietnamese factories are noncompliant on forced overtime and minimum wage law at the 1st cycle. This figure drops to three percent by the 5th cycle.
Noncompliance on probationary contracts is initially higher. At the 1st assessment, nearly 50 percent of factories are noncompliant. The noncompliance rate falls nearly to zero by the 5th assessment.
However, noncompliance on overtime persists through all cycles. Average noncompliance rates on the daily limit on overtime range between 0.8 and 0.9 for cycles 1 through 4, dropping to 0.5 on the 5th cycle. Average noncompliance on weekly rest is 0.6 on the 1st assessment and falls only to 0.35 by the 5th assessment.
Persistence in noncompliance on overtime may be made possible by the use of deceptive pay practices with regard to overtime. At the 1st assessment, 32 percent of factories are noncompliant on correct pay for ordinary overtime. Noncompliance declines to 20 percent of factories by the 2nd assessment. However, from the 3rd assessment forward, the noncompliance rate climbs each cycle, rising above 45 percent by the 5th cycle. A similar pattern emerges for noncompliance on correct pay for overtime on weekly rest days. Though, it should be noted that the apparent re-emergence of deceptive pay practices may simply reflect compliance on record keeping.
Analysis of Vietnamese data provides the following conclusions concerning the impact of Better Work on the wages-hours-verbal abuse complex.
1. Abusive treatment adversely affects a worker’s sense of agency, as measured by a feeling of hopelessness about the future, and that lost sense of agency reduces pay. Both conditions are necessary for verbal abuse to be part of a profit-maximizing strategy.
2. Evidence that Better Work is eliminating the low base pay strategy is provided by analysis of worker concerns with low pay. The Better Work treatment variables cycle3, cycle4, cycle5, dose4 and dose5 are all negative and significant predictors of worker concerns with low pay. The negative cycle coefficients indicate a treatment effect and the negative dose coefficients indicate curing. Worker concerns with low pay continue to diminish in the months following an assessment.
3. Evidence that Better Work is eliminating the forced overtime strategy is provided by analysis of compliance and survey data. The cycle2 and cycle3 variables are statistically significant and negative predictors of noncompliance on forced overtime. Further, worker concerns with excess overtime decline at the 4th and 5th assessments. However, unlike with low wage concerns, the Better Work effect decays after an assessment. The coefficients on dose4 and dose5 are both positive and statistically significant.
4. Evidence that the low base pay strategy induces firms to switch to a dismissal threat strategy emerges from analysis of the worker survey data. A decline in concern with low pay predicts an increase in noncompliance on probationary contracts.
8 | P a g e
5. Better Work largely deters firms from transitioning to a dismissal threat strategy. The Better Work treatment variables cycle2, cycle4, cycle5 and dose1 are all negative predictors of probationary contract violations.
By eliminating the low base pay, forced overtime and dismissal threat strategies, Better Work is increasing the cost of excess overtime. The Better Work treatment variables in the wage equation are nearly all positive. While there is evidence of decay following the 4th assessment, there is evidence of curing after the 5th assessment. The improvement in wage outcomes but not overtime outcomes indicates a strong motivation on the part of factories to persist in excessively long hours of work despite the increasing cost imposed by compliance on overtime work.
The persistence of overtime abuse suggests the existence of yet another strategy not anticipated by the theoretical model. Compliance evidence suggests that firms engage in deceptive pay practices with regard to overtime. Though, it should be noted that noncompliance on properly recording hours and pay may simply be a consequence of a factory’s willingness to reveal information about actual pay and hours rather than maintaining two sets of accounts.
The persistent pressure on overtime may be occurring due to a lack of managerial capital. However, delivery pressure from customers is likely a significant contributing factor. It is not uncommon for buyers to place orders irregularly or to concentrate orders in particular times of the year, to impose significant late delivery penalties, change technical requirements or surprise a factory with replenishment orders. These issues are topics of future research.
1.8 Coercion, Abuse, Human Trafficking and Deportation Threats
In 2006, a labor advocacy group, the Institute for Global Labour and Human Rights, investigated working conditions in Jordanian garment factories and issued a concerning report detailing excessive working hours, nonpayment of wages, confiscation of passports, and recruitment practices that trapped workers in debt. While contesting the details of the report, the Jordanian government declared its commitment to improving working conditions and adopted several new inspection and monitoring systems. As a part of the initiative to improve working conditions, Better Work Jordan was established in 2008.
Schupmann, Babbitt and Brown (2016) provide a general theory for coercive behavior, including human trafficking, abusive treatment and deportation threat to induce work effort from migrant workers.4 Coercion includes abusive treatment that reduces a sense of agency, restrictions on movement, control of documents, debt and deportation threats.
The agency variables are derived from the mental health questions. About half of the sample is asked whether they are troubled or bothered by crying and the other half is asked about feeling fearful. In order to increase the sample size, the two measures are combined into a single variable called Agency. Workers are asked to rate crying or feeling fearful on a scale of 1 to
4 Schupmann, Claire, Laura Babbitt and Drusilla Brown. 2016. “Coercion: Abuse, Human Trafficking and Deportation Threats: An Analysis of Firm Incentive Strategies and Better Work Interventions in Jordanian Apparel Factories,” March.
9 | P a g e
5,with 1 = never and 5 = all of the time. The average response for Crying is 1.77 and the average response for Fearful is 1.54.
Workers are also asked to rate their experience with control of their passport, passport seizure and deportation threat as punishments and whether they could go home if they wanted to.
Deportation threat is indicated if the worker believes that one of the punishments for misconduct is to be deported. Deportation threat is coded as 1=yes, deportation threat is a punishment and 0=otherwise. Only 1.5 percent of workers report deportation threat, which is consistent with the rate of noncompliance detected by Better Work Enterprise Advisors.
Evidence of human trafficking is indicated if a worker reports that the factory has control of her passport or that seizure of passport is a form of punishment. Lack of control of a worker’s passport is reported by 20.6 percent of workers in the sample. Loss of passport as a punishment is very rare. Workers are also asked if they could go home if they wanted to. If the worker responded, “no”, then several explanations are offered: lacking airfare, too much debt, contract restrictions and lack of control of their passport. Workers can also indicate that the factory or their family will not let them. The most common reasons for not being able to go home are lack of airfare (12.7%) and a requirement that they complete their contract before returning home (21.6%). Debt (5.3%), lack of possession of passport (2.5%) and factory refusal to allow the worker to go home (1.6%) are secondary concerns.
1.9 Deceptive Pay Practices.
Deceptive pay practices are modeled as the result of a prisoner’s dilemma in which firms fail to pay as promised and workers exert low effort. The prisoner’s dilemma emerges even though both the worker and the firm would be better off when firms pay as promised and the worker exerts high effort. Evidence of a treatment effect for Better Work exists if (1) workers are more likely to exert high effort in factories that share firm revenue with workers in the form of higher pay and (2) Better Work compliance specifically related to pay practices helps firms transition from a prisoner’s dilemma outcome of low pay and low effort to a mutually preferred outcome high pay and high effort.
1.10 Training. See Babbitt, Voegeli and Brown (2016).
1.11 Human Development
The Better Work impact evaluation was designed, in part, to identify the role of the program in reaching the Millennium Development Goals (MDG). Specific attention is paid to Goal 1 Eradicating Extreme Hunger and Poverty, Goal 2 Achieving Universal Primary Education, Goal 3 Promoting Gender Equality and Women’s Empowerment and Goal 5 Improving Maternal Health.
1.12 Firm Performance
Firm performance is measured in terms of profitability, productivity and personnel retention. A translog price-cost function is estimated for Vietnamese apparel firms. Productivity is measured by the time it takes workers to complete the daily production target on Friday, controlling for the
10 | P a g e
length of the workweek. Personnel retention is measured by the effect that Better Work interventions play in affecting the probability that an individual will remain employed.
1.13 Sourcing Practices
Factory managers optimizing choices related to social compliance are governed in part by the cost of compliance, production technology, worker preferences and the social context of the work place. Perhaps equally important is the larger market context in which factories function, particularly the structure of incentives established by a factory’s principle customers. Order size, order regularity, quality expectations and delivery terms are accompanied by a set of penalties and rewards for firm performance and social compliance.
The tension between buyer demands for factory performance related to production and social compliance is well documented. To the extent that buyers believe that social compliance is costly and organizationally separate compliance and sourcing units, factory managers may feel compelled to sacrifice social compliance to achieve expected production performance.
We analyze the impact of sourcing practices on supervisor stress, verbal abuse, excess overtime, perceptions of business relations, firm productivity and compliance choices by vendors.
Support to participating firms in Better Work is provided through training and advisory services. At the time of the 2nd assessment, firms are typically encouraged to create a performance improvement consultative committee or PICC. PICCs bring together workers and managers in an attempt to cooperatively solve problems. Worker members of the PICCs are then expected to transmit the minutes of the PICC meetings to their peers.
PICCs vary in quality. From the perspective of Better Work, desirable qualities include the following:
1. The union is fairly represented in the PICC. 2. The proportion of PICC members that is female should be similar to the proportion of the
workforce that is female. 3. Worker representatives on the PICC should be freely chosen from a set of candidates and
there should be more than one choice. 4. The PICC should meet regularly and both workers and managers should be involved in
chairing meetings. 5. The PICC should have the ability to meet without a Better Work advisor present. 6. PICC deliberations should be reported in meeting minutes and those minutes should be
transmitted to the workers. 7. PICC members should be adequately trained to execute their responsibilities. 8. The outcome of deliberations should be considered in factory management decisions.
In order to assess the role that the quality of the PICCs plays in determining worker and firm outcomes, progress reports submitted by Better Work enterprise advisors in Vietnam, Jordan and Indonesia were coded. PICC quality data were then merged with worker and manager surveys
11 | P a g e
and compliance findings. The merge is executed so that survey data is matched to the closest previous assessment and progress report.
PICC data is used to determine the contribution of PICC quality to outcomes related to worker perceptions of their relation with their supervisor, outcome of grievance processes and willingness to seek help from the trade union representative. Indicators of working conditions include reports of verbal abuse, physical symptoms such as fatigue, dizziness, aches and thirst, assessment of facilities such as the health clinic, canteen, drinking water and toilet, OSH conditions including air quality and chemical smells and mental health indicators such as feeling restless, fearful, sad or hopeless. The contributions to compliance focus on collective bargaining, discrimination and interference with the union and union operations. Finally, the PICC is assessed by factory managers in terms of the perceived ability of the PICC, worker committees and the union to help resolve conflicts between workers and managers and the effect that PICC quality has on supervisor stress.
1.15 Better Factories Cambodia
Better Factories Cambodia began a decade before the impact evaluation. Evaluation analysis focuses on the historical trends in compliance, the role of BFC in improving the compliance performance of firms lacking a reputation sensitive buyer, the role of BFC in helping Cambodian firms coordinate on a high working conditions equilibrium and the role that compliance played in helping Cambodian firms survive the 2008-09 financial crisis.
1.16 Haiti Case Studies
As part of the evaluation of Better Work in Haiti, a longitudinal case study focusing on managerial innovation is being conducted. A companion case study examines occupational health and safety. The report, based primarily on interviews conducted in 2015, found that innovations are occurring in case company factories and some of the innovations observed in 2015 or in the planning stage are consistent with sustainable development. The innovation case study focuses on understanding how and why innovation in apparel factories occurs, and on understanding whether there is a relationship between innovation and improved working conditions. After discussing the analytical framework, case selection and methods are presented. Following an overview of case companies, primary challenges facing companies are identified, and innovations are enumerated. Innovations are then compared to challenges, and capacity of case companies is explored using five factors: leadership, structures, culture, resources and understanding.5
.
5Harris, Neal. 2007. “Corporate Engagement in Processes for Planetary Sustainability: Understanding Corporate Capacity in the Non-Renewable Resource Extractive Sector, Australia.” Business Strategy and the Environment 16, 538-553.
12 | P a g e
Chapter 2 Better Work Compliance Trends
Factory engagement with Better Work begins with an enterprise assessment against a Compliance Assessment Tool (CAT). Points of compliance fall into eight broad categories: freedom of association and collective bargaining (FACB), occupational safety and health (OSH), contracts and human resources (CHR), Discrimination, Forced Labour, Child Labour, Compensation and Working Time. At each assessment cycle, a Better Work enterprise advisor records a 0 for ‘no evidence of noncompliance’ or 1 for ‘not compliant’ for each compliance question. The compliance summaries presented below report national averages at each assessment cycle drawn from a balanced panel in each Better Work country.
In addition to assessments, each Better Work country program produces an annual Compliance Synthesis Reports summarizing the findings of each year's enterprise assessments. Below, findings from the Synthesis Reports are used in conjunction with assessment data to characterize basic trends within countries.
Overall, major noncompliance in the areas of occupational safety and health remains an issue. Many of the graphs also provide corroborating evidence for the theory of compliance strategy switching. Better Work appears to force factories down a cascade of noncompliance; factories move from most preferred to less preferred business strategies, especially in areas of wages and hours.
While there are hundreds of compliance questions, a select few will be presented to highlight the most interesting and significant changes in factory compliance trends. A full list of compliance points in each country and observed trends can be found in Appendices 1 to 5. Compliance points are sorted by (1) always compliant, (2) always noncompliant, (3) trending toward compliance, (4) trending toward noncompliance and (5) no compliance trend.
2.1 Better Work Vietnam
Better Work Vietnam has released eight Compliance Synthesis Reports since 2010 beginning in December 2009, assessing compliance data for participating firms. Of the 302 factories for which compliance data is available in Vietnam, 174 were assessed twice, 136 three times and 91 four times. Compliance graphs are therefore generated for four cycles, providing year-to-year comparisons. The compliance data is grouped into the ten groups with the number of questions asked reported in Table 2.1.
In the Compliance Synthesis Report released in August 2015, non-compliance is highest in the OSH cluster. Though there has been some improvement, FACB, Compensation (paid leave), CHR and Working Time clusters still exhibit high noncompliance. In contrast, low noncompliance can be found in Forced Labour, Child Labour and Discrimination.
Child Labour. Turning first to child labour, significant compliance improvements in the child labour cluster is demonstrated with the question, “Does the employer have a reliable system in place to verify the age of workers prior to hiring?” Initially, 24 percent of the 302 factories were reported noncompliant. By the 2nd cycle, 17 percent (of 174) were noncompliant.
13 | P a g e
Noncompliance fell to 12 percent (of 136) by the 3rd cycle and in the end, only two percent (of 91) factories were noncompliant, as can be seen in Figure 2.1.
Compensation. Though there have been improvements since the 1st cycle, compensation remains a point of high noncompliance. When asked, “Does the employer settle claims for sick leave and maternity leave within 3 working days?” 94 percent of factories are found noncompliant at the 1st assessment. This number gradually reduced to 82 percent, 73 percent and 49 percent in the 2nd, 3rd and 4th cycles, respectively. However, despite the 45 percent decrease, 49 percent remain noncompliant.
Freedom of Association and Collective Bargaining. The FACB cluster did not display significant improvement, especially regarding the question, “Can workers freely form or join the union of their choice?” Only 1 out of 184 factories was compliant in the 1st cycle and none of the assessed factories was compliant in the 2nd, 3rd and 4th cycles.
Occupational Safety and Health. OSH compliance is more varied. Factories exhibit a steady improvement on the question, “Does the employer regularly inspect and maintain machines, equipment, buildings and stores?” as can be seen in Figure 2.2. At the 1st assessment, 24 percent of firms were noncompliant, falling to 4 percent by the 4th assessment. By contrast, an upward trend is observed in the question “Does the workplace have a fire detection and alarm system?” as can be seen in Figure 2.3. Approximately 25 percent of firms are noncompliant at the 1st assessment. Improvement emerges at the 2nd and 3rd assessments, but approximately 25 percent of firms are again noncompliant at the 4th assessment. A possible reason behind this contrast could be that regular inspection requires fewer financial resources as compared to installing fire detection and alarm systems. Another reason could be that deception concerning inspection and maintenance is easier than for a physical investment such as an alarm system.
Similar patterns can be observed from other pairs of graphs. There is an apparent downward noncompliance trend for the question “Are workers effectively trained to use machines and equipment safely?” as can be seen in Figure 2.4. However, the question “Are any of the emergency exits inaccessible, obstructed or locked during working hours, including overtime?” demonstrates an upward trend in noncompliance after the 1st cycle, as can be seen in Figure 2.5. The contrast might again be explained by the inherent subjectivity of being “effectively” trained versus the more objective accessibility of emergency exits, though it may also be easier for factories to appear compliant on training.
Additionally, the observed pattern is consistent with the latest (8th) synthesis report that notes that even though “noncompliance is highest and most concentrated in the OSH cluster, with rates at or above 70 percent in 6 out of the 8 compliance points … compliance has fallen 19 percent in the area of OSH management, largely as a result of new and more stringent requirements in the assessment process.”6
Working Time. Minimal improvement in compliance is also revealed by the question, “Does the employer comply with daily limits on overtime hours worked?” At the 1st cycle, 85 percent of firms are noncompliant, rising to over 90 percent in the 2nd cycle and then falling to 80 percent in 6Better Work Vietnam: Garment Industry 8th Compliance Synthesis Report, July 2015, p.5.
14 | P a g e
3rd and 4th cycles, as can be seen in Figure 2.6. Overtime remains an important issue for Better Work to address. Patterns of noncompliance are consistent with findings of differing factory strategies employed to optimize wages and hours. Though it should be noted that while overtime violations remain common, considerable improvement is in evidence on worktime records, as can be seen in Figure 2.7. Noncompliance falls from about 50 percent at the 1st assessment to about 30 percent by the 4th assessment.
Figure 2.3 Fire Detection and Alarm System Compliance Vietnam
Figure 2.4 Trained to Use Machines and Equipment Compliance Vietnam
17 | P a g e
Figure 2.5 Emergency Exits Unlocked During Work Hours Compliance Vietnam
Figure 2.6 Daily Limits on Overtime Compliance Vietnam
18 | P a g e
Figure 2.7 Work Time Records Actual Hours Worked Compliance Vietnam
Table 2.1 Compliance Categories Question Counts Vietnam Freedom of Association and Collective Bargaining (FACB) 48
Key Strengths and Process Integrity 35
Occupational Safety and Health (OSH) 30
Contracts and Human Resources (CHR) 29
Supplier Information 20
Discrimination 14
Forced Labour 13
Child Labour 12
Compensation 12
Working Time 12
19 | P a g e
2.2 Better Work Indonesia
Compliance Summary Statistics. Compliance data currently exist for 148 factories across 5 cycles in Indonesia. Out of the 148 factories, 80 were visited twice, 38 three times, 13 four times and 1 five times. Thus a balanced panel is drawn from 25 factories which received a first, second and third Better Work compliance visit. The most distinctive observed trends are presented below with supplemental context from the Synthesis Reports.
Always Compliant. Better Work Indonesia (BWI) factories were always compliant for the majority of questions under the Child Labor category, all questions under the Forced Labor category, some Compensation and Working Time questions, some legal requirements under the CHR, questions under the Discrimination category, including treatment toward workers with disabilities, the majority of questions under the FACB, including questions regarding union membership and participation in strikes, and some OSH questions, such as those concerning enough safe water, protection against fire and adequate light.
Achieved Compliance. After participation in Better Work, many factories achieved compliance in several areas under the Child Labor, Compensation, CHR, Discrimination, FACB, OSH and Working Time categories.
Two notable examples are within the OSH category. At the first visit, nearly 30 percent of factories were not compliant with safety warnings being posted in the workplace but all factories are compliant by the 3rd assessment, as can be seen in Figure 2.8. Similarly, over 60 percent of factories did not have a written OSH policy at the 1st assessment but by the 3rd visit all did, as can be seen in Figure 2.9. Further, nearly 50 percent of the factories did not comply with requirements on HIV/AIDs, but by the 3rd visit, all of them did, as can be seen in Figure 2.10. OSH remains one of the more challenging areas for achieving compliance. However, these three particular compliance points represent easy, low investment changes for factories, which may contribute to the perfect compliance rate achieved by the 3rd cycle.
Another area of achievement for Better Work Indonesia is that of overtime hours. Compliance assessments found factories dropping from 20 to 30 percent noncompliant to full compliance in several important overtime areas, including correct pay for overtime (Figure 2.11), voluntary overtime (Figure 2.12), correct pay for work on public holidays (Figure 2.13) and correct pay for personal leave (Figure 2.47). BWI also achieved full compliance on an important issue of gender discrimination, “Does the employer pay workers correctly when they are ill during the 1st and 2nd days of menstruation?” as can be seen in Figure 2.14.
Trending Toward Compliance. For some compliance questions, the percentage of compliant factories increased with each visit, but a nontrivial percentage of factories were still noncompliant by the 3rd visit. Compliance questions for which a large fraction of factories were still noncompliant include provision of health care benefits through JAMSOSTEK or another comparable provider, correct pay rate for ordinary overtime hours worked, harassment, bullying, or humiliating treatment, hiring of disabled workers, creation of an OSH committee (Figure 2.15), labeling of chemical substances, accommodation of standing workers (Figure 2.16), fire
20 | P a g e
detection and alarm systems, accessibility of emergency exits and undertaking an OSH assessment (Figure 2.17).
Factories made significant improvement toward providing adequate hand washing facilities and adequate soap, enough free, safe drinking water and provision of personal protective equipment (Figure 2.18). However, about ten percent of factories still remain noncompliant in these areas.
Several OSH points remain noncompliant. While emergency exits and escape routes being clearly marked falls from 65 to 15 percent noncompliant (Figure 2.19), approximately 30 percent of factories are noncompliant in maintaining accessible, unobstructed and unlocked emergency exits (Figure 2.20) at the 3rd assessment.
Some noncompliance also persists for overtime pay and hours. By the 3rd cycle, nearly 30 percent of factories still had working time records that inaccurately reflected the correct pay for overtime (Figure 2.21) and accurate time records (Figure 2.22). Around 30 percent of the factories observed at the 3rd cycle had regular weekly working hours that exceed 40 hours, as can be seen in Figure 2.23. However, for the question: “Do regular daily working hours exceed legal limits (7 hours a day, 6 days a week or 8 hours per day, 5 days a week)?” only between 10 and 20 percent of factories observed at the 3rd cycle were noncompliant, as can be seen in Figure 2.24. Furthermore, by the 3rd cycle over 55 percent of factories still had overtime hours on regular workdays that exceeded 14 hours a week, as can be seen in Figure 2.25.
No trend. Many compliance questions showed no significant trend either toward or away from noncompliance. Examples include breastfeeding breaks (Figure 2.26), safe buildings and legal permits (Figure 2.27), machine guards (Figure 2.28), eating areas (Figure 2.29), accident records (Figure 2.30) and information about the CBA (Figure 2.31).
Some compliance questions exhibit an increase in the noncompliance rate between the 1st and 2nd assessments and then a decrease in the noncompliance rate between the 2nd and 3rd assessments. Examples include the provision of meals of at least 1,400 calories to workers working overtime for 3 hours or more, the provision of special medical checks and effective training of workers to use machines and equipment safely.
Other compliance questions showed a decrease in the noncompliance rate between the 1st and 2nd visits and then an increase in the noncompliance rate between the 2nd and 3rd visits. Questions for which this pattern emerges include provision of a copy of the work agreement in Bahasa to workers, compliance of company regulations with legal requirements, acceptable temperature in the workplace, readily accessible first aid boxes/supplies, medical checks for workers, inventory of chemical and hazardous substances, training of workers to use personal protective equipment, provision of weekly rest and limit of overtime on regular workdays to 3 hours per day.
Regarding the question on first aid boxes/supplies in the workplace, it is concerning that the noncompliance rate decreased to below 85 percent by the 2nd visit, but then increased to 100 percent by the 3rd visit. Again we find that OSH is an area where factories struggle with compliance and Better Work cycles do not exhibit a clear picture of improvement.
Furthermore, regarding the question on the correct payment of workers during personal leave (not including paternity leave), the noncompliance rate went down to zero by the 2nd visit, but
21 | P a g e
then increased to nearly 15 percent by the 3rd visit, as can be seen in Figure 2.47. Similarly, regarding the question on the provision of weekly rest (1 day after 6 days of work, or 2 days after 5 days of work), the noncompliance rate went down to zero by the 2nd visit and then increased to almost 15 percent by the 3rd visit.
Trending Toward Noncompliance. For some compliance questions, the percentage of noncompliant factories increased with each subsequent visit. Examples include suitable chairs (Figure 2.32), legal disciplinary measures (Figure 2.33), hazardous chemical storage (Figure 2.35), washing facilities in the event of chemical exposure (Figure 2.36), training in the use of fire-fighting equipment (Figure 2.37), first aid officers (Figure 2.38), legal limits on work agreements (Figure 2.39), termination benefits (Figure 2.40), 3 months of maternity leave (Figure 2.41), acceptable temperatures (Figure 2.42) and use of subcontracts (Figure 2.43). In some cases, improvement emerges at the 2nd assessment followed by subsequent deterioration. Examples include training in the use of PPE (Figure 2.44), inventory of hazardous substances (Figure 2.45), safe machine use (Figure 2.46), labor law compliance (Figure 2.48), a work agreement in Bahasa (Figure 2.49), 3 hours of regular overtime (Figure 2.50) and weekly rest (Figure 2.51).
In fact, some compliance questions showed large percentage increases in noncompliance rates between the 1st and 3rd assessments. Under the CHR category, questions for which noncompliant factories increased include limits on the use of work agreements for a specified period of time, requirements concerning sub-contracted workers, benefits for resigned or terminated workers and disciplinary measuring complying with legal requirements. Under the Working Time category, a greater percentage of factories became noncompliant with respect to providing 3 months of maternity leave.
Noncompliance increased for many OSH questions including adequately trained first aid officers, training of workers to use fire-fighting equipment, chemical storage, chemical safety data sheets, adequate washing facilities and cleansing materials, suitable chairs and adequate accessible toilets separated by sex. Notably, the percentage of noncompliant factories with respect to adequately trained first aid officers increased from 20 percent to over 70 percent by the 3rd assessment (Figure 2.38). Similarly, the percentage of factories noncompliant in training an appropriate number of workers to use the fire-fighting equipment increased from zero to over 80 percent (Figure 2.37).
One of the most interesting areas of noncompliance, and an observed strategy of exploitation, is in the area of contracts. Factories moved toward noncompliance in adhering to short-term contract limits, subcontracting and providing termination benefits to workers who resign, as can be seen in Figures 2.39 and 2.40. This particular strategy relies on the threat of termination for short term contracts to force workers to remain in harsh working conditions.
Always Noncompliant. For some compliance questions, the percentage of noncompliant factories remained around the same throughout each visit. Several of these points of noncompliance are important OSH measures that Better Work has been unable to shift in factories. Importantly, 100 percent of factories were noncompliant at the 3rd assessment with respect to ensuring that the building is safe and maintaining legally required permits.
22 | P a g e
Additionally, between 24 and 30 percent of factories remain noncompliant in keeping their workers adequately informed of the collective bargaining agreement. This may have important impacts on workers’ ability to speak out in factories, their trust in unions and management and self-advocacy.
23 | P a g e
Figure 2.8 Posted Safety Warnings Compliance Indonesia
Figure 2.9 Written OSH Policy Compliance Indonesia
24 | P a g e
Figure 2.10 Requirements on HIV/AIDS Compliance Indonesia
Figure 2.11 Correct Pay for Overtime and Rest Days Compliance Indonesia
25 | P a g e
Figure 2.12 Overtime Voluntary Compliance Indonesia
Figure 2.13 Correct Pay for Overtime on Public Holidays Compliance Indonesia
26 | P a g e
Figure 2.14 Pay for 1st and 2nd Menstruation Days Compliance Indonesia
Figure 2.15 OSH Committee Compliance Indonesia
27 | P a g e
Figure 2.16 Accomodating Standing Workers Compliance Indonesia
Figure 2.17 OSH Assessment Compliance Indonesia
28 | P a g e
Figure 2.18 Necessary PPE Compliance Indonesia
Figure 2.19 Emergency Exits Marked Compliance Indonesia
29 | P a g e
Figure 2.20 Emergency Exits Unlocked Compliance Indonesia
Figure 2.21 Correct Pay for Ordinary Overtime Compliance Indonesia
30 | P a g e
Figure 2.22 Acurate Time Records Compliance Indonesia
Figure 2.23 Regular Hours 40 Per Week Compliance Indonesia
31 | P a g e
Figure 2.24 Regular Hours Legal Limits Compliance Indonesia
Figure 2.25 Regular Overtime 14 Hours per Week Compliance Indonesia
32 | P a g e
Figure 2.26 Breastfeeding Breaks Compliance Indonesia
Figure 2.27 Safe Building Legal Permits Compliance Indonesia
33 | P a g e
Figure 2.28 Machine Guards Compliance Indonesia
Figure 2.29 Eating Areas Compliance Indonesia
34 | P a g e
Figure 2.30 Record Accidents and Disease Compliance Indonesia
Figure 2.31 Dessiminate CBA Compliance Indonesia
35 | P a g e
Figure 2.32 Suitable Chairs Compliance Indonesia
Figure 2.33 Discipline Legal Compliance Indonesia
36 | P a g e
Figure 2.34 Adequate Toilets Compliance Indonesia
Figure 2.35 Hazardous Chemicals Properly Stored Compliance Indonesia
37 | P a g e
Figure 2.36 Washing Facility Compliance Indonesia
Figure 2.37 Trained Workers in Fire Fighting Equipment Compliance Indonesia
38 | P a g e
Figure 2.38 Trained First Aid Officers Compliance Indonesia
Figure 2.39 Work Agreements Compliance Indonesia
39 | P a g e
Figure 2.40 Termination Benefits Compliance Indonesia
Figure 2.41 3 Months Maternity Leave Compliance Indonesia
40 | P a g e
Figure 2.42 Acceptable Temperature Compliance Indonesia
Figure 2.43 Sub-Contracted Workers Compliance Indonesia
41 | P a g e
Figure 2.44 Trained to Use PPE Compliance Indonesia
Figure 2.45 Chemicals Inventory Compliance Indonesia
42 | P a g e
Figure 2.46 Training Safe Machine Operation Compliance Indonesia
Figure 2.47 Correct Leave Pay Compliance Indonesia
43 | P a g e
Figure 2.48 Labor Law Compliance Indonesia
Figure 2.49 Work Agreement in Bahasa Compliance Indonesia
44 | P a g e
Figure 2.50 Regular Overtime 3 Hours per Day Compliance Indonesia
Figure 2.51 Weekly Rest Compliance Indonesia
45 | P a g e
2.3 Better Work Jordan Compliance Summary Statistics. Better Work Jordan (BWJ) has produced seven Compliance Synthesis Reports since May 2010. In February 2011, BWJ published its second synthesis report, followed by reports in March 2012, November 2012, December 2014, January 2015 and January 2016. The most recent report evaluates activities in 64 factories between November 2014 and October 2015.
The summary below reports assessments between 2009 and 2015 in a balanced panel of 16 factories. Synthesis reports, along with compliance graphs, can be used to understand the observed trends in Jordanian apparel factories while assessing their successes and challenges.
The most recent report published in January 2016 found high levels of “discrimination on the basis of race, color and origin” with 51 factories (80%) out of compliance with national law and the CBA not meeting international standards because of the differences in the payment of financial benefits between migrants and Jordanian workers.”7 A rise in noncompliance at the 4th cycle could be explained by the recent Addendum to the Collective Bargaining Agreement. On 31 December 2014, an Addendum to the Collective Bargaining Agreement addressed discrimination in the payment of overtime and financial benefits for all migrant workers in the garment sector. The Addendum states that by 31 August 2017, factories shall match migrant workers’ payment to that of Jordanian workers. If factories comply with the Addendum, then it is expected that noncompliance in discrimination against migrant workers regarding pay will decline
About three-quarters of the Jordanian factory labor force are migrant workers, most of them from South and Southeast Asia. Questions that impact migrant workers are often the areas with greatest noncompliance. Specifically, this report will focus on how migrant workers are at a disadvantage regarding accommodations and unauthorized fees.
According to the employment contract and the provisions of the CBA, garment factory employers in Jordan must provide accommodation for migrant workers. Accommodations remains a key challenge for OSH compliance as an increasing number of factories do not comply with the minimum space requirements, are inadequately protected against heat, cold and dampness, inadequately prepared for emergencies, lack protection against disease carrying animals or insects, lack adequate cooking facilities and are inadequately ventilated. For all of these questions, the factories seem to trend towards noncompliance, with 100 percent of factories accounted for in this report providing accommodation that are inadequately protected against disease carrying animals or insects and inadequately ventilated, as can be seen in Figures 2.52 and 2.53. Moreover, in a significant number of factories, employers do not provide workers enough food of decent quality when given as in-kind payment. In the most recent cycle of compliance assessments, up to 25 percent of factories were noncompliance.
Migrant workers are also affected by the issuance of valid work permits and residence IDs. The most recent synthesis report published in January 2016 found that four factories had migrant
7Better Work Jordan: Garment Industry 7th Compliance Synthesis Report.
46 | P a g e
workers who lacked valid work permits and residence IDs and 30 factories in which workers claimed to have paid unauthorized fees to recruitment agents. The number of factories where workers do not have valid work permits or residence IDs does decrease with each cycle and levels at five percent by the 4th cycle.
Unauthorized fees paid by migrant workers prove to be a pressing issue. The percentage of factories that have workers who have paid unauthorized fees to recruitment agents increased from 54 to 62 percent. Proper recruitment practices are crucial – improper recruitment practices, such as high unauthorized fees, have implications for human trafficking and bonded labor. As the last synthesis report states, “high fees paid to a recruitment agency can create a tense situation in which the worker cannot leave their job and return home due to the amount of money owed or spent.” Recruitment agencies in their country of origin charge high recruitment fees to ensure that interested workers will be placed in a job in a Jordan factory. Noncompliance is found when agencies charge a fee over $300, a figure established in consultation with ILO experts.
By contrast, while forced labor is a major issue in Jordanian factories, all factories are compliant on Child Labor questions. In the most recent report, BWJ had concerns with three factories regarding child labor which have been reported to the Ministry of Labor. BWJ had found that one of the factories under concern has since “shown strong commitment to verifying age.”
The primary conclusion from the most recent synthesis report, published in January 2016, was that OSH was the area with the greatest noncompliance, representing more than half of the total noncompliance findings. More specifically, improvements are needed concerning worker protection and the presence of medical and OSH professionals on site, as can be seen in Figure 2.54.
In the most recent cycle, 65 percent of factories did not have aisles and emergency exits accessible, unobstructed and unlocked during working hours, including overtime, 30 percent of factories did not have proper guards installed and maintained on all dangerous moving parts of machines and equipment (Figure 2.55), 30 percent of factories were noncompliant with providing workers with all necessary personal protective clothing and equipment (Figure 2.56) and 100 percent of factories were out of compliance with whether workers are effectively trained to use machines and equipment safely (Figure 2.57).
However, for some of the OSH questions, factories exhibited a trend toward compliance. Factories were more likely to have bylaws in compliance with Jordan law (Figure 2.58). For the question “Has the employer formed a joint worker/management OSH committee?” factories moved toward compliance with about 20 percent noncompliant at the 4th cycle, as can be seen in Figure 2.59. Though more employers complied with forming joint worker/management OSH committee, such a change did not translate into progress in safety measures on the factory floor.
An important finding is that 100 percent of factories have moved toward compliance in maintaining acceptable temperature in the workplace. In the 1st, 2nd and 3rd cycles, a constant 25 percent of factories were reported to not have acceptable temperatures in the workplace. In the 4th cycle, all factories were reported to be compliant with acceptable temperature standards. Better Work Enterprise Advisors have reported that factory workers remove safety clothing, such
47 | P a g e
as gloves, because it is too hot to work and slows their progress toward meeting daily production quotas.
The most recent synthesis report states that: “All factories are noncompliant under Freedom to Associate as the law forbids workers from forming unions of their own choice by stipulating a single trade union structure.” In 2013, Better Work facilitated negotiations for a sector-wide Collective Bargaining Agreement. Better Work engages a number of organizations including the Jordan Garments, Accessories and Textiles Exporters Association (J-GATE), the Association of Owners of Factories, Workshops and Garments (AOFWG) and the General Trade Union of Workers in Textile, Garment & Clothing Industries “by providing collective bargaining trainings to both parties ahead of discussions. Amendments to the original CBA include an increase in seniority bonuses for workers with more than five years of employment.” The findings of this report suggest that the amendment has not yet affected factories’ compliance in increasing seniority bonuses, as can be seen in Figure 2.60.
In general, the areas of Compensation and CHR, other than those related to migrant workers, had the lowest noncompliance rates. The last report notes that “non-compliance in the area [of Compensation] is mainly attributed to incorrect calculation of wages.” The most interesting positive growth toward compliance in factories was for workers receiving correct pay during an idle period or work stoppage. The most recent cycle notes no evidence of noncompliance with paying workers during idle period or work stoppages. There was also a significant change in the percentage of factories whose bylaws comply with Jordanian legal requirements which are communicated to workers. During the first cycle, close to 60 percent of factories were found to be noncompliant. During the last cycle, only 20 percent of factories were found to be noncompliant.
In addition, there was a drastic improvement in the number of factories that comply with legal requirements regarding the hiring of disabled workers. During the 1st cycle, 79 percent of factories were found to be noncompliant. This number has improved during the last cycle, in which only 20 percent of factories were found to be noncompliant, as can be seen in Figure 2.61. The last report states the legal requirements regarding the hiring of disabled workers. “As agreed by the Ministry of Labor, the employer and union representatives, the hiring quota for persons with disabilities is determined based on the number of Jordanian workers. Employers must employ at least one disabled worker if the workplace has 25-50 workers, and at least 4% of workers with disabilities must be employed in workplaces with more than 50 workers.” Improvements in this area are in part due to “BWJ providing advisory support to factories on the effective integration of disabled workers.”
48 | P a g e
Figure 2.52 Accommodation Protected from Animals Compliance Jordan
Figure 2.53 Ventilation Compliance Jordan
49 | P a g e
Figure 2.54 Medical Staff Compliance Jordan
Figure 2.55 Machine Guards Compliance Jordan
50 | P a g e
Figure 2.56 PPE Provided Compliance Jordan
Figure 2.57 Trained to Use Machines Safely Compliance Jordan
51 | P a g e
Figure 2.58 Legal Factory Bylaws Compliance Jordan
Figure 2.59 OSH Committee Compliance Jordan
52 | P a g e
Figure 2.60 Seniority Bonus Compliance Jordan
Figure 2.61 Legal Requirements for Disabled Workers Compliance Jordan
53 | P a g e
2.4 Better Work Haiti
Compliance Summary Statistics. Better Work Haiti (BWH) has produced eleven Compliance Synthesis Reports. The first, dated 9 July 2010, summarized findings from a total of 21 factories assessed from October to December of 2009 and the eleventh, produced on 16 October 2016, summarized the compliance of 26 factories assessed from September 2014 to August 2015. The synthesis reports will be used to supplement compliance data graphed over assessment cycles from 2009 to 2015. These synthesis reports, along with the included compliance graphs can be used to understand the observed trends in Haitian factories. The assessments ask questions in relation to the eight core labor standards of the ILO: Occupational Safety and Health, Contracts and Human Resources, Compensation, Discrimination, Child Labour, Forced Labor, Working Hours and Freedom of Association and Collective Bargaining.
The greatest areas of change in Haiti were under Compensation, CHR and Working Time. Though, improvements in noncompliance are often followed by subsequent deterioration.
For the question, “Does the employer pay workers correctly for weekly rest days?” approximately 40 percent of factories were recorded as noncompliant in cycle 1 and then zero noncompliant in cycle 2, as can be seen in Figure 2.62. However, noncompliance begins to rise thereafter, ranging between 15 and 25 percent between cycles 7 and 10.
A similar pattern emerges concerning correct pay for annual leave, as can be seen in Figure 2.63. At the 1st assessment, 8 percent of factories were noncompliant. For cycles 2 to 8, no factories are found out of compliance. However, at assessments 9 and 10, noncompliance rises to 25 percent of factories. The pattern is repeated for different types of leave, including sick (Figure 2.65) and maternity leave. The 10th annual synthesis report describes several cases in which it was found that the management was unaware of payment procedures for leaves.
Maintaining accurate work time records produces a similar pattern, though the deterioration after the 5th assessment is not as pervasive, as can be seen in Figure 2.64. At the 1st assessment, 65 percent of factories were noncompliant. This rate falls to zero at the 5th assessment, but then rises in the 6th and 7th to 30 percent. Figure 2.66 illustrates a similar pattern for payroll records. At the 1st assessment, 25 percent of factories are noncompliant. Noncompliance falls to zero at cycle 4 and then returns to approximately 30 percent at cycle 7.
By contrast, improvement in the provision of daily breaks is dramatic and sustained, as can be seen Figure 2.67. At the 2nd and 3rd assessments, 95 percent of factories were failing to provide workers with 30 minute work breaks daily. However, by the 6th assessment, no factories were found noncompliant, an outcome that largely persists through the 10th cycle.
A record of compliance is also evident for unauthorized deductions, as can be seen in Figure 2.68. Only one factory was noncompliant at the 6th assessment. Zero noncompliance is evident for all other assessment cycles.
Haitian factories also make significant progress on providing union representatives access to workers in the workplace, as can be seen in Figure 2.69. At the 1st assessment, 17 percent of
54 | P a g e
factories were noncompliant. No findings of noncompliance occur from the 5th assessment forward.
Compliance in workplace practices related to termination and discipline are more varied. Figure 2.70 exhibits a varied pattern of noncompliance related to valid termination of employment. Noncompliance rates vary from 40 percent at the 4th assessment to zero at the 10th assessment.
It appears that issues with discipline are not related to established internal work rules, as can be seen in Figure 2.71. At the 3rd assessment, 95 percent of factories had internal rules that were not consistent with legal requirements. However, from the 6th to the 9th assessment, nearly all factories appear to have brought rules into compliance with legal requirements. Nevertheless, disciplinary measures are often not compliant with legal requirements, as can be seen in Figure 2.72. In some cases, disciplinary measures involve physical punishment and humiliating treatment, as can be seen in Figure 2.73.
55 | P a g e
Figure 2.62 Correct Pay for Weekly Rest Compliance Haiti
Figure 2.63 Pay for Annual Leave Compliance Haiti
56 | P a g e
Figure 2.64 Working Time Records Accurate Compliance Haiti
Figure 2.65 Pay for Sick Leave Compliance Haiti
57 | P a g e
Figure 2.66 One Payroll Record Compliance Haiti
Figure 2.67 30 Minute Daily Breaks Compliance Haiti
58 | P a g e
Figure 2.68 Unauthorized Deductions Compliance Haiti
Figure 2.69 Union Access to Workplace Compliance Haiti
59 | P a g e
Figure 2.70 Valid Termination Compliance Haiti
Figure 2.71 Legal Internal Rules Compliance Haiti
60 | P a g e
Figure 2.72 Legal Disciplines Compliance Haiti
Figure 2.73 Physical Punishment Compliance Haiti
61 | P a g e
Chapter 3 Occupational Safety and Health
Enterprise assessments collect information concerning compliance with a set of questions related to occupational safety and health. Questions and responses are summarized in Table 3.1
Workers are first asked to rate the frequency of work-related health symptoms such as fatigue, headache, backache, stomach pain, skin problems, dizziness, hunger and thirst. The question posed is, “How often do you experience the following symptoms?” Responses are coded on a scale of 1=Never to 4=Everyday.
The evaluation then turns to concerns workers might have about environmental working conditions. Workers are first asked to rate their satisfaction with workplace facilities including water, the toilet, the canteen and the dormitory. The question asked is, “How satisfied are you with the facilities in this factory?” Responses are coded on a scale of 1=Not satisfied at all to 4=Very Satisfied.
Ambient working conditions are assessed by asking whether workers in the factory have concerns about temperature, injuries, air quality, chemical smells and dangerous equipment. Workers are offered seven possible responses ranging from 1=not a concern to 7=caused a strike. For the purposes of the analysis below, all of the “yes” answers are aggregated together. Responses are coded as 0 = not concerned or 1 = some level of concern. The concern variables are averaged across workers within a factory.
62 | P a g e
Table 3.1 OSH Indicators
How often do you experience the following symptoms?
fatigue 1. Never
2. Occasionally
3. Often
4. Every day
headache
stomach pain
skin problems
dizziness
backache
hunger
thirst
How satisfied are you with the facilities in this factory?
water 1. Not satisfied at all
2. Somewhat satisfied
3. Somewhat satisfied
4. Very satisfied
toilet
canteen
dormitory
Are workers in this factory concerned with the following?
temperature 0=yes
1=no injuries
air quality
chemical smells
dangerous equipment
63 | P a g e
3.1 Better Work Occupational Safety and Health Vietnam
Summary statistics for each of the OSH questions for Vietnam are reported in Table 3.2. Of the health symptoms, workers are most likely to report headache, followed by backache, dizziness and fatigue. Experiences with skin rashes and hunger are rare. There are small reductions in the reports of physical symptoms, with the largest occurring for headaches. The average rating for headaches at cycle 1 is 1.7 on a 4-point scale. That is, workers are reporting headaches occasionally. By the 5th assessment, there is a small decline to 1.5
Workers most frequently identify concerns with temperature in the factory. At cycle 1, 12 percent of workers report that temperature is a concern for workers in the factory. Reports are consistently around that figure until the 5th assessment at which time reports drop to seven percent of workers. Air quality, chemical smells and injury concerns are articulated by three to ten percent of workers and there is little change over assessment cycles.
Better Work treatment effects are reported in Tables 3.3 (Fatigue, Headache, Stomach Ache, Skin Problems), 3.4 (Dizziness, Backache, Hunger, Thirst), 3.5 (Water Satisfaction, Equipment and Temperature Concern) and 3.6 (Injury, Air, Chemical Smell Concerns). Estimated coefficients with one or more asterisks are statistically significant. While many of the cycle and dose variables are statistically significant, a persistent treatment effect is only observed for four of the indicators.
The treatment effect of fatigue is reported in Figure 3.1. Frequency of fatigue slightly increases in the first three assessment cycles. However, the treatment effect is negative for cycles 4 (-0.02) and 5 (-0.05). That is, the report of fatigue declines by 0.05 on a 4-point scale in the period after the 5th assessment cycle. As can be seen in column (1) of Table 3.3, no definitive statement concerning curing and decay can be made. The coefficients on dose1, dose3 and dose5 are all positive and statistically significant, indicating that decay occurred in the months following an assessment. Curing, however, occurs after assessments 2 and 4.
Stomach pain exhibits a more pronounced and larger treatment effect, as can be seen in Figure 3.2. With the exception of the 1st assessment cycle, treatment effects are all negative. That is Better Work reduces reports of stomach pain. At the 5th assessment cycle, stomach pain frequency declines by 0.19 on a 4-point scale.
While the effect is larger than for fatigue, the estimated coefficients do not indicate a consistent pattern of curing or decay, as can be seen in column (3) of Table 3.3. A classic treatment pattern is only apparent at the 4th and 5th assessments. The cycle coefficients are negative and increasing in absolute value and the dose4 and dose5 coefficients are negative. This pattern indicates that stomach pain declines with the 4th and 5th assessments and curing occurs after each visit.
There appears to be a small improvement in perception of water quality emerging at the 5th assessment, as can be seen in Figure 3.3. The average treatment effect increases the rating of water quality by 0.18 on a 4-point scale. Similarly, there is a small decline in the proportion of workers reporting concerns with chemical smells, as can be seen in Figure 3.4. At the 2nd and 3rd assessments, the proportion of workers reporting chemical smell concerns declines by 0.03. At
64 | P a g e
the 4th and 5th assessment cycles, the percent of workers reporting chemical smell concerns declines by 5 percentage points.
65 | P a g e
Figure 3.1 Fatigue Treatment by Cycle Vietnam
Figure 3.2 Stomach Pain Treatment by Cycle Vietnam
0.02
0.01
0.02
-0.02
-0.05
-.06
-.04
-.02
0.0
2Tr
eatm
ent E
ffect
1 2 3 4 5
0.00
-0.09
-0.05
-0.14
-0.19
-.2-.1
5-.1
-.05
0Tr
eatm
ent E
ffect
1 2 3 4 5
66 | P a g e
Figure 3.3 Water Satisfaction, Treatment by Cycle Vietnam
Figure 3.4 Chemical Smells Treatment by Cycle Vietnam
Standard errors in parentheses *** p<0.01, ** p<0.05, * p<0.1
71 | P a g e
3.2 Better Work Occupational Safety and Health Indonesia
Summary statistics for each of the OSH questions for Indonesia are reported in Table 3.7. Of the health symptoms, workers are mostly likely to report fatigue, dizziness and headache, followed by stomach pain. Reported mean frequency in Indonesia is higher than for Vietnam. The most common symptoms have an average score around 2.4, which corresponds from occasionally to often. Reports actually increase slightly with each assessment cycle. The average rating for headaches at cycle 1 is 2.5 on a 4-point scale, the same as at the 4th assessment.
Concerns with ambient working conditions are also higher in Indonesia than Vietnam. At cycle 1, injury concerns are reported by 73 percent of workers, chemical smells by 67 percent, dusty or polluted air by 62 percent and temperature by 42 percent.
Treatment effects are reported in Tables 3.8 (Fatigue, Headache, Stomach Pain, Dizziness), 3.9 (Hunger, Thirst, Injury Concern), 3.10 (Temperature, Equipment, Air Concern) and 3.11 (Chemical Injury Concern, Water Satisfaction).
The only evident OSH treatment effect for BWI concerns injuries, as can be seen in Figure 3.5. The proportion of workers reporting concern with injuries declines by 24 percentage points at the 3rd assessment cycle.
Standard errors in parentheses *** p<0.01, ** p<0.05, * p<0.1
75 | P a g e
Table 3.11 Chemical Injury Concern, Water Satisfaction Treatment Effects Indonesia
(1) (2) VARIABLES Chemical concern Water satisfaction cycle2 -0.100*** -1.000*** (0.0184) (0.0218) cycle3 0.409** 0.530 (0.196) (0.362) dose1 0.00426*** -0.0137*** (0.00107) (0.00124) dose2 0.00711* 0.117*** (0.00406) (0.00468) dose3 -0.0393 -0.0271 (0.0304) (0.0558) Observations 2,290 2,291 Number of tuftsid 78 78
Standard errors in parentheses *** p<0.01, ** p<0.05, * p<0.1
76 | P a g e
3.3 Better Work Occupational Safety and Health Jordan
Summary statistics for each of the OSH questions for Jordan are reported in Table 3.12. Of the health symptoms, workers are most likely to report fatigue, headache and thirst, followed by hunger. Reported frequency in Jordan is higher than for Vietnam. The most common symptoms have an average score around 2.5, which corresponds from occasionally to often. Reports actually increase slightly with each assessment cycle. The average rating for thirst at cycle 1 is 2.6 on a 4-point scale, the same as at the 5th assessment.
Workers also report high concern with equipment safety (66%), injury concern (80%), dusty or polluted air (69%) and chemical smells (75%). Concerns decline significantly over the six assessment cycles on which data is available. By the 6th assessment cycle, equipment concerns fall to 34 percent and chemical concerns fall to 43 percent of workers.
Treatment effects are reported in Tables 3.13 (Fatigue, Headache, Thirst), 3.14 (Hunger, Water Satisfaction, Air Equipment Concern) and Table 3.15 (Injury Chemical Concern).
Persistent treatment effects are found for the incidence of Fatigue (Figure 3.6), Headache (Figure 3.7), Hunger (Figure 3.8) and Thirst (Figure 3.9). Workers also report significantly higher satisfaction with water (Figure 3.10) and less concern with injuries (Figure 3.11).
By the 4th assessment cycle, the incidence of headache declines by 0.56 on a 4-point scale. This effect persists through to the 6th assessment cycle. Hunger decline by 0.78 on a 4-point scale by the 6th assessment cycle. Thirst declines by 0.18 by the 3rd cycle and 0.37 by the 6th cycle on a 4-point scale. A treatment effect emerges for concerns with injuries. The proportion of workers concerned with injuries declines by 32 percentage points at the 6th cycle.
77 | P a g e
Figure 3.6 Fatigue Treatment by Cycle Jordan
Figure 3.7 Headache Treatment by Cycle Jordan
-0.05
-0.02
-0.06
-0.25
-0.29
-0.20
-.3-.2
-.10
Trea
tmen
t Effe
ct
1 2 3 4 5 6
-0.14
-0.19
-0.31
-0.56 -0.56-0.59
-.6-.4
-.20
Trea
tmen
t Effe
ct
1 2 3 4 5 6
78 | P a g e
Figure 3.8 Hunger Treatment by Cycle Jordan
Figure 3.9 Thirst Treatment by Cycle Jordan
-0.21-0.19 -0.19
-0.35
-0.45
-0.78
-.8-.6
-.4-.2
0Tr
eatm
ent E
ffect
1 2 3 4 5 6
0.06
0.01
-0.18-0.20
-0.36-0.37
-.4-.3
-.2-.1
0.1
Trea
tmen
t Effe
ct
1 2 3 4 5 6
79 | P a g e
Figure 3.10 Water Satisfaction Treatment by Cycle Jordan
Standard errors in parentheses *** p<0.01, ** p<0.05, * p<0.1
83 | P a g e
3.4 Better Work Occupational Safety and Health Haiti
Summary statistics for each of the OSH questions for Haiti are reported in Table 3.16. Of the health symptoms, workers are mostly likely to report thirst, headache, fatigue and hunger. Reported frequency in Haiti is higher than for Vietnam. Thirst, the most common symptom, has an average score around 3.6 at cycle 1, which corresponds from often to all of the time. Occurrence for several indicators declines with each assessment cycle. The average rating for thirst is 3.6 at cycle 1 and drops to 2.5 at cycle 10. During the same period, fatigue drops from 2.4 to 2.0 and headache drops from 2.7 to 2.3 on a 4-point scale.
Workers also report significant concerns with equipment safety (77%), injuries (68%), dusty or polluted air (62%) and concern with chemical smells (22%). Though, only concern with equipment declines over time.
Better Work treatment effects are reported in Tables 3.17 (Fatigue, Headache, Thirst, Hunger), 3.18 (Injury Concern, Water Satisfaction) and 3.19 (Equipment, Air, Chemical Smells Concerns).
Better Work Haiti exhibits little systematic treatment effects for OSH that are associated with program exposure. For example, treatment effects for thirst are depicted in Figure 3.12 and hunger in Figure 3.13. At cycle 7, thirst occurrence drops by 2.46 on a 4-point scale and hunger occurrence drops by 2.69 on a 4-point scale. However, both rebound at the 8th assessment cycle.
Such an outcome does not imply that Better Work Haiti is not having an effect on OSH. However, to the extent that there is a program effect, it is not associated with duration of program exposure. Factories that have had more exposure to Better Work do not exhibit better OSH outcomes for workers than those with less exposure.
Standard errors in parentheses *** p<0.01, ** p<0.05, * p<0.1
89 | P a g e
Chapter 4 Nicaragua
Compliance Summary Statistics. Better Work Nicaragua (BWN) has produced two Compliance Synthesis Reports. The first, dated August 2013, reports on assessments of 20 factories. The second, dated March 2015, reports on assessments of 25 factories. Of the 25 factories assessed from January 2014 to January 2015, 20 were assessed more than once by BWN, 12 were assessed twice and 8 were assessed three times. These synthesis reports, along with compliance graphs, can be used to understand the observed trends in the Nicaraguan factories while assessing their successes and challenges.
The primary conclusions from the first report were that Occupational Safety and Health (OSH), Contracts and Human Resources (CHR) and Compensation were the areas with the greatest noncompliance. More specifically, improvements were needed concerning worker protection, work environment, employment contracts regarding the specificity of terms and conditions and correct payment of social security benefits. Throughout both assessments, Child Labour and Forced Labour were zero percent noncompliant, and there were only minor issues regarding Discrimination, Freedom of Association and Collective Bargaining (FACB) and Working Hours.
Among the 20 factories that were assessed more than once, 11 improved their performance on the number of noncompliance findings, six had a higher number of noncompliance findings, and three factories had no change.
OSH is one of the areas in which noncompliance was persistent. Seventeen out of 20 factories were out of compliance regarding suitable chairs for workers, as can be seen in Figure 4.1. Noncompliance rates for Chemicals and Hazardous Substances, Emergency Preparedness, Health Services and First Aid, OSH Management Systems, Welfare Facilities and Worker Accommodation all decreased, but noncompliance rates for Worker Protection and Working Environment averaged across all firms, rose by six percent and 31 percent respectively. In the 2nd visit, 72 percent of factories were out of compliance regarding requirements for personal protective equipment, as can be seen in Figure 4.2. As discussed above, there was a slight improvement during the 2nd cycle, but all improvements had disappeared by the 3rd cycle.
Costly investments in protective equipment and suitable chairs may be a deterrent to compliance. However, Better Work is exploring affordable strategies to achieve compliance.
One area in which there was an overall improvement was emergency preparedness. As of the 1st visit, 20 percent of factories had neither elaborated nor implemented an emergency plan, but by the 3rd cycle no factory was noncompliant, as can be seen in Figure 4.5. Firms may perceive the development of a plan as less costly than physical investments. Alternatively, it is possible that developing a plan logically precedes costly investments.
Although there was a slight improvement, chemicals and hazardous substances commonly have improper labels, as can be seen in Figure 4.6. In the March 2015 report, it was noted that 13 factories were still out of compliance. Although factories are headed toward compliance, the 3rd cycle shows that 50 percent of enrolled factories are still failing to label chemicals and hazardous substances properly.
90 | P a g e
In the 1st visit, 9 factories did not have an OSH license, and by the 2nd visit there were still three factories without an OSH license.
Turning to compensation, the highest rate of noncompliance concerns wage information, use and deduction, as can be seen in Figure 4.3. In the 1st visit, 12 factories were noncompliant in informing workers about wage payments and deductions. By the 2nd visit 4 factories remained noncompliant. Employers may be adjusting wages and deductions without informing workers.
Another area where factories were observed as noncompliant was in payment of social security and other benefits. According to the March 2015 report, there were still five factories out of compliance for deducting the appropriate amount of workers’ wages for contributions to social security and four factories did not meet requirements on the pay destined to the National Social Security Institute (INSS) or National Technology Institute (INATEC), as can be seen in Figure 4.4.
In addition to limiting worker’s trust through compensation, 8 factories continue to be non-compliant in having employment contracts that specify the terms and conditions of employment.
The tables representing points in which the factories are always compliant, headed towards compliance, or always non-compliant are reported in Appendix 5. Survey Results. Program impact is ultimately measured by worker perceptions of working conditions, physical and mental health and family outcomes. Results on mental health, problem solving, abusive treatment, pay practices, occupational safety and health, physical symptoms, hours, wages, home life and punishments follow.
Two sets of statistics are reported for each survey item. The first table (Table 4.1) reports summary statistics that can be used to determine the extent to which an indicator is important for workers. The second table (Table 4.2) reports program impact. In nearly all cases, variables are scaled so that, as with compliance, a decline in the variable indicates an improvement.
The Program variables are cycle2, cycle3, dose1, dose2 and dose3. The estimated coefficients of cycle2 and cycle3 indicate whether there has been a change at assessments 2 and 3 relative to findings at assessment 1. The dose variables measure how many months elapsed between the time of the corresponding assessment and the time of the survey data collection. The estimated coefficients of dose1, dose2 and dose3 indicate whether there was decay or curing of treatment effect after the assessment.
The strongest possible treatment profile requires that the coefficients of cycle2 and cycle3 are both negative and that the coefficient of cycle3 is larger in absolute value relative to cycle2. The negative coefficients indicate that workers report a reduction in poor work outcomes after assessments 2 and 3 relative to assessment 1. A larger magnitudes for cycle3 relative to cycle2 would indicate that the reduction in poor work outcomes is increasing with each assessment cycle.
91 | P a g e
Further, the negative coefficients on dose1, dose2 and dose3 indicate that factories continue to improve in the months after an assessment and/or reflect beneficial effects that arise due to interactions between Better Work and the factory between assessments.
Mental Health. Participants in the worker survey are asked a set of questions related to mental health. The questions ask workers to report on the frequency of feeling restless, fearful, sad or hopeless. Workers are also asked how often they are bothered by crying. Possible responses are 1=never, 2=rarely, 3=often, 4=all of the time.
Summary statistics are provided in Table 4.1. Workers are most bothered by a feeling of hopelessness. The average score is 2.1, which is between rarely and often. Sadness (1.93) and restlessness (1.84) follow closely behind.
A positive program impact is indicated if the incidence is declining by cycle or dose. As can be seen in Table 4.2, we observe a Program benefit for some measures of mental health. In the case of feeling restless (column 1), the estimated coefficient of dose1 is -0.0561 and dose2 is -0.103. These values indicate that the more time Better Work has to engage with the factories after the 1st and 2nd assessments the less likely workers are to report feeling restless. However, we do not observe a cycle 3 effect, indicating that the beneficial effects have dissipated by the 3rd assessment. In the case of feeling sad (column 3), the estimated coefficient of dose1 is -0.0488, indicating a positive program effect after the 1st assessment. By contrast, frequency of crying (column 5) indicates persistent mental health challenges. The estimated coefficient of dose3 is 0.0737, further indicating that worker mental health may be deteriorating after the 3rd assessment.
As will be seen below, the pattern of findings related to mental health will emerge for other variables as well. That is, we observe a significant positive program impact during the early phases of BWN. However, there is evidence of retrogression by the end of the 3rd assessment.
Problem Solving, Freedom of Association, Collective Bargaining.
A central focus of Better Work is to improve the functioning of mechanisms and processes through which workers can address concerns that they might have about work. Mechanisms include seeking help from the trade union, PICC and/or supervisor. Worker reports of use of and experience with voicing mechanisms are summarized in Table 4.3.
Union membership in the sample is low. Only about six percent of participants report being a member of a union. In the sample average, workers clearly have some concern that joining a union might cost them their job. Participants are asked if they think they will lose their job if they join a union. The responses are scored 1=no, 2=maybe and 3=probably yes. The average of the variable UnionFired is 1.69, indicating that on average workers have concerns with union membership.
Concerns about union membership are also reflected in the level of comfort a worker has with seeking help from the trade union. Workers were asked how comfortable they are seeking help from the union, the PICC and their supervisor. The responses are scored 1=very comfortable and 5=very uncomfortable. The average response for help from the union is 2.28, indicating some
92 | P a g e
ambivalence. Workers were slightly more comfortable seeking help from the PICC (1.95) or their supervisor (1.94). A score between 1 and 2 indicates that most workers are either very or somewhat comfortable seeking help from their supervisor or the PICC.
Reports of interactions with supervisors, however, indicate some ambivalence. Workers were asked whether they felt like their supervisor followed the rules of the factory and treated their subordinates with respect. Responses were coded as 1=all of the time and 5=never. The averages of the two variables, SupRespect and SupRules, are 2.14 and 2.21, indicating that at least some of the time supervisor behavior is problematic.
Turning to program impact, each variable is analyzed with results reported in Table 4.4. Evidence from columns (1) and (3) indicates that there is no increase in union membership during the duration of BWN nor do workers increase their comfort level seeking help from the union. However, as can be seen in column (7), workers are less likely to believe that joining a union will cost them their job. The coefficient of cycle3 is -0.539, a very strong and statistically significant effect. By the end of the study, nearly all workers report believing that union membership is not an offense for which they will be fired.
By cycle 3, we also see evidence of increased comfort seeking help from the supervisor. As can be seen in column (4), the coefficient of cycle3 is -0.570. Again, this is a very large effect indicating that nearly all workers are very comfortable or comfortable seeking help from their supervisor. By contrast, the PICC is not gaining traction with workers, as can be seen from column (2).
Abusive Treatment. Workers report a significant concern with abuse in Nicaraguan factories. Workers are asked whether they are concerned with sexual harassment, verbal abuse and physical abuse. As can be seen in Table 4.5, of the workers that were willing to respond, 37.5 percent report concerns with sexual harassment, 61 percent report concerns with verbal abuse and 51 percent report concerns with physical abuse. Responses were coded as 0=no concern, 1=concern and discussed with coworker, discussed with HR manager, discussed with trade union representative, nearly caused a strike, did cause a strike and/or led the worker to consider quitting.
Responses from workers who chose not to respond or were not asked the question are given a missing data code and, therefore, are not included in the analysis.
Given the high incidence of abusive behaviors, sexual harassment, verbal abuse and physical abuse would be reasonable factory behaviors for BWN to target. However, there is little evidence of program impact. As can be seen in Table 4.6, neither of the cycle variables is statistically significant, and neither is even the right sign (-). The only apparent program effect concerns physical abuse and the effect is only seen in the months after the 1st assessment. The coefficient of dose1 in column 3, -0.0287, indicates that physical abuse diminished in the months following the first assessment.
Pay Practices. Workers are asked about concerns related to pay practices. Each concern variable is coded as 0=no concern and 1=some concern as defined above. As can be seen in
93 | P a g e
Table 4.7, on the order of one-third of participants report concern with late payment of wages (37%), excess deductions (33%), low wages (51%) and a broken punch clock (27%).
However, despite high concerns with pay practices, workers still generally trust the factory to pay all of the money they are owed. The TrustPay variable is coded as 1=high trust and 5=low trust. An average of 1.31 indicates that on average workers believe that they are being paid as promised.
Estimated program effect indicates significant improvements, as can be seen in Table 4.8. In column (1), the coefficient in cycle3 is -0.422 on late payments, a very large program effect. We also observe similarly large program effects for Low Wages, as can be seen in column 4 and Broken Punch Clock, as can be seen in column (5). The Low Wage coefficient for cycle3 is -0.252 and the Broken Clock coefficient for cycle3 is -0.212. The negative coefficient on dose2 (-0.0385) in column (5) indicates that improvement in concerns about broken punch clocks begins after the 2nd assessment and continues on to the 3rd assessment.
Occupational Safety and Health. Concern questions are asked about several dimensions of occupational safety and health including temperature (hot or cold), dangerous equipment, accidents, air quality, and chemical smells. As with the other concern variables, 0=no concern and 1=some level of concern. Workers are also asked how often they are injured at work. The Injured variable is coded as 1=never and 4=often.
As can be seen in Table 4.9, workers report significant concerns with OSH issues. Air quality and chemical smells are the most severe. 55 percent of workers report concerns with air quality and 52 percent report concerns with chemical smells. Lower, but still substantial rates are reported for accidents (47%), temperature (42%) and dangerous equipment (29%). At least one-quarter of workers have been injured at work.
A significant program effect is particularly detected by the incidence of injuries, as can be seen in Table 4.10. The cycle3 coefficient for the injury rate is -0.316, as reported in column (6). Again, this is a very large effect, when considering that change on a base of 1.37.
The impact of BWN on perceptions of safety are a bit less clear, though there is some evidence of a program effect. The dose2 coefficients for temperature, dangerous equipment, accidents and air quality are all negative. These values indicate that between the 2nd and 3rd assessments, workers are increasingly reporting lower OSH concerns. It is not surprising, therefore, that we identify a drop in the injury rate at the time of the 3rd assessment. Improvement in temperature also continues into cycle 3. The cycle3 coefficient in column (1) is -0.415, again indicating a very strong treatment effect.
Physical Symptoms. Improvements in OSH, if important to the worker, will translate into a reduction in the reports of stomach pain, dizziness, headache and backache and thirst. Workers typically report some experience with these symptoms. For each discomfort, the variable is coded as 1=never and 5=every day. The most common complaint is headache and backache. The mean report is 2.91 in Table 4.11, indicating that workers experience aches occasionally on average.
94 | P a g e
There is little to no program impact on symptoms associated with poor OSH, as can be seen in Table 4.12. The sole significant treatment effect coefficient is on dose1 for ache, as reported in Column (3) (-0.0573). These findings indicate that the most important impact of BWN on OSH outcomes is the accident rate. Workers are not generally reporting an improvement in ambient conditions.
Wages and Hours. Workers are asked about concerns with hours, overtime pay, hours actually worked and pay received. Turning first to concerns with hours, workers are asked about concerns with excess overtime and excess work on Sunday. Summary statistics are reported in Table 4.13. Overtime concerns are high. 32 percent of respondents are concerned with excess overtime and 34 percent are concerned with excess work on Sundays.
When asked if refusing overtime would result in termination, at least one-third believe such an outcome is possible. The RefuseOT variable is coded as 1=no, 2=yes, maybe and 3=yes, probably. The average response is 1.52, indicating that about one in three workers believe that refusing overtime could result in termination.
Turning to program impact, BWN exhibits very strong impact on worker concerns with excess overtime, as reported in Table 4.14. In column (1), the coefficient on cycle3 is negative (-0.299) and the coefficients on each of the dose variables are negative and significant. The coefficient on dose1 is -0.0296, dose2 is -0.0562 and dose3 is -0.0207.
The dose1 coefficient (-0.0240) is negative for work on Sundays. However, none of the other treatment variables for work on Sundays is statistically significant. Such an outcome indicates that there may have been improvement after the first assessment, but any positive effect dissipated over cycles 2 and 3.
In addition to being concerned about excess overtime, firms may not be paying correctly for overtime. A common practice is to only pay for overtime once the production target is reached. The law, in fact, requires that overtime begin once a daily or weekly hourly maximum is reached.
Workers are asked about the events that trigger overtime pay. Summary statistics are reported in Table 4.15. Nearly, all workers report that their factory pays for overtime work. Only 2.8 percent of participants indicated that their factory does not pay for overtime.
Violations related to overtime occur particularly when the factory only pays overtime once the production target is met. In fact, 34 percent of workers report that their factory only pays overtime for post-production target work. 38 percent of workers report that they received overtime after 8 hours of work during a single day, 31 percent report receiving overtime pay after 48 hours of work during a single week and 27 percent report receiving overtime pay for work on Saturday and/or Sunday.
A positive program effect is indicated if workers are less likely to be paid overtime only after reaching the production target and more likely to be paid overtime based on hours worked. A
95 | P a g e
positive effect is also indicated if there is a reduction in the number of workers reporting that their factory does not pay for overtime work.
Statistical analysis indicates a somewhat mixed story, as can be seen in Table 4.16. At cycle 2, the number of workers reporting no overtime pay declines. The coefficient of cycle2 in column (5) is -0.116 and the coefficient of dose1 is -0.0127. However, it appears that factories which began paying overtime did so only after workers reached the production target, as the number of workers reporting receiving overtime pay only after meeting their production target increased at cycle 2. The coefficient of cycle2 in column (1) is 0.342 and the coefficient of dose1 is 0.0229.
Hence, while we have some improvement, moving from no overtime pay to overtime pay after the production target is reached, firms still do not move toward legal compliance on overtime. However, once we reach the 3rd assessment, there is an increase in the number of workers reporting being paid overtime after 48 hours of work in one week. The coefficient of cycle3 in column (3) is 0.197.
Turning to the level of pay and hours, a histogram of weekly pay (USD) in Figure 4.7 indicates that most workers receive USD 50 or less. A histogram of weekly hours in Figure 4.8 indicates that mass of the distribution lies between 48 and 66 hours per week.
Turning to the question as to whether BWN increased wages and reduced hours, we estimate standard wage and hours equations. Equations are first estimated for the entire sample, reported in columns (1) and (2) of Table 4.17. We then limit the sample to workers reporting 20 or more hours per week, reported in columns (3) and (4).
Note first, that pay is positively related to hours worked but the estimated coefficient is not statistically significant. Weekly pay rises each year by USD 2.19. Weekly hours have been declining by about 2.283 hours per week. Finally, the estimated coefficient on female is negative but not statistically significant. Gender discrimination manifests in job assignments rather than in pay within an occupation. Sewers, a position commonly occupied by women, are paid less than other positions after controlling for education, age and number of promotions.
Considering column (3), the dose1 variable for Total Pay is positive (0.925) and the cycle2 variable is positive (16.42), indicating a very large treatment effect on weekly pay between the 1st and 2nd assessments. However, the cycle3 coefficient is negative and not statistically significant, indicating retrogression in pay. However, it is worth noting that the treatment effect does not completely disappear for women. The coefficient of female*cycle3 is 7.467, indicating that, while male participants saw all of their Better Work generated wage gains disappear, female employees did not at the time of the 3rd assessment. However, in the months following, female pay declined as well. The coefficient on female*dose3 is -0.851, indicating that female employees see the Better Work effect on pay decline by USD 0.85 each month after the 3rd assessment.
A treatment effect on hours is also in evidence for male employees between the 1st and 2nd assessment. The coefficient on dose1 in column (4) is -0.387, indicating that men in factories that have recently completed the first assessment is falling. However, the coefficient for
96 | P a g e
dose1*female is 0.696. The positive coefficient indicates that women are actually working longer hours.
97 | P a g e
Figure 4.1 Suitable Chairs Compliance Nicaragua
Figure 4.2 PPE Compliance Nicaragua
98 | P a g e
Figure 4.3 Information about Wages Payments and Deductions Compliance Nicaragua
The impact of Better Work on verbal is assessed by surveying workers on the extent to which verbal abuse is a concern for workers in the factory. Possible responses range from (1) not a concern, (2) yes, discussed among workers, (3) yes, discussed with supervisor or manager, (4) yes, discussed with trade union representative, (5) yes, considered quitting, (6) yes, threatened a strike and (7) yes, caused a strike.
The analysis tests for a change in factory average reports of verbal abuse and its intensity over assessment cycles. The coding of the variable used in the analysis below is presented in Table 5.1. Findings for Vietnam, Indonesia, Jordan, Haiti and Nicaragua will be discussed in turn.
Turning first to Table 5.2, reports of verbal abuse in Vietnam are low in comparison to other Better Work countries. At the 1st assessment cycle, 91.6 percent of respondents report that verbal abuse is not a concern. Concern falls with nearly every assessment cycle, with nearly 96 percent of workers not concerned by the 4th cycle. The only category of “yes” that increases is reports of concern to the trade union representative. About one percent of workers reported doing so at the baseline, a figure that rises to 1.4 percent at the 4th cycle. Summary statistics for the analysis are reported in Table 5.3
Statistical results are reported in Table 5.4 and depicted in Figures 5.1 to 5.4. Two measures of verbal abuse are analyzed. Figures 5.1 (by treatment month) and 5.2 (by treatment cycle) and column (1) of Table 5.4 report findings analyzing verbal abuse as a binary variable. That is, do workers report either no concern or any type of concern? Figures 5.3 (by treatment month) and 5.4 (by treatment cycle) and column (2) of Table 5.4 report findings analyzing changes in intensity of concern.
The Better Work treatment effect on the proportion of workers in each factory reporting verbal abuse is -0.13 by the 5th assessment cycle (Figure 5.2). The intensity measure also declines by 0.12 on a 7-point scale (Figure 5.4).
Such an effect is very large given that on average only 8.4 percent of respondents at the 1st assessment report concern with verbal abuse. During the five years of data collection, there is a secular positive trend in verbal abuse in Vietnam. The year coefficients are all positive and significant. However, for factories in their 4th and 5th assessment cycles, Better Work appears to have both eliminated the verbal abuse that was occurring at the 1st assessment and completely offset the secular trend toward increased shouting.
Note also that typically we observe curing of the Better Work treatment effect on verbal abuse in Vietnam. The coefficients on the dose variables in column (1) of Table 5.4 are generally negative, indicating that verbal abuse reports continue to decline in the months following a Better Work assessment. The only exception is months following the 5th assessment cycle.
A similar pattern emerges for Indonesia, as can be seen in Tables 5.5 and 5.7 and Figures 5.5 to 5.8. The proportion of workers reporting no verbal abuse falls from 21.6 percent at the 1st assessment to 16.3 percent at the 4th assessment. As in Vietnam, there is a secular rise in verbal abuse, particularly in 2013.
111 | P a g e
The cumulative Better Work treatment effect for the binary verbal abuse variable is -0.09 at the 4th cycle (Figure 5.6) and -1.0 for the scale (Figure 5.8). That is, Better Work reduced the proportion of workers reporting verbal abuse by 0.09 by the 4th assessment cycle and reduced the average intensity by 1.0 on a 7-point scale. It should be noted that while the cycle effects are negative for all three cycles, the dose effects are positive in the 3rd cycle for the binary measure of verbal abuse. Such an outcome indicates that Better Work Indonesia is struggling to contain the secular trend in verbal abuse, with decay occurring in the months following an assessment.
Results for verbal abuse in Jordan are reported in Tables 5.8 and 5.10 and Figures 5.9 to 5.12. Verbal abuse in Jordan is far more commonly reported than in Vietnam but less so than in Indonesia. At the 1st assessment cycle, 62.5 percent of participants reported no verbal abuse concern. However, this figure rises to 72.5 percent by the 4th assessment cycle, before retreating to 68.9 percent by the 6th assessment cycle.
A secular trend toward verbal abuse is again observed. The coefficients on the year variables are all positive and increasing in size. The Better Work treatment effect reduced the proportion of workers reporting verbal abuse by 0.42 (Figure 5.10) and reduced the average reported intensity by 1.4 (Figure 5.12) on a 7-point scale by the beginning of the 6th cycle. As with Indonesia, some of the gains made early in the program are reversed, with the dose effects following the 5th and 6th assessments turning positive.
By contrast, the programs in Haiti and Nicaragua struggled with verbal abuse. As can be seen from Table 5.11, reports of verbal abuse in Haiti are extremely volatile. At cycle 1, 39.2 percent of workers reported verbal abuse is not a concern. By cycle 10, that figure had dropped to 32.9 percent. The Better Work treatment effects depicted in Figures 5.13 and 5.14 indicate no improvement in verbal abuse reports associated with Better Work Haiti.
Nicaragua initially appeared to exhibit a reduction in verbal abuse. As can be seen in Table 5.14, in Nicaragua at cycle 1, 46.9 percent of respondents reported that verbal abuse was not a problem. The figure first rose to 60.5 percent at the 2nd cycle but then dropped to 42.5 percent by the 3rd cycle. The Better Work treatment effect, depicted in Figures 5.15 and 5.16, reveal a similar story. For the binary measure of verbal abuse, the initial dose effect, dose1, is negative, indicating that in the months following the 1st assessment verbal abuse declined. The cycle 2 and cycle 3 effects are also both negative. Verbal abuse appears to decline around the time of an assessment. However, there is decay in the months following the 2nd and 3rd assessments. By contrast, improvement is observed for the intensity measure. By the 3rd cycle, the average intensity declines by 0.67 on a 7-point scale.
112 | P a g e
Table 5.1 Variable Definitions Dependent Variables Variable Question Code Verbal_Abuse_Binary Is verbal abuse such as yelling or
vulgar language a concern for workers in your factory?
0=no 1=yes, do not want to answer
Verbal_Abuse_Fac Factory average of Verbal_Abuse_Binary
Verbal_Abuse 0=No, not a concern 1=Yes, discussed with co-workers 2=Yes, discussed with supervisor or manager 3=Yes, discussed with the trade union representative 4=Yes, considered quitting 5=Yes, threatened a strike 6=Yes, caused a strike
Verbal_Abuse_Scale 1=No, not a concern 2=Yes, discussed with co-workers 3=Yes, discussed with supervisor, manager or trade union representative 4=Yes, considered quitting, threatened a strike 5=Yes, caused a strike
Independent Variables Female What is your gender? Female = 1
Male = 0 Worker_Production_Pay What fraction of a sewer’s pay is
based on her own production? 1=None 2=Less than 10 percent 3=10 to 19 percent 4=20 to 29 percent 5=30 to 39 percent 6=40 to 49 percent 7=50 to 59 percent 8=60 to 69 percent 9=70 to 79 percent 10=80 to 89 percent 11=All of a sewer’s pay depends on the line’s production.
Sup_PerformancePay What percentage of a typical supervisor’s pay is based on the performance of the workers he or she supervises?
1=None. Supervisor pay does not depend on line production. 2=Less than 10 percent 3=10 to 19 percent 4=20 to 29 percent 5=30 to 39 percent 6=40 to 49 percent 7=50 to 59 percent 8=60 to 69 percent 9=70 to 79 percent 10=80 to 89 percent
113 | P a g e
11=A supervisor’s pay depends only on line production.
Rush_Orders_Obstacle Are rush orders an obstacle to business success?
4=Major 3=Modest 2=Minor 1=None
Rush_Orders_Major 1=Major 0=Otherwise
Rush_Orders_Modest 1=Modest 0=Otherwise
Rush_Orders_Minor 2=Minor 0=Otherwise
Rush_Orders_NotProblem 1=None 0=Otherwise
Sup_Stress_Obstacle Is supervisor stress an obstacle to business success?
4=Major 3=Modest 2=Minor 1=None
Sup_Stress_Major_Modest 1=Major or Modest 0=Otherwise
Sup_Stress_Minor 2=Minor 0=Otherwise
Sup_Stress_NotProblem 1=None 0=Otherwise
FOB Which production activities occur in this factory?
FOB=0 if CMT only FOB=1 if FOB
Preferred_Supplier How would you characterize the business relationship with this customer?
1=Preferred Supplier 0=Otherwise
Contractor 1=Contractor 0=Otherwise
CBA Are you represented by a collective bargaining agreement that you know of?
0=No 1=Yes
Education What is your highest level of education?
1=No formal education 2=Primary school 3=Lower secondary school 4=Upper secondary school 5=Short-term technical training 6=Long-term technical training 7=Professional secondary school 8=Junior college diploma 9=Bachelor’s degree
114 | P a g e
Figure 5.1 Verbal Abuse Treatment Months Vietnam
Figure 5.2 Verbal Abuse Treatment by Cycle Vietnam
Standard errors in parentheses *** p<0.01, ** p<0.05, * p<0.1
136 | P a g e
Chapter 6 Sexual Harassment
In order to estimate the Better Work impact on sexual harassment, workers are surveyed on the extent to which sexual harassment is a concern for workers in the factory. Possible responses range from (1) not a concern, (2) yes, discussed among workers, (3) yes, discussed with supervisor or manager, (4) yes, discussed with trade union representative, (5) yes, considered quitting, (6) yes, threatened a strike and (7) yes, caused a strike.
The analysis tests for a change in factory average reports of sexual harassment and its intensity over assessment cycles. The coding of the variable used in this analysis below is presented in Table 6.1. Findings for Vietnam, Indonesia, Jordan, Haiti and Nicaragua will be discussed in turn.
Reports of sexual harassment in Vietnam are extremely rare. As can be seen in Table 6.2, at the 1st assessment cycle 97.6 percent of workers report no concerns with sexual harassment. By the 5th cycle, this figure rises to 99.1 percent.
The decline, as small as it is, is a Better Work treatment effect. As can be seen in Table 6.4, all of the cycle and dose variables are negative and statistically significant for both the binary and intensity measures of sexual harassment, with the exception of dose5. The cycle effects are increasing in absolute value, with the exception of the transition from cycle 3 to cycle 4. At the end of the 5th cycle, the decline in the proportion of participants reporting sexual harassment concern due to Better Work is -0.08, as can be seen in Figures 6.1 and 6.2. That is, all of the observed decline in sexual harassment reports is attributable to Better Work. Similar results emerge for the intensity measure, as can be seen in Figures 6.3 and 6.4. At the 5th cycle, Better Work Vietnam has reduced the average intensity score by 0.11 on a 7-point scale.
Reports of sexual harassment in Indonesia are far more common. As can be seen in Table 6.5, only 15.6 percent of participants report no concern at the 1st assessment. This figure initially rises at cycles 2 and 3, to over 20 percent, but falls to 12.8 percent by the 4th assessment. Workers are particularly likely to report their concerns to the HR manager and the trade union representative. By the 4th cycle, 42.2 percent have reported sexual harassment to their HR manager and 30.4 percent have made a report to the trade union representative. Strikes or near strikes related to sexual harassment decline from 4.3 percent at the 1st assessment to one percent at the 4th assessment. There is also a large decline in workers who consider quitting as a result of sexual harassment. At the 1st assessment, 8.6 percent consider quitting. But at the 4th cycle, this figure has dropped to 2.9 percent.
Better Work treatment effects reflect the pattern in the summary data, as can be seen in Figures 6.5 and 6.6. By the end of the 4th cycle, the proportion of workers reporting sexual harassment drops by 0.13. The intensity effect initially exhibits a similar decline, as can be seen in Figures 6.7 and 6.8. At the 3rd assessment cycle, the intensity measure has declined by 0.84 on a 7-point scale. In contrast to the binary measure, intensity rises by 0.25 at the 4th assessment. However, the rise in intensity is due to the increased voicing to the HR manager and trade union representative, neither of which is necessarily a bad outcome.
137 | P a g e
A more persistent pattern of improvement emerges for Jordan. At the 1st assessment, 70.1 percent of participants report no concern with sexual harassment, as can be seen in Table 6.8. That figure falls to 66.4 at the 2nd assessment. Improvement emerges thereafter with 77.8 percent reporting no concern by the 6th assessment.
The Better Work treatment effect is large. The coefficients on the cycle variables are negative (with the exception of cycle 2) and increasing in absolute value with each assessment cycle, as can be seen in Table 6.10. The only source of concern is evidence of decay after the 1st, 3rd and 5th assessments. Overall, at the 6th assessment, the Better Work treatment effect reduced the proportion of workers reporting sexual harassment by 0.18 and reduced the intensity of reports by 0.58 on a 7-point scale, as can be seen in Figures 6.10 and 6.12.
Reports of sexual harassment in Haiti are also high. At the first assessment, 68.2 percent of participants report no sexual harassment concern. Significant improvement emerges by the 10th assessment cycle, with 79.2 percent of participants reporting no concern. However, as can be seen from Table 6.13, the improvement does not reflect a Better Work treatment effect that depends on the duration of program exposure.
If the improvement in the summary statistics is attributable to Better Work, the cause would have been the contribution the program made to a growing awareness of sexual harassment as an industry problem and industry-wide training. The year coefficients are negative and increasing in absolute value. In comparison to 2011, the proportion of workers reporting concern with sexual harassment drops by 0.19 in 2012, 0.39 in 2014 and 0.52 in 2015. Such year effects are extremely large. There is no obvious cause other than the attention brought by Better Work that might explain such a dramatic shift.
Reports of sexual harassment in Nicaragua are similar to those in Haiti. At the 1st assessment cycle, 70.4 percent of participants report no concern with sexual harassment, as can be seen in Table 6.14. This number rises at the 2nd assessment to 74.5 percent, but falls at the 3rd assessment to 67.5 percent. As can be seen in Table 6.16, the cycle effects are all positive. We observe negative dose effects only for the intensity measure in column (2). The overall effect is a reduction in sexual harassment.
However, as with Haiti, results for Nicaragua indicate that changes in sexual harassment concern are not related to the amount of exposure to Better Work that a factory has experienced. Yet, it is still possible that Better Work has had an impact on sexual harassment concerns in Nicaragua. The year effects, particularly for the binary indicator, are negative and increasing in absolute value. Compared to 2012, the proportion of workers concerned with sexual harassment dropped by 0.11 in 2013, 0.25 in 2014 and 0.28 in 2015. As with Haiti, it seems unlikely that such a dramatic drop would have occurred in the absence of Better Work.
138 | P a g e
Table 6.1 Variable Definitions
Dependent Variables Variable Question Code Sexual_Harassment_Binary Is sexual harassment a concern for
workers in your factory? 0=no 1=yes, do not want to answer
Sexual_Harassment _Fac Factory average of Verbal_Abuse_Binary
Sexual_Harassment 0=No, not a concern 1=Yes, discussed with co-workers 2=Yes, discussed with supervisor or manager 3=Yes, discussed with the trade union representative 4=Yes, considered quitting 5=Yes, threatened a strike 6=Yes, caused a strike
Sexual_Harassment _Scale 1=No, not a concern 2=Yes, discussed with co-workers 3=Yes, discussed with supervisor, manager or trade union representative 4=Yes, considered quitting, threatened a strike 5=Yes, caused a strike
Independent Variables Female What is your gender? Female = 1
Male = 0 Worker_Production_Pay What fraction of a sewer’s pay is
based on her own production? 1=None 2=Less than 10 percent 3=10 to 19 percent 4=20 to 29 percent 5=30 to 39 percent 6=40 to 49 percent 7=50 to 59 percent 8=60 to 69 percent 9=70 to 79 percent 10=80 to 89 percent 11=All of a sewer’s pay depends on the line’s production.
Sup_PerformancePay What percentage of a typical supervisor’s pay is based on the performance of the workers he or she supervises?
1=None. Supervisor pay does not depend on line production. 2=Less than 10 percent 3=10 to 19 percent 4=20 to 29 percent 5=30 to 39 percent 6=40 to 49 percent 7=50 to 59 percent 8=60 to 69 percent 9=70 to 79 percent
139 | P a g e
10=80 to 89 percent 11=A supervisor’s pay depends only on line production.
Rush_Orders_Obstacle Are rush orders an obstacle to business success?
4=Major 3=Modest 2=Minor 1=None
Rush_Orders_Major 1=Major 0=Otherwise
Rush_Orders_Modest 1=Modest 0=Otherwise
Rush_Orders_Minor 2=Minor 0=Otherwise
Rush_Orders_NotProblem 1=None 0=Otherwise
Sup_Stress_Obstacle Is supervisor stress an obstacle to business success?
4=Major 3=Modest 2=Minor 1=None
Sup_Stress_Major_Modest 1=Major or Modest 0=Otherwise
Sup_Stress_Minor 2=Minor 0=Otherwise
Sup_Stress_NotProblem 1=None 0=Otherwise
FOB Which production activities occur in this factory?
FOB=0 if CMT only FOB=1 if FOB
Preferred_Supplier How would you characterize the business relationship with this customer?
1=Preferred Supplier 0=Otherwise
Contractor 1=Contractor 0=Otherwise
CBA Are you represented by a collective bargaining agreement that you know of?
0=No 1=Yes
Education What is your highest level of education?
1=No formal education 2=Primary school 3=Lower secondary school 4=Upper secondary school 5=Short-term technical training 6=Long-term technical training 7=Professional secondary school 8=Junior college diploma 9=Bachelor’s degree
140 | P a g e
Figure 6.1 Sexual Harassment Treatment Months Vietnam
Figure 6.2 Sexual Harassment Treatment by Cycle Vietnam
-.1-.0
8-.0
6-.0
4-.0
20
final
treat
men
teffe
ct_b
ycyc
ledo
se
0 20 40 60BW_months
-0.01
-0.04-0.04 -0.04
-0.08-.08
-.06
-.04
-.02
0Tr
eatm
ent E
ffect
1 2 3 4 5
141 | P a g e
Figure 6.3 Sexual Harassment Intensity Treatment Months Vietnam
Figure 6.4 Sexual Harassment Intensity Treatment by Cycle Vietnam
-.15
-.1-.0
50
final
treat
men
teffe
ct_b
ycyc
ledo
se
0 20 40 60BW_months
-0.00
-0.05
-0.03-0.03
-0.11
-.15
-.1-.0
50
Trea
tmen
t Effe
ct
1 2 3 4 5
142 | P a g e
Table 6.2 Vietnam Sexual Harassment by Cycle Are workers in this factory concerned about Sexual Harassment?
Standard errors in parentheses *** p<0.01, ** p<0.05, * p<0.1
160 | P a g e
Chapter 7 Wages and Hours
Workers are asked how often they are paid and how much they received the last time they were paid. This information can be used to calculate weekly pay, converted into U.S. dollars. They are also surveyed on which days of the week they usually work and start and end times for each day. This information can be used to calculate weekly hours. We then estimate a weekly pay equation and a weekly hours equation. Both equations are controlled for demographic characteristics, year and month. The weekly pay equation is controlled for by weekly hours.
The wages and hours data are among the most noisy of all data collected in the impact evaluation. The sample is limited to workers reporting 40 to 100 hours per week. We also limit the analysis to workers earning within the range of ten to 140 USD per week.
Vietnam. Histograms for hours and wages in Vietnam are depicted in Figures 7.1 and 7.2. The data exhibit spikes at 53, 60 and 63 hours per week. Very few workers work more than 73 hours. The mean of the pay distribution is approximately 40 USD per week, with a spike at 46.
Better Work treatment effects for weekly hours are depicted in Figures 7.3 (by treatment months) and 7.4 (by assessment cycle). Better Work treatment effects for Weekly Pay USD are depicted in Figures 7.5 (by treatment months) and 7.6 (by assessment cycle). Estimated coefficients are reported in Table 7.1.
Weekly hours exhibits a significant treatment effect at cycles 2 (-1.65) and 4 (-2.5), with no evidence of decay in the months following an assessment. The coefficient on cycle 5 (-2.3) is statistically significant at the 15% level of confidence. These results indicate a cumulative Better Work treatment effect reducing work by 2.5 hours per week at the 4th assessment.
Weekly pay exhibits a strong significant treatment effect at cycles 2 (5.21), 4 (8.39) and 5 (12.00) with evidence of curing after the 3rd and 5th assessments. These results indicate a cumulative Better Work treatment effect increasing total pay by USD 15.33 per week by the 5th assessment.
Indonesia. Histograms for hours and wages in Indonesia are depicted in Figures 7.7 and 7.8. The data exhibit a spike at 45 hours per week. Very few workers work more than 70. The mean of the pay distribution is approximately 40 USD per week.
Better Work treatment effects for weekly hours are depicted in Figures 7.9 (by treatment months) and 7.10 (by assessment cycle). Better Work treatment effects for Weekly Pay USD are depicted in Figures 7.11 (by treatment months) and 7.12 (by assessment cycle). Estimated coefficients are reported in Table 7.2.
Weekly hours exhibits a significant treatment effect at cycles 2 (-2.1) and 4 (-4.8), with evidence of curing in the months following the 3rd assessment. These results indicate a cumulative Better Work treatment effect reducing work by 3.3 hours per week at the 4th assessment.
Weekly pay exhibits a strong significant treatment effect in the months following the 3rd and 4th assessments. These results indicate a cumulative Better Work treatment effect increasing total pay by USD 7.38 per week at the 4th assessment.
161 | P a g e
Jordan. Histograms for hours and wages in Jordan are depicted in Figures 7.13 and 7.14. The data exhibit spikes at 50, 55, 64 and 75 hours per week. Very few workers work more than 85 hours. The mean of the pay distribution is approximately 60 USD per week.
Better Work treatment effects for weekly hours are depicted in Figure 7.15 and Weekly Pay JD are depicted in Figure 7.16.
Better Work Jordan appears to have initially reduced weekly work hours. By the 4th assessment, weekly hours had declined by four hours for Jordanians and 2 hours for migrant workers. However, most of these effects are eliminated by the 5th assessment, with work hours rising at the 6th assessment particularly for Jordanian workers.
Weekly pay exhibits a strong significant treatment effect by the 4th assessment. These result indicate a cumulate Better Work treatment effect increasing total pay by JD 14.1 for Jordanians and JD 9.43 for migrants by the 6th assessment.
Haiti. Histograms for weekly hours and pay in Haiti are depicted in Figures 7.17 and 7.18. The data exhibit spikes at 45 and 50 hours of work per week. Pay ranges from 20 to 45 USD per week.
Treatment effects are reported in Table 7.3. Given limitations of the data, only cycle treatment variables were included in the regression. The treatment effects for hours vary, with some positive and some negative, as can be seen in column (1). There is some evidence, however, of a positive treatment effect on pay. Initially, pay declines by USD 1.64 at the 2nd assessment. Pay rebounds, with a positive treatment effect of USD 3.92 at the 3rd assessment but disappears again at the 5th assessment (-5.91). However, at the 9th and 10th assessments, pay appears to be rising consistently. By the 10th assessment, the Better Work treatment effect is USD 4.50 per week.
162 | P a g e
Figure 7.1 Histogram Weekly Hours Vietnam
Figure 7.2 Histogram Weekly Pay USD Vietnam
0.0
5.1
.15
.2D
ensi
ty
40 50 60 70 80 90TotalHours
0.0
1.0
2.0
3.0
4D
ensi
ty
20 40 60 80 100 120WeeklyPayUSD
163 | P a g e
Figure 7.3 Weekly Hours Better Work Treatment Months Vietnam Demographic Year and Month Controls
Figure 7.4 Weekly Hours Better Work Treatment by Cycle Vietnam Demographic Year and Month Controls
-5-4
-3-2
-10
final
treat
men
teffe
ct_b
ycyc
ledo
se
0 20 40 60BW_months
-0.14
-1.68
-0.74
-1.90
-3.37
-4-3
-2-1
0Tr
eatm
ent E
ffect
1 2 3 4 5
164 | P a g e
Figure 7.5 Weekly Pay USD Better Work Treatment Months Vietnam Demographic Year and Month Controls
Figure 7.6 Weekly Pay USD Better Work Treatment by Cycle Vietnam Demographic Year and Month Controls
05
1015
20fin
altre
atm
ente
ffect
_byc
ycle
dose
0 20 40 60BW_months
2.30
6.39
8.11
9.81
15.33
05
1015
Trea
tmen
t Effe
ct
1 2 3 4 5
165 | P a g e
Figure 7.7 Histogram Weekly Hours Indonesia
Figure 7.8 Histogram Weekly Pay USD Indonesia
0.1
.2.3
.4D
ensi
ty
40 50 60 70 80TotalHours
0.0
1.0
2.0
3.0
4D
ensi
ty
20 40 60 80 100 120WeeklyPayUSD
166 | P a g e
Figure 7.9 Weekly Hours Better Work Treatment Months Indonesia Demographic Year and Month Controls
Figure 7.10 Weekly Hours Better Work Treatment by Cycle Indonesia Demographic Year and Month Controls
-4-3
-2-1
01
final
treat
men
teffe
ct_b
ycyc
ledo
se
0 10 20 30 40 50BW_months
-1.33
-2.73
-2.04
-3.27
-4-3
-2-1
0Tr
eatm
ent E
ffect
1 2 3 4
167 | P a g e
Figure 7.11 Weekly Pay USD Better Work Treatment Months Indonesia Demographic Year and Month Controls
Figure 7.12 Weekly Pay USD Better Work Treatment by Cycle Indonesia Demographic Year and Month Controls
-50
510
15fin
altre
atm
ente
ffect
_byc
ycle
dose
0 10 20 30 40 50BW_months
-1.64
1.83
6.55
7.38
-20
24
68
Trea
tmen
t Effe
ct
1 2 3 4
168 | P a g e
Figure 7.13 Histogram Weekly Hours Jordan
Figure 7.14 Histogram Weekly Pay USD Jordan
0.0
2.0
4.0
6.0
8D
ensi
ty
40 60 80 100TotalHours
0.0
1.0
2.0
3.0
4D
ensi
ty
40 60 80 100 120 140WeeklypayUSD
169 | P a g e
Figure 7.15 Weekly Hours Better Work Treatment by Cycle Jordan Demographic Year and Month Controls
Figure 7.16 Weekly Pay JD Better Work Treatment by Cycle Jordan
Demographic Year and Month Controls
-10.0
-5.0
0.0
5.0
10.0
15.0
1 2 3 4 5 6
Chart Title
Jordanian Migrant
-6.0
-4.0
-2.0
0.0
2.0
4.0
6.0
8.0
1 2 3 4 5 6
Chart Title
Jordanian Migrant
170 | P a g e
Figure 7.17 Histogram Weekly Hours Haiti
Figure 7.18 Histogram Weekly Pay USD Haiti
0.0
5.1
.15
Den
sity
40 50 60 70 80TotalHours
0.0
1.0
2.0
3.0
4.0
5D
ensi
ty
20 40 60 80WeeklyPayUSD
171 | P a g e
Table 7.1 Wages and Hours Better Treatment Effects Vietnam
Standard errors in parentheses *** p<0.5, ** p<0.10, * p<0.15
174 | P a g e
Chapter 8 Coercion, Human Trafficking, Abuse and Deportation Threats
Human trafficking can be measured from the mechanisms used to control workers, evidence of trafficking itself and the emotional implications of trafficking. Variables for analysis are presented in Table 8.1 and summary statistics are presented in Table 8.2.
Agency variables provide an indicator of whether workers feel a sense of control in their lives and are derived from the mental health questions. About half of the sample is asked whether they are troubled or bothered by crying and the other half is asked about feeling fearful. In order to increase the sample size, the two measures are combined into a single variable called Agency. Workers are asked to rate crying or feeling fearful on a scale of 1 to 5, with 1 = never and 5 = all of the time. The average response for Crying is 1.77 and the average response for Fearful is 1.54. That is, about half of the workers are reporting crying or feeling fearful at least some of the time.
Evidence of the mechanisms of human trafficking include control of passports and punishments related to seizure of passports and deportation threat. Deportation threat is indicated if the worker believes that one of the punishments for misconduct is to be deported. Deportation threat is coded as 1=yes, deportation threat is a punishment and 0=otherwise. Only 1.5 percent of workers report deportation threat, which is consistent with the rate of noncompliance detected by Better Work Enterprise Advisors. Lack of control of a worker’s passport is reported by 20.6 percent of workers in the sample. Loss of passport as a punishment is very rare.
Evidence that workers have been trafficked is indicated if freedom of movement is constrained. Workers are asked if they could go home if they wanted to. If the worker responded, “no”, then several explanations are offered: lacking airfare, too much debt, contract restrictions and lack of control of their passport. Workers can also indicate that the factory or their family will not let them. The most common reasons for not being able to go home are lack of airfare (12.7%) and a requirement that they complete their contract before returning home (21.6%). Debt (5.3%), lack of possession of passport (2.5%) and factory refusal to allow the worker to go home (1.6%) are secondary concerns.
Better Work treatment effects on agency are reported in Table 8.3. Columns (1), (2) and (3) analyze the treatment effects on crying, feeling fearful and agency. Regressions include demographic, factory, year and month controls.
The estimated coefficients of the cycle variables exhibit a consistent pattern. Coefficients are negative and typically becoming larger in absolute value over time. Such a pattern indicates a program effect that is increasing with greater exposure to Better Work Jordan. For example, consider column (2), feeling fearful. The coefficients are cycle 3 (-0.302), cycle 4 (-0.384), cycle 5 (-0.383) and cycle 6 (-1.067). The limitation, of course, is that the standard errors on the estimates are quite large, in some cases, raising concerns about statistical significance. Combining the crying and fearful responses into a single indicator of agency provides a similar pattern and statistical significance emerges at cycle 5.
Average treatment effects by cycle are depicted in Figures 8.1 (Crying), 8.2 (Fearful) and 8.3 (Agency). By cycle 6, Better Work Jordan appears have reduced trouble with crying by 0.41 on
175 | P a g e
a 5-point scale and lack of agency by 0.57 on a 5-point scale. Both effects are statistically significant at the 5 percent level. Given that on average workers reported crying is 1.77, the Better Work treatment effect nearly eliminated crying as a concern for workers.
Significant effects are also in evidence for deportation threat as a punishment. As can be seen in Column (1) of Table 8.4, the estimated coefficients of the cycle variables are all negative when statistically significant. However, beginning with cycle 4, decay occurs in the months following an assessment, as can be seen by the positive coefficients on dose4, dose5 and dose6. While somewhat discouraging, theory anticipated such an outcome. Firms constrained from using their preferred method of preventing workers from leaving, switch to a deportation threat strategy.
Column (2) of Table 8.4 provides estimates of the treatment effect on passport seizure as a punishment. As with deportation threats, there is some variation in treatment effect. However, in contrast to deportation threat, curing occurs after the 4th and 6th assessments. Such a pattern is again consistent with strategy switching.
Summary treatment effects are depicted in Figures 8.4 for deportation threat and 8.5 for passport punishment. The treatment effects are small. Better Work appears to have reduced the proportion of workers subject to deportation threat by 4 percent at the 2nd assessment, but only 2 percent by the 6th assessment.
Turning to evidence that workers lack control of movement, workers are asked if they could go home if they want to. Estimates of treatment effects are reported in Table 8.5 for lacking airfare (column 1), having too much debt (column 2), believing that they must complete their contract (column 3) and not being allowed to go home by the factory (column 4).
A Better Work treatment effect is most pronounced for lack of airfare. Estimates of the cycle coefficients are negative and statistically significant. However, the treatment effect decays over time and disappears at the 6th assessment. Nonetheless, there is significant improvement relative to the baseline with a treatment effect at the 5th assessment of -0.20. Average treatment effects by cycle are depicted in Figures 8.6 for Airfare and 8.7 for Debt. The average treatment effect at the 5th assessment for Airfare is -0.20 and for Debt is -0.11.
Significant improvement also emerges for debt as an obstacle to returning home, though the effect peaks at cycle 4. The estimated coefficients on cycle 3 (-0.0588), cycle 4 (-0.121) and cycle 5 (-0.102) are all significant at the 10 percent level. The cycle6 coefficient, -0.191, is negative and larger in absolute value than any of the other estimates, but is not statistically significant.
In contrast to airfare and debt, we do not see a consistent pattern in the Better Work treatment effects for workers who believe they must complete their contract before returning home (column 3 of Table 8.5) and no significant effects for workers who believe that the factory will not let them return home (column 4 of Table 8.5). The belief that the worker cannot leave until the contract is complete is pervasive, with 21.6 percent of workers seeing the contract as an obstacle to returning home.
176 | P a g e
Figure 8.1 Jordan Human Trafficking, Crying
Figure 8.2 Jordan Human Trafficking, Fearful
-0.18
0.04 0.04
-0.15
-0.23
-0.41-.4-.3
-.2-.1
0Tr
eatm
ent E
ffect
1 2 3 4 5 6
-0.08
0.17
-0.14
-0.36
-0.20
-0.57
-.6-.4
-.20
.2Tr
eatm
ent E
ffect
1 2 3 4 5 6
177 | P a g e
Figure 8.3 Jordan Human Trafficking, Lack of Agency
Figure 8.4 Jordan Human Trafficking, Deportation Punishment
-0.19
0.02
-0.12
-0.29-0.27
-0.51-.5-.4
-.3-.2
-.10
Trea
tmen
t Effe
ct
1 2 3 4 5 6
-0.02
-0.04
-0.03
-0.01
0.00
-0.02
-.04
-.03
-.02
-.01
0Tr
eatm
ent E
ffect
1 2 3 4 5 6
178 | P a g e
Figure 8.5 Jordan Human Trafficking, Passport Punishment
Figure 8.6 Jordan Human Trafficking, Airfare
-0.00
-0.02
-0.01
-0.00
-0.01
-0.00
-.02
-.015
-.01
-.005
0Tr
eatm
ent E
ffect
1 2 3 4 5 6
-0.08
-0.19
-0.17-0.15
-0.20
-0.26
-.25
-.2-.1
5-.1
-.05
0Tr
eatm
ent E
ffect
1 2 3 4 5 6
179 | P a g e
Figure 8.7 Jordan Human Trafficking, Debt
-0.04
-0.08-0.08
-0.12
-0.11
-0.15-.15
-.1-.0
50
Trea
tmen
t Effe
ct
1 2 3 4 5 6
180 | P a g e
Table 8.1 Variable Construction
Crying How often are you bothered by crying? 1=never …. 5 = all of the time Fearful How often are you bothered by crying? 1=never …. 5 = all of the time Agency Max of Crying Fearful Cognitive_Dissonance Who decided for you to come to Jordan? 1=myself, 0 otherwise Deport_Punishment Is deportation a punishment in this factory? Yes = 1, No=0 Fac_Deport_ Punishment Factory average of Deport_ Punishment HT_Passport Do you have a passport? Yes, the factory has it = 1, 0=otherwise, or Punishment_Passport Is loss of passport a punishment in this factory? Yes = 1, No=0 Fac_Punishment_Passport Factory average of Punishment_Passport HTNoHomeAirFare Could you go home if you wanted to? 1=No, I do not have airfare. 0=otherwise HTNoHomeDebt Could you go home if you wanted to? 1=No, I have too much debt. 0=otherwise HTNoHomeContract Could you go home if you wanted to? 1=No, I have to complete my contract.
0=otherwise HTNoHomePassport Could you go home if you wanted to? 1=No, the factory has my passport.
0=otherwise HTNoHomeFactoryRefuse Could you go home if you wanted to? 1=No, the factory won’t let me.
0=otherwise HTNoHomeFamilyRefuse Could you go home if you wanted to? 1=No, my family won’t let me.
0=otherwise HTNoHome Max of HTNoHome Airfare Debt Contract Passport Factory
Standard errors in parentheses *** p<0.01, ** p<0.05, * p<0.1
186 | P a g e
Chapter 9 Deceptive Pay Practices
Deceptive pay practices can be thought of as a classic prisoner’s dilemma. Firms are motivated to reduce costs by failing to pay as promised. Workers respond to low pay with low effort. The effect of such an interaction is to produce low productivity and low pay, an undesirable outcome for both workers and firms. Escaping such an outcome requires that firms find some credible mechanism for signaling a genuine intent to pay as promised.
It has been argued that when workers and firms place a value on how they are perceived by one another, it is possible to escape the prisoner’s dilemma of low pay and low effort.8 Firms can signal that they care about fairness if total pay increases with firm revenue.
Possible outcomes of worker-firm interactions are depicted in Figure 9.1. Beginning at the top of the figure is the firm. Either the firm does or does not care about how it is perceived by its workers.
The first possibility is that the firm has no sense of responsibility toward its employees. In that case, we move down the left side of the diagram. The firm does not care whether it is perceived as fair by its employees. Workers respond with low effort, leaving the firm with low output.
If the firm does care whether workers perceive it as fair, we move down the right side of the diagram. Now, it is possible that firms and workers care about how they are perceived by each other but are unaware that behaving in a reciprocal fashion will produce a more desirable outcome. In that case, reciprocity as a strategy for escaping the prisoner’s dilemma is available but the firm is unaware of the option. Low effort and output again emerge, as is depicted by the second channel of Figure 9.1.
If the firm is unaware of the reciprocity mechanism, then the game takes place as if the reciprocity function does not exist and the outcome results in the prisoner’s dilemma. This is the point at which Better Work may begin to influence the outcome of the interaction between the worker and the firm. Better Work, by inducing the firm to pay as promised rather than engage in deceptive pay practices, could beget a positive response from workers. If we observe firms increasing productivity when they move from noncompliant to compliant on deceptive pay practices, it could be that Better Work, by inducing firms to be compliant, are helping the firm realize the existence of a better cooperative outcome.
8 Akerlof, George A. 1982. “Labor Contracts as Partial Gift Exchange,” The Quarterly Journal of Economics 97 (4): 543-569; Rabin, Matthew. 1993 "Incorporating Fairness into Game Theory and Economics." The American Economic Review 83.
187 | P a g e
It is also possible that the firm is aware of the theoretical possibility that workers will respond to generosity by the firm, but believes that the effort response will be small relative to the expense. In that case, we move down the third channel in Figure 9.1.
In this third case, Better Work again has a role. By inducing firms to become compliant and pay workers as promised, firms may discover that the worker effort response is greater than expected. By inducing firms to be compliant, Better Work’s intervention could cause firms to reassess the effort response of workers to the firm’s generosity. In such a case, the firm will pay as promised and workers will exert high effort. Productivity consequently increases. Such an outcome is depicted in the fourth channel in Figure 9.1.
To test the proposition that Better Work is either revealing the existence of the reciprocity opportunity or revealing that reciprocity will improve firm performance, we conduct the following tests.
Test 1. Are wages a function of revenue? If in fact, wages are a function of revenue, controlling for worker and firm characteristics, rather than productivity alone, we have evidence of the existence of the reciprocity function and that some firms are aware of it. If, however, it is found that wages are not a function of revenue, it could suggest that the reciprocity function does not exist, firms have not yet realized its existence or the parameter values are such that the prisoner’s dilemma is the equilibrium outcome even in the presence of the reciprocity function.
Test 2. If it is found that revenue does predict wages, we then ask whether compliance is mediating the relationship between revenue and pay. That is, do compliant firms have a stronger relationship between revenue and pay then noncompliant firms?
Test 3. If compliance is a mediator, we then need to determine the direction of causality. Are firms that engage in reciprocity also compliant or did Better Work help firms discover the reciprocity function? For this test, compliance is replaced by cycle and dose treatment variables to determine if randomized exposure to Better Work is enhancing the revenue-pay link.
Estimation. We begin by testing for the presence of the reciprocity function. The first regressions test whether wages are a function of revenue. Additionally, do workers respond with high effort when firms pay high wages? Productivity is measured by time to target, controlling for the length of the workday. A smaller number would suggest increased productivity, meaning we would expect revenue to be negatively related to time to target.
If the first test reveals evidence of a reciprocity mechanism, the next step is to add Better Work. In particular, is the revenue-price relationship mediated by compliance? Five compliance points related to pay procedures are tested as mediators in the pay-revenue relationship.
A full list of the compliance questions that were used can be found in Table 9.1. Compliance tested as mediators are compliance related to accurate payroll, minimum wage for regular and apprentice workers, overtime and personal leave.
188 | P a g e
If compliance is functioning as a mediator, we then test for evidence of a causal relationship from Better Work to reciprocity. The compliance variables in the pay equation are replaced by the cycle and dose variables interacted with revenue.
Variables. The main dependent variables are “Weekly Pay,” “Time to Target on Friday” and a variety of compliance questions. Time to target is a means of measuring worker productivity. Time to target indicates how long it takes the worker to reach their production target.
The main determinates of a wage equation make up the majority of the independent variables. Total hours, sex, age, education, job type, number of promotions and number of nearby factories make up the basis of the standard wage equation. Month and year dummies are used to capture any exogenous year or month effects.
Total hours is measured using a scale ranging from 0 to 24 (based on a 24 hour clock) where workers indicate their start time and end time for each day of the week. Then those responses are compiled into a total hours variable. Sex is a binary variable where 1 indicates female and 0 indicates male. Education is asked as “What is your highest level of education?” where workers choose from a list of “No formal education,” “Primary school,” “Lower secondary school,” “Upper secondary school,” “Short-term technical training,” “Long-term technical training,” “Professional secondary school,” “Junior college diploma,” or “Bachelor’s Degree.” The responses are separated into a series of independent dummy variables.
There are nine jobs in the factory and workers select their job from a list that reads “sewer”, “cutter”, “spreader”, “checker”, “mechanic”, “packer”, “quality control”, “supervisor”, or “helper,” which also was separated into a series of dummy variables. Promotions are measured by the number of promotions a worker has received since entering the factory asked as, “Have you been promoted since you entered this factory,” where workers indicate “Yes, once” coded as 1, “Yes, two times” coded as 2, “Yes, more than two times” coded as 3 or “No” coded as 4. The nearby factories variable is coded in groups where 1 suggests no nearby factories, 2 suggests one to two nearby factories, 3 suggests three to five nearby factories, 4 suggests six to ten nearby factories and 5 suggests eleven or more nearby factories. As was with education and job type, promotions and nearby factories were recoded into separate independent dummy variables.
Revenue is one of the major independent variables measured. Revenue is paired with an employment variable that measures the number of employees in a firm. Together, the two variables control for the scale of the firm.
Compliance is measured as a binary variable where 0 is compliant and 1 is noncompliant. Moreover, the interaction variable between compliance and revenue is used to determine if the relationship between wages and revenue is the same, stronger or weaker in compliance than in noncompliance. Here it is used to determine if compliance increases or decreases the strength of the relationship between wages and revenue by changing the marginal effect of revenue on wages. The same logic is used in all compliance questions.
189 | P a g e
Summary statistics are provided in Table 9.2 and 9.3.
Empirical Results. Proceeding with the model mentioned above, we first test for the impact of revenue on wages and productivity. Table 9.4 reports estimates of standard pay (columns 1 and 2) and productivity (columns 3 and 4) relationships. Revenue is included as an explanatory variable in columns (2) and (4). Revenue positively predicts pay, even when controlling for productivity and negatively predicts time to target, controlling for demographic characteristics. All equations are controlled for year and month.
These results support the contention that some firms are not at the prisoner’s dilemma outcome but are rather increasing wages and productivity by sharing revenue with workers. That is, the reciprocity relationship appears to exist.
The next step is to add the Better Work compliance variables and compliance-revenue interaction terms. The purpose of this test is to determine whether Better Work is a mediator for firms discovering the reciprocity relationship.
Compliance related to accurate payroll records, proper payment of minimum wage for full time workers and apprentices, proper payment for overtime and proper payment for personal leave all strengthen the relationships between wages and revenue, as can be seen in Table 9.5. These regressions control for worker and firm characteristics, year and month.
Putting together the findings from Tables 9.4 and 9.5 indicates that there is a reciprocity relationship. Firms that engage in revenue sharing with workers are also more productive. Further, the effect is mediated by compliance on pay practices. Firms that are compliant on several indicators of pay practices engage in more revenue sharing than other firms.
In fact, as can be seen in Table 9.5, the coefficient on Revenue itself is generally negative. Firms that are not compliant in pay practices are not engaged in revenue sharing. The coefficient on Revenue is negative in all equations and statistically significant except in all but the first. The practice of revenue sharing is exclusive to firms compliant on pay practices.
Better Work Impact Treatment Effects. The question remains, though, what the direction of causality is. Is Better Work driving compliance and the discovery of reciprocity or are firms that have discovered reciprocity more compliant as a byproduct? For the answer to this question, we turn to Table 9.6.
As in other chapters, we estimate the contribution of the cycle and dose variables to weekly pay (columns 1 and 2) and Time to Target (columns 3 and 4). The first column for each variable reports the basic treatment effect. For weekly pay, there is a strong treatment effect. Weekly pay rises after the 1st assessment and then with each assessment cycle. There appears to be little significant Better Work effect on time to target.
190 | P a g e
The second column of results for each variable introduces the Better Work cycle and dose variables as mediators for the relationship between Revenue and WeeklyPay. As can be seen in column (2), there is some evidence of a relationship.
The excluded group is cycle 4. Therefore, the coefficients of revcycle1, revcycle2 and revclcycle3 should be compared to revenue interacted with cycle 4.
The sign of revcycle1 is positive but the coefficient of revdose1 is negative. Such a configuration indicates that firms at that time of their 1st assessment are engaging in revenue sharing with workers but that the effect decays in the months following the 2nd assessment. A significant effect does not return until cycle 3. The coefficient of revcycle3 is positive and significant, indicating an increase in revenue sharing associated with exposure to Better Work at the time of the 3rd assessment. However, the coefficient of revdose4 is negative and significant. Thus, the positive effect that was achieved at the 3rd assessment begins to dissipate by the 4th assessment.
We conclude then that there appears to be two types of firms in Vietnam. Some of them are trapped in a prisoner’s dilemma, paying low wages and realizing low productivity. However, the other group appears to have discovered that revenue sharing with workers will increase productivity.
Firms that have discovered the benefits of revenue sharing are more likely to be compliant on points related to pay practices. There is weak evidence that Better Work may have been supporting factories as they discover the benefits of a reciprocal relationship with workers. However, the beneficial effect appears to dissipate by the 4th assessment cycle.
The erosion in reciprocity at the 4th assessment may have occurred because firms were not experiencing sufficiently strong productivity benefits to make reciprocity profit-maximizing. However, as discussed in Chapter 7, deceptive pay practices are employed by firms to increase overtime after Better Work has precluded the forced overtime, low base pay and dismissal threats strategies for achieving their overtime objectives. Therefore, the decay in reciprocity that emerges at the 4th assessment may reflect strategy switching as firms attempt to achieve their hours target.
191 | P a g e
Figure 9.1 Better Work Intervention Decision Tree
Firm
No Existance of Reciprocity
Low Output
Existance of Reciprocity
Unaware of Reciprocity Function
Low Output
Aware of Reciprocity Function
(Better Work Intervention?)
Parameters lead to mutual-min
Low Output
Parameters lead to mutual-max (Better Work
Intervention?)
High Output
192 | P a g e
Table 9.1 Compliance Points for Pay Practices Compliance Description: Compliance Question: Minimum Wage for Fulltime Workers Does the employer pay at least the applicable legal
minimum wage for ordinary hours of work to regular full time workers?
Minimum Wage for Piece-rate Workers Does the employer pay at least the applicable legal minimum wage for ordinary hours of work to piece rate workers?
Minimum Wage for Apprentices Does the employer pay at least 70% of the applicable legal minimum wage for ordinary hours of work to apprentices?
Minimum Wage for Temporary Workers Does the employer pay at least the applicable legal minimum wage for ordinary hours of work to temporary workers?
Minimum Wage for Probationary Workers Does the employer pay at least 70% of the applicable legal minimum wage for ordinary hours of work to probationary workers?
Minimum Wages for Vocationally Trained Workers Does the employer pay at least 7% higher than the applicable legal minimum wage for ordinary hours of work to workers who have received vocational training?
All Overtime Pay Compliant Does the employer pay workers for all overtime hours worked?
Ordinary Overtime Compliant Does the employer pay workers 150% of normal wage for ordinary overtime?
Rest Days Overtime Compliant Does the employer pay workers 200% of normal wage for overtime worked on weekly rest days?
Public Holidays Overtime Compliant Does the employer pay workers 300% of the normal wage for overtime worked on public holidays?
Night Overtime Compliant Does the employer pay workers 130% of the normal wage for regular working hours worked at night?
Wages Go Directly to Workers Does the employer pay wages directly to workers? Compliant on National Wage Deduction Law Does the employer comply with national laws
regarding wage deductions? Informs Workers of Wage Deductions Does the employer properly inform workers about
wage payments and deductions? Public Holiday Wage Payment Compliant Does the employer pay workers for legally
mandated paid public holidays? Pay Annual Leave Does the employer pay workers correctly for legally
required annual leave? Pay Personal Leave Does the employer pay workers correctly for
personal leave? Pay Sick Leave Does the employer correctly pay workers during
sick leave? Pay Maternity Allowance Does the employer pay full average monthly wages
and maternity allowance of two month's minimum wage to entitled workers?
Pay Breastfeeding Breaks Does the employer pay workers for one hour breastfeeding break per day?
Pay Menstrual Breaks Does the employer pay women workers for 30
193 | P a g e
minutes rest per day during their periods? Pay Paternity Leave Does the employer pay for paternity leave when
required? Pay Other Forms of Leave Does the employer pay for other types of leave
when required? Pay Dangerous Jobs Higher Wages Does the employer pay at least 5% higher than the
normal applicable wage level for workers who perform hazardous and dangerous and 7% higher for extremely hazardous and dangerous work?
Accurate Payroll Does the employer keep only one accurate payroll record?
The analysis of the impact of supervisory skills training was conducted by Laura Babbitt (2016).9 Additional evidence on training is currently being undertaken by Raymond Robertson and Wim de Groof. Analysis is forthcoming.
9 Babbitt, Laura G., Elyse Vogeli and Drusilla Brown. 2016. “Better Work Supervisory Skills Training, A Random Controlled Trial.” Tufts University.
201 | P a g e
Chapter 11 Millennium Development Goals
Background
The Better Work impact evaluation was designed, in part, to identify the role of the program in reaching the Millennium Development Goals (MDG). Specific attention was paid to Goal 1 Eradicating Extreme Hunger and Poverty, Goal 2 Achieving Universal Primary Education, Goal 3 Promoting Gender Equality and Women’s Empowerment and Goal 5 Improving Maternal Health.
As will be seen below, Better Work has had significant impacts on promoting gender equality, universal primary education, hunger alleviation and maternal health. Though, extreme hunger continues to be a persistent challenge for some Better Work country programs, particularly Haiti.
For each MDG, a basic regression model was developed identifying the underlying causal variables determining the goal outcome. Better Work impact variables were then introduced. Better Work presence is measured first by the cycle of assessment (cycle 1, cycle 2, etc.) and then by the months since the most recent assessment (dose1, dose2, dose3, etc.). Estimated equations also include year and month to control for secular trends unrelated to Better Work.
An ideal program impact is indicated if the coefficients on the cycle and dose variables are significant and increase in magnitude over time. Coefficients that are initially zero or are of the wrong sign indicate that the program requires curing before an impact emerges. Coefficients that return to zero in later cycles indicate program decay.
Goal 1: Eradicate Extreme Hunger
Hunger is a significant issue among Nicaraguan apparel workers. Hunger reports by cycle are tabulated in Table 11.1. In cycle 1, 49 of 202 respondents reported hunger most or all of the time. While hunger may have diminished during cycle 2, reports remerge in cycle 3, with 22 of 86 participants reporting hunger most or all of the time.
Statistical analysis detects a BWN program effect in the period after the 2nd assessment, as reported in Table 11.2. The year and cycle variables are not statistically significant. However, the coefficient on the dose2 variable is negative (-0.177), indicating a positive program effect on hunger, which decays after the 3rd assessment.
Hunger is also a significant issue for workers in Haiti. At cycle 1, 11.9 percent of participants report severe hunger either very often or all of the time, as reported in Table 11.3. Reports of extreme hunger drop to zero at the 7th cycle, but at the 10th cycle, 8.1 percent of respondents are again reporting extreme hunger. At cycles 4 and 5, extreme hunger jumps to 16.7 and 21.7 percent respectively.
When estimating program effect, three different measures of hunger are considered. Hunger is first scored on a scale from 1=rarely to 5=all of the time. OftenHungry is coded as 0=rarely or occasionally and 1=often, very often or all of the time.
202 | P a g e
VeryOftenHungry is coded as 0=rarely, occasionally or often and 1=very often or all of the time. Estimated program effects are reported in Table 11.4
Women are less likely to report extreme hunger than men. Hunger is most prevalent among workers aged 18-20. Hunger reports are otherwise unrelated to education, age or work experience. Surprisingly, the year effects are not statistically significant.
Considering program impact, none of the cycle variables is statistically significant, with the lone exception of cycle8 in the first (1.885) and the third (0.612) specifications. At cycle 8, workers increase their hunger rating by nearly two full points on a 5-point scale, indicating a startling jump in the proportion of participants reporting extreme hunger.
Some of the dose variables show a significant effect but the signs of the coefficients vary. Dose1 is significant and positive for the Hunger and OftenHungry categories, indicating an increase in participants reporting Often Hungry. Dose5 is significant for Hungry and VeryOftenHungry, indicating an increase in the proportion of reports of extreme hunger. Dose8 is significant and negative, indicating an overall improvement in hunger reports after the 8th assessment.
Overall, there does not appear to be a consistent pattern of improvement in extreme hunger for Haitian participants. It is likely that adverse events such as the cholera epidemic were overwhelming any Better Work program effect.
The incidence of hunger in Jordan is significant, as reported in Table 11.5. As for Haiti, we consider a hunger scale and report the proportion of workers who report being hungry often (often, very often, all of the time) and very often (very often, all of the time). At the 1st assessment, 9.7 percent of respondents report being hungry often and 4.8 percent report being hungry very often. Reports of hunger increase in the subsequent cycles, only falling at cycle 6. At that point, 3.7 percent report being hungry often and only 1.9 percent report being hungry very often.
Turning to the statistical analysis, Better Work Jordan exhibits strong treatment effects, as reported in Table 11.6. For the scale question, cycles 3, 4 and 5 have negative and statistically significant coefficients. More strikingly, the coefficients increase in absolute value with each passing cycle. We can conclude, then, that program effect is sustained and no decay occurs at later stages of the Better Work Programme. The coefficient of the dose2 variable is also negative and significant, indicating curing after the 2nd assessment. There is also evidence of a decline in extreme hunger at cycle 3, though the positive coefficient on the dose3 variable indicates decay in the months following the 3rd assessment.
Hunger is less severe in Indonesia than in Jordan, as reported in Table 11.7. More concerning is the fact that reports of hunger, particularly extreme hunger, are increasing, though slightly, over time. At cycle 1, 5.3 percent of workers report being hungry often, very often or all of the time. By the 3rd cycle, that figure has increased to 7.0 percent. While the actual number of participants reporting hunger is small, the trend remains concerning.
203 | P a g e
The statistical analysis, however, indicates that the trend in hunger is, at least in part, secular, as can be seen in Table 11.8. The coefficients of the year dummies indicate that hunger increased each year from 2011 to 2013. There was a slight decline in 2014 and reports return to 2011 levels in 2015. However, the coefficients for cycle3 and cycle4 variables are positive, significant and fairly large. The cycle4 coefficient is 0.327 on a 5-point scale. Evidence that Better Work is reducing hunger emerges only at cycle4 for extreme hunger. Though, it should be noted that the effect is miniscule.
204 | P a g e
Table 11.1 Hunger by Cycle Nicaragua
Hungry Cycle 1 2 3 Total 1 Rarely, just before meals 84 17 30 129 2 Occasionally, sometimes during the day 69 6 34 106 3 Often, hungry most of the time 35 7 12 53 4 Very Often, hunger keeps me awake at night 8 0 8 16 5 All of the Time 6 0 2 7 Total 202 30 86 318
Table 11.2 Hunger Better Work Treatment by Cycle Nicaragua, Year Controls
Standard errors in parentheses *** p<0.01, ** p<0.05, * p<0.1
211 | P a g e
Goal 2: Achieve Universal Primary Education
Financial constraints significantly affect child schooling in Nicaragua, as reported in Table 11.9. Of 321 participants in the study with sons, 60 (18.7%) report having school-aged sons out of school for financial reasons. For the 303 participants reporting having school-aged daughters, 41 (13.5%) report having school-aged daughters out of school for financial reasons. For boys, children out of school improves considerably at the 2nd cycle. Only 6.6 percent of school-aged boys were out of school for financial reasons. But non-attendance rates return to their cycle 1 level by the time of cycle 3. Statistical analysis reveals no program effect of girls or boys in school.
Nicaraguan parents with preschool children voice significant concerns with child safety, as reported in Table 11.10. At cycle 1, 35 (21%) of 164 parents with preschool children were concerned some or all of the time. Similarly, at cycle 3, 12 (18%) of 65 preschool parents voiced concern.
The situation improves somewhat at the 2nd assessment (4 of 27, or 14%). The cycle 2 program effect is negative (-1.4), but only significant at the 15% level. The cycle3 coefficient is also negative but smaller in absolute value and not statistically significant. It may be that BWN is improving outcomes for small children but the significance is not detected due to small sample size. However, even if there is a program effect at the 2nd cycle, much of the positive effect dissipates by the 3rd assessment.
Turning to Haiti, children are often not in school for financial reasons, as reported in Table 11.11. Perhaps more troubling is the gender differential. At cycle 1, of parents reporting having a daughter, 62.7 percent responded that their daughter was not in school for financial reasons. The figure drops to 34.8 percent at the 8th cycle but returns again to 83.1 percent at the 10th cycle. Financial constraints are much less likely to be a factor for participants with sons. At cycle 1, 27 percent report that the child is out of school for financial reasons, a figure that drops to 15.4 percent by the 10th cycle.
The gender disparity is evident from the statistical analysis of determinants of schooling reported in Table 11.12. We have 549 participants reporting having a daughter and 508 reporting having a son. If the participant is a woman, she is more likely to have her daughter out of school for financial reasons than if the participant is a man. In contrast, if the participant is a woman, she is less likely to have her son out of school for financial reasons than if the participant is a man. Older parents aged 21-30 are less likely to have daughters out of school for financial reasons than parents ages 18-20. However, there is no age effect for sons.
Turning to program impact, the coefficient on cycle7 is negative and statistically significant for sons. But the dose7 variable is positive, indicating that whatever effect might have occurred at the 7th cycle dissipates in the months following the 7th assessment.
School attendance rates in Vietnam are very high, as reported in Table 11.13. Girls aged 6-9 have a school attendance rate of 92 to 95 percent. Girls aged 10-12 are virtually all in school, though the school attendance rate was 95.5 percent at the 1st cycle. There is more
212 | P a g e
variability in school attendance of girls aged 13-17. The decline in school attendance at the 4th cycle to 80 percent from 90 percent in cycle 3 is surprising. Though, such an effect can be observed in a panel in which children may be aging out of school. School attendance often drops for older children when opportunities for employment expand.
School attendance rates for boys in Vietnam are slightly lower than for girls. This is most notably the case for 10-12 year old children. Families were slower to transition to sending 100 percent of 10-12 year old boys to school than for girls. While all boys are in school by the 4th cycle, all girls in the same age group were in school by the 2nd cycle.
Turning to the statistical analysis reported in Tables 11.14 (girls) and 11.15 (boys), the cycle 2 variable is positive and significant for 10-12 year old girls and the dose1 variable is positive and significant for the other two groups. The only negative effect is for dose4 for girls 13-17.
By comparison, there is no Better Work treatment effect for boys. The increase in school attendance observed in the summary statistics is a secular trend, particularly for boys aged 6-9 and is unrelated to Better Work.
Turning to Indonesia, children out of school for financial reasons are rare and decline with each cycle, as can be seen in Table 11.16. At cycle 2, 4.2 percent of school-aged daughters were out of school for financial reasons. That figure drops to 2.6 percent by the 4th cycle. In the case of sons, 3.1 percent of school-aged sons were out of school for financial reasons at cycle 1, dropping to 1.2 percent by cycle 4.
The improvement for girls appears to be largely secular, as can be seen in Table 11.17. School attendance is rising for girls in 2013 and 2014. For boys, there appears to be a small dose effect at cycle1, but the effect does not persist.
213 | P a g e
Table 11.9 Children Out of School by Cycle Nicaragua
Sons out of school for financial reasons Cycle 1 2 3 Total No 157 28 76 261 Yes 40 2 18 60 Total workers with sons 197 30 94 321 Daughters out of school for financial reasons Cycle 1 2 3 Total No 151 29 82 262 Yes 25 4 12 41 Total workers with sons 176 33 94 303 Table 11.10 Pre-school Children Safe by Cycle Nicaragua
Do you feel that your preschool child is safe while you are at work?
Cycle
1 2 3 Total 1 Always 107 16 41 164 2 Most of the time 22 7 12 41 3 Some of the time 26 4 10 40 4 Rarely 4 0 1 5 5 Never 5 0 1 6 Total 164 27 65 256 Table 11.11 Children not in School for Financial Reasons by Cycle Haiti
Cycle
Daughters not in School - Money 1 2 3 4 5 7 8 9 10 Total
No 19 55 13 14 9 2 15 16 11 154
Yes 32 123 16 53 15 12 8 82 54 395
Total 51 178 29 67 24 14 23 98 65 549 Percent not in School for Financial Reasons 62.7 69.1 55.2 79.1 62.5 85.7 34.8 83.7 83.1 71.9 Sons not in School - Money 1 2 3 4 5 7 8 9 10 Total No 28 108 31 59 18 10 10 96 50 410 Yes 14 36 3 15 6 2 3 9 10 98 Total 42 144 34 74 24 12 13 105 60 508 Percent not in School for Financial Reasons 27.5 20.2 10.3 22.4 25.0 14.3 13.0 9.2 15.4 17.9
214 | P a g e
Table 11.12 Children not in School for Financial Reasons Better Work Treatment by Cycle Haiti, Demographic Year Month Controls
Factories in Nicaragua did not change their pre- and post-natal health services following the inception of BWN. Approximately 11 percent of enrolled factories have prenatal care and between three and seven percent offer postnatal care. Figures are stable across all cycles, as can be seen in Table 11.18.
By contrast, there is some evidence that pregnancy related health services expanded for women in Haiti, as reported in Table 11.19. At the 1st assessment, 5.6 percent of respondents report being in a factory with health services for pregnant women. By the 10th assessment, that figure had increased to 25.9 percent.
Improvement in access is reflected in program effects reported in Table 11.20. The cycle7, dose9 and cycle10 treatment variables are positive and statistically significant. There is some decay after the 7th assessment, as the coefficient of dose7 is negative. However, the statistical analysis provides supporting evidence suggested by the summary statistics.
Health care for pregnancy in Vietnamese factories is principally prenatal, as reported in Table 11.21. At the 1st assessment, 66.9 percent of women had access to prenatal care at work. The rate rises with every cycle, reaching 81.6 percent at the 5th assessment. By contrast, the rate of women with access to postnatal care in the factory was a comparatively low 11.9 percent in the 1st cycle, rising to 14.4 percent by the 4th cycle. Treatment effects, reported in Table 11.22, are observed for Prenatal care at the 1st and 2nd assessments. The dose1 variable is positive and significant, as is cycle2.
Pregnancy care is rare in Jordanian factories, as reported in Table 11.23. At the 1st assessment, only 3.2 percent of workers report having access to prenatal services at the factory clinic. The figure rises to 8.5 percent at the 4th cycle but then begins to decline, falling to zero at the 6th assessment. Services for women after giving birth are slightly more common. At the 1st assessment, 4.8 percent of workers report having access to health care after giving birth. The figure rises to 7.3 at the 5th assessment but declines thereafter. Statistical analysis indicates a positive program effect, as reported in Table 11.24. The cycle4 variable is positive and significant as are the dose4 and dose5 variables. That is, at the time of the 4th and 5th assessments and for exposure to Better Work in the months after the 5th assessment, the probability of having access to both types of pregnancy care increases.
Turning to Indonesia, 16.1 percent of participants report that their factory provides health services for pregnant women at cycle 1, as reported in Table 11.25. The figure rises to 22.6 percent by cycle 3.
The statistical analysis indicates that there may be a Better Work effect, reported in Table 11.26. When we control for each year and month individually using binary variables, as reported in column (1), there appears to be no Better Work effect. All of the cycle and dose variables are insignificant. When, instead, we assume that there is a time trend, as reported in column (2), the dose2 variable is negative but small in absolute value.
219 | P a g e
However, the dose4 variable is positive (0.0361), indicating a positive program effect. In the absence of any time controls, as reported in column (3), the cycle3 and dose4 variables are positive and significant.
220 | P a g e
Table 11.18 Prenatal Postnatal Care in Factory Clinic by Cycle Nicaragua
Prenatal care in factory clinic Cycle 1 2 3 Total No 367 52 166 585 Yes 47 7 21 75 Total 414 59 187 660 Postnatal care in factory clinic Cycle 1 2 3 Total No 385 57 177 619 Yes 29 2 10 41 Total 414 59 187 660 Table 11.19 Health Services for Pregnant Women in Factory Clinic by Cycle Haiti
Cycle
Health Services for Pregnant Women 1 2 3 4 5 7 8 9 10 Total
No 102 292 62 123 48 15 27 173 91 933
Yes 6 58 5 12 6 3 4 33 28 155
Total 108 350 67 135 54 18 31 206 119 1,088
Percent with check up for pregnant women 5.6 53.7 4.6 11.1 5.6 2.8 3.7 30.6 25.9
221 | P a g e
Table 11.20 Health Services for Pregnant Women in Factory Clinic Better Work Treatment by Cycle Haiti, Year Month Demographic Controls
Table 11.23 Health Services for Pregnant Women in Factory Clinic by Cycle Jordan
Cycle Prenatal Clinic Service 1 2 3 4 5 6 Total
No 699 295 399 375 354 90 2,212
Yes 23 4 15 35 16 0 93
Total 722 299 414 410 370 90 2,305
Prenatal Clinic Service Percent 3.2 1.3 3.6 8.5 4.3 0.0 Postnatal Clinic Service 1 2 3 4 5 6 Total
No 702 297 395 379 362 89 2,224
Yes 20 2 19 31 8 1 81
Total 722 299 414 410 370 90 2,305
Postnatal Clinic Service Percent 4.8 5.2 6.1 5.2 7.3 1.9 Table 11.24 Health Services for Pregnant Women in Factory Clinic Better Work Treatment by Cycle Jordan, Year Month Demographic Controls
Participants in the Nicaraguan data collection exhibit a small gender differential, reported in Table 11.27. Males, on average, earn USD 44.29 per week and females earn 42.36 per week.
Better Work treatment effects mediated by gender are reported in Table 11.28. Gender is not a significant determinant of pay in Nicaragua, once position, education and experience are controlled for. However, at cycle3 there is a significant increase particularly in the pay for women by USD 7.457 per week. Though the effect dissipates in the months after the 3rd assessment. The female pay differential declines by -0.851 each month after the 3rd assessment. Female workers in Nicaragua also report working -3.282 fewer hours per week, on average. The gap closes in the period after the 1st assessment. With the differential declining by 0.696 weekly hours each month after the 1st assessment.
As with Nicaragua, Haiti exhibits a significant reduction in the gender pay gap as a consequence of Better Work, as reported in Table 11.29. In the absence of Better Work, women work 4.0 hours per week more than men. The differential declines significantly and notably in cycles 2 (-5.1), cycle 4 (-9.2), cycle 9 (-6.5) and cycle 10 (-5.7). The Better Work gender treatment effect for pay is also positive, though not statistically significant.
The shrinking of the gender pay and hours differential is also partially evident in Vietnam, as reported in Table 11.30. Men and women work an equal number of hours in Vietnam, after controlling for age, education, position, promotion history, etc. By contrast, there is a very pronounced gender-linked pay differential. Women earn about USD 5.32 less per week than men. However, the gender differential declines as a consequence of exposure to Better Work in the months following the 3rd assessment. The coefficient on the gender dose3 interaction term (Female_Dose3) is 0.897, indicating that for each month after the 3rd assessment, the male-female pay gap declines by USD 0.90 per week.
In contrast, there is no change in the gender pay differential in Jordan attributable to Better Work. However, it should be pointed out that Jordan does not exhibit a gender-linked pay differential after controlling for the basic demographic characteristic. In Jordan, women work slightly fewer hours per week but earnings are equal for the two genders.
In Indonesia, the gender pay gap actually appears to briefly increase, as can be seen in Table 11.31. Women and men earn equal pay after controlling for demographic characteristics and job, though women work 1.12 fewer hours per week than men. Focusing on column (3), total hours for women associated with Better Work actually increases at cycle 2 (2.68) and cycle 3 (2.54), though the effect disappears by the 4th assessment. However, at the 4th assessment, while the female hours differential disappears, there is a significant negative effect on women’s pay.
226 | P a g e
Table 11.27 Pay by Gender Cycle 1 Nicaragua Nicaragua Average Pay
First Assessment Male 44.2958 Female 42.35922 Table 11.28 Pay and Hours by Gender Better Work Treatment by Cycle Nicaragua, Year Month Demographic Controls (1)
Standard errors in parentheses *** p<0.01, ** p<0.05, * p<0.1
230 | P a g e
Child Health
Among the long term objectives of Better Work is to improve child health. Workers were surveyed on the health status of daughters and sons aged 0-5, 6-9, 10-12 and 13-18. Workers rated each child’s health on a scale of 1=Very Good to 4=Poor. Ratings were reverse coded and then aggregated over gender and age to produce a single child health indicator.
As can be seen in column (1) of Table 11.32, average child health among study participants in Vietnam actually declined in 2011 relative to 2010. We do not observe full recovery until 2014. Statistical analysis indicates a significant improvement in 2015 but there were only 12 children in the 2015 cell. Furthermore, once demographic characteristics are introduced, the statistical significance of the health coefficients of 2014 and 2015 disappear, indicating that the reason for the apparent improvement was in fact due to a change in the demographic characteristics of the sample rather than an improvement in child health outcomes. The findings then indicate that child health in 2012 and 2013 was worse than in 2010, 2014 and 2015.
There is, however, one part of the analysis that indicates a potential Better Work treatment effect. As can be seen in column (3) of Table 11.32, child health outcomes improve when parents work fewer hours and receive more pay. Each additional hour worked per week reduces child health by 0.003 on a 4-point scale In light of the fact that Better Work has significantly reduced hours, increased pay, and particularly increased pay for women, there is an indirect effect of Better Work on child health through the pay and hours channel.
Standard errors in parentheses *** p<0.01, ** p<0.05, * p<0.1
232 | P a g e
Chapter 12 Better Work and Firm Performance
There are several indicators of firm performance. Perhaps of greatest interest is the impact of Better Work on firm profits. Given the large variation in scale across firms, we can more robustly estimate the ratio of revenue to cost. A translog price-cost equation is estimated.10 Missing data for revenue and cost is imputed. A graph of the treatment effects for Vietnam is depicted in Figure 12.1. The cumulative treatment effect on the price-cost relationship is 0.62 on a mean of 2.48 at the 4th assessment cycle, indicating a 24 percent increase in the ratio of revenue to cost.
We also estimate the time necessary to meet the production target on Friday for Vietnamese firms, controlling for the length of the workday. Reaching the production target in less time is a possible indicator of productivity. Significant treatment effects are reported in Table 12.1 and depicted in Figure 12.2. The time to target declined by 20 minutes (-0.329) at the 2nd assessment and over 30 minutes at the time of the 4th (-0.562) assessment. There are also significant declines in the period after the 1st assessment (-0.0368) and the 5th assessment (-0.268). The cumulative treatment effect by the 5th cycle is -1.29 hours.
Additional results concerning the impact of Better Work on firm performance are discussed in Chapter 10 Training.
10 Regressors include lnPrice, lnPrice^2, lnWage, lnWage^2, lnPrice*lnWage, indicators of supply chain position, employment, monthly production and number of nearby competitors.
233 | P a g e
Figure 12.1 Price Cost Ratio Better Treatment by Cycle Vietnam
Figure 12.2 Time to Target Friday Hours Treatment by Cycle Vietnam
1,05
1,39
0,62
0
1
Pric
e-C
ost
VietnamPrice Cost Ratio Treatment Effects
Cycle 1 Cycle 2 & 3Cycle 4
-0.16 -0.16
0.20
-0.50
-1.29
-1.5
-1-.5
0.5
Trea
tmen
t Effe
ct
1 2 3 4 5
234 | P a g e
Table 12. 1 Better Work Treatment by Cycle Time to Target Friday Vietnam, Demographic Year Month Controls
Standard errors in parentheses *** p<0.05, ** p<0.1, * p<0.15
235 | P a g e
Chapter 13 Sourcing Practices and Compliance
Factory managers optimizing choices related to social compliance are governed in part by the cost of compliance, production technology, worker preferences and the social context of the work place. Perhaps equally important is the larger market context in which factories function, particularly the structure of incentives established by a factory’s principle customers. Order size, order regularity, quality expectations and delivery terms are accompanied by a set of penalties and rewards for firm performance and social compliance.
The tension between buyer demands for factory performance related to production and social compliance is well documented. To the extent that buyers believe that social compliance is costly and organizationally separate compliance and sourcing units, factory managers may feel compelled to sacrifice social compliance to achieve expected production performance.
However, considerable empirical evidence suggests that, at least along some dimensions, compliance and firm production performance are complementary.11 Firms encouraged by their buyers to achieve social compliance may also increase productivity and product quality. The question then becomes whether sourcing practices are inhibiting the ability of firms to achieve social compliance and, thereby, foregoing production and human resource systems innovations that are jointly better for workers, factories and international buyers.
Sourcing Practices and Better Work. Consider first the impact that Better Work has had on some sourcing practices. Evidence for Vietnam indicates that with each passing Better Work assessment cycle, firms are increasingly likely to report that their main customer is stopping their own social audits. Similarly, firms are increasingly likely to report that their main buyers are contacting them about their Better Work assessments. As will be seen below, firm managers feel that the multiplicity of brand-initiated audits is a challenge to business success. Consolidating audits could help firms improve business performance.
Statistical analysis of the determinants of customer visits for the purpose of performing a social audit is reported in Table 13.1. The assessment cycle corresponding to the data collection is indicated by the cycle2 … cycle5 variables. The treatment effect is indicated by the dose1 … dose5 variables. The dose variables indicate the number of months that have elapsed between the corresponding assessment and the data collection. Equations are estimated for the factory’s most important customer (column 1) and second most important customer (column 2).
Note first that preferred suppliers report more visit days than contractors or subcontractors. For the most important buyer, preferred suppliers have more visit days per quarter than subcontractors. Also, note that the higher the number of buyer visits for 11 Brown, D., R. Dehejia, R. Robertson, G. Domat and S. Veeraragoo. 2015. Are Sweatshops Profit-Maximizing?” Better Work Discussion Paper Series No. 17, ILO Geneva.
236 | P a g e
the purpose of sourcing, the more visits for the purpose of compliance, though the effect is very small.
The dose variables are also negative and, particularly for the second buyer, increasing in magnitude. Though, it appears that the strongest effect emerges after the 2nd assessment.
By contrast, factory managers report tougher purchasing terms by Better Work assessment cycle. The Better Work treatment effects on purchasing terms, social audits and contact about assessments are depicted in Figure 13.1. Perceptions of purchasing terms deteriorate with each successive assessment cycle. There are, in fact, several buyer practices, discussed below, that may lead to poor factory performance.
Sourcing Practices and Verbal Abuse. As demonstrated in Rourke (2014)12 and Abbott (2015),13 verbal abuse is a common motivational strategy employed in firms with weak HR functionality. Worker reports of verbal abuse in Indonesia, Jordan and Vietnam are depicted in Figure 13.2
Verbal abuse often arises when firms fail to adopt optimally powered pay systems to incentivize production performance. However, verbal abuse may also occur when supervisors are under heavy cognitive load.14 Production pressures often overwhelm the cognitive capacity of production supervisors. Even a supervisor who knows that calmly correcting errors is more effective than yelling may resort to verbal abuse when cognitive load exceeds manageable levels.
Rourke and Abbott find that workers who are the victims of verbal abuse are less productive and may require a pay differential to compensate for abusive treatment. Lower productivity and higher wages both reduce profits and increase price. That is, excessive cognitive load is sub-optimal for workers, factories and international buyers.
Cognitive load for supervisors may be unmanageably high as the consequence of inadequate managerial capital. That is, a factory’s managers may be making production organization decisions that sub-optimally increase pressure on supervisors.
However, delivery penalties and ordering practices may also be contributing factors. In fact, over-powered delivery penalties are counter-productive, driving up supervisor stress and cognitive load. To the extent that stress results in verbal abuse, factories become less productive, less profitable and less compliant.
Rourke (2014) and Abbott (2015) have empirically established that supervisor stress, driven by sourcing practices, is a contributing factor to verbal abuse. Evidence from the Better Work impact evaluation data indicate that supervisor stress is correlated with manager perceptions of sourcing practices. Both papers further demonstrate that verbal
12 Rourke, Emily. 2014. “Is there a Business Case against Verbal Abuse?” Better Work Discussion Paper Series No. 15, ILO Geneva. 13 Abbott, Liana. 2015. “Buying Stress.” Tufts University. 14 Paas, F., A. Renkl and J. Sweller. 2003. “Cognitive Load Theory and Instruction Design: Recent Developments.” Educational Psychologist, 38(1), 1-4.
237 | P a g e
abuse reduces productivity and increases the wage necessary to induce a worker to remain with a firm.
In the course of the Better Work impact evaluation, the general manager is asked to rate challenges to their business success as serious, moderate, minor or not a challenge. Challenges include supervisor stress and various sourcing practices. Uncertain orders, late penalties, change in technical requirements and defect penalties are rated a serious challenge by 40 to 50 percent of factory managers. Only 10 to 12 percent of factory managers do not see such issues as a business challenge. A summary of manager reports is depicted in Figure 13.3.
Other challenges include change in order size, replenishment orders, variations in technical requirements and variations in compliance codes, as can be seen in Figure 13.4. Forty to fifty percent of factory managers report these challenges as major rather than serious.
A simple correlation between supervisor stress and sourcing indicates that variations in technical requirements, variations in social compliance requirements, late delivery penalties, changes in technical requirements, defect penalties, replenishment orders and uncertain orders are all moderate drivers of manager reports of supervisor stress. Correlation between sourcing practices and supervisor stress are provided in Table 13.2 and depicted in Figure 13.5.
Excess Overtime. The conflict between social compliance and sourcing is most striking when considering excess overtime.
Bringing factories into compliance on excess overtime is one of Better Work’s greatest challenges. The noncompliance rate for the daily limit hovers between 80 and 90 percent noncompliant for cycles 1 to 4. While improvement appears to emerge at the 5th assessment, there are very few factories in this group. Improvement is evident for four rest days per month. Approximately 62 percent of factories are noncompliant at the 1st assessment, falling to 37 percent by the 4th assessment. By contrast, Vietnamese factories have come into compliance on paying the legal minimum wage for regular hours and not forcing workers to perform overtime against their will.
There are several plausible explanations for factory resistance to compliance on overtime. Ideally, factories would optimize by running operating capital 23 hours per day. Compliance with overtime regulations and optimal use of capital would require the firm to employ two or three shifts of workers.
However, uncertain orders make production planning, which includes multiple work shifts, challenging. Rather, apparel firms are more likely to choose a single work shift, the length of which depends on a factory’s current delivery schedule. Indeed, as noted above and in Figure 13.3, uncertain orders is the single biggest business challenge Vietnamese factories report. Over 50 percent of firms report uncertain orders as a serious business challenge. Only 14 percent of factories report that uncertain orders is not a business challenge.
238 | P a g e
Compliance, Working Conditions and Orders. We can gain some insight into the role that buyers are playing in overtime violations by analyzing the determinants of the size of the order a buyer places with a vendor. In particular, are buyers rewarding firms for compliant behavior or, alternatively, are buyers more likely to place orders with factories with excess hours?
Order size is determined by many factors such as the product type, length of buyer-supplier relationship, supply chain position, factory size, year, season and firm productivity. These characteristics are included in the analysis as control variables. We also include working conditions as a determinant of order size. Do buyers reward compliant factories with larger orders or do firms with longer hours have larger orders?
Working conditions are measured using two indicators. First, in the worker survey workers report hours worked. Second, working conditions are also indicated by compliance assessments.
Since firms are assessed on hundreds of points, factor analysis is employed to detect underlying compliance relationships in the data. We first aggregate compliance points into 15 broad categories. Factor analysis is then applied to reduce the 15 categories down to 3 underlying working conditions factors.
Factor 1 is dominated by health services and other sources of worker wellbeing. Factor 2 is dominated by unions and issues related to OSH. Factor 3 is dominated by work hours.
We estimate order size for a factory’s first and second most important customers. Results are reported in Tables 13.3 to 13.6. In each case, three specifications are employed. In column (1) in each of the tables, a baseline is estimated. Year and month coefficients (not reported) indicate whether order size has been rising or falling over time. In column (2), Better Work treatment variables are introduced. As above, a treatment effect is indicated if order size is rising with cycle and dose. In column (3), the impact of working conditions as reported from Better Work enterprise assessments are introduced. Negative coefficients for each of the standard factors indicate that buyers are rewarding factories with better compliance reports.
One of the controls included in the estimation equations is TimetoTargetF. This variable measures how long it takes for a worker to reach the assigned production target. A negative coefficient indicates that workers are reaching their production target faster, when controlling for the length of the workday. We are limited, however, by the number of workers that report their time to target. Therefore, two sets of estimations are performed. Estimates reported in Table 13.3 and 13.5 include TimetoTargetF and estimates reported in Tables 13.4 and 13.6 do not.
Consider first order size of the factory’s most important buyer. Results with the TimetoTargetF variable are reported in Table 13.3.
Note first that buyers appear to be rewarding firms with better compliance reports. Estimated coefficients for factors 1 and 3 are negative and significant in column (3) of
239 | P a g e
Table 13.3 and for factor 3 in column (3) of Table 13.4. Noncompliant firms receive smaller orders than compliant firms, controlling for factory characteristics and year.
However, while buyers may be rewarding overall compliance, there appears to be an exception for exceptionally long work days. The coefficient of total hours is positive in column (1) of Table 13.3 and column (3) in Table 13.4. That is, buyers appear to be rewarding longer hours with larger orders.
The pattern is repeated for a factory’s second most important customer, as reported in Tables 13.5 and 13.6. Looking again at column (3) in each table, the coefficient on factor 3 is negative indicating that larger orders are placed with firms compliant on hours-related compliance points. However, the coefficient on total hours is positive, indicating that an exception is made for the length of the workday. A longer workday predicts larger orders.
Finally, note that the Better Work treatment variables reported in column (2) of Tables 13.3 to 13.6 are generally negative. That is, more exposure to Better Work reduces order size, even controlling for year, month and other factory characteristics. Taking these results in columns (2) and (3) together, it appears that simply participating in Better Work is not enough to induce buyers to increase order size. Enrolled factories must also show an improvement in compliance performance for points other than the length of the workday.
Buyer Practices and Compliance Choices. The question we turn to is whether sourcing practices affect the compliance choices by the firm. To answer this question, we analyze the relationship between reported concerns with sourcing practices and subsequent compliance findings. Details are reported in Table 13.2 and treatment effects are depicted in Figure 13.8. We focus on compliance on OSH (factor 1), Unions (factor 2) and Work Hours (factor 3), characterized in Table 13.7. Each equation is controlled for supply chain position, export status, MNC status and number of nearby competitors.
Note first that findings of noncompliance by assessment cycle vary strikingly by compliance factor. For OSH, noncompliance declines with each assessment cycle. By the 5th cycle, the probability of noncompliance has dropped by 0.32. A similar and even more distinctive pattern emerges for Unions. By the 5th cycle, the probability of noncompliance has dropped by 0.41. However, in the case of Work Hours noncompliance, the probability of noncompliance rises by 0.11 by the 5th cycle.
The question then becomes whether sourcing practices are affecting the compliance choice. As can be seen from the sourcing practices variables, some practices are significant contributors to noncompliance and others are not. In the case of OSH, Change in Technical Requirements, Change in Order Size and Defect Fines predict noncompliance. In the case of Unions, Changes in Technical Requirements, Payment Term, Late Fines and Variations in Compliance Codes predict noncompliance. In the case of Work Hours, Rush Orders and Late Fines predict noncompliance.
240 | P a g e
The role of sourcing practices for work outcomes can also be seen directly from worker characterization of work outcomes. The impact of sourcing practices on pay, hours and work satisfaction are reported in Table 13.9. All regressions are controlled for worker and firm characteristics.
From a theoretical perspective, the sourcing practices most likely to affect pay are fines and payment terms. Sourcing practices most likely to affect hours are variations in orders and fines for late delivery.
The impact of sourcing practices on the log of weekly pay is reported in column (1). The longer the pay terms the lower weekly pay. The impact on total hours is reported in column (2). Replenish orders and late fines both increase total hours. However, rush orders and uncertain orders are correlated with a shorter workweek.
In terms of work hours, an important question for workers is whether those additional hours are desired or not. Column (3) reports on worker life satisfaction as a function of worker characteristics, pay and hours. As can be seen, life satisfaction declines with work hours, all else held constant. The direct evidence of the impact of sourcing practices on life satisfaction can be seen in column (4). Worker satisfaction falls as the payment term and late fines increase.
241 | P a g e
Figure 13.1 Purchasing Terms by Assessment Cycle Vietnam
Figure 13.2 Verbal Abuse Concern
-1
-0.5
0
0.5
1
1.5
2
Cycle 1 Cycle 2 Cycle 3 Cycle 4
Improved PurchasingTerms
Stop Social Audits
Contact AboutAssessment
242 | P a g e
Figure 13.3 Serious Challenges to Business Success Vietnam
Figure 13.4 Major Challenges to Business Success Vietnam
0
10
20
30
40
50
60
Serious Modest Minor None
Uncertain Orders
Late Penalties
Change Tech Req
Defect Penalties
0
5
10
15
20
25
30
35
40
45
50
Serious Major Minor None
Change Order Size
Replenish Orders
Var Tech Req
Var Compl Code
243 | P a g e
Figure 13.5 Correlates of Supervisor Stress Vietnam
Figure 13.6 Change in Noncompliance by Treatment Cycle OSH Unions Work Hours Vietnam
-0.5
-0.4
-0.3
-0.2
-0.1
0
0.1
0.2
Cycle 1 Cycle 2 Cycle 3 Cycle 4 Cycle 5
OSH Unions Work Hours
00.05
0.10.15
0.20.25
0.30.35
0.40.45
0.5
Correlation withSupervisor Stress
244 | P a g e
Table 13.1 Compliance Visits Better Work Treatment Effects
Support to participating firms in Better Work is provided through training and advisory services. At the time of the 2nd assessment, firms are typically encouraged to create a performance improvement consultative committee or PICC. PICCs bring together workers and managers in an attempt to cooperatively solve problems. Worker members of the PICCs are then expected to transmit the minutes of the PICC meetings to their peers.
PICCs vary in quality. From the perspective of Better Work, desirable qualities include the following:
1. The union is fairly represented in the PICC. 2. The proportion of PICC members that is female should be similar to the proportion of the
workforce that is female. 3. Worker representatives on the PICC should be freely chosen from a set of candidates and
there should be more than one choice. 4. The PICC should meet regularly and both workers and managers should be involved in
chairing meetings. 5. The PICC should have the ability to meet without a Better Work advisor present. 6. PICC deliberations should be reported by meeting minutes and those minutes should be
transmitted to the workers. 7. PICC members should be adequately trained to execute their responsibilities. 8. The outcome of deliberations should be considered in factory management decisions.
In order to assess the role that the quality of the PICCs plays in determining worker and firm outcomes, progress reports submitted by Better Work enterprise advisors in Vietnam, Jordan and Indonesia were coded. PICC quality data was then merged with worker and manager surveys and compliance findings. The merge is executed so that survey data is matched to the closest previous assessment and progress report.
PICC data was then used to determine the contribution of PICC quality to outcomes related to worker perceptions of their relation with their supervisor, outcome of grievance processes and willingness to seek help from the trade union representative. Indicators of working conditions include reports of verbal abuse, physical symptoms such as fatigue, dizziness, aches and thirst, assessment of facilities such as the health clinic, canteen, drinking water and toilet, OSH conditions including air quality and chemical smells, and mental health indicators such as feeling restless, fearful, sad and hopeless. The contributions to compliance focus on collective bargaining, discrimination and interference with the union and union operations. Finally, the PICC is assessed by factory managers in terms of the perceived ability of the PICC, worker committees and the union to help resolve conflicts between workers and managers and the effect that PICC quality has on supervisor stress.
Variable definitions are provided in Table 14.1 and summary statistics for each variable are provided in Table 14.2. Variables in all cases are coded so that an increase in the variable is considered to be a positive outcome. Therefore, positive coefficients in the analysis below indicate that an improvement in PICC quality across a particular dimension predicts an improvement in the outcome of the variable of interest.
253 | P a g e
Statistical analysis tests the contribution of each component of PICC quality on outcome variables, controlling for demographic and firm characteristics. Two sets of analyses are performed for each of the dependent variables. We first test the basic model linking PICC quality indicators, firm characteristics and worker characteristics to each dependent variable. Cycle and year variables are then offered as additional controls. A summary of findings is presented in Table 14.3. Individual results are reported in Tables 14.4 to 14.35. In the summary table, all results are rescaled to render coefficients comparable. Blue cells indicate a statistically significant positive impact of PICC quality on the outcome of interest. The size of the bar indicates the size of the effect.
Column (1) of results in Table 14.3 reports the effect of the presence of a union in a factory. The presence of a union exhibits only a small positive effect from the perspective of the worker on fatigue. Enterprise advisors report a miniscule improvement in compliance on union operations. Manager perception of the ability of worker committees or the union to solve problems is negatively affected by the presence of the union, as is supervisor stress.
Results in column (2) of Table 14.3 indicates the impact of the presence of the PICC, controlling for PICC quality, on the outcome variables. In contrast to the union alone, the presence of the PICC generally improves outcomes as perceived by workers. Workers are more likely to seek help from the trade union representative, report less verbal abuse and report significantly less dizziness and restlessness. Factories with a PICC are more likely to be in compliance on collective bargaining but less likely to be in compliance on union operations. In stark contrast to workers, the effect of the PICC, controlling for PICC quality, on manager perceptions is negative. Managers are significantly less likely to believe that the union or worker committee would be instrumental in resolving conflicts between workers and managers. Managers with unions or worker committees also report greater supervisor stress.
However, remarkably, once the union joins the PICC, managers are more likely to see the union and worker committees as likely to be able to help resolve conflicts between workers and managers, as can be seen in column (3). When the union joins the PICC, workers are also more likely to seek help from the trade union representative.
Other aspects of the composition of the PICC are also critical to PICC effectiveness. As can be seen in column (4), having female PICC members in numbers representative of the workforce, has a positive and significant effect on worker perception of the outcome of a complaint, willingness to seek help from the trade union representative, verbal abuse, dizziness and thirst. In addition, managers are more likely to perceive worker committees in a positive light and report lower levels of supervisor stress. Curiously, having female members on the PICC negatively impacts all measures of mental health.
The positive perception of the PICC is also greatly enhanced when members of the PICC are freely chosen, as can be seen in column (5). Workers report reduced verbal abuse, less dizziness, aches and thirst and better quality food and toilet facilities. Managers report a more positive perception of the PICC and other worker committees’ ability to help resolve worker-manager conflict and a lower supervisor stress level.
254 | P a g e
Workers generally report positive benefits associated with having a bipartite chair (column 6), ability of the PICC to meet without a Better Work advisor (column 7), regular meetings (column 8), training of PICC members (column 9) and the incorporation of PICC recommendations into manager decisions (column 10). The beneficial effects are pronounced for reducing verbal abuse and physical symptoms such as dizziness, aches and thirst. However, the largest beneficial effect emerges in toilet facilities and water quality and availability.
As with women on the PICC, the bipartite chair is negatively related to mental health outcomes. Better mental health outcomes emerge with regular PICC meetings (column 8), PICC training (column 9) and when PICC recommendations are incorporated into management decisions (column 10). Training of PICC members is particularly important for restlessness, fear and crying.
The findings indicate that workers, in general, are positively impacted by the presence and the quality of the PICCs. Workers most strikingly benefit from a reduction in verbal abuse and health symptoms such as dizziness and improved water quality.
Manager response to PICCs is more complicated. The mere presence of a PICC or union is not seen positively by managers. Managers perceive PICC’s most positively where unions and women are fairly represented, workers are freely able to choose representatives and minutes of the meeting are taken and distributed to workers. Managers see PICCs less constructively when control of the PICC is passed from Better Work to a bipartite chair. And curiously, the more often the PICC meets, the less likely a manager is to see the PICC as playing a constructive problem-solving role.
255 | P a g e
Table 14.1 Variables for Analysis
Variable Definition Code PICC_Presence Does the factory have a PICC 1=yes, 0=no Has_Union Does the factory have a Union 1=yes, 0=no PICC_Female Does the PICC have a fair representation of Women 1=yes, 0.5=partial, 0=no PICC_Union Does the PICC have a fair representation of union members 1=yes, 0.5=partial, 0=no PICC_Free_Choice Do workers have free choice in electing worker members to the PICC 1=yes, 0.5=partial, 0=no Multiple_Candidates Is there more Training_PICC Do members receive adequate training to help them in communicating effectively in
the PICC? 1=yes, 0=no
PICC_Bipartite_Chair Does a PICC member chair the meeting? 1=yes, 0=no PICC_Meet_No_BW Does the PICC meet without a BW Advisor present? 1=yes, 0=no PICC_Regular_Meetings Does the PICC meet regularly 1=yes, 0=no PICC_Management_Decider Does the PICC influence managerial decisions regarding grievances? 1=yes, 0.5=partial, 0=no PICC_Minutes Are there minutes from each PICC meeting made available to workers? 1=yes, 0=no Sup_Comfort If you were having a problem at your factory, how comfortable would you feel
seeking help from your supervisor? Adjusted to a 10 point scale.
5=Very comfortable 4=Comfortable 3=Uncomfortable 2=Very uncomfortable 1=Not comfortable at all
WouldSeekHelpFromSupervisor If you were having a problem at your factory, how comfortable would you feel seeking help from your supervisor? Adjusted to a 10 point scale.
1=Very Comfortable or Comfortable 0=Uncomfortable, Very Uncomfortable or Not Comfortable at all
OutcomeOfComplaint How satisfied were you with the outcome of your complaint Adjusted to a 10 point scale.
5=Very satisfied 4=Satisfied 3=Somewhat dissatisfied 2=Very dissatisfied 1=Not satisfied at all
WouldSeekHelpfromTradeUnionRep If you were having a problem at your factory, how comfortable would you feel seeking help from the trade union representative? Adjusted to a 10 point scale.
1=Very Comfortable or Comfortable 0=Uncomfortable, Very Uncomfortable or Not Comfortable at all
PICCCouldSolveProblem If this factory were having a conflict between managers and workers, how effective 1=Very effective or
256 | P a g e
do you think the PICC would be in helping resolve the conflict? Adjusted to a 10 point scale.
Somewhat effective 0=Somewhat ineffective Very ineffective I don’t know
Worker_CommitteeSolveProblem If this factory were having a conflict between managers and workers, how effective do you think the PICC would be in helping resolve the conflict? Adjusted to a 10 point scale.
1=Very effective or Somewhat effective 0=Somewhat ineffective Very ineffective I don’t know
UnionSolveProblem If this factory were having a conflict between managers and workers, how effective do you think the Union would be in helping resolve the conflict? Adjusted to a 10 point scale.
1=Very effective or Somewhat effective 0=Somewhat ineffective Very ineffective I don’t know
Verbal_Abuse Is verbal abuse such as yelling or vulgar language a concern for workers in your factory? Adjusted to a 10 point scale.
0=no 1=yes
Avg_VA Is verbal abuse such as yelling or vulgar language a concern for workers in your factory? Factory verage score Adjusted to a 10 point scale.
0=no 1=yes
VA_Scale Is verbal abuse such as yelling or vulgar language a concern for workers in your factory? Adjusted to a 10 point scale.
1=No, not a concern 2=Yes, discussed with co-workers 3=Yes, discussed with supervisor or manager 4=Yes, discussed with the trade union representative 5=Yes, considered quitting 6=Yes, threatened a strike 7=Yes, caused a strike
VA_Categorical Is verbal abuse such as yelling or vulgar language a concern for workers in your factory?
3=No, not a concern 2=Yes, discussed with co-
257 | P a g e
Adjusted to a 10 point scale.
workers orsupervisor or manager, trade union representative 1=considered quitting, threatened a strike
Sup_Stress_Obstacle Is supervisor stress and obstacle to business success? Adjusted to a 10 point scale.
4=Serious problem 3=Modest problem 2=Minor problem 1=Not a problem
Health_Clinic Does your factory have a health clinic? Adjusted to a 10 point scale.
0=No 1=Yes
Rate_Clinic How would you rate the treatment you receive at the factory clinic? Adjusted to a 10 point scale.
5=Excellent 4=Very Good 3=Good 2=Fair 1=Poor
Dizziness How often do you experience dizziness? Adjusted to a 10 point scale.
5=Excellent 4=Very Good 3=Good 2=Fair 1=Poor
Fatigue How often do you experience severe fatigue or exhaustion? Adjusted to a 10 point scale.
5=Never 4=Rarely 3=Occasionally 2=Often 1=Every day
Stomache_Pain How often do you experience stomach pain? Adjusted to a 10 point scale.
5=Excellent 4=Very Good 3=Good 2=Fair 1=Poor
Ache How often do you experience headache, backache or neck ache? Adjusted to a 10 point scale.
5=Excellent 4=Very Good 3=Good 2=Fair
258 | P a g e
1=Poor Thirst How often do you experience severe thirst?
Adjusted to a 10 point scale.
5=Excellent 4=Very Good 3=Good 2=Fair 1=Poor
Canteen_Quality How would you rate the food in the canteen? Adjusted to a 10 point scale.
5=Very good 4=Good 3=Fair 2=Poor 1=Offensive
Toilet_Satisfaction How satisfied are you with the toilet facilities in your factory? Adjusted to a 10 point scale.
5=Very satisfied 4=Satisfied 3=Somewhat dissatisfied 2=Very dissatisfied 1=Not satisfied at all
Water_Satisfaction How satisfied are you with the quality and availability of drinking water in your factory? Adjusted to a 10 point scale.
5=Very satisfied 4=Satisfied 3=Somewhat dissatisfied 2=Very dissatisfied 1=Not satisfied at all
Air_Quality_Concern Are workers concerned about dusty or polluted air in your factory? Adjusted to a 10 point scale.
3=No, not a concern 2=Yes, discussed with co-workers orsupervisor or manager, trade union representative 1=considered quitting, threatened a strike
Chemical_Smells_Concern Are workers concerned about bad chemical smells in your factory? Adjusted to a 10 point scale.
3=No, not a concern 2=Yes, discussed with co-workers orsupervisor or manager, trade union representative 1=considered quitting, threatened a strike
259 | P a g e
Restless During the past month, including today, how much have you been bothered or troubled by feeling restless? Adjusted to a 10 point scale.
5=Not at all 4=A little of the time 3=Some of the time 2=Most of the time 1=All of the time
Fearful During the past month, including today, how much have you been bothered or troubled by feeling fearful? Adjusted to a 10 point scale.
5=Not at all 4=A little of the time 3=Some of the time 2=Most of the time 1=All of the time
Sad During the past month, including today, how much have you been bothered or troubled by feeling sad? Adjusted to a 10 point scale.
5=Not at all 4=A little of the time 3=Some of the time 2=Most of the time 1=All of the time
Crying During the past month, including today, how much have you been bothered or troubled by crying? Adjusted to a 10 point scale.
5=Not at all 4=A little of the time 3=Some of the time 2=Most of the time 1=All of the time
Hopeless During the past month, including today, how much have you been bothered or troubled by hopeless about the future? Adjusted to a 10 point scale.
5=Not at all 4=A little of the time 3=Some of the time 2=Most of the time 1=All of the time
Collective_Bargaining Compliance on Collective Bargaining Adjusted to a 10 point scale.
0=Noncompliant 1=Compliant
Interference Compliance on nondiscrimination and interference with the union. Adjusted to a 10 point scale.
0=Noncompliant 1=Compliant
Union_Operations Compliance on union operations. Adjusted to a 10 point scale.
Better Factories Cambodia (BFC) began a decade before the impact evaluation project of Better Work was initiated. Impact evaluation data began in 2015 and will continue into 2017. To date, a partial baseline is complete. A final report on Cambodia will be available in 2018. However, analysis has been undertaken using compliance data and factory characteristics. The analysis explored the impact of BFC and the ability of firms to survive the financial crisis, the role that BFC played in developing Cambodia as a high working conditions export platform and the role that public disclosure played in improving the effectiveness of BFC.
Industry Norms.15 International labor standards and improved working conditions are commonly resisted as anti-competitive, forcing firms and workers to deviate from market-determined wages and working conditions. One possible reason that attempts to improve working conditions fail is that the relative importance of various contributing factors – poor laws (or enforcement), high compliance costs, local norms, or lack of technology – are not well understood.
Since poor conditions despite relatively strong legislation are a common problem in developing countries, the goal of the paper is to evaluate the remaining three hypotheses. The U.S.-Cambodian Trade Agreement may have pressured factories to adopt costly compliance measures that would have reduced the competitiveness of the Cambodian apparel sector. Stylized facts are used to evaluate this hypothesis and show that Cambodian exports increased at an increasing rate after the agreement, which is inconsistent with the costs hypothesis. We further evaluate the costs hypothesis by estimating the relationship between compliance and factory survival. Both approaches find little, if any, evidence that increasing compliance hurt factories, raising the question about what was then driving compliance.
Applying the Acemoglu and Jackson (2015)16 framework, explanations for improving working conditions in Cambodia are evaluated. Applying this framework nests three different hypotheses that generate distinct empirical predictions. These predictions are tested using a novel concept – retrogression – and rich factory-level panel data from Cambodia’s experiment with improving working conditions over the 2001-2014 period. This natural experiment contains several phases that allow for the identification of different empirical tests nested in the model, including changing from a public disclosure to non-public disclosure model, the loss of collective incentives (the end of the MFA) and changes in the global apparel market (caused by the collapse of demand during the financial crisis).
The results suggest that public disclosure of noncompliance supported coordination on a High working conditions equilibrium. During the public disclosure period, the cost of public disclosure out-weighed the perceived cost of compliance, which fostered compliance. At the end 15Brown, Drusilla, Rajeev Dehejia and Raymond Robertson. 2016. “Laws, Costs, Norms and Learning: Improving Working Conditions in Developing Countries,” IZA DP No. 10025. 16 Acemoglu, Daron, and Matthew O. Jackson. 2015. “History, Expectations, and Leadership in the Evolution of Social Norms" Review of Economic Studies, 82(2), 423-456.
296 | P a g e
of the public disclosure period, however, retrogression in compliance increases. So, for some signals, firms found it optimal to choose Low working conditions on the points of compliance for which the cost of compliance exceeded the benefits. This result weighs against the hypothesis of a sustaining high-compliance norm in the Acemoglu and Jackson (2015) sense of the term. They argue that a norm is established if a play of High is a best response no matter what signal is received in periods following a prominent agent.
However, if the failure to establish a norm during the public disclosure period were the only factor affecting compliance choices, firms should have regressed to the baseline at the end of the public disclosure period. The theoretical framework suggests that failure to completely retrogress after the end of public disclosure is the consequence of learning.
Evidence that firms learn from compliance is provided by firm reactions to the end of public disclosure. For firms lacking a reputation sensitive buyer who can access compliance reports, only the firm itself sees the compliance report after the end of public disclosure. While retrogression does accelerate in the post-public disclosure period, these firms remain fundamentally in compliance despite the absence of a public external review. As a consequence, we can conclude that a firm’s interest in remaining compliant is not solely driven by a concern for its reputation.
The third test, based on survival analysis, further corroborates the learning hypothesis. New compliance, particularly after the first visit, positively predicts survival. However, retrogression is not predicted by buyer type and is only weakly predicted by credit constraints tightening during the financial crisis, thus ruling out the possibility that buyer type and credit constraints are jointly determining compliance and survival.
The challenge to firms, however, is that acquiring the managerial knowledge necessary to optimally manage human capital can be as challenging as for physical capital, yet firms may be comparatively resistant to investing in human resource systems. A period of forced experimentation in the form of labor compliance has the potential to reveal efficient labor management practices. Therefore, firms acquired knowledge capital concerning optimal labor management practices that increased their probability of survival. However, it is also the case that there were marginal effects related to reputation and the decline in the equilibrium wage. Retrogression accelerated when public disclosure ended. The interest in compliance declined when factory managers could not observe each other’s compliance behavior. Thus, during the public disclosure period BFC may have helped Cambodian factories control free riding on the reputation created by compliant firms.
Finally, the average compliance rate for firms with a reputation sensitive buyer rises over the course of the program. Further, firms lacking a reputation sensitive buyer achieve the same level of compliance by the end of the study period as firms with a reputation sensitive buyer mid-way through the study period. Thus, the application of international labor standards was more effective than pressure from international buyers at achieving minimal working conditions and also reached those factories that do not fall under the discipline of global supply chains.
297 | P a g e
Survival.17 Rather than being associated with widespread failure of Cambodian factories, the BFC program increased the probability of survival. Improvements in working conditions have been associated with rising exports, wages and employment. The results in this paper suggest that, contrary to even very basic economic models, there is little evidence that improvements in working conditions have imposed burdens great enough to cause factories to shut down. One possible explanation for the relative lack of adverse effects is that improving some working conditions is more likely to be positively associated with survival. If factories have full information, then the finding of a positive relationship between working conditions and survival (which is more prevalent in our results than support for a negative relationship), would suggest that improving working conditions is a good decision that is made by good managers. At the same time, it is possible that factories that expect to close (perhaps due to other poor decisions) may refrain from making the investments. Emerging results, such as Bloom et al. (2013),18 however, suggest that developing country factories do not have full information and it is likely that the external emphasis on improving working conditions induced policy experimentation. Another possibility is that the positive relationship has roots in an “efficiency wage” explanation that dates back to Alfred Marshall. This seems particularly possible given the fact that the statistically significant negative coefficients (that suggest that improvements reduce the probability of closure) tend to relate to compensation and modern HR practices. Worker incentives may be associated with higher productivity, which might increase profits for the firm if productivity increases more than compensation (broadly defined).
Public Disclosure.19 Improving working conditions requires an understanding both of the factors that lead to harsh choices by firm managers and that have the greatest impact on the decision to improve these conditions.
Following the introduction of labor law enforcement by the ILO's BFC program, broad improvement in working conditions among firms both with and without a reputation sensitive buyer emerges. Factories with a reputation sensitive buyer have higher average compliance than other factories. Other factors expected to affect the decision to comply, such as the irreversibility of an investment in improvement, are consistently negatively correlated with improvements in working conditions. After the elimination of public disclosure of factory-level noncompliance, the rate of improvement in compliance slowed and, for some factories, declined. Even for factories and compliance points with falling compliance measures, compliance did not return to the baseline even after the threat of public disclosure was eliminated.
These findings are consistent with several hypotheses concerning labor law enforcement and the adoption of humane labor management practices in apparel factories. First, third party 17Robertson, Raymond, Drusilla Brown and Rajeev Dehejia. 2016. “Working Conditions and Factory Survival: Evidence from Better Factories Cambodia,” IZA DP No. 10026. 18Bloom, Nicolas, Benn Eifert, Aprajit Mahajan, David McKinzie and John Roberts, “Does Management Matter? Evidence from India,” Quarterly Journal of Economics, first published online November 18, 2012 doi:10.1093/qje/qjs044. 19Ang, Debra, Drusilla Brown, Rajeev Dehejia and Raymond Robertson. 2012. “Public Disclosure, Reputation Sensitivity, and Labor Law Compliance: Evidence from Better Factories Cambodia,” Review of Development Economics, 16 (4), 594-607.
298 | P a g e
enforcement complements and enhances code compliance efforts by reputation sensitive buyers. More importantly, however, Better Factories Cambodia also improved compliance with international labor standards and local labor law in factories lacking a reputation sensitive buyer. Such factories typically have a low buyer-level reputational pay-off to compliant behavior and, thus, free ride on the market-level reputation created by highly compliant factories supplying reputation sensitive buyers. That is, BFC appears to have improved compliance even among firms lacking a factory-level benefit from a reputation for compliance.
Factory-specific public disclosure of noncompliance appears to be the mechanism by which BFC controlled free riding by factories that lacked a reputation sensitive buyer on the market-level reputational externalities generated by compliant factories. For, when public disclosure of noncompliance was terminated at the end of 2006, average compliance among factories lacking a reputation sensitive buyer declined absolutely and relative to the compliance record of other factories.
However, these factories did not regress to the baseline level of compliance even though only the factory management was aware of the factory’s compliance record. Thus, enforcement activities may have induced factories to experiment in human resource management innovations that are both more humane and more efficient. Our findings are particularly consistent with evidence from the experimental literature concerning the use of payment of wages to induce work effort.
The change in policy regarding disclosure seems to be consistently and strongly correlated with factories' decisions to comply. The findings are consistent with Polaski’s (2006)20 contention that public disclosure is a key element explaining the early successes of Better Factories Cambodia and Brandeis's contention that “sunlight” is an effective incentive for compliance with widely accepted community standards.
20 Polaski, Sandra. 2006. “Combining Global and Local Forces: the Case of Labor Rights in Cambodia.” World Development 34(5), 919-32.
299 | P a g e
Chapter 16 Haiti Case Studies
Two case studies were developed to study Haiti, management innovation and occupational safety and health. The final data collection is scheduled for spring 2017. Two interim reports follow.
16.1 Innovation
Analytical framework. This assessment is informed by interdisciplinary methods and theories designed to explain the relationships among innovation, sustainable development and business decisions. The concept of sustainable development is captured very effectively in Our Common Future, the 1987 report of the Brundtland Commission.21 A central underlying theme of the report is the importance of collaborative problem solving and interdisciplinary approaches to development. The report notes,
In essence, sustainable development is a process of change in which the exploitation of resources, the direction of investments, the orientation of technological development; and institutional change are all in harmony and enhance both current and future potential to meet human needs and aspirations (emphasis added).22
Sustainable development is often characterized as comprising concerns for people, planet and profits, as depicted in Figure 16.1.
Government laws and regulations are essential to assessing and comparing companies’ sustainability initiatives because they establish a performance baseline. At a minimum, laws and regulations create a clear distinction between companies in compliance and those not in compliance. But scholars immediately observed that some companies operated in a zone characterized by exceeding government requirements. Hunt and Auster describe companies operating on a five stage developmental continuum in which they describe companies farthest along as “pro-activist” and seeking maximum protection from risks, some of which are not regulated.23 Shrivastava and Hart describe companies following a pathway from a band-aid approach to more serious to deep change.24 Reinhardt, instead of describing stages, identifies situations in which there is an economic rationale for beyond-compliance actions including
21 Gro Harlem Brundtland, a medical doctor and public health professional, was the first female Prime Minister of Norway. The UN Secretary General invited Brundtland to head a commission whose focus was resolving tensions between environment and development. In practice, development frequently damaged the environment, compromised human health and disrupted social systems. The commission’s report was a detailed elaboration of principles for decision making that shifted the paradigm, presenting sustainable development as an urgent societal goal, the achievement of which is the responsibility of all decision makers. Brundtland was subsequently elected Director-General of the World Health Organization. 22 World Commission on Environment and Development. Our Common Future. 1987. New York: Oxford University Press, 46. 23 Hunt, Christopher and Ellen Auster. 1990. “Proactive Environmental Management: Avoiding the Toxic Trap.” Sloan Management Review (31) (2), 7. 24 Shrivastava, P. and S. Hart. 1995. “Creating Sustainable Corporations.” Business Strategy and the Environment, 154-165.
300 | P a g e
opportunities for differentiation, opportunities for strategic interaction with competitors and existence of unexploited cost savings.25
Also germane to the discussion is the concept of corporate social responsibility (CSR). CSR has a rich history and has evolved over time to reflect both the social issues of the day and the constantly changing relationship between business and civil society. In 1851, for example, the textile company, Daniel Salt and Sons, built a new factory and community for workers in Bradford, England away from the unhealthy and polluted city core;26 this can be considered a manifestation of CSR in its time.
As gaps continue to emerge between the expectations of civil society and the actions of companies, the definition of CSR is increasingly contested. Many large companies create their own definitions of CSR and they range from conventional philanthropy to speculative business ventures. Activities companies describe as CSR on their websites and in periodic CSR reports include on-site day care, workforce development, extended producer responsibility, energy efficiency, waste reduction and water conservation. Companies use CSR for a variety of reasons including attracting top quality employees, mollifying host communities and drawing customers. CSR also can be used to deflect government regulatory initiatives, implicitly or explicitly, arguing that a government response is not needed because the private sector understands the problem and is fixing it as fast as possible.
Codes of conduct are one form of CSR; some codes are developed by industry groups and others are collaborative efforts of companies and other interested parties. For example, the Fair Labor Association (FLA) is a collaborative effort of companies, non-government organizations and over 190 universities. Launched in 1999, the FLA established a code for the apparel and footwear industries, attempting to eliminate sweatshop conditions in global supply chains, and has more recently expanded to include supply chains for electronics and foods.27 Codes are attractive to companies because they can define good practice, an outcome that critics of the field find unsettling.28
Reflecting on the decades of regulatory regimes and societal pressure to improve companies’ social, environmental and health performance Harris29 observes that there remain variations in performance from company to company even when industry sector and national laws and regulations are held constant. Harris looks inside companies for factors that mediate companies’ responses and develops an explanatory framework for corporate capacity. His framework is drawn from a case study of sustainability in the non-renewable resource extractive sector in 25Reinhardt, Forest. 1999. “Market Failure and the Environmental Policies of Firms: Economic Rationales for ‘Beyond Compliance’” Behavior. Journal of Industrial Ecology, 3(1), 9-21. 26 Smith, N. Craig. 2003. “Corporate Social Responsibility: Whether or How?” California Management Review, 45(4), 52. 27 Fair Labor Association. http://www.fairlabor.org/ accessed 16 September 2015. 28 Blowfield, Michael. 2005. “Corporate Social Responsibility—the Failing Discipline and Why it Matters for International Relations” International Relations 19(2), 173-191. 29 Harris, Neil. 2007. “Corporate Engagement in Processes for Planetary Sustainability: Understanding Corporate Capacity in the Non-Renewable Resource Extractive Sector, Australia.” Business Strategy and the Environment 16, 538-553.
Australia. This includes mining and fossil fuel extraction and primary refining, industries long targeted by critics and regulators for egregious social and environmental failures.
Noting that the social dimension is an explicit part of all definitions of sustainability the model Harris presents is sufficiently basic that it can be used to examine capacity for engagement more generally and capacity for innovation itself. Capacity for engagement is defined by Harris to include five factors: leadership, resources, structures, culture and understanding.30 See Figure 16.2. Harris presents the framework as an emergent theory and observes that if it is to have greater value it needs to be tested in other locations and other sectors. The capacity for engagement framework is used here in assessing capacity for sustainability and innovation in the apparel industry in Haiti.
A great deal of the literature at the nexus of innovation, sustainable development and business decisions focuses on large multinational companies and relates primarily to the environment portion of the sustainable development construct. The emphasis on large companies may be attributed to their willingness to participate in academic research and their willingness to discuss environment-related innovations. In contrast, the present cases are significant because they focus on small companies that supply multinational brands and they highlight innovations related to all of the dimensions of sustainable development, with an emphasis on innovations that simultaneously address environment, working conditions and economic considerations.
In this context, the apparel industry in Haiti offers an extremely valuable example of the opportunities and challenges to achieving sustainable development. The apparel industry plays a central role in Haiti’s economy, employing relatively large numbers of workers with modest skills. It introduces many people to the formal economy and to workplace culture. At the same time, the apparel industry requires relatively large amounts of energy for its operations, and people and goods must travel to and from factories. These requirements reveal deficits in existing infrastructure and illustrate challenges to Haiti’s development.
Historically, the apparel industry served as a gateway to industrial development in many countries31 and was associated with unsustainable worker exploitation, dangerous working conditions and pollution. The historical path followed by others is likely to be unavailable to the apparel industry in Haiti because its current growth is occurring in an era of increased transparency and accountability. Since the mid-1990s exposes of inhumane working conditions in the developing country factories of multinational apparel and footwear brands, there has been a growing cohort of consumers who desire to purchase goods made under decent conditions. Codes of conduct, contract conditions, audits and inspections are among the strategies used by multinational brands in an attempt to provide assurances to customers that goods have been
30 Harris, Neil. 2007. “Corporate Engagement in Processes for Planetary Sustainability: Understanding Corporate Capacity in the Non-Renewable Resource Extractive Sector, Australia.” Business Strategy and the Environment 16, 538-553. 31 Palpacuer, Florence. 2005. Peter Gibbon and Lotte Thomsen. “New Challenges for Developing Country Suppliers in Global Clothing Chains: A Comparative European Perspective.” World Development 33 (3), 409-430.
302 | P a g e
ethically sourced. However, these strategies have not been universally successful in creating humane working conditions.
Increased scrutiny by apparel consumers and multinational clothing brands followed in the wake of apparel factory deaths in Bangladesh from a 2012 fire32 and a spring 2013 building collapse.33 In addition, public concern over sustainability and CSR is increasing with attention being given to the role of fossil fuel use and climate change. Apparel companies in Haiti will likely have to take a different path than their historical predecessors and innovating is one way to achieve success.
Case selection and methods. Initial cases for this innovation study were selected in collaboration with Better Work staff in 2011. A preliminary roster of candidate companies was proposed by the Tufts team based on data in the first compliance synthesis report34 and the first biannual report under HOPE II.35 The goal was to select companies that represented the widest possible variety of observable and documented company characteristics including a range of size (number of employees), ownership and complexity of garments. Initial selections were slightly modified at the suggestion of Better Work staff who had additional information on ownership and other programs in candidate factories. In February 2011, when selections were made, 28 companies were active in the Better Work Haiti program. Of these, 5 were selected for case studies. All of the initial case factories were located in Port-au-Prince. In 2013, 2 additional case companies located outside Port-au-Prince were added.
Year one site visits were conducted during the week of 14 February 2011 and year two site visits and interviews at the same five case companies took place during the week of 19 March 2012. In 2013, one of the original five companies was unavailable during the week of 20 May when site visits were conducted.
In 2015, site visits and interviews were conducted during the week of 4 May. On 1 May, the government of Haiti announced that the minimum wage would be 240 Gourdes. This announcement, along with concern about forthcoming elections resulted in some case companies declining interviews and site visits at the last minute; interviews were completed with three case companies. In addition to case company interviews and site visits in 2015, interviews were held with the Ministry of Environment.
32 Ali Manik, Julfikar, and Jim Yardley, Bangladesh Finds Gross Negligence in Factory Fire, New York Times, December 17, 2012 http://www.nytimes.com/2012/12/18/world/asia/bangladesh-factory-fire-caused-by-gross-negligence.html accessed 11 July 2013. 33 Greenhouse, Steven and Stephanie Clifford, U.S. Retailers Offer Plan for Safety at Factories, New York Times, 10 July 2013. http://www.nytimes.com/2013/07/11/business/global/us-retailers-offer-safety-plan-for-bangladeshi-factories.html?pagewanted=all&_r=0 accessed 11 July 2013. 34 International Labour Organization (ILO) and International Finance Corporation (IFC) 2010 Better Work Haiti: Garment Industry: 1st Compliance Synthesis Report. Produced 9 July 2010. 35 International Labour Organization (ILO) and International Finance Corporation (IFC) 2010Better Work Haiti: Garment Industry: 1st Biannual Report under the HOPE II Legislation / International Labour Office, International Finance Corporation. Geneva.
Interviews with the General Manager, Financial manager, Human Resource Manager, Industrial Engineer, Production Manager, and Occupational Health and Safety Manager were requested. Not all companies had people in positions with these titles. In some factories, additional personnel were interviewed, including people with titles such as plant manager, owner or assistant general manager, all of whom provided valuable insight. In some companies the people interviewed in 2011 held the same positions in 2012, 2013 and 2015; in other companies, there were personnel changes.
Permission to record interviews was requested and some people granted permission while others did not. All interviewees were comfortable signing the consent form. However, not everyone was comfortable answering all of the questions. Interviews were conducted in a conference room or in individual offices or other relatively quiet spaces. Following the interviews, the production area and the factory grounds were toured. This created an opportunity to ask additional questions and observe many of the features discussed in the interviews. Considerably more confidence is placed on observed activities than reported activities.
In 2011, the challenges most frequently mentioned by top managers included:
• Low productivity
• High costs of doing business and infrastructure problems
• Low quality of factory buildings
A factor mentioned in many 2013 interviews was the loss of life among Bangladeshi apparel workers due to a fire in fall 2012 and a building collapse in spring 2013. At the time of our 2013 interviews, there were indications that multinational brands, becoming uncomfortable with contractor operations Bangladesh, were exploring Haiti as an alternative. In 2015, there were indications that interests of multinational brands were influencing decisions taken by managers in Haiti, especially relative to new styles, additional reporting and sustainability.
Low worker productivity. In initial interviews, low productivity of workers was attributed to several factors including the age and condition of production equipment, a reluctance to change work practices, challenges in team-building, absence or low levels of cross-training, communications problems and high turnover.
In 2015, a manager talked about the challenges of matching worker skills with new styles. A multinational brand was encouraging the company to take on a new style and the manager expressed uncertainty that workers were ready. In contrast, the manager described a men’s pant style the company had been sewing for upwards of 10 years and observed that “some operators are so good they can earn 600 or 700 gourdes just working part of the day.” Operators are very efficient and there’s low turnover in that men’s pant style—operators realize that if you do the same thing repeatedly you can get really good at it, according to the manager who added, “It’s hard to find someone who wants to switch [to a new style].”
New styles mean that workers have to undergo additional training if new skills or new equipment are required. One industrial engineer interviewed in 2015 described the build-up and training for a new style as the greatest challenge he faces. Both management and workers benefit from a
304 | P a g e
smooth and brief build-up; glitches mean workers produce fewer pieces and are paid less. When there are problems adjusting to a new style, quality may be low and delivery may be late.
High costs of doing business and infrastructure problems. In the 2011 interviews, a manager said, “In Haiti, everything but labor is expensive.” This is especially true of energy, which, according to interviewees, is the second greatest cost of production after labor.
Electricity problems. In 2011, interviewees reported electricity costs ranging from 34 to 38 cents US per kWh for electricity purchased from the grid. This puts Haitian apparel companies at a considerable disadvantage compared to their competition whose electricity is considerably less costly. In 2015, there was evidence that the high cost and low quality of electricity was driving management decisions.
Drinking water provision. As in 2011, 2012 and 2013, all Port-au-Prince case companies in 2015 continued to provide on-site treatment for drinking water. Costs of water treatment systems vary depending on technology choice, but all technologies for on-site treatment are associated with operation and maintenance expenditures, including periodic laboratory testing. In 2015, one manager estimated operation and maintenance costs for drinking water treatment at $600 per building per month.
Transportation challenges. Transportation was inefficient in 2011 and remained inefficient in 2012. Roads in the vicinity of the Port-au-Prince factories were poor quality and traffic jams were common. The government-owned industrial park’s location presented transportation access problems for employees, and according to interviewees, resulted in long commute times. Outside Port-au-Prince, transport options were few and costly in 2013. In 2015, there was evidence of efforts taken to improve transport options for workers outside Port-au-Prince.
In addition to employee transportation challenges, managers report challenges associated with transporting completed orders. In 2015, a manager described a debacle in which the shipping container full of garments was dropped from a crane, which then collapsed on the container, crushing it and causing water damage to the finished goods. This loss was attributed to inadequate port facilities.
Another manager described procurement challenges for OSH related to transportation, “If we have to buy something it takes forever.” OSH-related purchases include masks, eyewash and drinking fountains. Even the masks could not be obtained locally, so they purchase them on the Internet and have delivery by DHL, according to the interviewee.
Low quality of factory buildings. Three of the original five case companies rent buildings in the same government-owned industrial park, the fourth rents in a privately-owned industrial park and the fifth owns its own building. In 2012, all of the case factories were in the same locations as in the baseline year. In 2015, there was evidence of investment in improved factory space, including modifications to existing space and expansion to include additional buildings.
At the same time, significant challenges remain. One case company expressed concerns about heat, noise and fumes being generated by another company in the government-owned industrial
305 | P a g e
park that could exacerbate heat, noise and air pollution experienced by case company workers. In an attempt to mitigate the problem, employees of the case company erected physical barriers along the case company fence line as shown in Figures 16.3 and 16.4.
Temperature. Temperature on the factory floor is a common source of worker complaints during the summer, according to interviewees in several factories. In 2015, companies were continuing to take measures to address high temperatures on the factory floor.
A strategy observed in 2015 is increasing use of LED lighting. LEDs are significantly more efficient than fluorescent lighting, so they are less costly to operate and generate less waste heat. However, no data quantifying the temperature reductions were provided by interviewees.
Innovations. Although low labor costs remain a factor in competitiveness, achieving quality and delivery expectations require more than low cost, low skilled labor, and this is one way innovation may play a role in the contemporary apparel industry. More sophisticated communications systems, more teamwork, cross-training and an enhanced ability to identify and solve problems are just a few of the innovations that have improved productivity in manufacturing in other sectors,36 and one of the goals of this project is to determine whether these innovations and others are implemented and associated with improved working conditions in apparel companies. Innovation is defined here as solving problems in novel ways, or using an approach or a technology that is new to the organization or new to the place.
Innovations for 2015 include new lighting, new specialized sewing machines, a factory-based recycling program, a new boiler for burning scrap, roof fans and changes in Better Work Haiti’s program, including a management training program related to maternity for line supervisors funded by Disney.
An innovation mentioned by interviewees in 2015 was the decision on the part of Better Work to modify its program in Haiti. Instead of conducting assessments twice per year, Better Work Haiti will conduct an annual inspection. This revised program model is designed to allow Better Work more time to provide advisory services and conduct other aspects of capacity building. Responsibility for the second inspection shifts to the factories, who will conduct a self-assessment. According to one interviewee, buyers will take note if self-assessments are done poorly.
Analysis of innovations and challenges. While the challenges first identified in 2011 of low productivity, high costs and inadequate infrastructure and low quality of factory buildings remained in 2015, there was evidence of companies taking action to address deficits in all three areas. Some of the innovations were in the planning stage in prior years.
In 2013, two case companies used small LED lights at some work stations for task lighting. LED is an acronym for light emitting diode. LEDs are very energy efficient, using less energy than fluorescent bulbs, they are long-lasting, and radiate less heat than incandescent bulbs. One type of LED light observed in 2013 was a simple adhesive-backed battery powered light attached to a 36 See for example, Ichniowski, Casey, Kathryn Shaw and Giovanna Prennushi, “The Effects of Human Resource Practices on Productivity: A Study of Steel Finishing Lines.” 1997. American Economic Review 87 (3), 291-313.
306 | P a g e
sewing machine to provide intense light on the needle and sewing machine foot. Another type of LED task lighting observed in 2013 was a small battery powered lamp with an adhesive or magnetic base that had a flexible metal neck approximately 6” long that could be bent to focus on close tasks.
In a company with distant owners, managers in 2013 had diminished ability to experiment with novel approaches. According to one manager, “We planned to have different more efficient illumination, but we dropped the project. I was disappointed. Headquarters in Korea decided not to do it.” The project was going to convert overhead lighting to LEDs in a work area, the interviewee explained, but there was concern that variations in the grid electricity’s voltage would damage the expensive LED lights. This example of distant owners canceling a promising project illustrates interactions between leadership and the organizational structures element in Harris’ capacity framework as show on Figure 16.2.
In 2015, managers proudly announced they had installed LED lighting in the production area of one of the case companies. An interviewee observed that with LEDs they are able to have a higher level of illumination on the factory floor with less electricity. Reduced consumption of electricity means a reduction in the cost of production. In the same factory, new equipment for sewing flat seams was manufactured with integrated LEDs for greater operator visibility. Although LED lighting produces less waste heat than the fluorescent lighting it replaced, as noted earlier, interviewees did not provide before/after temperature monitoring data. Interviewees in this case company have consistently reported billing irregularities on the part of the government-controlled Electricité d’Haiti (EDH) and did not provide electricity consumption data to document reduced costs and consumption. The LEDs innovation illustrates relationship between the structures and the understanding elements of Figure 16.2 in the sense that an improvement in the physical structure, better lighting, also creates an opportunity to reduce consumption of electricity.
Installation of LEDs was under discussion in two other factories in 2015. In one factory, a manager discussed the problems they were having with electricity. Not only do they need to run their generator at least one hour per day because EDH is unable to provide consistent grid power, the manager said even when they have grid power, the “power is not stable” (voltage varies) causing the fluorescent lights to flicker. Illumination is very important in an apparel factory because operators must be able to see well to perform their jobs quickly and accurately. The LEDs, because of their reduced energy consumption were under discussion by the case company as a strategy to reduce energy consumption and to provide a more consistent light source for machine operators.
Interviewees in another factory described a plan to convert to solar power during 2015. At the time of our visit, the expectation was that the planned photovoltaic installation would be sufficient to power the entire factory. An interviewee indicated that a comprehensive lighting efficiency program including LED lighting might be part of the conversion program, although the interviewee did not have details. The solar conversion, if implemented, may have long-term benefits that accrue to both workers and owners. In the long-term, owners may benefit from reduced energy costs (reduced need to purchase high cost and low quality grid power from EDH)
307 | P a g e
and all personnel may benefit from reduced exposure to air pollutants if the back-up generator is used less frequently. In the short term, the solar conversion is likely to have high financial costs up front; these costs are associated with the purchase, installation and commissioning of the photovoltaic technology. Life cycle costs of the planned photovoltaic system will likely be considerably lower than continued reliance on grid electricity in view of the high costs of 34 to 38 cents US per kWh for electricity purchased from the grid. On the other hand, an interviewee observed that some solar equipment, such as street lighting, installed in Haiti following the 2010 earthquake, was no longer functional because of inadequate maintenance or vandalism.
In 2015, researchers observed roof-mounted exhaust fans on a case company’s buildings. According to interviewees, all but one of their buildings now have roof fans that were added in the last 12-18 months. The equipment was imported. According to interviewees, their data show a 3 degree reduction in temperature, and an interviewee said, “It helped a lot and makes the workers happy.” Before/after temperature monitoring data were not provided to researchers in support of the 3 degree temperature change. The roof fan innovation is related to the physical structures and resources elements of Figure 16.2.
According to interviewees, a case company renting buildings experimented with sprinkling (non-potable) tap water on the roof and the pH was so high that decision makers at their distant corporate headquarters told them to terminate the experiment out of concern that the building owner would hold them responsible for paying for roof damage. Managers in the same company described a series of investments that had been made in painting, equipment upgrades and other changes that totaled about $3 million US and were taken with the explicit goal of making the old buildings look better. This was done in an effort to attract new clients. An interviewee observed, “The buyers feel better in new places,” and noted that someone had suggested they “make a garden out front” to improve appearances. Researchers did not see any indication that the garden suggestion had been implemented.
Cultures of safety, to the extent they exist among apparel companies in Haiti, appear focused primarily on emergency evacuation and fire suppression. According to an interviewee, they have seen an improvement in attention to fire safety they attribute to Better Work. “The training gives them an idea that it’s real.” On the other hand, interviewees in other case companies noted persistent problems with keeping fire exits clear.
Some case companies have signs reminding employees that protective equipment should be used at cleaning stations. However, when asked about workforce literacy, one interviewee said they were lucky if 70 percent of the workforce is literate. This raises questions about the value of many of the posters on factory walls—even those in Creole. One factory displayed posters with codes of conduct for The Children’s Place, Under Armor and FLA, all in English.
In 2015, a manager described conducting a safety training in which pictures were used. Some of the pictures showed unsafe situations and workers were asked to describe the nature of the safety problem. One picture showed unsafe wiring that posed a shock or fire hazard. According to the manager, none of the people in the training session could identify the nature of the hazard. The manager described this as a cultural problem associated with the prevalence in Haiti of dangerous electrical connections, which in turn is related to the paucity of electricians in the
308 | P a g e
country and the absence of effective construction standards. In the framework in Figure 16.2, this challenge is related to both the culture and the understanding elements.
Managers in another company described increased pressure from existing and potential clients to report on and manage the case company’s sustainability profile. The company replaced the scrap boiler that was observed in 2012 and 2013 as emitting thick dark plumes of particulates with a scrap boiler that had more sophisticated operational controls. According to interviewees, the new unit cost $200,000 and was suitable for burning either synthetic or cotton fabric, whereas the old unit was suitable only for cotton. In the framework in Figure 16.2, this investment is related to the leadership, structures and resources elements.
An interviewee in one company asked researchers for guidance on quantifying pollutant emissions so that in the future a sustainability report could be prepared for interested clients. The interviewee explained that clients are increasingly making sourcing decisions based on the Higg Index, a system for quantifying the sustainability impact of a product or a company that was developed by the Sustainable Apparel Coalition.37 Researchers subsequently provided the interviewee with a self-study module explaining how to calculate greenhouse gas emissions.
As noted in 2011, one of the explanations for low worker productivity was the advanced age of production equipment. In 2015, new production equipment had been installed in one production area of a case company. The equipment allowed the factory to produce a new style for a new client and featured a vacuum tube near the machine’s needle/foot assembly, designed to evacuate fibers at the point of generation (rather than allowing fibers to become entrained in the air in the production area). This innovation is related to the resources and culture elements in Figure 16.2 the sense that a long-term investment is being made in productivity that may reduce worker exposures to fibers. According to an interviewee, the bag capturing fibers at each machine had to be emptied several times a day. A manager in the factory asked researchers for recommendations on monitoring technology appropriate for quantifying fiber levels experienced by the workforce.
From 2011 forward, case company interviewees increasingly queried researchers about sustainability matters, explaining that existing and/or prospective customers and investors were concerned about performance of their suppliers, particularly with respect to environmental matters. Thanks to a concerted effort on the part of Better Work staff, an arrangement was made in 2015 for researchers to meet with Haiti’s Ministry of Environment.
Ministry of Environment personnel indicated that in view of their extremely limited resources, a decision was taken to focus on community education. Interviewees did not provide any indication that the Ministry of Environment had any capacity to collect data on extant environmental conditions in the country or to establish a regulatory framework to guide decisions by companies in the direction of increased sustainability or to grant permits for boilers burning scrap or to approve equipment such as on-site generators. However, interviewees expressed interest in collaborating with others to enhance Ministry capacity and to act as a liaison for apparel companies with environment-related concerns.
37 Sustainable Apparel Coalition. 2015. http://apparelcoalition.org/ accessed 16 September 2015.
Limitations. Case studies are a valuable research method that creates an opportunity to explore contemporary phenomena when it can be challenging to distinguish between the case and its context.38 Because of limitations associated with case selection, generalizations to theory are often more appropriate than generalizations to populations.
As noted earlier, not all case companies granted interviews in 2015 due to circumstances beyond the control of researchers. Therefore, it will be important to conduct interviews in all case companies at a future date to enhance the value of these longitudinal studies.
Conclusions. Managers interviewed in 2015 indicated that existing and prospective clients were exploring the prospects for expanded or new investments in their companies and that these prospects were associated with changes. In some cases the changes were related to new styles and new production equipment. In other cases, the changes were related to pressure from existing and prospective clients to provide evidence of or to modify practices related to sustainability.
In 2013, some of the innovations identified had a negative valence; boilers for burning scraps were adding to the pollutant burden. By contrast, in 2015, innovations reported had a positive valence and included in one case the replacement of an old scrap boiler with a unit that appeared to be less polluting and the installation in one case company of LED lights that in theory reduced energy consumption and heat, and their discussion in two other companies. As noted in the limitations, however, caution should be taken in interpreting these findings as it was not possible to conduct interviews with all case companies in 2015.
As in 2013, interviewees identified training and expertise as a resource deficit. In some cases the deficits articulated by interviewees are in professional disciplines in which major clients have expertise. These include environmental management and health and safety, both of which are essential to sustainable development. These resource deficits persist among management personnel in 2015, despite clear evidence of renewed investment by brands and case companies in production-related technology and in physical structures. Capacity deficits in areas related to sustainable development can be addressed by major clients (brands) and/or by the international development community, both of which have relevant expertise.
Knowledge transfer will increase the global competitiveness of the apparel sector in Haiti. It became evident in the 2015 interviews that prospective clients are screening potential suppliers in Haiti based on their capacity to provide quantitative sustainability-related information. As a result of the increased uptake of the Sustainable Apparel Coalition’s Higg Index by major brands, the future competitiveness of apparel companies in Haiti may be compromised by these resource deficits. However, the deficits are, by no means, limited to apparel companies.
As noted in 2013, a factor central to the outcome of the present analysis of companies’ capacity related to sustainability is the Haitian government’s lack of capacity. There remain profound deficits in government capacity to ensure availability of clean water, electricity, transportation, housing and health services to its population. These deficits impose financial costs on case
38 Yin, Robert K. 1994. Case Study Research: Design and Methods. Thousand Oaks CA: Sage Publications. Second Edition.
310 | P a g e
companies that are not experienced by their competitors in other apparel-producing countries. In 2015, managers indicated these deficits may result in loss of competitiveness.
According to one interviewee, the capacity of the Ministry of Environment is critical to the success of apparel companies because clients increasingly seek evidence that activities such as operating generators, burning scraps for fuel and disposing of waste materials are conducted in ways that meet high standards and have received government permits.
Valente and Crane observe that some multinational companies engage in building government capacity in the developing countries in which they operate, for example when Shell provided human rights training for judges in Nigeria. 39 In this respect, multinational brands contracting with apparel companies in Haiti have a significant opportunity to enhance their CSR by collaborating to build the capacity of Haiti’s Ministry of Environment. Such an action could have the important trickle-down effects of reducing the pollution burden experienced by workers and communities and in improving the sustainability profile of the apparel industry in Haiti.
It can be argued that multinational brands have more than an opportunity—they have a responsibility to take action to build government and apparel supplier capacity related to sustainability. The Brundtland Commission stated that transnational corporations have a responsibility to transfer technology to enable sustainable development, noting that, “For their part, many corporations have recognized the need to share managerial skills and technological know-how with host country nationals and to pursue profit-seeking objectives within a framework of long-term sustainable development.”40
Although multinational brands claim to exercise CSR when they ensure that their suppliers comply with codes of conduct such as those developed by the FLA and examine metrics established by the Sustainable Apparel Coalition, these actions arguably reveal the limits of CSR. If brands only select suppliers that are compliant, the responsibility for action does not rest with the brand, it rests with the suppliers themselves. These longitudinal case studies have thus far demonstrated some capacity on the part of apparel companies in Haiti to innovate in response to changing circumstances. However, the companies in Haiti are limited by government capacity deficits. Enhancing government capacity is an essential step that cannot be undertaken by apparel companies in Haiti due to their own capacity limitations and to potential conflicts of interest. It can be argued that multinational brands claiming to act responsibly in Haiti have a duty to engage in building government capacity directly or to provide resources for others to build capacity.
39 Valente, Mike, and Andrew Crane. 2010. “Public Responsibility and Private Enterprise in Developing Countries.” California Management Review 52 (3), 52-78. 40 Our Common Future pp. 85-86.
311 | P a g e
Figure 16.1 Sustainable Development
Social
EconomicEnvironment
“Human beings are at the centre of concerns for sustainable development. They are entitled to a healthy and productive life in harmony with nature” (United Nations, 1992).
Graphic by Nicole Guanzon
Figure 16.2 Capacity factors, elements and connections. Source: Harris, 2007
312 | P a g e
Figure 16.3 View from case company toward neighboring factory showing fence line in government-owned industrial park
Figure 16.4 Detail of physical barrier created by case company to block heat, noise and fumes from neighboring factory in government-owned industrial park
313 | P a g e
Table 16.1 Comparison of challenges to innovations in 2015
Challenges → Innovations ↓
Low productivity
High cost and inadequate
infrastructure
Low quality of factory buildings
New production equipment
x
Plan to convert to solar power
x
LED lighting in production area
x x x
New boiler for burning scrap
x
Roof mounted exhaust fans
x x
Paint and general appearance upgrade
x
314 | P a g e
16.2 Occupational Safety and Health
A review of the academic literature points to a number of important baseline criteria necessary to support positive change in OSH conditions in developing world industries, including industry profitability, a functioning and stable legal and economic system, training and human capital, and worker participation. The Haitian apparel industry represents a particularly challenging case for Better Work because many of these underlying conditions are either not present or are severely limited in Haiti; to exacerbate matters, they are also generally outside the authority and control of the Better Work program. The significant challenge for Better Work in Haiti then is to promote long-term sustainable change within the context of a system that is quite possibly not yet capable of supporting it. For this reason, it is important to evaluate Better Work within the overall context and limitations of promoting change in Haiti. Despite these challenges, it is clear that Better Work can and does play an important role in supporting OSH improvements, as well as facilitating the underlying conditions that will foster long-term growth and change in working conditions in the country.
This document summarizes the preliminary results of the fourth year of a five-year longitudinal case study designed to explore the role of Better Work Haiti (BWH) in promoting and sustaining positive change in OSH in the Haitian apparel sector. This work is part of a larger impact evaluation of Better Work conducted by a team of researchers from Tufts University and is paired with a separate case study exploring the role of BW on promoting innovation in the apparel sector (Rappaport 2015). The broad goal of this evaluation is to understand the role of BWH as an agent of change in improving working conditions over time. A description of the results of the longitudinal cases is combined with quantitative data from worker and manager surveys, as well as five years of BWH compliance reports (ILO 2010, 2011a, 2011b, 2012a, 2012b, 2013a, 2013b, 2014a, 2014b, 2015) to provide a more complete picture of OSH changes since Better Work programming began in Haiti in 2010.
Methodological Approach. The longitudinal cases described in this report have occurred over a series of five years, beginning with a baseline assessment conducted in 2011 (Davis 2011, 2012, 2013). A parallel case study of the role of BWH in stimulating innovation in the Haitian apparel industry is reported separately (Rappaport 2015). Four of the five planned site visits to Haiti have been completed and the fifth and final round of data collection is anticipated to take place at a future date yet to be determined.
Originally, five factories were selected for evaluation, and all five were subject to follow-up visits in year two. These original five case study factories were selected to represent a variety of sizes (700-2500 employees as measured in 2011) and ownership categories from the 28 companies then participating in the Better Work program, and were limited geographically to the Port au Prince area. In 2013, two additional factories in the north of the country were added to the evaluation; however, these factories were unavailable for follow-up in 2015. Also unavailable during the 2015 site visits were two of the original five Port au Prince factories. It is anticipated that all seven case study factories will be available for observation during the site visits to occur in the final year of the longitudinal study.
315 | P a g e
For the purposes of this case study, the manager in charge of OSH in the factory was interviewed, although the job title for this manager varied across factories. In 2015, we were able to interview the same manager(s) as previous years. In some cases, additional observations were based on interviews conducted with other factory managers that were questioned primarily for the parallel case study of the impact of BWH on innovation within the factories (Rappaport 2015). These additional managers included the Owner, General Manager, Financial Manager, Human Resource Manager, Industrial Engineer and Production Manager. Translation was provided when needed and interviews were conducted in a conference room or other relatively quiet space onsite.
Following the interviews, we were given a tour of the factory and had the opportunity to ask additional questions and observe many of the features discussed in the interviews. During these interviews and factory tours, we focused on a number of specific OSH concerns identified as potentially hazardous to workers in the Haitian apparel sector (Davis 2011; European Agency for Safety and Health at Work 2011; International Labour Office 2010; US Department of Labor 2011) including toxic chemical exposure from the use of cleaning agents, mechanical hazards related to equipment operation, air pollution exposure from internal sources such as aerosolized cotton and fiber dust, as well as external sources from diesel generators and poor local air quality, musculoskeletal stressors related to poor ergonomic conditions, heat stress and noise exposure.
In summary, this report combines multiple sources of information about trends in OSH over the period of BWH involvement in Haitian apparel to paint a more complete picture of the impact of BWH in promoting OSH change within the sector. Specifically, this report describes the results of four years of case interviews and factory tours, combined with quantitative data from computerized manager and worker surveys and five years of BWH compliance assessment reports to identify both realized and potential OSH changes specific to Better Work’s involvement in Haiti.
Literature Review of Developing World Apparel. The majority of the world’s workers work in conditions that do not satisfy basic international standards for occupational safety as outlined by ILO and WHO guidelines and only 10 percent of developing world workers are even protected by OSH laws (LaDou 2003). Haitian apparel therefore represents no exception to the ubiquitously poor working conditions present in the developing world and the continuing struggle with OSH in BWH factories is not unique to this country or the industry.
Apparel as a ‘Starter Industry’. The apparel industry represented an important engine of economic growth during the early industrialization period of the now developed world (Mortimore 2002). However, it is difficult to draw similarities in the development process between former developed countries and presently developing economies, especially in small countries such as Haiti that primarily perform localized assembly functions. In these cases, barriers to entry are often low and competition for suppliers is fierce. As such, profit margins (and wages) face continual downward pressure to maintain competitiveness on the world market.
The strategy of ‘export upgrading’ (Schrank 2004) whereby countries build their export markets and human capital necessary to progress to higher value added products and spur economic
316 | P a g e
growth may in fact be significantly flawed as a strategy for small developing world economies such as Haiti. Apparel in and of itself does not necessarily generate the productive capacity needed to promote an ongoing cycle of exports (Sanchez-Ancochea 2006), and this task may be especially difficult for small countries seeking to industrialize based on simple labor-intensive products (Mortmore 2002). Schrank (2004: 125) suggests that ‘the prospects for upward mobility [for developing world apparel] are inauspicious at best.’ Apparel as a starter industry is often at a disadvantage in small countries because they are unable to achieve profitable economies of scale that would allow them to compete on a global market. As such, they rely on a combination of international trade agreements, cheap labor and poor environmental/occupational standards to attract foreign investment. Without extensive planning and intervention, this scenario in and of itself does not represent a stepping-stone towards an independent and sustainable export stream. In fact, some evidence suggests that the structure of developing world apparel may actually limit or otherwise distort the process of industrialization and economic growth in these countries (Mortmore 2002).
The Case for OSH Changes. There is no literature available to the knowledge of the author that explores the process of change and improvement in OSH conditions in developing world apparel factories. This gap in the literature highlights the importance of case studies such as these to explore and better understand this process of change. Based on a more general review of the literature as it relates to OSH in developing world factories and industries, a number of points can be highlighted as potentially relevant to Haitian apparel. As noted by Joubert (2002: 199), ‘Each country, region, or workplace may have its own answer and own set of factors that will affect the success or lack of success for implementation of occupational hygiene controls within it.’ Despite this variability, the literature outlines a general set of underlying conditions that are essential for laying the groundwork for positive change.
1) Industry profitability: A 2003 study by LaDou noted that OSH program development is linked to profitability of both the industry in question and the country within which it operates. Work by Joubert (2002) also emphasizes profit stream as an important precursor to change. A certain degree of technological sophistication and a reliable base of low cost inputs such as infrastructure, electricity, labor, etc. are further required to maintain the profitability of the industry and support improving OSH conditions over time.
2) Functioning and stable legal and economic system: LaDou (2003) suggests that properly functioning legal and economic systems represent basic prerequisites for successful OSH programs. This includes a strong government that understands and is capable of supporting basic human rights at work as a national priority and able to facilitate both the efficient production of goods and services and social justice in the work place (Joubert, 2002). In pursuit of economic growth, developing world economies often neglect occupational and environmental impacts to attract foreign investment and support the industrialization of key industries (Joubert 2002). A poorly functioning economy with wide-scale unemployment may also make workers more likely to accept poor working conditions as a matter of survival, regardless of whether they understand the hazardous conditions they face on the job (Joubert 2002).
317 | P a g e
3) Training and human capital: Trained and experienced managers are required to structure and enforce OSH standards at the factory level and to provide the ongoing leadership necessary to maintain a culture of safety inside the factories (LaDou 2003; Joubert 2002). Human capital by way of properly trained managers that understand the safety risks are also critical to maintaining pressure on the government to enforce existing regulations. Furthermore, it is essential that workers are themselves aware of the short and long-term consequences of their work so that they can properly advocate for a safe work environment. An uneducated workforce cannot demand improvements to conditions they are ignorant about or do not perceive as an unacceptable level of risk (Joubert 2002).
4) Worker participation: There is a strong argument presented in the literature advocating an important role for worker participation in improving OSH conditions. A ‘union effect’ (Partanen et al. 2005) has been noted in the literature whereby developing countries with greater union participation rates among workers also tend to rank higher in OSH performance measures (LaDou 2003). The active involvement of workers is important, as they possess unique and intimate knowledge of their own working conditions and of potential strategies to improve OSH conditions (Johansson and Partenen 2002). Worker apathy related to a failed sense of investment in their work environment has also been noted as a cause for concern (Joubert 2002). For this reason, top down management strategies alone may not be especially successful when it comes to improving OSH conditions in the developing world.
Relationship between Incentive Structures and OSH. Previous investigations of Better Work factories have highlighted the impact of incentive-based pay, i.e. the piece rate system, and on various aspects of worker well-being. Truskinovsky et al. (2014) and Lin et al. (2014) suggest that sexual harassment increases when line workers are paid piece rate wages, as supervisors take advantage of their role in determining the production bonus by extracting some portion of it in the form of sexual favors. Additional limited evidence of a similar effect on verbal abuse suggests that verbal abuse decreases when workers are incentivized (presumably because workers are motivated to produce without the need for abuse), while verbal abuse increases when the supervisors are incentivized based on their subordinates’ productivity (Rourke 2014).
While the role of incentive-based pay on OSH-related behavior and perceptions in the apparel industry is unknown, previous research in other dangerous industries suggests that productivity-based pay may heighten risk-taking on the job, increasing safety-related concerns and the chance of accidents (Davis 2011, Davis 2012). This may be particularly relevant in low wage scenarios where there is a general lack of safety education. In the apparel setting, risk-taking is likely to increase under the piece rate system for safety features that are perceived to slow the pace of work. This is supported by anecdotal evidence from these case studies, as managers consistently cited the difficulty of getting workers to use equipment and safety features that are perceived to reduce their productivity. For example, protective guards against needle pricks are perceived by sewers to slow the pace of work, while the same is true for cutters and gloves, and protective glasses that make it more difficult for workers to see or easily slip down the nose. The relationship between OSH and incentive pay represents an important area of future research for Better Work, as OSH is a central component to improved working conditions and compliance remains problematic.
318 | P a g e
While the economics literature may be unambiguously supportive of the link between incentivized pay and increased worker productivity (Rourke 2014), the impact on profits in the apparel sector deserves greater attention. In his seminal paper describing the significant productivity boost related to incentivized pay, Lazear (2000) draws an important distinction between productivity and profits, the latter of which is balanced by both costs and benefits. While increased productivity represents an important benefit, additional costs may include decline in quality (as workers are motivated to work faster) and measurement difficulties associated with oversight and quality control. Lazear goes on to note that incentives (and the resultant boost to productivity) will be weaker in cases where there are many factors outside the employees’ control that impact output. In the developing world apparel industry, inconsistencies in pay, lack of job security, and sexual and verbal abuse may weaken the link between piece rate and productivity. For this reason, it is not only plausible but also highly possible that the costs of measurement and quality control outweigh the potentially weak benefit of productivity given the relatively uncertain and abusive environment under which many apparel employees work. In combination with the potential negative impact of the piece rate system on OSH perceptions and behaviors noted previously, the distinction between productivity and profits represents an important area of future research for Better Work.
OSH in Haiti. Haiti is the poorest country in the Western Hemisphere, and is continually ranked among the lowest in standard of living in the world (UNDP, 2013). Based on a 2006 report, 56 percent of Haiti's population was characterized as ‘extremely poor’ (living on one dollar or less per day) and 76 percent was characterized as ‘poor’ (2 dollars or less per day) (USAID, 2006). In addition, the average life expectancy at birth in Haiti is the lowest in the Western Hemisphere, 63 for females and 60 for males (PAHO, 2009). In 2010, over 40 percent of the island population of 10 million people were considered unemployed, while 80 percent of the population was living below the poverty line (CIA Factbook 2013).
The apparel sector represents an important employer for the Haitian economy, accounting for approximately 90 percent of Haitian exports and nearly 5 percent of the gross domestic product (CIA Factbook 2013). The apparel industry in Haiti operates on a slim profit margin, specializing largely on the production of t-shirts and simple garments. The competitive advantage of Haitian apparel with respect to its competitors is derived from an abundance of cheap labor, preferential trade agreements (Hope II legislation) and geographic proximity to the US market. However, as noted in previous reports (Davis 2011, 2012, 2013), this competitive advantage is nearly completely offset by the high cost of doing business in Haiti, including electricity, rent and infrastructure challenges.
The country lacks a robust educational infrastructure, and over half of the adult population is illiterate (CIA Factbook 2013). Haiti suffers from a persistent ‘brain drain’ whereby the most skilled and educated citizens leave the country for greater opportunities. Jadotte (2012) notably argued that the largest export in Haiti is not apparel but is in fact skilled labor. The strength of Haiti’s underlying economic and political systems are further weakened by extraordinary public health and environmental challenges of poor water and sanitation, HIV, cholera and deforestation, which often serve to dwarf working conditions as a national priority.
319 | P a g e
From the perspective of doing business in Haiti, the country suffers from a ‘history of distrust between workers and employers with regard to the labour movement’ (ILO 2013: 10). Much of this relates to past conflicts underpinning a culture of government instability and corruption, resulting in a high degree of distrust with foreign intervention and authority in general (Farmer 2006). This lack of trust has proved challenging to the joint BWH goals of peaceful worker participation and industry profitability in Haiti. Exacerbating the labor conflict is the perception among factories that unions destroy companies. Despite the historical discord between workers, factories and government authority, union activity in Haitian apparel factories has risen quite substantially since Better Work became involved in the country, from a single factory in 2010 to 68 percent of factories in 2015 (ILO 2015).
Review of Economic Conditions: 2011-2015. At the time of the first follow-up in 2012, the major external pressures of change within the Haitian apparel industry were related to poor economic conditions. The business environment in Haiti had been harshly hit by the US recession and the apparel sector had reportedly lost some 4,000 jobs. In four of the five case study factories in our 2012 sample, there were reports of slowed production, forced shutdowns, layoffs, and reduced orders. Managers cited excess inventories, decreased demand in the US and buyer requirements for nearly next day delivery as difficulties faced by Haitian apparel factories at that time. To cope with the economic downturn and layoffs, factories had been forced to increase the level of productivity among their remaining workers.
The economic slowdown presented a challenge from the perspective of understanding the impact of Better Work involvement in OSH improvements over the baseline period. Attributing any OSH changes (or lack thereof) to BWH would be problematic in light of the unknown impact of this third external factor. The severe economic conditions represented a major pressure on factories that limited their potential to invest in working conditions and particularly for interventions with relatively high implementation costs. In light of such harsh economic climate, the fact that OSH conditions remained relatively stable was viewed at that time as a potentially positive sign that BWH involvement prevented otherwise inevitable rollbacks in working conditions in Haitian apparel factories (Davis 2012).
During the 2013 round of site visits to the case factories, the impact of economic factors was diminished and in some cases reversed. The economic climate appeared to be improving overall in Haiti, and one owner reported 25 percent growth in jobs over the previous year. The increase in business activity was evident across the board during the 2013 visits, as two of the case study factories were in the process of expanding capacity to new buildings or significantly renovating existing spaces to increase capacity. Along with this investment in building infrastructure, factories were also investing in new technologies to improve efficiency as well as new equipment such as machines, chairs and tables. Most notable with the new construction, renovation and purchasing observed in 2013 was the extent to which it was being done with the perspective of OSH in mind and in collaboration with BWH to ensure that the new spaces were OSH compliant. In general, managers and owners seemed cautiously optimistic in 2013 about the growth of the industry in Haiti.
320 | P a g e
Cautious economic optimism was also expressed in our 2015 interviews with the factory managers, and we continued to observe significant growth and infrastructure improvements. One factory had recently expanded to two new buildings that were being rented within the same industrial park. Despite the growth pattern, the manager reported continued difficulty in retrofitting the rented spaces to accommodate OSH requirements, particularly evacuation-related issues. Another factory reported that business was booming, including upgrading the production process to higher quality garments (worth double the value according to the manager). In addition to new styles, we also observed upgraded technology in the production process. Chalkboard line counts had been replaced with digital counts and new equipment was in use, including machines with built in vacuum components to collect fibers. Additional measures, such as roof top painting and industrial exhaust systems, had been taken to reduce heat.
However, despite clear growth in the industry, many systematic challenges related to infrastructure continue to drive up production costs. Most notable among them is the continued unreliability of the power grid; although generally available between the hours of 7am to 4pm, it is not a stable source of energy. However, by 2015 factories had begun to innovate around the problem presented by unreliable power. One factory had installed a new boiler at significant cost to burn only scraps, avoiding the problem of procuring diesel fuel or relying on the power grid for certain energy needs. As an unintended co-benefit, the newer model boiler also appeared to be significantly cleaner burning, reducing the factory’s negative impact on local air quality. In a similar fashion, another factory had plans to go completely ‘green’ and will soon receive all their power needs through solar panels. This factory saw the benefit of both reducing their vulnerability to power-related issues while also being able to market their products to buyers as a full package of social and environmental responsibility. In addition to their alternative energy project, the factory had also instituted recycling programs for oil, glass and other products since our previous site visit.
In addition to a continued interest and push for the infrastructure improvements noted above, we observed significant change and investment in the Caracol compound located in northeastern Haiti over the two year period. These investments are particularly relevant to sustainable growth in the Haitian apparel sector as the non-Port au Prince regions of Caracol and CODEVI represent 30 percent of overall employment with a workforce of more than 10,000 (ILO 2015). Although the Caracol industrial park officially opened in late 2011, at the time of our 2013 site visit to the region there was only a single apparel factory operational within the compound. In 2015, we observed significant physical expansion of that initial apparel factory space as well as new business operations in the area including a second garment factory. Other infrastructure improvements included helicopter pads, a police station, cafeteria and catering facilities onsite. Also under construction in 2015 were a technical school for worker training, water treatment facilities and a fire station; childcare facilities were under discussion. A fully operational electricity plant constructed by USAID was providing power to Caracol and the surrounding community. Although the infrastructure is currently privately operated, the purported goal is to eventually transfer operations to the government in a manner similar to the public owned power company and SONAPI industrial park in Port au Prince and to operate as a fully self-sufficient
321 | P a g e
industrial complex. Future plans may include a deep-water port in nearby Fort Liberte, as well as plans to improve roads outside the factory grounds.
Review of Labor Conditions: 2011-2015. During the baseline assessment in 2011, only one apparel factory in all of Haiti was unionized and none of the initial case study factories had unions present at that time. By the 2013 site visits, labor representation had grown to 50 percent of all BWH apparel factories (ILO 2013) and labor-related conflict had risen to the forefront of the management agenda. As reported in the most recent Synthesis Report (ILO 2015), unions are now present in 68 percent of factories, including all but one of the case study factories.
Unions can be perceived to represent both opportunities and challenges to the factories. Poor communication and distrust among various levels of the operation represent a critical stumbling block to labor-manager relations in Haiti. One manager interviewed went so far as to suggest that the pervasive ‘cultural bias against bosses’ was the biggest challenge to doing business in Haiti. Managers expressed doubt that union representatives were or could be helpful in improving OSH conditions because they themselves lacked an understanding of the occupational risks, as well as their own rights and responsibilities as union representatives. In contrast, a manager noted in 2013 that the union was helpful in explaining work-related policies including OSH to workers because they represent a more trusted source among workers than managers. This same manager also believed that the level of trust and communication among workers and managers was better in their factory compared to others in Haiti because there was more interaction among the two groups and less distinction drawn between them. Another manager discussed similar benefits to supporting union communication with workers and provided an example of the union helping avoid worker theft of toilet paper from the bathrooms.
In addition to increased union activity over the case study years, the country’s new minimum wage law took effect in 2012, bringing the daily minimum wage from 150 to 200 gourdes (approximately $3.50 to $4.60 based on the July 2013 exchange rate), with a piece rate target that varied from 200 to 300 gourdes ($6.90). To provide additional perspective, estimates of the living wage for workers in the SONAPI industrial park (where three of the case study factories are located) was estimated to be $29/day, over six times higher than the new daily benchmark of 200 gourdes (AFL-CIO 2011).41 At that time, the minimum wage law was unclear on the specifics of how the piece rate would be determined, and absent guidance from the Haitian government on how to establish this benchmark, there was a high degree of conflict between the BWH and factory interpretations on the issue of piece rate pay. According to a number of managers and owners, the single biggest challenge for their factories at that time was uncertainty related to the minimum wage. Many managers suggested that the industry was in a ‘holding pattern’ and that growth and investment was detracted until the minimum wage debate was settled. The single biggest complaint by managers at that time was related to BWH interpretation of the Haitian minimum wage law, suggesting that BWH involvement and interpretation was making them less competitive on the world market.
41 This living wage estimate was reportedly calculated based on survey of average monthly expenses for a 3-member household comprised of one adult wage-earner and two minor dependents for a locally appropriate basket of goods.
322 | P a g e
This conflict over the minimum wage continued through 2015, including brief periods of labor-related violence such as the December 2013 worker strikes. According to one manager during the 2015 site visits, labor conflicts related to the minimum wage make neighboring competitors like Mexico look more attractive relative to Haiti, especially when their workers are better trained. According to this manager, low wages are an important component of the business case for investors operating in Haiti. Another manager reported less minimum wage uncertainty in 2015 than previous years, but also noted that the labor climate continued to be one of the biggest challenges to operating in Haiti.
A final concern expressed by managers is that the Haitian labor code itself is often unclear and ambiguous, and that it contradicts international labor law in uncompetitive ways. Managers pointed to a number of problematic sources of non-compliance as evidence of poorly constructed national labor laws. For example, they argued that the mandated number of nurses and medical staff onsite was not feasible due to the high cost and that the present nurses on staff mostly sat around for lack of work. To managers, it did not make financial sense to add more idle nurses despite this being a continuing source of non-compliance. Managers similarly argued that the required medical checks under the Haitian labor code were anticompetitive, because neighboring countries imposed no such health-related costs on their apparel sector. Managers also suggested that these medical checks were the responsibility (under law) of the Haitian government and factories are unfairly judged non-compliant in the absence of government service. Finally, labor code requirements for bathroom and cafeteria space were seen to be problematic, particularly for those factories renting government owned space. Given the high cost to retrofit spaces to comply with these requirements, factories in rented spaces were unwilling to bear the cost burden to come into compliance and suggested that it was the role of the landlord (Haitian government) to properly equip their buildings with these spaces. With respect to government responsiveness, one manger expressed an opinion that the government should work to incentivize businesses that are already present in Haiti by maintaining buildings, outlining priorities and interpreting Haitian labor law, and not just focus on incentivizing and attracting new business to Haiti. Overall, there was a sense that the national labor code as interpreted and enforced through the BWH synthesis reports was unfair and anticompetitive, and that improved clarity around these issues was needed to improve the competitiveness of the Haitian apparel sector on the international stage. There was also a sense that some of the international labor laws interpreted by BWH as a non-compliance point, such as temperature, were just not feasible in a tropical country like Haiti.
Review of Training and Communication Initiatives: 2011-2015. The baseline assessment highlighted the need for improved safety training at the factories and suggested that BWH take a more active role in organizing and sponsoring training events at the factory. Although little to no progress in training was made between years one and two of this longitudinal study, more significant gains were observed by the 2013 site visits. These included the growth of OSH committees42 and more progress around the organization of PICCs,43 as well as increased interest 42 Small committees of workers and managers, usually one per factory building, tasked with discussing and managing OSH-related concerns in the workplace. Workers on the committee are assigned by management.
323 | P a g e
in fire safety and training programs. The PICC has been particularly slow to launch in Haiti, which has proved a difficult sell to both management and workers. While management perceived the initial PICC as a stepping-stone to unions, workers perceived the PICC as a less favorable replacement to union representation. Although BWH staff reported that demystifying the PICC in Haiti is an ongoing process, a summer 2014 meeting with the union conducted in Creole was critical to helping educate representatives on the role of PICCs and the potential benefits to workers. As of 2015 there are nine PICCs currently in existence across the full set of BWH factories in Haiti, up from a single operating PICC in 2013. A broader reflection of increased communication in the Haiti apparel sector has been the creation of the Social Dialogue Table, which BWH facilitated and now serves as an outside observer attending meetings. This group was developed as an independent platform to promote communication among employers and employees (both union and non-union) across factories. It will be important to continue to observe the results of broader communication in the sector during our final 2016 site visits.
Table 16.2 provides a breakdown of OSH-related trainings since 2013 at the full set of seven case study factories. In addition to the trainings outlined below, two of the case factories also delivered new maternity protection training to workers over this same time period. This training module, reportedly developed at the buyers’ request, represented a repurposed BW product from other countries that was translated and delivered in Creole. In addition to the standardized maternity training program, one case factory has built upon this to provide additional free health-related programs for pregnant women, including sonograms, hospital stays and onsite access to doctors and medications. According to BWH staff, the general goal is to develop targeted trainings that are linked to non-compliance issues and the new maternity training program is an example of this broader training initiative.
Similar to previous years, in 2015 managers continued to request that BWH provide more OSH training opportunities and there was a sense that BWH was ‘busy doing other things’ and providing less training than in previous years. The managers uniformly believe that these trainings are valuable, and one manager appreciated that BWH trainings were well explained and offered to workers in Creole. Managers made more specific requests that BWH train union representatives in both OSH and more generally in their rights and responsibilities as advocates. There was a sense that union representatives were not capable of properly advocating for OSH improvements because they lacked training to understand these issues. Additional suggestions were made that BWH provide more targeted training to the OSH managers.
The BWH-sponsored Health Fair continued to receive mixed reviews. Although generally viewed as a positive experience for workers that were able to participate, it was clear that the resources needed to maintain a safe and successful event were not available. One manager suggested that BWH take advantage of the long wait times to see doctors to deliver OSH training and that free food and drink should be provided to workers at the event. Although the status of
43 The Performance Improvement Consultative Committee (PICC) is a centralized committee of managers and workers tasked with developing and implementing improvement plans related to non-compliance points (including OSH) identified in the BW synthesis reports. Workers on the committee are voted in by their peers.
324 | P a g e
the Health Fair moving forward is uncertain, ideally this event could provide a participatory space whereby BWH could disseminate ideas and connect with workers.
Review of Accident and Illness Reporting: 2011-2015. The identification and mitigation of potential OSH hazards through proper accident and illness reporting remains a challenge in Haiti. The factories continue to document injuries (although nothing related to absenteeism or illnesses) and send monthly paper reports to the Haitian government, but do not record these data in any systematic fashion that would allow for the analysis of causal relationships and trends. However, there were a few gains identified in 2015 that are worthy of note. The single factory that in previous site visits had reported to be working on constructing a searchable database of worker accidents was finally seeing this project come to fruition. This factory was in the process of training nurses on how to use the new system and it will be important to follow up during the final site visit in 2016 to explore whether the new database has improved their understanding of worker health and safety. Another factory recently instituted a new health services delivery model under which medicines are more readily available and there is more direct and active interaction between nurses and workers, including education services. They also reportedly track absenteeism within the new system, and attributed a decline in absenteeism to the improved health care services. Although there was no specific database to track illnesses, the manager believed they might be able to identify and track illnesses based on medication usage.
Since the factories continued to lack a centralized reporting system of worker attendance and illnesses, managers were be unable to identify other than anecdotally the extent to which worker absences could be linked to factory-related accidents or clusters of worker illnesses. However, commonly reported illnesses included high blood pressure, anemia and vitamin deficiency, fever and asthma.
OSH Non-Compliance Trends: 2011-2015. Figure 16.5 compares the percent of non-compliance across the OSH categories over time for all of the BWH factories (ILO 2010, 2011a, 2011b, 2012a, 2012b, 2013), as well as the combined group of seven case study factories. Overall, OSH compliance rates in the most recent report improved in each category except for ‘Health Services and First Aid’ and ‘Welfare Facilities’. Improvements were much lower in the case study factories, where non-compliance held steady or worsened in all categories except for ‘OSH Management Systems’ and ‘Working Environment’.
The sporadically slow rate of change in OSH non-compliance points among the BWH factories is due to a number of factors. Much of this can be traced to the country-specific factors noted previously in the literature review as important to promoting change in OSH. These basic precursors, which include a profitable industry, non-corrupt and viable economic and legal systems, human capital, and worker participation, are notably lacking in the Haiti case and outside the control of BWH. In addition to these external factors, it is also important to recognize that non-compliance as outlined in the synthesis reports reflect the slow pace of reported change in OSH, which is likely exaggerated due to the increasing amount of data collected by the Better Work Enterprise Advisors (EA) and made available for reporting over time. As the factories come into compliance with the most basic OSH conditions, it allows the Better Work EA’s to assess additional layers of compliance that may have been previously
325 | P a g e
ignored in an effort to focus on these more fundamental improvements. This additional scrutiny may cause fluctuations in compliance points at factories over time.
Another source of fluctuation in non-compliance for the work environment category is the time period of data collection. In the Work Environment category, non-compliance shot up as data collection efforts revealed problems with noise, heat and lighting, and then a clear seasonal trend appeared whereby factories were more likely to be in compliance with heat in the winter versus the summer months. The up and down trends in this category are unrelated to actual change, and more specific to data collection and seasonal effects. Irrelevant to actual OSH impact, the Work Environment category will continue to be problematic if the data to support the new self-assessment cycles are collected in the summer months, while much less likely to present an issue in the winter months.
Also, Health Services and First Aid continues to see high levels of non-compliance as companies struggle to provide the regular medical exams for workers required under the Haitian labor code. However, managers suggested that the medical examinations are the responsibility of the government, and represent a failure of government services and not the factories themselves. However, in the absence of a functioning government to provide the necessary services required by law, companies are being judged out of compliance. A final problematic non-compliance category as noted by managers relates to Welfare Facilities and infrastructure requirements. Many companies operate in government owned facilities and are therefore hesitant to make OSH updates, such as adding new bathrooms and cafeteria space to buildings they don’t own. Managers also suggest that many of the Haitian labor code rules are unrealistic and unnecessary. Short of public investment in these buildings or adjustments to the labor code, these are likely to remain areas of non-compliance in the future regardless of BWH involvement in the factories.
Also worthy of note in the fluctuating and stagnant trend in OSH compliance is that half of the factory managers interviewed reported that the Better Work compliance assessment methods, and particularly the interview of workers, were inconsistently applied across the BWH EA’s. These same managers also expressed concern that the EA’s interpreted the compliance rules differently and factories could be judged in/out of compliance unfairly based on judgments made by the individual EA. One manager felt that the EAs needed more training to understand both international labor standards and also protocols for interviewing so that the assessment results would not vary across EAs. Another felt that the compliance report should not presume a problem simply because it is reported by a small number of workers and that if issues are raised during the worker interview process, they should prompt a further comprehensive survey of workers before being reported as non-compliance. However, another manager also noted that they were pleased with the ability to respond to the compliance assessment before the document is made public, which provides them an opportunity to argue their case.
New BWH Initiatives: 2015. Much of the change we observed in 2015 over previous years related to the implementation of new BWH initiatives and programs. The most notable of these changes was the development of a new service delivery model, changing the role of the Enterprise Advisor (EA) in the factories. In the previous model, EAs conducted independent periodic assessments of factory compliance on core labor standards and reported these results bi-
326 | P a g e
annually in the synthesis report. Under the new approach, factories will take control of self-assessing these core labor standards on an annual basis and the EAs will be responsible for a single independent annual assessment. The new model is part of a broader Second Phase initiative by Better Work Headquarters (not specific to Haiti) to transfer responsibility over to the factories, essentially redirecting EA efforts towards education and advisory services. The overall goal is to promote knowledge transfer to factories and facilitate improvements through advisory services as opposed to assessment and reporting. The factory managers overwhelmingly supported efforts by BWH under the new service delivery model and were optimistic that they were on a good path to complete their own assessments. One manager noted that their factory was already doing all the work needed for self-assessment under their current system. Although this manager welcomed the input of BWH as a ‘second set of eyes’, they also appreciated the limiting BWH assessment activities to once per year. Another manager suggested that their well-functioning PICC would be essential to the self-assessment process. As part of a separate but related initiative, BWH is working with the Haitian government to train a small team of public inspectors under the ILO-MAST program to perform the factory assessments, with the eventual goal of transferring assessment and enforcement responsibility over to the national government.
Evaluation of OSH in Haiti. This section of the report describes the results of four years of case interviews and factory tours, as well as quantitative data from computerized manager and worker surveys on perceptions of OSH hazards within the factories. A number of specific occupational health and safety concerns were identified in the baseline report as potentially hazardous to workers in the Haitian apparel sector: 1) toxic chemical exposure from the use of cleaning agents, 2) mechanical hazards related to equipment operation, 3) air pollution exposure from internal sources such as aerosolized cotton and fiber dust, as well as external sources from diesel generators and poor local air quality, 4) musculoskeletal stressors related to poor ergonomic conditions, 5) heat stress and 6) noise exposure.
Manager and Worker Perceptions .The results of computerized worker and manager surveys are shown in Tables 16.3 and 16.4 below, and provide an interesting albeit limited perspective for understanding OSH-related concerns in the BWH factories. The data collection efforts in Haiti proceeded at a slower pace than anticipated and the available data are limited to two observation periods (2011 and 2012). In some cases, it was clear that workers misunderstood the questions as written, as they often failed to answer the questions completely. This did not appear to be a problem for the mangers, where all respondents provided at least one affirmative response to each question. Based on these survey results, managers reported decreased concern in all of the OSH categories over time, while a similar pattern is true for workers with the exception of concern over dangerous equipment and dirty air. Workers were more likely to report that they discussed their concerns among co-workers, while managers were more likely to report that worker concerns were discussed directly with supervisors.
Toxic Chemical Exposure. There were some production process changes noted over previous assessments as factories were continuing to switch to more value added products and fabrics. However, with the exception of additional pad printing processes, chemical exposure remained largely unchanged compared to previous years. The major source of chemical exposure
327 | P a g e
continues to be the garment cleaning process and printing stations, and there were no reported changes to the use of cleaning agents in the past year.
In the previous assessment, factories reported an increasing use of verbal prompts by OSH and floor managers, as well as through the loudspeakers, to remind workers of safety precautions. As in previous years, the use of protective gear at the cleaning stations in 2015 remained sporadic across the case study factories but managers continued to report rising awareness and PPE usage over time. As noted in previous assessments, the cleaning stations are often located in close proximity to other work areas where the workers are not properly protected from chemicals. During the factory tours, we continued to see dust masks in use, even though these masks are not protective of chemical vapors.
At the baseline assessment, there were no eye wash facilities present in any of the case study factories. In the first follow-up assessment, eye wash precautions were available to workers at each of the factories, which varied from eye wash bottles to full-scale stations. We observed no change in the availability of eye wash stations during the 2015 follow-up period.
There continued to be no specific official policy at the majority of the factories that would exclude pregnant women from working at the cleaning stations. However, two of the factories had informal policies whereby pregnant women in the cleaning and printing stations were reassigned to other work stations. One of the managers with the unofficial pregnancy policy suggested that the printing area was the most dangerous in the facility because they used paint thinner and must wear proper respiratory equipment. Also noteworthy are the ongoing initiatives to provide maternal health supplies and training to workers. However, it was unclear the extent to which this new maternity protection training program covered occupational hazards related to chemicals. It continues to be a recommendation of this case study to promote official pregnancy policies at the factories to ensure pregnant workers are not unnecessarily exposed to potential hazards.
Mechanical Hazards. There were a number of important changes to factory operations with the potential to significantly lower the risk of mechanical hazards faced by workers. For example, one factory had purchased new machines, which were better designed for safety with individual LEED lighting and tamper proof safety mechanisms. Although the manager couldn’t say definitively whether the new machines reduced accidents because they did not collect such data, they were confident it reduced machine-related accidents as a result of the better design. In previous assessments, managers perceived the sewing operations as the most common cause of worker injuries (needle pricks), while the cutting machines (where present) were typically cited as the most dangerous. As noted previously, one manager this year believed that chemicals related to the pad printing process represented the greatest hazard to workers. Despite the new machines in some buildings, remaining old machinery and broken safety controls such as finger guards continue to be a problem at the factories. Overall, managers continued to complain of the difficulties of getting workers to properly use the equipment available to them.
Education and training of workers in mitigating mechanical hazards remains a problem, as there have been few updates to the training efforts over the study years. Managers report using verbal prompts by OSH and floor managers and the loudspeaker system to remind workers about safety
328 | P a g e
issues. In 2013, one manager noted that staying on top of workers is more difficult for operators because there are so many of them, as opposed to the smaller number of cleaners. According to management, workers complain that the equipment is uncomfortable and often times too big for the purpose. However, another important aspect of safety rejections continued to be the simple fact that these equipment slow workers down and are rejected by some workers because they reduce productivity and ultimately wages that are tied to the piece rate system.
Despite these challenges, managers generally reported in 2015 that workers were more concerned with safety across all work areas and as a result, PPE usage was up over previous years. They attributed this increase to better trainings and communication through more active managers and OSH committees. There was a sense that workers felt more comfortable raising and addressing perceived OSH threats, such as wearing their PPEs and keeping the aisles and exits unblocked. However, managers continued to report safety awareness among workers to be one of their greatest challenges. One manager reported concern with complaisance in general, and noted that workers are very concerned immediately after an accident or training, but that they become less aware and careful over time. As it relates directly to OSH, a manager in 2015 described the difficult task of purchasing and maintaining OSH equipment such as eye wash stations, and complained of long wait times to replace broken safety equipment such as finger guards. According to this manager, the absence of local suppliers of even simple safety equipment such as masks make it necessary to place orders with US suppliers, which resulted in long wait times between order and delivery.
Air Pollution Exposure. Although data on air pollution was unavailable at baseline in 2011, our team conducted air sampling of particle air pollution (PM2.5, particulate matter <2.5µm in diameter) during the second, third and fourth year follow-up periods at locations in and around Port au Prince, as well as both inside and outside the case study factories. The data collected during 2012-2013 site visits was the focus of an academic paper, the first in the scientific literature to describe air quality in Haiti (Davis and Rappaport 2014).
Exposure to PM2.5 has been linked to negative cardiovascular and respiratory health effects, and can be especially harmful to asthmatics, children and the elderly. For this reason, the World Health Organization recommends that background concentrations of PM2.5 not exceed 25µg/m3 over a 24 hour period (WHO 2006) and the US Environmental Protection Agency (EPA) limits PM2.5 to 35 µg/m3 over a similar 24 hour period (US EPA 2012). The EPA further characterizes air pollution into an Air Quality Index (AQI; EPA 2015) that illustrates gradations of potential negative health effects: Good, Moderate, Unhealthy for Certain Populations, Unhealthy, Very Unhealthy and Hazardous.
Filter samples were used to collect PM2.5 in 2012 and the values reported in Table 16.5 are scaled to approximate an average eight-hour work day. In 2013 and 2015, PM2.5 was observed using a real-time monitor (Dustrak II 8530, TSI Inc.) and values are reported as the geometric mean of
329 | P a g e
the sampling periods.44 These data along with the matching AQI designations are provided in Table 16.5.
Although substantial improvements in air quality was observed in Port au Prince traffic over the study period, PM2.5 levels remain alarming and continue to represent an extraordinary air pollution hotspot for commuting workers and the general population in the country. In 2015, GPS data were collected alongside the real-time PM2.5 data to provide location-specific details along the Port au Prince road network. An analysis of the detailed data by the project team is ongoing, and will be the focus of a separate academic paper.
The background monitoring of PM2.5 on the outskirts of Port au Prince in Petion-Ville produced similar results across the study period; however, all values remain above both EPA and WHO 24-hour standards. Levels observed in 2015 at a Port au Prince background site located in close proximity to the SONAPI industrial park were 50 percent higher than nearby Petion-Ville. Most alarming of the background samples observed during the 2015 assessment were levels observed at the perimeter of an apparel factory adjacent to the Cite Soleil slum in Port au Prince. In the context of the existing literature on air quality in the developing world, PM2.5 levels near Cite Soleil are higher than those observed in a study of rickshaw drivers in New Delhi, India in 2010 (190 µg/m3; Apte et al. 2011). To further illustrate this problem area, Figure 16.6 provides a snapshot of the real-time data collected for Cite Soleil. For comparison purposes, Figure 16.6 also includes the AQI designation for ‘Hazardous’ (most dangerous EPA category), as well as the annual average reported for Beijing, China in 2014 (85.9 µg/m3; China Daily 2015), a level surpassed by all data points collected near Cite Soleil. Cite Soleil is home to a large number of Port au Prince apparel workers and exposure to such high levels of air pollution near their residence will undoubtedly impact factories through increased absenteeism and lower worker productivity.
PM2.5 levels inside apparel factories also showed similarly elevated concentrations across the study period, while 2015 levels remained over four times higher than PM2.5 observed at busy loading docks of US trucking terminals in the early 2000s (Davis et al. 2006). Figure 16.7 provides an example snapshot from a case factory observed in 2015 and for comparison purposes includes a benchmark for average levels at Mexico City industrial sites in the early 2000s (50.8 µg/m3; Vega et al. 2004). Also noted in Figure 16.7 is a brief period at the fence line where a neighboring factory was running a diesel generator opposite the perimeter. At this specific location, levels were over 4.5 times higher than the median value observed over the entire survey period at this factory. It is important to note that this area was located immediately adjacent to an open bay door near the case study factory packing station, suggesting that this brief snapshot provides an approximation of occupational exposure during the work day for workers in that part of the factory when the generator is running.
Unlike the source profile of many high pollution international locations, such as New Delhi and Beijing, industrial sources in Haiti are not sufficiently active to represent a major contributing 44 A geometric mean is a formula for central tendency that provides a general approximation of the median. It is commonly reported for environmental data to control for the high number of outlier observations.
330 | P a g e
source of air pollution in the country. Specific to the apparel industry, the primary sources of localized air pollution come from the use of diesel generators and trash/scrap boilers onsite, as well as mobile-source emissions from diesel transport trucks. When these activities are concentrated in a small area, such as the case for industrial parks with multiple factories, it can contribute significantly to localized air quality problems. However, most of the poor air quality observed in Haiti represents a more complicated mix of non-industrial sources. For example, the poor transportation infrastructure results in a congested mix of old polluting vehicles that idle and clog the densely populated urban areas. As a consequence of the 2010 earthquake, rebuilding efforts related to demolition, construction, and increased vehicular traffic also contribute to air quality problems. The poorly functioning electricity grid requires an intense reliance on diesel generators to fill in supply gaps in the industrial, commercial and residential sectors.
To further complicate matters, residential biomass burning is prolific in Haiti, where 70 percent of energy consumption is estimated to originate from charcoal and firewood (USAID, 2007). Globally, biomass burning in the home represents an important contributor to ambient levels of PM, responsible for as much as 37 percent by some estimates (Chafe et al. 2014). USAID (2007) estimates that average lifespan in Haiti is 6.6 years lower due to the impacts of exposure to indoor biomass burning, and not surprisingly, acute lower respiratory illnesses present the biggest cause of mortality in Haitian children under the age of five (USAID, 2007).
Despite the potential public health threat of both indoor and outdoor air pollution on the Haitian population, air quality as a public health issue remains neglected in the country. According to USAID (2011), there is presently no air quality monitoring conducted by any national or international organization in the country, and there is no clearly defined government department that actively regulates environmental or public health concerns such as air quality. During the most recent site visit, we were able to interview an official in the resource-poor Ministry of the Environment. However, they reported no present initiatives related to air quality.
While industrial sources of air pollution are not presently a major cause for concern, the influx of foreign investment and aid in response to the earthquake has begun to concentrate industrial development in certain areas of the country, most notably in Caracol in the northeast. It is likely that new industrial development will impact local air quality through changes in the population density that will increase local biomass and charcoal consumption, vehicular and truck traffic to accommodate transportation needs of the industry and growing population, and additional solid waste and trash burning activity (USAID, 2011). Also, the impact of power generation to supply the newly industrialized areas in the northeast region has been noted as a potential source of worsening air quality (USAID, 2011). Despite these significant environmental impacts related to international investment, there is presently no plan in place to monitor changes in air quality in the densely populated capitol city of Port au Prince or in the new industrial developments in Caracol.
The environmental data collected as part of these case studies suggest that poor air quality deserves much greater attention in Haiti than it currently receives. Based on the high PM2.5
levels observed, it is very likely that air pollution is a major cause of acute and chronic worker illnesses. Although it is not surprising that air pollution concerns have been ignored given the
331 | P a g e
larger challenges related to poverty, sanitation, and infectious diseases in Haiti, it clearly is a public health threat that deserves greater attention. Given the newly focused development around Caracol, as well as high levels of residential and occupational exposures in workers, it is recommended that Better Work actively advocate for increased monitoring and reduction of air pollution sources.
Musculoskeletal Stressors. There were a number of concerns about musculoskeletal stressors related to repetitive movement and poor ergonomic conditions that were raised during both the baseline and follow-up site visits. These included the availability of break space and bathroom facilities, the training and use of proper safety equipment such as fatigue mats, and poor seating. There were no changes in 2015 to the available break space or bathroom facilities and the most recently updated seating was observed in 2013. The managers are challenged by space limitations, and the large expense of meeting what they perceive as unrealistic compliance objectives. One manager described the difficulties of a recent building expansion, where the new space provided limited potential to retrofit for OSH compliance such as fire safety. The manager reported that they had to work within the building constraints to expand to the rented site.
As early as the second follow-up in 2012, all case study factories had some break space available to workers, although it varied greatly in quality and accessibility. One factory was using an indoor converted space as a cafeteria, but it was not at the time actively used by workers because there was no food available for purchase nearby. However, during the 2013 follow-up the manager reported that the break space was overflowing with workers after they contracted with local food vendors to make lunch available for purchase just outside the cafeteria door. While two factories were reportedly in the process of constructing new or re-working existing spaces to accommodate onsite cafeterias in 2013, we observed no such changes in 2015. In the SONAPI industrial park where three of the original case factories are located, discussions with government officials have been ongoing since 2012 regarding the construction of an external cafeteria that would service all workers in the park, but no further progress had been made on this project.
The use of fatigue mats and back support belts by workers was sporadic at best. In some case they are not available, but more often than not, available fatigue mats are not properly used by workers. For example, in a previous assessment we observed one factory where fatigue mats had been taped to the floor to prevent workers from kicking them out of the way. During that same factory tour, we observed workers standing to the side of these taped mats. Managers have also reported past difficulties convincing workers lifting heavy materials to use the back support belts available to them. In the 2013 assessment, new seating was available in one of the factories, and a second reported that 25 percent of chairs had been replaced in the last year. We observed no further changes to the availability of new seating to workers. Despite the earlier improvements in seating at some of the factories, the seating available to the majority of workers continues to represent a challenge, and it is not surprising that backaches were noted by managers as a major source of worker health complaints. We also observed a wide variety in the quality of flooring, from pocked and uneven surfaces with boxes blocking walkways to smooth tiling and organized spaces.
332 | P a g e
Heat Stress. In the baseline assessment, it was difficult to determine the impact of temperature on workers because there was no temperature monitoring data available. However, BWH began collecting temperature data inside the factories during the winter of 2011, providing an evaluative tool for assessing changing temperature conditions at the factories. In 2013, two of the case factories had begun collecting their own temperature monitoring data and another reported plans to start such environmental monitoring soon, all as a proactive measure to anticipate and remedy temperature issues before reaching the point of non-compliance during the BWH assessments. In the most recent assessment, two of the three visited factories collected their own temperature data. They noted that this data was useful to understand and anticipate potential compliance-related issues in their factories, as well as pinpoint specific problem buildings. The factory that chose not to do temperature monitoring frankly noted that it was pointless to collect temperature data without a plausible solution to address the problem.
Better Work recommends a 300C maximum temperature level inside the factory buildings. Although the average temperature observed inside the case study factories was 300C in 2011 (290C in 2012), half of the indoor measurements over both periods were above the recommended limit. Furthermore, 70 percent of the indoor temperature samples were higher than the outdoor temperature observed at the same time in 2011 (66 percent in 2012), while 25 percent were more than 30C higher and 17 percent were more than 50C higher in 2011. On average, temperatures in the pressing areas were the most elevated over outdoor temperature levels, with an average increase of 3.20C over the outside in 2011. This differential, along with the fact that temperature levels were already at the BW max during the cooler months of the year, confirms that heat represents a major occupational hazard in the warmer months. The temperature monitoring data for more recent periods including 2015 was not available at the time of this analysis.
Two of the factory managers suggested that temperature represents their biggest OSH challenge, particularly in the summer. This is also clear in the non-compliance statistics provided in Figure 16.5, where the percentage of factories in non-compliance with the Work Environment compliance point spikes in the October synthesis report, because the BW temperature monitoring for that report is conducted in the warmer months of the year. In the April synthesis reports, non-compliance is typically down significantly.
Given the magnitude of the problem, managers reported experimenting with a number of solutions to varying degrees of success. All of the factories had switched or were anticipating a switch to LEED lighting, which in addition to using less energy also generates less heat. Other solutions included water sprinkling, painting the roofs and fans, including large exhaust fans installed on the rooftops of the buildings. The managers described some success with these solutions, reducing temperature levels on the order of 2-40C but not enough to be compliant with temperature in the summer months.
Factories also explored more expensive solutions and one manager noted the potential for evaporative cooling similar to what they believed was in place at the new Caracol complex. Despite their willingness to experiment, this manager frankly admitted that no matter what they do, nothing short of air conditioning would allow their factory to be in compliance during the summer months. However, air conditioning as a final solution seems quite implausible, not only
333 | P a g e
for the high cost of energy but the unreliability of the power grid. There was a general frustration with BW expectations on temperature that managers believed were not feasible in Haiti’s tropical climate.
Noise Exposure. The major sources of noise exposure to workers inside the apparel factories were identified as the operation of machinery, especially older sewing machines and the diesel generators. Poorly constructed buildings and the lack of wall and roof insulation were noted to contribute to high levels of indoor noise. However, updated sewing equipment was observed to substantially improve noise in a factory observed in 2015. Although the new equipment purchases were the result of an upgrade in fabric and design techniques and not specifically implemented to target OSH, it had the co-benefit of reducing noise exposure along with other OSH benefits such as improved safety features.
In the baseline assessment, it was difficult to determine the impact of noise on workers because there was no noise monitoring data available. However, BWH began collecting noise data inside the factories in 2011, providing an evaluative tool for assessing the potential impact of occupational noise at the factories. In 2013, two of the case factories had begun collecting their own noise monitoring data and another reported plans to start such environmental monitoring soon, all as a proactive measure to anticipate and remedy noise issues before reaching the point of non-compliance during the BWH assessments. In the most recent assessment, two of the three visited factories collected noise data. The factory that chose not to do noise monitoring did not believe that noise was an issue, and therefore relied on BW to collect it for them.
BW recommends a 90 decibel (dB) limit for noise, and average noise levels collected by BW EA’s and aggregated across all of factories and work locations was just under this at 89dB in 2011. During this same monitoring campaign, two of the five factories recorded average noise levels above that limit, although it is unclear whether noise data from the loudest recorded factory might have been due to the music played over the loudspeakers for workers. Not surprisingly, the 2011 data singled out the sewing area as the loudest work space on average across the factories, with estimated average noise levels above the BW limit (92.5dB). In 2012, the noise monitoring data showed much improvement. Although a handful of individual noise observations at the case study factories continued to remain above the BW limit, all average work area levels (including the sewing area) were now below the recommended 90dB. The noise monitoring data for more recent periods including 2015 was not available at the time of this analysis.
Critical improvements in noise over the study period are likely the result of two major factors. First, as factories become more aware of this issue as a result of non-compliance during the first round of monitoring, they took basic remedial measures such as limiting noise from the loudspeakers or making changes to equipment locations. This point was reinforced by two factories that reported to have stopped or limited music over the loudspeakers in an attempt to reduce ambient noise. Second, the replacement of old machines noted to have occurred at a number of the factories had a positive impact on decreasing noise levels at these factories. As factories continue to react to BWH non-compliance points and replace old machinery, it is likely that the positive trend in noise reduction will continue.
334 | P a g e
Preliminary Recommendations and Conclusions. This report combines multiple sources of information about trends in OSH over the period of Better Work involvement in the Haitian apparel sector to paint a more complete picture of the impact of BWH in promoting OSH change within the sector. We describe the results of four years of case interviews and factory tours, combined with quantitative data from computerized manager and worker surveys and five years of BWH compliance assessment reports to identify both realized and potential OSH changes specific to Better Work’s involvement in Haiti.
We observed significant change in the apparel sector in 2015 over previous years. The economy was improving and managers were generally optimistic about the future of the industry despite continued uncertainty over labor relations and the minimum wage. Investments in infrastructure, building expansion, and quality upgrades to the garments and production processes were occurring, with particularly rapid growth to the supporting infrastructure in Caracol. Much of the growth in the sector provides important co-benefits to OSH, as equipment upgrades and infrastructure improvements represent critical areas of lagging OSH compliance for factories. This accelerated pace of change is in contrast to the case study results of previous years, where the economic climate and recession along with intense debate and uncertainty over the minimum wage had appeared to dampen manager optimism and investment prospects for the industry, at least within the case study factories we observed over this time period. For this reason, the fifth and final round of site visits schedule to occur in 2016 will be essential to understanding the impetus for these changes and improvements, and to evaluate the role of Better Work Haiti in facilitating them. The following represent a few examples of important details to be explored in the final year of this longitudinal study:
• Changes and upgrades to higher value-added product lines • Growth within and around the Caracol compound • Infrastructure improvements inside the factories, both rented and factory owned spaces • Infrastructure improvements to the government owned industrial parks, including cafeteria
space and building upgrades • Changes to the availability of accident and illness databases, particularly at the case factory
implementing the new computerized reporting system • Continued role of economic climate and government programs as a mitigating factors in
OSH improvements • Progress and impact of the Better Work new service delivery model and ILO-MAST
program • Impact of new worker-manager communication forums, including the Social Dialogue Table
across factories, and PICCs and OSH committees within factories • Continued impact of minimum wage debate and labor relations
Although a final series of conclusions and recommendations to Better Work will be developed at the conclusion of the case study project in 2016, the following represents preliminary recommendations that Better Work might find useful before the end of the study period.
Continue to support efforts to increase worker-management communication through peaceful unionization efforts, OSH committees, PICCs, and the Social Dialogue Table.
335 | P a g e
Given the level of mistrust between workers and management, as well as Haiti’s troubled past of labor-related violence, it is essential that BWH continue to facilitate communication between workers and managers in a way that supports both worker participation and the growth of the industry. It is essential that workers contribute to the discussion about safety in the factories, and that they have a forum for presenting their OSH concerns to management in a peaceful fashion.
Support environmental data collection efforts so that future assessments can evaluate critical improvements in Work Environment conditions. Noise and temperature data are now available across multiple years, although not all factories routinely collect these data outside the Better Work evaluation periods. These environmental data are necessary to understand changes in working conditions inside apparel factories, particularly as it relates to temperature as a lagging source of non-compliance. It is clear that temperature remains an important problem in the summer months, and seasonal fluctuations in non-compliance in the Work Environment category reflect the continuing problem with heat. It is important for Better Work to facilitate collaboration and technology transfer across factories, and to support feasible low cost solutions to improve compliance rates in this category across the calendar year.
Limited air quality data are now available that provide suggestive evidence of an important public health threat to workers and the general public in Haiti. Better Work should facilitate and support the routine collection of air quality data and the development of potential mitigation strategies to reduce airborne particulate matter exposure in and around the industrial complexes.
Facilitate the development of a reporting system for accidents, illnesses, and absenteeism among factory workers. These data are critical to understanding OSH conditions at the factories, and with a few notable exceptions, the data reporting systems needed to track illnesses, absenteeism, and accidents related to work hazards are not present. This information is essential to understanding changes in OSH conditions over time, and it is recommended that BWH support a uniform reporting framework for accidents, illnesses, and absenteeism across the factories.
Continue to provide frequent OSH training opportunities for both managers and workers. These efforts are essential to improving the human capital needed to support long-term change in OSH in the Haitian apparel industry, especially in light of the high turnover rates among both managers and workers. A particular training gap was noted in 2015 in the form of newly appointed union representatives, who presently lack training in both OSH and in their rights and responsibilities as representatives. It will be important for Better Work to provide targeted training to these union representatives, particularly in light of increasing union activity in the factories.
Facilitate communication between the Haitian government and apparel factories in a way that promotes the growth of the industry. Physical space limitations in government owned buildings and industrial parks represent critical challenges to apparel factories operating in Haiti. In many cases, factories are unable and/or unwilling to make expensive retrofits to government owned buildings needed to come into OSH compliance (i.e. bathroom and cafeteria spaces). Managers also expressed concern over inconsistent or confusing interpretations of Haitian labor laws, as well as differences in national and international labor laws that put factories at a
336 | P a g e
competitive disadvantage. They also noted that some mandates under national and international labor laws are simply not feasible in Haiti (i.e. temperature, required number of medical staff). Better Work might help facilitate discussions between the relevant government officials and factory managers in a manner similar to their ongoing work to support improved worker and manager communication.
Expand the current maternity protection training to all factories, and incorporate occupational safety into the curriculum. It continues to be a recommendation of this case study to promote official pregnancy policies at the factories to ensure pregnant workers are not unnecessarily exposed to potential hazards, such as chemicals and printing processes, as well as machine vibration, noise and air pollution exposure.
Facilitate access to safety equipment and replacement parts by supporting communication among factories and suppliers. Managers expressed concern over long wait times to purchase and/or repair basic safety features due to a lack of local suppliers. Better Work might support communication among factories and suppliers to reduce costs and wait times, such as through group purchasing of safety equipment and improved access to low cost suppliers.
Explore the impact of piece rate pay on OSH perception and behavior. The impact of the piece rate pay system on OSH perceptions and behaviors deserves greater attention, as there is evidence to suggest that risk-taking behaviors may increase under incentivized pay structures. This may be particularly important to the case of the Haitian apparel industry, where the link between profits and incentive pay is less certain and incentivized pay has the potential to negatively impact both OSH and profit outcomes.
337 | P a g e
Figure 16.5 Percent Non-Compliance on OSH Compliance Points
Chemicals and Hazardous Substances Emergency Preparedness
OSH Management Systems Health Services and First Aid
0
20
40
60
80
100
All BW factories Case study factories
0
20
40
60
80
100
All BW factories Case study factories
0
20
40
60
80
100
All BW factories Case study factories
828486889092949698
100
All BW factories Case study factories
338 | P a g e
Working Environment Welfare Facilities
Worker Protection Employees Earning > 300 Gourdes
Case Study Factories Only
0
20
40
60
80
100
All BW factories Case study factories
75
80
85
90
95
100
All BW factories Case study factories
0
20
40
60
80
100
All BW factories Case study factories
0%
10%
20%
30%
40%
50%
60%
Oct-13 Apr-14 Oct-14 Apr-15
% employees earning at least 300 gourdesper day
339 | P a g e
Figure 16.6 Background Snapshot at Perimeter of Apparel Factory near Cite Soleil – May 26, 2015
0
500
1000
1500
2000
2500
3000
11:1
8:39
AM
11:3
9:02
AM
12:2
6:41
PM
11:5
9:16
AM
12:3
8:38
PM
12:3
1:18
PM
12:0
6:44
PM
11:2
2:10
AM
12:3
0:49
PM
11:5
1:39
AM
12:3
5:26
PM
12:4
6:59
PM
11:4
1:37
AM
12:0
3:52
PM
11:1
7:03
AM
12:0
8:47
PM
11:4
2:14
AM
12:2
8:36
PM
12:4
8:05
PM
12:0
9:06
PM
12:4
5:20
PM
12:3
9:58
PM
12:3
6:30
PM
12:0
6:36
PM
12:1
9:00
PM
11:2
9:01
AM
12:1
4:48
PM
12:4
6:12
PM
11:5
0:55
AM
12:3
8:28
PM
11:5
6:15
AM
11:4
3:07
AM
11:2
2:17
AM
12:2
0:54
PM
PM 2.5 Beijing 2014 average EPA designation 'Hazardous'
340 | P a g e
Figure 16.7 Factory Snapshot during Tour of Port au Prince Case Study Location – May 26, 2015
0
50
100
150
200
250
300
350
9:44
:06
AM9:
44:5
4 AM
9:45
:42
AM9:
46:3
0 AM
9:47
:18
AM9:
48:0
6 AM
9:48
:54
AM9:
49:4
2 AM
9:50
:30
AM9:
51:1
8 AM
9:52
:06
AM9:
52:5
4 AM
9:53
:42
AM9:
54:3
0 AM
9:55
:18
AM9:
56:0
6 AM
9:56
:54
AM9:
57:4
2 AM
9:58
:30
AM9:
59:1
8 AM
10:0
0:06
AM
10:0
0:54
AM
10:0
1:42
AM
10:0
2:30
AM
10:0
3:18
AM
10:0
4:06
AM
10:0
4:54
AM
10:0
5:42
AM
10:0
6:30
AM
10:0
7:18
AM
10:0
8:06
AM
10:0
8:54
AM
10:0
9:42
AM
PM 2.5 PAP Factory Mexico City Industrial Park Average
341 | P a g e
Table 16.2 Number of Case Study Factories Participating in OSH-related Training since
Previous Case Study Report
Assessment cycle OSH content related training
OSH committee training
PICC training
NO OSH-specific training
Oct 2013 6 1 1 1 April 2014 5 3 2 0 Oct 2014 6 0 5 1 April 2015 4 1 4 1
342 | P a g e
Table 16.3 Manager Survey Results for All BWH Factories Concern about
dangerous equipment or machinery
Concern about accidents or injuries
Concern about dusty or polluted air
Concern about bad chemical smells
Concern that factory is too hot or too cold
2011 (n=264)
2012 (n=121)
2011 (n=259)
2012 (n=121)
2011 (n=234)
2012 (n=91)
2011 (n=234)
2012 (n=91)
2011 (n=264)
2012 (n=121)
No, not a concern 13% 50% 12% 45% 34% 100% 34% 69% 25% 45% Yes, discussed among co-workers 15% 0% 23% 0% 12% 0% 17% 0% 16% 0% Yes, discussed between workers and supervisors 75% 50% 77% 55% 66% 0% 66% 31% 64% 55% Yes, discussed between workers and trade union representative 0% 0% 0% 0% 0% 0% 0% 0% 0% 0% Yes, some workers threatened to quit 11% 0% 0% 0% 0% 0% 0% 0% 0% 0% Yes, some workers threatened a strike 0% 0% 0% 0% 0% 0% 0% 0% 0% 0% Yes, caused a strike 0% 0% 0% 0% 0% 0% 0% 0% 0% 0%
343 | P a g e
Table 16.4 Worker Survey Results for All BWH Factories Concern about
Yes, discussed with supervisor or manager 6% 7% 2% 1% 4% 8% 1% 1%
0%
0%
Yes, discussed with trade union representative 0% 2% 0% 0% 0% 1% 0% 1%
0%
0%
Yes, considered quitting 2% 2% 1% 0% 1% 1% 0% 2%
0%
0%
Yes, threatened a strike 1% 0% 0% 0% 0% 1% 0% 0%
0%
0%
Yes, caused a strike 1% 0% 0% 1% 0% 0% 0% 0%
0%
0%
% of sample no affirmative response 40% 50% 35% 58% 39% 49% 70% 57% 100% 100%
344 | P a g e
Table 16.5 PM2.5 Concentrations across Locations in Haiti
Geometric Mean (µg/m3)
EPA Air Quality Index Designation
Background
Petion-Ville 2012 38.7 Unhealthy for sensitive sub-groups
2013 32.9 Moderate
2015 35.1 Moderate
Port au Prince 2015 51.6 Unhealthy for sensitive sub-groups
Cite Soleil 2015 203.4 Very unhealthy Traffic-PAP
2012 260.3 Hazardous
2013 122.6 Unhealthy
2015 97.7 Unhealthy
Apparel factories
2012 50.7
Unhealthy for sensitive sub-groups
2013 49.7
Unhealthy for sensitive sub-groups
2015 69.4 Unhealthy
345 | P a g e
Haiti Case Study References
AFL-CIO, Solidarity Center. 2011. A Post Earthquake Living Wage Estimate for Apparel Workers in the SONAPI Export Processing Zone. Available at: http://www.solidaritycenter.org/Files/haiti_livingwagesnapshot030311.pdf. Accessed on October 10, 2013.
Apte JS, Kirchstetter TW, Reich AL, Deshpande SJ, Kaushik G, Chel A, et al. 2011. Concentrations of fine, ultrafine, and black carbon particles in auto-rickshaws in New Delhi India. Atmospheric Environment, 45:4470–80.
Central Intelligence Agency (CIA). 2013. The World Factbook. Available at: https://www.cia.gov/library/publications/the-world-factbook/geos/ha.html. Accessed on October 10, 2013.
Chafe ZA, Brauer M, Klimont Z, Van Dingenen R, Mehta S, Rao S, Riahi K, Dentener F, Smith KR. 2014. Household cooking with solid fuels contributes to ambient PM2.5 air pollution and the burden of disease. Environmental Health Perspectives, 122:1314–1320
Davis ME. 2011. Occupational Safety and Regulatory Compliance in US Commercial Fishing. Archives of Environmental and Occupational Health, 66(4):209-216.
Davis ME. 2011. Case Study on Occupational Safety and Health in Haiti’s Apparel Sector. Report to the International Labor Organization and Better Work, Geneva, Switzerland.
Davis ME. 2012. Occupational Safety and Health in Haiti’s Apparel Sector Second Year Follow-up. Report to the International Labor Organization and Better Work, Geneva, Switzerland.
Davis ME. 2013. Occupational Safety and Health in Haiti’s Apparel Sector Third Year Follow-up. Report to the International Labor Organization and Better Work, Geneva, Switzerland.
Davis ME. 2012. Perceptions of Occupational Risk by US Commercial Fishermen. Marine Policy, 36:28-33.
Davis, ME and A Rappaport. 2014. Air Quality in Developing World Disaster and Conflict Zones – The Case of Post-Earthquake Haiti. Science of the Total Environment, 496:22-25.
Davis ME, Smith TJ, Laden F, Hart JE, Ryan LM, Garshick E. 2006. Modeling Particle Exposure in U.S. Trucking Terminals. Environmental Science and Technology, 40:4226-4232.
European Agency for Safety and Health at Work. Occupational Safety and Health in the Textiles Sector. Available at: http://osha.europa.eu/en/publications/e-facts/efact30. Accessed on January 25, 2011.
Farmer, P. 2006. The Uses of Haiti. Common Courage Press: Monroe, Maine.
346 | P a g e
International Labour Office (ILO). October 2010. Better Work Haiti: Garment Industry: 1st Biannual Report under the HOPE II Legislation. International Labour Office, International Finance Corporation, Geneva, Switzerland.
International Labour Office (ILO). April 2011a. Better Work Haiti: Garment Industry: 2nd Biannual Report under the HOPE II Legislation. International Labour Office, International Finance Corporation, Geneva, Switzerland.
International Labour Office (ILO). October 2011b. Better Work Haiti: Garment Industry: 3rd Biannual Report under the HOPE II Legislation. International Labour Office, International Finance Corporation, Geneva, Switzerland.
International Labour Office (ILO). April 2012a. Better Work Haiti: Garment Industry: 4th Biannual Report under the HOPE II Legislation. International Labour Office, International Finance Corporation, Geneva, Switzerland.
International Labour Office (ILO). April 2012b. Better Work Haiti: Garment Industry: 5th Biannual Report under the HOPE II Legislation. International Labour Office, International Finance Corporation, Geneva, Switzerland.
International Labour Office (ILO). April 2013a. Better Work Haiti: Garment Industry: 6th Biannual Report under the HOPE II Legislation. International Labour Office, International Finance Corporation, Geneva, Switzerland.
International Labour Office (ILO). April 2013b. Better Work Haiti: Garment Industry: 7th Biannual Report under the HOPE II Legislation. International Labour Office, International Finance Corporation, Geneva, Switzerland.
International Labour Office (ILO). April 2014a. Better Work Haiti: Garment Industry: 8th Biannual Report under the HOPE II Legislation. International Labour Office, International Finance Corporation, Geneva, Switzerland.
International Labour Office (ILO). April 2014b. Better Work Haiti: Garment Industry: 9th Biannual Report under the HOPE II Legislation. International Labour Office, International Finance Corporation, Geneva, Switzerland.
International Labour Office (ILO). April 2015. Better Work Haiti: Garment Industry: 10th Biannual Report under the HOPE II Legislation. International Labour Office, International Finance Corporation, Geneva, Switzerland.
Jadotte E. 2012. Brain Drain, Brain Circulation and Diaspora Networks in Haiti. UNCTAD The Least Developed Countries Report 2012. Available at: http://unctad.org/en/PublicationsLibrary/ldcr2012-bp1.pdf. Accessed on October 10, 2013.
Johansson M, Partenen T. 2002. Role of Trade Unions in Workplace Health Promotion. International Journal of Health Services, 32(1): 179-193.
347 | P a g e
Jinran Z. 2015. Beijing renews effort to reduce PM2.5, other airborne pollutants. China Daily. Available at: http://www.chinadaily.com.cn/beijing/2015-01/05/content_20935151.htm. Accessed on June 29, 2015.
Joubert, DM. 2002. Occupational Health Challenges and Success in Developing Countries: A South African Perspective. Int J Occup Environ Health, 8:119-124.
LaDou J. 2003. International Occupational Health. Int J Hyg Environ Health, 206: 303-313.
Lazear, Edward P., 2000. Performance Pay and Productivity. American Economic Review, 90(5):1346-1361.
Lin X, Babbitt L, and D Brown. 2014. Sexual Harassment in the Workplace: How Does It Affect Firm Performance and Profits. Better Work Discussion Paper Series: No. 16. International Labour Office, Geneva.
Mortimore M. 2002. When Does Apparel Become a Peril? On the Nature of Industrialization in the Caribbean Basin in Free Trade and Uneven Development: The North American Apparel Industry after NAFTA, ed Gereffi G, Spener D, Bair J. Temple University Press, Philadelphia.
Partanen TJ, Loria-Bolanos R, Wesseling C, Castillo C, Johansson KM. 2005. Perspectives for Workplace Health Promotion in Latin America and the Caribbean. Int J Occup Environ Health, 11:313-321.
Rappaport, A. 2013. Innovation Case Study. Report to the International Labor Organization and Better Work, Geneva, Switzerland.
Rappaport, A. 2015 in progress. Innovation Case Study Follow-Up. Report to the International Labor Organization and Better Work, Geneva, Switzerland.
Rourke E. 2014. Is There a Business Case Against Verbal Abuse? Incentive Structure, Verbal Abuse, Productivity and Profits in Garment Factories. Better Work Discussion Paper Series: No. 15. International Labour Office, Geneva.
Sanchez-Ancochea D. 2006. Development Trajectories and New Comparative Advantages: Costa Rica and the Dominican Republic under Globalization. World Development, 34(6):996-1015.
Schrank A. 2004. Ready-to-Wear Development? Foreign Investment, Technology Transfer, and Learning by Watching in the Apparel Trade. Social Forces, 83(1): 123-156.
Truskinovsky Y, Rubin J, and D Brown. 2014. Sexual Harassment in Garment Factories: Firm Structure, Organizational Culture and Incentive Systems. Better Work Discussion Paper Series: No. 14. International Labour Office, Geneva.
United States Agency for International Development (USAID). 2007. Environmental vulnerability in Haiti: findings and recommendations. Available at: http://www.wilsoncenter.org/sites/default/files/Haiti_Final.pdf. Accessed on January 8, 2014.
348 | P a g e
United States Agency for International Development (USAID). 2011. Environmental assessment of the USAID/Haiti north park power project. Available at: http://www.ute.gouv.ht/caracol/images/stories/docs/environmental%20assessment%20of%20the%20usaidhaiti%20north%20park%20power%20project.pdf. Accessed on January 14, 2014.
United States Department of Labor, Occupational Safety and Health Administration. Safety and Health Topics: Textiles. Available at: http://www.osha.gov/SLTC/textiles/index.html. Accessed on January 25, 2011.
United States Environmental Protection Agency (US EPA). 2012. National Ambient Air Quality Standards. Available at: http://www.epa.gov/air/criteria.html. Accessed on May 30, 2012.
Vega E, Reyes E, Ruiz H, Garcia J, Sanchez G, Martinez-Villa G, et al. 2004. Analysis of PM2.5 and PM10 in the Atmosphere of Mexico City during 2000-2002. Journal of the Air and Waste Management Association, 54:786-798.
World Health Organization (WHO). 2006. WHO Air quality guidelines for particulate matter, ozone, nitrogen dioxide and sulfur dioxide. Available at: http://whqlibdoc.who.int/hq/2006/WHO_SDE_PHE_OEH_06.02_eng.pdf. Accessed on May 30, 2012.
349 | P a g e
Chapter 17 Conclusions
17.1 Identification Strategy. The impact evaluation of Better Work originally envisioned recruiting 300 Vietnamese apparel factories to a program with the capacity to implement Better Work in 100 factories each year. A baseline would be collected on all factories. Each year, 100 factories would be selected to begin Better Work. Unfortunately for identification, over-subscription never occurred. An alternative experimental design was then developed. Enterprise assessments occur on average once per year, but there is a window of 10 to 13 months in which an unannounced annual assessment might occur. To provide a second layer of identification, participating firms would be randomly assigned to the month for a data collection following an assessment. Therefore, the timing of the assessment itself would be quasi-random and the time that elapsed between an assessment and a data collection would be random.
Treatment effects are estimated on a range of outcome variables. One treatment variable is included for each assessment cycle and one dose variable, indicating the number of months that have elapsed since the most recent previous assessment, for each assessment cycle are analyzed. Regressions are controlled for demographic and factory characteristics where appropriate. Equations are estimated using a panel estimator, with month and your controls. The estimated coefficients of the cycle and dose variables are the difference in difference treatment effects.
In chapters in which the mediating role of Better Work or gender is under consideration, the treatment variables are interacted with the mediating variable.
17.2 Compliance Trends. Trends in compliance among Better Work factories in Vietnam, Indonesia, Jordan and Haiti are evaluated using enterprise assessment data in conjunction to the Better Work annual Compliance Synthesis Reports. Country variation is observed in areas of high noncompliance and compliance trends. Overall, there is zero to very little evidence of noncompliance in questions regarding Child Labour across all countries. The same holds true for Forced Labor, with the exception of questions relating to migrant workers in Jordan. In general, noncompliance is common in areas of OSH, Compensation and Working Time, though there is some variation in trends for individual questions under the cluster.
Vietnam. High compliance is found in questions under Child Labour, Forced Labour and Discrimination. Noncompliance in question regarding age verification declines from 24 percent in the 1st cycle to 2 percent in the 4th cycle. A positive trend is observed in Compensation, where noncompliance in sick leave and maternity leave falls from 94 percent to 49 percent in cycle 4. The FACB does not show any significant trend. The overall noncompliance in the OSH cluster is high, but the trends in individual questions are more varied. There is very minimal improvement in Working Time and noncompliance regarding overtime continues to be an issue as 80 percent of the firms are found noncompliant in cycles 3 and 4. Improvement in work time records is observed, where noncompliance falls from 50 percent in cycle 1 to 30 percent in cycle 4. Indonesia. High levels of noncompliance are persistent in several categories under OSH, including 100 percent noncompliance in ensuring building safety and maintaining legal permits. Full compliance was achieved and sustained in posting safety signs, having a written OSH policy and requirements on HIV/AIDs. Though factories continue to be noncompliant, evidence for a trend towards compliance is observed in some OSH questions, including creation of an OSH committee and provision of healthcare benefits among others. In contrast, a trend towards
350 | P a g e
noncompliance is observed in some OSH questions. This includes the increase in noncompliance in adequately trained first aid officers from 20 percent in cycle 1 to 70 percent in cycle 3. In regards of Compensation and Working Time, full compliance is achieved in areas including correct pay for overtime, voluntary overtime, pay on public holidays and pay for personal leave, while noncompliance persisted in accurate time records and overtime hours. In cycle 3, 55 percent remained noncompliant in overtime hours. A trend towards noncompliance is observed in regards to maternity leave. Increase in noncompliance rates are observed for questions under CHR, including requirements for sub-contracted workers, benefits for resigned or terminated workers and legal disciplinary measures. Under FACB, factories continue to remain noncompliant in keeping workers adequately informed about the CBA. Jordan. High levels of noncompliance are observed in the areas of Compensation, CHR and OSH relating to migrant works. In questions regarding factory-provided accommodation and unauthorized fees, there is a trend towards noncompliance. All factories are found noncompliant in providing accommodation adequately protected against disease carrying animals and adequately ventilation. The number of workers who have paid unauthorized fee increases from 54 to 62 percent by cycle 4. This continues to be a pressing issue since this has implications for human trafficking and forced labor. A positive trend is observed in question relating to work permit and residence ID, with 5 percent of factories remaining noncompliant in cycle 4. A drastic improvement is seen in factories regarding hiring of disabled workers, with only 20 percent of factories noncompliant in cycle 4. The compliance trends in OSH are varied. In cycle 4, 65 percent did not have aisles or emergency exists accessible during working hours, 30 percent did not provide necessary protective clothing and equipment and 100 percent noncompliant in training workers to use machines safely. A trend towards compliance is observed in questions regarding forming an OSH committee and most importantly, in maintaining acceptable temperatures. In cycle 4, there is zero noncompliance in temperature standards. Effects if the 2013 amendments to the CBA are yet to be observed on the factory floor. Haiti. Compensation, CHR and Working Time continue to be areas of high noncompliance. Improvements are often followed by reversal to initial state of noncompliance. There is a positive trend for the question of correct pay for weekly rests, noncompliance falling from 40 percent to zero between cycle 1 and 2, but the trend is reversed with noncompliance ranging between 15 to 25 percent. Similar patterns are present for pay on annual leave, sick leave and maternity leave. Improvements are observed in the provision of daily breaks and unauthorized deductions. There is significant improvement in union access to works, with no findings of noncompliance from cycle 5 onward.
17.3 Occupational Safety and Health. Questions related to occupational safety and health (OSH) from the worker survey are analyzed. Better Work treatment effect is evaluated separately for each country program.
Vietnam. Among health symptoms, workers most commonly report headache, backache, dizziness and fatigue. Workers also show concern with temperature in the factory. Small treatment effects are detected for fatigue, with a decline of 0.05 on a 4-point scale, and stomach pain, with a 0.19 decline on a 4-point scale at the 5th assessment. A small improvement in perception of water quality is observed, with a 0.18 increase on a 4-point scale at the 5th assessment. There is a small decline in the proportion of workers reporting concerns with chemical smells, 0.05 decline at the 5th assessment.
351 | P a g e
Indonesia. Commonly reported health symptoms include fatigue, dizziness, headache and stomachache, with a higher frequency than in Vietnam. A treatment effect is observed only in the proportion of workers concerned with injuries, a decline by 0.24 points at the 3rd assessment.
Jordan. Fatigue, headache, thirst and hunger are the most commonly reported health concerns. Workers also report high concerns with working conditions, with 80 percent reporting concerns with injury. Sustained treatment effects are observed for headache (-0.59), hunger (-0.78), thirst (-0.37) and water satisfaction (0.36), rated on a 4-point scale. The proportion of workers with injury concerns declines by -0.32 at the 6th assessment.
Haiti. Workers most commonly report thirst, headache, fatigue and hunger. Workers also report significant concerns with work safety. No systematic treatment effect is observed.
17.4 Nicaragua. Empirical evidence indicates a strong but focused Program effect for Better Work Nicaragua. Mental health improves after the first and second assessments. Workers are less likely to feel restless and sad. However, the beneficial effects dissipate. In the months following the 3rd assessments workers are more likely to report bouts of crying.
BWN does not increase union membership or increase the role of unions in solving problems within the factory. However, by the 3rd assessment, workers are more likely to feel comfortable seeking help from their supervisor and no longer believe that joining a union will lead to employment termination.
BWN has a significant effect on pay practices. By the 3rd assessment, workers are less likely to be concerned with late payments, low wages and a broken punch clock. Workers in BWN factories are less likely to be injured at work.
Worker concerns with excess overtime decline, with the strongest effect at the 3rd assessment. Payment practices with regard to overtime improve. At the 2nd assessment, factories that were not paying for overtime transition to paying for overtime but only after the production target is complete. At the 3rd assessment, factories are more likely to pay overtime for hours above 48 per week.
BWN initially had a significant effect on pay. At the 2nd assessment, weekly pay increased by USD 16.42. However, the effect dissipated by the 3rd assessment. Importantly, there is reduced gender discrimination in wages by the 3rd cycle.
BWN reduced hours in the period between the 1st and 2nd assessments. However, the effect dissipated after the second assessment. BWN reduced the gender disparity in hours worked between the 1st and 2nd assessments. Female employees report working 3.282 fewer hours per week than male employees. However, the effect dissipates between the second and 3rd assessments.
17.5 Verbal Abuse. Analyzing the model of verbal abuse developed by Rourke (2014), the empirical analysis supports the finding that the two major determinants of verbal abuse are misaligned incentive structures and psychological stressors. Verbal abuse is most likely to occur in factories where supervisors have high powered incentives and workers have low powered incentives. Furthermore, supervisor stress and factory characteristics, such as whether the factory is under a CBA, play significant roles in increasing and deterring verbal abuse.
352 | P a g e
Verbal abuse is common in Better Work countries. In the baseline, some level of concern with verbal abuse is reported by 8.4 percent of Vietnamese, 78.4 percent of Indonesian, 37.4 percent of Jordanian, 60.8 percent of Haitian and 53.1 percent of Nicaraguan participants.
Better Work is found to have a significant effect on verbal abuse in Vietnam, Indonesia, Jordan and Nicaragua. In Vietnam, the Better Work treatment effect reduces the proportion of workers reporting any type of verbal abuse by 0.13 after four assessment cycles. The Better Work treatment effect for Indonesia reduces the proportion of workers reporting some form of verbal abuse by 0.14 by the 3rd assessment cycle, though there is some decay in treatment effect following the 3rd and 4th assessments. The intensity of reported verbal abuse falls by an average 1.0 on a 7-point scale by the 4th assessment, with no decay. The Better Work treatment effects for Jordan reduces the proportion of workers reporting some form of verbal abuse by 0.42 after the 5th assessment cycle and the intensity of reported verbal abuse falls by 1.4 on a 7-point scale. Haiti does not exhibit a Better Work treatment effect. While the proportion of workers reporting verbal abuse in Nicaragua does not decline, the intensity of the abuse does. At the 2nd assessment, intensity has declined by 0.85 on a 7-point scale.
The scale of the Better Work treatment effect in Vietnam, Indonesia and Jordan is very large. All three countries exhibit a secular rise in verbal abuse over time. However, the treatment effect is so strong in Vietnam and Jordan that by the 4th or 5th assessment cycle, Better Work has eliminated or greatly reduced the verbal abuse that was present at the beginning of the program and counteracted most of the secular rise.
17.6 Sexual Harassment. Analyzing the model of sexual harassment developed by Lin, Babbitt and Brown (2014), empirical analysis supports the finding that the two major determinants of sexual harassment are misaligned incentive structures and organizational norms.
Sexual harassment is common in Better Work countries. In the baseline, some level of concern with sexual harassment is reported by 2.4 percent of Vietnamese, 84.4 percent of Indonesian, 30.0 percent of Jordanian, 31.7 percent of Haitian and 29.6 percent of Nicaraguan participants.
Better Work is found to have a significant effect on sexual harassment in Vietnam, Indonesia and Jordan. In Vietnam, the Better Work treatment effect reduces reporting of any type of sexual harassment to zero after five assessment cycles. The Better Work treatment effect for Indonesia reduces the proportion of workers reporting some form of sexual harassment by 0.13 by the 3rd assessment cycle, though there is significant decay in treatment effect following the 3rd and 4th assessments. The intensity of reported sexual harassment falls by the 3rd assessment, but again with decay at the 4th assessment. The Better Work treatment effect for Jordan reduces the proportion of workers reporting some form of sexual harassment by 0.18 after the 6th assessment cycle and the intensity of reported verbal abuse falls by 0.58 on a 7-point scale.
Haiti and Nicaragua do not exhibit a Better Work treatment effect associated with duration of exposure to Better Work. However, in both cases, there is a strong pattern of secular decline in reports of sexual harassment. Between 2011 and 2015, the proportion of participants reporting any form of sexual harassment associated with year effects declined by 0.52 in Haiti. Between 2012 and 2015, the proportion of participants reporting any form of sexual harassment associated with year effects declined by 0.28 in Nicaragua. A likely explanation for the apparent secular
353 | P a g e
decline is the attention that the Better Program was bringing to the issue of sexual harassment. Therefore, it is entirely possible that Better Work had a significant effect on sexual harassment in Haiti and Nicaragua unrelated to the amount of time the firm has participated in Better Work.
17.7 Wages and Hours. Estimated Better Work Treatment effects reduced weekly hours in Vietnam by 2.5 at the 4th assessment and raised weekly pay by USD 15.33 by the 5th assessment. Indonesia exhibits a treatment effect reducing weekly hours by 3.3 and increasing weekly pay by USD 7.38 at the 4th assessment. Hours in Jordan rose, particularly for Jordanian workers. However, there is a treatment effect of JD 9.43 on weekly pay by the 6th assessment. Haiti also exhibits a treatment effect or USD 4.50 per week at the 10th assessment.
17.8 Coercion, Abuse, Human Trafficking and Deportation Threats. A theory is developed to model the choice of firms to engage in coercive behavior, including human trafficking, abusive treatment and deportation threat. The theory is tested employing data from Jordan and the impact of Better Work Jordan on firm choice is analyzed. Findings are as follows:
1. Crying is more common in factories that are noncompliant on deportation threats. 2. When factory strategy is measured from the perspective of the worker, human
trafficking and deportation threat both predict crying. In particular, workers who are not permitted to return home report increased incidence of crying by over 1 point on a 5-point scale.
3. Abusive treatment, loss of control of passport, debt and a family not allowing a worker to return home predict a feeling of fearfulness.
4. Better Work treatment effects on incidence and crying and fear are strong and persistent. Coefficients on each Better Work cycle of inspection are negative and typically becoming larger in absolute value over time. By cycle 6, incidence of crying decline by 0.3 points on a 5-point scale.
5. Better Work also reduces the reported incidence of lack of airfare and debt as coercive factory behaviors. The proportion of workers who report that debt or lack of airfare prohibit them from returning home declines by 0.17. The proportion of workers reporting lack of control of their passport declines by 0.6.
17.9 Deceptive Pay Practices. Deceptive pay practices are modeled as the result of a prisoner’s dilemma in which firms fail to pay as promised and workers exert low effort. The prisoner’s dilemma emerges even though both the worker and the firm would be better off when firms pay as promised and the worker exerts high effort. Theoretical predictions of the model are confirmed. Workers are more likely to exert high effort in factories that share firm revenue with workers in the form of higher pay. Firms that share revenue with workers are also more likely to be compliant on pay-related points. There is some evidence that Better Work facilitated the realization of the cooperative outcome. However, Better Work mediated effects diminish at the 4th cycle. Factories may be discovering that the payoff to paying as promised is not as great as anticipated. Or, more likely, deceptive pay practices become the method of choice for inducing workers to work longer hours than they desire.
17.10 Training. See Babbitt, Voegeli and Brown (2016).
354 | P a g e
17.11 Millennium Development Goals. Better Work Nicaragua diminishes extreme hunger in the months after the second assessment. However, the beneficial effect decays in the 3rd cycle. Better Work Jordan exhibits strong treatment effects alleviating hunger. When asking workers to rate their intensity of hunger, cycles 3, 4 and 5 have negative and statistically significant coefficients. Importantly, the coefficients increase in absolute value with each passing cycle, indicating that the Program effect is sustained and no decay occurs at later stages. The coefficient of the dose2 variable is also negative and significant, indicating curing after the second assessment. There is also evidence of a decline in extreme hunger at cycle 3.
Better work Vietnam increases schooling for girls in the months following the first assessment, though the positive effects decay in subsequent cycles. However, the lack of a sustained treatment effect is not surprising given the high school attendance rates in Vietnam preceding the introduction of the Program. A similar pattern emerges for boys in Indonesia.
Better Work Haiti may have expanded access to pregnancy-related health care. Cycle7, dose9 and cycle10 treatment variables are positive and statistically significant. In the case of Vietnam, treatment effects are observed for prenatal care at the first and second assessments. The dose1 variable is positive and significant, as is cycle2. Similar effects are observed for Indonesia. More pronounced pregnancy related Program effects are in evidence for Jordan, a significant effect in light of the low incidence of pregnancy-related health care in Jordan. At the time of the 4th and 5th assessments, and for exposure to Better Work in the months after the 5th assessment, the probability of having access to both types of pregnancy care increases.
Better Work had a pronounced impact on gender disparities in pay in Haiti, Nicaragua and Vietnam. Program effects are particularly distinctive for Haiti and Vietnam. Prior to Better Work, Haitian women worked longer hours for less pay, even controlling for position and demographic characteristics.
17.12 Better Work and Firm Performance. Better Work increases the mark-up of revenue over cost by 24 percent at the 4th assessment in Vietnamese factories. Better Work also reduces the time necessary to reach the daily production target by 1.29 hour in Vietnam. Supervisory skills training lowers manpower turnover and lowers the time needed to reach an hourly production target. Buyers reward some points of compliance with larger orders. Though, order size is positively related to noncompliance on excess overtime. Better Work helps workers and firms coordinate on a high pay-high productivity equilibrium, escaping a prisoner’s dilemma of low pay and low effort. Sexual harassment and verbal abuse reduce productivity and raise wages. The only exception is trafficked workers who lack a sense of agency. Better Work helps firms reduce verbal abuse and sexual harassment. Compliance along some dimensions increases the mark up of revenue over average cost.
17.13 Sourcing Practices. Evidence from Vietnam indicates that with each passing Better Work assessment cycle, firms are increasingly likely to report that their main customer is stopping their own social audits. Firms are more likely to report that their main buyers are contacting them about their Better Work assessments. Factory managers report tougher purchasing terms by Better Work assessment cycle.
355 | P a g e
Supervisor stress, driven by sourcing practices, is a contributing factor to verbal abuse. Variations in technical requirements, variations in social compliance requirements, changes in technical requirements, late delivery penalties, defect penalties, replenishment orders and uncertain orders are all moderate drivers of manager reports of supervisor stress.
Uncertain orders, late penalties, change in technical requirements and defect penalties are rated a serious challenge by 40-50 percent of factory managers. Only 10-12 percent of factory managers do not see such issues as a business challenge.
The conflict between social compliance and sourcing is most striking when considering excess overtime. Uncertain orders make production planning which includes multiple work shifts challenging. Firms with uncertain orders employ excess overtime rather than multiple shifts to manage large orders. Over 50 percent of firms report uncertain orders as a serious business challenge. Only 14 percent of factories report that uncertain orders are not a business challenge.
Buyers appear to be rewarding firms with better compliance reports. However, while buyers may be rewarding overall compliance, there appears to be an exception for excess overtime. Buyers appear to be rewarding longer hours with larger orders.
Factory complaints with replenishment orders and late fines predict longer work hours and lower job satisfaction. Factory complaints with longer payment terms predict lower wages and lower job satisfaction.
17.14 Performance Improvement Consultative Committees (PICCs). The findings indicate that workers are generally positively impacted by the presence and quality of PICCs. Workers most strikingly benefit from a reduction in verbal abuse and health symptoms such as dizziness. The story for managers is more complicated. The mere presence of a PICC or union is not seen positively by managers. Managers become most positive about the PICCs when unions and women are fairly represented, workers are freely able to choose their representatives and when minutes of the meeting are taken and distributed to workers. Managers see PICCs less constructively when control of the PICC is passed from Better Work to a bipartite chair. And curiously, the more often the PICC meets the less likely a manager is to see the PICC as playing a constructive problem solving role.
17.15 Cambodia. Compliance in Cambodian factories trends up over each successive compliance assessment. Through public disclosure of points of noncompliance, BFC helped Cambodian firms coordinate on a high compliance equilibrium. Cambodia maintained market share after the end of the MFA as a consequence of their reputation for humane working conditions. The choice of Cambodian firms to become newly compliant after the first assessment predicts survival of the 2008-09 financial crisis. BFC achieved higher compliance than reputation sensitive buyers and improved conditions in firms lacking a reputation sensitive customer. 17.16 Haiti Case Studies. Using results from the first 4 years of a five-year longitudinal study in Haiti, two case studies on management innovation and occupational safety and health (OSH) are developed. Case companies are selected in consultation with Better Work Haiti (BWH) and with the intention to represent a wide variety of observable and documented factory characteristics.
356 | P a g e
Five companies are selected in 2011 and two more are added in 2013. The case studies use findings from the interviews conducted with factory managers and factory tours in 2011, 2013 and 2015.
For the case study on management innovation, the analytical framework is informed by interdisciplinary methods and theories explaining the relationships among innovation, sustainable development and business decisions. In 2011, the most frequently mentioned challenges included low productivity, high costs of doing business and infrastructure problems and the low quality of factory buildings. Low productivity of workers was attributed to many factors, including the condition of equipment, worker absence, communication problems, high turnover rates, and difficulty matching worker skills and new styles. An unreliable supply of electricity, difficulty with transportation and high temperatures in factory floors are cited as some major challenges. Some factories are seen using LED lighting to lower energy consumption and to lower the temperature in the workplace. Though the managers mention LED lighting has helped lower the temperature, no quantifying data was provided. Other innovations include new specialized sewing machines, a factory-based recycling program, new boiler to burn scraps and roof fans. The case companies continued to provide on-site water treatment from 2011 through 2015.
Changes also include revisions to the BWH model, including training in maternity health for the management, an annual BW visit and changes in the role of enterprise advisors. In some cases, the scope for innovation was limited or hindered by differences between the factories and their overseas owners and the resource-scare Ministry of Labour. Overall, in the face of systematic and operational challenges, factories are noted to have some capacity to innovate.
The case study on OSH is prepared using interviews with managers who are in-charge of OSH and observations from factory visits. Haiti’s apparel sector is put into context with the broader literature on developing world apparel and the case for OSH changes is drawn existing literature. OSH in Haiti is evaluated with specific concerns: toxic chemical exposure, mechanical hazards, air pollution exposure, musculoskeletal stressors, heat stress and noise exposure. Critical improvements are observed in noise exposure and new machinery.
A review of economic conditions and OSH in Haiti informs that despite a clear growth systematic challenges regarding infrastructure continue to drive up production costs. An increase in unionization among case companies is observed, from one factory in 2011 to 50 percent in 2013. Though, there continues to be a variety manager perspective on the role and capacity of unions. An important challenge and point of conflict noted is the confusion over piece pay rate under the new minimum wage law. Managers also note the contradictions between Haitian labor code and international law, which they consider is making the industry less competitive. The PICC has been slow to launch in Haiti, partly due to perceptions among workers and management. The case study is followed by preliminary recommendations.
357 | P a g e
Appendix 1 Compliance Trends Vietnam
I. Always compliant among all firms
Child Labour Are any workers under age 18 subjected to the unconditional worst forms of child labour? Compensation Does the employer pay wages directly to workers in cash or by bank transfer? Compensation Are workers paid at least once a month? Compensation Are wages paid at the workplace or other appropriate location? Compensation Does the employer pay for paternity leave when required? Contracts and Human Resources Does the factory use any homeworkers? If so, please provide details. Contracts and Human Resources
Has the employer complied with any orders to reinstate or compensate workers who were found to be unjustly terminated?
Discrimination Is there sexual harassment of workers in the workplace?
Discrimination Is the gender or marital status of the worker a factor in employer decisions regarding termination or retirement of workers?
Discrimination Is the gender or marital status of a worker a factor in decisions regarding pay?
Discrimination Is the gender or marital status of a worker a factor in decisions regarding opportunities for promotion or access to training?
Discrimination Is there harassment of workers on the basis of sexual orientation? Discrimination Is there harassment of workers on the basis of disability? Discrimination Is there harassment of workers on the basis of age?
Discrimination Is sexual orientation a factor in the employer's decisions regarding termination or retirement?
Discrimination Is sexual orientation a factor in decisions regarding pay?
Discrimination Is sexual orientation a factor in decisions regarding opportunities for promotion or access to training?
Discrimination Is sexual orientation a factor in decisions regarding conditions of work? Discrimination Is HIV/AIDS status a factor in decisions regarding pay? Discrimination Is HIV/AIDS status a factor in decisions regarding opportunities for promotion? Discrimination Is HIV/AIDS status a factor in decisions regarding conditions of work? Discrimination Is disability a factor in the employer's decisions regarding termination or retirement? Discrimination Is disability a factor in decisions regarding pay? Discrimination Is disability a factor in decisions regarding opportunities for promotion or access to training? Discrimination Is an applicant's sexual orientation a factor in hiring decisions? Discrimination Is an applicant's age a factor in hiring decisions?
Discrimination Is age a factor in the employer's decisions regarding termination, or are workers forced to retire early?
Discrimination Is age a factor in decisions regarding pay? Discrimination Is age a factor in decisions regarding opportunities for promotion or access to training? Discrimination Is age a factor in decisions regarding conditions of work?
Discrimination Is a worker's real or perceived HIV/AIDS status a factor in decisions regarding termination or retirement?
Discrimination Has the employer taken steps to enable workers who become disabled for whatever reason to retain their work?
358 | P a g e
Discrimination Has the employer taken all legally required measures to reasonably help workers with AIDS-related illnesses?
Discrimination Does the employer allow workers with AIDS-related illnesses to work for as long as medically fit in available, appropriate work?
Discrimination Do recruitment materials such as job announcements or job application forms refer to age in a manner that could discourage older workers from applying?
Discrimination Are workers harassed on the basis of their basis of real or perceived HIV/AIDS status? Discrimination Are HIV/AIDS tests required at hiring?
Discrimination Are disabled workers who apply for work evaluated according to their ability to perform the job?
Discrimination Is race, colour or origin a factor in the employer's decisions regarding termination or retirement of workers?
Discrimination Is race, colour or origin a factor in decisions regarding pay?
Discrimination Is race, colour or origin a factor in decisions regarding opportunities for promotion or access to training?
Discrimination Is race, colour or origin a factor in decisions regarding conditions of work? Discrimination Is an applicant's race, colour or origin a factor in hiring decisions?
Discrimination Do recruitment materials such as job announcements or job application forms refer to the applicant's race, colour or origin?
Discrimination Are workers harassed on the basis of their race, colour or origin? Discrimination Is religion or political opinion a factor in decisions regarding pay?
Discrimination Is religion or political opinion a factor in decisions regarding opportunities for promotion or access to training?
Discrimination Is religion or political opinion a factor in decisions regarding conditions of work? Discrimination Is an applicant's religion or political opinion a factor in hiring decisions?
Discrimination Have you found that religion or political opinion is a factor in the employer's decisions regarding termination or retirement of workers?
Discrimination Do recruitment materials such as job announcements or job application forms refer to the applicant's religion or political opinion?
Discrimination Are workers harassed on the basis of their religion or political opinion?
Forced Labour Does the employer provide non-cash benefits that make the worker so indebted to the employer that they are unable to leave?
Forced Labour Can workers who owe other types of debt to the employer freely leave their jobs?
Forced Labour Can workers who owe debts for recruitment fees to the employer and/or third party freely leave their jobs?
Forced Labour Can workers who owe debts for recruitment fees to a third party freely leave their jobs? Forced Labour Does the employer use violence or the threat of violence to intimidate workers?
Forced Labour Does the employer use threats such as deportation, cancellation of visas or reporting to the authorities in order to force workers to stay at the job?
Forced Labour Does the employer use any other coercive tactics to overwhelm workers' ability to make decisions in their own interest?
Forced Labour Does the employer require workers to work beyond the term of their contracts? Forced Labour Does the employer delay or withhold wage payments in order to coerce workers to work?
Forced Labour Are workers free to terminate their employment with reasonable notice, and to leave their jobs when their contracts expire?
Forced Labour Are workers forced to work overtime under threat of penalty? Forced Labour Are workers forced to work overtime in order to earn minimum wage and/or reach
359 | P a g e
production targets?
Forced Labour If prison labour is used, is the work carried out under the supervision and control of a public authority?
Forced Labour If prison labour is used, have the prisoners freely consented to do the work?
Forced Labour
If prison labour is used, have the prisoners freely consented to do the work; do they receive similar treatment to non-prison workers; and is the work carried out under the supervision and control of a public authority?
Forced Labour If prison labour is used, do the prisoners receive similar treatment to non-prison workers working in the factory?
Freedom of Association and Collective Bargaining
Does the employer try to undermine the union by negotiating directly with individual workers?
Freedom of Association and Collective Bargaining
Does the employer refuse to bargain collectively in accordance with legal requirements, or refuse to bargain in good faith with the union, workers representation, union federation or confederation?
Freedom of Association and Collective Bargaining
Has the employer tried to promote the formation of a workers' organisation to compete against existing union(s)?
Freedom of Association and Collective Bargaining
Has the employer tried to promote the formation of a workers' organisation to compete against existing union(s)?
Freedom of Association and Collective Bargaining
Has the employer terminated workers or not renewed their contract due to the worker's union membership or activities?
Freedom of Association and Collective Bargaining
Has the employer not renewed a worker's employment contract due to the worker's union membership or activities?
Freedom of Association and Collective Bargaining
Does the employer use blacklists to ensure that union members or union officials are not employed?
Freedom of Association and Collective Bargaining
Does the employer threaten, intimidate, or harass workers who join a union or engage in union activities?
Freedom of Association and Collective Bargaining Does the employer punish workers for joining a union or engaging in union activities? Freedom of Association and Collective Bargaining
Does the employer provide incentives to workers to keep them from joining a union or engaging in union activities?
Freedom of Association and If any strikes were not considered legal, which requirement(s) were not complied with?
360 | P a g e
Collective Bargaining Freedom of Association and Collective Bargaining How many of the strikes were legal under national law? Freedom of Association and Collective Bargaining Has the employer hired new workers to replace striking workers during a strike? Freedom of Association and Collective Bargaining
Has the employer called security guards, the police or armed forces to break up a peaceful strike or arrest striking workers?
Occupational Safety and Health
Is the accommodation separate from the workplace (even though it may be in the same compound/industrial park)?
Occupational Safety and Health
Does the employer force workers to continue working when they have refused to work due to clear imminent and serious danger to their life or health?
Working Time Does the employer comply with the entitlement to paternity leave?
II. Almost always conform with the exception of less than 2 firms in each cycle
Compensation Does the employer restrict the freedom of workers to use their wages as they choose? Compensation Does the employer pay wages directly to workers? Contracts and Human Resources Does the employer comply with requirements regarding suspension of workers' contracts? Discrimination Is the gender or marital status of a worker a factor in decisions regarding conditions of work?
Discrimination Does the employer change the employment status, position, wages, benefits or seniority of workers during maternity leave?
Discrimination Are periods of maternity leave included in a worker's period of continuous service? Discrimination Is disability a factor in decisions regarding conditions of work? Discrimination Is an applicant's real or perceived HIV/AIDS status a factor during hiring decisions? Discrimination Has the employer made required accommodations for physically disabled workers? Forced Labour Has the employer ensured that the private employment agency does not use bonded labour? Forced Labour Can workers who owe debts for recruitment fees to the employer freely leave their jobs?
Forced Labour Does the employer restrict workers' freedom to come and go from the dormitories and/or the industrial park or zone in which the factory is located?
Forced Labour Does the employer restrict workers from leaving the workplace?
Forced Labour Does the employer force workers to work to discipline them or as punishment for participation in a strike?
Forced Labour Does the employer deny workers access to their personal documents (such as birth certificates, passports, work permits and ID cards) when they need them?
Forced Labour
Does the employer force workers to work more than 4 hours overtime per day, 30 hours overtime per month, or 300 hours overtime per year by threatening dismissal or other action that would reduce their future income?
Freedom of Is the grassroots level union in the factory involved in the bargaining process at the
361 | P a g e
Association and Collective Bargaining
enterprise level?
Freedom of Association and Collective Bargaining Does the employer unreasonably limit the issues that can be negotiated? Freedom of Association and Collective Bargaining Does the employer refuse to bargain collectively with union federations and confederations? Freedom of Association and Collective Bargaining
Does the employer refuse to bargain collectively in accordance with legal requirements, or refuse to bargain in good faith with the union or provisional union?
Freedom of Association and Collective Bargaining
Does the employer consider a job applicant's union membership or union activities when hiring?
Freedom of Association and Collective Bargaining Do union representatives have access to the workers in the workplace? Occupational Safety and Health Is the accommodation protected against disease carrying animals or insects? Occupational Safety and Health Is the accommodation adequately ventilated? Occupational Safety and Health Is the accommodation adequately protected against heat, cold or dampness? Occupational Safety and Health Has the accommodation been built with noise-proof materials? Occupational Safety and Health
Does worker accommodation have adequate toilets, showers, sewage and garbage disposal systems?
Occupational Safety and Health Does worker accommodation comply with legal minimum space requirements? Occupational Safety and Health
Does the worker accommodation comply with density restrictions and green space requirements?
Occupational Safety and Health Does the accommodation provide each worker with at least 75 liters of safe water per day? Occupational Safety and Health Does the accommodation offer workers adequate privacy? Occupational Safety and Health Does the accommodation have lighting of at least 50 lux? Occupational Safety and Health Does the accommodation have adequate cooking and storage facilities? Working Time Does the employer provide required leave for personal reasons?
Working Time Does the employer comply with the entitlement to sick leave and other types of leave that are covered by social insurance?
Working Time Does the employer work overtime only for reasons allowed by law?
362 | P a g e
III. Strictly increasing compliance rate yet not fully compliant by the cycle 4
Child Labour Does the employer have a reliable system in place to verify the age of workers prior to hiring?
Child Labour Do workers who are under age 18 work more than 8 hours a day or 40 hours a week (including overtime)?
Compensation Does the employer keep only one accurate payroll record?
Compensation Does the employer pay workers correctly for all overtime hours worked on weekly rest days?
Compensation Does the employer pay workers correctly for all overtime hours worked at night?
Compensation Does the employer settle claims for sick leave and maternity leave within 3 working days?
Compensation Does the employer pay women workers for 30 minutes rest per day during their periods?
Compensation Does the employer pay at least 5% higher than the normal applicable wage level for workers who perform hazardous and dangerous work?
Contracts and Human Resources
Does the employer comply with requirements for temporary transfers of workers to new work?
Contracts and Human Resources
Does the employer comply with limits on the period of employment for probationary workers?
Contracts and Human Resources Do workers understand the terms and conditions of employment? Contracts and Human Resources Do the contracts comply with the labour law, collective agreement and work rules? Contracts and Human Resources
Do all persons who perform work for the factory, both on the premises and offsite, have a contract?
Discrimination Is an applicant's gender or marital status a factor in hiring decisions? Discrimination Do job announcements refer to the applicants gender or marital status? Freedom of Association and Collective Bargaining
Has the employer made the collective bargaining agreement publically available to all workers?
Freedom of Association and Collective Bargaining
Has the collective agreement in force been approved by more than 50% of workers covered?
Freedom of Association and Collective Bargaining Does the employer consult with unions where legally required? Freedom of Association and Collective Bargaining Has the employer tried to interfere with, manipulate, or control the union(s)? Occupational Safety and Health
Has the employer taken actions to assess, monitor, prevent and/or limit workers' exposure to hazardous chemicals?
Occupational Safety and Health
Has the employer effectively trained workers and supervisor who work with or are responsible for hazardous chemicals?
Occupational Safety and Health
Does the employer keep chemical safety records for the hazardous chemicals used in the workplace?
Occupational Safety and Health Does the employer keep an inventory of hazardous chemicals used in the workplace? Occupational Safety and Health Are chemicals and hazardous substances properly stored? Occupational Safety and Health Has the employer developed and trained workers on an emergency evacuation plan? Occupational Safety and Health Does the employer conduct at least one emergency drill per year?
363 | P a g e
Occupational Safety and Health Are there at least 2 possible exits for all workers, where required? Occupational Safety and Health Are flammable materials safely stored? Occupational Safety and Health Has the employer provided first-aid training for workers? Occupational Safety and Health Does the workplace have sufficient onsite medical facilities and staff? Occupational Safety and Health Does the employer comply with the law on HIV/AIDS Prevention and Control? Occupational Safety and Health
Do workers who are not exposed to work-related hazards receive annual medical checks?
Occupational Safety and Health
Do workers who are exposed to work-related hazards, are disabled, juvenile and/or elderly receive free periodical health checks every 6 months?
Occupational Safety and Health
Does the employer regularly inspect and maintain machines, equipment, buildings and stores?
Occupational Safety and Health Does the employer keep updated records of work-related accidents and diseases? Occupational Safety and Health
Does the employer develop the Document on Working Conditions and Environment?
Occupational Safety and Health Does the employer conduct risk assessment? Occupational Safety and Health Is the workplace clean and tidy? Occupational Safety and Health Does the employer keep food samples for 24 hours? Occupational Safety and Health Are workers effectively trained to use machines and equipment safely? Occupational Safety and Health Are there sufficient measures in place to avoid heavy lifting by workers? Occupational Safety and Health Are standing workers properly accommodated? Occupational Safety and Health Is the workplace adequately ventilated? Working Time Does the employer provide required time off for breastfeeding breaks? Working Time Does the employer allow workers to take 30 minutes rest during their period? Working Time Is overtime work voluntary?
Working Time Does the employer ensure that workers have on average at least 4 rest days per month when weekly rest is not possible?
Working Time Do the working time records reflect the hours actually worked? Working Time Do regular weekly working hours exceed 48 hours? Working Time Do regular daily working hours exceed 10 hours?
IV. Complete compliance by cycle 4
Child Labour Have you found any workers under the age of 15? Child Labour Does the employer keep a record of workers under 18 years of age? Child Labour Do workers who are under age 18 work at night?
364 | P a g e
Child Labour Are any workers who are under age 18 doing work that is hazardous by nature? Compensation Does the employer properly inform workers about wage payments and deductions? Compensation Does the employer comply with national laws regarding wage deductions?
Compensation Does the employer pay at least the applicable legal minimum wage for ordinary hours of work to temporary workers?
Compensation Does the employer pay at least 85% of the wage paid to other workers for the same job for ordinary hours of work to probationary workers?
Compensation Does the employer pay workers for one hour breastfeeding break per day? Compensation Does the employer pay workers correctly for personal leave? Compensation Do workers receive correct payment during sick leave?
Compensation Do workers receive correct payment during sick leave and other types of leave that are covered by social insurance?
Compensation Do the workers receive correct payments when they take other types of personal leave that are covered by social insurance?
Compensation Do pregnant workers receive correct payment when they take time off for prenatal care?
Compensation Does the employer collect contributions to unemployment insurance funds from all workers?
Compensation Does the employer collect contributions to social insurance funds from all workers? Contracts and Human Resources Is there a Labour Conciliation Council in the factory? Contracts and Human Resources Have any workers been bullied, harassed or subject to humiliating treatment? Contracts and Human Resources Did the employer resolve grievances and disputes in compliance with legal requirements?
Contracts and Human Resources
Does the employer comply with legal requirements before reducing the size of the workforce or suspending workers' contracts due to changes in structure, technology or economic reasons?
Contracts and Human Resources Do resigned or terminated workers receive all other termination benefits required by law?
Discrimination Does the employer terminate workers due to the worker's pregnancy, maternity leave, marriage, or breast-feeding of a child under 12 months of age or force them to resign?
Freedom of Association and Collective Bargaining
If there is a collective agreement, does it provide more favorable terms and conditions for workers than the law?
FACB Has the employer implemented all provisions of the collective agreement(s) in force?
FACB Has the employer terminated a union official without the written agreement of the union board or the higher-level union?
FACB Are workers free to meet without management present? FACB Has the employer reinstated all eligible workers after a strike? FACB Has the employer punished any workers for participating in a strike? FACB Does the employer require workers to join a union? FACB Does the employer require workers to join a union?
FACB Does the employer deduct union dues from wages when workers request this in accordance with national law?
Occupational Safety and Health How many work-related accidents have there been in the factory in the last 12 months? Occupational Safety and Health
Has the employer performed an assessment of general occupational safety and health issues in the factory?
365 | P a g e
Occupational Safety and Health Does the factory have an approved OSH feasibility study? Occupational Safety and Health Does the employer develop an OSH plan annually? Occupational Safety and Health Is the accommodation protected against fire? Occupational Safety and Health Has the employer adequately prepared for emergencies in the accommodation? Occupational Safety and Health Are materials, tools, switches, and controls within easy reach of workers? Working Time Does the employer comply with the law regarding other types of leave? Working Time Does the employer comply with the entitlement to sick leave?
Working Time Are workers able to take time off for annual leave and not forced to accept payment for it instead?
366 | P a g e
Appendix 2 Compliance Trends Indonesia Observations were made as to whether the factories were always compliant, achieved compliance (by the third visit), moved towards compliance, were always non-compliant (demonstrated similar rates of non-compliance each visit), moved towards non-compliance, or showed no trend for various questions. Cluster Question Trend Child Labour Does the employer subject any workers under age 18 to
the unconditional worst forms of child labour? Compliant Throughout
Child Labour Do workers who are under age 18 perform work that is hazardous by nature, or do they work in a hazardous working environment?
Compliant Throughout
Child Labour Do workers who are under age 18 work at night? Compliant Throughout
Child Labour Do workers who are under age 18 work overtime? Compliant Throughout
Child Labour Does the employer comply with documentation requirements for young workers?
Compliant Throughout
Child Labour Do workers who are under age 18 work in a separate workplace from adult workers?
Compliant Throughout
Child Labourers Have you found any workers under the age of 13? Compliant Throughout
Child Labourers Are all workers who are under age 15 working (a) in accordance with national regulations regarding light work or (b) in a government-approved training program?
Compliant Throughout
Compensation Does the employer pay apprentices correctly for ordinary hours of work?
Compliant Throughout
Compensation Does the employer pay the correct district minimum wage for ordinary hours of work to probationary workers?
Compliant Throughout
Compensation Does the employer pay piece rate workers correctly for ordinary hours of work?
Compliant Throughout
Compensation Are workers' full wages paid in cash, or in the manner stipulated in the work agreement?
Compliant Throughout
Compensation Do in-kind wage payments comply with national law? Compliant Throughout
Compensation Is the basic wage equal to at least 75% of the total wage (basic wage plus fixed allowances)?
Compliant Throughout
367 | P a g e
Compensation Are workers paid at least once per month? Compliant Throughout
Compensation Does the employer pay workers the religious holiday allowance?
Compliant Throughout
Compensation Are wages paid at the workplace, company office, by bank transfer, or at another location specified in the work agreement or company regulation?
Compliant Throughout
Compensation Are wages paid directly to workers? Compliant Throughout
Compensation Does the employer restrict workers' freedom to use their wages as they choose?
Compliant Throughout
Compensation Does the employer pay workers correctly for paid public holidays?
Compliant Throughout
Compensation Does the employer pay workers correctly during maternity leave?
Compliant Throughout
Contracts and Human Resources
Does the employer comply with the labour law and regulations on hiring migrant workers?
Compliant Throughout
Contracts and Human Resources
Does the employer comply with requirements concerning home-based workers?
Compliant Throughout
Contracts and Human Resources
Do workers pay any recruitment fees? Compliant Throughout
Contracts and Human Resources
Has the employer complied with any orders to reinstate or compensate workers who were found to be unjustly terminated?
Compliant Throughout
Contracts and Human Resources
Does the employer comply with legal requirements before reducing the size of the workforce due to changes in operations?
Compliant Throughout
Contracts and Human Resources
Does the employer comply with requirements regarding severance pay and reward for service?
Compliant Throughout
Discrimination Is an applicant's race, colour or origin a factor in hiring decisions?
Compliant Throughout
Discrimination Is race, colour or origin a factor in decisions regarding conditions of work?
Compliant Throughout
Discrimination Is race, colour or origin a factor in decisions regarding pay?
Compliant Throughout
Discrimination Is race, colour or origin a factor in decisions regarding opportunities for promotion or access to training?
Compliant Throughout
Discrimination Is there harassment of workers on the basis of race, colour or origin?
Compliant Throughout
368 | P a g e
Discrimination Is race, colour or origin a factor in the employer's decisions regarding termination or retirement of workers?
Compliant Throughout
Discrimination Do recruitment materials such as job announcements refer to the applicant's religion or political opinion?
Compliant Throughout
Discrimination Is religion or political opinion a factor in decisions regarding conditions of work?
Compliant Throughout
Discrimination Is religion or political opinion a factor in decisions regarding pay?
Compliant Throughout
Discrimination Is religion or political opinion a factor in decisions regarding opportunities for promotion or access to training?
Compliant Throughout
Discrimination Is there harassment of workers on the basis of religion or political opinion?
Compliant Throughout
Discrimination Is religion or political opinion a factor in the employer's decisions regarding termination or retirement of workers?
Compliant Throughout
Discrimination Is an applicant's gender a factor in hiring decisions? Compliant Throughout
Discrimination Is gender a factor in decisions regarding conditions of work?
Compliant Throughout
Discrimination Is gender a factor in decisions regarding pay? Compliant Throughout
Discrimination Is gender a factor in decisions regarding opportunities for promotion or access to training?
Compliant Throughout
Discrimination Is there sexual harassment of workers in the workplace? Compliant Throughout
Discrimination Is gender a factor in the employer's decisions regarding termination or retirement of workers?
Compliant Throughout
Discrimination Does the employer require pregnancy tests or the use of contraceptives as a condition of employment?
Compliant Throughout
Discrimination Does the employer terminate workers who are pregnant or on maternity leave or force them to resign?
Compliant Throughout
Discrimination Has the employer taken steps to accommodate disabled workers in accordance with the type and extent of their disabilities?
Compliant Throughout
Discrimination Is disability a factor in decisions regarding conditions of work?
Compliant Throughout
369 | P a g e
Discrimination Is disability a factor in decisions regarding pay? Compliant Throughout
Discrimination Is disability a factor in decisions regarding opportunities for promotion or access to training?
Compliant Throughout
Discrimination Is there harassment of workers on the basis of disability? Compliant Throughout
Discrimination Has the employer taken steps to enable workers who become disabled for whatever reason to retain their work?
Compliant Throughout
Discrimination Is disability a factor in the employer's decisions regarding termination or retirement?
Compliant Throughout
Discrimination Is an applicant's real or perceived HIV/AIDS status a factor in hiring decisions?
Compliant Throughout
Discrimination Are HIV/AIDS tests required at hiring or at any time during employment?
Compliant Throughout
Discrimination Is HIV/AIDS status a factor in decisions regarding conditions of work?
Compliant Throughout
Discrimination Is HIV/AIDS status a factor in decisions regarding pay? Compliant Throughout
Discrimination Is HIV/AIDS status a factor in decisions regarding opportunities for promotion or access to training?
Compliant Throughout
Discrimination Do workers with AIDS-related illnesses receive workplace health services that are equal to those available other workers?
Compliant Throughout
Discrimination Is a worker's real or perceived HIV/AIDS status a factor in the employer's decisions regarding termination or retirement?
Compliant Throughout
Discrimination Does the employer allow workers with AIDS-related illnesses to work for as long as medically fit in available, appropriate work?
Compliant Throughout
Discrimination Is an applicant's religion or political opinion a factor in hiring decisions?
Compliant Throughout
Discrimination Does the employer change the employment status, position, wages, benefits or seniority of workers during maternity leave?
Compliant Throughout
Discrimination Is maternity leave excluded from workers' period of continuous service?
Compliant Throughout
Discrimination Is there harassment of workers on the basis of real or perceived HIV/AIDS status?
Compliant Throughout
370 | P a g e
Forced Labour Does the employer allow workers to leave the workplace at all times, including during overtime?
Compliant Throughout
Forced Labour Does the employer allow workers to come and go freely from the dormitories and the industrial park or zone in which the factory is located?
Compliant Throughout
Forced Labour Does the employer use violence or the threat of violence to intimidate workers?
Compliant Throughout
Forced Labour Does the employer delay or withhold wage payments in order to coerce workers to stay on the job?
Compliant Throughout
Forced Labour Does the employer force workers to work to discipline them or as punishment for participation in a strike?
Compliant Throughout
Forced Labour Does the employer deny workers access to their personal documents (such as birth certificates, passports, work permits and ID cards) when they need them?
Compliant Throughout
Forced Labour Does the employer use threats such as deportation, cancellation of visas or reporting to the authorities in order to force workers to stay at the job?
Compliant Throughout
Forced Labour Does the employer use any other coercive tactics to overwhelm workers' ability to make decisions in their own interest.
Compliant Throughout
Forced Labour Does the employer provide non-cash benefits that make workers so indebted to the employer that they are unable to leave the job?
Compliant Throughout
Forced Labour Can workers who owe recruitment fees to the employer freely leave their jobs?
Compliant Throughout
Forced Labour Can workers who owe recruitment fees to a third party freely leave their jobs?
Compliant Throughout
Forced Labour Has the employer ensured that the private job placement institution does not use bonded labour?
Compliant Throughout
Forced Labour Can workers who owe other types of debt to the employer freely leave their jobs?
Compliant Throughout
Forced Labour Does the employer force workers to work overtime by paying them below minimum wage during normal working hours?
Compliant Throughout
371 | P a g e
Forced Labour Does the employer force workers to work more than 3 hours of overtime per day or 14 hours of overtime per week by threatening dismissal or other action that would reduce their future income?
Compliant Throughout
Forced Labour If prison labour is used, have the prisoners freely consented to do the work?
Compliant Throughout
Forced Labour If prison labour is used, do the prisoners receive the same treatment as non-prison workers working in the factory?
Compliant Throughout
Forced Labour Does the employer restrict workers from leaving the workplace?
Compliant Throughout
Forced Labour Does the employer restrict workers' freedom to come and go from the dormitories and/or the industrial park or zone in which the factory is located?
Compliant Throughout
Forced Labour Does the employer require workers to work beyond the term of their contracts?
Compliant Throughout
Forced Labour Are workers free to terminate their employment with reasonable notice?
Compliant Throughout
Forced Labour If prison labour is used, is the work carried out under the supervision and control of a public authority?
Compliant Throughout
Freedom of Association and Collective Bargaining
Do union representatives have access to the workers in the workplace?
Compliant Throughout
Freedom of Association and Collective Bargaining
Can workers freely form a union? Compliant Throughout
Freedom of Association and Collective Bargaining
Can the union(s) freely form and join federations and confederations of their choice?
Compliant Throughout
Freedom of Association and Collective Bargaining
Does the employer require workers to join a union? Compliant Throughout
Freedom of Association and Collective Bargaining
Has the employer tried to promote the formation of a union to compete against existing union(s)?
Compliant Throughout
372 | P a g e
Freedom of Association and Collective Bargaining
Are workers free to meet without management present? Compliant Throughout
Freedom of Association and Collective Bargaining
If there is more than one union, does the employer treat them as stipulated by national law?
Compliant Throughout
Freedom of Association and Collective Bargaining
Has the employer tried to interfere with, manipulate, or control the union(s)?
Compliant Throughout
Freedom of Association and Collective Bargaining
Is a job applicant's union membership or union activities a factor during hiring decisions?
Compliant Throughout
Freedom of Association and Collective Bargaining
Does the employer use blacklists to ensure that union members or union officials are not employed?
Compliant Throughout
Freedom of Association and Collective Bargaining
Does the employer punish workers for joining a union or engaging in union activities?
Compliant Throughout
Freedom of Association and Collective Bargaining
Does the employer provide incentives to workers to keep them from joining a union or engaging in union activities?
Compliant Throughout
Freedom of Association and Collective Bargaining
Does the employer threaten, intimidate, or harass workers who join a union or engage in union activities?
Compliant Throughout
Freedom of Association and Collective Bargaining
Has the employer not renewed a worker's employment contract due to the worker's union membership or activities?
Compliant Throughout
Freedom of Association and Collective Bargaining
Has the employer terminated workers for joining a union or engaging in union activities?
Compliant Throughout
Freedom of Association and Collective Bargaining
Has the employer terminated a union official in a way that did not comply with the law?
Compliant Throughout
Freedom of Association and Collective Bargaining
Did the employer consult with unions when developing or changing the company regulations?
Compliant Throughout
Freedom of Association and Collective Bargaining
Does the employer refuse to bargain collectively or refuse to bargain in good faith with the union(s)?
Compliant Throughout
Freedom of Association and Collective Bargaining
Does the employer try to undermine the union(s) by negotiating directly with individual workers?
Compliant Throughout
Freedom of Association and Collective Bargaining
Does the employer refuse to bargain collectively with union federations and confederations?
Compliant Throughout
Freedom of Association and Collective Bargaining
Has the employer limited the issues that can be negotiated? Compliant Throughout
Freedom of Association and Collective Bargaining
Has the employer tried to prevent any workers from participating in a strike?
Compliant Throughout
Freedom of Association and Collective Bargaining
Has the employer hired new workers to replace striking workers during a strike?
Compliant Throughout
373 | P a g e
Freedom of Association and Collective Bargaining
Has the employer punished any workers for participating in a strike?
Compliant Throughout
Freedom of Association and Collective Bargaining
Has the employer failed to reinstate all eligible workers after a strike?
Compliant Throughout
Freedom of Association and Collective Bargaining
Were security guards, the police or armed forces called by the employer to break up a peaceful strike or arrest striking workers?
Compliant Throughout
Occupational Safety and Health
Are workers punished if they remove themselves from work situations that they believe present an imminent and serious danger to life or health?
Compliant Throughout
Occupational Safety and Health
Is the workplace adequately lit? Compliant Throughout
Occupational Safety and Health
Does the accommodation comply with minimum space requirements?
Compliant Throughout
Occupational Safety and Health
Does the accommodation have enough safe water? Compliant Throughout
Occupational Safety and Health
Does the accommodation have adequate toilets, showers, sewage and garbage disposal systems?
Compliant Throughout
Occupational Safety and Health
Is the accommodation protected against fire? Compliant Throughout
Occupational Safety and Health
Is the accommodation adequately protected against heat, cold, and dampness?
Compliant Throughout
Occupational Safety and Health
Is the accommodation protected against disease carrying animals or insects?
Compliant Throughout
Occupational Safety and Health
Is the accommodation protected against noise? Compliant Throughout
Occupational Safety and Health
Does the accommodation have adequate cooking and storage facilities?
Compliant Throughout
Occupational Safety and Health
Is the accommodation adequately lit? Compliant Throughout
Occupational Safety and Health
Does the accommodation offer workers adequate privacy? Compliant Throughout
Occupational Safety and Health
Does the accommodation comply with other health and safety requirements?
Compliant Throughout
Occupational Safety and Health
Has the employer adequately prepared for emergencies in the accommodation?
Compliant Throughout
374 | P a g e
Occupational Safety and Health
Does the employer conduct periodic emergency drills? Compliant Throughout
Occupational Safety and Health
Are noise levels acceptable? Compliant Throughout
Working Time Does the employer provide at least a 1/2 hour break every 4 hours?
Compliant Throughout
Working Time Does work on public holidays occur only under the conditions allowed by law?
Compliant Throughout
Working Time Does the employer provide other types of required leave? Compliant Throughout
Working Time Does the employer allow workers to take time off for religious obligations, duties to the State, educational requirements and/or long leave every 6 years?
Compliant Throughout
Child Labour Does the employer have a system in place to verify the age of workers prior to hiring?
Reached Compliance
Compensation Does the employer pay workers the correct rate for all overtime hours worked on weekly rest days?
Reached Compliance
Compensation Does the employer collect contributions to social insurance funds from all workers?
Reached Compliance
Compensation Are wages paid on time? Reached Compliance
Compensation Does the employer pay workers correctly when they are ill during the 1st and 2nd days of menstruation?
Reached Compliance
Compensation Does the employer pay the correct district minimum wage for ordinary hours of work to non-permanent workers?
Reached Compliance
Compensation Does the employer forward employee contributions for social insurance funds to JAMSOSTEK?
Reached Compliance
Compensation Does the employer pay workers correctly during sick leave?
Reached Compliance
Compensation Does the employer pay workers correctly during breastfeeding breaks, as required under the work agreements, company regulations or collective agreement?
Reached Compliance
375 | P a g e
Compensation Does the employer pay workers correctly for paternity leave?
Reached Compliance
Compensation Does the employer pay workers correctly during work stoppages?
Reached Compliance
Compensation Does the employer pay workers correctly during annual leave?
Reached Compliance
Compensation Does the employer pay workers correctly for other types of legally required leave?
Reached Compliance
Compensation Has the employer made any unauthorized deductions from wages?
Reached Compliance
Compensation Does the employer pay higher than district minimum wage for ordinary hours of work to permanent and non-permanent workers who have worked for more than 1 year?
Reached Compliance
Compensation Does the employer pay workers the correct rate for all overtime hours worked on public holidays?
Reached Compliance
Compensation Does the employer provide nutritious food and drinks to female workers who work between 11 p.m. until 7 a.m?
Reached Compliance
Contracts and Human Resources
Do the employment contracts specify the terms and conditions of employment?
Reached Compliance
Contracts and Human Resources
Are workers given the opportunities required under law to defend themselves before they are terminated?
Reached Compliance
Contracts and Human Resources
Is the probationary period applied only to permanent workers and no longer than 3 months?
Reached Compliance
Contracts and Human Resources
Did the employer resolve grievances and disputes in compliance with legal requirements?
Reached Compliance
Contracts and Human Resources
Does the employer comply with the law and regulations on subcontracting part of its work to another enterprise?
Reached Compliance
Contracts and Human Resources
Does the employer provide a letter of appointment to permanent workers with oral contracts?
Reached Compliance
Discrimination Do recruitment materials such as job announcements or job application forms refer to the applicant's race, colour or origin?
Reached Compliance
376 | P a g e
Discrimination Do recruitment materials such as job announcements refer to the applicant's religion or political opinion?
Reached Compliance
Freedom of Association and Collective Bargaining
Can workers freely join the union of their choice? Reached Compliance
Freedom of Association and Collective Bargaining
Does the employer allow workers to carry out trade union activities during working hours as agreed by both parties?
Reached Compliance
Freedom of Association and Collective Bargaining
Has the employer failed to implement any of the provisions of the collective bargaining agreement in force?
Reached Compliance
Freedom of Association and Collective Bargaining
Does the employer deduct union dues from wages when union and workers request this, or allow unions to collect dues directly from their members?
Reached Compliance
Occupational Safety and Health
Does the factory have a written OSH policy? Reached Compliance
Occupational Safety and Health
Are appropriate safety warnings posted in the workplace? Reached Compliance
Occupational Safety and Health
Does the employer comply with requirements on HIV/AIDS?
Reached Compliance
Occupational Safety and Health
Are there enough emergency exits? Reached Compliance
Occupational Safety and Health
Does the employer address safety and health risks to pregnant or nursing workers?
Reached Compliance
Occupational Safety and Health
Does the workplace have adequate fire-fighting equipment?
Reached Compliance
Occupational Safety and Health
Are noise levels within legal limits? Reached Compliance
Occupational Safety and Health
Does the employer provide required medical services? Reached Compliance
Occupational Safety and Health
Are possible sources of ignition appropriately safeguarded?
Reached Compliance
377 | P a g e
Working Time Is overtime voluntary? Reached Compliance
Working Time Does the employer provide 12 days of annual leave per year?
Reached Compliance
Working Time Does the employer provide required personal leave? Reached Compliance
Working Time Does the employer provide required sick leave? Reached Compliance
Working Time Does the employer provide required paternity leave? Reached Compliance
Compensation Does the employer pay the required employer contribution to JAMSOSTEK for work related accidents, death and provident fund?
Towards Compliance
Compensation Does the employer provide health care benefits to all workers through JAMSOSTEK or another provider that offers at least the same benefits as JAMSOSTEK?
Towards Compliance
Compensation Does the employer keep only one accurate payroll record? Towards Compliance
Compensation Does the employer pay workers the correct rate for all ordinary overtime hours worked (1.5 times the hourly rate for the 1st hour of overtime, and 2 times the hourly rate for each additional hour)?
Towards Compliance
Compensation Does the employer provide round trip transport for female workers who work between 11 p.m. until 5 a.m?
Towards Compliance
Contracts and Human Resources
Do all persons who perform work for the factory, both on the premises and offsite, have a contract?
Towards Compliance
Contracts and Human Resources
Does the factory have a functioning bipartite cooperation institution?
Towards Compliance
Contracts and Human Resources
Have any workers been bullied, harassed, or subjected to humiliating treatment?
Towards Compliance
Contracts and Human Resources
Do the work agreements comply with company regulations, the collective labour agreement, and prevailing laws and regulations?
Towards Compliance
378 | P a g e
Discrimination Does the employer hire one disabled worker for every 100 workers?
Towards Compliance
Discrimination Do job announcements refer to the applicant's gender? Towards Compliance
Occupational Safety and Health
Has the employer performed an assessment of general occupational safety and health issues in the factory?
Towards Compliance
Occupational Safety and Health
Does the factory have an OSH Committee? Towards Compliance
Occupational Safety and Health
Has the employer appointed an OSH Chemical Officer? Towards Compliance
Occupational Safety and Health
Are chemicals and hazardous substances properly labelled?
Towards Compliance
Occupational Safety and Health
Has the employer effectively trained workers who work with chemicals and hazardous substances?
Towards Compliance
Occupational Safety and Health
Are there sufficient measures in place to avoid heavy lifting by workers?
Towards Compliance
Occupational Safety and Health
Are electrical wires, switches and plugs properly installed, grounded, and maintained?
Towards Compliance
Occupational Safety and Health
Is the workplace adequately ventilated? Towards Compliance
Occupational Safety and Health
Does the employer provide adequate first-aid facilities? Towards Compliance
Occupational Safety and Health
Does the workplace have adequate hand washing facilities and adequate soap?
Towards Compliance
Occupational Safety and Health
Does the employer provide workers enough free safe drinking water?
Towards Compliance
Occupational Safety and Health
Does the employer provide adequate lockers for workers to store their personal belongings?
Towards Compliance
Occupational Safety and Health
Is the workplace clean and tidy? Towards Compliance
Occupational Safety and Health
Does the employer provide workers with all necessary personal protective clothing and equipment?
Towards Compliance
Occupational Safety and Health
Are standing workers properly accommodated? Towards Compliance
Occupational Safety and Health
Does the workplace have a fire detection and alarm system?
Towards Compliance
379 | P a g e
Occupational Safety and Health
Are emergency exits and escape routes clearly marked and posted in the workplace?
Towards Compliance
Occupational Safety and Health
Are the emergency exits accessible, unobstructed and unlocked during working hours, including overtime?
Towards Compliance
Occupational Safety and Health
Does the employer provide required medical services? Towards Compliance
Working Time Do regular daily working hours exceed legal limits (7 hours a day, 6 days a week or 8 hours per day, 5 days a week)?
Towards Compliance
Working Time Does the employer prepare written instructions on overtime?
Towards Compliance
Working Time Do the working time records reflect the hours actually worked?
Towards Compliance
Working Time Do regular weekly working hours exceed 40 hours? Towards Compliance
Working Time Does the employer allow workers to take time off when they are sick?
Towards Compliance
Contracts and Human Resources
Does the employer comply with limits on the use of work agreements for a specified period of time (i.e., limits on the employment of non-permanent workers)?
Towards Noncompliance
Contracts and Human Resources
Does the employer comply with requirements concerning sub-contracted workers at the workplace?
Towards Noncompliance
Contracts and Human Resources
Do workers who resign or are terminated receive all other legally required termination benefits?
Towards Noncompliance
Freedom of Association and Collective Bargaining
Does the employer inform workers about the contents of the collective bargaining agreement, and provide workers the text of the agreement?
Towards Noncompliance
380 | P a g e
Occupational Safety and Health
Do the operators/technicians/officers responsible for machinery/equipment/installations/lifting equipment have the required license?
Towards Noncompliance
Occupational Safety and Health
Are flammable materials safely stored? Towards Noncompliance
Occupational Safety and Health
Does the employer have a hazard control document? Towards Noncompliance
Occupational Safety and Health
Does the employer have a certificate for the electrical installations in the factory?
Towards Noncompliance
Occupational Safety and Health
Does the workplace have adequate trained first aid officers?
Towards Noncompliance
Occupational Safety and Health
Has the employer trained an appropriate number of workers to use the fire-fighting equipment?
Towards Noncompliance
Occupational Safety and Health
Are chemicals and hazardous substances properly stored? Towards Noncompliance
Occupational Safety and Health
Does the employer have chemical safety data sheets for the hazardous chemicals used in the workplace?
Towards Noncompliance
Occupational Safety and Health
Does the employer provide adequate washing facilities and cleansing materials in the event of exposure to hazardous chemicals?
Towards Noncompliance
Occupational Safety and Health
Do workers have suitable chairs? Towards Noncompliance
Occupational Safety and Health
Does the workplace have adequate accessible toilets (separated by sex)?
Towards Noncompliance
Working Time Is overtime on regular workdays limited to 14 hours per week?
Towards Noncompliance
381 | P a g e
Working Time Does the employer provide 3 months' maternity leave? Towards Noncompliance
Working Time Does the employer allow workers to take time off for personal/family matters as required by national law?
Towards Noncompliance
Occupational Safety and Health
Does the employer record work-related accidents and diseases?
Incompliant Throughout
Occupational Safety and Health
Does the employer have the required certificates to operate the factory's machinery and equipment, and licensed operators?
Incompliant Throughout
Occupational Safety and Health
Does the workplace have an adequate eating area? Incompliant Throughout
Occupational Safety and Health
Does the employer ensure the building is safe and maintain legally required permits?
Incompliant Throughout
Occupational Safety and Health
Are proper guards installed and maintained on all dangerous moving parts of machines and equipment?
Incompliant Throughout
Working Time Does the employer provide leave when workers are ill during the 1st and 2nd days of menstruation?
Incompliant Throughout
Working Time Does the employer provide opportunities for breastfeeding breaks?
Incompliant Throughout
Compensation Does the employer provide meals and drinks of at least 1,400 calories to workers working overtime for 3 hours or more?
No Trend
Compensation Does the employer pay workers correctly during personal leave (not including paternity leave)?
No Trend
Compensation Does the employer pay the correct district minimum wage for ordinary hours of work to permanent full time workers?
No Trend
Contracts and Human Resources
Does the employer only terminate workers for valid reasons?
No Trend
Contracts and Human Resources
Do the disciplinary measures comply with legal requirements?
No Trend
Contracts and Human Resources
Does the employer give a copy of the work agreement in Bahasa to workers?
No Trend
382 | P a g e
Contracts and Human Resources
Do the company regulations comply with legal requirements as stipulated in the labour law and regulations?
No Trend
Contracts and Human Resources
Does the employer compensate workers for unused paid annual leave when they resign or are terminated?
No Trend
Contracts and Human Resources
Does the employer compensate workers for unused paid annual leave when they resign or are terminated?
No Trend
Freedom of Association and Collective Bargaining
If there is a collective bargaining agreement, are the provisions at least as favourable for workers as the law?
No Trend
Occupational Safety and Health
Is the temperature in the workplace acceptable? No Trend
Occupational Safety and Health
Are special medical checks provided when required? No Trend
Occupational Safety and Health
Has the employer ensured that there are a sufficient number of readily accessible first aid boxes/supplies in the workplace?
No Trend
Occupational Safety and Health
Are materials, tools, switches, and controls within easy reach of workers?
No Trend
Occupational Safety and Health
Are workers effectively trained to use machines and equipment safely?
No Trend
Occupational Safety and Health
Does the employer comply with legal requirements regarding pre-assignment and annual medical checks for workers?
No Trend
Occupational Safety and Health
Does the employer keep an inventory of chemicals and hazardous substances used in the workplace?
No Trend
Occupational Safety and Health
Are workers effectively trained and obliged to use the personal protective equipment that is provided?
No Trend
Occupational Safety and Health
Is the accommodation adequately ventilated? No Trend
Working Time Does the employer provide required weekly rest (1 day after 6 days of work, or 2 days after 5 days of work)?
No Trend
Working Time Is overtime on regular workdays limited to 3 hours per day?
No Trend
383 | P a g e
Appendix 3 Compliance Trends Jordan
The following tables represent points in which the factories are always compliant, headed towards compliance, or headed towards non-compliance:
Core Labor Standard Question Outcome Child Labor Have you found any workers under
the age of 16? Always Compliant
Does the employer comply with documentation requirements for workers under age 18?
Always Compliant
Do workers who are under age 18 perform work that is hazardous by nature?
Always Compliant
Do workers who are under age 18 work at night?
Always Compliant
Does the employer have a reliable system in place to verify the age of workers prior to hiring?
Always Compliant
Do workers who are under age 18 work long hours (more than 6 hours per day, more than 4 hours without a 1-hour break, or overtime)?
Always Compliant
Do recruitment materials such as job announcements or job application forms refer to the applicant's race, colour or origin?
Always Compliant
Does the employer subject any workers under age 18 to the unconditional worst forms of child labour?
Always Compliant
Discrimination Is an applicant's race, colour or origin a factor in hiring decisions?
Always Compliant
Is race, colour or origin a factor in decisions regarding conditions of work?
Always Compliant
Is race, colour or origin a factor in decisions regarding opportunities for promotion or access to training?
Always Compliant
Is there harassment of workers on the basis of race, colour or origin?
Always Compliant
Is race, colour or origin a factor in the employer's decisions regarding termination or retirement of workers?
Always Compliant
Do recruitment materials such as job announcements or job application forms refer to the applicant's religion
Always Compliant
384 | P a g e
or political opinion? Is an applicant's religion or political
opinion a factor in hiring decisions? Always Compliant
Is religion or political opinion a factor in decisions regarding conditions of work?
Always Compliant
Is religion or political opinion a factor in decisions regarding pay?
Always Compliant
Is religion or political opinion a factor in decisions regarding opportunities for promotion or access to training?
Always Compliant
Is there harassment of workers on the basis of religion or political opinion?
Always Compliant
Is religion or political opinion a factor in the employer's decisions regarding termination or retirement of workers?
Always Compliant
Do job announcements refer to the applicant's gender?
Always Compliant
Is an applicant's gender a factor in hiring decisions?
Always Compliant
Is gender a factor in decisions regarding pay?
Always Compliant
Is gender a factor in decisions regarding opportunities for promotion or access to training?
Always Compliant
Is there sexual harassment of workers in the workplace?
Always Compliant
Is gender a factor in the employer's decisions regarding termination or retirement of workers?
Always Compliant
Does the employer require pregnancy tests or the use of contraceptives as a condition of employment?
Always Compliant
Does the employer change the employment status, position, wages, benefits or seniority of workers during maternity leave?
Always Compliant
Is maternity leave excluded from workers' period of continuous service?
Always Compliant
Does the employer dismiss workers who are pregnant or on maternity leave or force them to resign?
Always Compliant
Working Time Does the employer comply with the daily break periods specified in the factory bylaws?
Always Compliant
Does the employer provide required Always Compliant
385 | P a g e
weekly rest periods? Does the employer comply with the
minimum period of rest within a 24 hour period that is specified in the factory bylaws?
Always Compliant
Is overtime work voluntary? Always Compliant Does the employer provide workers
at least 14 days of paid annual leave per year, or 21 days after 5 years of service?
Always Compliant
Does the employer provide workers at least 14 days of sick leave?
Always Compliant
Does the employer comply with the entitlement to 10 weeks of maternity leave?
Always Compliant
Does the employer provide one hour per day for breastfeeding breaks?
Always Compliant
Does the employer provide other types of required leave?
Always Compliant
Contracts and Human Resources Does the employer maintain a personnel file for each worker?
Always Compliant
Is the probationary period limited to 3 months?
Always Compliant
Does the employer comply with agreed limits on the period for vocational training?
Always Compliant
Does the employer pay for the return trip of migrant workers who have been expelled from the country because of an invalid residence ID?
Always Compliant
Do workers have an opportunity to defend themselves before they are terminated based on their conduct or performance?
Always Compliant
Does the employer provide workers proper notice of termination?
Always Compliant
Has the employer complied with any court orders to reinstate or compensate workers who were found to be unjustly terminated?
Always Compliant
Does the employer comply with legal requirements before terminating or suspending workers due to changes in operations?
Always Compliant
Do workers receive all their entitlements upon expiration of their contracts?
Always Compliant
Did the employer resolve collective disputes in compliance with legal requirements?
Always Compliant
Compensation Do in-kind wage payments comply Always Compliant
386 | P a g e
with workers' employment contracts?
Are wages paid in a convenient manner?
Always Compliant
Does the employer restrict workers' freedom to use their wages as they choose?
Always Compliant
Does the employer pay workers correctly for annual leave (14 or 21 days)?
Always Compliant
Does the employer pay workers correctly for maternity leave?
Always Compliant
Does the employer pay workers correctly during breastfeeding breaks?
Always Compliant
Does the employer pay workers correctly for other types of leave when required?
Always Compliant
Does the employer pay workers' wages for the first three days of work missed due to work-related accidents or illnesses?
Always Compliant
Does the employer pay piece rate workers correctly for ordinary hours of work?
Always Compliant
Does the employer pay at least minimum wage for ordinary hours of work to vocational trainees?
Always Compliant
Does the employer pay at least minimum wage for ordinary hours of work to casual workers?
Always Compliant
Does the employer pay at least minimum wage for ordinary hours of work to temporary workers?
Always Compliant
Freedom of Association and Collective Bargaining
Do union representatives have access to the workers in the workplace?
Always Compliant
Does the employer deduct union dues from wages when workers request this in accordance with national law?
Always Compliant
Does the employer require workers to join a union?
Always Compliant
Has the employer tried to promote the formation of a union to compete against existing union(s)?
Always Compliant
Are workers free to meet without management present?
Always Compliant
If there is more than one union, does the employer treat them equally?
Always Compliant
Has the employer tried to interfere Always Compliant
387 | P a g e
with, manipulate, or control the union(s)?
Is a job applicant's union membership or union activities a factor during hiring decisions?
Always Compliant
Does the employer use blacklists to ensure that union members or union officials are not employed?
Always Compliant
Does the employer punish workers for joining a union or engaging in union activities?
Always Compliant
Does the employer provide incentives to workers to keep them from joining a union or engaging in union activities?
Always Compliant
Does the employer threaten, intimidate, or harass workers who join a union or engage in union activities?
Always Compliant
Has the employer not renewed a worker's employment contract due to the worker's union membership or activities?
Always Compliant
Has the employer terminated workers for joining a union or engaging in union activities?
Always Compliant
Has the employer terminated a union official in a way that did not comply with the law?
Always Compliant
Does the employer refuse to bargain collectively or refuse to bargain in good faith with the union?
Always Compliant
Does the employer try to undermine the union(s) by negotiating directly with individual workers?
Always Compliant
Does the employer refuse to bargain collectively with union federations and confederations?
Always Compliant
Has the employer limited the issues that can be negotiated?
Always Compliant
If there is a collective agreement, are the provisions at least as favorable for workers as the law?
Always Compliant
Does the employer prevent workers from accessing copies of collective bargaining agreements or learning about their provisions?
Always Compliant
Has the employer tried to prevent any workers from participating in a strike?
Always Compliant
Has the employer hired new workers Always Compliant
388 | P a g e
to replace striking workers during a strike?
Has the employer punished any workers for participating in a strike?
Always Compliant
Has the employer failed to reinstate all eligible workers after a strike?
Always Compliant
Were security guards, the police or armed forces called by the employer to break up a peaceful strike or arrest striking workers?
Always Compliant
Occupational Safety and Health Does the employer keep an inventory of chemicals and hazardous substances used in the workplace?
Always Compliant
Does the employer have chemical safety data sheets for the hazardous chemicals used in the workplace?
Always Compliant
Has the employer effectively trained workers who work with chemicals and hazardous substances?
Always Compliant
Does the employer provide adequate washing facilities and cleaning materials in the event of exposure to hazardous chemicals?
Always Compliant
Are workers punished if they remove themselves from work situations that they believe present an imminent and serious danger to life or health?
Always Compliant
Are materials, tools, switches, and controls within easy reach of workers?
Always Compliant
Do workers have suitable chairs? Always Compliant Are there sufficient measures in
place to avoid heavy lifting by workers?
Always Compliant
Is the workplace adequately ventilated?
Always Compliant
Are noise levels acceptable? Always Compliant Is the workplace adequately lit? Always Compliant Does the employer address safety
and health risks to pregnant or nursing workers?
Always Compliant
Is the accommodation protected against noise?
Always Compliant
Is the accommodation adequately lit?
Always Compliant
Does the accommodation offer workers adequate privacy?
Always Compliant
Does the factory have a valid permit to discharge non-hazardous
Always Compliant
389 | P a g e
wastewater to sewer? Does the factory have a valid permit
to discharge hazardous wastewater directly to the dumping area?
Always Compliant
Does the factory have a valid permit to discharge sludge?
Always Compliant
Forced Labour Does the sludge/wastewater transporter have appropriate permits?
Always Compliant
Does the employer use violence or the threat of violence to intimidate workers?
Always Compliant
Does the employer delay or withhold wage payments in order to coerce workers to work?
Always Compliant
Does the employer force workers to work to discipline them or as punishment for participation in a strike?
Always Compliant
Does the employer use threats such as deportation, cancellation of visas or reporting to the authorities in order to force workers to stay at the job?
Always Compliant
Does the employer use any other coercive tactics to overwhelm workers' ability to make decisions in their own interest?
Always Compliant
Does the employer provide non-cash benefits that make workers so indebted to the employer that they are unable to leave the job?
Always Compliant
Can workers who owe debts for recruitment fees to the employer freely leave their jobs?
Always Compliant
Can workers who owe other types of debt to the employer freely leave their jobs?
Always Compliant
Does the employer set production targets that require workers to work overtime in order to earn minimum wage?
Always Compliant
Does the employer force workers to work unreasonable amounts of overtime by threatening dismissal or other action that would reduce their future income?
Always Compliant
If prison labour is used, have the prisoners freely consented to do the work?
Always Compliant
If prison labour is used, do the Always Compliant
390 | P a g e
prisoners receive similar treatment to non-prison workers working in the factory?
If prison labour is used, is the work carried out under the supervision and control of a public authority?
Always Compliant
Core Labor Standard Question Outcome Discrimination Does the employer comply with
legal requirements regarding the hiring of disabled workers?
Toward Compliance
Working Time Do regular weekly working hours exceed 48 hours?
Toward Compliance
Contracts and Human Resources Do the employment contracts specify the terms and conditions of employment?
Toward Compliance
Do the employment contracts comply with Jordanian legal requirements?
Toward Compliance
Do workers understand the terms and conditions of employment?
Toward Compliance
Does the employer provide workers with a copy of their contract?
Toward Compliance
Do all persons who perform work for the factory, both on the premises and offsite, have a contract?
Toward Compliance
Do the factory bylaws comply with Jordanian legal requirements and were they communicated to workers?
Toward Compliance
Does the employer only terminate workers for valid reasons?
Toward Compliance
Does the employer comply with legal requirements regarding severance pay?
Toward Compliance
Does the employer compensate workers for unused paid annual leave when they resign or are terminated?
Toward Compliance
Do the disciplinary measures comply with legal requirements?
Toward Compliance
Compensation Does the employer pay workers 150% of their normal wage for overtime worked on weekly rest days?
Toward Compliance
Does the employer pay workers 150% of their normal wage for overtime worked on public holidays?
Toward Compliance
Has the employer made any Toward Compliance
391 | P a g e
unauthorized deductions from wages?
Does the employer keep only one accurate payroll record?
Toward Compliance
Does the employer pay workers correctly for paid public holidays?
Toward Compliance
Does the employer pay workers correctly during sick leave?
Toward Compliance
Does the employer pay workers correctly during idle periods or work stoppages?
Toward Compliance
Does the employer pay workers correctly during idle periods or work stoppages?
Toward Compliance
Does the employer collect contributions to the Social Security Corporation from all workers at 6.5% of the workers' base wages?
Toward Compliance
Does the employer forward employee contributions for social security to the Social Security Corporation?
Toward Compliance
Core Labor Standard Question Outcome Freedom of Association and Collective Bargaining
Can workers freely form a union? Always Incompliant
Can workers freely join the union of their choice?
Always Incompliant
Can the union(s) freely form and join federations and confederations of their choice?
Always Incompliant
Core Labor Standard Question Outcome Discrimination Is race, colour or origin a factor in
decisions regarding pay? Toward Incompliance
Is gender a factor in decisions regarding conditions of work?
Toward Incompliance
Working Time Do regular daily working hours exceed 11 hours per day?
Toward Incompliance
392 | P a g e
Do the working time records reflect the hours actually worked?
Toward Incompliance
Contracts and Human Resources Have workers paid unauthorized fees to recruitment agents?
Toward Incompliance
Do workers who resign or are terminated receive the accumulated thirteenth month payment?
Toward Incompliance
Freedom of Association and Collective Bargaining
Has the employer failed to implement any of the provisions of the collective agreement(s) in force?
Toward Incompliance
Occupational Safety and Health Does the employer have written plans for OSH programs?
Toward Incompliance
Are workers effectively trained to use machines and equipment safely?
Toward Incompliance
Are electrical boxes, electrical wires, switches and plugs properly installed, grounded, and maintained?
Toward Incompliance
Does the employer provide pre-assignment medical checks for workers?
Toward Incompliance
Does the workplace have required onsite medical facilities and staff?
Toward Incompliance
Does the accommodation have adequate eating and living areas?
Toward Incompliance
Does the workplace have an adequate eating area?
Toward Incompliance
When provided as in-kind payment, does the employer give workers enough food of decent quality?
Toward Incompliance
Does the accommodation comply with minimum space requirements?
Toward Incompliance
393 | P a g e
Is the accommodation protected against disease carrying animals or insects?
Toward Incompliance
Is the accommodation adequately ventilated?
Toward Incompliance
Does the accommodation have adequate cooking facilities?
Toward Incompliance
Has the employer adequately prepared for emergencies in the accommodation?
Toward Incompliance
Are adequate first aid supplies readily accessible on all floors?
Toward Incompliance
Has the employer trained an appropriate number of workers to use the fire-fighting equipment?
Toward Incompliance
Does the employer conduct periodic emergency drills?
Toward Incompliance
Does the employer require workers to work overtime without their consent only for reasons allowed by law?
Toward Incompliance
Does the employer pay workers for all overtime hours worked?
Toward Incompliance
Does the employer pay workers who are entitled to it the correct seniority bonus?
Toward Incompliance
Does the accommodation have adequate eating and living areas?
Toward Incompliance
394 | P a g e
Appendix 4 Compliance Trends Haiti
Core Labour Standard Question Outcome
Child Labour Have you found any workers under the age of 15? Always Compliant
Child Labour
Does the employer subject any workers under age 18 to the unconditional worst forms of child labour? Always Compliant
Child Labour
Does the employer require workers under age 18 to provide a medical certificate, and an employment certificate or permit delivered by the Director of Labor? Always Compliant
Child Labour Does the employer keep a register of workers under 18 years of age? Always Compliant
Contracts and Human Resources
Does the employer comply with limits on the trial period for apprentices? Always Compliant
Contracts and Human Resources
Does the employer comply with limits on the use of fixed term contracts? Always Compliant
Contracts and Human Resources
Does the employer comply with requirements concerning sub-contracted workers at the workplace? Always Compliant
Contracts and Human Resources
Does the employer comply with requirements concerning homeworkers? Always Compliant
Contracts and Human Resources
Has the employer complied with any orders to reinstate or compensate workers who were found to be unjustly terminated? Always Compliant
Freedom of Association and Collective Bargaining Can workers freely form a union? Always Compliant Freedom of Association and Collective Bargaining
Can workers freely join the union of their choice? Always Compliant
Freedom of Association and Collective Bargaining
Can the union(s) freely form and join federations and confederations of their choice? Always Compliant
Freedom of Association and Collective Bargaining
Does the employer require workers to join a union? Always Compliant
Freedom of Association and Collective Bargaining
Has the employer tried to promote the formation of a union to compete against existing union(s)? Always Compliant
Freedom of Association and Collective Bargaining
Is a job applicant's union membership or union activities a factor during hiring decisions? Always Compliant
Freedom of Association and Collective Bargaining
Does the employer use blacklists to ensure that union members or union Always Compliant
395 | P a g e
officials are not employed?
Freedom of Association and Collective Bargaining
Does the employer provide incentives to workers to keep them from joining a union or engaging in union activities? Always Compliant
Freedom of Association and Collective Bargaining
Has the employer not renewed a worker's employment contract due to the worker's union membership or activities? Always Compliant
Freedom of Association and Collective Bargaining
Does the employer refuse to bargain collectively or refuse to bargain in good faith with the union or worker representatives? Always Compliant
Freedom of Association and Collective Bargaining
Does the employer try to undermine the union(s) by negotiating directly with individual workers? Always Compliant
Freedom of Association and Collective Bargaining
Does the employer refuse to bargain collectively with union federations and confederations? Always Compliant
Freedom of Association and Collective Bargaining
Does the employer prevent workers from accessing copies of collective bargaining agreements or learning about their provisions? Always Compliant
Freedom of Association and Collective Bargaining
Has the employer tried to prevent any workers from participating in a strike? Always Compliant
Freedom of Association and Collective Bargaining
Has the employer hired new workers to replace striking workers during a strike? Always Compliant
Freedom of Association and Collective Bargaining
Has the employer failed to reinstate all eligible workers after a strike? Always Compliant
Freedom of Association and Collective Bargaining
Were security guards, the police or armed forces called by the employer to break up a peaceful strike or arrest striking workers? Always Compliant
Compensation
Does the employer pay workers 50% above the normal wage for regular working hours worked at night? Always Compliant
Compensation Are workers' cash wages paid in legal currency? Always Compliant
Compensation Do in-kind wage payments comply with national law? Always Compliant
Compensation Are workers paid at least every 15 days? Always Compliant
Compensation Are wages paid at the workplace? Always Compliant Compensation Are wages paid directly to workers? Always Compliant
Compensation
Does the employer restrict workers' freedom to use their wages as they choose? Always Compliant
Discrimination Do recruitment materials such as job announcements or job application Always Compliant
396 | P a g e
forms refer to the applicant's race, colour or origin?
Discrimination Is an applicant's race, colour or origin a factor in hiring decisions? Always Compliant
Discrimination Is race, colour or origin a factor in decisions regarding pay? Always Compliant
Discrimination
Is race, colour or origin a factor in decisions regarding opportunities for promotion or access to training? Always Compliant
Discrimination Is there harassment of workers on the basis of race, colour or origin? Always Compliant
Discrimination
Is race, colour or origin a factor in the employer's decisions regarding termination or retirement of workers? Always Compliant
Discrimination Is an applicant's religion or political opinion a factor in hiring decisions? Always Compliant
Discrimination
Is religion or political opinion a factor in decisions regarding conditions of work? Always Compliant
Discrimination Is religion or political opinion a factor in decisions regarding pay? Always Compliant
Discrimination
Is religion or political opinion a factor in decisions regarding opportunities for promotion or access to training? Always Compliant
Discrimination
Is there harassment of workers on the basis of religion or political opinion? Always Compliant
Discrimination
Is religion or political opinion a factor in the employer's decisions regarding termination or retirement of workers? Always Compliant
Discrimination
Is gender or marital status a factor in decisions regarding conditions of work? Always Compliant
Discrimination Is gender or marital status a factor in decisions regarding pay? Always Compliant
Discrimination
Is gender or marital status a factor in decisions regarding opportunities for promotion or access to training? Always Compliant
Discrimination
Is gender or marital status a factor in the employer's decisions regarding termination or retirement of workers? Always Compliant
Discrimination
Is maternity leave included in a worker's period of continuous service? Always Compliant
Forced Labour
Does the employer use violence or the threat of violence to intimidate workers? Always Compliant
397 | P a g e
Forced Labour
Does the employer force workers to work to discipline them or as punishment for participation in a strike? Always Compliant
Forced Labour
Does the employer deny workers access to their personal documents (such as birth certificates, passports, work permits and ID cards) when they need them? Always Compliant
Forced Labour
Does the employer use threats such as deportation, cancellation of visas or reporting to the authorities in order to force workers to stay at the job? Always Compliant
Forced Labour
Does the employer use any other coercive tactics to overwhelm workers' ability to make decisions in their own interest. Always Compliant
Forced Labour
Does the employer provide non-cash benefits that make workers so indebted to the employer that they are unable to leave the job? Always Compliant
Forced Labour
Has the employer ensured that the private employment agency does not use bonded labour? Always Compliant
Forced Labour
Can workers who owe other types of debt to the employer freely leave their jobs? Always Compliant
Forced Labour
If prison labour is used, have the prisoners freely consented to do the work? Always Compliant
Forced Labour
If prison labour is used, do the prisoners receive the same treatment as non-prison workers working in the factory? Always Compliant
398 | P a g e
Appendix 5 Compliance Trends Nicaragua The following tables represent points in which the factories are always compliant, headed towards compliance, or headed towards non-compliance: Core Labor Standard Question Outcome
Child Labor Does the employer cross-check worker’s age and documents as stipulated by national law?
Always compliant
Do workers under the age of 18 perform work that is hazardous by nature?
Always compliant
Do workers under the age of 18 work in long shifts?
Always compliant
Does the employer have permission from the parents or legal guardians of workers between the ages of 14 and 16, and approval from the Ministry of Labor?
Always compliant
Does the employer subject any workers under age 18 to the unconditional worst forms of child labour?
Always compliant
Have you found any workers under the age of 14?
Always compliant
Do workers under the age of 18 work more than 6 hours a day or 30 hours a week?
Always compliant
Do workers under the age of 18 work at night?
Always compliant
Compensation Does the employer restrict workers’ freedom to use their wages as they choose?
Always compliant
Does the employer pay at least minimum wage for regular hours of work to regular full time workers?
Always compliant
Does the employer pay at least minimum wage for regular hours of work to workers on probation?
Always compliant
Does the employer at least pay minimum wage for regular hours to
Always compliant
399 | P a g e
temporary workers?
Does the employer pay workers 100% more than their normal wage for all overtime hours worked on national holidays?
Always compliant
Does the employer pay workers 100% more than their normal wage for all for all ordinary overtime hours worked?
Always compliant
Does the employer pay workers 100% more than their normal wage for all overtime hours worked on weekly rest days?
Always compliant
Are wages paid directly to workers? Always compliant
Are wages paid on time? Always compliant
Are wages paid on working days? Always compliant
Does the employer pay workers correctly for paid national holidays?
Always compliant
Does the employer pay workers correctly during breastfeeding breaks?
Always compliant
Does the employer pay workers correctly during daily breaks?
Always compliant
Does the employer pay correctly for maternity leave?
Always compliant
Does the employer pay workers correctly during personal leave?
Always compliant
Does the employer pay workers correctly for non-working weekly rest days?
Always compliant
Does the employer pay workers their salaries during work stoppages caused by the employer?
Always compliant
Does the employer pay piece rate workers correctly for regular hours of work?
Always compliant
Does the employer pay piece rate workers correctly for regular hours of work?
Always compliant
Does the employer pay the correct portion of workers' salary when
Always compliant
400 | P a g e
workers take sick leave from one to three days?
Does the employer pay workers who are subpoenaed to testify as witness or as plaintiff or respondents in court cases or administrative hearings?
Always compliant
Has the employer made any unauthorized deductions from wages?
Always compliant
Are wages paid at the workplace or other appropriate location?
Always compliant
Contracts and Human Resources Does the employer comply with requirements for migrant workers’ contracts?
Always compliant
Does the employer comply with legal requirements limiting the number of consecutive fixed-term contracts?
Always compliant
Did the employer resolve grievances and disputes in compliance with legal requirements?
Always compliant
Do workers know and understand the terms and conditions of their employment relation?
Always compliant
Is the trial period for unlimited duration contracts limited to 30 days?
Always compliant
Does the employer get Ministry of Labour authorization prior to terminating workers for just cause?
Always compliant
Do workers who resign or are terminated receive severance based on years of service?
Always compliant
Does the recruitment process for migrant workers comply with legal requirements?
Always compliant
Does the employer comply with legal requirements when reducing the work force due to changes in operations?
Always compliant
Does the employer comply with requirements concerning Sub-contracted workers at the workplace?
Always compliant
401 | P a g e
Does the employer comply with legal requirements before suspending workers due to changes in operations?
Always compliant
Does the employer terminate workers for invalid reasons?
Always compliant
Has the employer complied with any orders to reinstate or compensate workers who were found to be unjustly terminated?
Always compliant
Discrimination Is disability a factor in decisions regarding conditions of work?
Always compliant
Is HIV/AIDS status a factor in decisions regarding conditions of work?
Always compliant
Is race, colour or origin a factor in decisions regarding conditions of work?
Always compliant
Is religion or political opinion a factor in decisions regarding conditions of work?
Always compliant
Is sexual orientation a factor in decisions regarding conditions of work?
Always compliant
Are disabled workers who apply for work evaluated according to their ability to perform the job?
Always compliant
Have all accommodations required by national law been made for physically disabled persons?
Always compliant
Has the employer taken steps to enable workers who become disabled for whatever reason to retain their work?
Always compliant
Does the factory employ the legally required proportion of disabled workers?
Always compliant
Is there harassment of workers on the basis of disability?
Always compliant
Is there harassment of workers on the basis of real or perceived HIV/AIDS status?
Always compliant
402 | P a g e
Is there harassment of workers on the basis of race, colour or origin?
Always compliant
Is there harassment of workers on the basis of religion or political opinion?
Always compliant
Is there harassment of workers on the basis of sexual orientation?
Always compliant
Is an applicant’s gender a factor in hiring decisions?
Always compliant
Is an applicant’s real or perceived HIV/AIDS status a factor in hiring decisions?
Always compliant
Is an applicant’s race, colour or origin a factor in hiring decisions?
Always compliant
Is an applicant’s religion or political opinion a factor in hiring decisions?
Always compliant
Is an applicant’s sexual orientation a factor in hiring decisions?
Always compliant
Does the employer allow workers with HIV/AIDS-related illnesses to work for as long as medically fit in available, appropriate work?
Always compliant
Has the employer taken legally required measures to help workers with HIV/AIDS-related illnesses?
Always compliant
Are HIV/AIDS tests required at hiring or at any time during employment?
Always compliant
Do job announcements refer to the applicant’s gender?
Always compliant
Does the employer change the employment status, position, wages, benefits or seniority of workers during maternity leave?
Always compliant
Is maternity leave excluded from workers’ period of continuous service?
Always compliant
Is disability a factor in decisions regarding pay?
Always compliant
Is gender a factor in decisions regarding pay?
Always compliant
403 | P a g e
Is HIV/AIDS status a factor in decisions regarding pay?
Always compliant
Is race, colour or origin a factor in decisions regarding pay?
Always compliant
Is religion or political opinion a factor in decisions regarding pay?
Always compliant
Is sexual orientation a factor in decisions regarding pay?
Always compliant
Does the employer require pregnancy tests or the use of contraceptives as a condition of employment?
Always compliant
Is disability a factor that affects decisions about job promotion or access to training?
Always compliant
Is gender a factor that affects decisions about job promotion or access to training?
Always compliant
Is HIV/AIDS status a factor that affects decisions about job promotion or access to training?
Always compliant
Is race, colour or origin a factor that affects decisions about job promotion or access to training?
Always compliant
Is religion or political opinion a factor that affects decisions about job promotion or access to training?
Always compliant
Is sexual orientation a factor that affects decisions about job promotion or access to training?
Always compliant
Do recruitment materials such as job announcements or job application forms refer to the applicant’s race, colour or origin?
Always compliant
Do recruitment materials such as job announcements or job application forms refer to the applicant’s religion or political opinion?
Always compliant
Is there sexual harassment of workers in the workplace?
Always compliant
Is religion or political opinion a factor in the employer’s decisions regarding termination or retirement
Always compliant
404 | P a g e
of workers?
Is disability a factor in the employer’s decisions regarding termination or retirement of workers?
Always compliant
Is gender a factor in the employer’s decisions regarding termination or retirement of workers?
Always compliant
Is a worker’s real or perceived HIV/AIDS status a factor in the employer’s decisions regarding termination or retirement of workers?
Always compliant
Is religion or political opinion a factor in the employer’s decisions regarding termination or retirement of workers?
Always compliant
Does the employer terminate workers who are pregnant or on maternity leave or force them to resign?
Always compliant
Is race, colour or origin a factor in the employer’s decisions regarding termination or retirement of workers?
Always compliant
Is sexual orientation a factor in the employer’s decisions regarding termination or retirement of workers?
Always compliant
Forced Labor Does the employer use any other coercive tactics to overwhelm workers’ ability to make decision in their own interest?
Always compliant
Can workers who owe debts for recruitment fees to the employer freely leave their jobs?
Always compliant
Does the employer delay or withhold wage payments in order to coerce workers to work?
Always compliant
Does the employer deny workers access to their personal documents (such as birth certificates, passports, work permits, ID Card) when they need them?
Always compliant
Does the employer use threats such as deportation, cancellation of visas, or reporting to the authorities in order to force workers to stay at the
Always compliant
405 | P a g e
job?
Does the employer restrict workers’ freedom to come and go from the dormitories and/or the industrial park or zone in which the factory is located?
Always compliant
In case of using prison labor, have inmates given their free consent?
Always compliant
Does the employer provide non-cash benefits that make workers so indebted to the employer that they are unable to leave the job?
Always compliant
Are workers forced to work overtime in order to earn minimum wage and/or reach production targets?
Always compliant
Does the employer set production targets that require workers to work overtime in order to earn minimum wage?
Always compliant
Does the employer force workers to work overtime beyond legal limits by threatening dismissal or other action that would reduce their future income?
Always compliant
Can workers who owe other types of debt to the employer freely leave their jobs?
Always compliant
Can workers who owe debts for recruitment fees to a third party freely leave their jobs?
Always compliant
If prison labour is used, do the prisoners receive similar treatment to non-prison workers working in the factory?
Always compliant
Does the employer restrict workers from leaving the workplace?
Always compliant
Does the employer force workers to work to discipline them or as punishment for participation in a strike?
Always compliant
If prison labour is used, is the work carried out under the supervision and control of a public authority?
Always compliant
406 | P a g e
Are workers free to terminate their employment with reasonable notice?
Always compliant
Does the employer use violence or the threat of violence to intimidate workers?
Always compliant
Freedom of Association and Collective Bargaining
Does the employer use blacklists to ensure that union members or union officials are not employed?
Always compliant
Has the employer tried to promote the formation of a workers’ organization to compete against existing union(s)?
Always compliant
Does the employer consult with the union when required by a collective agreement?
Always compliant
Has the employer tried to interfere with, manipulate, or control the union(s)?
Always compliant
Does the employer deduct union dues from workers’ wages at their (voluntary) request?
Always compliant
If there is a collective agreement, are the provisions at least as favourable for workers as the law?
Always compliant
Can workers freely form a union? Always compliant
Can workers freely join the union of their choice?
Always compliant
Has the employer hired new workers to replace workers during a strike?
Always compliant
Is a job applicant’s union membership or union activities a factor during hiring decisions?
Always compliant
Does the employer provide incentives to workers to keep them from joining a union or engaging in union activities?
Always compliant
Has the employer limited the issues that can be negotiated?
Always compliant
Are workers free to meet without management present?
Always compliant
Does the employer try to undermine Always compliant
407 | P a g e
the union(s) by negotiating directly with individual workers?
Has the employer not renewed a worker’s employment contract due to the worker’s union membership or activities?
Always compliant
Were security guards, the police or armed forces called by the employer to break up a peaceful strike or arrest striking workers?
Always compliant
Has the employer tried to prevent any workers from participating in a strike?
Always compliant
Has the employer punished any workers for participating in a strike?
Always compliant
Does the employer punish workers for joining a union or engaging in union activities?
Always compliant
Does the employer refuse to bargain collectively with union federations and confederations?
Always compliant
Has the employer failed to reinstate all eligible workers after a strike?
Always compliant
Does the employer require workers to join a union?
Always compliant
Has the employer terminated a union official without complying with legal procedures and requirements?
Always compliant
Does the employer threaten, intimidate, or harass workers who join a union or engage in union activities?
Always compliant
If there is more than one union, does the employer treat them equally?
Always compliant
Can the union(s) freely form and join federations and confederations of their choice?
Always compliant
Occupational Safety and Health Does the factory have a written Occupational Safety and Health (OSH) policy?
Always compliant
Has the employer designated a person exclusively devoted to OSH
Always compliant
408 | P a g e
promotion, prevention and protection?
Are workers punished if they remove themselves from work situations that they believe present an imminent and serious danger to life or health?
Always compliant
Are materials, tools, switches, and controls within easy reach of workers?
Always compliant
Are there sufficient measures in place to avoid heavy lifting by workers?
Always compliant
Are electrical wires, switches and plugs properly installed, grounded, and maintained?
Always compliant
Are appropriate safety warnings posted in the workplace?
Always compliant
Does the accommodation comply with minimum space requirements?
Always compliant
Does the accommodation have enough safe water?
Always compliant
Does the accommodation have adequate toilets, showers, sewage and garbage disposal systems?
Always compliant
Is the accommodation protected against fire?
Always compliant
Is the accommodation adequately protected against heat, cold, and dampness?
Always compliant
Is the accommodation protected against disease carrying animals or insects?
Always compliant
Is the accommodation protected against noise?
Always compliant
Is the accommodation adequately ventilated?
Always compliant
Does the accommodation have adequate cooking and storage facilities?
Always compliant
Is the accommodation adequately lit? Always compliant
409 | P a g e
Does the accommodation offer workers adequate privacy?
Always compliant
Does the accommodation comply with other health and safety requirements?
Always compliant
Has the employer adequately prepared for emergencies in the accommodation?
Always compliant
Does the employer provide accommodation for workers in the Free Trade Zone?
Always compliant
Does the workplace have a fire detection and alarm system?
Always compliant
Are there enough emergency exits? Always compliant
Does the employer conduct periodic emergency drills?
Always compliant
Working Time Does the employer provide the mandatory 30 minutes of rest for the regular work shift or a rest time agreed upon by both parties?
Always compliant
Does the employer provide the mandatory weekly rest period?
Always compliant
Does the employer provide required daily break periods?
Always compliant
Does the employer provide a weekly rest day after six consecutive days of work?
Always compliant
Do workers receive payment instead of time off for annual leave?
Always compliant
Core Labor Standard Question Outcome Compensation Does the employer properly
inform workers about wage payments and deductions?
Toward Compliance
Does the employer comply with other wage payments?
Toward Compliance
Are workers’ full wages paid in the manner required?
Toward Compliance
Does the employer pay workers correctly during medical leave?
Toward Compliance
Does the employer pay workers Toward Compliance
410 | P a g e
correctly for annual leave (vacation)?
Does the employer pay workers a 13th month of wages?
Toward Compliance
Contracts and Human Resources Have any workers been bullied, harassed, or subjected to humiliating treatment?
Toward Compliance
Do the internal by-laws comply with legal requirements?
Toward Compliance
Does the employer compensate workers for unused paid annual leave when they resign or are terminated?
Toward Compliance
Do all persons who perform work for the factory, both on the premises and offsite, have a contract?
Toward Compliance
Do workers have the opportunity to defend themselves before they are terminated based on their conduct or performance?
Toward Compliance
Do the disciplinary measures comply with the company’s by-laws approved by the Ministry of Labor?
Toward Compliance
Does the employer comply with employment procedures when hiring subcontractors at the workplace?
Toward Compliance
Discrimination Is gender a factor in decisions regarding conditions of work?
Toward Compliance
Freedom of Association and Collective Bargaining
Does the employer prevent workers from accessing copies of collective bargaining agreements or learning about their provisions?
Toward Compliance
Has the employer terminated workers for joining a union or engaging in union activities?
Toward Compliance
Occupational Safety and Health Does the workplace have adequate accessible toilets?
Toward Compliance
Are chemicals and hazardous substances properly labelled?
Toward Compliance
Does the employer comply with requirements on HIV/AIDS?
Toward Compliance
Does the factory require Toward Compliance
411 | P a g e
contractors and sub-contractors to comply with OSH standards?
Does the employer provide workers enough free safe drinking water?
Toward Compliance
Does the workplace have an adequate eating area?
Toward Compliance
Has the employer provided first-aid training for workers?
Toward Compliance
Does the employer comply with legal requirements regarding re-employment medical exams?
Toward Compliance
Does the employer have OSH technical organizational regulations (TOR) that are approved by the Ministry of Labor?
Toward Compliance
Is the temperature in the workplace acceptable?
Toward Compliance
Does the employer provide information on the chemicals and hazardous substances used in the workplace to the Ministry of Labour?
Toward Compliance
Are standing workers properly accommodated?
Toward Compliance
Does the employer provide adequate washing facilities and cleansing materials in the event of exposure to hazardous chemicals?
Toward Compliance
Does the employer investigate work-related accidents and indicate the technical recommendations necessary to prevent them?
Toward Compliance
Is the workplace adequately lit? Toward Compliance Has the employer ensured that
there are a sufficient number of readily accessible first aid boxes/supplies?
Toward Compliance
Does the employer have chemical safety data sheets for the hazardous chemicals used in the workplace?
Toward Compliance
Does the employer keep an Toward Compliance
412 | P a g e
inventory of chemicals and hazardous substances used in the workplace?
Are chemicals and hazardous substances properly stored?
Toward Compliance
Is the workplace clean and tidy? Toward Compliance Has the employer elaborated and
implemented an emergency plan? Toward Compliance
Are the emergency exits accessible, unobstructed and unlocked during working hours, including overtime?
Toward Compliance
Are emergency exits and escape routes clearly marked and posted in the workplace?
Toward Compliance
Does the workplace have adequate fire-fighting equipment?
Toward Compliance
Has the employer trained an appropriate number of workers to use the fire-fighting equipment?
Toward Compliance
Are proper guards installed and maintained on all dangerous moving parts of machines and equipment?
Toward Compliance
Does the workplace have adequate hand washing facilities and adequate soap?
Toward Compliance
Has the employer set up a joint worker/management OSH committee?
Toward Compliance
Has the employer taken action to assess, monitor, prevent and limit workers’ exposure to chemicals and hazardous substances?
Toward Compliance
Does the employer have an OSH license?
Toward Compliance
Has the employer elaborated an OSH training program?
Toward Compliance
Does the employer address safety and health risks to pregnant or nursing workers?
Toward Compliance
Does the employer report both accidents and non-occurrences to the Ministry of Labor?
Toward Compliance
Does the employer have a steam Toward Compliance
413 | P a g e
generator license? Do steam generating machine
operators have valid licenses? Toward Compliance
Has the employer effectively trained workers who work with chemicals and hazardous substances?
Toward Compliance
Are workers effectively trained to use the personal protective equipment that is provided?
Toward Compliance
Are workers effectively trained to use machines and equipment safely?
Toward Compliance
Is the workplace adequately ventilated?
Toward Compliance
Working Time If workers are paid for annual leave instead of receiving time off, is there a valid agreement between workers and management that provides for a portion of the leave to be paid?
Toward Compliance
Core Labor Standard Question Outcome Compensation Does the employer forward workers’
contributions for social security to the Nicaraguan Social Security Institute?
Never compliant/Toward non-compliance
Does the employer keep only one accurate payroll record?
Never compliant/Toward non-compliance
Does the employer pay 2% of the gross payroll to INATEC?
Never compliant/Toward non-compliance
Does the employer pay 16% of total wages to the Nicaraguan Social Security Institute
Never compliant/Toward non-compliance
Does the employer deduct 6.25% from all workers’ wages for contributions to social security?
Never compliant/Toward non-compliance
Contracts and Human Resources Do workers who resign or are terminated receive the accumulated thirteenth month payment?
Never compliant/Toward non-compliance
Freedom of Association and Collective Bargaining
Has the employer failed to implement any of the provisions of the collective agreement(s) in force?
Never compliant/Toward non-compliance
Do union representatives have access to the workers in the workplace?
Never compliant/Toward non-compliance
Occupational Safety and Health Do workers who are exposed to work-related hazards receive annual
Never compliant/Toward non-compliance
414 | P a g e
free health checks? Are the noise levels acceptable? Never compliant/Toward non-
compliance Does the employer provide workers
with all necessary personal protective clothing and equipment?
Never compliant/Toward non-compliance
Has the employer done an initial industrial hygiene risk assessment, a risk map, and annual risk assessments?
Never compliant/Toward non-compliance
Do workers have suitable chairs? Never compliant/Toward non-compliance