The impact of biogenic carbon sources on aerosol absorption inMexico City
N. A. Marley1, J. S. Gaffney2, M. Tackett2, N. C. Sturchio3, L. Heraty3, N. Martinez3, K. D. Hardy 4,A. Marchany-Rivera5, T. Guilderson6, A. MacMillan 7, and K. Steelman7
1Graduate Institute of Technology, University of Arkansas at Little Rock, Little Rock, AR, USA2Chemistry Department, University of Arkansas at Little Rock, Little Rock, AR, USA3Earth and Environmental Sciences, University of Illinois at Chicago, Chicago, IL, USA4Swarthmore College, 500 College Ave., Swarthmore, PA, USA5University of Puerto Rico, Mayaguez, Mayaguez, PR, Puerto Rico6Center for Accelerator Mass Spectrometry, Lawrence Livermore National Laboratory, Livermore, CA, USA7Chemistry Department, University of Central Arkansas, Conway, AR, USA
Received: 13 August 2008 – Published in Atmos. Chem. Phys. Discuss.: 24 October 2008Revised: 30 January 2009 – Accepted: 31 January 2009 – Published: 2 March 2009
Abstract. In order to determine the wavelength depen-dence of fine (<1 micron) atmospheric aerosol absorption inthe Mexico City area, the absorptionAngstrom exponents(AAEs) were calculated from hourly averages of aerosolabsorption measured at seven wavelengths (370, 450, 520,590, 660, 880, and 950 nm) with an aethalometer during twofield campaigns, the Mexico City Metropolitan Area study inApril 2003 (MCMA 2003) and the Megacity Initiative: Localand Global Research Observations in March 2006 (MILA-GRO). These results were compared to AAEs determined inthe laboratory from 850–280 nm (350 points) on 12-h fineaerosol samples collected at the same sites. The aerosolAAEs varied from 0.76 to 1.5 in 2003 and from 0.63 to 1.4in 2006. The AAE values determined in the afternoon wereconsistently higher than the corresponding morning values,suggesting the photochemical aging of the aerosols leading tothe formation of more highly UV absorbing organic aerosolspecies in the afternoon.
The AAE values were compared to stable and radiocarbonisotopic measurements of the 12-h aerosol samples to deter-mine the sources of the aerosol carbon. The fraction of mod-ern carbon (fM) in the aerosol samples, as determined from14C analysis, showed that an average of 70% of the carbona-ceous aerosols in Mexico City were from modern biomasssources during both field campaigns. The13C/12C ratios of
the aerosol carbon illustrate the significant impact of Yucatanforest fires (C-3 plants) in 2003 and local grass fires (C-4plants) in 2006. A direct comparison of the fM values, stablecarbon isotope ratios, and aerosol AAEs suggested that thewavelength dependence of the aerosol absorption was con-trolled by the biogenically derived aerosol components.
1 Introduction
Atmospheric aerosols play an important role in global cli-mate because of their ability to both scatter and absorb solarradiation. While aerosol scattering is primarily dependent onparticle size, aerosol absorption is largely dependent uponchemical composition. Those aerosols that have no signifi-cant absorption in the UVB-visible spectral region (e.g. sul-fate) act to scatter solar radiation, reducing the amount reach-ing the Earth’s surface and resulting in an overall cooling ef-fect. The cooling effect of anthropogenic sulfate aerosols inthe Northern Hemisphere has been estimated to be compara-ble in magnitude to the atmospheric warming produced fromincreases in carbon dioxide (CO2) (Kiel and Briegleb, 1993).Other aerosol species (e.g. black carbon) can both scatterand absorb solar radiation resulting in a cooling of the sur-face while simultaneously warming the atmosphere. Blackcarbon (BC) aerosols produced from incomplete combus-tion can reduce the amount of sunlight reaching the Earth’ssurface by as much as 10% (Ramanathan and Carmichael,
Published by Copernicus Publications on behalf of the European Geosciences Union.
1538 N. A. Marley et al.: Biogenic carbon impact on aerosol absorpton in Mexico City
2008). However, they also increase the solar energy absorbedin the atmosphere by as much as 50% in some areas leadingto heating of the particles and significant local warming ofthe boundary layer (Hermann and Hanel, 1997; Ramanathanand Carmichael, 2008). Absorbing aerosols may cause asmuch warming in the lower atmosphere as the major green-house gases, thus being a potentially important contributor toregional climate forcing (Ramanathan et al., 2007). The pres-ence of absorbing aerosols in the troposphere can thereforeresult in a local heating of the air altering atmospheric stabil-ity and affecting large-scale circulation patterns and hydro-logic cycles resulting in significant regional climate effects(Kaufman et al., 2002).
1.1 Aerosol absorption
The dominant light-absorbing aerosol species is thought tobe BC, commonly known as carbon soot, produced by in-complete combustion of fossil fuels and biomass burning.One of the largest sources of BC is emissions from dieselengines and therefore urban areas are thought to be one ofthe largest regional sources of absorbing aerosols dominatedby BC. The absorption of solar light by freshly emitted BCaerosols is broadband, decreasing monotonically with wave-length over the entire spectral region from UV to infrared(Marley et al., 2001).
Other light absorbing species are also present in atmo-spheric aerosols, including polycyclic and heterocyclic aro-matic hydrocarbons and their nitrated derivatives (Jacobson,1999), amino acids such as tryptophan in biological parti-cles (Pinnick et al., 2004), and polycarboxylic acids knownas “humic-like” substances (HULIS) (Cappiello et al., 2003).The polycyclic aromatic hydrocarbons (PAHs) are producedalong with BC during combustion of fossil fuels and their ni-trated derivatives are formed by atmospheric oxidation in thepresence of NO2. The HULIS are produced from biomassburning (Hoffer et al., 2006), by atmospheric oxidation ofBC (Decesari et al., 2002), or by atmospheric oxidation ofbiogenic hydrocarbons (Limbeck et al., 2003). These organiccarbonaceous aerosol species have an enhanced absorption atshorter wavelengths (<400 nm) leading to aerosol absorptionprofiles greater than that expected from BC aerosols alone(Gelencser et al., 2003).
The wavelength (λ) dependence of aerosol absorption (A)is usually approximated by a power-law expression;
A = βλ−α (1)
whereα is the absorptionAngstrom exponent (AAE) andβ is the aerosol absorption at 1µm. The value ofα de-pends on the chemical composition of the absorbing aerosol(Bergstrom et al., 2007). Freshly emitted BC particles fromdiesel engines have an AAE of 1 (Bergstrom et al., 2002;Marley et al., 2001) while carbonaceous aerosols producedfrom biomass burning have much stronger wavelength de-pendence of absorption, with an AAE of 2 (Kirchstetter et
al., 2004). The water soluble HULIS isolated from biomassburning aerosols have very high AAEs in the range of 6 to 7(Hoffer et al., 2006). Fine inorganic dust aerosols have beenassociated with a wide range of AAEs from values greaterthan 2 (Bergstrom et al., 2007) to less than 0.5 (Meloni et al.,2006) depending on their source and chemical composition.
An understanding of the wavelength dependence ofaerosol absorption is important for several applications. Anabsorbing aerosol with an AAE of 3 will have an absorp-tion coefficient in the UV that is 8 times larger than that inthe visible (Bergstrom et al., 2007). This is not only im-portant for the determination of the aerosol radiative forc-ing but also for atmospheric photochemical modeling. TheUV is the most important spectral range for the promotionof atmospheric photochemical reactions. The presence ofUV absorbing aerosols in the troposphere reduces the actinicflux throughout the boundary layer, which reduces the pro-duction of photochemical oxidants such as ozone and resultsin a buildup of the unreacted precursors in the atmosphere(Wendisch et al., 1996; Dickerson et al., 1997). The pres-ence of absorbing aerosols in Mexico City leads to a reduc-tion in the actinic flux below 430 nm by 10–30% (Castro etal., 2001). This reduction in UV radiation results in less sur-face level ozone produced in the city than would be expectedfrom the precursor concentrations. The unreacted precursorsare then transported out of the basin ultimately contributingto higher ozone levels in the surrounding region.
Aerosol absorption measurements have been used to deter-mine BC aerosol mass concentrations by using the BC massabsorption efficiencies. Routinely the mass absorption effi-ciency is determined experimentally at one wavelength andan AAE of 1 is assumed to obtain the mass absorption ef-ficiencies at other wavelengths (Hansen et al., 1984). Thisassumption can be a major source of error when comparingresults of aerosol BC concentrations obtained from differentmethods. In a recent study, it was concluded that a betterunderstanding of the wavelength dependence of aerosol ab-sorption and how it varies with aerosol composition is neededin order to reconcile BC measurements made with differentinstrumental methods (Park et al., 2006).
The wavelength dependence of aerosol absorption has alsobeen used to identify and classify different aerosol types(Meloni et al., 2006; Bergstrom et al., 2007). Remote sens-ing of aerosols by TOMS (Total Ozone Mapping Spectrome-ter) and OMI (Ozone Monitoring Instrument) type satellitesutilizes the ratio of reflected light at two near-UVB wave-lengths (e.g. 340 and 380 nm) to determine the type of ab-sorbing aerosols present in the atmosphere (Torres et al.,1998). Similar methods have been used to identify aerosolsin ground-based studies. While urban aerosols that containlarge concentrations of BC from the combustion of fossil fu-els are associated with an AAE near 1 and aerosols impactedby biomass burning are associated with AAEs around 2, thiscan vary depending on the wavelength range used. In a recentstudy, biomass burning aerosols observed in South Africa
N. A. Marley et al.: Biogenic carbon impact on aerosol absorpton in Mexico City 1539
yielded AAEs of 1.1 from 325–1685 nm and AAEs of 1.5from 325–1000 nm (Bergstrom et al., 2007).
A thorough understanding of the wavelength dependenceof aerosol absorption is therefore important for the estimationof aerosol radiative forcing as well as for the estimation ofatmospheric photochemical oxidant production on local andregional scales. It is also important to the interpretation ofsatellite retrievals and the identification of absorbing aerosolsources and types, as well as for the comparison of aerosolBC concentration measurements made by different measure-ment methods. In addition, in order to predict aerosol ab-sorption profiles over the atmospherically relevant spectralrange, the measured aerosol absorption must be correlated tothe type of absorbing aerosols present.
1.2 Carbon isotopic tracers
Carbon isotope measurements provide a powerful tool toidentify different types of carbonaceous aerosols. Carbon-14measurements can distinguish between fossil fuel and non-fossil fuel carbon sources. Carbon-14, produced naturally inthe upper atmosphere by the interaction of nitrogen atomswith thermal neutrons, is taken up as14CO2 and enters thecarbon cycle labeling all biogenic materials with a relativelyconstant initial14C/12C ratio of about 1.5×10⁻¹² (Currie etal., 1982). Fossil fuels and the BC aerosols produced fromtheir combustion contain no14C because their age (on the or-der of 100–200 million years) is much greater than the 5730-year half-life of the radiocarbon. Therefore, the14C contentin atmospheric aerosols, presented as the fraction of moderncarbon (fM) provides a direct measure of the relative contri-butions of carbonaceous materials derived from fossil fuelsand that derived from modern biomass sources.
Stable carbon isotope ratios are also useful for the iden-tification of carbonaceous aerosol sources. Different plantscan utilize two different photosynthetic pathways, denotedC-3 and C-4 according to the number of carbon atoms fixedby each pathway (Smith and Epstein, 1971). The differ-ence in atomic masses of the three carbon isotopes,12C,13C, and14C, affects the chemical reactivity and the phys-ical processes sufficiently to cause selective uptake of12CO2over both13CO2 and14CO2 during photosynthesis. The C-3 plants, which utilize the Calvin-Benson photosynthetic cy-cle, have a more selective chemistry and fractionate the heav-ier carbon isotope (13C) by about 12–14 parts per thousand ascompared to the less selective C-4 or Hatch-Slack photosyn-thetic pathway. The C-3 and C-4 plants will therefore be la-beled with different13C/12C ratios. The C-3 plants are mostabundant and comprise most tree species, shrubs, and cooltemperate grasses and sedges, while the C-4 plants consistmostly of warm temperate to tropical grasses (Sage, 2001).The13C/12C ratios (R) are commonly expressed asδ13C val-ues in per-mil (‰), and represent the difference between themeasuredR and that of a carbon isotope standard, typicallyCO2 prepared from Peedee belemnite (PDB) carbonate. The
measured13C/12C ratios of organic matter are generally13C-depleted compared to theR of the PDB standard and aretherefore reported as negative values. These resultingδ13Cvalues are used to estimate the relative contributions from C-3 (δ13C=−27±6) and C-4 (δ13C=−13±4) (Boutton, 1991)plant sources to atmospheric carbonaceous aerosols.
1.3 Mexico City field studies
The Mexico City metropolitan area (MCMA) is the largesturban center in North America. Due to the high traffic densi-ties and increased energy usage, Mexico City suffers fromhigh levels of particulate BC pollution. The presence ofhighly absorbing aerosols in Mexico City has lead to a re-duction in solar flux of 17.6% (Raga et al., 2001). The massof absorbing aerosols exported from the MCMA into the sur-rounding region is estimated to be 6000 metric tons per dayor 2 mega-tons per year (Gaffney et al., 1999). Since freshlyformed combustion aerosols are hydrophobic, they are ex-pected to be more resistant to washout and have longer life-times than more hygroscopic aerosols such as sulfate and ni-trate (Gaffney and Marley, 2005; Dua et al., 1999). In addi-tion, since Mexico City is at an altitude of 2250 m (7300 ft),these aerosols are released into the atmosphere at altitudesconsidered to be in the free troposphere elsewhere. The ab-sorbing aerosols exported from the Mexico City basin aretherefore assumed to have longer lifetimes than aerosols re-leased at lower altitudes (Raga et al., 2001). Thus, theMCMA can be a major source of carbonaceous aerosols tothe surrounding regions impacting the radiative balance andclimate on a regional scale.
In order to better understand the sources of absorbingaerosols in the Mexico City basin and their impact on re-gional climate, the Mexico City 2003 field study was con-ducted in April of 2003, as part of the US Department of En-ergy’s (USDOE) Atmospheric Science Program (ASP). Thisstudy was in collaboration with the Mexico City Metropoli-tan Area 2003 (MCMA 2003) air quality study organized byM. J. Molina and L. T. Molina of the Massachusetts Instituteof Technology. Aerosol absorption measurements were ob-tained as a function of wavelength at the Centro Nacional deInvestigacion y Capacitacion Ambiental (CENICA), on theIztapalapa campus of the Universidad Autonoma Metropoli-tana (UAM). In addition, fine mode (<1 micron) aerosolsamples were collected every 12 h at the site.
In March 2006, a multiagency field campaign was under-taken in Mexico City called the Megacity Initiative: Localand Global Research Observations (MILAGRO). The MILA-GRO study was composed of four collaborative field exper-iments, including the Megacity Aerosol Experiment, Mex-ico City 2006 (MAX-Mex) sponsored by the USDOE/ASP.The MAX-Mex field study was focused on the investigationof the direct radiative effect of aerosols in the Mexico Cityplume as a function of time, location, and processing condi-tions. Aerosol absorption measurements were obtained as a
1540 N. A. Marley et al.: Biogenic carbon impact on aerosol absorpton in Mexico City
function of wavelength at the Instituto Mexicano del Petroleo(IMP), in the northwestern part of the MCMA. This site,known as T0, was chosen to represent the fresh emissionsfrom the urban center. Fine mode aerosol samples were col-lected at site T0 and also at the Technological University ofTecamac, located 18 mi northwest of T0. This second site,known as T1, was expected to represent a mixture of freshand aged pollutants as they exit the basin.
Results are presented here for AAEs calculated fromaerosol absorption measurements at seven wavelengths ob-tained by using a seven-channel aethalometer located inMexico City during the two field campaigns in April 2003and March 2006. These results are compared to AAEs cal-culated from continuous UV-visible absorption profiles ob-tained on the 12-h aerosol samples collected in the field. Dur-ing both study periods substantial biomass burning eventswere observed, which were found to affect the aerosol ab-sorption. The AAEs are compared to both stable and ra-diocarbon isotopic measurements made on the 12-h aerosolsamples to evaluate the sources of carbon that give rise to theobserved differences in aerosol absorption properties.
2 Experimental methods
2.1 Sample sites
Aerosol absorption measurements were obtained from 3April 2003 (day 93) to 1 May 2003 (day 121) on the rooftopof the CENICA laboratory building (19◦21′ 44.541′′ N,99◦04′ 16.425′′ W, elevation of 2247 m above sea level)on the Iztapalapa campus of the Universidad AutonomaMetropolitana (UAM). The UAM consists of 30 buildings ona campus of restricted traffic flow. It is located in the north-eastern section of the MCMA in an area dominated by lowcost housing and small industries.
Measurements of aerosol absorption were also obtained in2006 from 10 March (day 69) to 29 March (day 88) at the In-stituto Mexicano de Petroleo Laboratories (IMP). This site,known as T0, is located in the north central part of Mex-ico City (latitude 19◦29′ N, longitude 99◦09′ W, altitude of2240 m a.s.l.) approximately 16 km (10 mi) north-northeastof the CENICA site. The IMP complex is a restricted cam-pus of 33 buildings located in an industrial and commercialarea of Mexico City surrounded by streets that are very heav-ily travelled by light duty vehicles and diesel busses. Thenearest major roads are approximately 300 m away from themeasurement site.
Aerosol samples were collected at both CENICA and IMPsites as well as at the Technological University of Tecamac,State of Mexico, (latitude 19◦43′ N, longitude 98◦58′ W, alti-tude 2340 m a.s.l.) from 1 March 2006 (day 60) to 29 March2006 (day 88). This site, known as T1, was approximately30 km (18 mi) north of Mexico City. The main transporta-tion route through Tecamac is public road No. 85, which runs
north-south from Mexico City to Pachuca. The municipalityof Pachuca, located 94 km (58 mi) northeast of Mexico Cityand 64 km (40 mi) northeast of Tecamac, is also a potentialsource of emissions at site T1.
2.2 Aerosol sampling
Samples of fine mode (<1.0 micron) aerosols were collectedat each site by using high volume samplers (Hi-Q Envi-ronmental Products, Model HVP-3800AFC) equipped withcascade impactors (Thermo Anderson). The samplers wereequipped with brushless, three stage centrifugal fan blow-ers controlled by an electronic mass flow sensor that detectschanges in the operator’s pre-set flow rate caused by changesin temperature, barometric pressure, and pressure drop dueto particulate loading on filter media. The high-volume sam-pler compensates for these changes by adjusting the motorspeed to maintain the pre-set flow rate at 40 standard cubicfeet per minute (scfm). Three separate LCDs display elapsedtime, total volume of air sampled, and instantaneous flowrate, which are recorded at the beginning and end of eachsample interval.
The aerosol samples were collected on 8 in×10 in glassfiber filters (Whatman) in 2003 and 8 in×10 in quartz fiberfilters (Pall Life Sciences) in 2006. The samples were takenat 12-h intervals from 05:30 to 17:30 and from 17:30 to05:30 local standard time (LST). The volume of air sampledduring the 12-h time period averaged 740 m3 with an aver-age aerosol loading of 13 mg total carbon content (18µg/m3;σ=5µg/m3).
2.3 Aerosol absorption measurements
The absorption of fine aerosols was measured in the field byusing a 7-wavelength aethalometer (Thermo-Andersen) witha sample inlet designed to collect aerosols in the size rangeof 0.1–2µm (Hermann et al., 2001). The aethalometer iscurrently the best method available for the measurement ofaerosol AAEs in the field. This is the only instrument that al-lows for the measurement of aerosol absorption at more than2 wavelengths and includes the UVB spectral range. Sincemost of the enhanced absorption occurs in the UVB range,instruments that only use visible wavelengths will underes-timate the AAEs. However, the use of the aethalometer hasbeen met with some controversy due to the inherent difficul-ties associated with the measurement of light attenuation bysolid samples (Schmid et al., 2005; Arnott et al., 2005).
The aerosols in the sample air are collected within theaethalometer by continuous filtration through a paper tapestrip. The optical attenuation of light transmitted through theparticle laden filter is measured sequentially at seven wave-lengths (370, 450, 520, 590, 660, 880, and 950 nm) by chang-ing the LED sources. At low sample loadings, light scat-tering from the filter surface causes a reduction in intensitythat is not associated with aerosol absorption, resulting in a
N. A. Marley et al.: Biogenic carbon impact on aerosol absorpton in Mexico City 1541
positive error in the attenuation measurements. To reduce theoccurrence of these light scattering artifacts, the instrumentcollects some sample onto the filter before taking measure-ments. As the sample is deposited on the paper tape strip,light attenuation increases steadily. At high sample loadings,high absorption values cause the instrument sensitivity to de-crease. Therefore, the instrument automatically advances thetape to a new sample spot when light attenuation becomessevere.
Under normal operating conditions, the instrument calcu-lates the BC concentration ([BC]) of the sample from themeasured optical attenuation (ATN) by Eq. (2).
ATN = σ ∗[BC] (2)
The values for BC mass absorption efficiency (σ ) are deter-mined from a previous comparison of aerosol light transmis-sion measurements with thermal evolution methods, assum-ing a wavelength dependence ofλ−1 over the aethalometer’sspectral range (Gundel et al., 1984; Hansen et al., 1982).Equation (2) also assumes that BC is the main absorbingaerosol species in the samples and that the sample path lengthis negligible and constant. Multiple scattering of light withinthe sample and filter substrate can cause an increase in pathlength, which changes as the filter becomes more heavilyloaded with particles. In order to obtain quantitative mea-surements of aerosol BC concentrations from the light at-tenuation measurements, corrections must be made for theselight scattering errors (Arnott et al., 2005). However, as longas these errors are not wavelength dependent, they will notbe important in the calculation of aerosol AAEs.
The aethalometer results for BC aerosol concentrations(µg/m3) were converted to aerosol optical absorption (m−1)
at each wavelength by using the manufacturer’s values for themass absorption efficiencies. The calculated aerosol absorp-tion measurements were recorded at five-minute intervals foreach of the seven wavelengths. Measurements obtained justprior to and immediately after the filter tape advance werediscarded as outliers (Arnott et al., 2005). The AAEs werecalculated from one-hour averages of the five minute opticalabsorption measurements at the seven wavelengths by a leastsquares fit to Eq. (3).
ln(A) = −α ln λ + ln β (3)
The correlation coefficient (r2) obtained from the leastsquares fit serves as a measure of the assumption that thewavelength dependence of the aerosol absorption follows theexponential relationship in Eq. (1). The correlation coef-ficients from these calculations varied from 0.9999 to 0.96with a standard deviation of 0.004 in 2003 and from 0.9997to 0.95 with a standard deviation of 0.006 in 2006, indicatingthat the AAE is a good representation of the wavelength de-pendence of the aerosol absorption for the majority of mea-surements.
Aerosol absorption profiles were also obtained in the lab-oratory on the 12-h aerosol samples collected at each site(Marley et al., 2001). Spectra were recorded from 850 to280 nm at a spectral resolution of 1.6 nm with a researchgrade UV-visible-NIR spectrometer (Perkin Elmer, Lambda1050) equipped with an integration sphere reflectance acces-sory (Labsphere) developed specifically for the analysis ofsolid samples. Aerosol AAEs were calculated from the dif-fuse reflectance spectra by a least squares fit to Eq. (3) usingall 350 points.
The integration sphere is designed to collect all the lightscattered by the surface of the sample and direct it back tothe detector (Marley et al., 2001). Therefore, all light scat-tered from the sample surface is measured by the detectorand any reduction in intensity is due to sample absorptiononly. The interior of the sphere is coated with a perfectly dif-fuse reflectance coating (Spectralon®) and the detector viewis limited to incident flux that has undergone at least two re-flections from the sphere surface. This assures that the in-cident beam undergoes multiple reflections in the interior ofthe sphere increasing the sensitivity of the technique.
The relationship between absorbance and the diffuse re-flectance is described by the Kubelka-Munk function,F (R)as
F(R) = (1 − R2)/2R = k/s (4)
whereR is the intensity of light reflected from the sample,k
is the Kubelka-Munk absorption coefficient ands is the sam-ple scattering coefficient. The sample scattering coefficientis related to the real refractive index (n) of the bulk material,which is not significantly wavelength dependent (Marley etal., 2001). The wavelength dependence ofF (R) is thereforea direct measure of the wavelength dependence of the sampleabsorption. In addition,F(R) is not dependent on the sam-ple path length as in transmission spectroscopy. Therefore,multiple reflections within the filter do not present a sourceof error in reflection spectroscopy and can be neglected.
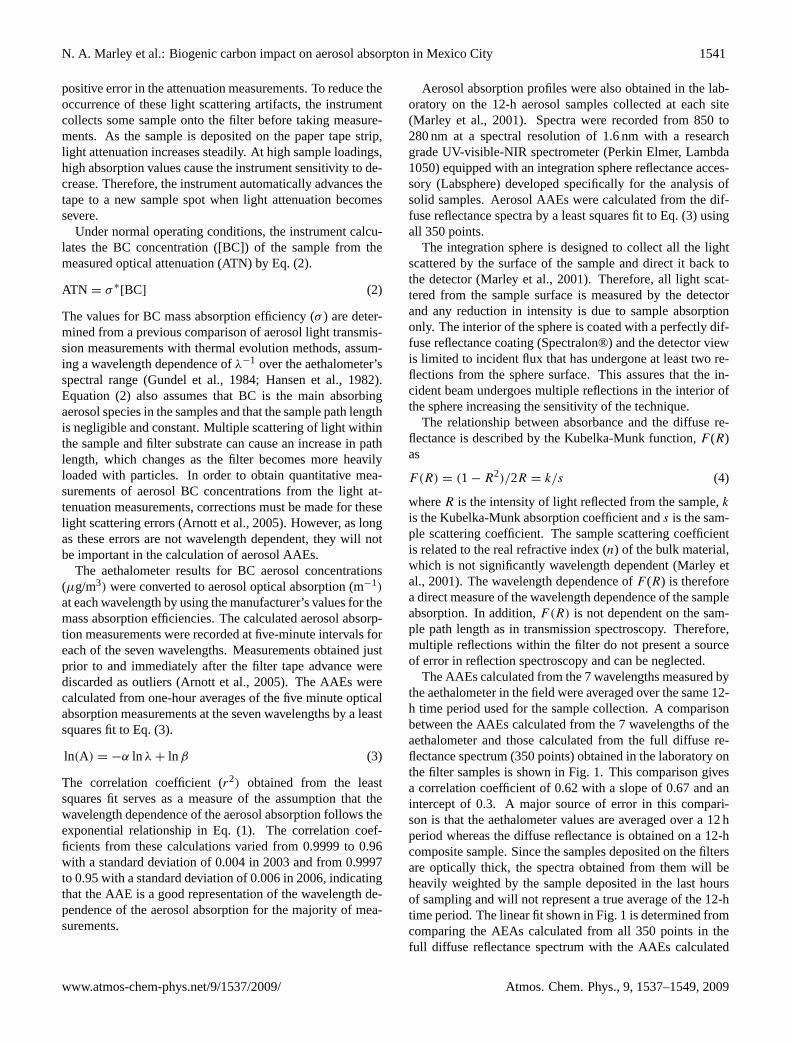
The AAEs calculated from the 7 wavelengths measured bythe aethalometer in the field were averaged over the same 12-h time period used for the sample collection. A comparisonbetween the AAEs calculated from the 7 wavelengths of theaethalometer and those calculated from the full diffuse re-flectance spectrum (350 points) obtained in the laboratory onthe filter samples is shown in Fig. 1. This comparison givesa correlation coefficient of 0.62 with a slope of 0.67 and anintercept of 0.3. A major source of error in this compari-son is that the aethalometer values are averaged over a 12 hperiod whereas the diffuse reflectance is obtained on a 12-hcomposite sample. Since the samples deposited on the filtersare optically thick, the spectra obtained from them will beheavily weighted by the sample deposited in the last hoursof sampling and will not represent a true average of the 12-htime period. The linear fit shown in Fig. 1 is determined fromcomparing the AEAs calculated from all 350 points in thefull diffuse reflectance spectrum with the AAEs calculated
1542 N. A. Marley et al.: Biogenic carbon impact on aerosol absorpton in Mexico City
Figure 1. Comparison between aerosol absorption Ǻngstrom exponents calculated from aerosol absorption measured at 7 wavelengths with an aethalometer and absorption measured by diffuse reflectance at 350 wavelengths between 280-850 nm. The reported linear fit is for diffuse reflectance calculated from the same wavelengths used by the aethalometer.
0 0.5 1 1.5 2
diffuse reflectance (350 points)
0
0.5
1
1.5
2
aeth
alom
eter
(7 p
oint
s)
Fig. 1. Comparison between aerosol absorptionAngstrom ex-ponents calculated from aerosol absorption measured at 7 wave-lengths with an aethalometer and absorption measured by diffusereflectance at 350 wavelengths between 280–850 nm. The reportedlinear fit is for diffuse reflectance calculated from the same wave-lengths used by the aethalometer.
using only the 6 wavelengths that correspond to those usedby the aethalometer (370, 450, 520, 590, 660, and 880 nm).This comparison yields a correlation coefficient of 0.86 witha slope of 0.82 and an intercept of 0.2 and represents the er-rors introduced in the calculation of the AAEs by using asmall set of wavelengths.
2.4 Carbon measurements
The aerosol samples collected in 2003 were oxidized to CO2by using a low-temperature oxygen plasma (Rowe and Steel-man, 2002). A custom-built plasma oxidation apparatus al-lowed for collection of CO2 in a glass sample tube. A glowdischarge was produced by radio frequency (RF) capacitivecoupling with two external copper electrodes on either endof a 12 cm×4.6 cm glass sample chamber. Vacuum condi-tions were maintained with a turbomolecular pump and adiaphragm fore pump. Successive oxygen plasmas (1 torr;100 W) were used to clean the empty sample chamber untilless than 1µg of carbon remained. Approximately 60 cm2 ofthe aerosol filter sample was inserted into the sample cham-ber under a positive pressure to prevent the introduction ofatmospheric CO2 or particulates. A one-hour argon plasma(1 torr; 40 W) was used to remove adsorbed gases followedby a one-hour oxygen plasma (1 torr; 100 W), which con-verted the carbonaceous material on the filter to CO2 andH2O. A second oxygen plasma was performed to ensurequantitative transfer of carbon from the filter.
The samples collected in 2006 were converted to CO2 bythermal combustion. Each sample was sealed under vacuumin a quartz tube with copper oxide, metallic copper and sil-ver and combusted at 900◦C. The CO2 produced from thecombustion was cryogenically isolated from other combus-tion products and the amount was measured manometrically.
The CO2 collected from the aerosol samples was con-verted to graphite by hydrogen reduction using an iron cat-alyst. The resulting graphitic carbon was then pounded intoan Al target and the14C/12C ratios were measured by ac-celerator mass spectrometry (AMS) at the Center for Accel-erator Mass Spectrometry (CAMS) at Lawrence LivermoreNational Laboratory (LLNL). The results are reported as thefraction of modern carbon (fM) in the total carbon of theaerosol sample (Stuiver and Polach, 1977).
Samples of CO2 were also isolated by thermal combus-tion of the aerosol samples for the determination of13C con-tent by stable isotope ratio mass spectrometry. Isotope ratiomeasurements of CO2 were made using an Elemental Ana-lyzer (Carlo Erba NCS 2500) coupled to a triple-collector gassource mass spectrometer (Thermo Finnigan Delta Plus XL).Two l-glutamic acid references (USGS-40;δ13C=−26.39and USGS-41;δ13C=+37.63) were analyzed concurrentlywith the samples. All references were matrix matched tothe aerosol samples by the addition of blank quartz filters.Vanadium pentoxide was added to all references and sam-ples to ensure complete combustion in the elemental ana-lyzer. Masses 44, 45, and 46 (CO2+ions) were measuredin the samples and standard gases. Isotope ratios were cal-culated by comparison with those in the reference CO2 sam-ples calibrated to the Solenhofen Limestone standard (NBS-20), which had a13C/12C ratio of 0.0112253 (Craig, 1957).The results are reported in conventional delta (δ) notation de-scribed by
δ13C = [(Rsample/Rstandard) − 1] × 1000 (5)
whereR is the atom ratio13C/12C expressed in units of per-mil (‰) deviation relative to the isotopic reference mate-rial standard (VPDB) for whichδ13C is defined as 0.00‰(Coplin et al., 2006). The analytical uncertainty of theδ13Cvalues reported here is±0.3‰.
3 Results and discussion
3.1 Aerosol absorption
The aerosol AAEs calculated from the aethalometer absorp-tion measurements made in Mexico City in April 2003 andMarch 2006 are shown in Fig. 2. In 2003 the AAEs var-ied from 0.76 to 1.5 with an overall average of 1.05. TheAAEs determined at site T0 in 2006 were slightly lower witha range of 0.63 to 1.4 and an average of 0.94. Figure 3 showsthe AAEs averaged over the morning (06:00–12:00 LST)and afternoon (12:00–18:00 LST) hours for April 2003 andMarch 2006. For the majority of days during both studies, theafternoon AAEs were higher than the morning values. Thedifference between morning and afternoon AAEs in 2003ranged from 0.08 to 0.29 with an average of 0.14, excludingday 99. The afternoon of day 99 was dominated by a par-ticularly turbulent thunderstorm (see Fig. 4) that lofted fine
N. A. Marley et al.: Biogenic carbon impact on aerosol absorpton in Mexico City 1543
Figure 2. Aerosol absorption Ǻngstrom exponents calculated from aerosol absorption measured at 7 wavelengths in Mexico City during April 2003 (top) and March 2006 (bottom)
Fig. 2. Aerosol absorptionAngstrom exponents calculated fromaerosol absorption measured at 7 wavelengths in Mexico City dur-ing April 2003 (top) and March 2006 (bottom).
dust, accompanied by heavy cloud cover that significantlyreduced solar radiation in Mexico City during the day. Finedust aerosols have been associated with low AAEs (Meloniet al., 2006). In addition, the reduced solar flux caused byincreased cloud cover would result in decreased photochem-istry and a decreased production of oxidized aerosol species(Tang et al., 2003). This resulted in the afternoon averageAAE being lower than the morning average AAE for day 99.
The last week of March 2006 (after day 82) was againdominated by heavy thunderstorms accompanied by largeamounts of dust lofting and heavy cloud cover (see Fig. 4).This resulted in AAEs during this period that were lower thanthe rest of the study period in 2006 and were also essentiallythe same for both morning and afternoon hours. During theremaining study period (excluding the days 82 through 88)the difference between morning and afternoon AAEs rangedfrom 0.06 to 0.22 with an average of 0.13, resembling theresults obtained in 2003.
A rapid photochemical production of secondary organicaerosols (SOA) has been observed in the Mexico City areaprimarily in the morning hours beginning at 08:00 (Salcedo
Figure 3. Aerosol absorption Ǻngstrom exponent s calculated for morning (o) and afternoon (•) hours in Mexico City during April 2003 (top) and March 2006 (bottom).
Fig. 3. Aerosol absorptionAngstrom exponents calculated formorning (o) and afternoon (•) hours in Mexico City during April2003 (top) and March 2006 (bottom).
et al., 2006; Hennigan et al., 2008; Aiken et al., 2008; Volka-mer et al., 2006; Paredes-Miranda et al., 2008). Thus, theincrease in aerosol AAEs in the afternoons cannot be ex-plained by the formation of SOA alone. This increase inAAEs in the afternoon hours is therefore most likely due tothe photochemical aging of preexisting aerosols leading tomore highly UV absorbing oxidized organic species such asHULIS, resulting in higher AAEs than observed from eitherthe fresh primary emissions or SOA formation in the morn-ing (Mang et al., 2008; Walser et al., 2007; Decesari et al.,2002).
The values of the AAEs averaged over the nighttime hours(18:00–06:00 LST) were consistently intermediate betweenmorning and afternoon values during both field studies. Thisis due to a combination of the venting of the aged pollutantsin the basin at night (de Foy et al., 2006) and fresh eveningemissions replacing them. The resulting nighttime aerosolsremaining in the basin are a mixture of some photochemi-cally aged aerosols from the previous afternoon and freshlyemitted aerosols at night yielding AAEs that fall betweenthose typical of fresh emissions observed in the morningsand those of photochemically aged aerosols observed in theafternoons.
1544 N. A. Marley et al.: Biogenic carbon impact on aerosol absorpton in Mexico City
Figure 4. Rain intensity (mm/hr) measured at CENICA in April 2003 (A) and at sites T0 (B) and T1 (C) in March 2006.
Fig. 4. Rain intensity (mm/hr) measured at CENICA in April 2003(A) and at sites T0(B) and T1(C) in March 2006.
The highest AAEs were observed in 2003 during the lastweek of April (days 116 to 120), with hourly averages rang-ing from 0.9 to 1.6 and an overall average of 1.2 (see Fig. 2).Satellite data has shown that smoke plumes from widespreadYucatan fires in 2003 heavily impacted the Valley of Mexicoduring the entire month of April. The most direct impacts onMexico City occurred during the last week of April (Massieet al., 2006). Although both deforestation and crop residuefires are common in the Yucatan (Yokelson, 2009), the emis-sions from fires in 2003 were particularly intense. True-colorsatellite images clearly show smoke plumes that originatedfrom the Mexico-Guatemala border impacting Mexico Cityon April 18 (day 108), which was also a period of the highAAEs (Massie et al., 2006). These results agree with previ-ous studies that show aerosols associated with biomass burn-ing typically have higher AAEs than aerosols produced bythe combustion of fossil fuels (Hoffer et al., 2006; Kirchstet-ter et al., 2004).
Figure 5. Fraction of modern carbon in fine aerosol samples collected at CENICA in Mexico City in April 2003 (top) and at sites T0 (•) and T1 in (o) March 2006 (bottom).
90 95 100 105 110 115 120 125Day of Year
0
0.1
0.2
0.3
0.4
0.5
0.6
0.7
0.8
0.9
1
Frac
tion
of M
oder
n C
arbo
n
55 60 65 70 75 80 85 90Day of Year
0
0.2
0.4
0.6
0.8
1
Frac
tion
of M
oder
n C
arbo
n
Fig. 5. Fraction of modern carbon in fine aerosol samples collectedat CENICA in Mexico City in April 2003 (top) and at sites T0 (•)and T1 in (o) March 2006 (bottom).
3.2 Carbon-14 measurements
The fM values measured in the fine aerosol samples collectedin Mexico City are shown in Fig. 5. At the CENICA site inApril 2003, the fM ranged from 0.56 to 0.86 with an aver-age of 0.70. The fM in samples collected in March 2006ranged from 0.42 to 0.75 with an average of 0.60 at site T0and from 0.55 to 0.96 with an average of 0.76 at site T1.Overall, the carbonaceous aerosols produced in the MexicoCity basin consisted of approximately 70% biogenic materi-als. These biogenic aerosol components can be derived eitherfrom biomass burning or from SOA formation from biogenicprecursors.
Other studies conducted in the Mexico City area duringeither MCMA2003 or MILAGRO have found evidence oflarge impacts from biomass burning during both campaigns(Yokelson et al., 2007, 2009; Johnson et al., 2006; Moffet etal., 2008; DeCarlo et al., 2008; Stone et al., 2008). Aircraftstudies in the Yucatan estimated that approximately 44 Tg ofbiomass was burned in the Yucatan in the spring of 2006 fromboth forest and crop clearing (Yokelson et al., 2009). Mea-surements of particulate to CO ratios suggested that as muchas 79–92% of the primary fine particulate mass in the Mexico
N. A. Marley et al.: Biogenic carbon impact on aerosol absorpton in Mexico City 1545
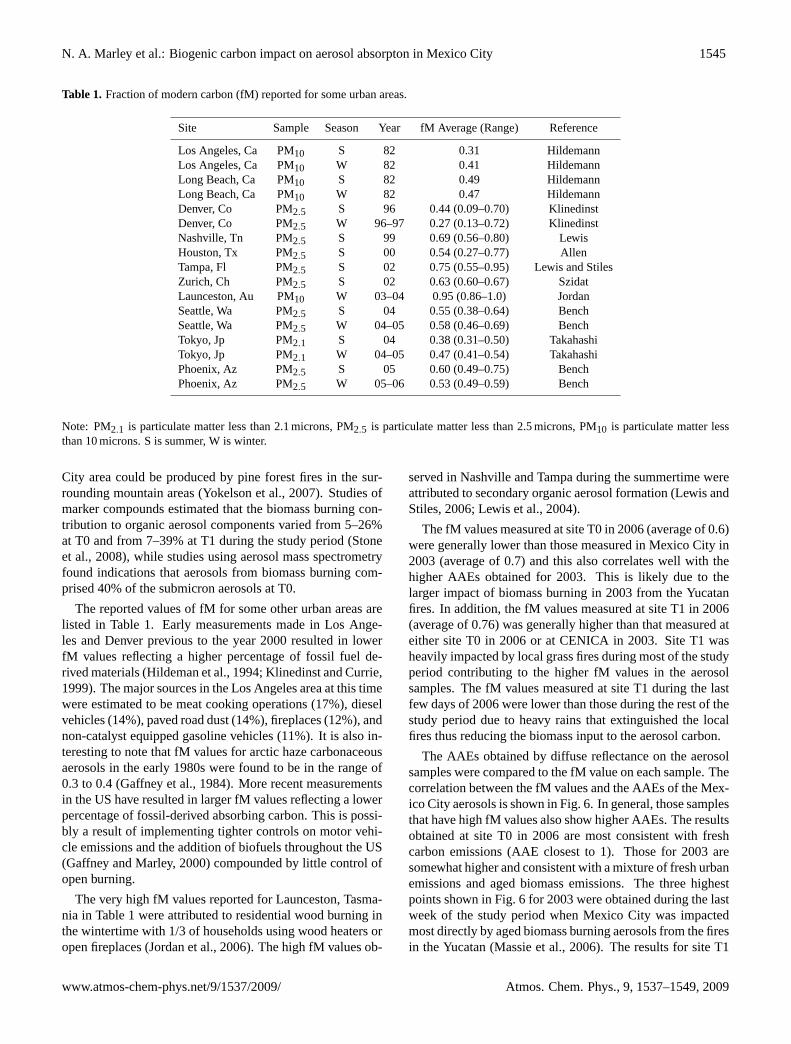
Table 1. Fraction of modern carbon (fM) reported for some urban areas.
Site Sample Season Year fM Average (Range) Reference
Los Angeles, Ca PM10 S 82 0.31 HildemannLos Angeles, Ca PM10 W 82 0.41 HildemannLong Beach, Ca PM10 S 82 0.49 HildemannLong Beach, Ca PM10 W 82 0.47 HildemannDenver, Co PM2.5 S 96 0.44 (0.09–0.70) KlinedinstDenver, Co PM2.5 W 96–97 0.27 (0.13–0.72) KlinedinstNashville, Tn PM2.5 S 99 0.69 (0.56–0.80) LewisHouston, Tx PM2.5 S 00 0.54 (0.27–0.77) AllenTampa, Fl PM2.5 S 02 0.75 (0.55–0.95) Lewis and StilesZurich, Ch PM2.5 S 02 0.63 (0.60–0.67) SzidatLaunceston, Au PM10 W 03–04 0.95 (0.86–1.0) JordanSeattle, Wa PM2.5 S 04 0.55 (0.38–0.64) BenchSeattle, Wa PM2.5 W 04–05 0.58 (0.46–0.69) BenchTokyo, Jp PM2.1 S 04 0.38 (0.31–0.50) TakahashiTokyo, Jp PM2.1 W 04–05 0.47 (0.41–0.54) TakahashiPhoenix, Az PM2.5 S 05 0.60 (0.49–0.75) BenchPhoenix, Az PM2.5 W 05–06 0.53 (0.49–0.59) Bench
Note: PM2.1 is particulate matter less than 2.1 microns, PM2.5 is particulate matter less than 2.5 microns, PM10 is particulate matter lessthan 10 microns. S is summer, W is winter.
City area could be produced by pine forest fires in the sur-rounding mountain areas (Yokelson et al., 2007). Studies ofmarker compounds estimated that the biomass burning con-tribution to organic aerosol components varied from 5–26%at T0 and from 7–39% at T1 during the study period (Stoneet al., 2008), while studies using aerosol mass spectrometryfound indications that aerosols from biomass burning com-prised 40% of the submicron aerosols at T0.
The reported values of fM for some other urban areas arelisted in Table 1. Early measurements made in Los Ange-les and Denver previous to the year 2000 resulted in lowerfM values reflecting a higher percentage of fossil fuel de-rived materials (Hildeman et al., 1994; Klinedinst and Currie,1999). The major sources in the Los Angeles area at this timewere estimated to be meat cooking operations (17%), dieselvehicles (14%), paved road dust (14%), fireplaces (12%), andnon-catalyst equipped gasoline vehicles (11%). It is also in-teresting to note that fM values for arctic haze carbonaceousaerosols in the early 1980s were found to be in the range of0.3 to 0.4 (Gaffney et al., 1984). More recent measurementsin the US have resulted in larger fM values reflecting a lowerpercentage of fossil-derived absorbing carbon. This is possi-bly a result of implementing tighter controls on motor vehi-cle emissions and the addition of biofuels throughout the US(Gaffney and Marley, 2000) compounded by little control ofopen burning.
The very high fM values reported for Launceston, Tasma-nia in Table 1 were attributed to residential wood burning inthe wintertime with 1/3 of households using wood heaters oropen fireplaces (Jordan et al., 2006). The high fM values ob-
served in Nashville and Tampa during the summertime wereattributed to secondary organic aerosol formation (Lewis andStiles, 2006; Lewis et al., 2004).
The fM values measured at site T0 in 2006 (average of 0.6)were generally lower than those measured in Mexico City in2003 (average of 0.7) and this also correlates well with thehigher AAEs obtained for 2003. This is likely due to thelarger impact of biomass burning in 2003 from the Yucatanfires. In addition, the fM values measured at site T1 in 2006(average of 0.76) was generally higher than that measured ateither site T0 in 2006 or at CENICA in 2003. Site T1 washeavily impacted by local grass fires during most of the studyperiod contributing to the higher fM values in the aerosolsamples. The fM values measured at site T1 during the lastfew days of 2006 were lower than those during the rest of thestudy period due to heavy rains that extinguished the localfires thus reducing the biomass input to the aerosol carbon.
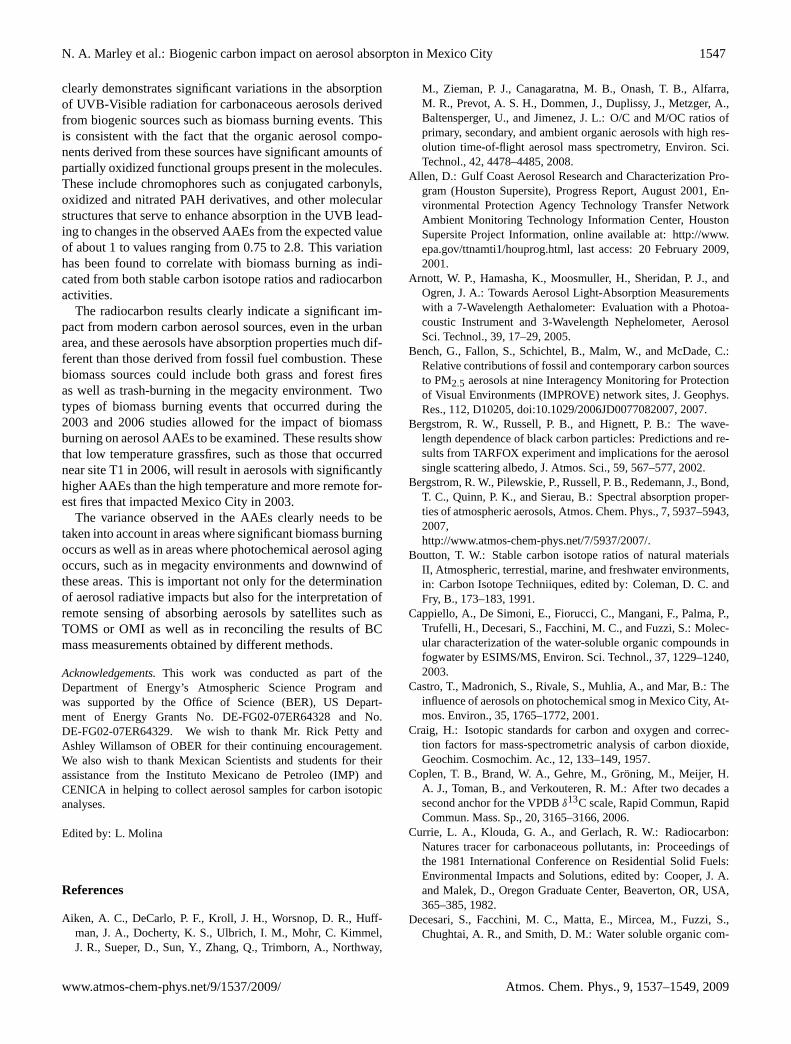
The AAEs obtained by diffuse reflectance on the aerosolsamples were compared to the fM value on each sample. Thecorrelation between the fM values and the AAEs of the Mex-ico City aerosols is shown in Fig. 6. In general, those samplesthat have high fM values also show higher AAEs. The resultsobtained at site T0 in 2006 are most consistent with freshcarbon emissions (AAE closest to 1). Those for 2003 aresomewhat higher and consistent with a mixture of fresh urbanemissions and aged biomass emissions. The three highestpoints shown in Fig. 6 for 2003 were obtained during the lastweek of the study period when Mexico City was impactedmost directly by aged biomass burning aerosols from the firesin the Yucatan (Massie et al., 2006). The results for site T1
1546 N. A. Marley et al.: Biogenic carbon impact on aerosol absorpton in Mexico City
Figure 6. Aerosol absorption Ǻngstrom exponent s as a function of the fraction of modern carbon determined in Mexico City during April 2003 (•) and March 2006 at site T0 (•) and at site T1 (o).
Fig. 6. Aerosol absorptionAngstrom exponents as a function of thefraction of modern carbon determined in Mexico City during April2003 (black) and March 2006 at site T0 (red) and at site T1 (blue).
in 2006 are highest and more typical of a larger impact of thelow temperature grass fires in the area.
3.3 13C/12C Ratios
Theδ13C values of the aerosol samples collected in MexicoCity in 2003 ranged from−22 to−30‰ with an average of−26‰; while those measured at site T0 in 2006 were simi-lar, ranging from−23 to−28‰ with an average of−25‰(see Fig. 7). These values are in the range of biogenic ma-terial from trees, shrubs and other C-3 plants. Theδ13C ofthe fine aerosol samples collected at T1 in 2006 were some-what higher, ranging from−15 to −27‰ with an averageof −23‰ indicating a mixture of biogenic materials from C-3 trees and shrubs with significant input from the C-4 grassfires in the area.
The relationship between theδ13C and fM values of theaerosol samples is shown in Fig. 8. The samples from site T1in 2006 are generally higher in bothδ13C and fM than thesamples collected at site T0, again indicating the influenceof local grass fires in the vicinity of site T1. While the fMvalues of the aerosol samples collected in 2003 are closer tothose from site T0 than those from site T1 in 2006, theδ13Cvalues were lower at T0 in 2006. This is another indication ofinput from the Yucatan fires in 2003, which were C-3 forestfires that would result in lowerδ13C values.
4 Conclusions
The results of this study clearly indicate that there can besubstantial differences in the AAEs of atmospheric carbona-ceous aerosols and that these differences can be correlatedto the sources of the carbon. While carbonaceous aerosolsproduced from the combustion of fossil fuels haveAngstromcoefficients near 1 (Bergstrom et al., 2002), this work
Figure 7. Carbon-13 content in fine aerosol samples collected at CENICA in Mexico City in April 2003 (top) and at sites T0 (•) and T1 (o) in March 2006 (bottom) expressed as δ13C, the ratio of 13C/12C in units of per mil (‰) deviation relative to the standard reference VPDB.
δ13
C
90 95 100 105 110 115 120 125Day of Year
-35
-30
-25
-20
-15
-10
δ13
C
90 95 100 105 110 115 120 125Day of Year
-35
-30
-25
-20
-15
-10
Fig. 7. Carbon-13 content in fine aerosol samples collected atCENICA in Mexico City in April 2003 (top) and at sites T0 (•) andT1 (o) in March 2006 (bottom) expressed as the ratio of13C/12C(δ13C) in units of per-mil (‰) deviation relative to the standard ref-erence VPDB.
Figure 8. Carbon-13 content (δ13C) in fine aerosol samples as a function of the fraction of modern carbon (fM). Samples were collected at CENICA in Mexico City in April 2003 (•) and at sites T0 (•) and T1 (o) in March 2006.
Fig. 8. Carbon-13 content (δ13C) in fine aerosol samples as a func-tion of the fraction of modern carbon (fM). Samples were collectedat CENICA in Mexico City in April 2003 (black) and at sites T0(red) and T1 (blue) in March 2006.
N. A. Marley et al.: Biogenic carbon impact on aerosol absorpton in Mexico City 1547
clearly demonstrates significant variations in the absorptionof UVB-Visible radiation for carbonaceous aerosols derivedfrom biogenic sources such as biomass burning events. Thisis consistent with the fact that the organic aerosol compo-nents derived from these sources have significant amounts ofpartially oxidized functional groups present in the molecules.These include chromophores such as conjugated carbonyls,oxidized and nitrated PAH derivatives, and other molecularstructures that serve to enhance absorption in the UVB lead-ing to changes in the observed AAEs from the expected valueof about 1 to values ranging from 0.75 to 2.8. This variationhas been found to correlate with biomass burning as indi-cated from both stable carbon isotope ratios and radiocarbonactivities.
The radiocarbon results clearly indicate a significant im-pact from modern carbon aerosol sources, even in the urbanarea, and these aerosols have absorption properties much dif-ferent than those derived from fossil fuel combustion. Thesebiomass sources could include both grass and forest firesas well as trash-burning in the megacity environment. Twotypes of biomass burning events that occurred during the2003 and 2006 studies allowed for the impact of biomassburning on aerosol AAEs to be examined. These results showthat low temperature grassfires, such as those that occurrednear site T1 in 2006, will result in aerosols with significantlyhigher AAEs than the high temperature and more remote for-est fires that impacted Mexico City in 2003.
The variance observed in the AAEs clearly needs to betaken into account in areas where significant biomass burningoccurs as well as in areas where photochemical aerosol agingoccurs, such as in megacity environments and downwind ofthese areas. This is important not only for the determinationof aerosol radiative impacts but also for the interpretation ofremote sensing of absorbing aerosols by satellites such asTOMS or OMI as well as in reconciling the results of BCmass measurements obtained by different methods.
Acknowledgements.This work was conducted as part of theDepartment of Energy’s Atmospheric Science Program andwas supported by the Office of Science (BER), US Depart-ment of Energy Grants No. DE-FG02-07ER64328 and No.DE-FG02-07ER64329. We wish to thank Mr. Rick Petty andAshley Willamson of OBER for their continuing encouragement.We also wish to thank Mexican Scientists and students for theirassistance from the Instituto Mexicano de Petroleo (IMP) andCENICA in helping to collect aerosol samples for carbon isotopicanalyses.
Edited by: L. Molina
References
Aiken, A. C., DeCarlo, P. F., Kroll, J. H., Worsnop, D. R., Huff-man, J. A., Docherty, K. S., Ulbrich, I. M., Mohr, C. Kimmel,J. R., Sueper, D., Sun, Y., Zhang, Q., Trimborn, A., Northway,
M., Zieman, P. J., Canagaratna, M. B., Onash, T. B., Alfarra,M. R., Prevot, A. S. H., Dommen, J., Duplissy, J., Metzger, A.,Baltensperger, U., and Jimenez, J. L.: O/C and M/OC ratios ofprimary, secondary, and ambient organic aerosols with high res-olution time-of-flight aerosol mass spectrometry, Environ. Sci.Technol., 42, 4478–4485, 2008.
Allen, D.: Gulf Coast Aerosol Research and Characterization Pro-gram (Houston Supersite), Progress Report, August 2001, En-vironmental Protection Agency Technology Transfer NetworkAmbient Monitoring Technology Information Center, HoustonSupersite Project Information, online available at:http://www.epa.gov/ttnamti1/houprog.html, last access: 20 February 2009,2001.
Arnott, W. P., Hamasha, K., Moosmuller, H., Sheridan, P. J., andOgren, J. A.: Towards Aerosol Light-Absorption Measurementswith a 7-Wavelength Aethalometer: Evaluation with a Photoa-coustic Instrument and 3-Wavelength Nephelometer, AerosolSci. Technol., 39, 17–29, 2005.
Bench, G., Fallon, S., Schichtel, B., Malm, W., and McDade, C.:Relative contributions of fossil and contemporary carbon sourcesto PM2.5 aerosols at nine Interagency Monitoring for Protectionof Visual Environments (IMPROVE) network sites, J. Geophys.Res., 112, D10205, doi:10.1029/2006JD0077082007, 2007.
Bergstrom, R. W., Russell, P. B., and Hignett, P. B.: The wave-length dependence of black carbon particles: Predictions and re-sults from TARFOX experiment and implications for the aerosolsingle scattering albedo, J. Atmos. Sci., 59, 567–577, 2002.
Bergstrom, R. W., Pilewskie, P., Russell, P. B., Redemann, J., Bond,T. C., Quinn, P. K., and Sierau, B.: Spectral absorption proper-ties of atmospheric aerosols, Atmos. Chem. Phys., 7, 5937–5943,2007,http://www.atmos-chem-phys.net/7/5937/2007/.
Boutton, T. W.: Stable carbon isotope ratios of natural materialsII, Atmospheric, terrestial, marine, and freshwater environments,in: Carbon Isotope Techniiques, edited by: Coleman, D. C. andFry, B., 173–183, 1991.
Cappiello, A., De Simoni, E., Fiorucci, C., Mangani, F., Palma, P.,Trufelli, H., Decesari, S., Facchini, M. C., and Fuzzi, S.: Molec-ular characterization of the water-soluble organic compounds infogwater by ESIMS/MS, Environ. Sci. Technol., 37, 1229–1240,2003.
Castro, T., Madronich, S., Rivale, S., Muhlia, A., and Mar, B.: Theinfluence of aerosols on photochemical smog in Mexico City, At-mos. Environ., 35, 1765–1772, 2001.
Craig, H.: Isotopic standards for carbon and oxygen and correc-tion factors for mass-spectrometric analysis of carbon dioxide,Geochim. Cosmochim. Ac., 12, 133–149, 1957.
Coplen, T. B., Brand, W. A., Gehre, M., Groning, M., Meijer, H.A. J., Toman, B., and Verkouteren, R. M.: After two decades asecond anchor for the VPDBδ13C scale, Rapid Commun, RapidCommun. Mass. Sp., 20, 3165–3166, 2006.
Currie, L. A., Klouda, G. A., and Gerlach, R. W.: Radiocarbon:Natures tracer for carbonaceous pollutants, in: Proceedings ofthe 1981 International Conference on Residential Solid Fuels:Environmental Impacts and Solutions, edited by: Cooper, J. A.and Malek, D., Oregon Graduate Center, Beaverton, OR, USA,365–385, 1982.
Decesari, S., Facchini, M. C., Matta, E., Mircea, M., Fuzzi, S.,Chughtai, A. R., and Smith, D. M.: Water soluble organic com-
1548 N. A. Marley et al.: Biogenic carbon impact on aerosol absorpton in Mexico City
pounds formed by oxidation of soot, Atmos. Environ., 36, 1827–1832, 2002.
de Foy, B., Varela, J. R., Molina, L. T., and Molina, M. J.: Rapidventilation of the Mexico City basin and regional fate of the ur-ban plume, Atmos. Chem. Phys., 6, 2321–2335, 2006,http://www.atmos-chem-phys.net/6/2321/2006/.
DeCarlo, P. F., Dunlea, E. J., Kimmel, J. R., Aiken, A. C., Sueper,D., Crounse, J., Wennberg, P. O., Emmons, L., Shinozuka, Y.,Clarke, A., Zhou, J., Tomlinson, J., Collins, D. R., Knapp, D.,Weinheimer, A. J., Montzka, D. D., Campos, T., and Jimenez,J. L.: Fast airborne aerosol size and chemistry measurementsabove Mexico City and Central Mexico during the MILAGROcampaign, Atmos. Chem. Phys., 8, 4027–4048, 2008,http://www.atmos-chem-phys.net/8/4027/2008/.
Dickerson, R. R., Kondragunta, S., Stenchikov, G., Civerolo, K.L., Doddridge, B. G., and Holben, N.: The impact of aerosolson solar ultraviolet radiation and photochemical smog, Science,278, 827–830 1997.
Dua, S. K., Hopke, P. K., and Raunemaa, T.: Hygroscopicity ofDiesel Aerosols, Water Air Soil Poll., 112, 247–257, 1999.
Gaffney, J. S., Tanner, R. L., and Phillips, M.: Separating Carbona-ceous Aerosol SourceTerms Using Thermal Evolution, CarbonIsotopic Measurements, and C/N/S Determinations, Sci. TotalEnviron., 36, 53–60, 1984.
Gaffney, J. S., Marley, N. A., Cunningham, M. M., and Doskey,P. V.: Measurements of Peroxyacyl Nitrates (PANs) in MexicoCity: Implications for Megacity Air Quality Impacts on RegionalScales, Atmos. Environ., 33, 5003–5012, 1999.
Gaffney, J. S. and Marley, N. A.: Alternative Fuels, in Air PollutionReviews: Volume 1, The Urban Air Atmosphere and Its Effects,edited by: Brimblecombe, P. and Maynard, R., Imperial CollegePress, London, UK, Chapter 6, 195–246, 2000.
Gaffney, J. S. and Marley, N. A. (eds.): The Importance of theChemical and Physical Properties of Aerosols in DeterminingTheir Transport and Residence Times in the Troposphere, Chap-ter 14, Urban Aerosols and Their Impacts: Lessons Learned fromthe World Trade Center Tragedy, ACS Symposium Book 919,Oxford University Press, 286–300, 2005.
Gelencser, A., Hoffer, A., Kiss, G., Tombacz, E., Kurdi, R., andBencze, L.: In-situ formation of light absorbing organic matterin cloud water, J. Atmos. Chem., 45, 25–33, 2003.
Gundel, L. A., Dod, R. L., Rosen, H., and Novakov, T.: The re-lationship between optical attenuation and black carbon concen-tration for ambient and source particles, Sci. Total Environ., 36,197–202, 1984.
Hansen, A. D. A., Rosen, H., and Novakov, T.: Real-time mea-surement of the absorption coefficient of aerosol particles, Appl.Optics, 21, 3060–3062, 1982.
Hansen, A. D. A., Rosen, H., and Novakov, T.: The aethalometer:an instrument for the real-time measurement of optical absorp-tion by aerosol particles, Sci. Total Environ., 36, 191–196, 1984.
Hermann, P. and Hanel, G.: Wintertime optical properties of atmo-spheric particles and weather, Atmos. Environ., 24, 4053–4062,1997.
Hermann, M., Stratmann, M., Wilck, M. and Wiedensohler, A.:Sampling characteristics of an aircraft-borne aerosol inlet sys-tem, J. Am. Meteorol. Soc., 7–19, 2001.
Hennigan, C. J., Sullivan, A. P., Fountoukis, C. I., Nenes, A., Heco-bian, A., Vargas, O., Peltier, R. E., Case Hanks, A. T., Huey, L.
G., Lefer, B. L., Russell, A. G., and Weber, R. J.: On the volatil-ity and production mechanisms of newly formed nitrate and wa-ter soluble organic aerosol in Mexico City, Atmos. Chem. Phys.,8, 3761–3768, 2008,http://www.atmos-chem-phys.net/8/3761/2008/.
Hildemann, L. M., Klinedinst, D. B., Klouda, G. A., Currie, L. A.,and Cass, G. R.: Sources of urban contemporary carbon aerosol,Environ. Sci. Technol., 28, 1565–1576, 1994.
Hoffer, A., Gelencser, A., Guyon, P., Kiss, G., Schmid, O., Frank,G. P., Artaxo, P., and Andreae, M. O.: Optical properties ofhumic-like substances (HULIS) in biomass-burning aerosols, At-mos. Chem. Phys., 6, 3563–3570, 2006,http://www.atmos-chem-phys.net/6/3563/2006/.
Jacobson, M. Z.: Isolating nitrated and aromatic aerosols and ni-trated aromatic gases as sources of ultraviolet light absorption, J.Geophys. Res., 104, 3527–3542, 1999.
Johnson, K. S., de Foy, B., Zuberi, B., Molina, L. T., Molina, M.J., Xie, Y., Laskin, A., and Shutthanandan, V.: Aerosol composi-tion and source apportionment in the Mexico City MetropolitanArea with PIXE/PESA/STIM and multivariate analysis, Atmos.Chem. Phys., 6, 4591–4600, 2006,http://www.atmos-chem-phys.net/6/4591/2006/.
Jordan, T. B., Seen, A. J., Jacobson, G. E., and Gras, J. L.: Ra-diocarbon determination of wood smoke contribution to air par-ticulate matter in Launceston, Tasmania, Atmos. Environ., 40,2575–2582, 2006.
Kaufman, Y. J., Tanre, D., and Boucher, O.: A satellite view ofaerosols in the climate system, Nature, 419, 215–223, 2002.
Kiel. J. T. and Briegleb, B. P.: The relative roles of sulfate aerosolsand greenhouse gases, Science, 260, 311–314, 1993.
Kirchstetter, T. W., Novakov, T., and Hobbs, P. V.: Evidencethat the spectral dependence of light absorption by aerosols isaffected by organic carbon, J. Geophys. Res., 109, D21208,doi:10.1029/2004JD004999, 2004.
Klinedinst, D. B. and Currie, L. A.: Direct quantification of PM2.5fossil and biomass carbon within the Northern Front Range AirQuality study’s domain, Environ. Sci. Technol., 33, 4146–4154,1999.
Lewis, C. W. and Stiles, D. C.: Radiocarbon content of PM2.5 am-bient aerosol in Tampa, FL, Aerosol Sci. Technol., 40, 189–196,2006.
Lewis, C. W., Klouda, G. A., and Ellenson, W. D.: Radiocar-bon measurement of the biogenic contribution to summertimePM-2.5 ambient aerosol in Nashville, TN, Atmos. Environ., 38,6053–6061, 2004.
Limbeck, A., Kulmala, M., and Puxbaum, H.: Secondary organicaerosol formation in the atmosphere via heterogeneous reactionof gaseous isoprene on acidic particles, Geophys. Res. Lett., 30,ASC6.1–ASC6.4, doi:10.1029/2003GL017738, 2003.
Mang, S. A., Henricksen, D. K., Bateman, A. P., Andersen, M. P.S., Blake, D. R., and Nizkorodov, S. A.: Contribution of car-bonyl photochemistry to aging of atmospheric secondary organicaerosol, J. Phys. Chem. A, 112, 8337–8344, 2008.
Marley, N. A., Gaffney, J. S., Baird, J. C., Blazer, C. A., Drayton,P. J., and Frederick, J. E.: An empirical method for the deter-mination of the refractive index of size fractionated atmosphericaerosols for radiative transfer calculations, Aerosol Sci. Technol.,34, 535–549, 2001.
Massie, S. T., Gille, J. C., Edwards, D. P., and Nandi, S.: Satel-
N. A. Marley et al.: Biogenic carbon impact on aerosol absorpton in Mexico City 1549
lite observations of aerosol and CO over Mexico City, Atmos.Environ., 40, 6019–6031, 2006.
Meloni, D., di Sarra, A., Pace, G., and Monteleone, F.: Aerosoloptical properties at Lampedusa (Central Mediterranean). 2. De-termination of single scattering albedo at two wavelengths fordifferent aerosol types, Atmos. Chem. Phys., 6, 715–727, 2006,http://www.atmos-chem-phys.net/6/715/2006/.
Moffet, R. C., de Foy, B., Molina, L. T., Molina, M. J., andPrather, K. A.: Measurement of ambient aerosols in north-ern Mexico City by single particle mass spectrometry, Atmos.Chem. Phys., 8, 4499–4516, 2008,http://www.atmos-chem-phys.net/8/4499/2008/.
Park, K., Chow, J. C., Watson, J. G., Trimble, D. L., Doraiswamy,P., Arnott, W. P., Stroud, K. R., Bowers, K., Bode, R., Petzold,A., and Hansen, A. D. A.: Comparison of continuous and filter-based carbon measurements at the Fresno Supersite, J. Air WasteManage., 56, 474–491, 2006.
Paredes-Miranda, G., Arnott, W. P., Jimenez, J. L., Aiken, A. C.,Gaffney, J. S., and Marley, N. A.: Primary and secondary con-tributions to aerosol light scattering and absorption in MexicoCity during the MILAGRO 2006 campaign, Atmos. Chem. Phys.Discuss., 8, 16951–16979, 2008,http://www.atmos-chem-phys-discuss.net/8/16951/2008/.
Pinnick, R. C., Hill, S. C, Pan, Y.-L., and Chang, R. K.: Fluo-rescence spectra of atmospheric aerosol at Adelphi, Maryland,USA: measurement and classification of single particles contain-ing organic carbon, Atmos. Environ., 38, 1657–1672, 2004.
Raga, G. B., Baumgardner, D., Castro, T., Martınez-Arroyo, A.,and Navarro-Gonzalez, R.: Mexico City air quality: a qualitativereview of gas and aerosol measurements (1960–2000), Atmos.Environ., 35, 4041–4058, 2001.
Ramanathan, V., Ramana, M. V., Roberts, G., Kim, D., Corrigan,C. E., Chung C. E., and Winker, D.: Warming trends I Asia am-plified by brown cloud solar absorption, Nature, 448, 575–578,2007.
Ramanathan, V. and Carmichael, G.: Global and regional climatechanges due to black carbon, Nature, 1, 221–227, 2008.
Rowe, M. W. and Steelman, K. L.: Radiocarbon dating of rockpaintings using plasma-chemical extraction, Am. Lab., 34, 15–19, 2002.
Sage, R. F.: Environmental and evolutionary preconditions for theorigin and diversification of the C-4 photosynthetic syndrome,Plant Biol., 3, 202–213, 2001.
Salcedo, D., Onasch, T. B., Dzepina, K., Canagaratna, M. R.,Zhang, Q., Huffman, J. A., DeCarlo, P. F., Jayne, J. T., Mor-timer, P., Worsnop, D. R., Kolb, C. E., Johnson, K. S., Zuberi,B., Marr, L. C., Volkamer, R., Molina, L. T., Molina, M. J., Car-denas, B., Bernabe, R. M., Marquez, C., Gaffney, J. S., Marley,N. A., Laskin, A., Shutthanandan, V., Xie, Y., Brune, W., Lesher,R., Shirley, T., and Jimenez, J. L.: Characterization of ambientaerosols in Mexico City during the MCMA-2003 campaign withAerosol Mass Spectrometry: results from the CENICA Super-site, Atmos. Chem. Phys., 6, 925–946, 2006,http://www.atmos-chem-phys.net/6/925/2006/.
Schmid, O., Artaxo, P., Arnott, W. P., Chand, D., Gatti, L.V., Frank, G. P., Hoffer, A., Schnaiter, M., and Andreae, M.O.: Spectral light absorption by ambient aerosols influencedby biomass burning in the Amazon Basin. I: Comparison andfield calibration of absorption measurement techniques, Atmos.
Smith, B. N. and Epstein, S.: Two categories of13C/12C ratios forhigher plants, Plant Physiol., 47, 380–384, 1971.
Stone, E. A., Snyder, D. C., Sheesley, R. J., Sullivan, A. P., Weber,R. J., and Schauer, J. J.: Source apportionment of fine organicaerosol in Mexico City during the MILAGRO experiment 2006,Atmos. Chem. Phys., 8, 1249–1259, 2008,http://www.atmos-chem-phys.net/8/1249/2008/.
Stuiver, M. and Polach, H. A.: Discussion: Reporting of14C data,Radiocarbon, 19, 355–365, 1977.
Szidat, S., Jenk, T. M., Gaggeler, H. W., Synal, H.-A., Fisseha,R., Baltensperger, U., Kalberer, M., Samburova, V., Wacker, L.,Saurer, M., Schwikowski, M., and Hajdas, I.: Source apportion-ment of aerosols by14C measurements in different carbonaceousparticle fractions. Radiocarbon, 46, 475–484, 2004.
Takahashi, K., Hirabayashi, M., Tanabe, K., Shibata, Y., Nishikawa,M., and Sakamoto, K.: Radiocarbon content in urban atmo-spheric aerosols, Water Air Soil Poll., 185, 305–310, 2007.
Tang, Y., Carmichael, G. R., Uno, I., Kurata, G., Lefer, B., Shet-ter, R. E., Huang, H., Anderson, B. E., Avery, M. A., Clarke, A.D., and Blake, D. R.: Impacts of aerosols and clouds on photol-ysis frequencies and photochemistry during TRACE-P:2. Three-dimensional study using a regional chemical transport model, J.Geophys. Res., 108, 8822, doi:10.1029/2002JD003,2003, 2003.
Torres, O., Bhartia, P. K., Herman, J. R., Ahmad, Z., and Gleason,J.: Derivation of aerosol properties from satellite measurementsof backscattered ultraviolet radiation. Theoretical basis, J. Geo-phys. Res., 103, 17099–17110, 1998.
Volkamer, R., Jimenez, J. L., San Martini, F., Dzpina, F., Zhang,Q., Salcedo, D., Molina, L. T., Worsnop, D. R., and Molina, M.J.: Secondary organic aerosol formation from anthropogenic airpollution: Rapid and higher than expected, Geophys. Res. Lett.,33, L17811, doi:10.1029/2006GL026899, 2006.
Walser, M. L., Park, J., Gomez, A. L., Russell, A. R., and Nizko-rodov, S. A.: Photochemical aging of secondary organic aerosolparticles generated from the oxidation of d-limonene, J. Phys.Chem. A, 111, 1907–1913, 2007.
Wendisch, M., Mertes, S., Ruggaber, A., and Nakajima, T.: Verticalprofiles of aerosol and radiation and the influence of a tempera-ture inversion: Measurements and radiative transfer calculations,J. Appl. Meteorol., 35, 1703–1715, 1996.
Yokelson, R. J., Urbanski, S. P., Atlas, E. L., Toohey, D. W., Al-varado, E. C., Crounse, J. D., Wennberg, P. O., Fisher, M. E.,Wold, C. E., Campos, T. L., Adachi, K., Buseck, P. R., andHao, W. M.: Emissions from forest fires near Mexico City,Atmos. Chem. Phys., 7, 5569–5584, 2007,http://www.atmos-chem-phys.net/7/5569/2007/.
Yokelson, R., Crounse, J. D., DeCarlo, P. F., Karl, T., Urbanski, S.,Atlas, E., Campos, T., Shinozuka, Y., Kapustin, V., Clarke, A.D., Weinheimer, A., Knapp, D. J., Montzka, D. D., Holloway, J.,Weibring, P., Flocke, F., Zheng, W., Toohey, D., Wennberg, P. O.,Wiedinmyer, C., Mauldin, L., Fried, A., Richter, D., Walega, J.,Jimenez, J. L., Adachi, K., Buseck, P. R., Hall, S. R., and Shet-ter, R.: Emissions from biomass burning in the Yucatan, Atmos.Chem. Phys. Discuss., 9, 767–835, 2009,http://www.atmos-chem-phys-discuss.net/9/767/2009/.