The impact of brand and category characteristics on consumer stock-out reactions Laurens Sloot, Peter C. Verhoef, Philip Hans Franses ERIM REPORT SERIES RESEARCH IN MANAGEMENT ERIM Report Series reference number ERS-2002-106-MKT Publication November 2002 Number of pages 47 Email address corresponding author [email protected], [email protected], [email protected]Address Erasmus Research Institute of Management (ERIM) Rotterdam School of Management / Faculteit Bedrijfskunde Erasmus Universiteit Rotterdam P.O. Box 1738 3000 DR Rotterdam, The Netherlands Phone: +31 10 408 1182 Fax: +31 10 408 9640 Email: [email protected]Internet: www.erim.eur.nl Bibliographic data and classifications of all the ERIM reports are also available on the ERIM website: www.erim.eur.nl CORE Metadata, citation and similar papers at core.ac.uk Provided by Research Papers in Economics
Transcript
ERIM REPOERIM Report Publication Number of paEmail addressAddress
Bibliograp
CORE Metadata, citation and similar papers at core.ac.uk
Provided by Research Papers in Economics
The impact of brand and category characteristics on consumer stock-out reactions
Laurens Sloot, Peter C. Verhoef, Philip Hans Franses
RT SERIES RESEARCH IN MANAGEMENT Series reference number ERS-2002-106-MKT
BIBLIOGRAPHIC DATA AND CLASSIFICATIONS Abstract We develop two models to test hypotheses on the specific impact of brand and category
characteristics on consumer stock-out responses. Our empirical results show that both characteristics are important determinants. Consumers are more product loyal in hedonic product groups than in utilitarian product groups and consumers are more brand loyal to high equity brands than to low equity brands. Brand loyalty is especially strong for high equity brands in hedonic product groups. Our study also confirms findings from prior research on OOS reactions. Theoretical and managerial implications of the findings of the study are discussed. 5001-6182 Business 5410-5417.5 Marketing
Library of Congress Classification (LCC) HF 6161.B4 Brand name product Advertising
M Business Administration and Business Economics M 31 C 44
Marketing Statistical Decision Theory
Journal of Economic Literature (JEL)
M 39 Marketing and Advertising: Other 85 A Business General 280 G 255 A
Managing the marketing function Decision theory (general)
European Business Schools Library Group (EBSLG)
280 N Consumer behavior Gemeenschappelijke Onderwerpsontsluiting (GOO)
The impact of brand and category characteristics on
consumer stock-out reactions1
November 14, 2002
Laurens Sloot2
Erasmus Food Management Institute
Peter C. Verhoef
Erasmus University, Rotterdam
Philip Hans Franses
Erasmus University, Rotterdam
1 The authors gratefully acknowledge the research assistance of Rocco Kellevink. The research has been supported by the Erasmus Food Management Institute. The helpful comments of Harry Commandeur, Ed Peelen, Marnik Dekimpe and Eline van Ketel are also acknowledged. 2 Address of Correspondence: Laurens Sloot, Erasmus Food Management Institute, Erasmus University, Office H16-25, P.O. Box 1738, NL-3000 DR Rotterdam, The Netherlands; Phone +31 10 408 1307; Fax +31 10 408 9160; E-mail: [email protected]
1
The impact of brand and category characteristics on
consumer stock-out reactions
Abstract
We develop two models to test hypotheses on the specific impact of brand and category
characteristics on consumer stock-out responses. Our empirical results show that both
characteristics are important determinants. Consumers are more product loyal in hedonic
product groups than in utilitarian product groups and consumers are more brand loyal to high
equity brands than to low equity brands. Brand loyalty is especially strong for high equity
brands in hedonic product groups. Our study also confirms findings from prior research on
OOS reactions. Theoretical and managerial implications of the findings of the study are
discussed.
2
INTRODUCTION
Out-of-Stock (OOS) is a regular phenomenon for grocery shoppers. Percentages seem to vary
between 5% (The Netherlands) and 8% (US) on SKU level (Kooistra, 1999; Andersen
Consulting, 1996). Although OOS is not rare, it still rates high on the shoppers’ irritation list
and cause a lower level of consumer satisfaction (CBL, 1989 and 2000; Fitzsimons, 2000).
OOS may have impact on a retailer’s financial result, because it might lead to a loss of sales
as consumers decide to postpone or cancel the purchase or switch to another store. The
resulting gross margin losses for retailers are estimated to lie between 7 and 12 billion dollar
per year in the US (Andersen Consulting, 1996).
As a result some Efficient Consumer Response (ECR) projects focused on developing
methods to improve the supply chain. An evaluation off projects in which Continuous
Replenishment Planning has been applied led to the conclusion that OOS levels could
decrease by 55% (Vergin and Barr, 1999). Although the ECR projects showed encouraging
effects in decreasing OOS levels, a substantial decrease at a nationwide level has not yet been
observed (EFMI, 2000). The tendency of extending assortments, combined with the fact that
shelf space is often fixed in the short and mid term, leads to the conclusion that OOS is
unlikely to disappear. Therefore, retailers need additional insights in the effects of OOS on
consumer behavior. Especially knowledge about which types of OOS lead to high levels of
store switching and postponement of purchases can be useful in prioritizing the OOS
problem.
An important question in this respect concerns the product types and brand types for
which OOS results in substantial sales losses. OOS is important for brand manufacturers as
well, because high OOS levels for a specific brand may lead to losses of brand sales and
decreasing brand loyalty. Besides the important financial consequences of OOS,
3
understanding consumers’ OOS responses increases the insights of manufacturers about the
importance of having a good weighted distribution and a good shelf position. In this respect,
consumer OOS reactions may provide insights in the possible effects on brand loyalty when
items of a brand or a complete brand range are delisted in a specific retail chain (Campo,
Gijsbrechts and Nisol, 2002).
Within the (marketing) literature there has been a substantial interest in the topic of
consumer reaction towards OOS since the 1960’s (e.g. Peckham, 1963). The majority of the
early studies on OOS mainly focussed on the definition and measurement of consumer OOS
reactions (Peckham, 1963; Zinszer and Lesser, 1981; Gattorna, 1988; Emmelhainz, Stock and
Emmelhainz, 1991) and the financial consequences of OOS (Walter and Grabner, 1981).
Recently, researchers developed and tested theoretical based models to explain OOS
reactions (e.g. Campo, Gijsbrechts and Nisol, 2000; Verbeke, Farris and Thurik, 1998; Zinn
and Liu, 2001). Especially, the study of Campo, Gijsbrechts and Nisol (2000) is noteworthy,
as it provides and tests a strong theoretical framework for explaining consumer OOS
responses. In general, an important limitation of these studies is that OOS reactions are
studied for a small number of product categories. Studies also often limit their attention to
OOS reactions in one particular supermarket and/or retail format. Finally, most studies ignore
the fact that OOS reactions might differ per considered brand. As a result, no theories are
developed that may explain observed differences in reactions between product categories and
brands. Moreover, the consideration of a single retail chain limits the external validity of the
studies.
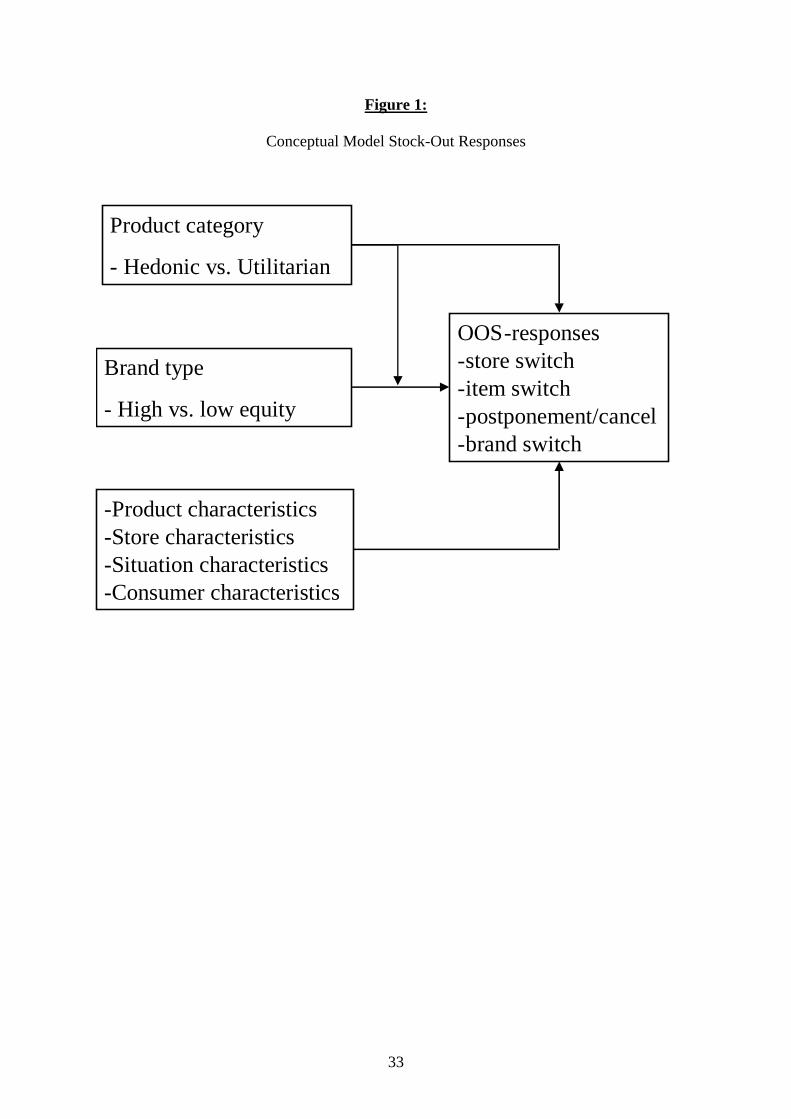
In this study we aim to fill in these research gaps. We follow the theoretical
framework of Chandon, Wansink and Laurent (2000) who made a distinction between
utilitarian and hedonic products (Batra and Ahtola, 1991; Dhar and Wertenbroch, 2000) and
between low equity and high equity brands (Keller, 2002; Ailawadi, Lehman and Neslin,
4
2002). We use this distinction to explain differences in OOS responses across product
categories and brands. To improve the generalizability and external validity of the results we
study OOS responses of 749 consumers in 8 different product groups in 8 different retail
chains.
Besides the theoretical contribution, our study helps managerial decision making on
how to minimize the impact of OOS on the performance of both retailers and brand
manufacturers. Our empirical results provide crucial insights for retailers and brand
manufacturers in which product categories and for which type of brands they should increase
their effort to reduce OOS. At the same time, the results also show in which product
categories and for which brands, reducing OOS does not have top priority.
We continue this paper with a review of the prior literature on OOS. Next, we discuss
our conceptual model and the underlying hypotheses. The research methodology and the
empirical results are described subsequently. We end this paper with a discussion, managerial
implications, research limitations and directions for future research.
LITERATURE REVIEW
In this section we provide a literature review of prior studies on OOS reactions. We first
discuss the objectives, methodology, and consumers’ OOS reactions considered in these
studies. Subsequently, the antecedents of OOS reactions are provided.
Objectives, Methodology and OOS reactions
Table 1 provides an overview of published studies about consumer stock-out reactions within
the marketing and business logistics literature. We particularly describe the objectives, the
context, the considered OOS reactions and the methodology. OOS studies have a long
5
tradition within the marketing literature. Not surprisingly, most studies on OOS were
executed in the context of grocery products. The objectives of the early studies on OOS were
mainly on defining and measuring OOS reactions and their financial impact. The study of
Schary and Christopher (1979) was the first study that also aimed to explain OOS reactions.
In the beginning of the ‘90’s, the research focusing on explaining OOS reactions continued
with the study of Emmelhainz, Stock and Emmelhainz (1991).
-- Insert Table 1 about here –
In the literature on the definition and measurement of OOS reactions usually six main
behavioral consumer responses are distinguished. Ranked from relatively high to relatively
low brand loyalty these reactions are:
(1) Store switch: going the same day to another store to buy the item which is OOS
(2) Item switch: switching to another format or variety of the same brand;
(3) Postponement: postponing the intended buy until the next regular trip to the
supermarket
(4) Cancel: dropping the intended purchase at all or postponing it for a longer period
of time
(5) Category switch: buying a substitute product from another product category
(6) Brand switch: buying another brand within the same product category
Studies on OOS reactions typically do not consider these 6 reactions simultaneously. For
example, Verbeke, Farris and Thurik (1998) only focused on (1), (3) and (6), while Campo,
Gijsbrechts and Nisol (2000) did not explicitly consider (5) and (6).
6
Another important issue with respect to the studied OOS reactions is that studies use
different definitions and measurement approaches. For example, Zinn and Liu (2001)
consider leaving the store as a reaction, which might be an indication of both store switch or
purchase cancellation/postponement. Campo, Gijsbrechts and Nisol (2000) consider the
reaction “brand switch” as part of the reaction “item switch”, although these reactions
basically can be very different. Buying another item of the same brand can be considered as
an indication for strong brand loyalty, while buying another item of another brand indicates
just the opposite.
Most studies usually apply one of two different research designs: (1) field experiment
and (2) survey. In the field experiments, true stock-outs are used. In some experiments
specific items or brands were taken OOS in advance of the research (quasi experiments),
while in other experiments consumers were asked if they encountered an OOS during their
shopping trip (natural experiments). Studies applying survey designs mainly considered
hypothetical stock-out situations. In that case the respondent is asked, how (s)he would have
reacted when a purchased item or brand was OOS. Due to these differences in research
designs it is difficult to get a clear insight in the most common OOS reactions. For example,
in survey designs with hypothetical OOS, the reported store switch percentages are generally
higher than in experimental designs.
With respect to the design, also the type of OOS is important. Generally, two types of
OOS are distinguished: (1) item OOS and (2) brand OOS. In the first case, a single item of a
brand (for example the 2 liter bottle of Coca Cola or the Coca Cola light variety) is OOS,
while in the second case all items of a single brand in a product category are OOS. As might
be expected the reported OOS reactions will differ. Moreover, in the case of brand OOS, an
item switch is not possible by definition. Note that an important implication of the use of
7
different research designs is that it is difficult to derive empirical generalizations on the
determinants of OOS reactions.
The sample sizes of available studies vary between 300 and 1500 respondents
approximately. Studies have been executed in a number of different product categories. Due
to their methodology, studies considering experienced OOS usually measure reactions for
most categories in the store. However, none of the studies explicitly considers how reactions
differ across categories. If differences across categories are reported, researchers usually
speculate on the explanations (e.g. Campo, Gijsbrechts and Nisol, 2000). With respect to the
type of brands studied, our review reveals that some studies only looked at high-share brands
(e.g. Verbeke, Farris and Thurik, 1998), while others consider high- and low-share brands
and private labels (e.g. Campo, Gijsbrechts and Nisol, 2000). Note, however, that despite the
consideration of a broad range of brands, OOS studies usually do not consider the type of
brand as an explanatory variable for OOS response. Finally, our review also shows that
studies are usually executed within stores of a single retail chain. As a result, the external
validity of these studies might be limited to that single retail chain.
From this broad literature review we derive one general conclusion concerning
explaining consumer stock-out responses. The findings about explanatory variables for OOS
responses are based on data which are restricted by (1) the type of brands that are studied, (2)
the type of product categories that are studied or (3) the type of stores considered. Therefore,
it is difficult to derive empirical generalizations about OOS reactions in general and
specifically about the role of product type and brand type on consumer OOS responses.
Overview of antecedents of stock-out response
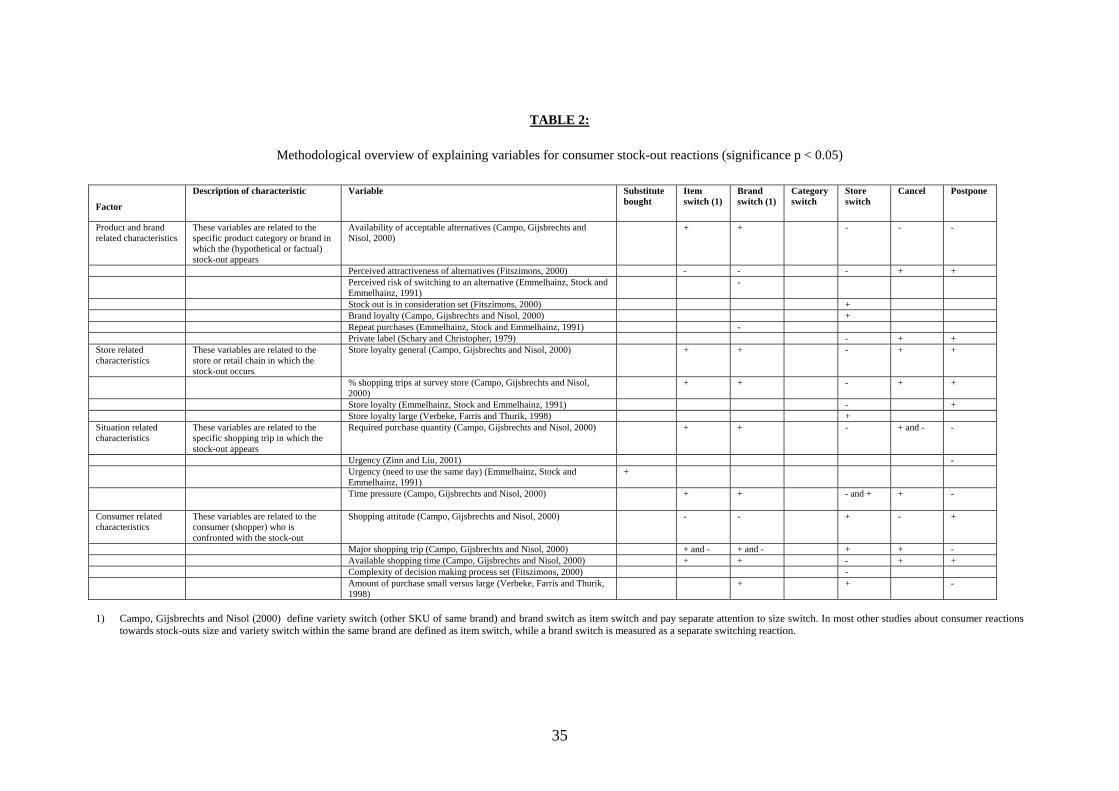
In Table 2 we provide an overview of the empirical evidence on the effect of a number of
possible determinants of OOS reactions. These all concern variables, which are measured at
8
the consumer level. In line with prior research, we distinguish the following clusters of
Table 1: Methodological overview of studies about consumer response towards stock-outs
Author(s) Product type Main objective(s) of study Main stock-out reactions measured Study design
Stock-out type (hypothetical of true)
Range of stock-outs (item or brand stock-out) Data collection method
Number of categories involved
Number of brand types involved
Number of retail chains and stores involved
Peckham (1963)
Grocery products Determining the level of consumer out-of-stock confrontations and describing consumer stock-out behavior
Substitute brand bought (Y/N)
Field experiment (quasi)
True Brand Personal interviews in a supermarket setting (after check-out) (n = 1173, 24% experience unavailability)
14 Noinformation given
Many different retail chains and many stores (exact number not given)
Walter & Grabner (1975)
Liquor products Describing consumer stock-out behavior and determining the economic costs of stock-outs to retailers
Store switch Brand Switch Item switch Defer
Survey Hypothetical Item Written survey, distributed by the cashier (n= 1433)
Specific number not given
No information given
One retail chain, 10 stores
Schary and Christopher (1979)
Grocery products (branded food items)
Describing consumer stock-out response and explaining stock-out reactions from store and product related characteristics
Item switch Brand switch Product switch Store switch No buy Postpone
Field experiment (quasi)
True Item Personal interviews with shoppers just leaving the check-out area (n=1167, 343 effectively)
Specific number not given
No information given
One retail chain, 2 stores
Emmelhainz, Stock and Emmelhainz (1991)
Grocery products Identifying consumer stock-out behavior and analyzing the impact of product and situation influences on consumer stock-out behavior
Item switch Brand switch Product switch Delay purchase Different store Special trip
Field experiment (natural)
True Item Personal interviews (n=2810, 375 effectively)
5 5 leadingselling variety’s
One retail chain (discount), 1 store
Verbeke, Farris and Thurik (1998)
Grocery products Identifying consumer stock-out reactions for high selling brands and explaining stock-out reactions by store related and situational characteristics
Brand switch Store switch Postpone purchase
Field experiment (natural)
True Brand Interviews by telephone (n = 590)
5 5 high share brands
One retail chain, 8 stores
Campo, Gijsbrechts and Nisol (2000)
Grocery products (margarine and cereals)
Explaining consumer stock-out reactions based on a conceptual framework with major determinants of consumer stock-out reactions
Size switch Item switch Store switch Defer Cancel
Survey Hypothetical Item Personal interviews in the supermarket (n=993 cases, margarine 544, cereals 449)
2 3 (generics,private labels and national brands)
One retail chain, 1 store
Fitzsimons (2000)
All types of products
Explaining stock-out effects (store switch, satisfaction) by cognition and attitudinal
Store switching Consumer satisfaction
Laboratory experiments
Hypothetical Hypothetical items
Four experiments with written surveys.
Specific number not given
No information given
No real retail outlet context
Zinn and Liu (2001)
Small appliances, home decoration items, furniture and jewelry
Explaining consumer stock-out reactions from a consumer psychology context (consideration set, commitment, attractiveness of alternatives and perceived complexity of choice process)
Substitute item Delay purchase Leave the store
Field experiment (quasi)
True Item Written questionnaire, (n=283)
Specific number not given
No information given
One retail chain ( discount), 4 different stores
34
TABLE 2:
Methodological overview of explaining variables for consumer stock-out reactions (significance p < 0.05)
Factor
Description of characteristic Variable Substitutebought
Item switch (1)
Brand switch (1)
Category switch
Store switch
Cancel Postpone
Product and brand related characteristics
These variables are related to the specific product category or brand in which the (hypothetical or factual) stock-out appears
Availability of acceptable alternatives (Campo, Gijsbrechts and Nisol, 2000)
+ +
- - -
Perceived attractiveness of alternatives (Fitszimons, 2000) - - - + + Perceived risk of switching to an alternative (Emmelhainz, Stock and
Emmelhainz, 1991) -
Stock out is in consideration set (Fitszimons, 2000) + Brand loyalty (Campo, Gijsbrechts and Nisol, 2000) + Repeat purchases (Emmelhainz, Stock and Emmelhainz, 1991) - Private label (Schary and Christopher, 1979) - + + Store related characteristics
These variables are related to the store or retail chain in which the stock-out occurs
Store loyalty general (Campo, Gijsbrechts and Nisol, 2000)
+ + - + +
% shopping trips at survey store (Campo, Gijsbrechts and Nisol, 2000)
+ + - + +
Store loyalty (Emmelhainz, Stock and Emmelhainz, 1991) - + Store loyalty large (Verbeke, Farris and Thurik, 1998) + Situation related characteristics
These variables are related to the specific shopping trip in which the stock-out appears
Required purchase quantity (Campo, Gijsbrechts and Nisol, 2000) + + - + and - -
Urgency (Zinn and Liu, 2001) - Urgency (need to use the same day) (Emmelhainz, Stock and
Emmelhainz, 1991) +
Time pressure (Campo, Gijsbrechts and Nisol, 2000) + + - and + + -
Consumer related characteristics
These variables are related to the consumer (shopper) who is confronted with the stock-out
Major shopping trip (Campo, Gijsbrechts and Nisol, 2000) + and - + and - + + - Available shopping time (Campo, Gijsbrechts and Nisol, 2000) + + - + + Complexity of decision making process set (Fitszimons, 2000) - Amount of purchase small versus large (Verbeke, Farris and Thurik,
1998) + + -
1) Campo, Gijsbrechts and Nisol (2000) define variety switch (other SKU of same brand) and brand switch as item switch and pay separate attention to size switch. In most other studies about consumer reactions
towards stock-outs size and variety switch within the same brand are defined as item switch, while a brand switch is measured as a separate switching reaction.
35
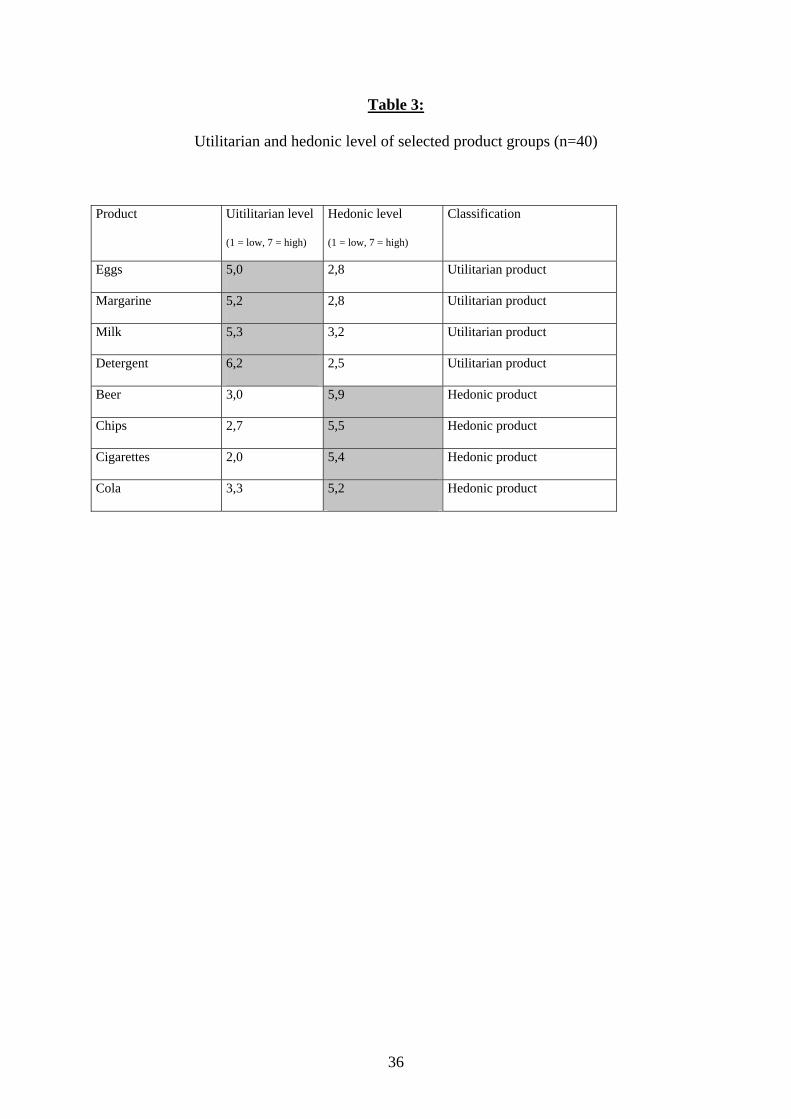
Table 3:
Utilitarian and hedonic level of selected product groups (n=40)
Product Uitilitarian level
(1 = low, 7 = high)
Hedonic level
(1 = low, 7 = high)
Classification
Eggs 5,0 2,8 Utilitarian product
Margarine 5,2 2,8 Utilitarian product
Milk 5,3 3,2 Utilitarian product
Detergent 6,2 2,5 Utilitarian product
Beer 3,0 5,9 Hedonic product
Chips 2,7 5,5 Hedonic product
Cigarettes 2,0 5,4 Hedonic product
Cola 3,3 5,2 Hedonic product
36
Table 4:
Cronbach-alpha per product group for multi-item self-report scales
Product type * Brand Type -0.018 (0.77) 0.24 (0.00) -0.067 (0.35) -0.16 (0.04)
39
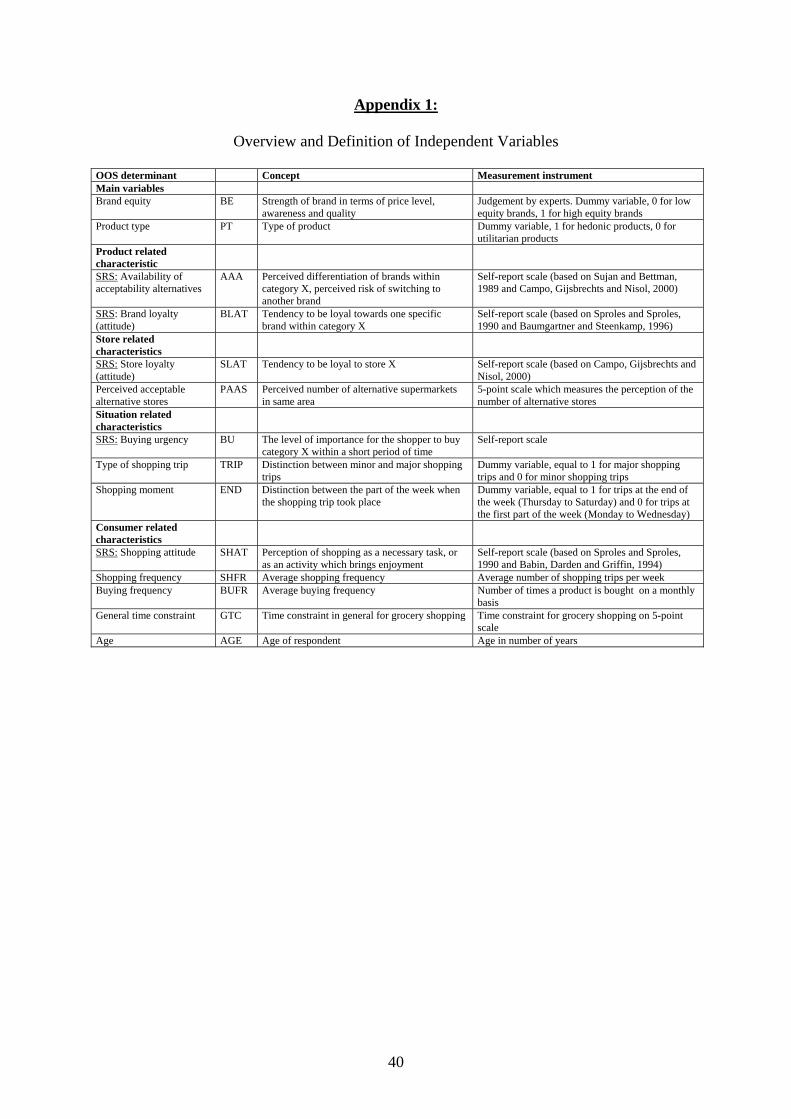
Appendix 1:
Overview and Definition of Independent Variables
OOS determinant Concept Measurement instrument Main variables Brand equity BE Strength of brand in terms of price level,
awareness and quality Judgement by experts. Dummy variable, 0 for low equity brands, 1 for high equity brands
Product type PT Type of product Dummy variable, 1 for hedonic products, 0 for utilitarian products
Product related characteristic
SRS: Availability of acceptability alternatives
AAA Perceived differentiation of brands within category X, perceived risk of switching to another brand
Self-report scale (based on Sujan and Bettman, 1989 and Campo, Gijsbrechts and Nisol, 2000)
SRS: Brand loyalty (attitude)
BLAT Tendency to be loyal towards one specific brand within category X
Self-report scale (based on Sproles and Sproles, 1990 and Baumgartner and Steenkamp, 1996)
Store related characteristics
SRS: Store loyalty (attitude)
SLAT Tendency to be loyal to store X Self-report scale (based on Campo, Gijsbrechts and Nisol, 2000)
Perceived acceptable alternative stores
PAAS Perceived number of alternative supermarkets in same area
5-point scale which measures the perception of the number of alternative stores
Situation related characteristics
SRS: Buying urgency BU The level of importance for the shopper to buy category X within a short period of time
Self-report scale
Type of shopping trip TRIP Distinction between minor and major shopping trips
Dummy variable, equal to 1 for major shopping trips and 0 for minor shopping trips
Shopping moment END Distinction between the part of the week when the shopping trip took place
Dummy variable, equal to 1 for trips at the end of the week (Thursday to Saturday) and 0 for trips at the first part of the week (Monday to Wednesday)
Consumer related characteristics
SRS: Shopping attitude SHAT Perception of shopping as a necessary task, or as an activity which brings enjoyment
Self-report scale (based on Sproles and Sproles, 1990 and Babin, Darden and Griffin, 1994)
Shopping frequency SHFR Average shopping frequency Average number of shopping trips per week Buying frequency BUFR Average buying frequency Number of times a product is bought on a monthly
basis General time constraint GTC Time constraint in general for grocery shopping Time constraint for grocery shopping on 5-point
scale Age AGE Age of respondent Age in number of years
40
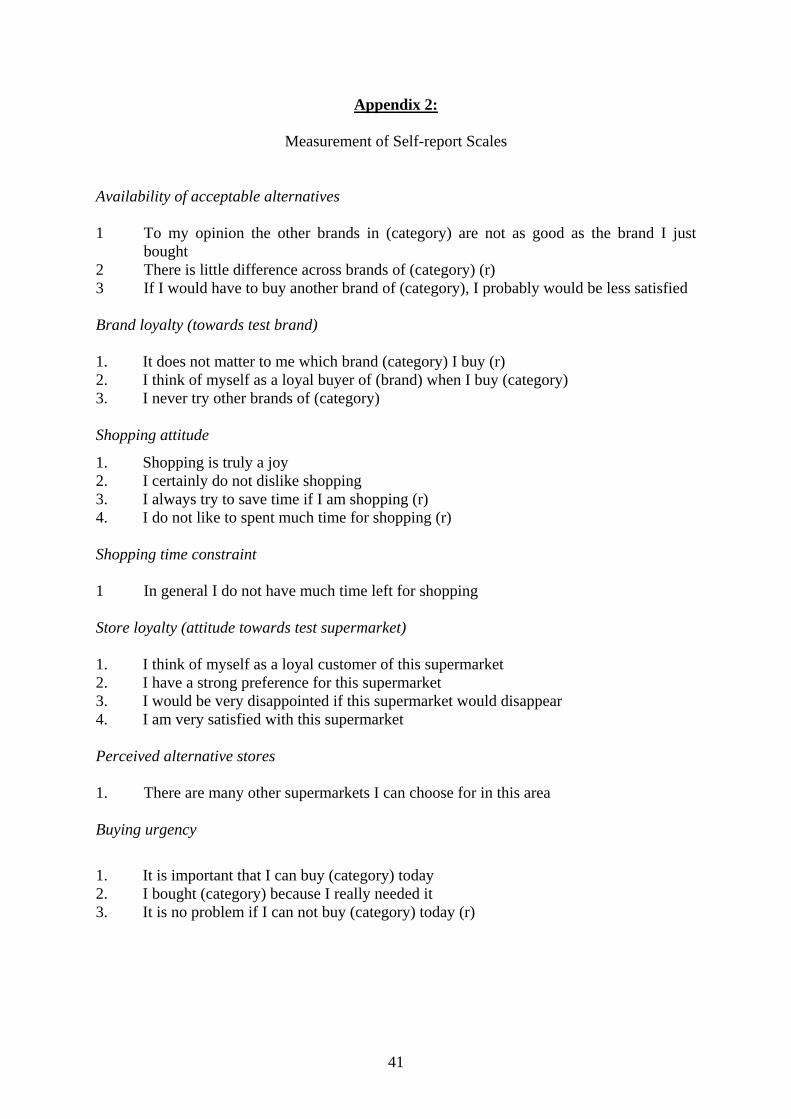
Appendix 2:
Measurement of Self-report Scales
Availability of acceptable alternatives 1 To my opinion the other brands in (category) are not as good as the brand I just
bought 2 There is little difference across brands of (category) (r) 3 If I would have to buy another brand of (category), I probably would be less satisfied Brand loyalty (towards test brand) 1. It does not matter to me which brand (category) I buy (r) 2. I think of myself as a loyal buyer of (brand) when I buy (category) 3. I never try other brands of (category) Shopping attitude
1. Shopping is truly a joy 2. I certainly do not dislike shopping 3. I always try to save time if I am shopping (r) 4. I do not like to spent much time for shopping (r) Shopping time constraint 1 In general I do not have much time left for shopping Store loyalty (attitude towards test supermarket) 1. I think of myself as a loyal customer of this supermarket 2. I have a strong preference for this supermarket 3. I would be very disappointed if this supermarket would disappear 4. I am very satisfied with this supermarket Perceived alternative stores 1. There are many other supermarkets I can choose for in this area Buying urgency
1. It is important that I can buy (category) today 2. I bought (category) because I really needed it 3. It is no problem if I can not buy (category) today (r)
Part of Week (0=beginning; 1 =end) -0.035 (0.92) 0.052 (0.20) -0.14 (0.01) 0.08 (0.09)
Consumer related
Shopping Attitude 0.022 (0.19) 0.024 (0.20) -0.022 (0.30) -0.024 (0.30) General Time Constraint -0.006 (0.64) -0.006 (0.64) 0.001 (0.96) -0.012 (0.49) Age/100 0.31 (0.00) -0.09 (0.38) 0.01 (0.92) -0.22 (0.10) a Instead of a perceptual measure for available alternative stores, we also included an objective measure. The marginal effects for this predictor variable were also not significant.
42
Publications in the Report Series Research∗ in Management ERIM Research Program: “Marketing” 2002 Suboptimality of Sales Promotions and Improvement through Channel Coordination Berend Wierenga & Han Soethoudt ERS-2002-10-MKT The Role of Schema Salience in Ad Processing and Evaluation Joost Loef, Gerrit Antonides & W. Fred van Raaij ERS-2002-15-MKT The Shape of Utility Functions and Organizational Behavior Joost M.E. Pennings & Ale Smidts ERS-2002-18-MKT Competitive Reactions and the Cross-Sales Effects of Advertising and Promotion Jan-Benedict E.M. Steenkamp, Vincent R. Nijs, Dominique M. Hanssens & Marnik G. Dekimpe ERS-2002-20-MKT Do promotions benefit manufacturers, retailers or both? Shuba Srinivasan, Koen Pauwels, Dominique M. Hanssens & Marnik G. Dekimpe ERS-2002-21-MKT How cannibalistic is the internet channel? Barbara Deleersnyder, Inge Geyskens, Katrijn Gielens & Marnik G. Dekimpe ERS-2002-22-MKT Evaluating Direct Marketing Campaigns; Recent Findings and Future Research Topics Jedid-Jah Jonker, Philip Hans Franses & Nanda Piersma ERS-2002-26-MKT The Joint Effect of Relationship Perceptions, Loyalty Program and Direct Mailings on Customer Share Development Peter C. Verhoef ERS-2002-27-MKT Estimated parameters do not get the “wrong sign” due to collinearity across included variables Philip Hans Franses & Christiaan Hey ERS-2002-31-MKT Dynamic Effects of Trust and Cognitive Social Structures on Information Transfer Relationships David Dekker, David Krackhardt & Philip Hans Franses ERS-2002-33-MKT Means-end relations: hierarchies or networks? An inquiry into the (a)symmetry of means-end relations. Johan van Rekom & Berend Wierenga ERS-2002-36-MKT ∗ A complete overview of the ERIM Report Series Research in Management:
http://www.ers.erim.eur.nl ERIM Research Programs: LIS Business Processes, Logistics and Information Systems ORG Organizing for Performance MKT Marketing F&A Finance and Accounting STR Strategy and Entrepreneurship
Cognitive and Affective Consequences of Two Types of Incongruent Advertising Joost Loef & Peeter W.J. Verlegh ERS-2002-42-MKT The Effects of Self-Reinforcing Mechanisms on Firm Performance Erik den Hartigh, Fred Langerak & Harry R. Commandeur ERS-2002-46-MKT Modeling Generational Transitions from Aggregate Data Philip Hans Franses & Stefan Stremersch ERS-2002-49-MKT Sales Models For Many Items Using Attribute Data Erjen Nierop, Dennis Fok, Philip Hans Franses ERS-2002-65-MKT The Econometrics Of The Bass Diffusion Model H. Peter Boswijk, Philip Hans Franses ERS-2002-66-MKT How the Impact of Integration of Marketing and R&D Differs Depending on a Firm’s Resources and its Strategic Scope Mark A.A.M. Leenders, Berend Wierenga ERS-2002-68-MKT` The Theoretical Underpinnings of Customer Asset Management: A Framework and Propositions for Future Research Ruth N. Bolton, Katherine N. Lemon, Peter C. Verhoef ERS-2002-80-MKT Further Thoughts on CRM: Strategically Embedding Customer Relationship Management in Organizations Peter C. Verhoef, Fred Langerak ERS-2002-83-MKT Building Stronger Channel Relationships through Information Sharing. An Experimental Study Willem Smit, Gerrit H. van Bruggen, Berend Wierenga ERS-2002-84-MKT What is the Predictive Power of Market Orientation? Fred Langerak ERS-2002-88-MKT Service Processes as a Sequence of Events: An Application to Service Calls Peter C. Verhoef, Gerrit Antonides, Arnoud N. de Hoog ERS-2002-105-MKT The Impact of Brand and Category Characteristics on Consumer Stock-out Reactions Laurens Sloot, Peter C. Verhoef, Philip Hans Franses ERS-2002-106-MKT