Page 1
The Impact of CAFE Standards on Innovation
in the US Automobile Industry
Antonio M. Bento, Kevin D. Roth, Yiwei Wang
Bento: Charles H. Dyson School of Applied Economics and Management, Cornell University, 403
Warren Hall, e-mail: [email protected] .
Roth: Institute of Transportation Studies, University of California, Irvine, 3297 Social Science Plaza B,
email: [email protected] .
Wang: Charles H. Dyson School of Applied Economics and Management, Cornell University, 434
Warren Hall, e-mail: [email protected] .
Selected Paper prepared for presentation at the 2015 Agricultural & Applied Economics Association
and Western Agricultural Economics Association Annual Meeting, San Francisco, CA, July 26-28
Copyright 2015 by [authors]. All rights reserved. Readers may make verbatim copies of this document for
non-commercial purposes by any means, provided that this copyright notice appears on all such copies.
Page 2
The Impact of CAFE Standards on Innovation
in the US Automobile Industry
Antonio M. Bento, Kevin D. Roth, Yiwei Wang1
Abstract:
The Obama administration seeks to tighten the fuel economy standards in the US and the target
is to almost double the miles per gallon (MPG) of vehicles by 2025 comparing to that of 2010.
With this new aggressive movement, there is an ongoing discussion about whether auto makers
could meet the new standards without providing consumers with vehicles that are much lighter
and less powerful. In this paper, we investigate how historical changes in the fuel economy
standards impacted technological innovation in the automobile industry and estimate the changes
in the rate of innovation in response to the changes in the standards. By decomposing innovation
growth into natural growth and growth induced by standard changes, we not only show that
standard changes can increase innovation growth but are also able to quantify the induced growth
rate with respect to the rate of changes in standards. Such method can provide a more precise
prediction of the future technological innovation under new standards.
Key words: CAFE standards, technological growth, regulation and innovation, fuel economy,
vehicle attributes
JEL Classification Codes: L2, L5, Q4, Q5
Global climate change has been a hot topic for years. Believed to be the major cause of
the climate change, greenhouse gas (GHG) emissions gain increasing concern. Many countries
adopted regulations and policies to reduce GHG emissions. As one of the major producer of
GHG, emission cuts in the US could have large impact on global environment.
According to EPA estimates, US produces around 6,000 metric tons of energy related
CO2 emission every year. Light duty vehicles, including passenger cars and light duty trucks, are
1 Bento: Charles H. Dyson School of Applied Economics and Management, Cornell University, 403
Warren Hall, e-mail: [email protected] . Roth: Institute of Transportation Studies, University of
California, Irvine, 3297 Social Science Plaza B, email: [email protected] . Wang: Charles H. Dyson School
of Applied Economics and Management, Cornell University, 434 Warren Hall, e-mail:
[email protected] .
Page 3
one of the major sources of GHG emissions and contributes around 20% of the total energy
related GHG emission in the US. Not surprisingly, various policies had been introduced to
reduce emissions and energy consumptions in this sector. One of the most important regulations
relate to emission cuts is the corporate average fuel economy (CAFE) standard. CAFE was first
enacted in 1975 as the response to the oil embargo in the early 1970s. CAFE standards target on
the sales weighted average fuel economy, measured in miles per gallon (MPG), of automobiles
in all automakers that run business in the US. The standards was first introduced to passenger
cars in model year 1978 and to light duty trucks in model year 1979.
The standard for passenger cars was set at 18 MPG for model year 1978 and kept
increasing in the next few year until it hit 27.5 in 1986. The standards was lowered to 26 in 1987
and raised back to 27.5 in 1990. The 27.5 MPG standard for cars remained stable since 1990
until 2010. Empirical studies in engineering show that automakers can sacrifice engine power
and vehicle weight to get higher fuel economy. That is exact what firms did when CAFE first
came into effect. Automakers reacted in the beginning by down-weighting their vehicles and
using less powerful engines to improve fuel economy to meet the standards. Later when the
standards were stable in the 90s, they kept MPG around the standards and produced heavier and
more powerful vehicles with new innovations.
In 2011, President Obama announced new aggressive CAFE standards, which seek to
almost double the overall fuel economy of passenger vehicles by 2025 compared to 2011. The
goal is an average MPG of 54.5 in 2025 model year vehicles, passenger cars and light duty
trucks combined, much higher than the 27.4 MPG in 2011. With the new aggressive change in
the CAFE standards, there is an ongoing discussion about whether auto makers would provide
consumers with much lighter and less powerful products, which might raise safety concerns.
In this paper, we analyze vehicle attributes data to answer two related questions. First,
how was innovation affected by the changes in the CAFE standards in the automobile industry in
the US? At what rate? Second, what would happen to innovation under the new standards? We
use a broad definition of innovation. Following Joseph Schumpeter (1942), we consider all
successful commercial application of invention, new ideas and designs, and adoptions of ideas or
technologies from diffusion, as innovation. We focus on investigating the relationship between
the growth rate of technological innovation related to fuel economy and the changes in the CAFE
standards.
Our work mainly differs from previous literatures in two ways. First, instead of merely
showing evidence of innovation growth in the automobile sector, we focus on the relationship
between innovation and the changes in the standards. Previous studies show evidence that
regulation can speed up innovation growth. We move one step forward and decompose
innovation growth into two parts. One is the natural growth, which occurs regardless of
regulation pushes. The other part is the induced growth, which is in direct response to the
tightened standards. Therefore, we not only show that regulation changes can impact innovation
but also show that the changes in the rate of innovation is proportionate to the changes in the
CAFE standards.
Page 4
Second, with our method of decomposing innovation growth, we turn innovation growth
into a function of regulation changes. By doing that, we create a better tool to predict future
innovation under new regulations. Instead of picking a random rate of growth from previous
data, we can now adjust the predicted growth rate based on how tight the new regulation will be.
The results suggest that, automakers improved their technology over time at a natural
growth rate. When the stringent level of standards changed, automakers also adjusted their
innovation rate in response to the changes. They were able to innovate faster compared to the
natural rate when facing pressure from tight standards. To be more specific, in the car sector, the
natural innovation in fuel economy related technologies can increase the fuel economy of cars by
1.19% annually should vehicle weight and engine power were kept constant. Every 1% increase
in the CAFE standard would induce an additional 0.32% improvement in total innovation.
Likewise, in the light truck sector, there is a natural innovation rate of 0.67% annually and every
1% increase in the CAFE standards would induce an additional 0.62% in fuel economy related
innovation. Using these results, we predict that additional innovation induced by the more
stringent new standards would play a big role under the new aggressive standards. In the car
sector, average fuel economy would increase by 41% if weight and engine power were kept at
2011 levels. However, such increase will still not be fast enough to meet the 2025 target so firms
will have to downsize there product to gain higher fuel economy. We estimate that cars will have
to be downsized to the late 90s’ level to meet the aggressive target. In the light truck sector,
average fuel economy would increase by 45% if weight and engine power remained at 2011
levels. Since the standard increase is relatively smaller in the truck sector compared to that of the
car sector, we estimate that firms will only have to downsize their product to the late 2000s’ level
to meet the 2025 target. This is a more optimistic prediction compared to previous studies.
The method we use in this paper can also be applied to other industries where there are
regulations whose stringent level change over time and impact innovation directly.
The remainder of the paper is organized as follows. Section I discusses the theoretical
and empirical models. Section II introduces the data. Section III provides evidences of attributes
tradeoffs and technological progress. Section IV reports the empirical results and interpretation
of the estimates. Section V provide robustness checks using alternative models. In section VI, we
predict future innovation under the new aggressive standards. Finally, section VII concludes.
I Theoretical and empirical models
Empirical studies in engineering show that the automobile attribute, such as weight,
engine power, and fuel economy, are transferable to each other. Murrell (1999) estimates that
each percent increase in 0–60 MPH time (i.e. slower acceleration performance) implies a 0.44%
improvement in fleet average fuel economy. There is also a rich body of literature that studied
the relationship between regulation and innovation. Newell, Jaffe, and Stavins (1999) use
characteristics transformation surface of innovation to study the technology growth and trade-
offs between energy usage and performance in energy consuming products. Their findings were
that energy efficiency directed innovations response substantially during the period after energy-
Page 5
efficient product labeling was required such as energy star in air-conditioners. Adopting the idea
of “characteristics transformation surface” in Newell, Jaffe, and Stavins, Knittel (2011) studies
the trade-off between light duty vehicle attributes including fuel economy, measured in miles per
gallon (MPG), weight, horsepower and torque and builds a transformation surface. Then he
estimates the growth of the technologies over time and thus estimates the potential of MPG
increases of vehicles. In his analysis, he estimates that if weight, horsepower, and torque were
fixed at their 1980 levels, MPG could have risen by 60% from 1980 to 2006. Also, to achieve
Obama’s aggressive CAFE standard increase will require downsizing of vehicles. DeCicco and
Ross (2001) estimate that by 2010-2015, there could be a 47% increase in overall fuel economy,
which is measured in miles per gallon (MPG), from 24 to 35 with a curb weight cut of 14% at
2000 level. The overall MPG could even reach 44 with a curb weight cut of 26% compared with
2000 level. These empirical results are important supports of modeling fuel economy as a
function of vehicle weight and engine power. In this paper, we adopt a similar frame work to
Knittel’s model.
Our focus in this paper is on the relationship between innovation and changes in the
CAFE standards. Following Knittel’s vehicle attribute surface framework, we model the
technology growth under the CAFE standards as follows. Firms choose the attributes of their
product, including engine power, hpit, torque, tqit, curb weight, wit, fuel economy, mpgit, other
attributes that are related to MPG, Xit, attributes related to other aspects, Yit, at time t given the
profitable technologies available at time t. I represent it as:
(1) Kit=f(mpgit, wit, hpit, tqit, Xit, Yit, t)
The purpose of this study is to measure innovation that are related to fuel economy, that
includes innovation that directly affects fuel economy, and innovation that affects attributes that
are transferable to fuel economy, such as weight and engine power. So we assume that K is
additively separable in fuel economy related attributes and non-fuel-economy related attributes,
that is:
(2) Kit=Ut(mpgit, wit, hpit, tqit, Xit)+D(Yit, t)
Where U is the profitable technologies that are related to fuel economy available at time t, and D
is technologies that are unrelated to fuel economy, such as safety, available at time t. Our focus is
on the progress of U over time. The level set of U can be expressed as
(3) mpgit=g(wit, hpit, tqit, Xit|Ut)
We model the innovation in U at year t with respect to year t-1 as
(4) Ut/Ut-1=(St/St-1)mEXP(j+εt)
where S is the fuel economy standard, m is the innovate rate that is induced by standard changes,
j is the average yearly innovate rate, and ε is a normally distributed zero mean error term, which
represents fluctuation in the annual innovation under natural growth. We assume independency
of ε in different model years. Then in each model year after CAFE was enacted, we have
(5) Ut/U0=(St/S0)mEXP(t*j+∑εt)
Page 6
Following Knittel (2011), we assume Cobb-Douglas functional form for U. Then the fuel
economy is modeled as
(6) Mpgit= β1lnWit+β2lnHPit+ β3lnTQit+j*t+ m*lnCAFEt+ β4Mt + β5Mt*t +X’itB+eit
II Data
We collect vehicle attribute of models that were sold on the US market from Ward’s
Automotive Yearbook (WAY) from 1975 to 2011 and automobile-catalog.com (AC) from 1975
to 2011. Both data have their advantage and disadvantages. The WAY covers a broader range of
vehicles among 68 different makes. However, WAY does not provide complete information of
torque in cars prior to 1997. Fuel type is also not reported directly in WAY. Therefore, we
construct the fuel type of an internal combustion vehicle from the compression ratio reported in
WAY. We assign fuel type to gasoline if the compression ratio of the engine is less than 12 and
diesel if the compression ratio is above 12. We also construct transmission type for earlier years
in WAY when several transmissions were reported for a same trim. We pick only the first
provided transmission as the standard trim to determine whether the vehicle is manually
transmitted or automatically transmitted.
In the WAY data, the MPG reported are the EPA adjusted MPG ratings. The EPA
changed their methods of estimating MPG ratings over time. Also, only the combined adjusted
MPG rating was reported before 1985. Beginning in 1985, adjusted MPGs were reported in 2
separate numbers, city MPG and highway MPG. The city MPG was calculated as 0.9*[EPA
tested city MPG] and highway MPG was calculated as 0.78*[EPA tested highway MPG].
In 2008, the EPA adjusted their MPG rating methods again. The new methods took more
variables such as outdoor temperature, air-conditioning into account. This change resulted a
decrease in EPA adjusted MPG in most vehicles. The new formulas are shown as below
Adjusted city MPG =1
0.003259 +1.1805
Tested city MPG
Adjusted highway MPG =1
0.001376 +1.3466
Tested highway MPG
We use these formulas provided by the EPA and the adjusted MPG to reverse engineer the tested
MPG and then apply the formulas used prior to 2008 to get adjusted MPG numbers that are
comparable to those of previous model years. We then applied the same method EPA used to
construct the combined MPG, which is the weighted harmonious mean of adjusted city MPG and
adjusted highway MPG using a city/highway ratio of 0.55/0.45. We add a dummy in our
regression specifications to control for this additional adjustment to the MPG in the WAY data
as the tested fuel economy would be proportionately higher than the estimated actually fuel
economy reported in the AC data.
Page 7
The AC data that we have permission to use cover 23 major makes but provide more
comprehensive information in vehicle MPG and torque. The AC data also provide full
information of transmission type and fuel type. The MPG reported in the AC data are not EPA
ratings but estimates made by engineers.
Vehicles that have gross weight above 8500 lbs, typically heavy duty trucks, are not
regulated by the CAFE standards, therefore, we remove these vehicles from our analysis. We
also remove hybrid vehicles and electric vehicles that have MPG above 70 from our analysis
since these vehicles use very different technologies and we worry that our model for internal
combustion engine automobiles might not be suitable in estimating technology growth and
attributes tradeoffs in these vehicles.
III Evidences of attributes tradeoffs and technological progress
The fuel economy of vehicle models changed dramatically after the CAFE standards was
enacted. Figure one shows the changes of the CAFE standards over time. The standards were
effective starting in 1978 for cars and 1979 for trucks. The standards increased sharply at the
beginning and then remained stable in the 1990s and 2000s. The Obama administration set
aggressive new standards and the new standards after 2011 model year will be based on
footprints of vehicles. The 2025 target of MPG is almost twice as high as that of 2010.
Goldberg (1998) uses a discrete choice model to study the effect of the CAFE standards
on vehicle attribute. He shows that firms would produce cars with lower MPG at equilibrium had
CAFE not been in place. Since firms are taking corner solutions in their MPG choice when
CAFE standards are effective and binding, there is no incentive for firms to develop vehicles
with better MPG. Instead, firms produce more small cars and less large cars to make sure the
average MPG meets the standards. This could be the explanation of the almost flat average MPG
curve after 1983, when the CAFE standards stayed stable. Figure two shows how the average
weight, horsepower and fuel economy change from 1975 to 2011 in our data. Compared to
passenger cars in model year 1975, average MPG almost doubled in 1986 and remained at that
level till 2011. Average horsepower lowered by over 20% in 1982 compared to 1975 models and
then kept increasing every year and was 90% higher than 1975 models in 2011. Similarly,
average curb weight of cars decreased sharply during the period when CAFE standards were
increasing. The average weight decreased by 25% from model year 1975 to 1986 and gradually
increased and got back close to the 1975 level in 2011.
We observe similar trend in the light duty truck sector, whose CAFE standards were first
introduced at 17.2 MPG for 2 wheel drive trucks and 15.8 MPG for 4 wheel drive trucks. The
separate standards for 2 wheel drive trucks and 4 wheel drive trucks were disconnected after
1992. A combined standard was introduced later in 1982 at 17.5 MPG and all standards kept
increasing till 1987, when the combined standard was at 20.5 MPG. The combined standard
moved around 20.5 for a few years and remain stable at 20.7 MPG from 1996 to 2004. The truck
standard increased slowly again since 2005 and kept increasing to 24.1 in 2011. During 1975-
2011 model years, average weight of light trucks also dropped sharply in the first few years
Page 8
when the standards came into effect and then increased to 20% higher than 1975 level in 2011.
Average horsepower decreased slightly in the beginning and then increased to 110% higher than
1975 level during the same period.
These evidences show that, first, when standards increase faster than innovation, firms
are capable of lowering weight and horsepower of their products to achieve higher MPG. The
changes of average weight, horsepower and MPG during the late 70s and early 80s reflect such
behavior. Second, as technologies advance over time, firms are capable of building vehicles that
are better in every dimension. The changes of average CAFE standards were stable show that
technological growth over time allow firms to build vehicles with similar MPG, but much more
powerful and heavier. While horsepower and weight can be transferred to MPG, such changes
show that firms were able to build vehicles that are more fuel efficient. Figure three compares
the weight and fuel economy of car models in 1978 with models in 2008. Not surprisingly, firms
were able to produce cars that are larger and more efficient in 2008 compared to 1978. Such shift
in the plotting of attribute can also be seen in engine power and fuel economy and is clear
evidence of innovation.
IV Empirical results
Tables one and two report the regression results of passenger cars and tables three and four
report the regression results of light duty trucks. Table one and three also make comparisons
between firms from different origins while table two and four compare among different vehicle
classes.
A. Trade-offs of vehicle attributes
Coefficients of engine power, which includes torque and horsepower, and weight suggest
that they are negatively correlated to fuel economy. This is consistent with empirical studies in
engineering, which emphasize that firms can decrease weight or engine power to gain higher fuel
efficiency. Vehicles with diesel engine usually have better fuel economy compared to vehicles
with gasoline engines due to the higher efficiency of diesel engines. Another important factor
that affects fuel economy is the type of transmission. Manually transmitted vehicles are normally
more fuel efficient than automatically transmitted vehicles. However, the coefficients of the
interaction terms of manual transmission and time trend show that the difference had been
decreasing over time in both cars and trucks. In fact, some of the modern automatic
transmissions, such as the CVT, have similar or even better performance than manual
transmissions in terms of affecting fuel economy.
B. Natural rate of innovation
The coefficients of year trend estimate the average annual growth rate of fuel economy
related technologies. The results suggest that on average, firms have an annual increase of 1.19
percent in the fuel economy of their passenger cars. Note that this is not saying the actual fuel
Page 9
economy of the car models would be increasing every year. The interpretation is that the natural
innovation would increase the fuel economy by 1.19 percent assuming that other vehicle
attribute, including engine power and weight, were kept constant. Firms could chose to increase
weight or engine power instead of fuel economy to make their product more attractive their
customers. And that is exactly what they did when the CAFE standards remained stable.
Similarly, in the light duty truck sector, the natural innovation rate is 0.66 percent annually.
These estimates are the average innovation rate of all firms. As shown in table one and two, the
growth rate could vary across firms of different origins and different vehicle classes. For
example, while the US automakers have annual innovation rates at 0.79 percent in cars and 0.56
percent in trucks, the Asian automakers have annual innovation rates at 1.3 percent in cars and
0.86 percent in trucks. Also, small cars appear to enjoy a higher innovation rate than large cars
while SUV/CUVs lead in innovation rate among trucks.
C. Innovation in response to the CAFE standards
The induced innovation is the key focus of this paper. Our results show that in both the
passenger car and light truck markets, the changes in the level of CAFE standards have
significant effect on the MPG related innovation in addition to the natural innovation rate. Also,
the truck sector responds more strongly than the car sector.
The coefficients of the log CAFE standards estimate the average technological increase
with respect to changes in the CAFE standards. The estimates suggest that on average, 1 percent
increase in the CAFE standards are associated with additional 0.32 percentage point increase in
the innovation rate of fuel economy related technologies of cars. Likewise, 1 percent increase in
the CAFE standards are associated with additional 0.62 percentage point increase in the
innovation of trucks. There are two explanations to the different response to the CAFE standard
changes among cars and trucks. The first explanation is that trucks started at a relatively low
technology level. When the CAFE standards first came into effect, the market share of light duty
trucks was only around 20 percent and there were very few international brands on the US
market. The market of cars, however, were much more competitive. Second reason is that, as
discussed in part B, the natural innovation rate of trucks are also lower than that of cars.
Therefore, automakers were able to improve their technologies faster when they were pushed by
the increases of standards since there were more rooms for improvements due to the two reasons
discussed above.
We also break down our sample into various subgroups to explore the heterogeneity
among different automakers and vehicle classes. As shown in table one, in the passenger car
market, both US automakers and Asian automakers respond strongly to the standards. This is
surprising at first glance since Asian makers had been producing cars with average fuel economy
that were high above the CAFE standards. Slight increases of the CAFE standards should not
have a direct pressure on the Asian makers. We explain this as the evidence of market
competition. The US automakers had been producing cars with an average fuel economy that
barely meets the CAFE standards. Every time the CAFE standards tightened up, US automakers
had to push harder in their innovation to increase their fuel economy to meet the higher
standards. They are reluctant to simply lower weight and engine power as these attributes are
Page 10
what consumers demand in the US. The traditional advantage of Asian brand cars is fuel
efficiency since they day they entered the US market. To defend their advantages in the market
competition, Asian makers also had to increase the fuel efficiency of their products when US
automakers improved their fuel economy. Therefore, though most of the time the tightening in
the CAFE standards did not push Asian automakers directly, they still stimulated faster
innovation rate of Asian brand cars through market competition.
There were also automakers who chose to not to comply with the CAFE standards and
pay the fines. These were all European companies who were specialized in producing luxury
cars. Unlike the US automakers and Asian automakers, European automakers do not have a
significant response in innovation to the increases in the CAFE standards. We explain this as the
evidence that these European companies were able to pass on the fines to their consumers who
cared more about luxury features of their vehicles and were less sensitive to prices. We do not
observe such behavior in the luxury cars in the US and Asian automakers. There are two
explanations for this. First, though they are all luxury vehicles, the US and Asian luxury cars
were normally cheaper than the European luxury cars, which suggest that consumers who chose
to purchase European luxury cars are probably richer and less price sensitive than those who
chose the US or Asian brand luxury cars. Second, the US and Asian automakers pushed their
technological growth in response to increases in CAFE standards to either avoid paying fines or
maintaining market advantages. These technological improvements can be applied to both
economy cars and luxury cars without extra innovation costs. As a result, even though consumers
of luxury cars could be less price sensitive, the US and Asian automakers still applied
technologies that were already at their disposal.
V Robustness checks
In this section we discuss the potential concerns of the robustness of our results and we
perform series of robustness checks to show that the estimates in the main specification are
sound.
A. Correlation between vehicle attributes
The first concern of the empirical model we use is that vehicle attribute are correlated
with each other. When automakers design their vehicles, the combinations of installed equipment
are not random. For example, engine power is highly correlated with vehicle weight. Automakers
typically install more powerful engines in heavier and larger vehicles. Therefore, horsepower and
weight are clearly correlated with each other. Though the focus of this paper is not on the trade-
off relationship between attributes but on the innovation rate, we still want to make sure that
such correlation in attribute wouldn’t bias our estimation of innovation responses. To address
this concern, we use the translog functional form for the technology level U to test whether our
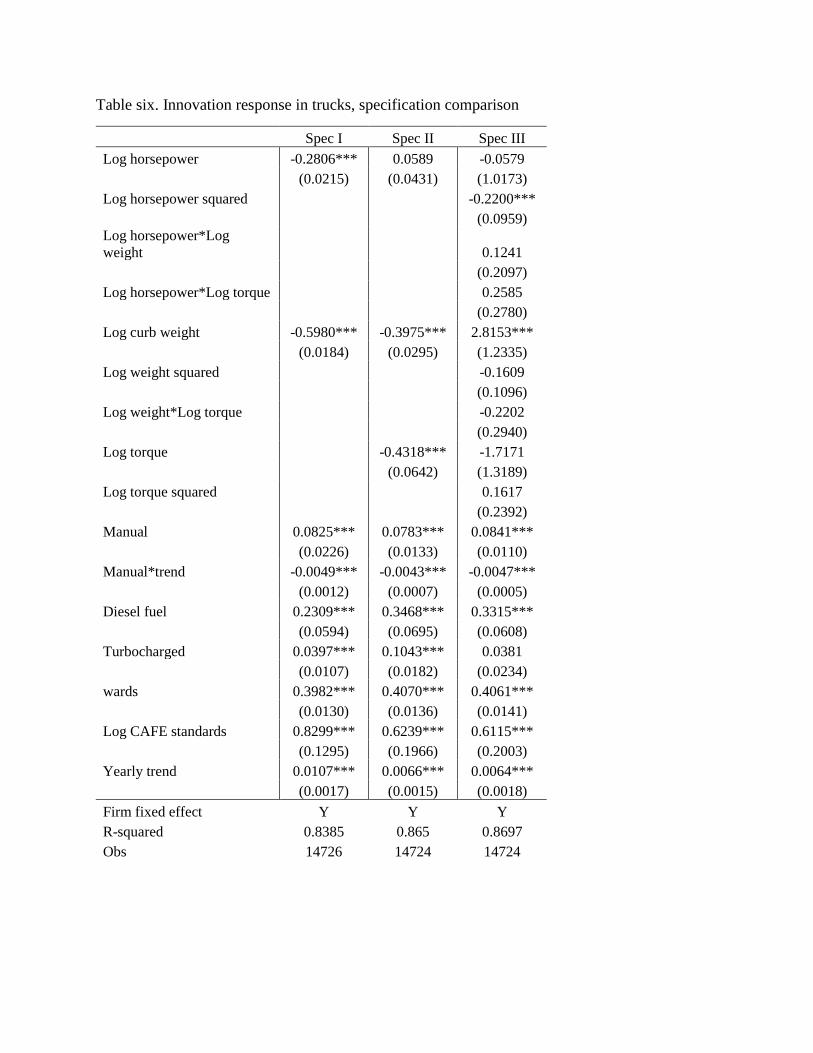
estimates of innovation responses are sensitive to such correlations. Table five and six show the
regression results using the translog functional form in specification III while showing the main
specification in specification II. The annual innovation rate estimated using the translog model is
very close to the estimates we have in the Cobb-Douglas model. The response rates of innovation
Page 11
to the changes in the CAFE standards are also very close between the two specifications. Such
results suggest that even though there are correlations between vehicle attribute, they do not
appear to be a potential threat to the estimations of annual innovation rates and the response rates
of innovation.
B. Engine power measurement
The second concern we have is the measure of engine power. We use both highest torque
and highest horsepower in the analysis. However, these two measures are also closely related.
We present the specification keeping only horsepower in specification one and the estimates of
natural innovation rate and response rate increased compared to our main specification. The
relationship between torque and horsepower is: Horsepower=Revolution per minute
(rpm)*Torque/5252 while torque is a function of rpm. So though highly correlated, keeping both
maximum horsepower and maximum torque in the model still helps controlling more features of
engine development over time. Therefore, we still chose the more conservative estimates in our
main specification to proceed to predicting future innovation.
VI Future innovation prediction
We simulate innovation under the new standards using the estimated natural innovation
rate and the induced innovation in response to the CAFE standards. The CAFE standards
changed to footprint based standards starting in 2012. Instead of a single average fuel economy
standard for cars or trucks, the footprint based standards set different standards for vehicles
based on their size. To simplify the simulation, we use the average change rates of the footprint
based standards for in the simulation.
Our calculation show that the average fuel economy standard increase from 2011 to 2025 in
cars is 72%, or an increase of 0.542 in logarithm. We estimate the logarithm innovation rate
comparing to 2011 as
(7) Growtht=(T-2011)*j + (logSt-logS2011)*m
where j is the average annual growth, T is the model year, S is the CAFE standards and m is the
technological growth response to CAFE standards. In the car sector, as shown in section IV,
j=0.0119 and m=0.32. Using the formula above and the estimates, we calculate that the total
technological growth from the natural growth will be 0.167 in logarithm from 2011 to 2025 and
the additional growth stimulated by standard increases will be 0.190 in logarithm as shown in
table seven. The induced innovation exceeds the natural innovation in cars. This means that if
firms keep the weight and engine power of their cars at the 2011 level, they will be able to build
cars with 40.5% higher MPG than their 2011 products in 2025 or an increase of 0.340 in
logarithm. However, the increases in the CAFE standards for cars is 0.542 in logarithm. This
means that there will still be a 0.2 gap. Therefore, to meet the standards in 2025, automakers will
have to decrease the weight and engine power of their cars comparing to 2011 level to gain better
fuel economy. Comparing to the historical data, if we assume that firms decrease weight and
engine power backward of the way they increased weight and engine power in the past, then cars
Page 12
will have to be downsized to the 1995 to 1999 level to be able to comply with the 2025
standards.
Likewise, we calculate the future innovation in the light truck sector. The total induced
innovation will be 37.4% in the truck sector or 0.318 in logarithm from 2011 to 2025 and the
natural innovation will be 9.8% or 0.093 in logarithm. This leaves only 7.6% gap for firms to
downsize to meet the 2025 targets. We estimate that firms only need to downsize to 2007 to 2009
levels to achieve that.
VII Conclusion
In this paper, we estimate the technology growth in the automobile industry under the
pressure of the CAFE standards and then predict future vehicle attributes changes under the new
aggressive standards. We find that automakers would have a higher innovation rate under the
new standards. We estimate that automakers have a higher natural innovation rate in cars
compared to the truck sector. In the truck sector, the innovation is more sensitive to changes in
the standards than in the car sector. However, we cannot simply conclude that the overall effect
of the new aggressive standards are positive. This is because we only looked at fuel economy
related technologies in this analysis. Though we showed that firms have response positively to
the changes in standards in fuel economy related innovation, we don’t know if that’s at the
expense of innovation in other areas, such as safety technologies.
Our simulation of innovation under the new aggressive CAFE standards suggest that
automakers will have to do moderate downsizing to meet the 2025 target in cars, and they only
need minor downsizing in trucks to meet the standards. This is a much more optimistic
prediction than previous studies have shown.
Finally, by modeling innovation as a function of changes in regulation stringency, we
provide a tool that can more precisely predict future innovation under new regulation and
compare between different scenarios of regulation by taking into account the changes in
stringency levels. Such method can also be applied to other areas with similar standards or
regulations that are quantifiable.
Page 13
Reference:
Ashford, A. A., and R. P. Hall. The Importance of Regulation-Induced Innovation for
Sustainable Development. Sustainability 3(1): 270-292.
Brunnermeier, S. B., and M. A. Cohen. 2003. Determinants of Environmental Innovation in US
Manufacturing Industries. Journal of Environmental Economics and Management 45(2): 278-
293.
Christopher R. Knittel. 2011. Automobiles on Steroids: Product Attribute Trade-Offs and
Technological Progress in the Automobile Sector, American Economic Review 2012,
101(December 2011): 3368–3399
DeCicco, John, and Marc Ross. 1996. “Recent Advances in Automotive Technology and the
Cost-Effectiveness of Fuel Economy Improvement.” Transportation Research: Part D: Transport
and Environment, 1(2): 79–96.
DeCicco, John, Feng An, and Marc Ross. 2001. Technical Options for Improving Fuel Economy
of US Cars and Light Trucks, by 2010–2015. Washington, DC: American Council for an
Energy-Efficient Economy.
Goldberg, Pinelopi K. 1998. “The Effects of the Corporate Average Fuel Efficiency Standards in
the US.” Journal of Industrial Economics, 46(1): 1–33.
Greene, David L., and K. G. Duleep. 1993. “Costs and Benefits of Automotive Fuel Economy
Improvement: A Partial Equilibrium Analysis.” Transportation Research, 27(A): 217–35.
Jaffe, A. B., R. G. Newell, and R. N. Stavins. 2002. Environmental Policy and Technological
Change. Environmental and Resource Economics 22(1-2): 41-69.
Lanjouw, J. O., and A. Mody. 1996. Innovation and the International Diffusion of
Environmentally Responsive Technology. Research Policy 25(4): 549-571.
Page 14
Murrell JD. 1990. How Fuel Economy Responds to Changes in Weight, CID, and N/v. Ann
Arbor, MI: U.S. Environ. Prot. Agency, Off. Mobile Sources
Newell, Richard G., Adam B. Jaffe, and Robert N. Stavins. 1999. “The Induced Innovation
Hypothesis and Energy-Saving Technological Change.” Quarterly Journal of Economics, 114(3):
941–75.
Popp, D. 2002. Induced Innovation and Energy Prices. American Economic Review 92(1): 160-
180.
Page 15
Figure one. CAFE standards over time (MPG)
Figure two. Changes in car attribute from 1975 to 2011
0
10
20
30
40
50
60
70
Cars Small Cars Large cars
Trucks Small trucks Large trucks
Page 16
Figure three. Technological innovation of cars from 1978 to 2008
Page 17
Table one. Innovation response in cars.
All US Asian EU
Log horsepower -0.1378 0.0492 -0.4781*** -0.6089
(0.0732) (0.0389) (0.1063) (0.0977)
Log curb weight -0.3770*** -0.2848*** -0.3061*** -0.3802***
(0.0355) (0.0331) (0.0728) (0.0423)
Log torque -0.3533*** -0.5881*** -0.0245 0.2657***
(0.0841) (0.0388) (0.1320) (0.1072)
Manual 0.1341*** 0.1157*** 0.0954*** 0.1142***
(0.0186) (0.0214) (0.0196) (0.0543)
Manual*trend -0.0067*** -0.0051*** -0.0047*** -0.0043***
(0.0007) (0.0007) (0.0010) (0.0021)
Diesel fuel 0.1637*** 0.1340*** 0.1999*** 0.1362***
(0.0537) (0.0185) (0.0814) (0.0298)
Turbocharged 0.1430*** 0.1405*** 0.1235*** 0.0213***
(0.0161) (0.0250) (0.0201) (0.0227)
wards 0.3977*** 0.4147*** 0.3360*** 0.4147***
(0.0141) (0.0115) (0.0210) (0.0234)
Log CAFE standards 0.3205*** 0.3089*** 0.4225*** -0.2012
(0.0353) (0.0388) (0.0799) (0.1366)
Yearly trend 0.0119*** 0.0079*** 0.0130*** 0.0129***
(0.0013) (0.0005) (0.0006) (0.0011)
Firm fixed effect Y Y Y Y
R-squared 0.8971 0.9181 0.8553 0.7637
Obs 21656 12870 5501 3066
Page 18
Table two. Innovation response comparison among car classes
Small cars Medium Cars Large cars Economy cars Luxury cars
Log horsepower -0.2300*** -0.1275*** 0.0722 -0.0867 -0.2597***
(0.0948) (0.0547) (0.0561) (0.0651) (0.1269)
Log curb weight -0.2994*** -0.4589*** -0.4882*** -0.3788*** -0.2921***
(0.0563) (0.0713) (0.0926) (0.0460) (0.0565)
Log torque -0.2808*** -0.3734*** -0.4676*** -0.4253*** -0.1954
(0.1162) (0.0519) (0.0859) (0.0650) (0.1299)
Manual 0.1389*** 0.1014*** 0.0385 0.1300*** 0.0831***
(0.0132) (0.0390) (0.0178) (0.0157) (0.0445)
Manual*trend -0.0061*** -0.0049*** -0.0001*** -0.0063*** -0.0040***
(0.0006) (0.0016) (0.0008) (0.0005) (0.0017)
Diesel fuel 0.2490*** 0.0735 0.2197*** 0.2118*** 0.0566
(0.0523) (0.0474) (0.0185) (0.0688) (0.0679)
Turbocharged 0.1271*** 0.1916*** 0.2609*** 0.0895*** 0.1331***
(0.0155) (0.0182) (0.0211) (0.0237) (0.0348)
wards 0.3543*** 0.4041*** 0.5065*** 0.3538*** 0.4833***
(0.0171) (0.0131) (0.0104) (0.0133) (0.0253)
Log CAFE standards 0.3456*** 0.3058*** 0.3101*** 0.2695*** 0.4373***
(0.0575) (0.0594) (0.1496) (0.0382) (0.1246)
Yearly trend 0.0129*** 0.0117*** 0.0052*** 0.0123*** 0.0101***
(0.0012) (0.0012) (0.0020) (0.0012) (0.0026)
Firm fixed effect Y Y Y Y Y
R-squared 0.8609 0.8901 0.9336 0.9325 0.7971
Obs 10185 8525 2946 16287 5369
Page 19
Table three. Innovation response in trucks.
All US Asian EU
Log horsepower 0.0589 0.0927 0.0253 -0.0946
(0.0431) (0.0711) (0.0716) (0.0894)
Log curb weight -0.3975*** -0.3797*** -0.4283*** -0.5554***
(0.0295) (0.0507) (0.0412) (0.0737)
Log torque -0.4318*** -0.4788*** -0.3781*** -0.1819
(0.0642) (0.1050) (0.0761) (0.1146)
Manual 0.0783*** 0.0855*** -0.0439*** -0.0174***
(0.0133) (0.0191) (0.0415) (0.0433)
Manual*trend -0.0043*** -0.0045*** -0.0002*** -0.0001
(0.0007) (0.0012) (0.0018) (0.0013)
Diesel fuel 0.3468*** 0.3452*** 0.4524*** 0.3051***
(0.0695) (0.0991) (0.0213) (0.0540)
Turbocharged 0.1043*** 0.0648*** 0.0743***
(0.0182) (0.0141) (0.0277)
wards 0.4070*** 0.4259*** 0.3390*** 0.3699***
(0.0136) (0.0161) (0.0198) (0.0339)
Log CAFE standards 0.6239*** 0.6306*** 0.4530*** 1.1270***
(0.1966) (0.3151) (0.1492) (0.3600)
Yearly trend 0.0066*** 0.0056*** 0.0086*** 0.0046
(0.0015) (0.0022) (0.0030) (0.0068)
Firm fixed effect Y Y Y Y
R-squared 0.865 0.8612 0.8145 0.9191
Obs 14724 10369 3775 566
Page 20
Table four. Innovation comparison among truck classes
Pickups CUV/SUV Vans
Log horsepower -0.0270 0.0818 0.0498
(0.0241) (0.0853) (0.0413)
Log curb weight -0.2808*** -0.4397*** -0.7404***
(0.0195) (0.0244) (0.0403)
Log torque -0.2736*** -0.4617*** -0.2448***
(0.0358) (0.0843) (0.0232)
Manual 0.0492 0.0939 0.2152
(0.0275) (0.0117) (0.0358)
Manual*trend -0.0027*** -0.0040*** -0.0084***
(0.0013) (0.0009) (0.0021)
Diesel fuel 0.3086*** 0.3818***
(0.0238) (0.0790)
Turbocharged 0.0259*** 0.1341***
(0.0086) (0.0145)
wards 0.3768*** 0.4129*** 0.3337***
(0.0235) (0.0163) (0.0203)
Log CAFE standards 0.8959*** 0.4719*** 0.3913***
(0.0448) (0.1726) (0.1257)
Yearly trend 0.0009 0.0088*** 0.0065***
(0.0022) (0.0008) (0.0018)
Firm fixed effect Y Y Y
R-squared 0.7782 0.8904 0.8145
Obs 4267 8748 3775
Page 21
Table five. Innovation response in cars, specification comparison
Spec I Spec II Spec III
Log horsepower -0.4122*** -0.1378 -1.0728
(0.0165) (0.0732) (1.3998)
Log horsepower squared -0.4933***
(0.0875)
Log horsepower*Log
weight 0.0195
(0.1733)
Log horsepower*Log torque 1.0932***
(0.1607)
Log curb weight -0.5840*** -0.3770*** 5.8616***
(0.0311) (0.0355) (1.4723)
Log weight squared -0.5143***
(0.1320)
Log weight*Log torque 0.3847
(0.2608)
Log torque -0.3533*** -2.2422
(0.0841) (1.8252)
Log torque squared -0.6405***
(0.1297)
Manual 0.1490*** 0.1341*** 0.1122***
(0.0184) (0.0186) (0.0197)
Manual*trend -0.0074*** -0.0067*** -0.0050***
(0.0007) (0.0007) (0.0008)
Diesel fuel 0.1122*** 0.1637*** 0.2129***
(0.0501) (0.0537) (0.0521)
Turbocharged 0.1235*** 0.1430*** 0.1232***
(0.0268) (0.0161) (0.0186)
wards 0.3983*** 0.3977*** 0.3921***
(0.0148) (0.0141) (0.0139)
Log CAFE standards 0.3792*** 0.3205*** 0.2243***
(0.0289) (0.0353) (0.0353)
Yearly trend 0.0157*** 0.0119*** 0.0119***
(0.0004) (0.0013) (0.0010)
Firm fixed effect Y Y Y
R-squared 0.8883 0.8971 0.9036
Obs 21656 21656 21656
Page 22
Table six. Innovation response in trucks, specification comparison
Spec I Spec II Spec III
Log horsepower -0.2806*** 0.0589 -0.0579
(0.0215) (0.0431) (1.0173)
Log horsepower squared -0.2200***
(0.0959)
Log horsepower*Log
weight 0.1241
(0.2097)
Log horsepower*Log torque 0.2585
(0.2780)
Log curb weight -0.5980*** -0.3975*** 2.8153***
(0.0184) (0.0295) (1.2335)
Log weight squared -0.1609
(0.1096)
Log weight*Log torque -0.2202
(0.2940)
Log torque -0.4318*** -1.7171
(0.0642) (1.3189)
Log torque squared 0.1617
(0.2392)
Manual 0.0825*** 0.0783*** 0.0841***
(0.0226) (0.0133) (0.0110)
Manual*trend -0.0049*** -0.0043*** -0.0047***
(0.0012) (0.0007) (0.0005)
Diesel fuel 0.2309*** 0.3468*** 0.3315***
(0.0594) (0.0695) (0.0608)
Turbocharged 0.0397*** 0.1043*** 0.0381
(0.0107) (0.0182) (0.0234)
wards 0.3982*** 0.4070*** 0.4061***
(0.0130) (0.0136) (0.0141)
Log CAFE standards 0.8299*** 0.6239*** 0.6115***
(0.1295) (0.1966) (0.2003)
Yearly trend 0.0107*** 0.0066*** 0.0064***
(0.0017) (0.0015) (0.0018)
Firm fixed effect Y Y Y
R-squared 0.8385 0.865 0.8697
Obs 14726 14724 14724
Page 23
Table seven. Future innovation prediction from 2011 to 2025 under the new standards.
Cars Trucks
Percentage logarithm Percentage logarithm
Average increase in the CAFE
standards from 2011 to 2025 72.0% 0.542 55.6% 0.442
Average annual innovation 1.2% 0.012 0.7% 0.007
Innovation response rate to
changes in CAFE standards 0.320 0.624
Induced innovation 20.9% 0.190 37.4% 0.318
Total innovation from 2011 to
2025 40.5% 0.340 44.6% 0.369
Deficit to meet the 2025 targets 22.5% 0.203 7.6% 0.073