The Impact of Capital Inflows on Asset Prices in Emerging Asian Economies: Is Too Much Money Chasing Too Little Good? * August, 2008 Soyoung Kim ** Doo Yong Yang Korea University ADB Institute Abstract In recent years, emerging Asian economies have experienced (i) large capital inflows, especially a surge in portfolio inflows, and (ii) an appreciation of asset prices such as stock price, land price, and nominal and real exchange rates. We empirically investigate the effects of capital inflows on asset prices by employing a panel VAR model. The empirical results suggest that capital inflows indeed contributed to the asset price appreciation in this region, although capital inflow shocks explain a relatively small part of asset price fluctuations. Key words: Capital inflows, Asset prices, Panel VAR JEL Classification: F32, F21, G12 * We thank Cindy Houser, Jong-Wha Lee, and Lei Lei Song for various suggestions, editing, and data construction. This research is supported by the research fund (R0600842) of Seoul Development Institute. ** Department of Economics, Anam-Dong, Sungbuk-Gu, Seoul, Korea 136-701,e-mail: [email protected].
Transcript
The Impact of Capital Inflows on Asset Prices in Emerging Asian Economies: Is Too Much Money Chasing Too Little Good?*
August, 2008
Soyoung Kim** Doo Yong Yang Korea University ADB Institute
Abstract
In recent years, emerging Asian economies have experienced (i) large capital inflows, especially a surge in portfolio inflows, and (ii) an appreciation of asset prices such as stock price, land price, and nominal and real exchange rates. We empirically investigate the effects of capital inflows on asset prices by employing a panel VAR model. The empirical results suggest that capital inflows indeed contributed to the asset price appreciation in this region, although capital inflow shocks explain a relatively small part of asset price fluctuations.
Key words: Capital inflows, Asset prices, Panel VAR
JEL Classification: F32, F21, G12
* We thank Cindy Houser, Jong-Wha Lee, and Lei Lei Song for various suggestions, editing, and data construction. This research is supported by the research fund (R0600842) of Seoul Development Institute. ** Department of Economics, Anam-Dong, Sungbuk-Gu, Seoul, Korea 136-701,e-mail: [email protected].
1
I. Introduction
The relationship between capital surges and domestic asset price boom is quite relevant in
emerging market economies. Emerging market economies have frequently experienced a series of
boom-bust cycles that result in economies crisis. It begins with a boom stage of credit expansion,
investment increases, asset prices rise, and increasing capital inflows, and ends up with a burst stage
when all reverses. The recent coincidence of huge capital inflows and asset price appreciation in
Asia gives rise to a similar line of concerns. The policy options to mitigate the adverse effects of
huge capital inflows are known to be relatively limited in Asia. Potential difficulties in policy
options lie on complicated policy objectives, since there exists trade-offs between domestic and
external objectives.1
Capital inflows in emerging Asian countries have reached $200 billion in 2005, which is
higher than the previous peak of $140 billion in 1996, from $26 billion in 1998. Observing this
coincidence of rapid appreciation of asset and currency prices and huge capital inflows in recent
years, policymakers and academia in the region have expressed concerns that huge capital inflows
might be leading to financial instability and adverse consequences on the real economy. Given that
financial market stability is critical to macroeconomic management, these trends have become
significant factors affecting policy decisions in these emerging Asian economies.
The current surge in capital inflows, especially portfolio inflows in the region, may have
been induced by both push factors related to the global environment, and pull factors related to
post-crisis changes in the region's economic environment. With low interest rates and declining
asset investment returns in advanced economies, investors’ demand for investment opportunities in
emerging market portfolio assets began to soar, fueled in part by the favorable global liquidity
condition. At the same time, several economies in the region relaxed regulatory restrictions on
1 For example, if monetary authorities target asset prices, the monetary policy in emerging Asia becomes more complicate since capital flows influence both exchange rates and domestic liquidity. This possibly affects asset prices. Monetary policy reacts to asset prices is highly controversial in general. See Roubini, (2006), Filardo (2004), Borio and Lowe (2002), Bordo and Jeanne (2002), Cecchetti et al (2002), and White (2006) for active monetary policy role in considering asset prices in its objectives. See also Miskin (2007), Schwartz (2002), Bernanke and Gertler (1999, 2001), Gilchrist and Leahy (2002), and Goodfriend (2003) for opponents of active monetary policy.
2
foreign portfolio investments through capital market/account liberalization, further spurring massive
portfolio inflows.
Capital inflows can help domestic economies in various ways, but large capital inflows may
also produce undesirable macroeconomic outcomes. History tells us that emerging market
economies often suffer periods of rapid capital inflows followed by outflows, generating boom-bust
cycles. The initial period of capital inflows is often characterized by real exchange rate appreciation,
domestic credit expansion, consumption and/or investment booms, and asset price bubbles. Over
time, the process tends to reverse itself: net capital inflows turn into net outflows and boom turns
into bust, with adverse consequences for local asset prices and, often, the real economy. In fact,
several studies have shown that the Asian crisis in the 1990s was related to excessive capital flows.2
Then, as massive capital inflows and asset price appreciation are observed in the initial stage of
boom-bust cycle, the recent coincidence of huge capital inflows and asset price appreciation in
emerging Asian economies has raised concerns on the possibility of future crisis.
There are several channels that capital inflows may result in an increase in asset prices.
First is a direct channel that affects the demand for assets, and then increases asset prices. In
addition, there can be a spill-over effect to other financial markets such as real estate market
subsequently. Second is a liquidity channel such that capital inflows may result in an increase in
money supply and liquidity, unless fully sterilized, which in turn can boost the asset prices. Third,
capital inflows tend to generate economic booms of the country, and then lead to an increase in
asset prices.
However, recent asset price surge in emerging Asian market economies can be due to some
other factors than capital inflows. For example, the recovery from the Asian Financial crisis and a
better economic perspective of the Asian countries may have also led to asset price increases. 2 Corsetti et al. (1998) points out that the causes of the crisis lie on financial over-lending, banking problems, and composition, maturity and size of capital inflows in Asia. Mishkin (1999) also asserts that the crisis started with financial liberalization that resulted in a lending boom which was fed by capital inflows, and bank lending expanded so rapidly that excessive risk-taking prevailed. Excessive bank lending to the real estate sector has also been noted. Sachs and Woo (2000) point out that too much money was poured into speculative real estate projects. Krugman (1998) also states that the problem began with financial institutions whose liabilities were perceived as having an implicit government guarantee, but were essentially unregulated and therefore subject to a severe moral hazard problem. The excessive risk lending of these institutions created increases in price, not of goods, but of financial assets.
3
Monetary expansion and low interest rates of these Asian countries, originating from the recession
in the late 1990s and early 2000s, may be another factor explaining the asset price booms. The
exchange rate appreciation against the U.S. dollar may also be explained by the massive U.S.
current account deficit and national debt problem.
On the other hand, some recent studies provide some interesting insights on asset bubbles
and capital inflows. Caballero and Krishnamurthy (2006) argue that in emerging markets with
shortage of stores of value and financial repression, dynamic inefficiency prevails and they are easy
to create asset bubbles. They reproduce bubbles dynamics in emerging economies with capital
flows; capital inflows increasing domestic liquidity during the growth phase of the bubble, but
when the bubble crashes, capital flows reverse, domestic credit and investment falls. On the other
hand, Ventura (2002) insists that bubbles act as a substitute for international capital flows,
improving the international allocation of investment and reducing rate of return differentials across
countries. These studies suggest that there can be asset price bubbles, even when foreign investors
are not allowed to directly access domestic asset markets. Further, Ventura (2002) suggests that
asset price appreciation can be observed in the economy without any capital inflows3.
To shed some light on these issues, we empirically investigate the effects of recent surges in
capital inflows on appreciations of asset prices in emerging Asian economies. There have been
some empirical studies on the effects of capital flows or capital account liberalization. Some studies
discuss macroeconomic effects, for example, Kim, Kim, and Wang (2004), Montiel (1996), Agenor
and Hoffmaister (1998), Corbo and Hernandez (1994), and Jansen (2003). However, there are not
many studies that focused on the effects on asset prices. We examine whether the recent increase in
asset prices is due to capital inflows, and if so, how much is due to capital flows. To discern the
potential effects of these increase portfolio inflows and policy implications of these increased
portfolio inflows, it is essential to assess their impact on the region’s capital markets.
We construct panel VAR model to address the issue. First, VAR models are data-based with
3 Refer to Tirole (1985).
4
a relatively small number of restrictions. Such empirical framework is useful to document empirical
facts. Second, the effects of capital inflows are expected to be inherently dynamic. For example,
foreign capital inflows may affect different types of asset markets with different timings. VAR
models are useful in inferring dynamic effects. Third, panel framework is used since the sample
period under consideration is relatively short.
Section II summarizes trends in capital inflows to the region and asset prices and exchange
rate, and discusses the potential effects of capital inflows on asset prices and exchange rates.
Section III provides an empirical analysis on the effects of capital inflows and foreign portfolio
inflows on asset prices using panel VAR models. Section IV provides a conclusion to this study.
II. Recent Trends and Impacts of Capital Flows in Emerging Asian Economies4
II.1. Recent Trends in Capital Flows in Emerging Asian Economies
For the last three decades, there have been large cross-border capital flows between
economies on a global scale, and the trend has continued to the present. The profit-seeking activities
and diversification of risks by domestic and multinational financial institutions contributed
significantly to increasing cross-border capital flows. Furthermore, with the turn of the 1990s,
capital inflows on a global scale started to take on diverse forms as investors from advanced
economies diversified their assets internationally. Cross-border capital flows in general grew rapidly
from the 1980s, because institutional investors began to show a high tendency to structure
diversified portfolios in order to lower risks in their international portfolios. In addition, the
development of information and communication technology enabled global investment and
broadened opportunities for investors to manage risks though investment in diversified financial
assets across various countries. Moreover, an increasing number of institutional investors, including
insurance companies, pension funds, and hedge funds are investing in the emerging market. At the
same time, global cyclical factors are also favorable in increasing cross-border capital flows in
general, including lower interest rates and higher liquidity.
4 “Emerging Asian economies” refers to the People's Republic of China, Indonesia, the Republic of Korea, Malaysia, the Philippines, and Thailand, hereafter.
5
Although cross-border capital flows have increased in general, Asia's emerging markets
have been marked by a greater amount of capital inflows. First, economic fundamentals have
improved significantly. Most crisis-hit countries have bounced back from the Asian crisis and in
turn have lowered risk premiums combined with economic reforms in the region. Second, some
currencies in the region are undervalued vis-à-vis the US dollar. Since there is an expectation of US
dollar depreciation due to the current account deficit in the US, it seems safe to say that the
undervalued currencies carry more weight in international portfolios, not only by regional investors
but also by international investors as well. Third, many countries have loosened regulatory
requirements on foreign portfolio inflows through capital liberalization. Taken together, these
factors have contributed to a strong increase in inflows into the region's stock, bond, and real estate
markets, although the magnitude of the impact varies across countries and markets, depending on
local factors.
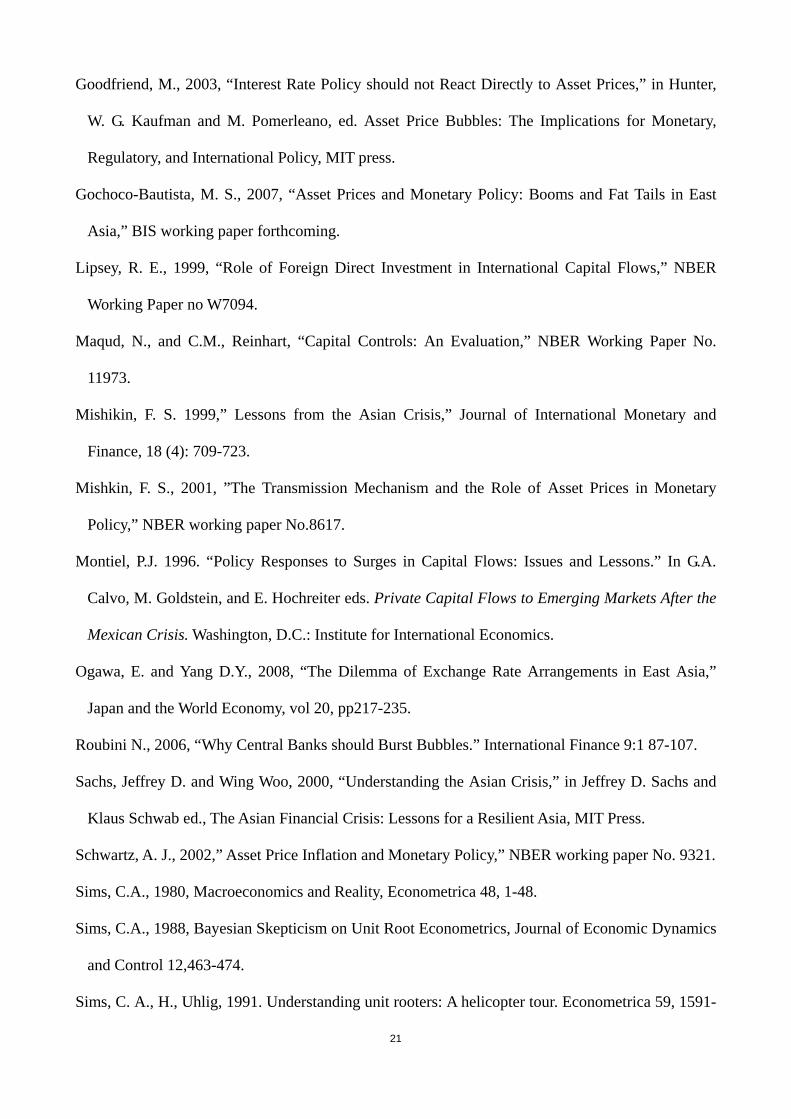
As a result of both push and pull factors as stated above, gross capital inflows in emerging
Asian economies have reached $200 billion in 2005, which is an increase of 100% over inflows in
1997 (see Figure 2)5. These inflows are close to 5% of GDP, which is lower than 7% of mid-1990s,
but the trend is increasing (see Figure 1). China has been the main destination for these capital
flows since 1993. In 1992, the share of China’s capital inflows to the total capital inflows of these
economies was 17%, but it increased dramatically to 73% in 2005.
Figure 3 shows the patterns of capital inflows in these economies. FDI constitutes a major
component in capital flows in these economies, accounting for 70% of total inflows. Since the early
1990s, FDI flows into East Asia have increased, especially concentrated in China and Southeast
Asian countries. Debt financing had more weight than equity financing in the late 1980s; however,
since the early 1990s, equity inflows have increased. Especially after the Asian crisis, equity
inflows are increasing because most Asian economies have removed barriers to foreign investment
on equity markets.
5 Gross capital inflows are defined as nonresident investment of FDI, portfolio investment and other investments to emerging Asian economies.
6
Gross capital outflows have increased rapidly in recent years and have reached an
unprecedented level6. The emerging Asian economies’ capital outflows recorded over $130 billion
in 2005, which is 4% of GDP in these economies, an increase of close to 400% over the last 10
years. China’s share of capital outflows constituted over 60% in 2005, followed by Korea and
Indonesia (see Figure 4 and 5).
Capital outflows are primarily composed of portfolio investments. In particular, bond
outflows are the dominant pattern of capital outflows, comprising over 60% of the total outflows.
This reflects a large proportion of Chinese and Korean banks’ purchases of nonresident debt
securities.
Broadening opportunities for foreign investment by institutional investors made available
to private investors could constitute an important channel for the expansion of capital outflows. In
2006, China announced a set of measures to provide individual savers greater access to foreign
assets. Qualified Domestic Institutional Investors now facilitate the foreign investment of domestic
savings although the availability of such funds is currently limited. Korea also encourages more
domestic individual investment abroad through mutual funds.
FDI outflows have increased as Asian firms have moved to establish global supply and
sales networks. Outward FDI from China has grown rapidly. In Korea, FDI outflows have also
increased as the country’s leading automobile and electronics firms have expanded a sizable portion
of their production overseas.
There are a couple of considerations with regard to the shift in the composition of capital
flows to the region. The first is that the variability of overall flows may be a bit lower. In general,
experience shows that FDI has been the least variable type of capital flow, while bank loans vary
the most. Portfolio equity flows are nearly as variable as bank loans. However, as stock and bond
market depth and liquidity increase, there is evidence that the volatility of FDI and debt securities
flows may increase (Lipsey 1999, Albuquerque 2003). Second, there are important differences in
6 Gross capital outflows refer to the total resident investment abroad including FDI, portfolio and other investment.
7
the consequences of flow reversals. As compared with bank lending, FDI is less subject to sharp
reversals. For portfolio investments in debt and equity markets, the direct impact of reversals is less
likely to severely affect the economy because asset equity price adjustments will quickly reduce the
BOP impact of sudden large outflows. There are, of course, potentially significant indirect
transmission channels to the real economy—through wealth effects on spending and, more seriously,
potential banking sector exposure to asset markets through securities holdings or through credit
exposure to investors.
II.2. Recent Trends in Asset Prices and Liquidity in Emerging Asian Economics
There is a general tendency that asset price increases and exchange rates appreciate in
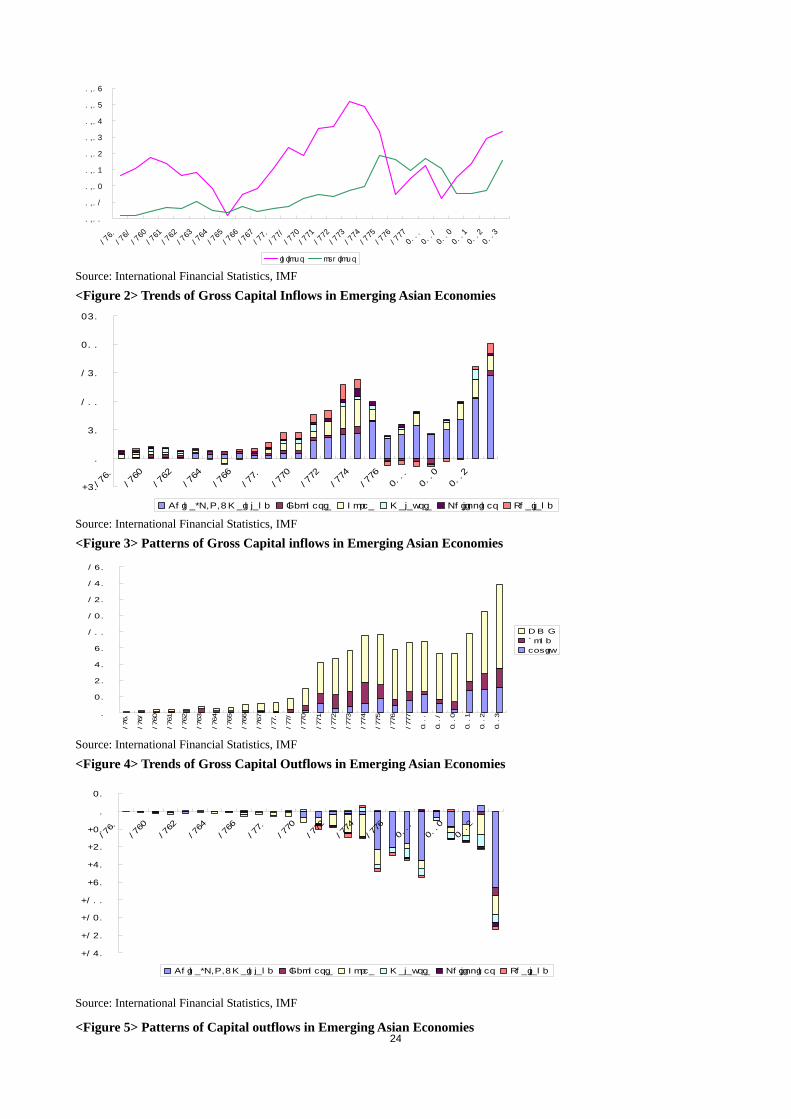
emerging Asian economies. Figure 6 shows the equity prices for four ASEAN countries, China, and
Korea. In these countries, stock prices increased sharply in recent years. From 2003, the upward
trend in equity prices is very clear in most countries. In Indonesia, Korea, Philippines, and Malaysia,
stock prices increased steadily from 2003. In China, a sharp increase started from mid 2005, and in
Thailand, there was a big surge in 2003.
On the other hand, a downward trend in bond yields is found in recent years (Figure 7). In
Indonesia and the Philippines, for example, drops in bond yields were quite substantial. In other
countries, the decrease was more moderate. Note that the downward trend in bond yield only started
from late 2005, which is later than the starting point of the upward trend in equity price. This might
be due to the spillover effects from equity markets. Most foreign capital flows enter stock markets,
partly because emerging East Asia has relatively less developed domestic bond markets and they are
less open to foreign participation. However, as stock prices rise, expected returns on equities drop
and bonds become more attractive to local investors, who bid up bond prices, lowering bond yields
In addition, land prices have increased in most countries (Figure 8). In Thailand and
Indonesia, they have increased by more than 50% from 2002. An upward trend has also been found
in Korea from 2001. The land prices in the Philippines have also increased steadily.
Figures 9 and 10 show the nominal and real effective exchange rates, respectively. Recently,
8
a clear appreciation trend is found in many countries, although the degree of appreciation varies
across countries. The Korean won and the Thai baht appreciated steadily from 2003. Other
currencies have appreciated from late 2005. The recent appreciation trend has also been found for
the real effective exchange rates in all these countries. The real appreciation started from 2004 or
2005.
Table 1 shows the percentage changes in foreign exchange reserves. Foreign exchange
reserves of these countries have increased rapidly in recent years. While these economies have been
running sizeable amounts of surplus on their current accounts, they have also piled up large capital
inflows. The bulk of the current account surpluses and capital inflows have been sterilized and
added to their reserves, for these countries want to stabilize either the nominal or real effective
exchange rate with the objective of maintaining their export competitiveness. Although the
sterilization of reserve accumulation was substantial, money supply (M2) also tended to increase
sharply in some countries, which may imply that the sterilization was only partial.
II.3. Effects of Portfolio Inflows on Capital Markets
Capital inflows may result in an increase in asset prices and an appreciation of the nominal
and real exchange rates. We summarize the main mechanisms in this section. Capital inflows can
affect asset prices in three ways. First, foreign portfolio inflows can directly affect the demand for
assets. For example, capital inflows to the stock market increase the demand for stocks and increase
the stock price. In addition, portfolio inflows may affect other markets subsequently. For example,
as capital flows into the stock market, the stock price increases but the expected return on stocks
may decrease. Then, investors may seek higher returns on other asset markets, such as the real
estate market and the bond market, and give upward pressure on other asset prices.
Second, capital inflows may result in an increase in money supply and liquidity, which in
turn may boost the asset prices. Capital inflows tend to appreciate the nominal and real exchange
rates. To avoid exchange rate appreciation, monetary authorities must intervene in the foreign
exchange market. Monetary authorities cope with excess demand for local currency (due to capital
9
inflows) by buying foreign currencies following capital inflows. This results in an accumulation of
foreign exchange reserves and, accordingly, domestic money supply. When this leads to an increase
in liquidity flows into asset markets, asset prices may surge. The foreign exchange intervention may
be sterilized by selling government securities through an open market operation. However, if
sterilization is partial, then liquidity and asset prices may increase.
Third, capital inflows tend to generate economic booms in a country and lead to an increase
in asset prices. Past studies have documented economic booms often following capital inflows.
Monetary expansion following capital inflows may lead to economic booms. Capital inflows due to
a fall in the world interest rate may lead to consumption booms and investment booms. A lowering
world interest rate would also decrease the domestic interest rate, which may lead to investment
booms. For a debtor country, a fall in the world interest rate will induce income and substitution
effects, which may lead to consumption booms.
Capital inflows tend to appreciate nominal and real exchange rates. In a floating exchange
rate regime, foreign portfolio inflows would directly affect the demand for domestic currency assets,
which leads to appreciation in the nominal exchange rate. Combined with sticky prices, the real
exchange rate can also appreciate. On the other hand, if the monetary authority intervenes in the
foreign exchange market, then the nominal appreciation may be avoided in a managed floating
regime. However, the real exchange rate may still appreciate. As discussed, consumption and
investment booms are likely to increase the price of non-traded goods more than the price of traded
goods because the supply of non-traded goods is more limited than the supply of traded goods.
As evidenced by the concurrent surges in portfolio inflows, asset price increases, and
exchange rate appreciation in the data, there may be substance to the assertion that a recent surge in
portfolio inflows increased asset prices and added to appreciation pressure rates. Furthermore, there
was an increase in money supplies, despite a substantial sterilization of foreign exchange reserve
accumulation.
However, other factors may explain asset price increases and exchange rate appreciation in
10
the Asian countries. The recovery from the Asian Financial crisis and a better economic perspective
of the Asian countries may have also led to asset price increases. Monetary expansion and low
interest rates of these Asian countries, originating from the recession in the late 1990s and early
2000s, may be another factor explaining the asset price booms that these countries have experienced.
The exchange rate appreciation against the U.S. dollar may also be explained by many other factors.
For example, the massive U.S. current account deficit and national debt problem may have also
caused the depreciation of the U.S. dollar. In the following section, we try to formally assess the
effects of portfolio inflows on asset prices and exchange rates.
III. Empirical Analysis
III.1. Panel VAR Model
We examine the effects of foreign capital inflows on asset prices using panel VAR (Vector
Auto-Regression) models. VAR models provide useful methodology to investigate this issue. First,
VAR models are data-based with a relatively small number of restrictions. Such empirical
framework is useful to document empirical facts. Second, the effects are expected to be inherently
dynamic. For example, foreign capital inflows may affect different types of asset markets with
different timings. VAR models are useful in inferring dynamic effects. Third, panel framework is
used since the sample period under consideration is relatively short.
Let’s assume that an economy i is described by the following structural form equation:
it
iit edyLG +=)( (1)
where G(L) is a matrix polynomial in the lag operator L, ity is an m×1 data vector, di is an m×1
constant matrix, m is the number of variables in the model, and ite denotes a vector of structural
disturbances. By assuming that structural disturbances are mutually uncorrelated, )var( ite can be
denoted by Λ, which is a diagonal matrix where diagonal elements are the variances of structural
disturbances. The individual fixed effect, di, is introduced to control for the country specific factors
that are not included in the model but affect each variable.
11
We pooled the data and estimated the following reduced form panel VAR with the individual
fixed effect:
it
it
iit uyLBcy ++= −1)( , (2)
where ci is an m×1 constant matrix, B(L) is a matrix polynomial in the lag operator L, and
Σ=)var( itu .
There are several ways of recovering the parameters in the structural form equation from
the estimated parameters in the reduced form equation. The identification schemes under
consideration impose recursive zero restrictions on contemporaneous structural parameters by
applying Cholesky decomposition to the reduced form residuals, Λ, as in Sims (1980). Note that our
statistical inference is not affected by the presence of non-stationary factors since we follow a
Bayesian inference (see Sims 1988 and Sims and Uhlig 1991).7
III.2. Empirical Model
In the basic model, the data vector, ity , is {Y, P, CAP, SP, LP} where Y is output, P is the
log of the price level, CAP is capital inflows or portfolio inflows (as a ratio to trend GDP), SP is the
log of the stock price and LP is the log of the land price.8 We included CAP, SP, and LP since they
are the main variables of our interests. Y and P are included to control for the factors that can affect
asset prices.
The factors or variables affecting domestic asset prices can be divided into three types. First,
certain factors affect domestic asset prices mostly through changes in foreign capital inflows. For
example, a change in the foreign interest rate changes foreign capital inflows and thereby affects
domestic asset price. Second, certain factors affect domestic asset prices mostly through channels
other than foreign capital inflows. For example, an increase in the price level (which may be the
result of monetary expansion) may increase domestic asset prices, but in this transmission, foreign
capital inflows are not likely to play an important role. Third, there are certain factors that affect
7 Specifically, we generate the standard error bands based on a Bayesian method, as described in RATS Manual. We also experimented with the difference specifications of Y, P, SP, and LP. Results do not change qualitatively. 8 A linear trend in GDP is assumed. Assuming different types of trend such as quadratic trend do not affect the results much.
12
domestic asset prices not only through changes in foreign capital flows but also through other
channels. For example, a change in the domestic economic condition induces foreign capital
inflows and then affects the asset prices. But a change in the domestic economic condition also
influences investments by domestic investors and thereby affects asset prices.
In the basic model, we control for the second and the third types of factors to analyze the
effects of capital inflows on asset prices. We include the second type of factor in the model because
there may be an omitted variable bias if an important factor is not included in the model. We also
include the third type of factor in the basic model. If we exclude this type of factor in the model,
then all the effects of this factor, including the effects through channels other than changes in capital
inflows, may be captured as the effects of foreign portfolio inflows. On the other hand, the first type
of factor affects the asset prices mainly through the changes in capital inflows. Therefore, to analyze
the effects of capital inflows, it is unnecessary to include this type of factor in the model.
Aggregate output is the most important variable that represents the domestic economic
condition, which may affect asset prices both through changes in foreign capital inflows and
through other channels (the third type). The aggregate price level shows the nominal and monetary
condition of the economy, which can also affect asset prices (the second type).
Regarding the ordering of the variables, aggregate output and aggregate price level are
assumed to be contemporaneously exogenous to other financial variables in the system. The
underlying idea is that real economic activities and the aggregate price level respond to changes in
economic condition sluggishly but the financial sector reflects all the information immediately. This
type of identifying assumptions are suggested by Sims and Zha (2006), and widely used in other
studies such as Kim (1999) and Kim and Roubini (2000).
In addition, by ordering the aggregate output and the price level before capital inflows,
structural shocks to capital inflows are constructed as conditioned on the current (and lagged)
aggregate output and the price level. Given that we would like to control for those variables in
identifying structural shocks to capital flows, this ordering is ideal for our purpose.
13
On the other hand, capital inflows are assumed to be contemporaneously exogenous to asset
prices. This type of assumption is used by Kim, Kim, and Wang (2004) and Froot, O’Connell, and
Seasholes (2001). In principle, stock prices can affect foreign portfolio inflows. High past returns
may signal high future returns when momentum is an important determinant of expected return.
Therefore, high past returns may induce foreign portfolio inflows. However, even in momentum
trading, a very transitory change in asset prices is not likely to significantly affect foreign portfolio
inflows. Therefore, the assumption of contemporaneous exogeneity of foreign portfolio inflows to
stock price may be justifiable. On the other hand, there is not much foreign capital that directly
flows into the real estate market in these economies. Therefore, the case of momentum trading is
not particularly applicable to the case of land price, and the assumption of contemporaneous
exogeneity of foreign portfolio inflows to land price is reasonable.
In order to make the assumption on stock price more reliable, the data on stock price is
constructed as the end of the period value.9 Consequently, capital inflows are a flow variable that
represents the activities during the period while stock price represents the value at the end of period.
Therefore, the assumption that other variables such as capital inflows are contemporaneously
exogenous to stock price is a reasonable one.
Finally, notice that the ordering between Y and P and between asset prices does not matter
when we examine the effects of shocks to capital inflows.10
In addition, we have constructed various extended models. First, we have considered some
extended models with other factors that may affect asset prices through channels other than capital
inflows. The extended model is: {Y, P, X, CAP, SP, LP}, where X is a new variable. We order X
before CAP to control for both current and lagged factors in identifying structural shocks to capital
flows. We consider the domestic short-term interest rate and capital outflows. Low domestic interest
rate may increase asset prices while capital outflows may decrease asset prices.
Second, to examine the effects on other relevant variables such as the nominal and real
9 Using daily stock price data, the stock price at the last date during the quarter is constructed. 10 Refer to Christiano, Eichenbaum, and Evans (1999).
14
effective exchange rates, we have added a new variable to the basic model. Since it is not clear
whether capital inflows are contemporaneously exogenous to exchange rates (and vice versa), we
consider two types of models with different orderings: {Y, P, X, CAP, SP, LP} and {Y, P, CAP, X,
SP, LP}, where X is the nominal or real effective exchange rates.
We consider five countries in our model: South Korea, Malaysia, Indonesia, the Philippines,
and Thailand.11 The estimation period is from the first quarter of 1999 to the first quarter of 2006.
Quarterly data is used.12 We exclude the period prior to 1999 since economic behavior before and
after the Asian crisis may be considered inconsistent within the framework of our study. A constant
term and four lags are assumed.
All data series have been obtained from International Financial Statistics, with the
exception of stock prices, land prices and nominal and real effective exchange rates. Stock price has
been obtained from Bloomberg while nominal and real effective exchange rate has been obtained
from BIS. Land prices have been obtained from various sources – the Bank of Korea webpage (for
Korea), ADB (for Philippines), and Gochoco-Bautista (2007) (for the others).
III.3. Empirical Results
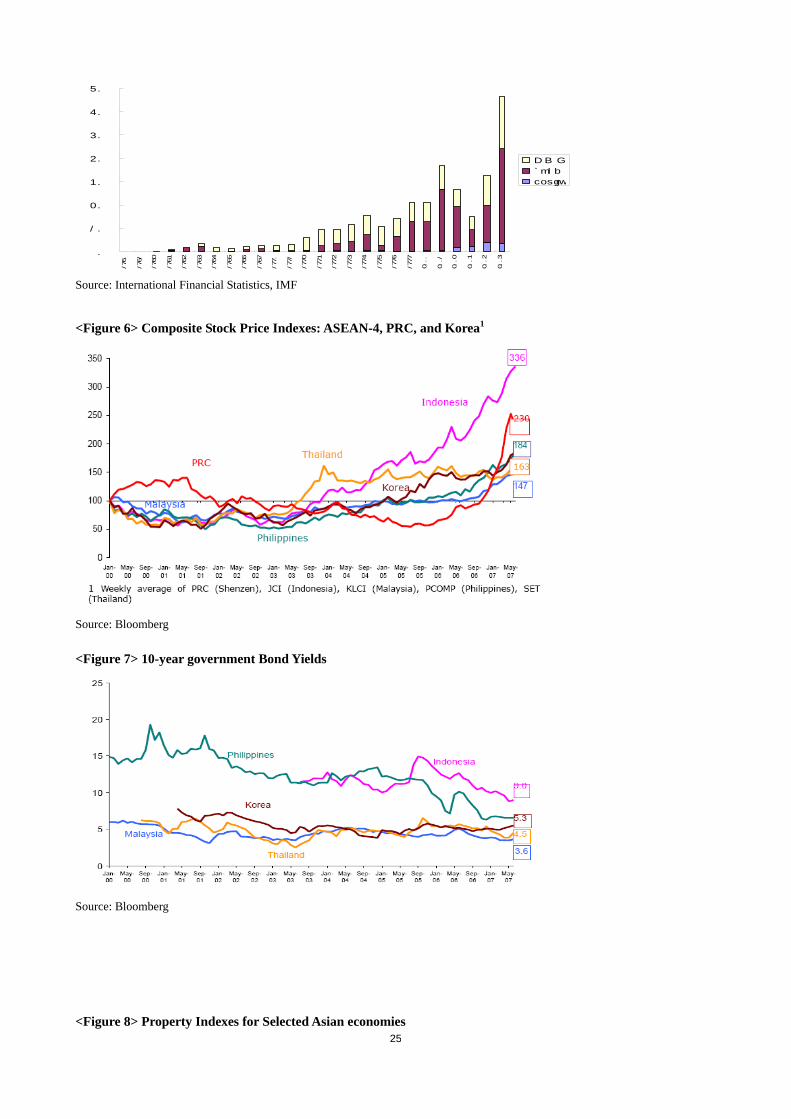
Figures 11 and 12 report the impulse responses of each variable with one standard error
band (68% probability bands) per 10 quarter horizon. The names of shocks are reported at the top of
the graph in each column. The names of responding variables are reported at the far left of the graph
in each row. Figure 11 shows the results for the system including capital inflows while Figure 12
reports the results for the system including portfolio inflows.
Although we are mostly interested in the effects of capital inflow shocks and other shocks
do not have much structural interpretation, we provide some explanations on the effects of other
shocks to understand the general picture. Positive shocks to RGDP and PGDP tend to increase the
asset prices over time. PGDP shocks have a very strong effect on asset prices while RGDP shocks
have a weak effect. We included these two factors in order to control for the factors that affect asset
11 Enough data series are not available for other countries. 12 Some variables such as capital inflows are not available in monthly frequency.
15
prices possibly through channels other than portfolio inflows. Since we have found that these
factors indeed affect asset prices significantly, we may say that at least some factors are controlled.
On the other hand, these two shocks do not seem to affect capital flows or portfolio flows strongly.
Therefore, we may infer that these two shocks affect asset prices without changing capital inflows
much, that is, mostly through channels other than capital inflows.
Then, we examine the effect of a positive shock to capital flows, which is of our main
interests. To infer the nature of capital flow shocks, first we can see the responses of capital flows.
Capital flows increase by 4% of trend GDP on impact. In the next quarter, the surge in capital flows
decrease, but still capital flows increase by about 0.6% of trend GDP, and this modest surge
continues over the next two years or so.
In response to capital flow shocks, the stock price increases for three quarters. The increase
in stock price is about 2-3% for the first three quarters. The land price also increases, but in general
the increase is more delayed than the increase in stock price. Land price increases about 1% on
impact, and it further increases up to three quarterly after the shock, and then decreases back to the
initial level. The maximum effect of the 1.5% increase is found in the 3rd quarter after the shock.
The effect of portfolio inflows on asset prices is similar on the whole, but the effect seems
to be weaker. Stock price increases on impact by about 1.5%, and decreases back to the initial level
in three quarters. The land price increase is delayed, and the maximum effect, about 1% increase, is
found in about five or six quarters after the shock. These weaker effects seem to be related to the
nature of portfolio inflow shocks. Portfolio inflows increase at about 2.5% on impact and decreases
back to the initial level in the next period. That is, shocks to portfolio inflows are smaller and less
persistent, which may explain why the effects of portfolio inflows shocks on asset prices are weaker
than those of capital inflows.
It is also interesting that neither capital inflow shocks nor portfolio inflow shocks affect
domestic output and price much; the responses of output and price level are not significantly
different from zero with 68% probability. Finally, positive shocks to asset prices increase capital
16
inflows and portfolio inflows, although the effect is not particularly strong. Increasing asset prices
may attract foreign investors and induce capital inflows.
To further confirm the above results, we report the results from extended models that
additionally include domestic short-term interest rate or capital (or portfolio) outflows in Figure 13.
Figure 13 shows the effects of capital inflows (or portfolio inflows) shocks on capital inflows (or
portfolio inflows), stock prices, and land prices. ‘CAP-R,’ ‘CAP-OUT,’ ‘PORT-R,’ and ‘PORT-
OUT’ stands for the model with capital inflows and short-term interest rates, the model with capital
inflows and capital outflows, the model with portfolio inflows and short-term interest rates, and the
model with portfolio inflows and portfolio outflows. In these models, the results are qualitatively
similar to those of the basic five variable model.
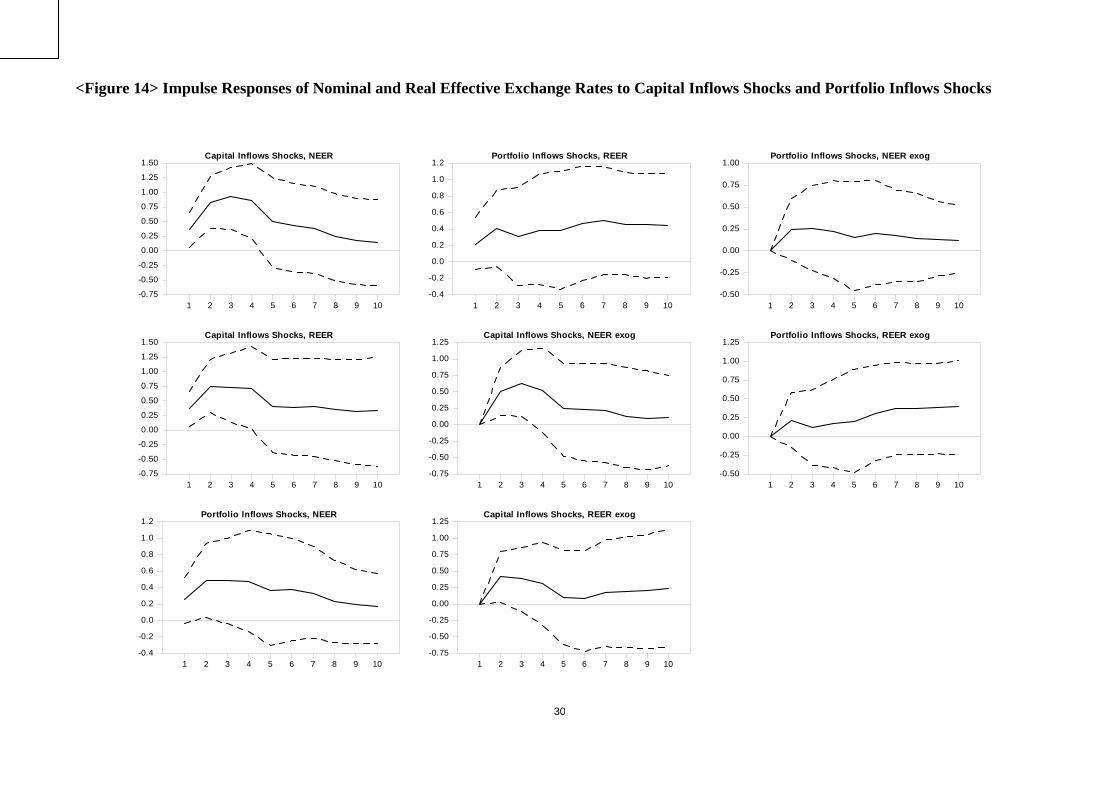
Then, we report the effects of capital inflow (and portfolio inflow) shocks on the real and
nominal effective exchange rates, using the extended model that additionally includes the real or
nominal effective exchange rates in Figure 14. The name of the type of shocks (either capital
inflows shocks or portfolio inflows shocks) and the name of the responding variable (either NEER –
nominal effective exchange rate - or REER – real effective exchange rate) and the structure of the
model (“exog” indicates the model in which exchange rate is contemporaneously exogenous to
capital inflows – otherwise, the model in which capital inflows is contemporaneously exogenous to
exchange rate) are defined at the top of each graph.
Positive capital inflow shocks lead to real and nominal appreciation, which is different from
zero with 68% probability in all specifications. The effects of portfolio inflow shocks are weaker,
but nominal and real exchange rates tend to appreciate in all cases. Also, note that in most cases, the
responses of the nominal effective exchange rates are very similar to those of the real effective
exchange rates, which suggests that real appreciation is mostly induced by nominal appreciation.
In summary, a surge in capital inflows or portfolio inflows has positive effects on asset
prices. Stock price increases immediately as capital inflows directly hit the stock market. The land
price increase is more delayed, which may be explained by a spill over effect. The real effective
17
exchange rate appreciates, which is mostly explained by a nominal appreciation. However, the
effects of capital inflows on the macro-economy seem to be limited, showing that output and the
aggregate price level do not respond much.
Next, we further inquire into to what extent variation in asset prices are explained by capital
inflow shocks by applying forecast error variance decomposition to asset prices. Table 3 reports the
results for the basic empirical models. Portfolio inflow shocks explain no more than 5% of stock
price and land price fluctuations in any horizon within 8 quarters. The contribution of capital inflow
shocks is larger, but still not very significant. Capital inflow shocks explain less than 8% of stock
price fluctuations in any horizon within 8 quarters. They explain less than 14% of land price
fluctuations in any horizon within 8 quarters as well. Based on these results, although capital
inflows affect asset prices significantly, it might be difficult to argue that the recent asset price surge
in these emerging Asian countries is mostly due to the recent increase in capital inflows.13
Finally, we find that capital inflows surge in these emerging Asian countries, and the
empirical results suggest that capital inflow shocks do have some responsibility for the rise in asset
prices in recent years. Therefore, the next question is whether the current surge in capital flows may
ultimately destabilize the macro-economy as we have seen historically, for example, during the
Asian crisis in the late 1990s. In this regard, we may say that a devastating crisis is less likely to
occur in upcoming years compared to the late 1990s, although we cannot entirely exclude the
possibility. First, the nature of the capital inflows is different. In the 1990s, a large portion of the
surge in capital inflows was short-term debt, but an increase in foreign portfolio inflows is a major
part in recent years. Second, the exchange rate had been more tightly controlled in the 1990s, but
these countries have adopted more flexible exchange rate arrangements after crisis. Third, these
countries (e.g., China and Korea) have built up massive foreign exchange reserves, and a regional
cooperation system has been arranged since the Asian crisis. Fourth, banking and financial sectors
13 However, the estimation period does not include the most recent dates when asset price appreciation accelerated and serious concerns on capital flows emerged. If a more recent period is included, the role of capital flow shocks might increase. In addition, whatever the exact contribution of capital inflow shocks to variations in asset prices, policymakers should pay attention to current asset price increases since it has been very rapid in recent years.
18
have been strengthened and there have been quite a few structural reforms in these countries. In
addition, our empirical results also show that capital inflow shocks do not significantly boost the
macro-economy, which may imply that the boom-bust cycle theory is less likely to be applied in the
current case.14
IV Conclusions
In recent years, emerging Asian economics experienced (i) large capital inflows, especially
a surge in portfolio inflows, and (ii) an appreciation of asset prices such as stock prices, land prices,
and nominal and real exchange rates. We first documented the recent trend in capital inflows and
asset prices in these countries, and reviewed how a surge in capital inflows can increase asset prices.
Emerging economies in Asia are using a variety of policy measures to deal with large
capital inflows and asset price hikes, including mitigating currency appreciation pressure by
implementing sterilization measures, encouraging capital outflows, and tightening credit growth by
increases in lending rates and required reserves. However, potential difficulties in policy options lie
on complicated policy objectives, since there exists trade-offs between domestic and external
objectives. Most Asian economies have taken the export-oriented growth strategy. Nominal (or real)
exchange rates are so important to keep export price competitive advantages. Under these
circumstances, massive sterilization is necessary. However, the fact that not only the sterilization is
partial, but also the increasing opportunity cost of sterilization brings about increasing liquidity in
domestic markets, which might contribute to asset price hikes. If monetary authorities target asset
prices, the monetary policy in emerging Asia becomes more complicate since capital flows
influence both exchange rates and domestic liquidity, which in turn possibly affects asset prices.
In order to shed some light on these issues, we empirically investigated the effects of
capital inflows on asset prices by employing a panel VAR model. The empirical results suggest that
capital inflows indeed contributed to the asset price appreciation in emerging Asian economies,
although capital inflows shocks explain a relatively small part of asset price fluctuations. Positive
14 See Kim, Kim, and Wang (2004) that capital flow shocks affect macroeconomic condition significantly in 1990s.
19
capital flow shocks increase stock prices immediately and land prices with some delays. They also
appreciate the nominal and real exchange rates.
References
Agenor, P. and A. Hoffmaister. 1998. “Capital Inflows and the Real Exchange Rate: Analytical
Framework and Econometric Evidence.” In R. Glick ed. Managing Capital Flows and Exchange
Rates. Cambridge University Press.
Albuquerque, R., 2003, “The Composition of International Capital Flows: Risk Sharing through
Foreign Direct Investment,” Journal of International Economics, Vol. 61, Issue 2, pp 353-383.
Bernanke, B. S. and M. Gertler, 1999, “Monetary Policy and Asset Volatility,” Federal Reserve
Bank of Kansas City Economic Review, vol 84, no.4, 17-52.
Bernanke, B. S. and M. Gertler, 2001, “Should Central Bank Respond to Movements in Asset
Prices?’ American Economic Review, 253-257.
Bordo, M. and O. Jeanne, 2002, “Monetary Policy and Asset Prices: Does Benign Neglect Make
Sense?” International Finance 5, 139-164.
Borio, C. and P. Lowe, 2002, “Asset Prices, Financial and Monetary stability: Exploring the
Nexus,” BIS working papers no 114.
Caballero, R. and A. Krishnamurthy. 2006. Bubbles and Capital Flow Volatility: Causes and Risk
management. Journal of Monetary Economics 53: 35-53.
Cecchetti, S. G, H. Genberg, and S. Wadhwani, 2002, “Asset Prices in a Flexible Inflation Targeting
Framework,” NBER working paper No. 8970.
Christiano, L., Eichenbaum, M., Evans, C., 1999. Monetary policy shocks: What have we learned
and to what end? In: Taylor, J.B., Woodford, M (Eds.), Handbook of Macroeconomics, Vol. 1A,
North-Holland, Amsterdam, pp. 65-148.
Corbo, V., and L. Hernandez, 1996, “Macroeconomic Adjustment to Capital Inflows: Latin
American Style versus East Asian Style,” Policy Research Working Paper 1377, IMF.
20
Corsetti, G, P. Pesenti, and N. Roubini, 1999,”What Caused the Asian Currency and Financial
Crisis?” Japan and the World Economy 305-373
Duttagupta, R. Fernandez, G., and Karacadag, C., 2005, Moving to a Flexible Exchange Rate: How,
When, and How Fast? Economic Issues 38, International Monetary Fund.
Eichengreen, B., 1999, “Kicking the Habit: Moving from Pegged Rates to Greater Exchange Rate