325
Edited by KATALIN TAUSZ The Impact of Decentralization on Social Policy Local Government and Public Service Reform Initiative
E d i t e d b y
KATALIN TAUSZ
The Impact ofDecentralizationon Social Policy
Local Governmentand Public ServiceReform Initiative

ii
T H E I M PA C T O F D E C E N T R A L I Z AT I O N O F S O C I A L P O L I C Y
L O C A L G O V E R N M E N T A N D P U B L I C S E RV I C E R E F O R M I N I T I AT I V E
O P E N S O C I E T Y I N S T I T U T E
A d d r e s sNádor utca 11.
H-1051 Budapest, Hungary
M a i l i n g a d d r e s sP.O. Box 519
H-1357 Budapest, Hungary
Te l e p h o n e (36-1) 327-3104
F a x(36-1) 327-3105
E - m a i [email protected]
We b S i t ehttp://lgi.osi.hu/
First published in 2002by Local Government and Public Service Reform Initiative, Open Society Institute Budapest
© OSI/LGI, 2002
ISBN: 963 9419 34 6
All rights reserved. No part of this book may be reprinted or reproduced or utilized in any form or byany electronic, mechanical or other means, now known or hereafter invented, including photocopying and
recording, or in any information storage or retrieval system, without permission in writing from the publishers.
Copies of the book can be ordered by e-mail or post from LGI.Printed in Budapest, Hungary, May 2002.
Design & Layout by Createch Ltd.
Local Governmentand Public ServiceReform Initiative
TM and Copyright © 2002 Open Society Institute

iii
Local Governmentand Public Service Reform Initiative
Local Government and Public Service Reform Initiative (LGI), as one of the programsof the Open Society Institute (OSI), is an international development and grant-givingorganization dedicated to the support of good governance in the countries of Central andEastern Europe (CEE) and the Newly Independent States (NIS). LGI seeks to fulfill itsmission through the initiation of research and support of development and operationalactivities in the fields of decentralization, public policy formation and the reform ofpublic administration.
With projects running in countries covering the region between the Czech Republicand Mongolia, LGI seeks to achieve its objectives through:
• development of sustainable regional networks of institutions and professionalsengaged in policy analysis, reform-oriented training and advocacy;
• support and dissemination of in-depth comparative and regionally applicablepolicy studies tackling local government issues;
• support of country-specific projects and delivery of technical assistance to theimplementation agencies;
• assistance to Soros foundations with the development of local government, publicadministration and/or public policy programs in their countries of the region;
• publication of books, studies and discussion papers dealing with the issues of de-centralization, public administration, good governance, public policy and lessonslearned from the process of transition in these areas;
• development of curricula and organization of training programs dealing withspecific local government issues;
• support of policy centers and think tanks in the region.
Apart from its own projects, LGI works closely with a number of other internationalorganizations (Council of Europe, Department for International Development, USAID,UNDP and the World Bank) and co-funds larger regional initiatives aimed at the supportof reforms on the subnational level. Local Government Information Network (LOGIN)and Fiscal Decentralization Initiatives (FDI) are two main examples of this cooperation.

iv
T H E I M PA C T O F D E C E N T R A L I Z AT I O N O F S O C I A L P O L I C Y

v
Contents
List of Contributors .............................................. vii
List of Tables and Figures ....................................... ix
Preface .................................................................... xv
1. The Impact of Decentralizationon Social Policy in Hungary,Latvia and Ukraine ........................................... 1Klára Czike ■ Balázs Krémer ■ Katalin Tausz
2. The Impact of Decentralizationon Social Policy in Hungary ........................... 89Balázs Krémer ■ István Sziklai ■ Katalin Tausz
3. Social Sector Development in Latvia ............ 133Linda Zivarte ■ Dace Jansone
4. The Ukrainian Social Protection Systemand the Methods of Governance ................... 197Anatoliy Chemerys ■ Andriy LipentsevOksana Muzychuk ■ Vira Tsypuk
Index ................................................................... 305

vi
T H E I M PA C T O F D E C E N T R A L I Z AT I O N O F S O C I A L P O L I C Y
vii
List of Contributors
LATVIA
Dace Jansone—Assistant Professor, Vidzeme University College, Head of Departmentof Political Science.
Linda Ziverte—M.Sc.Soc., University of Latvia, Faculty of Social Sciences, Head of theDepartment of Social Work, Ph.D. student in sociology.
UKRAINE
Anatolij Chemerys—Ph.D. in Economics, Director, Lviv Branch of Ukrainian Academyof Public Administration, Office of the President of Ukraine.
Andrij Lipentsev—Ph.D. in Economics, Deputy Director, Lviv Branch of UkrainianAcademy of Public Administration, Office of the President of Ukraine.
Oksana Muzychuk—M.A. in Public Administration, Lecturer, Lviv Branch of UkrainianAcademy of Public Administration, Office of the President of Ukraine.
Vira Tsypuk—Ph.D. Student in Sociology, Head of Informational Analytical Depart-ment, Lviv Branch of Ukrainian Academy of Public Administration, Office ofthe President of Ukraine.
HUNGARY
Klára Czike—Ph.D. student, ELTE Institute of Sociology.Balázs Krémer—Ph.D., Budapest.Katalin Tausz—Ph.D., Head of Department of Social Work and Social Policy, ELTE.

viii
T H E I M PA C T O F D E C E N T R A L I Z AT I O N O F S O C I A L P O L I C Y

ix
List of Tables and Figures
TABLES
C H A P T E R 1
Table 1.1: Pros and Cons of Decentralization ...................................... 16
Table 1.2: Ethnic Composition in Hungary, Latvia and Ukraine ........ 27
Table 1.3: Level of Urbanization in Hungary, Latvia and Ukraine ....... 29
Table 1.4: Structure of Sub-national Governance ................................. 29
Table 1.5: Trend of GDP 1989–1999 .................................................. 34
Table 1.6: General Government ExpenditureSpent by Sub-national Bodies .............................................. 35
Table 1.7: Amount of ‘Own Source’ Revenues ..................................... 37
Table 1.8: Social Expenditure of Nyíregyháza CityRelated to Total Expenditure ................................................ 39
Table 1.9: Dates of Introduction of Acts Referring to Social Security,Unemployment and Family Benefits in Latvia, Ukraine,and Hungary and their Currently Valid Acts ....................... 42
Table 1.10: Number and Proportion of Pensioners ................................ 43
Table 1.11: Total Employment, 1989–1998 ........................................... 45
Table 1.12: Trend of Real Value of Wages 1989–1998 ........................... 45
Table 1.13: Trend of Unemploymentin Latvia, Ukraine and Hungary .......................................... 45
Table 1.14: Rate of Fertility in the Central Eastern-EuropeanCountries from 1980 to 1998 .............................................. 49
Table 1.15: Types of Family Allowance at the End of the 1990s ............ 50
Table 1.16: Factors Influencing Family Allowancesat the End of the 1990s ........................................................ 51
L I S T O F TA B L E S A N D F I G U R E S

x
T H E I M PA C T O F D E C E N T R A L I Z AT I O N O F S O C I A L P O L I C Y
Table 1.17: Features of Maternity Leave at the End of the 1990s ........... 52
Table 1.18: Main Features of Child-care Leaveat the End of the 1990s ........................................................ 53
Table 1.19: Features of Maternity Benefits at the End of the 1990s ....... 53
Table 1.20: Main Features of Family Benefits at the End of the 1990s .... 54
C H A P T E R 2
Table 2.1: Macroeconomic Indicators (1989–1999) ............................ 93
Table 2.2: Consumer Price Indices by Main Group of Expenditure ...... 94
Table 2.3: Public Expenditures as % of GDP, 1990–1999 .................. 95
Table 2.4: Rates of Economic Activity, 1990–1998 ............................. 96
Table 2.5: Number and Characteristics of the Unemployed ................ 97
Table 2.6: Changes in Poverty Rates ..................................................... 98
Table 2.7: Proportion of the Relatively Poor (under 50% of themean equivalent income) in Some Typical Groups .............. 98
Table 2.8: Number of Administrative Units as at 1 January 2000 ...... 102
Table 2.9: Non-profit Organizations Providing Welfare Services ....... 104
Table 2.10: Main Characteristic Features of Child Care Benefits:Child Care Allowance (GYES), Child Care Fee (GYED),Child Care Support (GYET) After 1998 ........................... 109
Table 2.11: Real Value of Some Family Benefits ................................... 110
Table 2.12: Effectiveness of Poverty Reduction .................................... 110
Table 2.13: Number of Registered Children at Risk by Reason ........... 111
Table 2.14: Revenues of Non-profit Organizationsby Source and Field, 1998 ................................................. 112
Table 2.15: Number of Recipients of the Most FrequentTypes of Benefit .................................................................. 119
Table 2.16: Some Statutory Minima and Some Yardsticksin Hungary, Monthly Sums ............................................... 123
Table 2.17: Social Provisions Related to the SubsistenceMinimum, 1991–1999 ...................................................... 123

xi
L I S T O F TA B L E S A N D F I G U R E S
C H A P T E R 3
Table 3.1: Social Risks Included in the StateSocial Insurance System ................................................... 156
Table 3.2: Expenditures of the Social Protection Sector ................... 161
Table 3.3: State Social Insurance Special Budgets and Services ........ 170
Table 3A.1: Resident Population by Nationality ................................. 173
Table 3A.2: Population of Latvia by Citizenship ................................ 174
Table 3A.3: Population Change Components .................................... 175
Table 3A.4: Distribution of Responsibilities betweenCentral Government and Local Governments ................. 176
Table 3A.5: Local Government Functions in Latvia ........................... 177
Table 3A.6: Competencies of Local Governments .............................. 178
Table 3A.7: Volume Indices of Gross Domestic Product .................... 182
Table 3A.8: Gross Domestic Product .................................................. 183
Table 3A.9: Rates of Economic Activity, Employmentand Job-seekers in November 1999 ................................. 184
Table 3A.10: Number of Unemployed Persons .................................... 185
Table 3A.11: Economically Active Population, Annual Average,by City and District ......................................................... 186
Table 3A.12: Level of Demographic Burden ......................................... 188
Table 3A.13: Life Expectancy by Age and Sex in 1999 ......................... 189
Table 3A.14: Recipients of Pensions and State Social Security Benefit ... 190
Table 3A.15: Distribution of Functions Between the State andLocal Governments in Social Assistance .......................... 191
Table 3A.16: State Social Benefits and Allowances ............................... 192
Table 3A.17: Average Size of State Social Benefits and Allowances ....... 193
Table 3A.18: Home Care ...................................................................... 194
Table 3A.19: Specialized Social Care Centers for Children,Aged People and Invalids,and Those Who Are Mentally Ill ..................................... 195
Table 3A.20: Orphanages and Local Government Children’s Homes .... 195

xii
T H E I M PA C T O F D E C E N T R A L I Z AT I O N O F S O C I A L P O L I C Y
C H A P T E R 4
Table 4.1: Basic Macroeconomic Indicators ..................................... 212
Table 4.2: Basic Demographic Indicators ......................................... 216
Table 4.3: Structure of Cash Income ofthe Ukrainian Population ................................................ 217
Table 4.4: Dynamics of Actual Cash Income of Population,December 1990–December 1999 .................................... 218
Table 4.5: Record of Housing Subsidy Allocation ............................ 227
Table 4.6: Disabled Population in Ukraine ...................................... 228
Table 4.7: Disabled and their Pension in Ukraine ............................ 229
Table 4.8: Network of Social Service Institutes for Pensionersand Single Persons Unable to Work ................................. 232
Table 4.9: Network of Nursing Homes in Ukraineas of 1 January 2000 ........................................................ 233
Table 4.10: Social Budget ................................................................... 243
Table 4.11: Ratio of Local Budget in the Revenues andExpenditures of the National Budget of Ukraine(Pension Fund excluded) ................................................. 244
Table 4.12: Priorities of Distribution ofLocal Budget Expenditures .............................................. 245
Table 4.13: Revenue Structure of Local Budgets of Ukraine .............. 247
Table 4A.1: Indicators of Maximum and High Pensions thatare Designated on the Basis of the Current Legislationof Ukraine, Indicators of Average Wages/Income,and the Margin of Low Income ....................................... 260
Table 4A.2: Financing of Social Protection and Social ProvisionPrograms from the Ukrainian Consolidated Budget ....... 267

xiii
FIGURES
C H A P T E R 1
Figure 1.1: Implementation of Social Policy ............................................ 6
Figure 1.2: State-funded Income and Expenditurein Nyíregyháza City 1993–1998 .......................................... 39
Figure 1.3: Pre-primary Enrolment Rate ................................................ 48
Figure 1.4: Family Allowance—Average Wage Ratio ............................. 51
C H A P T E R 2
Figure 2.1: Number of Employed People in Hungary ........................... 96
Figure 2.2: Role of the State in Local Government Financing ............. 107
Figure 2.3: Real Value of the Local Governments’ Revenuesand Expenditures, 1991–1999 ........................................... 108
Figure 2.4: Number of People Provided with Some Social Service ...... 115
Figure 2.5: Number of Residents in Long- and Short-termResidential Institutions by Maintainer ............................... 116
Figure 2.6: Changes in the Average Income, Minimum Wage, AverageOld-age Pension, Minimum Old-age Pension, SubsistenceMinimum, and Unemployment Benefit, 1990–1999 ........ 121
Figure 2.7: Composition of Beneficiaries of DifferentTypes of Benefits ................................................................ 122
C H A P T E R 3
Figure 3A.1: Trend in Gross Domestic Product ..................................... 181
C H A P T E R 4
Figure 4.1: Administrative Structure of Ukraine .................................. 208
Figure 4.2: Legislative and Executive Branches in Ukraine .................. 209
Figure 4.3: Structure of State Bodies in Charge of Social Policy .......... 236
L I S T O F TA B L E S A N D F I G U R E S

xiv
T H E I M PA C T O F D E C E N T R A L I Z AT I O N O F S O C I A L P O L I C Y

xv
Preface
“...Decentralization has quietly become a fashion of our time. It is being considered orattempted in an astonishing diversity of developing and transitional countries: by solventand insolvent regimes, by democracies (both mature and emergent) and autocracies, byregimes making the transition to democracy and by others seeking to avoid that transition,by regimes with various colonial inheritances and by those with none. It is beingattempted where civil society is strong, and where it is weak. It appeals to people of theleft, the center, and the right, and to groups which disagree with each other on a numberof other issues” (Manor, J. 1999).1
Consequently, decentralization is defined, interpreted and made a political issue inseveral—sometimes contradictory—ways. Sometimes it is considered a term, sometimesa concept, a process, a theory, a methodology, or a policy—even a trend. However theclassic words of A. de Toqueville have remained essential even nowadays: “Decentralizationhas not only an administrative value but also a civic dimension since it increases theopportunities for citizens to take an interest in public affairs; it makes them get accustomedto using freedom.” Thus, the real relevance of decentralized governance in the CEEcountries is not only that it may help to make public institutions more effective in meetingcitizens’ needs, but that it also creates the right conditions for civil society to learn howto be competent in the management of their own affairs. In this way decentralization isan integral part of the process of democratization of the former state socialist societies.
Endeavors towards decentralization have become a world-wide phenomenon. Apartfrom the movement towards decentralization in many countries throughout the world,it is a key concept in the most powerful international organizations such as the WorldBank, the European Union and the OECD. It is not, however, such a kind of conceptor practice where “one size fits all.” There is no well-tailored, pre-fabricated blueprintfor decentralization—much depends on the socio-cultural traditions, specific powerrelations, and political interests of the individual countries.
In the states of the former Soviet bloc the prospect of breaking down the heavilycentralized structures was created by the systemic changes. This present research projectattempted to understand and describe only one segment of this story, viz. welfare policy.Thus, in this paper decentralization will be defined and analyzed in the context of itsapplication or functioning in the domain of social policy.
1 J. Manor (1999) The Political Economy of Democratic Decentralization. Washington,D.C.: World Bank. p. 1.

xvi
T H E I M PA C T O F D E C E N T R A L I Z AT I O N O F S O C I A L P O L I C Y
We made an inventory on who are the main actors, what is decentralized in the socialsector (administrative, fiscal, political, service-delivery structures, and institutions), whereor to what level of governance decentralization is relevant, and how and by what meansis decentralization implemented in the social sector. The why factors, in other wordsthe external and internal reasons of the specific concepts, political arguments and practices,were only touched upon and not deeply analyzed.
The ultimate question of this research did not relate to decentralization as such: itwas, rather, a people-centered approach that was in the focus of our interest. After all,people generally do not think of their lives in terms of sectors, domains, types of governance,but of the whole of their own reality, their own well-being.
The book is organized into four major sections. Following the comparative analysisthe three national teams present the country case studies. Owing to the long process ofwriting and editing the book, some of the legal aspects may well have changed since theyear 2000.
A combined team of Hungarian, Latvian, and Ukrainian experts of social policy andpublic administration carried out this research project initiated in 2000 by the LocalGovernment and Public Service Reform Initiative of the Open Society Institute. Thefieldwork was carried out by local experts co-ordinated by the Local Government TrainingCenter in Latvia and the Lviv Branch of the Ukrainian Academy of Public Administration.
The team was led by Katalin Tausz and consisted of Klára Czike, Balázs Krémer(country co-ordinators), Ruta Kalnina, Dace Jansone, Dagmara Beitnere, Linda Ziverte(Latvia); Anatoliy Chemerys, Andriy Lipentsev, Oksana Muzychuk, Vira Tsypuk(Ukraine); and István Sziklai, Ferenc Petróczi, Judit Erdôs, Attila Vitál, Dóra Deme,Margit Kinyik (Hungary).
The authors and participants of the project wish to express appreciation to ViolettaZentai, Project Manager, and to Gábor Péteri, Research Director at LGI, who initiated,advised, and showed so much interest throughout the project. We owe special thanksto Dena Ringold of the World Bank for her valuable comments and suggestions. Ourappreciation is also extended to Judit Benke (LGI) for her support and understandingin the financial management of the project. We are grateful to Harvey H. Shenker forhis copyediting work.
There are many aspects to any project such as this in view of which, in addition tothanking people for their hospitality, we should like to acknowledge everybody, includingthe many local experts, who so willingly helped the team.
January 2002
Katalin Tausz, Project DirectorBudapest, Hungary

1
C H A P T E R 1
The Impact
of Decentralization
on Social Policy
in Hungary, Latvia
and Ukraine
Klára Cz ik e
■
Baláz s Kr émer
■
Kata l in Tau sz

2
T H E I M PA C T O F D E C E N T R A L I Z AT I O N O N S O C I A L P O L I C Y
3
Table of Contents
1. Introduction and Background ............................................................................ 51.1 Purpose and Objectives ............................................................................. 51.2 Methodology ............................................................................................. 8
2. Decentralization Notions, Viewpoints and Approaches ..................................... 92.1 Preliminary Considerations ....................................................................... 92.2 Panacea to Cure Crises ............................................................................ 112.3 Decentralization—Which is Good and Desirable ................................... 12
2.3.1 Economic Metaphors .................................................................. 122.3.2 Decentralization as a Way to Democratize the Welfare State ...... 14
3. Misuse of Decentralization ............................................................................... 16
4. Flowering of Decentralized Units in Public Life ............................................... 194.1 Questions ................................................................................................ 194.2 The Various Types of Decentralized Units
—or Public Functions Outside the Center ............................................. 204.2.1 De-concentration ........................................................................ 214.2.2 Corporation—Decentralization of Public Bodies ....................... 214.2.3 Local Government Decentralization: Devolution? ..................... 224.2.4 Private Welfare Systems by Government Fiat .............................. 224.2.5 Making the Welfare System Plural,
Privatization of Public Services, NGOs Gain Ground ............... 22
5. Statehood and Decentralization ........................................................................ 235.1 Structural Analysis of a State ................................................................... 235.2 The Birth of New States .......................................................................... 245.3 Reviving the History of Independent Statehood ..................................... 245.4 Skipping Missing Decades ...................................................................... 25
6. State Structures and Governance ...................................................................... 266.1 Democratic Cornerstones: Parliaments ................................................... 266.2 Local Governments ................................................................................. 286.3 Regions, Oblasts, Rayons, Counties—Tiers ............................................ 306.4 The Agents of Central Governments, ‘In the Field’ ................................ 30

4
T H E I M PA C T O F D E C E N T R A L I Z AT I O N O N S O C I A L P O L I C Y
7. Fiscal (De)Centralization and Social Welfare .................................................... 317.1 Heritage and General Constraints ........................................................... 317.2 National Fiscal Policies in the Sphere of Social Welfare:
Reduction and Centralization ................................................................. 337.3 A Tricky Scenario: Expenditure Assignment ........................................... 347.4 Markets in Local Business: Revenue Assignment .................................... 377.5 Intergovernmental Transfers and Granting Arrangements ....................... 387.6 Summing Up: Fiscal Decentralization of Social Protection .................... 40
8. Welfare Provisions ............................................................................................. 418.1 Social Insurance—the Foundation of the Social Protection System ........ 418.2 Family Support ........................................................................................ 478.3 Social Services .......................................................................................... 56
8.3.1 Historical Background ................................................................ 568.3.2 Political and Administrative Constraints .................................... 568.3.3 Common Characters of Social Care Profiles ............................... 578.3.4 Country Specific Features of Social Services ............................... 598.3.5 Financing Social Services ............................................................ 618.3.6 Professional Standards ................................................................ 638.3.7 Supervisory Mechanisms ............................................................ 63
8.4 Social Assistance ...................................................................................... 64
9. Conclusions and Policy Recommendations ...................................................... 719.1 Centralized and Decentralized Functions: Past and Present .................... 719.2 The Criteria of Evaluation ...................................................................... 739.3 Legal Regulations and the Reality ............................................................ 739.4 Governance ............................................................................................. 749.5 Resources and Capacities ......................................................................... 76
9.5.1 Financing .................................................................................... 769.5.2 Human Resources and Professional Standards ........................... 78
9.6 The System of Social Provisions .............................................................. 799.7 Supervisory and Controlling Mechanisms............................................... 81
Notes ....................................................................................................................... 84
Literature ................................................................................................................. 85
5
S C H O O L M A N A G E M E N T A N D F I N A N C E : A N O V E R V I E W
The Impact of Decentralization on
Social Policy in Hungary, Latvia and Ukraine
Klára Czike ■ Balázs Krémer ■ Katalin Tausz
1. INTRODUCTION AND BACKGROUND
1.1 Purpose and Objectives
In the former state socialist countries, social policy did not exist as an independentsector before the 1990s. The dismantling of the command economy and the centrallycontrolled structures of public administration and public institutions has been a criticalelement of the post-communist transition. The changing division of power among statebranches and administrative levels, as well as the appearance of market based and non-profit service providers, created a new setting for social policy in the 1990s.
The classical concept of the welfare state as constructed in the famous BeveridgeReport is based on the idea of a strong central state, a market economy, and politicaldemocracy.
In several countries (e.g. Hungary and Latvia) the responsibility for social assistanceand social services is delegated by law to local level administration. Other kinds of policies(such as housing, education, health and employment) also have implications for localsocial policy.
Occupational welfare appeared in different forms in the state socialist countries fromthose in Western industrial societies. In the CEE countries, state-owned companiesperformed several welfare functions (day-care centers for children, health services, housing,recreation, etc.), and they even administered social insurance benefits. Beginning in the1970s in many Western industrial societies, occupational welfare (such as private pensionschemes, company cars, etc.) was mainly offered to company management and “valuableemployees.” Private companies of the former socialist countries also adopted this typeof model. In the theory of social policy, these activities are considered to be forms ofwelfare policy with a bottom-up redistribution effect. In market economies, privatecompanies perform a special role in the making of welfare policy. They contribute to
6
T H E I M PA C T O F D E C E N T R A L I Z AT I O N O N S O C I A L P O L I C Y
the functioning of the welfare mix and in this way to the deconstruction of the traditionalwelfare state.
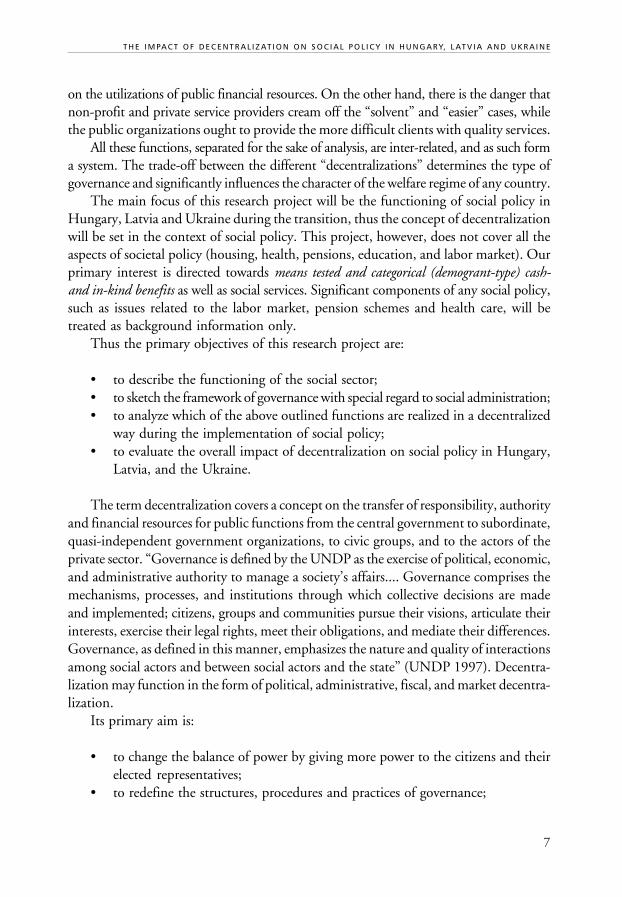
Fiscal welfare, carried out through tax policy, generally works in favor of the taxpayervia different tax credits, tax allowances, and tax exemptions (e.g. for children in Hungary).In this interpretation, fiscal welfare must be distinguished from the fiscal decentralizationof social services.
Figure 1.1Implementation of Social Policy
Implementation of Social Policy
Legislation Financing Service Legal ProfessionalProvision and Financial Control
Control
In the state socialist system all the above outlined functions were performed centrallyby the state though the informal sector had a very important “correction” function.Nowadays, as a result of the transition process all the possible actors participate, albeitto varying degrees, in the implementation of social policy. (The presence of several actors,such as local-self governments, the market sector, and the non-profit sector, i.e. thewelfare mix, may mean—in the narrowest sense of the word—decentralization.)
Legislation and legal and financial control can be exercised only by the central govern-ment or by the local government or its equivalent. Even so it is a relevant problem, es-pecially in the CEE countries, to consider the legislative power of the local self-governments.
Financial decentralization relates both to revenues and expenditures. It may mean aright to autonomous capacity building, fund raising, and allocation of resources supp-lementing the centrally guaranteed resources for social policy. In the neo-liberal conceptof social policy, however, the most important function of financial decentralization isto substitute the resources of the central budget.
In modern European systems all possible actors participate in providing services.The real differences lie behind the responsibility for financing the services. In otherwords, the differences in the social policy of the European countries are primarilydetermined by where the state marks the boundaries of public responsibility; in whichcases the responsibility is shifted on the market, on the non-profit sector, or on the family.
Professional control has a special significance in pluralistic welfare regimes. On onehand, in several cases the operation of the non-profit and for-profit organizations is based
7
on the utilizations of public financial resources. On the other hand, there is the danger thatnon-profit and private service providers cream off the “solvent” and “easier” cases, whilethe public organizations ought to provide the more difficult clients with quality services.
All these functions, separated for the sake of analysis, are inter-related, and as such forma system. The trade-off between the different “decentralizations” determines the type ofgovernance and significantly influences the character of the welfare regime of any country.
The main focus of this research project will be the functioning of social policy inHungary, Latvia and Ukraine during the transition, thus the concept of decentralizationwill be set in the context of social policy. This project, however, does not cover all theaspects of societal policy (housing, health, pensions, education, and labor market). Ourprimary interest is directed towards means tested and categorical (demogrant-type) cash-and in-kind benefits as well as social services. Significant components of any social policy,such as issues related to the labor market, pension schemes and health care, will betreated as background information only.
Thus the primary objectives of this research project are:
• to describe the functioning of the social sector;• to sketch the framework of governance with special regard to social administration;• to analyze which of the above outlined functions are realized in a decentralized
way during the implementation of social policy;• to evaluate the overall impact of decentralization on social policy in Hungary,
Latvia, and the Ukraine.
The term decentralization covers a concept on the transfer of responsibility, authorityand financial resources for public functions from the central government to subordinate,quasi-independent government organizations, to civic groups, and to the actors of theprivate sector. “Governance is defined by the UNDP as the exercise of political, economic,and administrative authority to manage a society’s affairs.... Governance comprises themechanisms, processes, and institutions through which collective decisions are madeand implemented; citizens, groups and communities pursue their visions, articulate theirinterests, exercise their legal rights, meet their obligations, and mediate their differences.Governance, as defined in this manner, emphasizes the nature and quality of interactionsamong social actors and between social actors and the state” (UNDP 1997). Decentra-lization may function in the form of political, administrative, fiscal, and market decentra-lization.
Its primary aim is:
• to change the balance of power by giving more power to the citizens and theirelected representatives;
• to redefine the structures, procedures and practices of governance;
T H E I M PA C T O F D E C E N T R A L I Z AT I O N O N S O C I A L P O L I C Y I N H U N G A R Y, L AT V I A A N D U K R A I N E

8
T H E I M PA C T O F D E C E N T R A L I Z AT I O N O N S O C I A L P O L I C Y
• to lay the basis of participatory social and economic development;• to increase democracy (grass-roots democracy);• to provide more relevant responses to locally expressed needs;• to promote innovative practices in public service delivery;• to increase the efficiency and effectiveness as well as the quality and flexibility
of public services;• to ensure the accountability and transparency of local governance.
One of the most important results of this research project would be the clarificationof the meaning and significance of decentralization within the specific CEE context.Because in most of these countries the basic statutory obligation for social service provisionsfalls on the local governments, this study focuses in particular on the role and functioningof local governments. We applied a complex approach in analyzing decentralization andsocial welfare, exploring the functioning of the traditional social protection system andtouching on—when necessary—the subject of occupational as well as fiscal welfare.This research was strongly committed to examining the legal, institutional, and socialaspects of decentralization in addition to its fiscal dimension.
As there has been virtually no research conducted on the process, dynamics, andimpact of decentralization of social security systems, this policy-oriented, comparativestudy is able to help in pinpointing various problems, and in providing the basis forpolicy recommendations to improve decentralized social service delivery and to identifynew areas of future research.
1.2 Methodology
This research project applied various quantitative and qualitative methods based ondifferent primary and secondary sources.
A concise synthesis and analysis of wide-ranging information on decentralization andsocial services in the three countries, based on a review of the literature, legislation, andsocial, economic and demographic indicators formed the starting point of this study. Thismade it possible to outline the institutional framework, financing mechanisms, and decision-making systems, as well as the accessibility, eligibility and entitlement criteria of socialservices and the preparation of the standardized data collection sheets. (See Annex 1.1.)
Quantitative analysis was applied to each level of public administration. Our projectcombines national-level analysis of each of the three countries with case studies from:
• each of the three capital cities;• one district in each of the capital cities;• one county in each country (two in Hungary);

9
• one regional center in each state (two in Hungary);• one small town in each state (two in Hungary);• one rural community in each state (two in Hungary).
The quantitative analysis outlines the main determinants and consequences of budgetallocations, administrative measures and processes, and characteristic features of therecipients. It illustrates how social policy and decentralization work “on paper”—in-national legislation, various local regulations, documents, and local statistical and financialdata—and it highlights some aspects of the implementation of policies.
Due to methodological and time limitations, the case studies could not be based onproper sampling procedures.
Our qualitative analysis is based on interviews conducted at each level of publicadministration in the three countries to provide an understanding of the empirical realityof decentralization. Using this methodology, information was obtained on the implemen-tation of central and local government policies, the evaluation of those policies by themain actors in municipalities, and local public policy-making. Qualitative methods wereused to evaluate institutional performance as well. The interviews were focused on questionsregarding the division of roles and responsibilities between state, regional, and localauthorities with respect to services, the loci of decision-making, incentive structures, andlevels of accountability.
In the course of the analysis, an attempt was made to identify the level of horizontalco-operation between municipalities, and vertical co-operation between central, regional,and local governments. Moreover, the analysis endeavored to capture the ways in whichvarious professionals understand the goals and operations of their social service systemsand how the various systems work. It also investigated incentives and other factors thatgenerate certain policy decisions and behavior. Several quotations from the interviewswill be used as illustrative anecdotes to underline the arguments of the analysis.
The research was done in the summer autumn of 2000 and covers the developmentsof the late 1990s.
2. DECENTRALIZATION NOTIONS, VIEWPOINTS AND APPROACHES
2.1 Preliminary Considerations
Decentralization is similar to other notions that have “sneaked” from one area of knowledgeto political programs inasmuch as it resists exact definition. A UNDP program sets theconceptual framework of decentralization based on the ideas of Cheema, Rondinelli andNellis as follows: “Decentralization can be defined as the transfer of responsibility for
T H E I M PA C T O F D E C E N T R A L I Z AT I O N O N S O C I A L P O L I C Y I N H U N G A R Y, L AT V I A A N D U K R A I N E
10
T H E I M PA C T O F D E C E N T R A L I Z AT I O N O N S O C I A L P O L I C Y
planning, management and resource raising and allocation from the central governmentand its agencies to: (a) field units of central government ministries or agencies, (b)subordinate units or levels of government, (c) semi-autonomous public authorities orcorporations, (d) area-wide, regional or functional authorities, or (e) non-governmental,private, or voluntary organizations’” (http://magnet.undp.org/Docs/dec/monograph/Chapter1.htm).
The above-quoted UNDP document highlights a very important aspect of thedefinition of the term when stating that the notion of decentralization comes from amental model containing a center and a periphery. “This is only a model just as a pyramidicsocial structure is only a mental model. When we view a society as a whole system, wesee not vertical layers (as in a pyramid) or concentric layers (as in the centric model) butrather a horizontal environment with autonomous yet interrelated actors, sectors, andgeographic areas. In designing decentralization policies and programs it is necessary tobe cognizant of the mental model one is using and if necessary to adapt or completelychange the model to better fit reality.”
As previously stated, our leading point is the analysis of the social sector of the threecountries concerned and it is a secondary point to reveal how the methods of governanceinfluence the functioning of social policy. In this interpretation decentralization is rathera method of implementing policies than an end to be achieved. (This kind of approach isall the more necessary since it is hardly possible to make a clear distinction between thedifferent “effects” impacting on the functioning of the welfare system. The role of themacroeconomic decline, the changing power relations, and the transformation of socialstratification cannot be clearly separated from the impact of the changing administrativestructures.) Our analyses will go beyond quantitative questions like: How many tasks?How much money? How much political power and administrative capacity? the decent-ralized agents of social policy have. We intend to describe the welfare systems themselves(which stand on various levels of decentralization) as interdependent systems that bearspecific traits. Therefore, we will indicate the interplay of the aims and decentralizationof welfare systems and of the circumstances under which they operate.
In our understanding of the term, decentralization refers to a process: it implies transitionfrom a less decentralized (more centralized) state to a more decentralized (less centralized) one.
In this research project, a basic question to be answered is: What proportion of thesocial resources is under the control of the agents of decentralization and what powersdo they have? In this respect decentralization is an indicator of power relations between thecenter and the local agents. “No attention has been paid to power as a critical feature ofsocial relations. Institutions may appear to act in the common good, but can actually shapeand reproduce relations of unequal power and authority. Hence particular groups of womenor poorer people may be marginalized” (M. Leach, R. Means and I. Scoones 1998).
As is customary, we will explain the meaning of decentralization in the context of aspecific country. “Since national processes of decentralization take place in different policy

11
environments, they are grounded in divergent political traditions, and imply the reformof very different administrative systems, the term referred to generically as ‘decentralization’does not necessarily carry the same political connotations in the three countries studied.This diversity limits the scope for generalization. One must be careful not to assume,for example, that the relationship between central and local government institutionshas a similar dynamic in different contexts. On the other hand, the diversity of the casesalso enriches the comparison. The commonalties that emerge are all the more suggestivebecause of the diversity of the countries” (Jean Bossuyt and Jeremy Gould 2000).
2.2 Panacea to Cure Crises
“Today’s local administrators have a vital role in maintaining an active social fabric whichwill ensure a balance between the dangers of excessive central government and the irresistibleatomization of individuals. Local governments that have real power can more effectivelyaddress local interests as well as exercise a check on operations at higher levels of authority”(Global2 1996).
Just as in the case of many other reform strategies, decentralization emerged as aresponse to the so-called crises of the developed world, the welfare states. It is thereforeworthwhile to briefly examine the crisis circumstances that have lent such an importanceto the process of decentralization.
“There seem to be as many diagnoses of the welfare state crisis as there are experts.Most, nonetheless, can be conveniently subsumed under three main headings. There is,firstly, the ‘market-distortion’ view, which argues that the welfare state stifles the marketand erodes incentives to work, save, and invest. A second popular diagnosis focuses onthe cataclysmic long-term effects of population ageing.” And a third group of argumentsfocuses on the consequences of the new global economy, which mercilessly punishesprofligate governments and uncompetitive economies (Esping-Andersen p. 2). AfterEsping-Andersen “Welfare regimes must be identified much more systematically in termsof the inter-causal triad of state, market, and family” (p. 35). In this understanding thecrisis of the welfare state can be related to state failure, market failure, and family failure.In this respect decentralization is an answer to one aspect of state failure: the failure of gover-nance. “The failures of the centralized forms of state intervention and the realizationthat de-concentration had its limits, and the renewal of free-market theories embodiedby structural adjustment and macro-economic stabilization policies, are all reasons foradapting public service in the direction of true decentralization” (http://www.ciesin.org/decentralizaton/English/General/history_fao.html).
During the 1990s, the post-communist countries underwent crises that are some-times attributed to similar causes, but were much graver. The crises inherited from thecommunist system—coupled with the consequences of economic recession due to
T H E I M PA C T O F D E C E N T R A L I Z AT I O N O N S O C I A L P O L I C Y I N H U N G A R Y, L AT V I A A N D U K R A I N E
12
T H E I M PA C T O F D E C E N T R A L I Z AT I O N O N S O C I A L P O L I C Y
transition from a command economy to a market economy, and the collapse of theEastern Bloc—brought about a much deeper recession than that of the Western countriesbecause the base was lower.
Unemployment affected broader sections of society than in the West. What is more,it came as a totally new phenomenon. The countries concerned lacked the politicaltraditions and agencies to handle the crisis.
Events followed one another at breakneck speed: while these countries were installingWestern-type schemes of the welfare state, these very schemes developed crisis symptomsand therefore had to be reformed. Even under ideal conditions, such processes couldnot have followed reasonable scenarios.
The outcome of those reforms was unpredictable as well because these countrieshad no experience in handling certain social and political risks (they did not know howto involve the public in certain decisions nor how to channel political dialogue); theagencies of public administration and social schemes were underdeveloped; certain fieldsof expertise (for instance, social work, welfare economics), professional forums, andpolitical and professional norms of behavior were missing.
The differences are not just quantitative. Social policy was in a fundamental crisisin nearly all of the post-communist countries. As a rule, the political programs of transition(from a single party system to a multi-party system) failed to address the real problemsof society. It is more or less fair to say that we have not found any transition country wherea societal policy program and a long-term institutional vision existed or, if one existed,was consistent. The social changes tended to be spontaneous consequences of the politicaland economic changes. Decentralization entered public thought as a panacea for theabove social and political problems as well as for general development.
2.3 Decentralization—Which is Good and Desirable
The literature refers to decentralization in a similar way to other ideas spawned by reforms—with a positive bias. It is described as a goal to be attained by way of reform. Policy papersgenerally consider decentralization in this respect as a counterpoint to globalization, an in-tegral part of democratization, a logical application of the core characteristics of good gover-nance (accountability, transparency, rule of law, responsiveness) and a new form of communi-cation and information flow between geographical areas, societal actors, and social sectors.
2.3.1 Economic Metaphors
As indicated above, most of the decentralization ideals were created after the publicpolicy budgets of welfare states plunged into crises. When the equilibrium of revenues
13
and expenses, and of supply and demand is upset, it seems to be quite reasonable totransfer the logic and techniques of the market into state mechanisms, the domain ofsocial provision and other public services.
If we compare the state to a huge combine, it is justifiable to examine the operationand successful organizational reforms of prosperous multinational companies (e.g. thecar manufacturers General Motors and Ford, which have always been in the public eye).There are several reasons why their internal reforms can be considered as decentralization.To start with: they involved de-concentration, in which the general functions of the centerwere devolved on regional or national sub-centers. Occasionally the “profit centers” ofcertain lines of products or the centers of functional divisions (e.g. sales, development,and the manufacture of sub-assemblies) were de-concentrated.
Even more intriguing is that process of decentralization in which a wide array of sub-contractors were involved in certain phases of production and sales. We would emphasizetwo aspects of that process. The centers could define their requirements—componentquality, time limits and norms that subcontractors must fulfill—with such precisionthat the continuity and efficiency of manufacturing could be ensured without bureaucraticcontrols, solely by acting as an exacting purchaser. Employment of those techniquesachieved more than maintaining former performance levels, they brought about lessexpensive and more efficient outputs. What is more, the demand generated by decentra-lization called into life a “supply industry” consisting of competing small- and medium-sized companies.
Given that it improves the efficiency of car-making if the center of a combine isrelieved of some of the phases of work, and that parts can be bought from subcontractors,then that principle can also be applied to functions of the state. In principle the statecan also purchase from autonomous public and private schemes the “parts and sub-assemblies” which, when co-ordinated, can add up to state and governmental functions.
Faced with the task of efficiently managing crises, economists inevitably recallSchumpeter’s theory. In a nutshell: crises emerge when former sources and technologicaland institutional capabilities are depleted. Successful management of a crisis is most likelyif new, innovative sources and techniques appear that have a good chance of replacing theold, depleted forms. If the existing large schemes cannot adequately respond to the crisesof social provision, it would be of benefit to permit small, local, non-governmental organiza-tions to experiment with more efficient techniques of social provision. In such a hypothesisthe state is not the above-mentioned “exacting purchaser,” nor are the decentralized unitssubordinated subcontractors. Instead, the state should be seen partly as the “owner ofventure capital” that sponsors innovation and partly as a partner in charge of co-ordination,a partner who takes the responsibility of organizing the co-operation of several smallinnovators, and of handling competition and conflicts. The state as described here isquite similar to that state which strives to influence the structure of the economy byissuing regulations, granting support to, and/or sponsoring, individual projects.
T H E I M PA C T O F D E C E N T R A L I Z AT I O N O N S O C I A L P O L I C Y I N H U N G A R Y, L AT V I A A N D U K R A I N E
14
T H E I M PA C T O F D E C E N T R A L I Z AT I O N O N S O C I A L P O L I C Y
For the decades of socialist rule the state was the scene of anything but competition.In fact, the state considered that its principal duty was to compensate with non-market-based tools for the damage and dysfunction caused by market competition. Many ofthe observers interpreted the deficit of the central budget and of the funds at the disposalof social schemes as a problem that was due to inefficient use of the money available.Supposing competition to be the engine of efficiency, efficiency can be improved byspreading it as widely as possible. In this interpretation, decentralization, especially theprivatization of public services, mainly refers to the process in which competing actorsappear on the stage of social policy. In this pattern the state is responsible for organizingthe competition, inviting and appraising bids, and acting as the contracting party thatrepresents the purchaser. In addition, the state (usually represented by one of its institutions)takes part in propagating the principles of competition in the sphere of public servicesin the following roles: market regulator, protector of consumer interests, guardian ofquality assurance, regulator of prices, guardian of the fairness of competition. It also ismeant to prevent any abuse of the dominant market position.
2.3.2 Decentralization as a Way to Democratize the Welfare State
Decentralization is an expression of the desire to make social provisions more humane.As opposed to the former “alienated” and bureaucratic social policy procedures, it seeksrelations that emphasize direct human contacts and face-to-face communication.
Direct human contacts and communication are essential parts of every transaction,be it in the field of business or public service. If the task is to strengthen a welfare systemin which an increased role is to be played by direct human communication and theservice to be ensured for customers, then that type of decentralization is necessary inwhich person-to-person relations do matter. A welfare system that is humane, standsclose to the community and the family, is open and sensitive to personal problems, andcan flexibly adjust to various situations can be nothing other than decentralized.
One of the driving forces of decentralization is to get closer to the consumers, citizensand communities by enforcing the principle of subsidiarity. The principle of servicecan be transcended if we attempt to reduce the asymmetry of the relationship betweenprovider and consumer by some kind of “sharing.” By bringing vital decisions closer tothose affected and assuming shared responsibility for the consequences and risks of thejointly agreed decisions, these principles chart out the framework for decentralizationin which social programs focus on well-defined communities. In that process the stateis a co-ordinator that partly or entirely delegates its sovereignty to the public socialservices for the benefit of target groups or communities. In this interpretation subsidiarityis conducive to a “needs sensitive” social protection system.
All sorts of attempts, initiated by the so-called “new right,” to reform the welfare state,i.e. to reduce the role of the state in shaping welfare policies, can, however, also be in-

15
terpreted within the theoretical framework of decentralization. A revealing example ishow an OECD report on public management developments characterizes the conditionsaffecting good governance in Hungary: “A fundamental burden on the Hungarian economyis the fact that, besides the inherited external debt, a substantial volume of internal statedebt has accumulated over the past years. Measures are being taken to improve the balanceof public finances and to eliminate the causes of its decline. The planned reduction ofthe central budget deficit necessitates a fundamental rethink of the roles and respons-ibilities of the state, and development of a public sector in line with the capacities of theHungarian economy. Reduction of the role and responsibilities of the state necessitatesrationalization of the activities, responsibilities and institutions that were formerly financedby the state, and the transfer of certain tasks currently performed by the state to non-governmental organizations and/or the private sector” (OECD 1998). Then the principleof subsidiarity in this interpretation may express a strong commitment to dismantle thewelfare responsibilities of the central state and delegate them to the various local agents.
The basic tenet of the works that criticize the alienation of representative democracyis that ordinary citizens get lost in the bureaucratic maze of the modern state. In thisinterpretation the aim of decentralization is to achieve that situation in which publicaffairs should be handled by smaller organizations that are transparent and on whichcitizens can exert an influence. These principles are closely related both to the principleof “small is beautiful” and those theses of subsidiarity that state that decisions shouldbe brought as close to the people as possible and should be made in the smallest possibleunits of public administration.
Thus decentralization may be interpreted as evolving the system of multiple checksand balances on the exercise of political power as the decentralized units may possess thesway to counterpoise the dominant power of the central state.
In the former state socialist countries there was no way for direct participation, evenin local political life, in the political decision-making processes. To make the democraticpolitical system work, people had to “learn” certain attitudes, skills and “knowledge” tomake public life democratic. In this case decentralization can be considered to be theschool for democracy.
Others criticize representative democracy for they think that modern political partiescan no longer stand for the interests of the whole of society. Partisan rivalry and parliamentonly express the infighting within the political elite. Multi-party democracies have along history of seeking ways of articulating in the political arena societal interests thatparties fail to stand for adequately. Examples include the upper houses in bicameralparliaments, corporative patterns of the German type (which traditionally means theparticipation in extra-parliamentary political decision-making of the churches and tradeunions), and the lobby system. Nowadays, in all three patterns, emphasis is laid ondecentralization in the form of the involvement of regional and settlement-level delegatesas well as non-governmental organizations.
T H E I M PA C T O F D E C E N T R A L I Z AT I O N O N S O C I A L P O L I C Y I N H U N G A R Y, L AT V I A A N D U K R A I N E

16
T H E I M PA C T O F D E C E N T R A L I Z AT I O N O N S O C I A L P O L I C Y
As a rule, the more balanced division of power involves bargains and interest recon-ciliation which, in turn, spawn conflicts. This does not necessarily lead—in the shortrun—to higher efficiency; on the contrary, to use the private-sector analogy again,when multinational companies diversify and decentralize their operation to gain higherefficiency, such steps rarely diminish their power and influence and they rarely strengthenthose of their partners. In fact the opposite is true. However, in the long term, only wellfunctioning counter-balancing actors can make the democratic system sustainable.
It can be considered to be one of the most important successes and merits of decent-ralization that there were no aggressive, threatening social explosions in the given transitionalcountries in the past decade. Despite the significant reduction of welfare expenditure,the dramatically decreasing standard of living and the growing inequalities as well asincreasing poverty, the new democracies survived the first (and—for the majority ofthe population—unexpected) crisis. This might partly be due to the fact that the localgovernments were able to handle the most acute social problems and keep them localized.Notwithstanding the frequent failures, the institutionalization of the channels of localdemocracy and the direct or indirect initiation of a significant number of people (electedrepresentatives, members of the administration, experts, etc.) into the decision-makingprocesses, the first, stronger or weaker forms of democratic participation and collectivecrisis management were created.
3. MISUSE OF DECENTRALIZATION
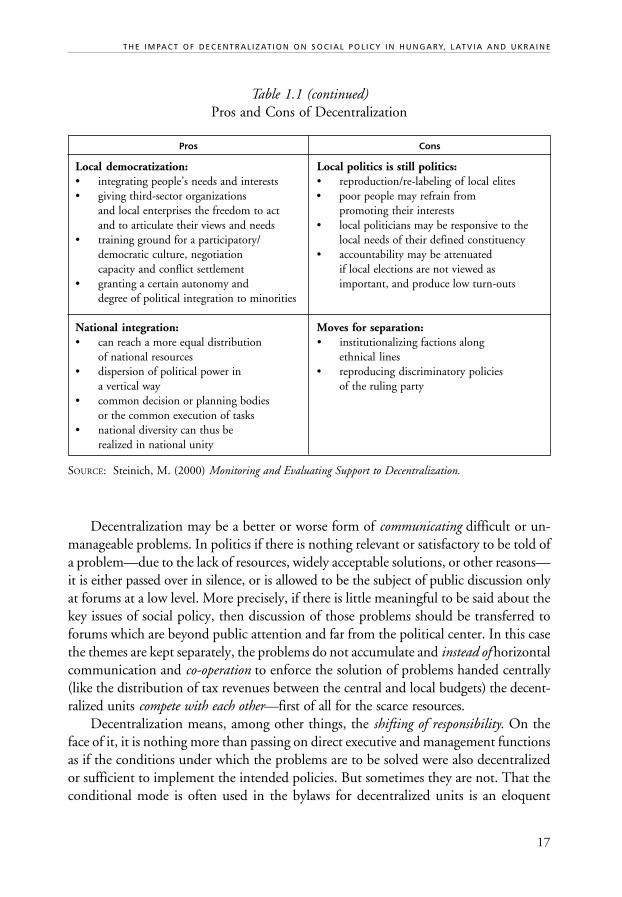
The following table demonstrates the most frequently cited advantages of decentraliza-tion, together with some skeptical considerations as well (M. Steinich 2000).
Table 1.1Pros and Cons of Decentralization
Pros Cons
Better service delivery: Dangers for service delivery:• moral adequate to local needs • decentralization of corruption• more flexible • untamed spending• more innovative • rolling-back of many of the• cheaper economic, and particularly social,• good for mobilizing the comparative functions of the state
advantages of local enterprises • local cadre will not be independentand the local non-profit sector enough and motivated enough to
take responsibility for riskyundertakings
17
Table 1.1 (continued)Pros and Cons of Decentralization
Pros Cons
Local democratization: Local politics is still politics:• integrating people’s needs and interests • reproduction/re-labeling of local elites• giving third-sector organizations • poor people may refrain from
and local enterprises the freedom to act promoting their interestsand to articulate their views and needs • local politicians may be responsive to the
• training ground for a participatory/ local needs of their defined constituencydemocratic culture, negotiation • accountability may be attenuatedcapacity and conflict settlement if local elections are not viewed as
• granting a certain autonomy and important, and produce low turn-outsdegree of political integration to minorities
National integration: Moves for separation:• can reach a more equal distribution • institutionalizing factions along
of national resources ethnical lines• dispersion of political power in • reproducing discriminatory policies
a vertical way of the ruling party• common decision or planning bodies
or the common execution of tasks• national diversity can thus be
realized in national unity
SOURCE: Steinich, M. (2000) Monitoring and Evaluating Support to Decentralization.
Decentralization may be a better or worse form of communicating difficult or un-manageable problems. In politics if there is nothing relevant or satisfactory to be told ofa problem—due to the lack of resources, widely acceptable solutions, or other reasons—it is either passed over in silence, or is allowed to be the subject of public discussion onlyat forums at a low level. More precisely, if there is little meaningful to be said about thekey issues of social policy, then discussion of those problems should be transferred toforums which are beyond public attention and far from the political center. In this casethe themes are kept separately, the problems do not accumulate and instead of horizontalcommunication and co-operation to enforce the solution of problems handed centrally(like the distribution of tax revenues between the central and local budgets) the decent-ralized units compete with each other—first of all for the scarce resources.
Decentralization means, among other things, the shifting of responsibility. On theface of it, it is nothing more than passing on direct executive and management functionsas if the conditions under which the problems are to be solved were also decentralizedor sufficient to implement the intended policies. But sometimes they are not. That theconditional mode is often used in the bylaws for decentralized units is an eloquent
T H E I M PA C T O F D E C E N T R A L I Z AT I O N O N S O C I A L P O L I C Y I N H U N G A R Y, L AT V I A A N D U K R A I N E
18
T H E I M PA C T O F D E C E N T R A L I Z AT I O N O N S O C I A L P O L I C Y
illustration of that point: [if certain conditions are met, then] the decentralized unit“may grant” certain benefits, “may establish” certain entitlements or “may require” thatcertain conditions be met—as is the case, for example, with the Hungarian Social Law.The conditions and capacities under which the decentralized functions have to be dis-charged are often lacking—they have to be ensured by the decentralized units themselves.
Decentralized solutions can be successful if the increase in the funds granted to thelocal government authorities and non-governmental organizations enables them to fulfillthe growing tasks. In the first years of transition, however, the statistics showed that atmacro-level the number of people dependent on social care was growing and net publicspending on welfare was decreasing. It has yet to be seen whether it is possible to com-pensate at macro-level for the decrease in central funds by mobilizing additional localresources and establishing partnership relations with players in the market.
When there is a decline in resources, either the standard of social provisions has tobe lowered or the number of recipients has to be reduced, or both. Such dangers aredoubly menacing in those post-communist countries where the political, institutional,and professional norms that could act as controlling mechanisms for the quality andimpact of social provisions are missing. To employ again the analogy of the manufactureof cars it certainly does make a difference if a company that intends to cut productioncosts replaces the electrically-operated window opener with a mechanical one, or replacesa sophisticated brake system with an inferior one. In the post-communist countries,which lack long-standing traditions, the “welfare motorcar” often has very poor brakes.
It is quite a widespread phenomenon in the post-communist countries to “copy” andinstitutionalize those informal household management techniques or survival strategies, whichmake it possible for masses of households to adjust themselves to privation and poverty.(Due to methodological difficulties it is almost natural that there is no macro-data onthe extent and weight within the budget of the institutions run by local self-governmentsof these practices.) If there is a lack of financial resources, households have to makedecisions whether to pay the electricity bill, or whether to buy their child a pair of newshoes. Even statutory obligations are ignored if there is no cash, and life must go on.For instance, in 1998 only 8% of the Hungarian municipalities provided all the basicsocial services provided for in the Social Act. This type of institutionalized deviant behavior,while by no means can it be a legitimate method at the national level, may be locallyaccepted as a way of managing situations characterized by the lack of resources.
When households are short of cash they tend to revive the “oikos”; in other words, themethods of the traditional peasant societies. People try to repair household utensils that areout of order, from two worn-out dresses they stitch together a third “new” one. Collectiveknowledge and skills of this kind are mobilized when parents fix the shaky furniturein their children’s school, or children take their own toilet paper to the kindergarten.A bizarre form of this practice in the Ukraine is the covering of wages and even pensionsby goods instead of money. In other words, a return to the barter system.

19
As a matter of fact, smaller village communities—on account of the survival of thetraditional value system of peasant societies—even encourage informal solutions and publicwork in order to compensate for the lack of money or available services. Furthermore,in the traditional peasant value system the use of money is the last possible solution toa problem, let it be the building of a house for one of the villagers or harvesting the grapes.
Should the quality of social provision, the principle of equal access to care and theequity of distribution, not be present in the public discourse, when the welfare prog-rams are not systematically and regularly evaluated as against the realization of theseprinciples, and local actors are tempted to give preference to the interests of the middle-class voters, there is the danger that certain people are discriminated against by beingexcluded from certain types of social provisions and the benefits are “smuggled” from thetarget groups to other, preferred groups. In this way the interests of the vulnerablegroups are subordinated to those of the ruling elite.
There are unintended consequences of decentralization such as the failure to reduceterritorial differences or, in other words, the failure to accomplish territorial justice becauseof the lack of adequate policies and resources. Regional- and settlement-level economicand societal differences are on the increase in the CEE countries. The danger of povertyand unemployment correlates with the place of residence (town or village, rich or poorregion). In Hungary and Latvia there are attempts to reduce these inequalities by imple-menting quite sophisticated equalizing mechanisms. These mechanisms, however, havenot as yet provided the appropriate solution for the problem of horizontal inequalities sincethe compensation for the disadvantages is unsatisfactory. The compensatory mechanismsmay even overrule other principles and values—including those that should be assertedby the decentralizing policies themselves. Such mechanisms can strengthen patron-clientrelationships in which the generosity of the central administration compensates for localdifficulties. The latter danger needs to be underlined in the case of the post-communistcountries. Where there is competition for compensatory funds (which are meant to evenout differences), the “plan-bargaining” deals (including blackmail) of the communistregime survive. Moreover, the former patron-client relationships are reintroduced inpolitical life.
4. FLOWERING OF DECENTRALIZED UNITS IN PUBLIC LIFE
4.1 Questions
However ideological and contradictory decentralization may be, especially in the Centraland Eastern European context, it is possible to speak of it as a global and historical processand an empirical fact in the following limited senses:
T H E I M PA C T O F D E C E N T R A L I Z AT I O N O N S O C I A L P O L I C Y I N H U N G A R Y, L AT V I A A N D U K R A I N E
20
T H E I M PA C T O F D E C E N T R A L I Z AT I O N O N S O C I A L P O L I C Y
• the number of organizations that discharge public functions of the state has beengrowing and their structure is becoming increasingly differentiated,
• the legal autonomy and self-determination of public institutions (including privateorganizations that fulfill public functions) other than the central agencies of thestate (parliament, government and the courts) have become stronger than ever before,
• the decentralized units that lie outside the central agencies of the state haveaccess to additional funds,
• the influence of these decentralized units on certain societal and political issues(including issues of social policy) is stronger than ever.
If we suppose that during the past decade in the three countries under survey thehistorical processes were the same as those taking place globally, it is justifiable to putforth the following questions:
• What public personalities play a role in social policy?• What kind of legal autonomy and competence do those public personalities
have?• What is the size and composition of the funds they have at their disposal?• What role do decentralized units play in social policy and what influence do
they exert?
These questions do not cover every aspect of statehood and state functions. Theyfocus on issues that are related to the “decentralization” of the political decision-makingand executive branches.
In addition to the empirical questions that focus on the characteristics of thedecentralized units, we also intend to examine those questions that refer to the interplaybetween state agencies and the features and causes of the distribution of functions,competence, and responsibility.
4.2 The Various Types of Decentralized Units—or Public Functions Outside the Center
The decentralization of state functions supposes—by definition—an arrangement ofstate functions that is “centralized” per se, in which decision competence, and the toolsof implementation and responsibilities are concentrated in a power center. With thecountries of Central and Eastern Europe, it is customary to use—by way of example—the communist state structure before the transition of the CEE countries to the multi-party system. It might be questioned whether or not it is appropriate to use them asexamples, yet such simplification seems to be acceptable as a starting point. Bearing

21
that in mind, examination of the process of decentralization means examining the processof dismantling the totally centralized state.
Administrative decentralization may have three major forms: de-concentration,delegation, and devolution. In the following sections of this chapter we will focus onthe forms of decentralization that are the most relevant in relation to social policy in thepost-communist countries.
4.2.1 De-concentration
In our interpretation, de-concentration—the historical predecessor of devolution—is theweakest form of decentralization. It is an institutional transformation in which bureau-cratically subordinated government agencies assume partially independent functions andcompetence (as for instance the right to manage assets independently and dispose of separatebudgetary funds). De-concentration of resources is not equivalent with their political de-volution, with the dismantling of the state center. Instead, it is similar to the organizationaltransformation in industry in which “combines” and “plants” are turned into “holdings”and into the “independent subsidiaries” and “profit centers” of a company group. “In casesof de-concentration, resources such as civil service positions or budgetary funds are re-allocated from central government to a lower administrative unit (e.g. a district prefecture).The decision-making authority remains with the central government and local staff answerto their upstream superiors. When authority devolves down to a lower level, decisionsabout the use of the resources are made locally, and administrative staff tend to be account-able to the local political leadership” (Jean Bossuyt and Jeremy Gould 2000, p. 2). Oftende-concentration occurs simultaneously with the “regionalization” of central management,as for instance with the establishment of “prefecture systems,” or sectoral inspectorates.The decentralization of public administration in the Ukraine, which is taking placeunder close presidential control and bureaucratic supervision, can be described as de-concentration. Similarly, the “decentralization” of the social insurance system and thelabor market organizations in Latvia and Hungary is in effect de-concentration.
4.2.2 Corporation—Decentralization of Public Bodies
It is possible to delegate state functions into public bodies where members are notappointed, nominated or elected exclusively (or not at all) by governmental agencies(or parliament or the political parties). As commissioned by law, these public bodiesdispose of public monies and the instruments of implementing public functions. Althoughthese organizations are not wholly controlled by the central government, they areaccountable to it. In the sphere of social provision, “tripartite” corporative public bodies
T H E I M PA C T O F D E C E N T R A L I Z AT I O N O N S O C I A L P O L I C Y I N H U N G A R Y, L AT V I A A N D U K R A I N E
22
T H E I M PA C T O F D E C E N T R A L I Z AT I O N O N S O C I A L P O L I C Y
can be found in the field of social insurance and employment policy (labor market).Examples of similar cases of the decentralization of public bodies can be seen in the artsand scientific life (“Academies”). Similar public bodies often discharge various trainingand accreditation functions. A few years ago, for instance, the body managing the Hun-garian social insurance system was of a corporative, tripartite type. Even today the county-level employment councils—which are organized along corporative lines—possess strongpowers (in deciding how to use the active tools of employment policy).
4.2.3 Local Government Decentralization: Devolution?
The most common definition of decentralization refers to the transfer of central govern-ment functions (decision-making, finance, and management) to the local governmentauthorities of localities and regions. Although local municipalities elected locally (or ona regional basis) can be found almost everywhere, their functions are occasionally confinedto politically representing the area concerned. The most important criterion of localgovernment decentralization is not the election of mayors and local municipal assemblies,but rather the transfer of responsibility for providing services, the raising of their ownrevenues, and the making of their own investment decisions. As far as the welfare systemis concerned, decentralization in the form of local authorities may affect every aspect ofpublic services (health service, housing, education, and welfare institutions) and the varioussocial assistance programs.
4.2.4 Private Welfare Systems by Government Fiat
A peculiar form of decentralization is when the government may oblige private organiza-tions to operate welfare services, and citizens may become clients of private organizationsby government fiat. An example of the first category is when employers are obliged todischarge certain welfare functions (to grant sick leave, to provide mandatory healthscreening, to offer preventive medical care, etc.). As for the second category, considerthe legal obligation of citizens to seek social insurance (pension, health or accident care)at private institutions. The Hungarian pension reform involves such an obligation.
4.2.5 Making the Welfare System Plural,Privatization of Public Services, NGOs Gain Ground
The fact that private organizations may also operate (either on a profit or a non-profitbasis) in areas that used to be set aside for public institutions cannot in itself be regardedas decentralization. (Instead, this should be considered as the introduction of market

23
principles to new areas.) The entry of private organizations into traditionally state-controlledpublic services can be considered decentralization if that activity is carried out in the formof regulated relations with a government agency. Such a relationship may include citizens“contracting out,” in which a private organization assumes government functions, and/or the regular state financing of such activity. Private (i.e. non-state) organizations may bein contractual relations with the state at any level of public administration, and they assumefunctions that transcend those of the local authorities. In Latvia, the only recognitionthat a function discharged by an NGO is “public” is tax allowances, but the state does notpurchase social services from them. In Hungary the non state-owned residential welfareinstitutions are eligible to the same per capita normative state subsidy as the state-ownedones. In addition, the government finances the discharge of various welfare functions byprivate organizations in the form of contractual relations. “Funding of service-deliveryNGOs in isolation from local government may not promote dialog, but rather competitionand even confrontation between local authorities and civic groups. The challenge is tosupport civic actions at local level while ensuring that their autonomous activities arelinked, to the greatest possible extent, with broader development processes and institu-tional dynamics in a given territory” (Jean Bossuyt and Jeremy Gould 2000, p. 10).
5. STATEHOOD AND DECENTRALIZATION
5.1 Structural Analysis of a State
The above analysis surveyed the components of the decentralization of social policy. But,as was mentioned above, decentralization is a process rather than a static complex. Theprocedure we have applied so far is similar to an analyst trying to study the characteristicsof a house just by looking at its windows, roof structure, beams, wall-plaster, and so on.But that procedure can be misleading. Just by examining smaller or bigger componentsof the house, or by noting that users have an increasing say in deciding the layout andthe internal arrangement of kitchens, we have not turned ourselves into experts who canissue statements about the growing importance of the component parts in house-building.Just by analyzing the bricks, beams, windows and wall-plaster, the analyst will neverunderstand, say, why the walls of the houses overlooking the canals in Amsterdam leanoutwards at the upper levels.
The analyst can only understand the functions of the kitchens, roofs and beams ifthey understand the operation of the house as a whole, the living conditions of the residents,the conditions of construction, and the origin of the traditions honored there. In thesame way, the operation of decentralized systems can only be understood if we understandthe operation of the state as a whole.
T H E I M PA C T O F D E C E N T R A L I Z AT I O N O N S O C I A L P O L I C Y I N H U N G A R Y, L AT V I A A N D U K R A I N E

24
T H E I M PA C T O F D E C E N T R A L I Z AT I O N O N S O C I A L P O L I C Y
5.2 The Birth of New States
Western literature about decentralization posits a state that is relatively constant overtime and which is continuous in its history and implemented state functions.
We have already asked the following question: If we posited a fully centralized state,how should we characterize a decentralized state in which the state functions, and thefunds and institutions needed to fulfill them, would (through some mechanism) betransferred to sub-national or other autonomous players outside the center? It is evidentthat in CEE (just as elsewhere) there are local government authorities, autonomous stateplayers, and non-state players all of which fulfill public functions, and there are mecha-nisms that ensure for those players the prerequisites to fulfill their functions.
It is however relevant to ask whether or not it is justifiable to speak about “centralizedstates” that supposedly preceded the present situation, in which social policy (and other)functions were fulfilled centrally unlike today, when they are decentralized. There werecentralized states, but they were different states.
Some of the transition countries, e.g. Poland, the Czech Republic, and Hungary,already had independent statehood prior to the transition. That is why it is possible (atleast in principle) to compare statehood before and after transition. The Eastern Bloccollapsed in such a short time and transformation was so thorough that it is justifiableto consider the decentralization of social policy a continuous process in which formercentralized functions smoothly converted into decentralized ones. But even in the caseof the Polish, Czech and Hungarian states, we cannot suppose that the state has remainedunchanged apart from certain functions being decentralized. In fact, these states arenow entirely different from what they were before transition.
It doubly applies to the “new countries” of Eastern Europe, some of which had nothad a modern state for a long time or had never had one at all. As far as Latvia or Ukraineare concerned, it is untenable to suppose they were ever centralized and have since beendecentralized. Those states did not even exist for several decades. Today, only ten yearsafter their (re)birth, it is impossible to examine how they have decentralized their formernon-existent centralized state. All we can analyze is their present operation, social policy,and state composition.
5.3 Reviving the History of Independent Statehood
The states of Central Eastern Europe considered the Soviet system an alien state formation,one that had been forced on them. In fact, they attained independent statehood uponthe collapse of the Eastern Bloc as its negation. After they became independent states,earlier nation-state traditions exerted a strong influence on their new state formation(with or without nationalist pride). So that the new states could revive their nationalidentities, they tended to embrace national traditions about statehood—rusty as some
25
of them were. Between the last third of the 19th century and the first half of the 20th
century, in Hungary and Latvia the state was in several respects prosperous and notvery far behind the advanced states of the time. The residents of those countries keenlycherished the memory of those times. (In Hungary at the 1990, 1994 and 1998 parlia-mentary elections, senior persons were returned to Parliament who had previously beenMPs in the pre-Sovietized, democratically elected parliament.)
If we ask about memories of the former sovereign statehood in the case of Hungaryand Latvia, we will get the following answer: Local government authorities played anoutstanding role in the nation-state tradition in connection with democracy and economicprosperity.
The history of Latvia over the past centuries has in many respects been one withthat of Riga. The country’s prosperity always depended (and still depends) on whetherRiga (where a third of the population lives and which used to belong to the HanseaticLeague) did well as a center of commerce. At times, when Riga, a free and autonomouscity, operated as a flourishing merchant town between the North and the East, Latviaprospered. Latvia will only succeed in exercising its political power if it institutionalizesRiga’s municipal autonomy.
The history of the Hungarian state in modern times is different. In the Austro-Hungarian Empire, Hungary was subordinated to the Habsburg-governed Austria.Bodies similar to local authorities, headed by an elected village mayor, managed villages.In addition to the village mayors, strong local government tradition owes its backgroundto the town councils of the burghers of medieval towns, which focused on the defenseof the towns. After the collapse of the communist regime, municipalities were revivedin town and country to replace the over-centralized Soviet-type councils.
Ukraine experienced independent national statehood only during a short, butimportant, period at the beginning of the 20th century. At that time the infrastructure(legislative, legal, and executive bodies) was established. This period, however, did notlast long because of the Bolshevik invasion.
5.4 Skipping Missing Decades
The question of historical legacy is quite complex. Even experts of sociology and culturalanthropology may find it interesting how institutions of public administration from pre-Soviet times can be filled under present political and administrative conditions withexperience attained by public administrators under communism.
A question that needs further research is whether administrative traditions datingback to independent statehood before communism can provide institutions that arecapable of responding to the challenges faced nowadays by local authorities. Of the threecountries, Ukraine’s position is the most difficult. It lacks even relatively long-termmodern nation-state traditions concerning public administration.
T H E I M PA C T O F D E C E N T R A L I Z AT I O N O N S O C I A L P O L I C Y I N H U N G A R Y, L AT V I A A N D U K R A I N E
26
T H E I M PA C T O F D E C E N T R A L I Z AT I O N O N S O C I A L P O L I C Y
The tradition that can be perceived in contemporary Latvian legislation is in severalrespects the closest to the Western type of community administration. Philologicalresearch has also confirmed that the regulations applied in local government activitiesin Latvia have been borrowed from the Presbyterian self-government principles of theLutheran Church. In Riga that tradition goes back to the Hanseatic League. Only thefuture will show whether or not the “countryside”—which accounts for two thirds ofthe country’s territory and where Catholics (50% Roman, 50% Greek Catholics) livein scattered localities—can also embrace that tradition. The question can be put in moredirect terms by asking if the “countryside” accept the Presbyterian principles of self-government as indigenous Latvian institutions.
In Hungary, relying on the pre-1945 traditions of public administration, it took buta short time to replace the over-centralized communist council system. In addition tothe apt observation that local authorities are testing grounds for students of democracy,it is chiefly the pre-1939 administrative traditions that can explain why there are over3,000 local authorities in a country of just ten million people. Before World War II thosemunicipalities had narrower functions, such as employing a village teacher and operatinga village school, where children of different ages studied together. The only other functionthey discharged was that of fostering the identity of and instilling pride into the localcommunity: an example being that of keeping the cemeteries tidy. A considerable partof Hungary’s local authorities can still do little more than fulfill those functions. It isunlikely that Hungary can ever establish a municipality for each of its more than 3,000citizens that can discharge each of the following functions: maintain proper schools,provide health care and social services, monitor damage to the environment, issue build-ing permits, act as guardianship authority, etc.
The local government traditions of all three countries go back to pre-modern timeswhen the post-1945 criteria associated with the welfare state was not institutionalized.Those administrative traditions failed to include expertise in social policy administrationthat evolved and matured after 1945. And that was not all they lacked. Paternalisticmethods of governance may have been adequate to handle certain local crises (on a familylevel or in a small community) in which rights and duties are unarticulated, yet todaycan violate fundamental liberties or be discriminatory.
6. STATE STRUCTURES AND GOVERNANCE
6.1 Democratic Cornerstones: Parliaments
The establishment of democratically elected parliaments and the institution of free andfair elections were the first and most important achievements of the post-1989 transition

27
process. Over the past ten years, Latvia and Hungary have achieved a relatively transparentstructure of competing political parties. Although the political and electoral cultures ofthe two countries are not yet as mature as those of the developed democracies, the politicalprofiles of individual parties, and the conduct of politics in general, can be characterizedas moving closer to Western standards. The Ukrainian political spectrum, on the otherhand, seems to be more oligarchic—instead of competing political programs, differentinterest groups, lobbies, or clans struggle against one another for political power. Thisuncertainty of political roles corresponds with Ukraine’s presidential-administrativestructure, and is unique among the three countries.
In each of the three countries, constitutional rules and principles are viewed as toolswith which to solve pressing political problems. To that end, hundreds of new laws arepassed by the respective parliaments each year. In the first years of the transition therelative weakness of the legitimacy and power of central governments in this respect seemedin part to be a reaction to the former party-state system, and had helped to institute “govern-ing parliaments,” that create and amend laws instead of implementing governmentalregulations and decisions. This practice has had a positive impact in increasing the accep-tance of core democratic principles, and building public trust in the “power of rules.”
When criticizing the efficiency of governance, Western norms of professionalism inthe civil service and public administration in performing and implementing public policiesare taken as reference points. One must not forget, however, that the main missions ofthe new state governments in the past ten years have been the creation of national unityand the strengthening of the sovereignty of the new political regimes. Furthermore, thenew states have aimed at tackling problems of widening regional and urban-rural economicinequalities, increasing and worsening poverty, and ethnic tensions.
Table 1.2Ethnic Composition in Hungary, Latvia and Ukraine
Country Number of Ethnic Groups Proportion ofDominant Ethnicity
Ukraine 4 73%
Latvia 6 52%
Hungary 6 90%
SOURCE: World Factbook, CIA, 1989–1996.
These difficulties can partly explain why it has been necessary to make almost everypolitical decision in the highest political forum, viz. parliament.
T H E I M PA C T O F D E C E N T R A L I Z AT I O N O N S O C I A L P O L I C Y I N H U N G A R Y, L AT V I A A N D U K R A I N E
28
T H E I M PA C T O F D E C E N T R A L I Z AT I O N O N S O C I A L P O L I C Y
6.2 Local Governments
“In the case of countries making the transition from communism to a market economyand addressing issues about decentralization, the appropriate role of local governmentsand new approaches to governance are central to the reform process. Local governancein this situation requires the acquisition, by both officials and administrators, of newskills and management systems. Moreover, as these countries achieve economic stability,citizens will certainly try to influence governmental institutions to cater to their ownincreasingly diversified needs, thus placing even more locally focused demands on systems.Consequently, decentralization—which moves decision-making power closer to commu-nities—is a logical reform choice for systems engaged in transition. For citizens in manyother countries, the demand for decentralization is acute, but the struggle to achieve itis complex and far from won” (Global2 1996).
In all three countries, the respective constitutions register the system of local self-governments as the fundamental component of the territorial division of state power.Moreover, in each of the three countries, special laws establish the political autonomyof local self-governments. The sophisticated language used to express the importance ofself-governments creates the impression that the territorial division of power is regardedas a fundamental issue. The treatment of self-governments in legal and constitutionaltexts can also be considered as an important political gesture to local self-governments.
The OECD report evaluating public management developments in Hungary(OECD 1998) is relevant in the case of Latvia as well: “In 1990, as a result of a substantialdecentralization process, a new, up-to-date system of municipal government was put inplace; municipal governments exercise power on an autonomous basis and decide onmatters of local interest. Their fundamental role is to organize and/or provide local publicservices.” In Latvia and Hungary, legal regulations on self-governments are quitedifferentiated and sophisticated, expressing a genuine respect for the power, competenceand autonomy of local self-governments, reflected by their empowerment to formulatelocal regulations.
Legal regulation is uniform: it does not depend on the locality of an application. However, thesame regulation has one meaning in the villages and a different one in larger cities. In our experience,decentralization resulted in leaving the local-self-governments to deal with their own problems...
SOURCE: Head of a family care center, Hungary.
In all three countries, the public administration of local municipalities can be charac-terized as having duplicate functions: they are partly subordinate to the elected localcouncils but, at the same time, they act as the local representatives of central government.The importance of these two components is reflected in the rules that regulate therelationship between civil servants working in local offices and their employers. The

29
two systems that differ most in this respect are Hungary and Ukraine. In Hungary, thesuperior of the notary (the head of the administration) and other civil servants is themayor. In contrast, in Ukraine the local civil servants are subordinate to the hierarchicalorder of the centralized public administration bureaucracy. (Latvia is between the two,but closer to Hungary in this respect.)
The power of local municipalities only partly depends on the legal status of self-government. An important question to ask in this case is how well equipped are thelocalities with appropriate administrative capacities, viz. adequate manpower and resources.Every case study illustrated a lack of adequate capacities. In the absence of adequatedata about these inadequacies, it is impossible to estimate what would be appropriatewith respect to local responsibilities in social assistance and service provision. In thisrespect, the urban-rural divide presents major problems. At least one quarter of thoseliving in rural communities suffer great disadvantages.
Table 1.3Level of Urbanization in Hungary, Latvia and Ukraine
Country Population Area Urbanization [% of Population Density[millions] [thousands population living [people/sq. km]
of sq. km] in urban areas]
Ukraine 50.0 579.4 71 86.3
Latvia 2.5 62.1 73 40.5
Hungary 10.2 92.3 65 110.8
SOURCE: World Development Indicators, 1998.
At the same time, some elements of “over-decentralization” can be recognized aswell (especially in Hungary and Latvia), concerning the average size of self-governedlocalities.
Table 1.4Structure of Sub-national Governance
Country Number of Average Population Number of Average PopulationRegional Units of Regional Units Local Units of Local Units
[thousands] [thousands]
Ukraine (oblasts) 25 1851.9 619 80.8
Latvia (rayons) 33 76.2 562 4.5
Hungary (counties) 20 500.1 3070 3.3
SOURCE: World Bank, Country Reports.
T H E I M PA C T O F D E C E N T R A L I Z AT I O N O N S O C I A L P O L I C Y I N H U N G A R Y, L AT V I A A N D U K R A I N E

30
T H E I M PA C T O F D E C E N T R A L I Z AT I O N O N S O C I A L P O L I C Y
The average sizes of localities would be even smaller if we excluded from considera-tion the relatively huge capital cities, Riga and Budapest. It seems to be something of a“mission impossible” to ensure a powerful, capable and functional local administrationfor roughly every 4,000 inhabitants in Hungary and Latvia.
This kind of over-decentralization (without corresponding capacities and capabilities)can be described as the result of a process whereby the main goal of decentralization isthe establishment of training grounds for democracy. It was seen to be less importantto distribute administrative power in a way that would achieve the most professional,cheapest and transparent system of public service delivery possible.
6.3 Regions, Oblasts, Rayons, Counties—Tiers
One of the most important objectives of the ongoing public administration reforms isto consolidate the status and functions of the intermediate government levels. Thecomposition of the functions of middle-level government seems to be quite ambiguousin spite of all of the political rhetoric about the increasing significance of regionalism.
The clearest situation exists, in principle, in the Ukraine, where the middle-level sub-national units are parts of the hierarchical chain of administrative bureaucracy. But if welook at the different complicated hierarchical routes through oblasts, rayons, cities, auto-nomous territories, urban districts and rural villages, it is not easy to establish a coherenthierarchy in such a large country. On the opposite side of the spectrum is Hungary,where the counties have almost no regional role in co-ordinating the activity of local self-governments. In Hungary, counties are responsible for delivering a well-defined set of publicservices. In the welfare sector, these functions are typically the management of large insti-tutions like secondary schools, hospitals, or residential care institutions. The Latvian caseseems to be the most ambiguous in this respect, partly because of the mismatch of Western-like regional functions and the Soviet-like hierarchical middle range status, and also becauseof the ongoing consolidation of the previously existing 26 regional units into six regions.
The unclear functions of the regional units are reflected in the lack of a coherentregional policy. One of the guiding principles of regionalism has been the attraction ofEU Regional Fund grants—particularly in the case of Hungary and Latvia.
6.4 The Agents of Central Governments, ‘In the Field’
The most difficult question facing the central governments of these states is how eachof the governments should relate to each of its many different self-governments. Thishas been a very sensitive question throughout the democratic transition process. If thegovernment is too active or the regional and local agencies act as prefecture-like commanders

31
of local self-governments, local autonomy loses its meaning. Fears of this sort of centrallydominated governance are well founded when one considers the tradition of state adminis-tration rooted in the state-socialist era. (In fact, in Ukraine local autonomy is stronglyquestioned by the extremely powerful government agencies.)
On the other hand, if there are no controlling or supervising units protecting basicrights, citizens can be left vulnerable to the idiosyncratic practices of local governments.
In reality, we saw little evidence demonstrating the existence of this kind of indirectgovernment behavior—and of what we saw, most of it related to fiscal control mechanisms.The coherent institutional solutions to implement fair targeting, to protect the consumersof local welfare provisions, and to prevent discrimination are almost completely absentin the three countries.
7. FISCAL (DE)CENTRALIZATION AND SOCIAL WELFARE
Before proceeding further, we must indicate our uncertainty concerning even the basicraw figures available in this field. In most cases, we were unable to clarify, even withinthe individual country framework, precisely which social program-items were includedin which budgetary categories. Comparison is very difficult in light of the highly inconsis-tent accounting categories in the three countries. Furthermore, there are several dimen-sions that can lead to the consideration of some public expenditure items as “decentralized”in one respect but fully centralized in another. It is thus impossible to classify the items bygrades on a centralization-decentralization axis. To be frank, our analysis will be a kindof “impressionistic picture,” focusing more on the principle policy dilemmas and lesson a “real” scientific description of the subject.
7.1 Heritage and General Constraints
From a technical point of view, the fiscal systems of the socialist states were quite de-centralized in a superficial sense. Local revenue mostly covered local expenditure. Thesystem worked as a “clearing” or “netting-out” operation: a portion of the locally collectedrevenues was utilized by the localities themselves for approved objectives up to the approvedamounts, and the remainder was given to the central government. In other words, thisfiscal regime could have been characterized by a high level of revenue assignment (“fixed”versus “regulative” taxes), and also by a high level of expenditure assignment (“own resources”versus “compensations”). This system, at first glance, can be considered decentralized,but this technical arrangement by no means reflected the actual operation of the system.In the socialist command economy systems, any technical opportunity for autonomy was
T H E I M PA C T O F D E C E N T R A L I Z AT I O N O N S O C I A L P O L I C Y I N H U N G A R Y, L AT V I A A N D U K R A I N E
32
T H E I M PA C T O F D E C E N T R A L I Z AT I O N O N S O C I A L P O L I C Y
“over-written” by political and administrative wills. The “own” income generated tosome degree an “own budget,” but all decisions on the utilization of these resources weremade at the central level.
The real issue is not the challenge of how to create and operate decentralized fiscalsystems, but rather the political and administrative aspect of the problem: how to equipthe local and regional units with adequate political power and administrative capacitiesso that they can exercise autonomous, self-reliant governance.
Concerning the survival of the socialist legacy, the three countries represent three verydifferent stages. The current Ukrainian public finance system exhibits the most similaritiesto the previous socialist system. Elected bodies exist at different sub-national levels, buttheir role is rather symbolic. Real power lies in the hands of the highly centralized publicadministration, which is fully subordinated to the president or his representatives.
In the interviewee’s opinion such a situation is a serious problem, as “the department can actuallydo nothing.” The department is not a legal entity and, as such, it cannot have its own account.Thus, even small programs face the wall of bureaucratic resistance and limited financial support.
SOURCE: Interview with a representative of a City Council Department of Social Assistance and Protectionof the Population, Ukraine.
The most rapid changes in the fiscal system can be observed in Latvia, which startedfrom the same socialist situation ten years ago, but—at least according to the terms ofits legislation—has fully reformed its public administration and finance structure. Thereis, however, some discrepancy between the “formal” situation and reality. Put anotherway, the legislative treatment is somewhat disconnected from the everyday perceptionof the system. For example, the legal text reveals some newly introduced “local personalincome tax surcharging over the national tax base” scheme, but our Latvian partners haveinterpreted this as a minor modification of the former “fixed-compensatory” assignmentsystem. The real issue is, again, the less the fiscal technology, the more the observableincrease in the political decision-making power and administrative responsibility in thehands of municipalities.
The former socialist system in Hungary successfully started to replace the formeroccasional “plan-bargaining” system with a normative political decision making process.The origin of the long list of different granting schemes (in the Hungarian language,“normative state contributions”) for public policy programs is rooted in the era of the“new economic mechanisms” of the late 1960s. The new economic policies introduceddirect charges over urban and communal services and the reduction of state subsidies onrenting fees of housing and urban transport. In sum, the existing “tool-kit” of fiscaldecentralization was manufactured late in the socialist period in Hungary. The realissue is not a technical one but a political one: who should manage and manipulate thistool-kit (even if this kit is in an ongoing state of development)?

33
7.2 National Fiscal Policies in the Sphere of Social Welfare:Reduction and Centralization
Let us quote as an example the Memorandum of the Ukraine to the IMF, signed by theUkrinian President in 1998. The character of the statement is more or less valid for allthree countries, and some paragraphs are identical to the political statements made byleaders of the countries to other institutions (such as the World Bank and the EU) duringthe 1990s: “(5.) ...further reduction of the fiscal deficit is necessary...(7.)...We havestarted to reduce the size of the public sector, including health and education sectors....(Also we) should reduce the budgeting wage bill. The social protection system will berationalized, and streamlined to eliminate general subsidies, and improve the targetingassistance to the truly needy. In this context, we will eliminate most budgetary privilegesand review the benefits provided by the Chernobyl Fund, the Social Insurance Fund,and the Employment Fund....(9.)... Financial relations between the central governmentand the local governments will be reorganized and clearly defined... to develop an efficientlocal revenue commensurate with its responsibility. (23.)... Taking into account theclearance of arrears on wages, pensions, and social benefits, the underlying consolidatedbudget deficit is targeted to narrow from about 5.2% in 1997 to 2.3% of the GDP in1998...(24.)... To improve the transparency of fiscal operations, several extra budgetaryfunds have been eliminated or incorporated in the main budget accounts, and in 1999we intend to incorporate all remaining extra budgetary funds, including those at localgovernment level (with the exception of the Pension Fund and the Social InsuranceFund...”
... Secondly, the other problem is that the State itself is the main guilty party in not observing thelaw. It should not be this way. It must not be tolerated. If the State is not satisfied with a law, itshould be suspended or repealed. In the Ukraine, for example, the law states that salaries/wagesare to be paid twice a month. But sometimes salaries/wages are not paid for years, and this isaccepted as normal. The law says that people have to work for the period as stated in the contractconcluded with the employer whereas the employer is able to force them to take holidays for sixmonths or even up to three years, without any adequate sanctions being taken against the employer.At present, the State remains the main employer or employs the most people, and the State itselfviolates these laws.
SOURCE: Representative of the Trade Unions Federation of Ukraine.
A presidential decree forbidding all budgetary netting-out operations was issued inthe beginning of 1998, and the mechanism for these operations was eliminated. More-over, part of the earmarked revenues of various funds have been counter-earmarked foruse by the Ministry of Finance, accompanied by similar reductions in associated expendi-tures incurred by these funds.
T H E I M PA C T O F D E C E N T R A L I Z AT I O N O N S O C I A L P O L I C Y I N H U N G A R Y, L AT V I A A N D U K R A I N E
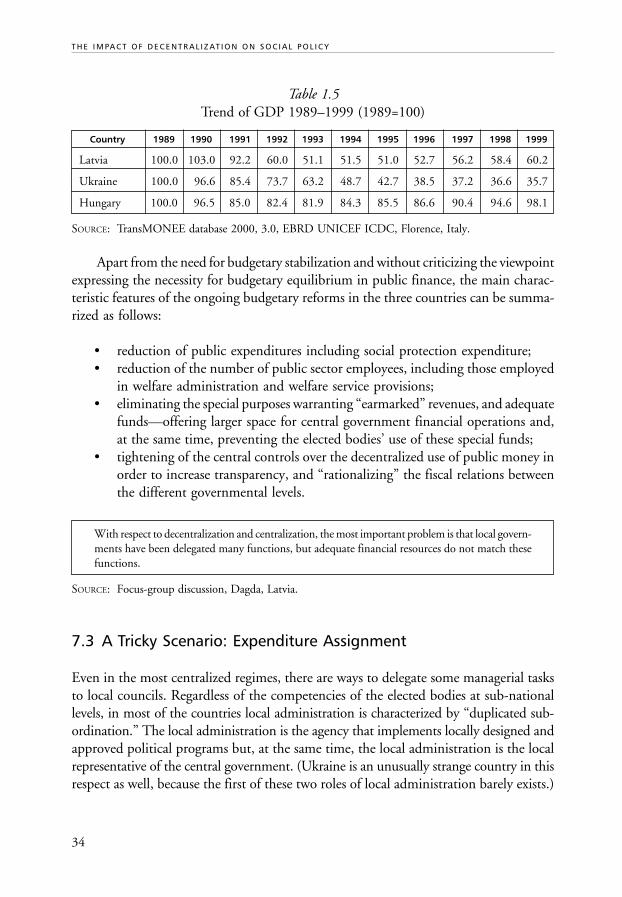
34
T H E I M PA C T O F D E C E N T R A L I Z AT I O N O N S O C I A L P O L I C Y
Table 1.5Trend of GDP 1989–1999 (1989=100)
Country 1989 1990 1991 1992 1993 1994 1995 1996 1997 1998 1999
Latvia 100.0 103.0 92.2 60.0 51.1 51.5 51.0 52.7 56.2 58.4 60.2
Ukraine 100.0 96.6 85.4 73.7 63.2 48.7 42.7 38.5 37.2 36.6 35.7
Hungary 100.0 96.5 85.0 82.4 81.9 84.3 85.5 86.6 90.4 94.6 98.1
SOURCE: TransMONEE database 2000, 3.0, EBRD UNICEF ICDC, Florence, Italy.
Apart from the need for budgetary stabilization and without criticizing the viewpointexpressing the necessity for budgetary equilibrium in public finance, the main charac-teristic features of the ongoing budgetary reforms in the three countries can be summa-rized as follows:
• reduction of public expenditures including social protection expenditure;• reduction of the number of public sector employees, including those employed
in welfare administration and welfare service provisions;• eliminating the special purposes warranting “earmarked” revenues, and adequate
funds—offering larger space for central government financial operations and,at the same time, preventing the elected bodies’ use of these special funds;
• tightening of the central controls over the decentralized use of public money inorder to increase transparency, and “rationalizing” the fiscal relations betweenthe different governmental levels.
With respect to decentralization and centralization, the most important problem is that local govern-ments have been delegated many functions, but adequate financial resources do not match thesefunctions.
SOURCE: Focus-group discussion, Dagda, Latvia.
7.3 A Tricky Scenario: Expenditure Assignment
Even in the most centralized regimes, there are ways to delegate some managerial tasksto local councils. Regardless of the competencies of the elected bodies at sub-nationallevels, in most of the countries local administration is characterized by “duplicated sub-ordination.” The local administration is the agency that implements locally designed andapproved political programs but, at the same time, the local administration is the localrepresentative of the central government. (Ukraine is an unusually strange country in thisrespect as well, because the first of these two roles of local administration barely exists.)
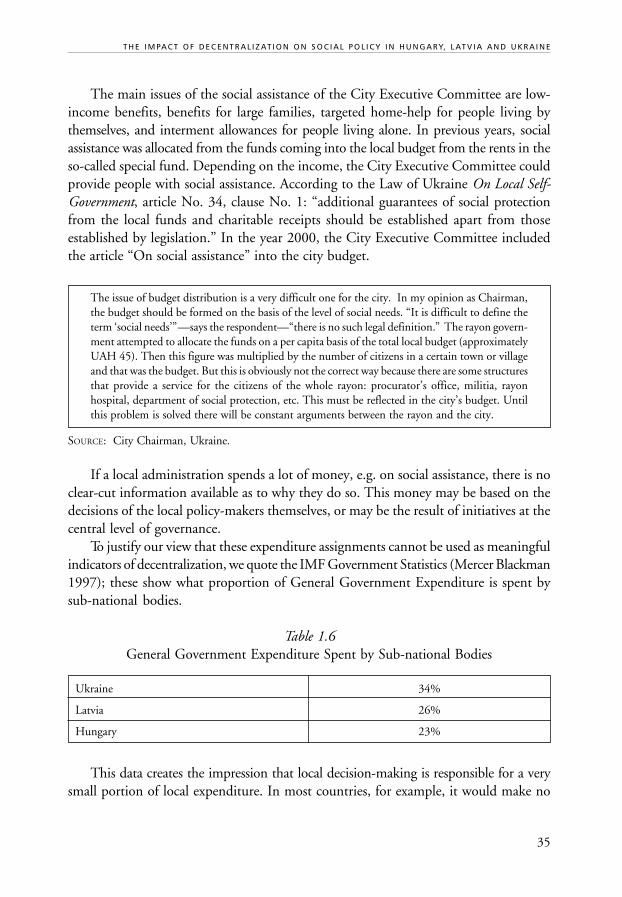
35
The main issues of the social assistance of the City Executive Committee are low-income benefits, benefits for large families, targeted home-help for people living bythemselves, and interment allowances for people living alone. In previous years, socialassistance was allocated from the funds coming into the local budget from the rents in theso-called special fund. Depending on the income, the City Executive Committee couldprovide people with social assistance. According to the Law of Ukraine On Local Self-Government, article No. 34, clause No. 1: “additional guarantees of social protectionfrom the local funds and charitable receipts should be established apart from thoseestablished by legislation.” In the year 2000, the City Executive Committee includedthe article “On social assistance” into the city budget.
The issue of budget distribution is a very difficult one for the city. In my opinion as Chairman,the budget should be formed on the basis of the level of social needs. “It is difficult to define theterm ‘social needs’” —says the respondent—“there is no such legal definition.” The rayon govern-ment attempted to allocate the funds on a per capita basis of the total local budget (approximatelyUAH 45). Then this figure was multiplied by the number of citizens in a certain town or villageand that was the budget. But this is obviously not the correct way because there are some structuresthat provide a service for the citizens of the whole rayon: procurator’s office, militia, rayonhospital, department of social protection, etc. This must be reflected in the city’s budget. Untilthis problem is solved there will be constant arguments between the rayon and the city.
SOURCE: City Chairman, Ukraine.
If a local administration spends a lot of money, e.g. on social assistance, there is noclear-cut information available as to why they do so. This money may be based on thedecisions of the local policy-makers themselves, or may be the result of initiatives at thecentral level of governance.
To justify our view that these expenditure assignments cannot be used as meaningfulindicators of decentralization, we quote the IMF Government Statistics (Mercer Blackman1997); these show what proportion of General Government Expenditure is spent bysub-national bodies.
Table 1.6General Government Expenditure Spent by Sub-national Bodies
Ukraine 34%
Latvia 26%
Hungary 23%
This data creates the impression that local decision-making is responsible for a verysmall portion of local expenditure. In most countries, for example, it would make no
T H E I M PA C T O F D E C E N T R A L I Z AT I O N O N S O C I A L P O L I C Y I N H U N G A R Y, L AT V I A A N D U K R A I N E
36
T H E I M PA C T O F D E C E N T R A L I Z AT I O N O N S O C I A L P O L I C Y
sense not to decentralize the pension system. In Ukraine—where the pension fundcontributions can sometimes only be collected “in-kind,” and senior citizens receive theirpensions in the form of natural goods—the system must be managed locally. It is possibleto determine the exchange rate of pension-barters, or to organize the delivery of pensions(say in potatoes or bicycle parts), only at local level. In all three countries, it is fashionableto support “better targeting” of the locally managed social programs. As far as this ideais concerned, our judgement is very critical and the considerations of the Poverty Reportof the World Bank in Hungary (1999) must be taken seriously. This report stated thata considerable proportion of locally managed cash benefit programs are misused andthat, in spite of means testing, these programs did not reach the poor. All other types ofcash transfers and social protection programs have demonstrated better targeting thanthe means-tested locally managed cash benefit programs.
As of 1 January 2000, a total of 45,025 unemployed persons were registered inEmployment Centers; this number represents 0.89% of the total population of Kyiv.Of these, 9,179 of them received unemployment benefits: 30.8% received over UAH100 a month, 33.8%—UAH 25, 25.5% UAH 25-74 a month. The professionalorientation services were used by 25,843 persons during the year; 3,847 unemployedpersons were engaged in public works; 25.8% were provided with jobs (there are fiveunemployed people for one who is working in Kyiv).
Even so, these Employment Center statistics do not reflect the actual situation of unemploymentin Kyiv (according to the data of the State Committee, the level of unemployment reached13.2% in Kyiv). Thus it is possible to conclude that most people without jobs do not register atan Employment Center. They do not apply for a job or for assistance (which anyway does notcover the needs for living). That is why neither the City Employment Center nor the Unemploy-ment State Fund has anything to be proud of because 23.3% of the total sum of Fund expensesis spent on maintaining and improving the Fund itself.
SOURCE: Case study, Kyiv City Employment Center.
On the basis of the available data, there are no figures on the administrative costs oflocal social assistance programs. Concerning the very low level of average benefits receivedand the overly complicated testing and decision-making procedures, however, one canhypothesize that the efficiency of welfare expenditure assignment programs is very low.
There are additional problems with those programs where the administrative tasksare delegated only to the local level. If the local administration is provided with “technical”administrative duties only, their perception on budgetary limitations will inevitably be “soft”;they will not be interested in concentrating on the cost-effectiveness of the programs. More-over, in any case of “third party payments,” the problem of cost containment will occur.This happens in “compensatory schemes,” but this is also the case in Hungary’s non-insurancebased, social assistance financed disability schemes. In Ukraine, this problem occurs in the
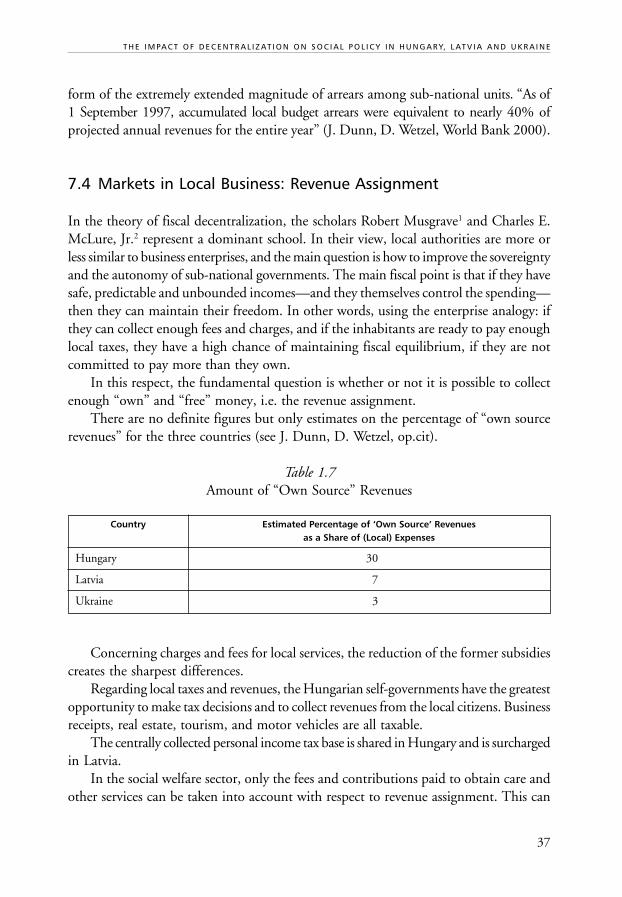
37
form of the extremely extended magnitude of arrears among sub-national units. “As of1 September 1997, accumulated local budget arrears were equivalent to nearly 40% ofprojected annual revenues for the entire year” (J. Dunn, D. Wetzel, World Bank 2000).
7.4 Markets in Local Business: Revenue Assignment
In the theory of fiscal decentralization, the scholars Robert Musgrave1 and Charles E.McLure, Jr.2 represent a dominant school. In their view, local authorities are more orless similar to business enterprises, and the main question is how to improve the sovereigntyand the autonomy of sub-national governments. The main fiscal point is that if they havesafe, predictable and unbounded incomes—and they themselves control the spending—then they can maintain their freedom. In other words, using the enterprise analogy: ifthey can collect enough fees and charges, and if the inhabitants are ready to pay enoughlocal taxes, they have a high chance of maintaining fiscal equilibrium, if they are notcommitted to pay more than they own.
In this respect, the fundamental question is whether or not it is possible to collectenough “own” and “free” money, i.e. the revenue assignment.
There are no definite figures but only estimates on the percentage of “own sourcerevenues” for the three countries (see J. Dunn, D. Wetzel, op.cit).
Table 1.7Amount of “Own Source” Revenues
Country Estimated Percentage of ‘Own Source’ Revenuesas a Share of (Local) Expenses
Hungary 30
Latvia 7
Ukraine 3
Concerning charges and fees for local services, the reduction of the former subsidiescreates the sharpest differences.
Regarding local taxes and revenues, the Hungarian self-governments have the greatestopportunity to make tax decisions and to collect revenues from the local citizens. Businessreceipts, real estate, tourism, and motor vehicles are all taxable.
The centrally collected personal income tax base is shared in Hungary and is surchargedin Latvia.
In the social welfare sector, only the fees and contributions paid to obtain care andother services can be taken into account with respect to revenue assignment. This can
T H E I M PA C T O F D E C E N T R A L I Z AT I O N O N S O C I A L P O L I C Y I N H U N G A R Y, L AT V I A A N D U K R A I N E

38
T H E I M PA C T O F D E C E N T R A L I Z AT I O N O N S O C I A L P O L I C Y
be estimated as less than 30% of care expenditure in Hungary and a smaller percentagein Latvia.
7.5 Intergovernmental Transfers and Granting Arrangements
The last scenario reflects the weak points of revenue assignment. Charges, fees, taxes onbusiness receipts or on valuable real estate can be effective within better-off communities.People generally weigh whether to contribute to the costs of the local community ifthey feel that they earn adequate incomes. If they are dissatisfied with the utilization oftheir money, they will elect new local politicians at the next local elections. If the com-munity is poor, however, the same decision-making process has negative consequencesfor revenue assignments, since the base for such local revenues will also be poor.
We are living in an era in which horizontal inequalities are growing due to the socialinequality factors of poverty and social exclusion. In order to promote horizontal equity,it is necessary to improve the fiscal balance among regions and municipalities, especiallyin financing poverty relief and social assistance programs. This raises the issue of theefficacy of the different granting schemes.
The most important function of the normative type of granting is leveling; capitation is determinedon the basis of the number of inhabitants or the members of the target group. The differences inthe local conditions, the characteristics of employment, and income inequalities are not takeninto consideration. Thus the system of granting strengthens territorial inequalities. There existsa negative correlation between the revenues and financial situation of a local self-governmentand the welfare expenditure. As a consequence, the balance of payment deficit is continuouslyincreasing in the field of social provisions, the municipalities are forced to withdraw resourcesfrom development, and small settlements are endangered by bankruptcy. The widening of thescope of responsibilities of local self-governments, e.g. support for the long-term unemployed,increases the deficit of local self-governments resulting in absurd solutions in the case of financialprovisions based on discretion. The planning procedure of local self-governments has to beadjusted to the dysfunctional central granting system; planning based on the previous year’sbudget will be dominant blocking innovations in the social sector.
SOURCE: Case study, Nyíregyháza, Hungary.
The two granting philosophies most often put into practice must be clearly differen-tiated. One of them can be characterized as “capacity granting”—the central state allocatesgrants according to the size of local public service capacities (e.g. the number of studentsin schools, or the number of hospital beds provided by care services). The most importantadvantage of this kind of system is its protection of existing capacities even if economicconditions worsen. But this advantage also acts as a disadvantage because this procedurepreserves these structures and institutions irrespective of changing needs and demands.“Capacity granting” serves as a powerful counter-incentive against reforms, even if attempts
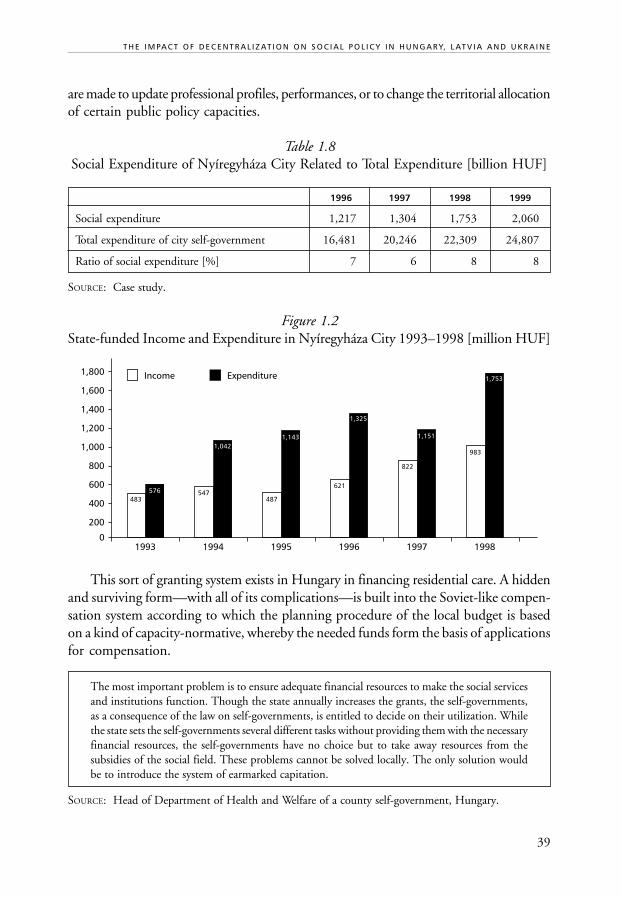
39
are made to update professional profiles, performances, or to change the territorial allocationof certain public policy capacities.
Table 1.8Social Expenditure of Nyíregyháza City Related to Total Expenditure [billion HUF]
1996 1997 1998 1999
Social expenditure 1,217 1,304 1,753 2,060
Total expenditure of city self-government 16,481 20,246 22,309 24,807
Ratio of social expenditure [%] 7 6 8 8
SOURCE: Case study.
Figure 1.2State-funded Income and Expenditure in Nyíregyháza City 1993–1998 [million HUF]
This sort of granting system exists in Hungary in financing residential care. A hiddenand surviving form—with all of its complications—is built into the Soviet-like compen-sation system according to which the planning procedure of the local budget is basedon a kind of capacity-normative, whereby the needed funds form the basis of applicationsfor compensation.
The most important problem is to ensure adequate financial resources to make the social servicesand institutions function. Though the state annually increases the grants, the self-governments,as a consequence of the law on self-governments, is entitled to decide on their utilization. Whilethe state sets the self-governments several different tasks without providing them with the necessaryfinancial resources, the self-governments have no choice but to take away resources from thesubsidies of the social field. These problems cannot be solved locally. The only solution wouldbe to introduce the system of earmarked capitation.
SOURCE: Head of Department of Health and Welfare of a county self-government, Hungary.
T H E I M PA C T O F D E C E N T R A L I Z AT I O N O N S O C I A L P O L I C Y I N H U N G A R Y, L AT V I A A N D U K R A I N E
200
0
400
600
800
1,000
1,200
1,400
1,600
1,800
1993
483576
1994
547
1,042
1995
487
1,143
1996
621
1,325
1997
822
1,151
1998
983
1,753Income Expenditure

40
T H E I M PA C T O F D E C E N T R A L I Z AT I O N O N S O C I A L P O L I C Y
The other type of granting scheme can be called “need assessment granting.” Thissystem is based on the assessment of local needs calculated by certain social and demographicindicators (number of inhabitants, composition by age, ratio of unemployed to employed,etc.) That “unit of need” can be granted from the central budget. This is the dominantmeans of generating local social assistance budgets in Hungary. In principle, the systemseems to be effective, but it implies two fundamental difficulties. The first has to do withthe generosity of the grants. If they are too high, they will create problems in terms ofincentives and local responsibilities. If they are too low, they provide inadequate meansto fulfil their original purpose of relieving local poverty. The consequence of this dilemmais that more and more complicated indexes attempt to find “a golden medium” betweenthe two approaches. But these indexes very much weaken the transparency, predictabilityand accountability of the “need granting scheme.”
7.6 Summing Up: Fiscal Decentralization of Social Protection
In recent years, the impact of fiscal centralization guided by state budget consolidationprograms has been much stronger than that of steps taken toward fiscal decentralization.
Concerning the quality of the new tool-kit of fiscal techniques, our judgement isambivalent. These new tools can improve the responsibility and accountability of localpolitical leaders and initiate modest behavioral changes in local spending. Further, theycan make the community more sensitive to the costs and prices of public sector expenditure.The means of fiscal decentralization in social policy, however, do not react adequately toeither vertical or horizontal equity issues.
In Hungary, for instance, the law defines the range of primary services that arecompulsory for each settlement. Among the services falling within the scope of primaryservices, catering and home help should be provided everywhere. Despite this require-ment, in 26% of the country’s settlements no primary services were provided in 1997,a factor which affected 5% of the total population of the country.
Catering services were not organized in 30% of the settlements (6% of the totalpopulation); home help was not provided in 52% of the settlements (12% of the totalpopulation); family assistance services were not offered in 92% of the settlements (41%of the total population).3
In villages with a population of less than five hundred and other locations that areoutside the urban areas, the various primary care services may also be organized withthe involvement of a village manager. The tasks of family assistance must be performedthough a family assistance service or the employment of a family assistant with qualificationsspecified in a separate legal regulation.
41
The conversion of the role of central income security programs to local social assistanceseems to be a very costly trade-off. The typically means-tested social assistance benefitprograms have deep problems with their coverage, effectiveness and efficiency and thereis evidence that indicates some negative effects of the targeting procedures.
It can only be assumed, due to the lack of information on the administrative costs ofdecentralization of social programs, that these kinds of solutions incur relatively highadministrative costs in comparison with the direct and per capita costs of the programs.
8. WELFARE PROVISIONS
As the Report of the United Nations Global Forum on Innovative Policies and Practicesin Local Governance expressed “Institutional and policy innovations need to be basedupon some measure of societal consensus” (Global2 1996). In Hungary and the Ukrainethere is not a long-term institutional vision of social policy, whereas in Latvia, at leastthe framework of it is constructed.
8.1 Social Insurance—the Foundationof the Social Protection System
Latvia, Ukraine and Hungary, like most of the Central and Eastern European countries—despite the well-known difficulties—inherited a relatively well-built health-care andpension system from the state socialism regimes. The system was based on the more orless guaranteed workplace, which provided citizens with considerable security.
The pension and health programs were traditionally provided and granted by thecentral state during state socialism. There is no need to explain in detail the funda-mental political importance of these schemes. In all three countries these schemes sufferfrom strong pressure because of transformed demographic, economic, political, and socialconditions.
After the political and economic transition all three countries reshaped their systemsin some way. In Latvia and Hungary, pension, health-care and unemployment systemsare insurance based. The social protection system of Ukraine is still predominantlycharacterized by the structures inherited from the Soviet Union, but insurance-basedpension and unemployment schemes are in operation.
The most fundamental changes occurred in the pension system in Hungary and Latvia,and in Ukraine there is a detailed plan to reform the scheme in accordance with the basicprinciples of the two former countries.
T H E I M PA C T O F D E C E N T R A L I Z AT I O N O N S O C I A L P O L I C Y I N H U N G A R Y, L AT V I A A N D U K R A I N E
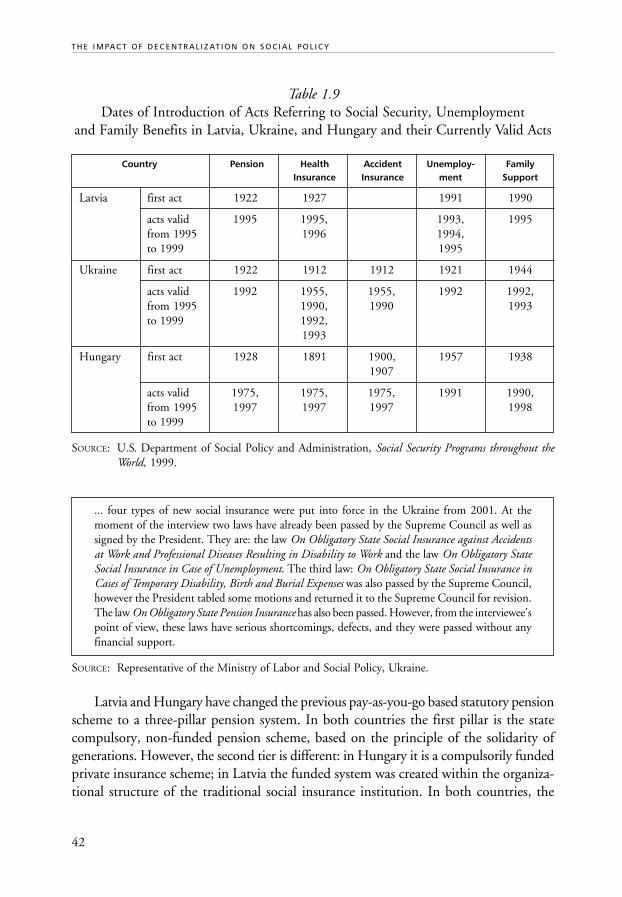
42
T H E I M PA C T O F D E C E N T R A L I Z AT I O N O N S O C I A L P O L I C Y
Table 1.9Dates of Introduction of Acts Referring to Social Security, Unemployment
and Family Benefits in Latvia, Ukraine, and Hungary and their Currently Valid Acts
Country Pension Health Accident Unemploy- FamilyInsurance Insurance ment Support
Latvia first act 1922 1927 1991 1990
acts valid 1995 1995, 1993, 1995from 1995 1996 1994,to 1999 1995
Ukraine first act 1922 1912 1912 1921 1944
acts valid 1992 1955, 1955, 1992 1992,from 1995 1990, 1990 1993to 1999 1992,
1993
Hungary first act 1928 1891 1900, 1957 19381907
acts valid 1975, 1975, 1975, 1991 1990,from 1995 1997 1997 1997 1998to 1999
SOURCE: U.S. Department of Social Policy and Administration, Social Security Programs throughout theWorld, 1999.
... four types of new social insurance were put into force in the Ukraine from 2001. At themoment of the interview two laws have already been passed by the Supreme Council as well assigned by the President. They are: the law On Obligatory State Social Insurance against Accidentsat Work and Professional Diseases Resulting in Disability to Work and the law On Obligatory StateSocial Insurance in Case of Unemployment. The third law: On Obligatory State Social Insurance inCases of Temporary Disability, Birth and Burial Expenses was also passed by the Supreme Council,however the President tabled some motions and returned it to the Supreme Council for revision.The law On Obligatory State Pension Insurance has also been passed. However, from the interviewee’spoint of view, these laws have serious shortcomings, defects, and they were passed without anyfinancial support.
SOURCE: Representative of the Ministry of Labor and Social Policy, Ukraine.
Latvia and Hungary have changed the previous pay-as-you-go based statutory pensionscheme to a three-pillar pension system. In both countries the first pillar is the statecompulsory, non-funded pension scheme, based on the principle of the solidarity ofgenerations. However, the second tier is different: in Hungary it is a compulsorily fundedprivate insurance scheme; in Latvia the funded system was created within the organiza-tional structure of the traditional social insurance institution. In both countries, the
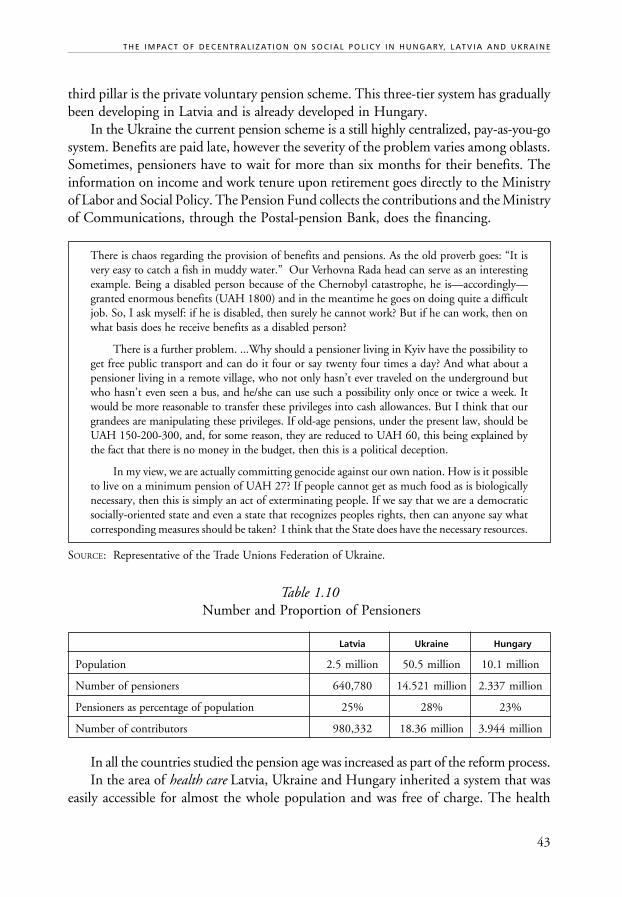
43
third pillar is the private voluntary pension scheme. This three-tier system has graduallybeen developing in Latvia and is already developed in Hungary.
In the Ukraine the current pension scheme is a still highly centralized, pay-as-you-gosystem. Benefits are paid late, however the severity of the problem varies among oblasts.Sometimes, pensioners have to wait for more than six months for their benefits. Theinformation on income and work tenure upon retirement goes directly to the Ministryof Labor and Social Policy. The Pension Fund collects the contributions and the Ministryof Communications, through the Postal-pension Bank, does the financing.
There is chaos regarding the provision of benefits and pensions. As the old proverb goes: “It isvery easy to catch a fish in muddy water.” Our Verhovna Rada head can serve as an interestingexample. Being a disabled person because of the Chernobyl catastrophe, he is—accordingly—granted enormous benefits (UAH 1800) and in the meantime he goes on doing quite a difficultjob. So, I ask myself: if he is disabled, then surely he cannot work? But if he can work, then onwhat basis does he receive benefits as a disabled person?
There is a further problem. ...Why should a pensioner living in Kyiv have the possibility toget free public transport and can do it four or say twenty four times a day? And what about apensioner living in a remote village, who not only hasn’t ever traveled on the underground butwho hasn’t even seen a bus, and he/she can use such a possibility only once or twice a week. Itwould be more reasonable to transfer these privileges into cash allowances. But I think that ourgrandees are manipulating these privileges. If old-age pensions, under the present law, should beUAH 150-200-300, and, for some reason, they are reduced to UAH 60, this being explained bythe fact that there is no money in the budget, then this is a political deception.
In my view, we are actually committing genocide against our own nation. How is it possibleto live on a minimum pension of UAH 27? If people cannot get as much food as is biologicallynecessary, then this is simply an act of exterminating people. If we say that we are a democraticsocially-oriented state and even a state that recognizes peoples rights, then can anyone say whatcorresponding measures should be taken? I think that the State does have the necessary resources.
SOURCE: Representative of the Trade Unions Federation of Ukraine.
Table 1.10 Number and Proportion of Pensioners
Latvia Ukraine Hungary
Population 2.5 million 50.5 million 10.1 million
Number of pensioners 640,780 14.521 million 2.337 million
Pensioners as percentage of population 25% 28% 23%
Number of contributors 980,332 18.36 million 3.944 million
In all the countries studied the pension age was increased as part of the reform process.In the area of health care Latvia, Ukraine and Hungary inherited a system that was
easily accessible for almost the whole population and was free of charge. The health
T H E I M PA C T O F D E C E N T R A L I Z AT I O N O N S O C I A L P O L I C Y I N H U N G A R Y, L AT V I A A N D U K R A I N E
44
T H E I M PA C T O F D E C E N T R A L I Z AT I O N O N S O C I A L P O L I C Y
indicators of the population of the region lagged behind those of the West and therewere, and still are, problems concerning the efficiency as well as the quality of the provision.The institutionalized system was supplemented with a wide range of formal and informalprivileges and semi-legal cash flows. In Hungary and Latvia the health care system isinsurance-based (though in different ways) and it is becoming a more and more dominantideology to strengthen the insurance basis of the health care system; in Hungary inparticular, more and more services are marketed. In Ukraine, government funded healthservice providers provide services: mandatory social insurance for medical care has notyet been implemented. Thus, according to several policy papers and recommendationsthe restructuring of the financing of the health care system is one of the most urgent tasksin the country.
With regard to the Social Insurance Fund governed by trade unions, it is a relic of the Sovietsystem. There was no such organization in any other country, but no one could say at that timethat it was bad. Today, instead, we have serious problems regarding pension insurance. There arealso serious problems in our social insurance sphere. Let us take agriculture as an example: inagriculture, there occurred a rough State intrusion and today women have no possibility to begranted leave of absence in respect of pregnancy and childbirth since the State, as if meetingagriculturists’ interests, introduced a so-called single tax, and as a result obligatory collections tothe Social Insurance Fund were abolished. It was allegedly supposed that some part of this taxwould be given to the Social Insurance Fund and that this Fund should be subsidized so that itcould perform its functions. But having initiated this the State didn’t go ahead with this proposal.Collections were abolished but no money was given to the Fund.
SOURCE: Representative of the Trade Unions Federation of Ukraine.
One of the main characteristics of state socialism was the security of employmenttogether with the connected social grants and the high job-market participation (e.g.women). At the same time, too many people worked in the agricultural and industrialsectors, and “hidden unemployment” was widespread in the analyzed countries causinga distorted employment structure and decreased economic efficiency. After the transitionthe growth of unemployment was a new phenomenon in Latvia, Ukraine and Hungary.
Unemployment obviously means lack of income, and it means that people have nothing to do.Dagda has a high unemployment rate: 14%. One of the causes of the high unemployment ratemay well be the fact that people are interested in registering as unemployed as in this way theyhave the chance of participating in paid temporary community jobs, and though the pay is lowit’s still a source of income. Alcoholism in general is adding to the problem since it leads tochildren being neglected and people losing their jobs. Teenage alcoholism is a serious problem,too. The worst situations are in families where the adults are unemployed, and in the case ofpeople living by themselves. In some cases, pensioners are helping their children’s families.
SOURCE: Focus-group discussion, Dagda, Latvia.

45
Table 1.11Total Employment, 1989–1998 (1989=100%)
1989 1990 1991 1992 1993 1994 1995 1996 1997 1998
Latvia 100 100 99 92 86 77 74 72 74 —
Ukraine 100 100 98 96 94 91 93 91 89 88
Hungary 100 97 87 77 72 71 69 69 69 70
SOURCE: UNECE, Economic Survey of Europe, 99/1.
In the Ukraine a large part of the labor force is employed de jure, but they do not workde facto, as they are on forced—administrative (mainly unpaid)—leave or on shortenedworking hours. In 1997, 2.9 million employees (21.9%) were on forced administrativeleave and 2.1 million (16.1%) were on shortened working hours.
Table 1.12Trend of Real Value of Wages 1989–1998 (1989=100)
1989 1990 1991 1992 1993 1994 1995 1996 1997 1998
Latvia 100 105.0 71.9 49.0 51.8 57.9 57.7 54.1 60.7 63.0
Ukraine 100 — — — — — — — — 40.3
Hungary 100 94.3 87.7 86.5 83.1 89.1 78.2 74.3 77.1 79.6
SOURCE: TransMONEE database 2000, 3.0, EBRD UNICEF ICDC, Florence, Italy.
The real value of wages decreased in all three countries. The situation would be evenworse if many were not involved in the gray or black economy.
In all three countries the unemployment system is based on some kind of tighteninginsurance-type solution. Central governmental labor-market policies use active and passive,centralized and decentralized measures as well.
Table 1.13Trend of Unemployment in Latvia, Ukraine and Hungary
1989 1990 1991 1992 1993 1994 1995 1996 1997 1998
Latvia — — — 0.9 4.5 6.3 6.4 7.0 7.5 7.6
Ukraine — — — 0.3 0.4 0.4 0.6 1.6 3.1
Hungary 0.4 0.8 8.5 12.3 12.1 10.4 10.4 10.5 10.4 9.1
SOURCE: TransMONEE database 2000.
T H E I M PA C T O F D E C E N T R A L I Z AT I O N O N S O C I A L P O L I C Y I N H U N G A R Y, L AT V I A A N D U K R A I N E
46
T H E I M PA C T O F D E C E N T R A L I Z AT I O N O N S O C I A L P O L I C Y
With respect to Fund management, I admit that if we still want to build our country accordingto democratic principles, we should abide by such principles. As of today a new law on industrialaccident insurance has been passed, fund-managing personnel have been assigned. A law onunemployment insurance has been passed accordingly, and respective managing bodies havebeen created on an equal and trilateral basis. Employers, trade unions, and the State have beenrepresented. By the way, I am the Unemployment Insurance Fund director. In my opinion, themain shortcoming of the newly created Unemployment Insurance Fund is the fact that the Statewants to make the insurance fund handle other matters than insurance; in other words, the Fundwill have to provide people having no insurance with social services and financial support. Thus,if you and I make insurance contributions, they will not only be used to cover expenses connectedwith accidents that we may be involved in but also to cover other people’s expenses, peoplewhom the State—for some reason or other—permitted to waive contributing to this fund.Therefore, our payments as well as those of the employers will be higher. Secondly, the Stateundertook to finance this Fund with respect to activities not connected with insurance mattersor matters that are beyond the Insurance Fund’s authority. But as of today I do know thatregarding the budget for 2001 the State is not going to assign even a kopiyka or enough moneyat least to enable the Fund to perform public functions. As a result we will be forced to increaseinsurance tariffs, but workers have no spare money, their salary or wages are below the povertyrate, and employers use every rostrum to say the tax load is very high in our country. This is themain problem.
As a matter of fact our social welfare laws are so good that if they were obeyed, it would beimpossible to dream of a better life—real communism. It is stated in the constitution that theState provides full employment, but today the official unemployment rate exceeds 4.5%. Accordingto methods of the Ministry of Health Protection the unemployment rate in the Ukraine exceeds11%. The average period of unemployment officially lasts for more than 11 months; accordingto unofficial data—it is more than 18 months; and according to my expert judgement in theUkraine the unemployment rate exceeds 25%.
SOURCE: Representative of the Trade Unions Federation of Ukraine.
Relevant institutional bases are essential to support these policies. The most seriousproblems occur in this respect in Ukraine. The capacity of the labor market institutionsis not adequate for the growing number of unemployed people or with the services tobe offered to them. There are not enough employment centers and the present centerslack the necessary technical facilities.
Social assistance type of benefits as well as different forms of compulsory public workare getting a more and more important role in the system, especially in the case of long-term unemployed citizens. Zsuzsa Ferge’s4 ideas refer to Hungary, but they are relevantin the other two countries as well: “since 1991 the eligibility conditions for unemploy-ment benefit have deteriorated continuously. The replacement rate decreased, theconditions of access have become harsher, and the amount of benefit has declined comparedeven with the minimum wage. These steps may be seen as the expression of the will toreduce the anti-incentive effect of the provisions. The side-effect, though, has been tomake the situation of the unemployed extremely difficult. Poverty has hit many families,particularly those with the head of the family being unemployed.”

47
8.2 Family Support
Family support systems may be composed of various measures.5 Historically speaking,family provisions have evolved within the framework of social insurance systems. Familyallowance, for example, has been transformed from this type of benefit into a universal(demogrant) benefit in most developed countries over the past few decades. Socialassistance, based on means testing, is generally targeted toward children or families withchildren, in order to reduce poverty. In addition to these three forms of family provisions,personal income tax systems may contain social policy measures as well. The criteria ofentitlement, the level and the change of the value of benefits, the ratio and role of thedifferent types of benefits as well as the system of indexation differentiate the variousfamily support systems in the three countries.
The former states of the Soviet Union inherited an underdeveloped cash-benefit familysupport system in contrast to the other countries in what was then the Eastern Bloc.Services such as nurseries, kindergartens, day-care services, etc., however, were fairly welldeveloped. Family allowance, the most important element of income maintenance offamilies with children, was inaugurated in 1990, and has since been continuously modifiedby the successor states. In Hungary, a high-level income transfer system is to supplementthe extended network of services.
The rapid establishment of new means of family support (family allowance, differenttypes of child-care leave) occurred during the first few years after the former republics,and satellites, of the Soviet Union gained independence. The tenability of these supportsystems soon became a major problem, however. The Baltic countries, including Latvia,had more or less stabilized their social protection systems by the end of the 1990s dueto their relatively better economic situation. In Ukraine, however, social support completelylost its significance because of economic depreciation on the one hand, and problemswith the enforceability of entitlements to social support and delays in the distribution ofstate income transfers on the other. A special feature of this situation concerned youngfamilies: the extensive system of child-care institutions (nurseries, kindergartens), typicalof the socialist area, collapsed soon after 1990.
Fundamental changes of the system occurred later in those countries (e.g. Hungary)that had enjoyed extended, high-level family support systems.
International organizations paid special attention to family support schemes whenanalyzing the social protection systems of the CEE countries. In 1993, the World Bankoffered financial support to the Ukraine to increase family allowances aimed primarilyat low-income families. Because of uncertainty in determining incomes, the WorldBank suggested the targeting of specific groups in society, such as single parent familiesand families with three or more children.
The International Monetary Fund also urged better targeting of social services andthe introduction of family benefits based on means testing in many countries of the
T H E I M PA C T O F D E C E N T R A L I Z AT I O N O N S O C I A L P O L I C Y I N H U N G A R Y, L AT V I A A N D U K R A I N E
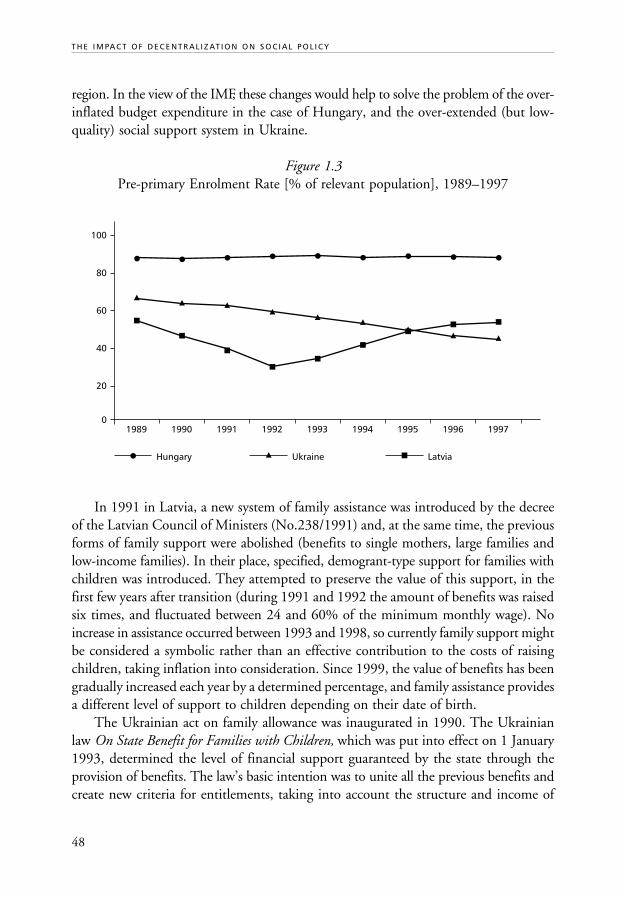
48
T H E I M PA C T O F D E C E N T R A L I Z AT I O N O N S O C I A L P O L I C Y
region. In the view of the IMF, these changes would help to solve the problem of the over-inflated budget expenditure in the case of Hungary, and the over-extended (but low-quality) social support system in Ukraine.
Figure 1.3Pre-primary Enrolment Rate [% of relevant population], 1989–1997
In 1991 in Latvia, a new system of family assistance was introduced by the decreeof the Latvian Council of Ministers (No.238/1991) and, at the same time, the previousforms of family support were abolished (benefits to single mothers, large families andlow-income families). In their place, specified, demogrant-type support for families withchildren was introduced. They attempted to preserve the value of this support, in thefirst few years after transition (during 1991 and 1992 the amount of benefits was raisedsix times, and fluctuated between 24 and 60% of the minimum monthly wage). Noincrease in assistance occurred between 1993 and 1998, so currently family support mightbe considered a symbolic rather than an effective contribution to the costs of raisingchildren, taking inflation into consideration. Since 1999, the value of benefits has beengradually increased each year by a determined percentage, and family assistance providesa different level of support to children depending on their date of birth.
The Ukrainian act on family allowance was inaugurated in 1990. The Ukrainianlaw On State Benefit for Families with Children, which was put into effect on 1 January1993, determined the level of financial support guaranteed by the state through theprovision of benefits. The law’s basic intention was to unite all the previous benefits andcreate new criteria for entitlements, taking into account the structure and income of
0
20
40
60
80
1989
100
1990 1991 1992 1993 1994 1995 1996 1997
Hungary Ukraine Latvia

49
families as well as the age and health-conditions of children. According to the law, statebenefits are calculated as a percentage of minimum salary. Low-income families becameentitled to extra support. The local governments might have granted benefits fromtheir own budget as well. The situation in Ukraine, however, is determined by thecontinuously deteriorating economic indexes. In 1996, Ukraine’s GDP stood at only43% of its 1990 level. The declared and undeclared rates of unemployment have beenincreasing continuously; recession has been coupled with hyperinflation; the consumerprice index is now 165,000 times higher than it was in 1990, while average wages arenow only 56,000 times higher.6 Since 1996, any increase in the amount of benefits hasbeen entirely incidental, and has not been adjusted for any social indicators.
According to the government’s concept concerning the reforms of social policy, thevarious currently functioning family assistance schemes in the Ukraine should be unified,their overlapping components should be terminated, and families that are left out of theschemes should be re-integrated into them.
The lack of appropriate financial resources, however, precludes the proper imple-mentation of the law On State Benefit for Families with Children. Under these conditionsthe government aimed at providing extra measures to reduce poverty among familieswith children through regular targeted benefits based on the assessment of the financialsituation of the families.
In Hungary, the family allowance scheme functioned within the framework of thesocial insurance system and has been considered to be the most decisive element of thefamily support system. At the beginning of the 1990s, pro-natalist measures were intro-duced to influence the disadvantageous demographic processes and to strengthen thetraditional family models and roles.
Table 1.14Rate of Fertility in the Central Eastern-European Countries from 1980 to 1998
Country 1980 1990 1995 1998*
Latvia 1.88 2.02 1.25 1.1
Ukraine 1.95 1.90 1.40 1.4
Hungary 1.90 1.80 1.60 1.3
* SOURCE OF DATA FOR1998: World Health Report, WHO, 1999.SOURCE: TransMONEE, Unicef, 2000.
In the middle of the 1990s, benefits became means tested, resulting neither in cutsin the budget, nor in the improvement of the living conditions of low-income families.Since 1998, the direction of the reforms has changed: the system of tax allowances isopenly in favor of the middle classes, and handles low-income families residually. Although
T H E I M PA C T O F D E C E N T R A L I Z AT I O N O N S O C I A L P O L I C Y I N H U N G A R Y, L AT V I A A N D U K R A I N E

50
T H E I M PA C T O F D E C E N T R A L I Z AT I O N O N S O C I A L P O L I C Y
family allowances became universal after 1998, social assistance—in the form of regularchild protection benefit—gained an important role in poverty relief. This kind of solutionis unprecedented both in the post-socialist countries and in the member states of the OECD.
Table 1.15Types of Family Allowance at the End of the 1990s
Country Type of Entitlement Main Features of the Benefit FinancingBenefit
Latvia State Universal benefit 15 Varying amount, depending on the child’s Statebenefit (20 if the person is at date of birth (amount of benefit is less for budget
a secondary school) children who were born before1 January 1999, than of those
who were born later)7
Hungary State Universal benefit 16 Family with one child: HUF 3,800; Statebenefit (20 if the person is a Single-parent family with one child: budget
student of an institute HUF 4,500;of public education) Family with two children:
HUF 4,700/child;Single-parent family bringing uptwo children: HUF 5,400/child;
Family with three or more children:HUF 5,900/child;
Single-parent family with three or morechildren: HUF6,300/child;In case of permanently ill or
handicapped child: HUF 7,5008
Ukraine State Partly means tested Child under 16 years: 50% of the minimum Statebenefit with demogrant type wage in single parent families; budget
of targeting 16 Three children under 16 years: 100%(18 if the person of the minimum wage per family;
is a student) Four children under 16 years old: 200%of the minimum wage per family
SOURCES: Social Security 1999, MISSCEEC 1999, European Council 1999, Phare Consensus 1999, SocialReport—Latvia 1999, Social Report— Lithuania 1999, UNICEF 1999, Social Policy … 1999.
Family allowance plays the most important role in poverty relief. According tovarious data sources, in the majority of the former socialist countries, the real value ofthe family allowance schemes decreased continuously throughout the 1990s.
Various analytical works illustrate that the decreasing value of the family allowancehas hit low-income families the hardest. Although this decrease has affected all familieswith children, those who have been most seriously affected are families with three ormore children and households without appropriate “market” income (i.e. they only have
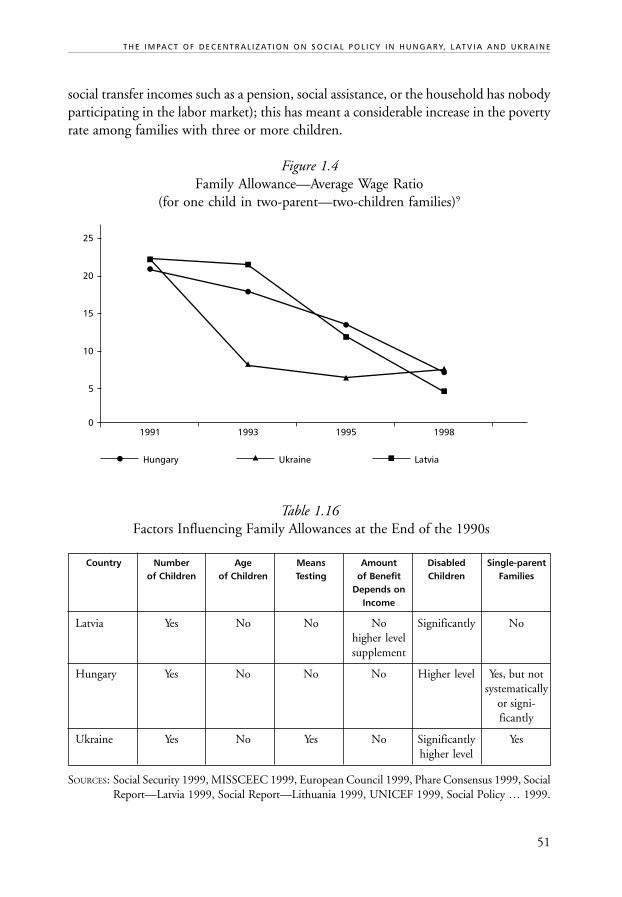
51
social transfer incomes such as a pension, social assistance, or the household has nobodyparticipating in the labor market); this has meant a considerable increase in the povertyrate among families with three or more children.
Figure 1.4Family Allowance—Average Wage Ratio
(for one child in two-parent—two-children families)9
Table 1.16 Factors Influencing Family Allowances at the End of the 1990s
Country Number Age Means Amount Disabled Single-parentof Children of Children Testing of Benefit Children Families
Depends onIncome
Latvia Yes No No No Significantly Nohigher levelsupplement
Hungary Yes No No No Higher level Yes, but notsystematically
or signi-ficantly
Ukraine Yes No Yes No Significantly Yeshigher level
SOURCES: Social Security 1999, MISSCEEC 1999, European Council 1999, Phare Consensus 1999, SocialReport—Latvia 1999, Social Report—Lithuania 1999, UNICEF 1999, Social Policy … 1999.
0
5
10
15
20
1991
25
Hungary Ukraine Latvia
1993 1995 1998
T H E I M PA C T O F D E C E N T R A L I Z AT I O N O N S O C I A L P O L I C Y I N H U N G A R Y, L AT V I A A N D U K R A I N E
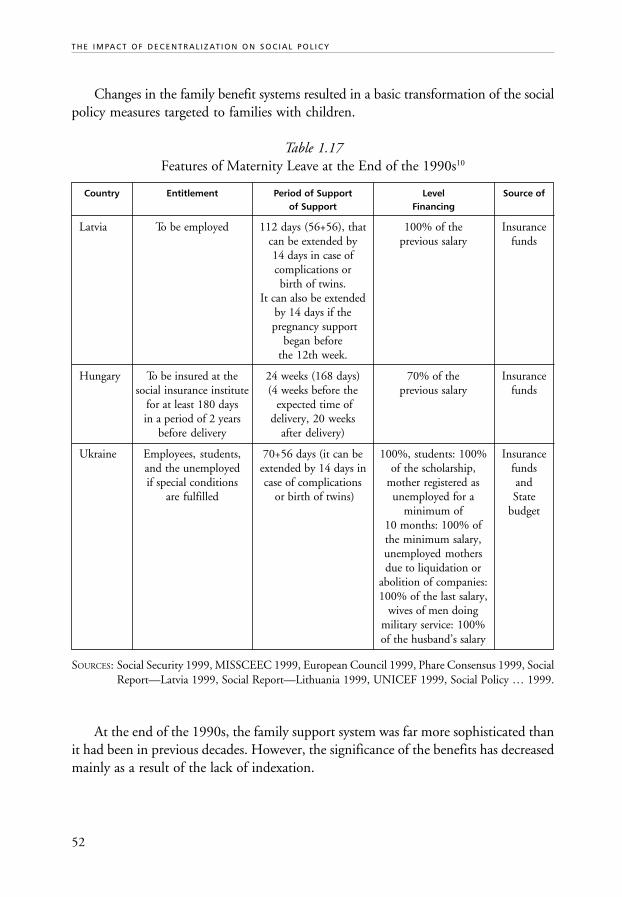
52
T H E I M PA C T O F D E C E N T R A L I Z AT I O N O N S O C I A L P O L I C Y
Changes in the family benefit systems resulted in a basic transformation of the socialpolicy measures targeted to families with children.
Table 1.17Features of Maternity Leave at the End of the 1990s10
Country Entitlement Period of Support Level Source ofof Support Financing
Latvia To be employed 112 days (56+56), that 100% of the Insurancecan be extended by previous salary funds14 days in case ofcomplications orbirth of twins.
It can also be extendedby 14 days if the
pregnancy supportbegan before
the 12th week.
Hungary To be insured at the 24 weeks (168 days) 70% of the Insurancesocial insurance institute (4 weeks before the previous salary funds
for at least 180 days expected time ofin a period of 2 years delivery, 20 weeks
before delivery after delivery)
Ukraine Employees, students, 70+56 days (it can be 100%, students: 100% Insuranceand the unemployed extended by 14 days in of the scholarship, fundsif special conditions case of complications mother registered as and
are fulfilled or birth of twins) unemployed for a Stateminimum of budget
10 months: 100% ofthe minimum salary,unemployed mothersdue to liquidation or
abolition of companies:100% of the last salary,
wives of men doingmilitary service: 100%of the husband’s salary
SOURCES: Social Security 1999, MISSCEEC 1999, European Council 1999, Phare Consensus 1999, SocialReport—Latvia 1999, Social Report—Lithuania 1999, UNICEF 1999, Social Policy … 1999.
At the end of the 1990s, the family support system was far more sophisticated thanit had been in previous decades. However, the significance of the benefits has decreasedmainly as a result of the lack of indexation.
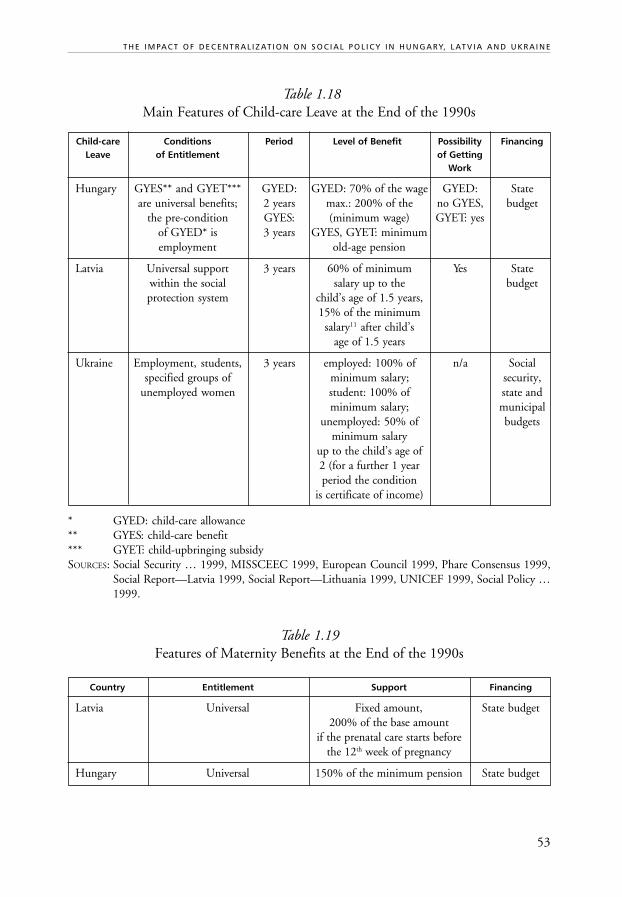
53
Table 1.18Main Features of Child-care Leave at the End of the 1990s
Child-care Conditions Period Level of Benefit Possibility FinancingLeave of Entitlement of Getting
Work
Hungary GYES** and GYET*** GYED: GYED: 70% of the wage GYED: Stateare universal benefits; 2 years max.: 200% of the no GYES, budget
the pre-condition GYES: (minimum wage) GYET: yesof GYED* is 3 years GYES, GYET: minimumemployment old-age pension
Latvia Universal support 3 years 60% of minimum Yes Statewithin the social salary up to the budgetprotection system child’s age of 1.5 years,
15% of the minimumsalary11 after child’s
age of 1.5 years
Ukraine Employment, students, 3 years employed: 100% of n/a Socialspecified groups of minimum salary; security,
unemployed women student: 100% of state andminimum salary; municipal
unemployed: 50% of budgetsminimum salary
up to the child’s age of2 (for a further 1 yearperiod the condition
is certificate of income)
* GYED: child-care allowance** GYES: child-care benefit*** GYET: child-upbringing subsidySOURCES: Social Security … 1999, MISSCEEC 1999, European Council 1999, Phare Consensus 1999,
Social Report—Latvia 1999, Social Report—Lithuania 1999, UNICEF 1999, Social Policy …1999.
Table 1.19Features of Maternity Benefits at the End of the 1990s
Country Entitlement Support Financing
Latvia Universal Fixed amount, State budget200% of the base amount
if the prenatal care starts beforethe 12th week of pregnancy
Hungary Universal 150% of the minimum pension State budget
T H E I M PA C T O F D E C E N T R A L I Z AT I O N O N S O C I A L P O L I C Y I N H U N G A R Y, L AT V I A A N D U K R A I N E
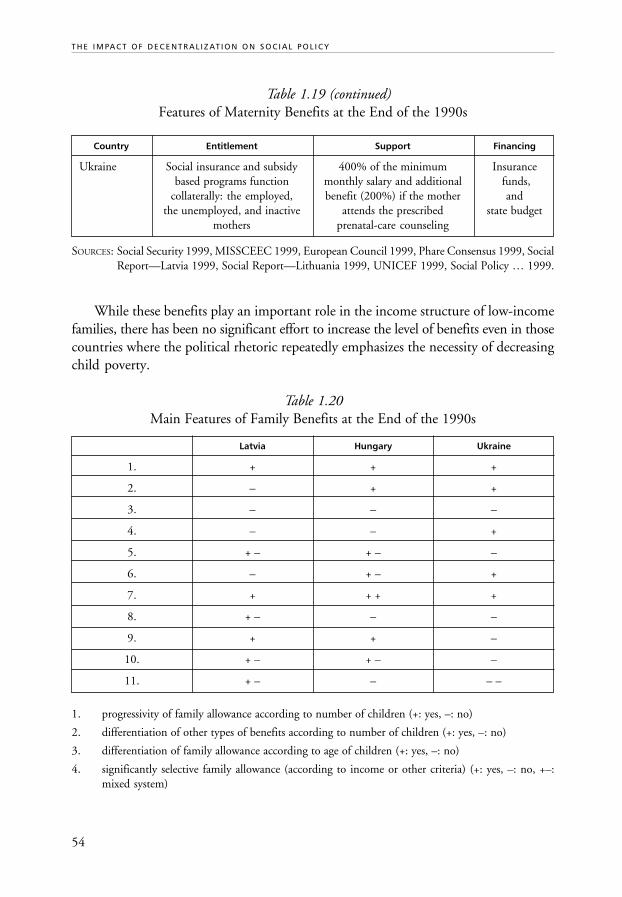
54
T H E I M PA C T O F D E C E N T R A L I Z AT I O N O N S O C I A L P O L I C Y
Table 1.19 (continued)Features of Maternity Benefits at the End of the 1990s
Country Entitlement Support Financing
Ukraine Social insurance and subsidy 400% of the minimum Insurancebased programs function monthly salary and additional funds,
collaterally: the employed, benefit (200%) if the mother andthe unemployed, and inactive attends the prescribed state budget
mothers prenatal-care counseling
SOURCES: Social Security 1999, MISSCEEC 1999, European Council 1999, Phare Consensus 1999, SocialReport—Latvia 1999, Social Report—Lithuania 1999, UNICEF 1999, Social Policy … 1999.
While these benefits play an important role in the income structure of low-incomefamilies, there has been no significant effort to increase the level of benefits even in thosecountries where the political rhetoric repeatedly emphasizes the necessity of decreasingchild poverty.
Table 1.20Main Features of Family Benefits at the End of the 1990s
Latvia Hungary Ukraine
1. + + +
2. – + +
3. – – –
4. – – +
5. + – + – –
6. – + – +
7. + + + +
8. + – – –
9. + + –
10. + – + – –
11. + – – – –
1. progressivity of family allowance according to number of children (+: yes, –: no)
2. differentiation of other types of benefits according to number of children (+: yes, –: no)
3. differentiation of family allowance according to age of children (+: yes, –: no)
4. significantly selective family allowance (according to income or other criteria) (+: yes, –: no, +–:mixed system)
55
5. significantly higher level of support for single-parent families (longer period of leaves: +, significantlyhigher level of benefits: +, this aspect has a lesser significance: +–, no: –)
6. normative, undefined targeted benefits
7. child-care leaves of significant length (3 or more years) (+: 3 years, –: less than 3 years, + +:more than 3 years)
8. demogrant-type of benefits (+: yes, –: no, + –: mixed)
9. tax allowances (+: yes, –: no)
10. guaranteed, calculable support (+: remains unrevised for a number of years, value of benefits iscalculable in advance, –: frequent changes and/or lack of definite conception, value of changes inbenefits is incalculable in advance, + –: mixed)
11. indexing of the basic benefits (+: yes, –: no, + –: partly, – –: lack of minimum guarantees)
In spite of the differences in the family protection systems in the three countries,there are some important common features that impact families with children.
• The existing systems cannot solve the problem of child poverty.• There are no adequate measures to maintain the real value of the cash benefits.• The freedom of choice of women is restricted due to the labor market processes
(unemployment), the low income of families, and the shrinking capacity of cheapday care services for children.
• Pro-natalist ideas play a role in the formation of the family protection system.• The lack of steady, well calculable, rights-based systems increases the vulnerability
of families with children.• Social assistance measures play an increasing role in the family protection systems
of all of three countries.• The basic responsibility for social assistance falls within the competence of local
governments. This decentralized solution may render possible a more reliableneeds’-assessment, but sets limits to the guarantees of social security for familieswith children and occasionally results in discrimination against certain, so-called“undeserving families.”
In Hungary, the introduction of regular, flat-rate child protection benefits, which wasprovided as of right for every needy child, was a considerable step in the reform of thesocial assistance system in Hungary in 1997. The official goal of the benefit was to gua-rantee a subsistence level and to ensure that children are brought up in their own families.But without basic changes in the family support system this benefit cannot eliminatechild poverty. Nor can it prevent further impoverishment of children or stop the childprotection authorities from taking children away from their families for financial reasons.This benefit is both income-dependent and property-dependent, and in controlling itlocal governments have considerable freedom to act on various considerations followinghome-visits. In the 9th district of Budapest, for instance, before the introduction of the
T H E I M PA C T O F D E C E N T R A L I Z AT I O N O N S O C I A L P O L I C Y I N H U N G A R Y, L AT V I A A N D U K R A I N E

56
T H E I M PA C T O F D E C E N T R A L I Z AT I O N O N S O C I A L P O L I C Y
compulsory property test, families with a car—with the exception of seriously disabledpeople—were excluded from some cash benefits as it was said that if they have resourcesto run a car, then they are not so poor.
8.3 Social Services
8.3.1 Historical Background
In each of the three countries, different social care institutions have been functioning fora long time, though these institutions focus almost exclusively on the field of residentialcare. The predominant institutions of residential care are hospital-like institutions, nursing-home institutions for the elderly and disabled, and Soviet-type foster-homes. These aretypically huge institutions providing residence for several hundred to several thousandpeople. (Some of the institutions for children in state care were so large that they werecommonly referred to as “children’s cities.”)
The social service sector, dominated by residential care institutions, played a partialrole in covering up serious problems that existed in the social sector as a whole. The attemptto hide deficiencies in the system was successful because people felt ashamed to need thesekinds of provisions, and silently accepted the poor living conditions and poor treatmentoffered by these institutions. Social care in this form proved to be a paternalistic exercisein these countries, in comparison with tolerant and sensitive Western norms.
The survival of this social care structure cannot be explained by political and value-oriented circumstances alone. Rather, a number of pragmatic factors contributed to itsbeing maintained. These institutions acted as “factories of social care” based on the relativelyeasy management and control of the clients and programs. Their “machinery” was oftenoperated by employees who lacked professional skills and training.
8.3.2 Political and Administrative Constraints
Two controversial but fundamental preconditions should be recognized with respect topolitical and administrative constraints on the social services sector. On the one hand,social work and care are fundamental cornerstones of any political program because theyunderline the importance of local responsibilities in the social sector. On the other hand,social work and care issues are the most problematic areas when designing, managing andadministering any social policy scheme. They are relatively costly: the per-capita pricesare always higher than the expenses of the cash benefit programs. They require verysophisticated and developed “technology” to obtain the desired results, to finance, monitor
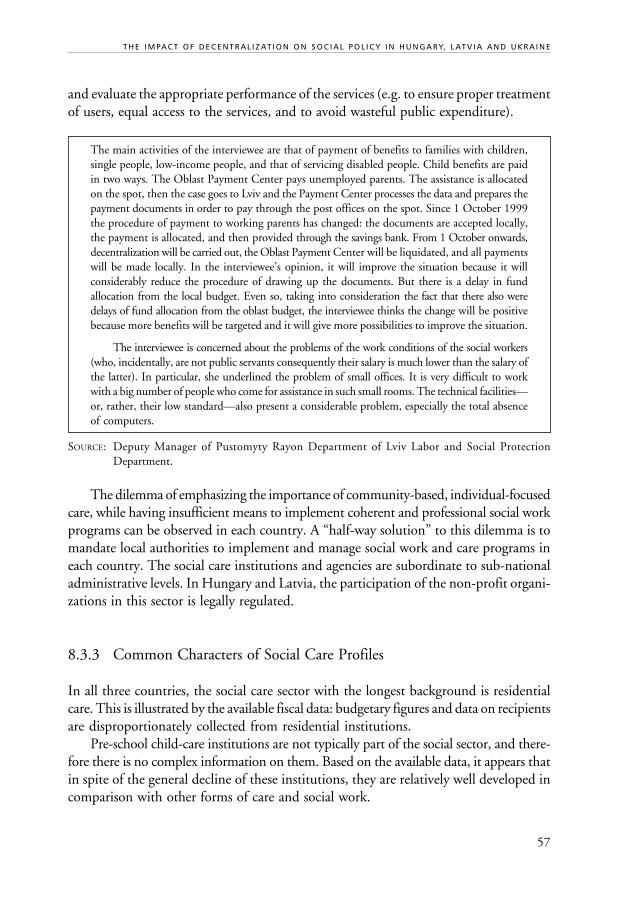
57
and evaluate the appropriate performance of the services (e.g. to ensure proper treatmentof users, equal access to the services, and to avoid wasteful public expenditure).
The main activities of the interviewee are that of payment of benefits to families with children,single people, low-income people, and that of servicing disabled people. Child benefits are paidin two ways. The Oblast Payment Center pays unemployed parents. The assistance is allocatedon the spot, then the case goes to Lviv and the Payment Center processes the data and prepares thepayment documents in order to pay through the post offices on the spot. Since 1 October 1999the procedure of payment to working parents has changed: the documents are accepted locally,the payment is allocated, and then provided through the savings bank. From 1 October onwards,decentralization will be carried out, the Oblast Payment Center will be liquidated, and all paymentswill be made locally. In the interviewee’s opinion, it will improve the situation because it willconsiderably reduce the procedure of drawing up the documents. But there is a delay in fundallocation from the local budget. Even so, taking into consideration the fact that there also weredelays of fund allocation from the oblast budget, the interviewee thinks the change will be positivebecause more benefits will be targeted and it will give more possibilities to improve the situation.
The interviewee is concerned about the problems of the work conditions of the social workers(who, incidentally, are not public servants consequently their salary is much lower than the salary ofthe latter). In particular, she underlined the problem of small offices. It is very difficult to workwith a big number of people who come for assistance in such small rooms. The technical facilities—or, rather, their low standard—also present a considerable problem, especially the total absenceof computers.
SOURCE: Deputy Manager of Pustomyty Rayon Department of Lviv Labor and Social ProtectionDepartment.
The dilemma of emphasizing the importance of community-based, individual-focusedcare, while having insufficient means to implement coherent and professional social workprograms can be observed in each country. A “half-way solution” to this dilemma is tomandate local authorities to implement and manage social work and care programs ineach country. The social care institutions and agencies are subordinate to sub-nationaladministrative levels. In Hungary and Latvia, the participation of the non-profit organi-zations in this sector is legally regulated.
8.3.3 Common Characters of Social Care Profiles
In all three countries, the social care sector with the longest background is residentialcare. This is illustrated by the available fiscal data: budgetary figures and data on recipientsare disproportionately collected from residential institutions.
Pre-school child-care institutions are not typically part of the social sector, and there-fore there is no complex information on them. Based on the available data, it appears thatin spite of the general decline of these institutions, they are relatively well developed incomparison with other forms of care and social work.
T H E I M PA C T O F D E C E N T R A L I Z AT I O N O N S O C I A L P O L I C Y I N H U N G A R Y, L AT V I A A N D U K R A I N E

58
T H E I M PA C T O F D E C E N T R A L I Z AT I O N O N S O C I A L P O L I C Y
It also seems clear that the most visible horizontal, rural–urban inequalities withinthe social sector exist in the social work and caring programs. Within cities, human resourcesand institutional capacities for social work are far more developed than those in the ruralcommunities. Rural populations are usually deprived of these types of personal and residentialsocial services. We have no figures from Latvia and Ukraine on home-delivered, community-based services, but the most detailed Hungarian data is meaningful in this respect. TheHungarian Social Act obliges local self-governments to perform three specific social workactivities: (1) daily child-care, (2) home care, (3) general social work (e.g. “family care”).However, only 8% of local authorities in larger cities are able to provide all three services.
The recent regulations clearly determine the responsibilities and competencies, but the controllingmechanisms or, in other words, the sanctions are missing. What would happen if a settlement doesnot provide a certain service defined in the Social Act as compulsory? Absolutely nothing! Just theneeds will not be met... Two factors determine the situation in a settlement: political relations andcash. Strategic planning is absent at local level. Decisions on the spectrum of services provided in agiven locality depend on the financial resources available to the local-self-government at the time.Nobody is really interested in whether there is any demand for the service, or whether it be sustainable.In reality, decisions whether a program is to be sponsored or refused are made centrally in the Ministry.The responsibility falls on the local self-government, but the purse strings are held in the Ministry.... In this respect the state plays a ping-pong game with all the actors who are at a lower level. Andit is impossible to outline long-term plans as everything changes every four years with the elections.
SOURCE: Head of a family care center, Hungary.
In Latvia and Ukraine, there are no specific objectives targeted at community-basedsocial work and care in the legal regulations. The language of the regulations is conditionalin this respect: local authorities may (or “are invited to”) implement such programs.
Because the regulation on social care services does not assign tasks according toactual capacity, the less-developed communities—often completely lacking in expertiseor capacity—are forced to call virtually anything “social work and care.” In several cases,social workers have been obliged to carry out all sorts of official duties, such as meanstesting and investigating the life-styles and “personal character” of the applicants (duringhome-visits). Very often, personal help is misused—taken as a pretext for exercisingdiscretion in judging the entitlement for cash-benefit programs.
The organizer of social work has mentioned a very serious problem: the dependence on socialbenefits that has developed among long-term clients.
SOURCE: Focus-group discussion, Dagda, Latvia.
In order to understand the context within which these types of practices occur, wemust understand that if the local poverty relief budgets are so low that they can onlyprovide relief at the poverty level—it is extremely difficult to determine who should
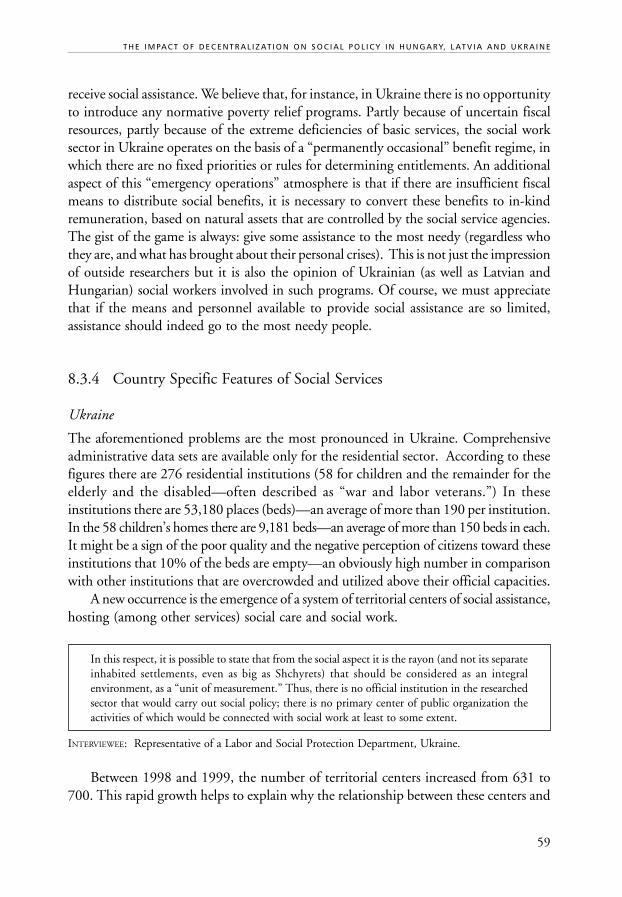
59
receive social assistance. We believe that, for instance, in Ukraine there is no opportunityto introduce any normative poverty relief programs. Partly because of uncertain fiscalresources, partly because of the extreme deficiencies of basic services, the social worksector in Ukraine operates on the basis of a “permanently occasional” benefit regime, inwhich there are no fixed priorities or rules for determining entitlements. An additionalaspect of this “emergency operations” atmosphere is that if there are insufficient fiscalmeans to distribute social benefits, it is necessary to convert these benefits to in-kindremuneration, based on natural assets that are controlled by the social service agencies.The gist of the game is always: give some assistance to the most needy (regardless whothey are, and what has brought about their personal crises). This is not just the impressionof outside researchers but it is also the opinion of Ukrainian (as well as Latvian andHungarian) social workers involved in such programs. Of course, we must appreciatethat if the means and personnel available to provide social assistance are so limited,assistance should indeed go to the most needy people.
8.3.4 Country Specific Features of Social Services
Ukraine
The aforementioned problems are the most pronounced in Ukraine. Comprehensiveadministrative data sets are available only for the residential sector. According to thesefigures there are 276 residential institutions (58 for children and the remainder for theelderly and the disabled—often described as “war and labor veterans.”) In theseinstitutions there are 53,180 places (beds)—an average of more than 190 per institution.In the 58 children’s homes there are 9,181 beds—an average of more than 150 beds in each.It might be a sign of the poor quality and the negative perception of citizens toward theseinstitutions that 10% of the beds are empty—an obviously high number in comparisonwith other institutions that are overcrowded and utilized above their official capacities.
A new occurrence is the emergence of a system of territorial centers of social assistance,hosting (among other services) social care and social work.
In this respect, it is possible to state that from the social aspect it is the rayon (and not its separateinhabited settlements, even as big as Shchyrets) that should be considered as an integralenvironment, as a “unit of measurement.” Thus, there is no official institution in the researchedsector that would carry out social policy; there is no primary center of public organization theactivities of which would be connected with social work at least to some extent.
INTERVIEWEE: Representative of a Labor and Social Protection Department, Ukraine.
Between 1998 and 1999, the number of territorial centers increased from 631 to700. This rapid growth helps to explain why the relationship between these centers and
T H E I M PA C T O F D E C E N T R A L I Z AT I O N O N S O C I A L P O L I C Y I N H U N G A R Y, L AT V I A A N D U K R A I N E
60
T H E I M PA C T O F D E C E N T R A L I Z AT I O N O N S O C I A L P O L I C Y
the sub-national level administration is somewhat ambiguous. The numerical data reflectsthis rather bleak picture. If we calculate very roughly, and compare the total budget ofthese centers (cca. UAH 130 million) with the total number of recipients (600,000people, including almost 50,000 living in residential institutions), we arrive at a per-capita monthly cost just above UAH 3.5. This illustrates both the “emergency help”character of social services, and the very poor performance of these programs.
Latvia
The Latvian case seems to be the most rapidly changing and developing in this sector.Latvian regulations have imported the most up-to-date norms and standards mostlyfrom the Nordic systems. Latvia has experienced something of a boom in social workeducation. This is an extremely “risky game”: if the regulation and this newly developededucation are able to improve the social service system, this very ambitious developmentplan will have been worth the investment. If, on the other hand, the regulations expressonly lofty ideals and unattainable goals, they could work to undermine popularconfidence in the rule of law and trust in the constitutional order. Likewise, if the neweducation can introduce new ideas of professional performance, it could serve as anengine of development. If there are no appropriate jobs for the graduates, however, thecommon perception will be that studying social work is a waste of time.
Concerning the regulation of social services, there exists a very modern andsophisticated system of regulations, including clear objectives and targets of differentschemes. However, the means of governance, including the appropriate informationand monitoring tools, are relatively weak in terms of following up on ongoingdevelopments on the basis of a wide variety of regulations and schemes.
The most difficult tools for institutionalizing government programs are the nationalaccounts and the budgetary plans. Looking at the structure of fiscal planning, we cansee a much more differentiated structure than that in Ukraine. In particular, the Latviancase provides a picture of a differentiated structure in programs targeting problemedchildren and young people, and in the traditional residential sector providing assistanceto the elderly and disabled.
The distribution of budgets shows an extreme concentration of social services expen-ditures in the residential services (LVL 22.7 million in 1999 to provide for 2,439 childrenand 4,424 elderly and disabled residents), while less money is spent on other care andservices (pre-school childcare: LVL 7 million, other community-based social services:LVL 5.8 million). In the care sector, there is a staff of 818—among them 56 receivededucation in professional social work, 17 received secondary level social work education,and 210 received other high level education. It is illustrative that more than one quarterof the staff educated at high school (non-social work) attend training courses in socialwork.
61
Hungary
The Hungarian supply of social work and care can be considered to be well-developedstructure. The menu of different forms of personal assistance is almost as long as it is in inWestern Europe. We might characterize the Hungarian social care sector as comprising ahighly innovative, diverse set of different programs, institutions and organizations. This canbe explained in part by the longer tradition of extended university and high school leveleducation, by the fact that more than 10,000 non-governmental organizations are activein this field, and also by the large number and high level of autonomy of local authorities.
The size of the social care sector, especially the size of community-based services,appears to be large in comparison with the other two countries in this study. Accordingto 1998 data, 60,000 inhabitants live in long-term residential institutions (among them35,000 elderly people), and nearly 10,000 people live in temporary care institutions(7,000 in shelters for the homeless and other shelter homes). The total public expenditureon residential care in 1998 was HUF 38 billion. More than 1 million elderly anddisabled recipients were served by social catering—“meals on wheels”—services, and41,300 were cared for at home. The budget of community-based care was more thanHUF 15.3 billion in 1998. About 20% of service providers are non-governmentalorganizations, and their contribution is highest in the field of residential care, with aspecial focus on “new” high-risk groups, such as the homeless and drug addicts.
8.3.5 Financing Social Services
Social services are part of the welfare budgets, having no special category in Latvia or theUkraine. The Hungarian case provides some unusual lessons on decentralizing this kindof public duty.
Local authorities finance the costs of “home delivered,” community-based servicesfrom their regular (welfare) budgets based on central government general social grants.
In Hungary, the social service and cash benefit budgets are amalgamated in onebudgetary category at the local level, creating strange incentives in operating these budgets.If a mayor wants to optimize the value they can give to their voters, then all these budgetsshould be spent on cash benefit programs. This is not only because the relative admi-nistrative costs are much lower in that case, but also because the net profit of the localpopulation will be almost equal to the expenditure of the municipality, if only moneyis offered. If the authorities operate and finance social work and social care organizations(public or private) they must pay social insurance contributions, personal income taxesand other revenues back to the central budget. The result is that if the municipalityprovided funding for care or social work, the net “profit” of the municipality’s inhabitantsis sometimes less than the half of the amount spent by the authority. The result is that
T H E I M PA C T O F D E C E N T R A L I Z AT I O N O N S O C I A L P O L I C Y I N H U N G A R Y, L AT V I A A N D U K R A I N E
62
T H E I M PA C T O F D E C E N T R A L I Z AT I O N O N S O C I A L P O L I C Y
the local authorities try to avoid managing service-like social programs, even if they arelegally obliged to do so.
The central budget contributes a lump sum, per capita calculated grant (the publicresidential institutions are owned by counties) towards the relatively high expenditureon residential care. This share of competencies generates a kind of “ping-pong match”between counties and local authorities in determining who should bear the responsibilityfor those frail, “expensive clients” for whom it is costly to provide appropriate services.The question of whether the responsible institution should be locally administered homecare agencies or county-managed residential homes is a source of significant inter-institutional tension. (This kind of game is well known throughout the world betweenchronic departments in hospitals and long-term social care institutions.) This seems tobe a pragmatic decision: if the relative costs are higher, and services of appropriate qualitycan be ensured only by incurring higher costs, the state should finance a significant partof those high costs. However, this generates further difficulties.
For instance, the higher income orients the public and private “entrepreneurs insocial care” toward the residential sector, which is often criticized from an economicstandpoint (too expensive) as well as from a professional standpoint (it is preferable tohelp people to live on their own when possible).
The “sector-neutral” normative granting also seems to be very attractive. On the otherhand, private (market-based NGOs) organizations are interested in maximizing theirincomes, and minimizing their expenditures. The easiest way to maximize income is toraise the fees paid by clients. It is very difficult to implement any form of “defense of theconsumer,” or to ensure fee-related value of services. High fees however are not just aproblem of the “weak individual consumer” against the “unfair, powerful provider.” Highfees result in a “creaming effect,” whereby only financially better off elderly or disabledpeople can enjoy these public services, or the public subsidies of these services. As thereare long waiting-lists in this sector, the perverse nature of the distribution is even stranger:if an elderly person has no money, in spite of the public judgement that they would needresidential care, they usually wait, on average, two years for placement. This also meansthat they do not receive public support while waiting for the services.
The private-, the Church-owned, and other types of non-profit organizations endeavor to solvethe social problems but they do not advance the fulfillment of the duties of the County self-government. These organizations cream-off those people who need social services. The clients ofthese organizations have to pay a larger initial sum, higher regular fees, or offer real estate to theservice provider despite not needing full care. The County Self-government is left with thepoorest people who are not able to pay the full fee and whose health is frail and would thus needfull care. These civic organizations get a state grant and may well provide services of higherquality with their additional resources than those run by the self-government.
SOURCE: Head of Department of Health and Welfare of county self-government in Hungary.
63
If someone has enough money to pay the fees in a private residential institution,they not only buy the services but also “buy” the normative per-capita grant for contributingto the costs of their residential care.
In conclusion, we can learn from the Hungarian example that the most developedfiscal measures (normative, sector-neutral grants, co-payments, etc.) can play an importantrole in capacity development, but they are an insufficient means for ensuring appropriatemanagement incentives for equitable distribution or fair, proper quality of services.
8.3.6 Professional Standards
Social work as a specific profession, or as a field of specialized training does not have along history in Hungary, Latvia or Ukraine. Social work education has its deepest rootsin Hungary, having existed for nearly twenty years, but professional social work trainingstarted only in the late 1980s. In Latvia, huge investments have been made in recentyears in the area of social work education, with the intensive support and technicalassistance of several Nordic countries. In Ukraine, education in social work remains inan experimental phase.
8.3.7 Supervisory Mechanisms
If one and the same body (bodies) is (are) mandated with providing social services as wellas exercising controlling power over the performance of those services, conflicts of interestmay occur. This situation is characteristic of social work and caring activities. The localauthorities have a somewhat schizophrenic status in this business: they are committedto be economically efficient owners of these services, but they must monitor themselves.Of course, it is impossible to monitor everything from outside, but it would be far moredemocratic to implement some kind of separation of powers not only at the central,but also at the local level. From this constitutional perspective, the lack of controllingmechanisms is easily criticized.
In each of the three countries, some form of fiscal control over social service provisionsis performed, according to the general relevant rules for sub-national administrative levels.The existing tools of fiscal control can monitor the budgetary rules, but they are unableto monitor financial efficiency, whether the actual spending is goal-oriented, rational,or to the advantage of those receiving the services.
Quality control or consumer protection systems exist only in the field of “classical”child protection schemes. In Latvia and Hungary the judicial/legal branch (custody courtsin Latvia, the public prosecutor’s office in Hungary) controls the service providers in
T H E I M PA C T O F D E C E N T R A L I Z AT I O N O N S O C I A L P O L I C Y I N H U N G A R Y, L AT V I A A N D U K R A I N E

64
T H E I M PA C T O F D E C E N T R A L I Z AT I O N O N S O C I A L P O L I C Y
order to ensure proper implementation of services and treatment in the fields of childprotection and youth probation.
There is no social assistance in the rayon regarding individuals of unsound minds and familieswith such individuals. There are neither mental hospitals nor boarding homes though there aresuch people in the rayon. “There is some law, but I haven’t read it yet. I’ll have to find it,” theprofessional expert confessed.
There is, in fact, no such law. Issues concerning the social protection of persons of unsoundmind are to be found in various legal articles, such as “The Law on State Benefits for Familieswith Children,” “The Code on Family and Marriage,” “Pensions/Benefits Law,” “Legal Funda-mentals on Health Protection.” There is an impression that the respondent is thoroughlyindifferent to this category of people as well as being incompetent.
SOURCE: Head of a Rayon Labor and Social Protection Department, Ukraine.
In practice, none of the three countries in question has the means to ensure the justdistribution or accessibility of the services, or the process of targeting the services towardssociety’s most needy and vulnerable groups, families, and individuals.
8.4 Social Assistance
Social assistance measures (cash benefits based on selection) and safety net programs aredecisive elements of different types of social policy regimes. The transition process in theCEE countries from the command-based to a market-based economy took place duringa period in which both political and economic forces argued for the advantages of neo-liberal solutions. Thus, the new CEE states simultaneously had to lay the basis for theirsocial protection systems (by creating independent social insurance funds and organiza-tional bodies, and designing legislative frameworks for social policy), and dismantle theexisting welfare institutions that were declared to be too costly. These countries thereforefell into the trap of creating a welfare system while making cuts in social expenditures inorder to mitigate budgetary crises. Furthermore, these processes took place during a periodof high unemployment, increasing poverty and social inequalities, an aging populationcrisis, and other difficult challenges. The new social policy sector was charged with findingan answer to these problems. It was hoped that this sector could help to improve thequality of life of millions of people, to prevent the impoverishment of the middle classes,and to provide assistance to meet the basic needs of those living in extreme poverty.
The legacy of the past, especially in the case of Ukraine and to a lesser extent Latviaand Hungary, resulted in special difficulties for the creation of new welfare systems. Asa consequence of the central role played by the army during the Communist period, theimportance of certain branches of the economy (such as mining), and the large number
65
of people affected by the Chernobyl disaster, a huge (especially in Ukraine) system oftargeted benefits and services or, in other words, of privileges was established.
The moral and humanitarian foundation of these provisions is based on a historicalpolitical compromise made between the norms of the Soviet past and those of the newlyindependent states. The granting of any kind of privileges, however, contradicts theprinciple of equal treatment—the basic political right in any democratic system. Moreover,it is impossible to compare factors contributing to low labor market participation andlow incomes (disability due to war, structural unemployment, etc.). The legacy of thepast places a great burden on the new social protection systems because any move awayfrom previously instituted norms becomes highly sensitive politically.
One could easily arrive at the conclusion that any kind of income-based cash benefitscheme would be more democratic and equitable than this current compromise. Thereare other factors, however, that contradict this assumption. For example, all three countrieshave been hard hit by the problems related to the “shadow” (informal) economy, makingany kind of income test unrealistic. (In Ukraine, its proportion is the largest relative to thenormal economy. According to World Bank estimates, the informal economy accountsfor 47% of its total GDP.)
Selection based social assistance programs may be founded on normative selection(eligibility criteria formulated in legal regulations) and may be exercised according to thediscretion of certain organizational units or that of the bureaucracy. In the latter casethe risk of infringing upon rights of the beneficiaries is stronger.
Social assistance systems—whatever other kinds of factors are taken into considerationwhen deciding on the eligibility criteria—are primarily based on means testing. In allthree countries, selection is based on income, property, work, and behavior tests.
The purpose of means testing is partly to relate the recipient’s income to a certain“official” standard, the administrative poverty line. In this respect the three countriesexercise different practices. In Hungary, the minimum old-age pension is consideredthe appropriate indicator, or relating point. In Latvia the consumer’s basket is used formeans testing, and in Ukraine the Parliament sets the poverty line and all the basic socialpayments are calculated on the basis of the minimum wage. The three countries use theper capita household income as the “basic measuring unit” of income when decidingon social assistance entitlements.
The most relevant forms of income-tested social assistance in the three countriesare some form of regular social assistance for low-income families and housing allowances.
Targeted assistance to poor families became available in Ukraine beginning in April1999. This benefit aimed at providing certain types of low-income families with a minimumguaranteed income. According to statistical data from January 2000, more than 30,000families applied for the benefit, of which 7,165 families (23%) were provided with it—a figure that definitely does not reflect the number of those living in extreme poverty.(The average sum of the grantee benefit was UAH 12 per month.)
T H E I M PA C T O F D E C E N T R A L I Z AT I O N O N S O C I A L P O L I C Y I N H U N G A R Y, L AT V I A A N D U K R A I N E

66
T H E I M PA C T O F D E C E N T R A L I Z AT I O N O N S O C I A L P O L I C Y
In Latvia, low-income family assistance is paid if family income is below LVL 12per family member per month or if it is less than 75% of the crisis subsistence minimumper family member established by the Cabinet of Ministers. The amount of benefit iscalculated as the difference between LVL 12 per family member and the total income ofthe poor family. Additionally, a family is recognized to be poor if: (1) it does not havefiscal resources exceeding LVL 200 per month, (2) it does not own any property whosevalue is greater than LVL 3,000, or (3) it has no providers who are able to provide foodand it has not entered into agreements on the supply of food.
In Hungary, long-term unemployed people and elderly citizens not entitled to pensionsare generally the beneficiaries of regular social assistance. (The new name of the provisionor elderly citizens is “old-age benefit.”)
In Latvia, if a person earns an amount below the minimum subsistence incomethat in itself entitles them to financial support. In Ukraine and Hungary, certain low-income groups are provided with supplementary benefits.
In Latvia and Ukraine, the tone of the regulations is more suspicious than in Hungary.The benefit is granted for a period of three months if the family has a member who isable to work, and for six months if the family members are incapable of working.
In each country, numerous documents are required to prove the eligibility of a familyfor financial support. In all three countries, the authorities have the right to make homevisits and to collect information on the financial situation of the applicant family.Concerning income, in Ukraine the size of the land of the potential recipient and inLatvia the property and the family structure as well as data at the disposal of other legaland natural persons—are taken into consideration. In Latvia, the benefit is granted toensure that after the settlement of rent and utility payments the family is still left withnot less than 75% of the subsistence minimum per family member for the purchase of food.
The majority of the activities of the Department of Welfare are focused on administration. Thestaff is enormously overloaded, one official in charge deals with 1,800 files on average annually.In a city of 113,000 inhabitants the Department of Welfare made decisions in more than 37,000cases, and (in 1997) accepted more than 27,000 applications.
SOURCE: Case study, city of Nyíregyháza, Hungary.
In Latvia and Hungary the decision is made at the local level, whereas in Ukrainethe middle level of governance provides the cash benefit from a given rayon and out ofthe rayon‘s budget.
... the fact that Shchyrets has the biggest population size in Pustomyty rayon does not mean thatthe population of the particular sector deserves special attention. On the contrary. Both in thecourse of collecting quantitative information and during the personal interviews with the keyfigures of the sector (in the sphere of social policy) it was discovered that all the information
67
concerning the performance of social policy in Pustomyty rayon is concentrated in the rayoncenter—Pustomyty city, which is a kind of organizational center of rayon social policy.
At the same time, the local self-government in Shchyrets does not pay any social benefitsout of the town budget. In 1999 the only type of social assistance provided by the local self-government to the citizens was the cash allowance in case of death (because of their status thesecitizens could not obtain the cash allowance from the Employment Fund or from the SocialInsurance Fund of Ukraine). Nevertheless there are two people among the eight workers of thetown council that specialize in drawing up documents on the compensation of expenses forcommunal services (subsidies). The main expense item of the town budget is concentrated onthe support of three schools, two pre-school institutions, and a medical/obstetrics station
SOURCE: Case study, Ukraine.
In Latvia, the Ministry of Welfare has prepared the concept “On Minimum IncomeGuarantees to Poor People” providing suggestions on how to ensure, for people who areunable to earn a living by themselves, a guaranteed and uniform minimum level of incomefor the whole state. In this respect, plans have been made to set the guaranteed minimumlevel of income at a national level, to define the obligations of local governments to ensurethis minimum income, and for state participation in financing of such support. Thisconcept will be the basis for amending the law On Social Assistance.
In all three countries housing costs have increased considerably, resulting in payment problemsfor a significant portion of the population. Several government measures have been createdto assist debt management, including housing allowance.
In Ukraine, the housing subsidies program was introduced in 1995. This is a monthly-targeted benefit for citizens that reimburses expenses paid on rent and rates (communalservices). The eligibility criteria are centrally determined: the level of income, the percentageof the housing costs relative to the disposable income of the family (15–20%), the housing“norm” (21sq.m per-capita). The decision-making body operates at district level.
In Hungry, although the Social Act defines the framework of the eligibility criteria,local governments are entitled to set the housing “norms” according to the standardhousing stock within their constituencies.
In Latvia, the housing allowance—similar to low income family allowance—is grantedin order to ensure that after the settlement of rent and utility payments the family is stillleft with not less than 75% of the subsistence minimum per family member for thepurchase of food. In order to be granted the benefit, families must file a statement aboutthe necessity of the social assistance and a proposal concerning the size of the benefit.The applicant for the benefit submits an application, a reference from his/her place ofresidence, a declaration on the means of livelihood of his/her family, a record-book onrent payments, and presents a document that confirms expenses on the purchase of fuelat the time that the benefit is granted.
In all three countries, the benefits, except in certain cases, are paid directly to thecommunal service companies.
T H E I M PA C T O F D E C E N T R A L I Z AT I O N O N S O C I A L P O L I C Y I N H U N G A R Y, L AT V I A A N D U K R A I N E

68
T H E I M PA C T O F D E C E N T R A L I Z AT I O N O N S O C I A L P O L I C Y
Child protection benefit is a very important additional form of means-tested regularsocial assistance in Hungary, and is given to families with children.
In Latvia and Hungary, local authorities may create, within their budgetary means,additional forms of social assistance. In Latvia, the most frequently granted benefits are:benefits for the payment for medical bills, benefits for meals and food, and benefits forthe upbringing and education of children.
Freedom of choice is limited if cash benefits can be transferred into in-kind benefits.In Hungary, for example, it is legally possible to give part of the child protection benefitin the form of free school meals. In all three countries, housing allowances are a specialtype of in-kind benefit, as the financial resources are directed to the service providersinstead of the consumers.
There are 16 divisions providing in-kind and cash assistance including “clothes banks.” In 1999they provided clothes, shoes, means of rehabilitation, etc., for a total of about 69,000 low incomepensioners, the disabled, people living alone who are unable to work and families with children.
SOURCE: Case study, Kyiv, Ukraine.
When evaluating systems of social assistance the maintenance of the real value ofbenefits is a key issue. Indexing may occur according to a legally regulated mechanism, ormay be dependent on the will of the existing political elite, which is the case in all threecountries.
In each country, “workfare” (or, as it is expressed euphemistically in the scientificliterature, “activation”) is a dominant ideology. In interviews, local politicians repeatedlyadvocated the notion that people have to work for public assistance.
Various co-participation activities have been introduced for clients of social assistance. Employeesthemselves use the term “to work for social benefits.” These are various activities involving tidyingup the town. “A man comes. If we see that he can work, then we use the situation.”
SOURCE: Focus group discussion, Dagda, Latvia.
In Latvia, if a person who is able to work and is a potential recipient for poor familysocial assistance, they must register with the Employment State Service and, prior togranting of the benefit, the local government may request that they participate in com-munity jobs or activities that help develop employment skills.
In Latvia, poor family social assistance benefits are not granted to a person who:
• has been dismissed from work at their own request or is blameworthy thus leadingto their dismissal. In this case, the person may request benefits six months afterdismissal;

69
• has refused the job offer or community job, except cases when the offered jobor community job would not allow them to take care of a disabled child or achild who does not yet attend school;
• has refused to take part in activities leading toward the development of occupationalskills and employment, except in cases when the activities would not allowthem to take care of a disabled child or a child who does not yet attend school;
• has refused social and medical rehabilitation.
Unemployment results in lack of incomes; people have nothing to do. Dagda has a highunemployment rate—14%. One of the causes of the high unemployment rate might be the factthat people are interested in registering as unemployed as they then have the opportunity ofparticipating in paid temporary community jobs which, though payment is small, still provide asource of income. When granting benefits, account is taken of the participation of the inhabitantsin activities for tidying up the civil parish, which are organized every Friday. For their schoollunches children work in the school fields.
SOURCE: Focus group discussion, Dagda, Latvia.
The more the number of preconditions to gain entitlement, the more vulnerableare the low-income families and individuals.
Means testing is often accompanied by procedures designed to control the reliabilityof the applicants, such as home visits, endangering even the first generational rights ofthe future beneficiaries. If the means tests become “character-tests” (as often happens),paternalistic, and discriminatory practices may occur.
Often, social workers carry out means testing for determining cash-benefit entitlements.This practice is absurd because this kind of control cannot be in line with the philosophyof the helping professions. Moreover, it makes the programs extremely expensive as aconsiderable portion of the expenses go to paying the wages of the “testers.” Further, itis bizarre to imagine that trained social workers and social work agencies are better ableto measure incomes than tax officers.
A significant part in granting assistance is played by the fact that inhabitants of the town knoweach other very well. Often the social worker already has his/her opinion about the client andwhether he/she deserves or does not deserve assistance—“we know all of them.” One of thetraditional ways to achieve changes is control, respect, and fear. It was particularly stressed by therepresentative of the Custody Court working with high-risk families where parents do not takecare of their children—“we control them.” It works as people have a respect for the representativeof the Custody Court and the social worker and it motivates them to be better.
SOURCE: Focus group discussion, Dagda, Latvia.
The application of these kinds of tests is not only extremely stigmatizing but maydiscriminate against the most needy. One cannot properly evaluate the effectiveness andefficiency of the Ukrainian social assistance system, but information is available on the
T H E I M PA C T O F D E C E N T R A L I Z AT I O N O N S O C I A L P O L I C Y I N H U N G A R Y, L AT V I A A N D U K R A I N E

70
T H E I M PA C T O F D E C E N T R A L I Z AT I O N O N S O C I A L P O L I C Y
consequences of mistargeting in the Hungarian and Latvian means-tested income supportschemes. In one interview conducted in Latvia, the interviewee stated: “It can be saidthat the most active applicants for assistance are well informed about all types ofassistance. However there are also people who are entitled to assistance but they areincompetent and socially inactive.”
Only in the case of target benefits can the social worker examine the living conditions of theapplicant. All other benefits are provided on the basis of various certificates, which are very oftenfaked. If a person possesses two apartments he or she cannot receive a subsidy on either of them.Also if a person has bought an apartment then he or she cannot apply for the subsidy for oneyear. In other cases a person is not responsible for submitting inadequate information to theSocial Protection Bodies. Our Ministry tries to resolve this problem in co-operation with theTACIS project. We have now introduced such a position as a social inspector. Inspectors carryout on-the-spot checks of the living conditions of applicants for social assistance. Nevertheless,apart from the Act on the introduction of the post of social inspector there are no other regulationsthat would provide the inspector with the authority to carry out the examination and on thebasis of this examination to refuse the provision of social assistance.
SOURCE: Representative of the Main Department of Social Protection of Kyiv City State Administration.
When analyzing any kind of social security system, the first question to be asked iswhat are the legal bases of the system. In all three countries, the legal bases of socialassistance are established through various acts, and in Latvia and in Hungary local self-governments have the right or the duty to adopt these in local regulations. Legal regulations,however, only create the conditions for social support in principle. In reality, the everydaypractice—particularly in Ukraine—may differ significantly.
There are two types of social assistance concerning the means of regulation in Hungary. Even thoughfewer people are provided with financial support in a normative way and more are based on discretion,only in the cases of housing benefit, crisis assistance, and funeral benefit can the local self-governmentenforce its own ideas. Determination of the eligibility criteria in the various government actsneglects the local conditions and special local needs. This phenomenon can be interpreted as aform of centralization. On the other hand, the eligibility criteria of financial support based ondiscretion are not connected to needs’ assessment, but they largely depend on the local powerrelations, the financial resources, and the professional skills of the responsible people even in acity as big as Nyíregyháza—the county seat. Efficiency and effectiveness have never been analyzed.
SOURCE: Case study, Szabolcs–Szatmár–Bereg County, Hungary.
In order to make any schemes rights-based, an additional problem must be solved,viz. the granting of the possibility and the appropriate mechanisms to appeal againstthe entitlement decisions made by the authorities.
In all three countries, the first level of the appeals process is the same organizationalunit that decides on the entitlements of the applicants.

71
Article 40 of the Ukrainian Constitution and the Law of Ukraine On Citizens’ Appeals(1996) regulate the Ukrainian appeals process. In order to protect their social rights,citizens may appeal to the District Administration, to the executive bodies of city anddistrict councils, and to the court.
In Latvia, if the local government decides against providing social assistance to anindividual, its duty is to issue a comprehensive written refusal to the applicant. Complaintson the decisions taken by the local government about the eligibility of a given family tobe considered as a poor family, the granting of benefits, or the assessment of the provider’soptions are reviewed by the council of the local government concerned. If the decisionof the local government council does not satisfy the individual, they have the right tosubmit a complaint to the court. A complaint may be submitted to the Social AssistanceFund concerning the decision of the council if the social assistance is financed frompublic resources. Disputes on the exercise of rights prescribed by the above law are re-viewed by the court under the procedure prescribed by law.
In Hungary, it is necessary to differentiate the locally regulated forms of socialassistance and those regulated in an Act. In the latter case, the refusal of an applicationmay be contested in court whereas in the former case legal control may be requested onlyfrom the office of the County Government Commissioner. This practice reflects oneof the most important controversies of decentralized governance—the principle of legalsecurity is facing the requirement of local autonomy.
9. CONCLUSIONS AND POLICY RECOMMENDATIONS
9.1 Centralized and Decentralized Functions: Past and Present
When we scrutinize those social policy functions that are not directly managed by thecenter, we should forget whether these “decentralized” functions were ever “centralized.”
To continue on the same train of thought, it can be stated that as far as Latvia, Ukraineand Hungary are concerned, certain decentralized social policy functions were nevercentralized and some functions were not, and are not, decentralized.
One may ask: When these countries started out towards transition, which socialpolicy functions were assigned to a central and which ones to a decentralized organiza-tional arrangement?
Lasting social (welfare) crises, which were the consequences of grave economic re-cession, marked the first decade of transition. Both the central and the non-centralfunctions were of a crisis-management character—even if it was not publicly admitted.
Most of the central programs were meant to handle crises of a political character.As far as the stability of a political regime is concerned (and, let us add, that of a democratic
T H E I M PA C T O F D E C E N T R A L I Z AT I O N O N S O C I A L P O L I C Y I N H U N G A R Y, L AT V I A A N D U K R A I N E

72
T H E I M PA C T O F D E C E N T R A L I Z AT I O N O N S O C I A L P O L I C Y
state as well), it is not the situation of the poorest section of society that poses potentialdangers but the situation of those who experience a marked deterioration in their standardof living or who are afraid of this happening. It underlines the political seriousness of theproblem that at times of deep and lasting economic crises, even the greater part of societycan belong to the “risk group.”
The instruments that affect practically the whole of society and are meant to protectpresent societal status and levels of income are either insurance systems (as, for instance,old-age pension, disability pension, sick pay, unemployment benefit, etc.) or incomemaintenance programs based on principles of universalism (such as family allowance,maternity allowance, annuity for the disabled, etc.). Such programs have always beencentralized. In accordance with present organizational and political traditions, andbecause they are indispensable for stability—which means they are of special politicalimportance—they have remained centralized. To sum up: whenever a social (welfare)issue gained special political importance, and targeted those groups that matter at thepolls and are for that matter in the forefront of political interest, the state under surveyresponded with centralized programs and by reforming the centralized schemes.
The decentralized—i.e. transferred to the competence of municipalities and NGOs—social programs are, in terms of power relations, less important as they target the poorand other marginal groups that are of secondary importance in terms of their influenceon the public mood. These provisions generally offering care for low-prestige, stigmatizedand excluded groups provided a weapon for a quite large section of voters who politicallyoppose caring for the needs of such groups. The political importance of these programsis low: they only become political issues if local crises escalate or if scandals break outbecause functions are not discharged (for instance, when homeless people die of cold orRomanies decide to resettle in another country, etc.).
The inconsistencies in the contemporary Western welfare models also influence theimplementation of decentralized social policies in the post-socialist countries. The advancedcountries are pursuing various directions in reforming their welfare systems; the severalnew models are in hot competition; and the beneficiaries of the international aid programsand technical assistance projects keenly feel that rivalry. It is the end-user of such aidprograms that feels the adverse effects of such inconsistencies the most poignantly.
The three countries surveyed vastly differ in what norms they met in the course ofthe aid programs that helped their transition. Latvia tends to follow protestant, Scandi-navian principles whose roots are identical with those of the cultural legacy of Riga. Atthe very beginning of the transition, aid programs in Hungary stressed the corporativeelements of German-speaking countries and later more and more powerfully the privati-zation principles of the United States.
In the dominant discourse of the post-socialist countries, societal crisis is in the wind,anxiety from serious social conflicts is prevalent in public attitudes, and people have livedthrough critical situations throughout the last ten years. Consistent and rational social

73
policies that subordinate the means of social policy to desirable and feasible objectivesdo not exist in these countries. Social policy faces a crisis: no concepts have been formulatedby the competing programs of the various political parties of these countries on what isnecessary to create a “better,” more humane society.
Some hope and others are strongly convinced that political democracy and economicgrowth will result in social development. It should be emphasized, however, that thisprocess has not occurred smoothly anywhere in the world. It is of no surprise that economicdevelopment does not seem directly or automatically to influence social relations inHungary and Latvia; the benefits of their recent economic growth have not translatedto improving the living standards of the most vulnerable segments of the population inthese countries.
9.2 The Criteria of Evaluation
Every analysis reflects on the values of the analysts themselves and the present study is no exception.It examines the social policy system of Ukraine, Latvia and Hungary as compared with our ideals.The values we cherish can be chiefly associated with this or that social policy regime rather thandecentralization as such. Consequently, when we qualify a phenomenon as being “good” it is notbecause it is adequately decentralized. The key criterion for our assessment is whether or not adecentralization-related phenomenon makes a social policy regime “better.”
SOURCE: Case study, Szabolcs–Szatmár–Bereg County, Hungary.
9.3 Legal Regulations and the Reality
The various welfare systems tend to upset the conventional systems of reciprocity thatused to ensure established relationships. The “donors,” i.e. those who finance the benefits,and the “recipients,” i.e. the beneficiaries of the benefits, are not in an identical socialsituation: their rights for self-determination and capacity for interest enforcement aredifferent. It is for this reason that we give preference to those welfare systems that arebased on guarantees and facilitate the assertion of interests.
Despite the fact that the principles as well as the wording of legal regulations are inline with the European standards these regulations are in several cases not realized inpractice. In all three countries it would be necessary to mobilize additional resources and set upa system of incentives to enforce the rule of law and to correspond to the delegated responsibilities.
It is not unreasonable to make predictions about the future. It helps enhance predict-ability and the stability of the legal system if social provision is defined in legal regulations ofthe highest possible order and if the readjustment of benefits to inflation is ensured by pre-established mathematical formulae. In this respect, only Latvia has made significant stepsahead.
T H E I M PA C T O F D E C E N T R A L I Z AT I O N O N S O C I A L P O L I C Y I N H U N G A R Y, L AT V I A A N D U K R A I N E

74
T H E I M PA C T O F D E C E N T R A L I Z AT I O N O N S O C I A L P O L I C Y
9.4 Governance
As was stated earlier the success of decentralized governance primarily depends on theperformance of the central state, on its commitment to improve public services, and onits role in guiding the evolution of the reform process.
Decentralization is partly about the replacement of the highly centralized hierarchicalorganizational structure by decentralized management environments, and not to createa “smaller scale” centralized structure.
Even though local governance can frequently be seen as the training ground of de-mocratic (participatory) culture and institutions may appear to act in the common good,what actually happens is that they shape and reproduce relationships of unequal power andauthority; this is especially true in the case of special groups, first of all ethnic minorities, andthis situation leads to social exclusion.
In our understanding, the relevant problem is how the direct state service provisionsand management based on traditional, bureaucratic techniques are followed by indirectmethods of governance.
These methods rest on three basic questions:
• What are the services to be delivered by autonomous self-governments, and govern-mental and non-governmental public actors?
• What kinds of resources and capacities are available for these actors to providethe delegated public responsibilities?
• What kind of supervisory and controlling mechanisms guarantee the fulfillmentof the tasks administered at the local level, and what are the desired outputsand outcomes?
Hungary has adopted a highly decentralized form of local government which, incertain areas, has led to the inefficient provision of services, and strains on local finances.The government has recognized the issue and the financial incentives to encourage thepooling of facilities with the result that the activities taking place through the creationof local government associations have had some success. In the absence of anycomprehensive restructuring of local government responsibilities, the government willhave to adopt a flexible and innovative approach to both local government financingand the provision of services (Progress report 2000).
According to a 1998 newsletter on social budgeting: “All countries in Central andEastern Europe are in the process of reforming their social protection systems.... Theproblem in many countries is that co-ordinated planning of the overall social protectionsystem is non-existent. As different agencies design policies for different benefits, majorreforms of various schemes are planned in isolation from other sectors of social policy.In many cases, the skills and tools that are necessary for co-ordinated planning are notavailable” (Newsletter 2–98 Social Budgeting).

75
The determination of the duties of organizations that are in principle decentralizedand autonomous must maintain a complicated linguistic and technical balance in therelevant legislation. If every detail and phase is regulated, the autonomy of the decentralizedunits is ignored. This practice is, rather, a process of “de-concentration”—the refinementof bureaucratic institutional techniques. Roughly speaking, the public administrationreform that has until now taken place in Ukraine is reflected in the fact that social policydepartments in the villages do not currently exist. These techniques, when conductedwithout genuine support for the principles of decentralization, always lead to confusedpractices. As the Ukrainian research team has indicated, a clarification of the divisionof responsibilities between the central, oblast, and rayon-level administrative systems isindispensable for the improvement of social welfare provisions at all levels.
The dominant approach in the distribution of the welfare responsibilities to localself-governments in Hungary and Latvia is that those social problems that must be dealtwith are regulated in the social legislation of those countries. There are ways, however,to enlarge the group or realize outcomes that are not included in the regulations. All ofthese “soft” procedures, however, do not provide reassuring solutions to the problemsof the outcomes, the minimum level of service provision, the values to be realized (equalaccess and treatment, coverage, equitable and fair redistribution), and the effects of socialpolicy. In principle, the rules of access to social services and cash benefits are legallyregulated, e.g. in Hungary; however, the fact that even statutory obligations are not adheredto without any consequences seriously violates the fairness of access to these provisions.
In formulating the desired outcomes, the socialist legacy serves as a serious hindrance.In the rhetoric of the state-socialist system, ideological desires and impersonal imperativeswere confused with real descriptions of duties. One can recognize this legacy in wordingslike “local self-governments must deal with the problem of...” or “municipalities haveto ensure....”
None of the three countries has institutionalized a poverty threshold or a minimumsocial assistance level, or has a guaranteed minimum income for all citizens. Legally definedrights for certain benefits, i.e. the procedure of normative selection to get certain cashbenefits, may also restrict the autonomy of local self-governments. On the other hand,even decentralized bodies must not over-rule human rights such as the respect for humandignity. Moreover, in those cases when the local self-governments cannot exercise anydiscretion in deciding on the beneficiaries, in other words their decision-making poweris restricted, the target groups can obtain more calculable and predictable financial supportas a result of which their existential security is improved.
Neither the legally guaranteed rights ensuring equal access to social services nor thedesired minimum level and quality of services are realized in the practice of the localauthorities in the three countries studied.
We could hardly find any traces of civil control over the activities of autonomous localself-governments or the principle and practice of empowerment of the socially disad-vantaged groups.
T H E I M PA C T O F D E C E N T R A L I Z AT I O N O N S O C I A L P O L I C Y I N H U N G A R Y, L AT V I A A N D U K R A I N E

76
T H E I M PA C T O F D E C E N T R A L I Z AT I O N O N S O C I A L P O L I C Y
One of the basic objectives of decentralization is the transfer of power to local self-governments and the empowerment of the civil society. Decentralization, however, doesnot necessarily strengthen local democratic institutions. In all three studied countries,due to the legacy of the past, decentralization was master-minded and implemented byruling elites. In Ukraine, to a comparatively large extent, and in Latvia and Hungary toa lesser degree, hierarchical structures were created. The top-down culture of politics as wellas bureaucracies survived, though in smaller territorial units, as a result of which citizensand grassroots organizations are alienated from local politics and feel excluded from thelocal decision-making processes. Thus, it would be of crucial importance to make the localcommunity the real owner of the decentralization process by promoting the access of civicactors to information; by improving communication between local politicians, officialsand local communities; to develop the techniques of co-operative planning, to strengthenthe capacity of local communities to enable them to articulate their needs; to force therepresentatives of the local community to participate in the decision-making processes.
A system of reconciliation of interests with the participation of the representatives ofcentral government, local self-governments, and professional bodies would render possiblethe initiation of all the interested parties into the process of formulating regulations tomake them more feasible. In this way civil control over the planning procedure and im-plementation of policies could gain ground, thereby advancing the democratization ofthe social sector.
9.5 Resources and Capacities
9.5.1 Financing
Welfare programs are operated from budget allocations that are fixed in advance. Whenthe slogan is to cut costs at any price—which is frequently the case due to the economicsituation or to ideological considerations—money is often taken away from the budgetaryallocation of welfare systems.
Not only the declaration of social rights but also the restrictive regulation of publicinstitutions may set limits on the autonomy of decentralized organizations. Restrictiveregulations, in our experience, relate only to finance. The basic regulatory principle isquite simple: welfare spending must not exceed the budget. It is worth mentioning thatbudgetary limits are far “harder” or more defined in the Ukraine, where the welfare ad-ministration is more bureaucratic and hierarchical than in Latvia and Hungary. In thelatter two countries, municipalities react to the lack of resources with more flexible“spending behavior.” One cannot be fully satisfied with this flexibility, however, forinstead of (or in addition to) improving the efficiency and targeting, it indicates a decrease

77
in the quality of services and a restriction in the number of beneficiaries thereby resultingin the social exclusion of certain groups.
Often the rules for using funds compel the managers who oversee spending to followcourses of action that divert from the proclaimed social policy principles. In such casesthe proclamation of the social policy priorities is nothing more than lip service, while therules and incentives that enable spending are the actual “law.” We are convinced that thosefinancial arrangements are welcomed that encourage providers to stick to the declaredsocial policy principles.
Ii is problematic if a welfare program allows scope for squandering. It is better if aprogram can accomplish the same outputs by spending less, both in absolute and relativeterms. It is beneficial, in addition, if it lends room for innovative techniques that cutcosts. However, it is unacceptable if expenditure is cut at the cost of corrupting thequality of provision or if provision is confined to clients who can be assisted at a lowercost, while problematic cases requiring more expensive care go without cover.
In all three countries, the representatives of every local authority we visited complainedabout the inadequacy of funding in relation to delegated responsibilities. This correspondswith our opinion that decentralization of social policy in this region tends to aim moreat shifting the responsibility for problems and responsibilities than at the decentralizationof resources and capacities. Unfortunately, decentralization can work only when substantialresponsibilities, tasks and powers are transferred from the center with staff and financialmeans to match.
Without exception, in all three countries it would not be problematic to set up closerlinks between municipal budgets (resource allocation) and performance. The system ismainly based on inputs instead of outputs and outcomes.
The rural-urban divide and regional economic inequalities create special financialdifficulties. In Latvia (Equalization Fund) and in Hungry (“social normative”) there existsome mechanisms that react to the diverse financial situations of the municipalities. Theefficiency of these financial systems, however, does not guarantee an appropriate levelequal access to social services. Some mechanisms that react to the diverse financial situationsof the municipalities ought to be instituted in Ukraine as well.
In Latvia it would be advisable to revise the very complicated cash flow path to makethe financial system more effective and transparent. According to the local research team:“One of the problems of decentralization is the fact that it creates a very complicated cashflow path that is difficult to supervise. It is almost impossible to follow the cash flow. Eachseparate local government is financed from several sources. These sources are the centralfunding by the government (which constitutes 71.4% of personal income tax), and fundingfrom the national special budget and the national general budget as special purpose grants.Additionally, local governments receive funds from the Local Government FinanceEqualization Fund, which was instituted to reduce the gap between local governmentswith different levels of basic funding. The funding of local governments is made up of
T H E I M PA C T O F D E C E N T R A L I Z AT I O N O N S O C I A L P O L I C Y I N H U N G A R Y, L AT V I A A N D U K R A I N E

78
T H E I M PA C T O F D E C E N T R A L I Z AT I O N O N S O C I A L P O L I C Y
local fees, real estate tax, and payments for services. Local governments may also receivestate-guaranteed loans or gifts/donations. This diverse structure of funding sources makesdifficult the observation of the cash flow. As such, the possibility of wasting money withoutdue process cannot be eliminated.”
Hungary is exhibiting some signs of “re-centralization”: this is evident from the cut-backs in the financing of local self-governments in that their share in locally collectedpersonal income tax is continuously shrinking.
9.5.2 Human Resources and Professional Standards
We consider it very harmful and demoralizing if a considerable part of the budget of awelfare program is allocated for the salaries of the administrators and staff members whilea relatively small amount is allocated for the direct costs of the program itself. By contrast,we see it a fine accomplishment if the highest possible percentage of expenditure is suppliedto the group to be supported. Complicated means-testing procedures together with theunnecessarily wide range of services are responsible for increasing the relative costs ofadministration.
In Central Eastern Europe a civil servant traditionally acts as a civil patron ratherthan a servant of the public. In order that the social policy programs might keep thedomineering behavior of bureaucrats within limits, it is essential that the rules of eligibilityand procedure should be uniform for all members of society. If that cannot be ensured,which is quite frequently the case in the three countries, fundamental constitutional andhuman rights may be violated by public offices venting the subjective views and tempera-ment and prejudices of officials.
In the area of social services, there are hardly any regulations (and those mainly inresidential care) or mechanisms outlining the content of the services. The Latvian andHungarian regulations at least make a list of the services to be provided by the residentialcare centers, but these lists do not contain any information on the professional standardsand quality of the services. The Hungarian regulatory system produces relatively detailedinformation regarding, for example, minimum space requirements for the rooms ofresidents, the number of bathrooms, and the professional qualifications of the staff. Thesepreconditions have to be met in order for the institution to be granted a license. Clearnational standards, however, are essential for safeguarding equity and quality.
The standardization of the content of the services does not necessarily result in uniformservices. As one author wrote: “A focus on quality, linked with equality, does not mean thatservices have to be the same for all those receiving them (‘one size fits all’), rather the opposite.Flexibility and responsiveness are needed, requiring staff to use their initiative and judge-ment when making decisions. Different quality systems, including management trainingand development, are needed to support such an approach” (Gaster 1999, p. 43).
79
Another important factor determining the quality of services is the professional quali-fication of the staff in the social policy sector. University-level and college-based educationof social workers and social policy experts began in the middle of the 1980s in Hungary,and a system of further education has recently been introduced. In Latvia, huge effortshave been made to compensate for the shortage in properly trained social workers. Ukraine,however, is just beginning this process.
The value and the prestige of a profession may be expressed by the position of therepresentatives of that profession in the income hierarchy. We have no data on this issuefrom Latvia or Ukraine. So far as Hungary is concerned, social sector employees are atthe bottom of the hierarchy. As an example, even the average wage of textile workers ishigher than the average salary of social workers.
It is a matter of urgency in all three countries that efforts be made to increase thenumber of highly qualified professionals, to decrease the rapid fluctuation of the workforcein this sector, and to improve the financial recognition as well as the moral support ofthe social professions.
9.6 The System of Social Provisions
It is characteristic in all three countries that, for many reasons, reactive measures dominatesocial policy and proactive solutions are generally missing. In several fields such as themanagement of overdue debts in utility services, drug and alcohol consumption, andyouth unemployment it would be far more humane and much cheaper to take proactivemeasures than correcting incurred damages. Even though some efforts are being madein Hungary and Latvia in this direction, the long-term, systemic, programmatic planningand management procedures are generally missing in the social sector.
A decentralized system of social policy would be fully capable of applying proactivemeasures but even this kind of consideration is missing from central government policy.It was stressed in many interviews that at the local government level “everybody knowseverybody” and this helps to focus social assistance on real problems that probably couldnot be observed from the center, and it allows administrators to think about preventiveactivities where possible. “In analyzing benefits of decentralization of social policy in Latvia,one important advantage that should be pointed out is that social policy has movedcloser to individuals. ...Now local governments are responsible for decision-making onmany social issues, and because they have considerable discretion in this field, they can bevery flexible and react to the most important problems in the most appropriate way.”
Inevitably the criterion of fair distribution is the most important principle that anysocial policy system must fulfil. The present Hungarian welfare system is the only oneamong the three countries studied where there are conscious procedures applied aimedat perverse distribution via fiscal (taxation) measures.
T H E I M PA C T O F D E C E N T R A L I Z AT I O N O N S O C I A L P O L I C Y I N H U N G A R Y, L AT V I A A N D U K R A I N E
80
T H E I M PA C T O F D E C E N T R A L I Z AT I O N O N S O C I A L P O L I C Y
It goes without saying that all social programs are expected to ensure that the recipientsshould have unobstructed access to the services. If that principle is not observed, then notonly is it unfair but there also appears the danger of discriminative and exclusionist mechanisms.
As a rule, welfare programs are expected to assert the principle of both vertical andhorizontal equity when the average living conditions of a target group are improved. But,in fact, we expect such a program to accomplish more: the living conditions of the leastwell off people should improve to a higher than average degree. As a matter of fact, boththe social and the regional inequalities, as is to be seen from the county reports, are in-creasing in all three countries.
The principles of efficiency may contradict those of equity. Over-emphasis on efficiencycan eliminate equity altogether, in fact, it can cancel fundamental freedoms and theobservation of human dignity.
Welfare programs often suffer from “leakage,” which means benefits get divertedon their way to the recipients. Each local government, however, is accorded considerablediscretion in allocating support. There is strong evidence from the interviews that socialassistance does not always reach those individuals who need it most, and the exercise ofdiscretion may result in discrimination against certain groups of the population.
The term “focus” is often narrowed down to mean, say, targeting poor people withincome support. By contrast, we use the notion of focus in a broader sense. For instance,we consider it a malfunction in focus if non-disabled people also have access to benefitsmeant for the disabled.
As necessary preconditions, the criteria of entitlements and the content as well as theminimum level of service provisions must be specified.
In each of the three countries, social assistance cash benefits are targeted to groupsor life situations and not purely to factors based on the income of the population. Thisis partly the reason for the wide variety of benefits. The Ukraine is an extreme examplein this respect, for on paper, it provides over 50 types of benefits to almost 18 millionpeople. As the research team pointed out: “In the course of conducting the case studies,it became evident that reconsideration and liquidation of most of these benefits, basedon the personal opinions of most interviewees, are the main tasks of reforming the socialprotection policy. For example, according to the law On the Status of War Veterans andGuarantees for Their Social Protection, 5.3 million people receive different exemptions.The total amount of these exemptions in 1999 was UAH 3.6 billion. Thus 3.6 millionmore people would wish to receive the status of War Participant.” The determination ofa needs-based poverty line as the social assistance threshold is urgently needed in these countries.
It is desirable that the welfare programs should encourage and support their clients(at least those that are able to do so) to strive to improve their living conditions by somemoney-earning activity. But it is not true that the best encouragement for a client is toapply sanctions or reduce benefit levels. Thus a system lacking work incentives—as is thecase in all three countries—tends to perpetrate poverty rather than alleviate it.
81
As far as residential care is concerned, huge institutions are the surviving heirs ofthe Soviet past. In Hungary, the dismantling of the large residential homes for childrenand disabled people has begun, and several forms of community-based care have begunto function. These practices are still in their infancy in the other two countries.
The place of residence is gaining in importance among the causes of social inequality.Horizontal equity would therefore require that, among people of identical demographicand sociological status, people who live in undeveloped regions and localities get moresupport from the welfare programs. Equal access to social services is not guaranteed becauseof significant regional inequalities in all of the countries. Differences between the capitalcities and the rural communities having the same legal status and responsibilitiesconcerning basic provisions (in Latvia and Hungary) are especially pronounced. Froma social policy point of view, it is problematic that more developed, wealthier settlementsenjoy a wider and richer range of public services than poorer areas. In the decliningregions, fewer resources are available and more poor people should be provided withsupport from the local communities. If the social sector does not find a solution to theseproblems, poorer self-governments will have to continue to use all of their resources,even those allocated for development purposes, to cover the costs of social assistance.Even though the central government’s equalizing mechanisms make fairer and moreequitable distribution possible, they decrease local interest in the development of thelocal economy and in finding more cost-sensitive solutions. In several cases, more effortis expended by the municipalities in competing for central funding than in lobbyingfor the enlargement of local resources.
Services, possibly good quality services, accessible to all and responsive to all, as LucyGaster notes, is not only a technical duty but a democratic right. “Democracy, citizenship,and participation are vital elements of a healthy local state. The state needs people to actas citizens, to exercise their rights freely, and to have trust and confidence in the organsof government. Good quality services, developed to meet the real needs of the public,are an important stepping stone on the route to citizenship” (Gaster 1999, p. 51).
9.7 Supervisory and Controlling Mechanisms
“Discussions regarding quality within the public sector are often carried out in twocompletely different dimensions. On the one hand, there is the discussion and evaluationof the quality provided to customers and, on the other hand, there is the discussion andevaluation of the result which is provided in relation to the fulfillment of the goals setby and for the local government. Even if the goals set for the local government are identicalto the customers’ needs, and they often are, it is necessary to separate the satisfaction ofcustomers’ needs from the institutional and political demands made upon the localgovernment” (Global2 1996).
T H E I M PA C T O F D E C E N T R A L I Z AT I O N O N S O C I A L P O L I C Y I N H U N G A R Y, L AT V I A A N D U K R A I N E
82
T H E I M PA C T O F D E C E N T R A L I Z AT I O N O N S O C I A L P O L I C Y
The lack of the appropriate professional supervisory and controlling mechanisms in socialpolicy has outstanding importance as it may endanger even the legitimacy of thedemocratic system. This may occur in two ways:
First, if the self-government, representing the will of the local majority, adopts localprejudices and racist attitudes, there is a possibility of social policy becoming a vehiclefor undermining basic human rights and for institutionalized discrimination.
Second, if transition to a market-based economy and democratic institutions producesonly disadvantages for many people as they drift toward the periphery of society due toimpoverishment, marginalization and social exclusion, social tensions may result inpolitical destabilization. If the management of these social and political risks falls domi-nantly on local social policy, as is the case in these three countries, central control overlocal solutions cannot be avoided.
Adequate professional supervisory and controlling mechanisms for monitoring andevaluating locally and centrally initiated and performed activities ought to be developedto give a clear-cut picture on the outputs and outcomes of these programs. There is anurgent need to make a shift from the traditional procedural approach to a more results-oriented strategy. “The aim is to move from a mode of operation based on ex-ante controlof resources, extensive regulation to prevent abuse, and ex-post inspection to insure com-pliance with legal standards, to continuously monitored service delivery and managementwith accountability for results in all dimensions of performance (economy, efficiency,effectiveness, service quality, financial performance)” (Global2 1996).
Unsurprisingly, only those tasks that have previously been defined and for whichresources are available can be properly controlled. Thus, clear targets and performanceindicators are needed including raising some basic questions like: What are the primarypurposes of the social provisions? How can they be carried out most effectively? Whoshould be the main beneficiaries?
A program should meet the requirements of transparency, accurate accoun-tancypractices, and controllability; in other words, anyone should easily be able to find outabout a program, and what it provides and for who. To attain that aim, the administratorsof the welfare system should operate an advanced and strictly governed mechanism inwhich administrative procedure is precise and information flows are required. To make aprogram transparent, it is also necessary to have regulated relations with the “outsideworld.” In this case the political, administrative and civil actors should all consider it theirduty to understand and check on the processes and they should be capable of doing so.(And the administrative staff should be prepared to allow outsiders to have access torequired information)
Supervision and control are generally viewed negatively, particularly in CentralEastern Europe. In this region, articulating the need for supervision and control caneasily be interpreted as supporting “police state” solutions. For this reason it is importantto emphasize that this control must be focused on transparency and accountability. The
83
availability of data regarding events, clients, costs, time schedules, records, redistributioneffects, proper self-administration, information technology and organizational systems arethe necessary preconditions for controlling, monitoring and evaluating local social policy.
Decentralization may result in difficulties in establishing efficient and uniformdatabases. There is reliable information only on the utilized resources in each countryand there is data on the service users only in Hungary. No knowledge is available on thedemographic and social composition of the recipients of social services, and needsassessment does not exist. Therefore, ideologies on better targeting have no deepermeaning because it is impossible to say how and for whom social services are targeted.As a result of the lack of proper information on the recipients, there is practically noway to calculate the unit costs of the welfare provisions or to analyze their efficiency.
The techniques and procedures of self-administration are not fully worked out inany of the three countries. In Hungary, the projects of the National Employment Fundand some non-governmental organizations apply monitoring techniques. New programsor grant-based projects are hardly ever properly evaluated, however. In the Ukraine,even the system of social and economic statistics should be reformed. Informationtechnology is absent in many areas. In Latvia, for example, 553 local governmentsowned only 173 computers in 1999 and only 14% of local governments possessedcomputerized databases.
As a result of decentralization, local governments have become very independent,at least in Hungary and Latvia. Many decisions are taken by local governments themselvesand as a result of the lack of elaborate administrative systems as well as meaningfulinformation flow, the state loses control; at the national level clear understanding ofwhat, in fact, is going on in local governments is lost. User-participation is not integratedin the planning, costing and supervisory procedures. Thismeans that civil society hasno power to enforce any such procedures or to exercise effective control over the behaviorof political leaders or of government officials (neither upwards or downwards) overlocal issues. Party politics dominates the activities of the civic groups with no effectiveform of social dialogue between the central and local level, or between the local powerelite and the consumers of the services.
Thus the citizens can do nothing—apart from voting once every four years.
T H E I M PA C T O F D E C E N T R A L I Z AT I O N O N S O C I A L P O L I C Y I N H U N G A R Y, L AT V I A A N D U K R A I N E

84
T H E I M PA C T O F D E C E N T R A L I Z AT I O N O N S O C I A L P O L I C Y
NOTES
1 R. Musgrave, The Theory of Public Finance (1959).2 Charles E. McLure Jr., The Tax Assignment Problem: Conceptual and Administrative
Consideration in Achieving Subnational Fiscal Autonomy, World Bank, 1999.3 http://www.szfk.hu.4 Civil jelentés a szegénységrôl, Szociális Szakmai Szövetség, Budapest, 2000.5 The most important ideas put forth in this chapter are based on the work of Ágnes
Darvas. See Ágnes Darvas, Finding or Losing the Way. Family Support Systems inEast-Central Europe. 2000. Manuscript.
6 Revenko, Andrej, Poverty in Ukraine. World Bank, p. 1.7 The family allowance is a universal type of support within the subsidizing system
in Latvia; the amount of support is very low, but it has gradually been raised—year-by-year. The last raise was after 1 January 2000, so benefits to children whowere born after this are higher than for those children born in 1999(Social Report,1999).
8 Average gross salary in Hungary (2000): HUF 79,800 (KSH); minimum monthlysalary: HUF 22,500; minimum pension: HUF 16,600.
9 UNICEF (1995)—Poverty, Children and Policy: Responses for a Brighter Future.Florence, Italy, Economies in Transition Studies. Regional Monitoring Report, No. 3.Kangas, O. (1999) Social Policies in Settled and Transitional Countries. LIS WorkingPaper. No. 196, March 1999.
10 Prior to the 1990s, having medical attendance during pregnancy was an importantcondition for determining the entitlement to benefit. Nowadays, in determiningbenefits, this criterion tends to be considered a special premium in Latvia, Russiaand the Ukraine.
11 Amount of benefit paid out in 1999 is to be compared with the minimum wage, thebenefit is not adjusted to the minimum amount of salary, since November 1992 theamount of benefit was not raised for those parents who have been bringing up achild older than 1.5 years.
85
LITERATURE
http://www.altapedia.com/online/countries/latvia.htmhttp://www.amnesty.org/ailib/aireport/ar97/EUR52.htmhttp://www.cia.gov/cia/publications/factbook/lg.htmlhttp://www.ciesin.org/decentralisationhttp://www.ciesin.org/decentralization/English/General/Different_forms.tmlhttp://www.cspp.strath.ac.uk/catalog2_0.htmlhttp://www.imf.org/external/np/loi/1999/111099.htmhttp://www.imf.org/external/pubs/cat/doctext.cfmhttp://www.latnet.lv/popin/popcentr.demcom.htmhttp://www.lps.lv/ulsgl_ge.htmhttp://www.magnet.undp.org/Docs/dechttp://www.magnet.undp.org/Docs/dec/globa2.htmhttp://www.oecd.org/puma/gvernance/surveys/report98/surv98hu.htmhttp://www.oneworld.nethttp://www.polisci.com/world/nation/LG.htmhttp://www.undp.riga.lv/UNDP/programme/poverty.htmAdministrative Districts and Major Cities of Latvia: Statistical Yearbook 1999, Central
Statistical Bureau of Latvia, Latvian Statistical Institute, Riga, 1999.Ágh, A. (1999) Önkormányzatiság a magyar demokratizálásban, Politikatudományi
Szemle, No. 2, 1999.AI Report 1997, Latvia.Basta, L.I.: Decentralisation—Key Issues, Major Trends and Future Developments.Bossuyt, J. and J. Gould (2000) Decentralisation and Poverty Reduction: Elaborating
the Linkages. Policy Management Brief. No. 12. Maastricht: ECDPM.Chiefs of State and Cabinet Members of Foreign Governments
http://www.cia.gov/cia/publications/chiefs/chiefs98.htmCoping with Little Means in Latvia, Ministry of Welfare and UNDP, Riga, 2000.Darvas, Á. (2000) Utak vagy tévutak? Családtámogatások Közép-Kelet Európában,
Manuscript.Decentralised Governance Programme. UNDP, 1997.
http://www.undp.org/Docs/dec/DECEN923/Decenpro.htmDemographic Commission, Cabinet of Ministers, Republic of Latvia.Dunn, J., and D. Wetzel (2000) Fiscal Decentralization in Former Socialist Economies:
Progress and Prospects, World Bank.Esping–Andersen, G. (1999) Social Foundations of Post-industrial Economies. Oxford
University Press.Ethnicity and Poverty in Latvia, UNDP and Ministry of Welfare, Riga, 2000.European Charter of Local Government, Strasbourg, 15 October 1985.
T H E I M PA C T O F D E C E N T R A L I Z AT I O N O N S O C I A L P O L I C Y I N H U N G A R Y, L AT V I A A N D U K R A I N E

86
T H E I M PA C T O F D E C E N T R A L I Z AT I O N O N S O C I A L P O L I C Y
Gaster, L. (1999) Quality Management in Local Government—Issues and Experience.Public Policy and Administration. Volume 14, No. 3, Autumn.
Gender and Human Development in Latvia, Riga, 1999.Governmental Organizations
http://www.latnet.lv/wwwsites/government/governmental.htmhttp://www.latnet.lv/wwwsites/legislation/
Harcsa, István (1998) Social Care Provided by Local Government. Statisztikai Szemle.Horváth, T. (1999) A magánszektor és a decentralizáció szerepe a közszolgáltatások
szervezésében. Jogtudományi Közlöny, No. 1, 1999.ILO-CEET Newsletter, Social Budgeting—A Necessary Tool for the Sound Governance
of Social Protection Systems. ILO-CEET, 1998.Latvia—Human Development Report, 1996, 1997, 1998, 1999.Latvia: Selected Issues and Statistical Appendix, International Monetary Fund, 1999.Latvia: Selected Issues and Statistical Appendix, IMF, Staff Country Report No. 99/99,
September 1999.Leach, M., R. Means and I. Scoones (1997): Challenges to Community Based Sustain-
able Development; Dynamics, Entitlements, Institutions. IDS Bulletin, Vol. 28 (4),1997. http:///www.oneworld.org/euphoric/rondzend/feb98_3.htm
Listening to the Poor—Social Assessment of Poverty in Latvia, UNDP, Ministry of Welfare,Riga, 2000.
Litvack, J., J. Ahmad and J. Bird (2000) Rethinking Decentralization at the World Bank,Discussion Paper, 9 May 2000.
Local Government and Public Service Reform Initiative—Basic Statistical Datahttp://www.osi.hu/lgi/resources/ceecis94/latvia.htm
Macro-economic Portrait of Latvia’s Regions, Statistical Bulletin, Central Statistical Bureauof Latvia, Riga, 2000.
Manor, J. (1997) The Promises and Limitations of Decentralization: Summary, FAOTechnical Consultation on Decentralization, 16-18 December, Rome.
Martinez–Vazquez, J., J.E. McLure Jr. and S. Wallace (1994) Subnational FiscalDecentralisation in Ukraine.
McLure, J.E. Jr. (1999) The Tax Assignment Problem: Conceptual and AdministrativeConsiderations in Achieving Subnational Fiscal Autonomy, World Bank, 1999.http://www1.worldbank.org/wbiep/decentralization/Courses.
Mezei, I. (1999) Gondolatok, javaslatok az önkormányzat ellenôrzési rendszerének tovább-fejlesztésére. Pénzügyi Szemle, No. 6, 1999.
MISSCEEC, Consensus Programme, Phare, 1999.New Baltic Barometer.Overcoming Human Poverty, UNDP, 2000.Panina, N. and E. Golovakha (1999) Tendencies in the Development of Ukrainian
Society (1994–1998), Sociological Indicators. Kyiv, 1999.

87
T H E I M PA C T O F D E C E N T R A L I Z AT I O N O N S O C I A L P O L I C Y I N H U N G A R Y, L AT V I A A N D U K R A I N E
Péteri, G. (1993) “From the ‘Enterprising’ Local Government Towards Local EconomicDevelopment,” in: Private Sector Development and Local Government in Hungary,Budapest, Hungary: Public Policy Institute.
Poverty and the Labor Market in Latvia, Ministry of the Welfare of Republic of Latvia &UNDP, Riga, 2000.
Prospects for Pension Reform in Ukraine, USAID/PADCO Social Sector Reform Program,Kyiv, 2000.
Report on the Development of Economy of Latvia, Ministry of Economics, 1999.Reproductive Health of the Population of Latvia, Evaluation and Recommendations, Riga,
1998.Scott, W. (2000) Recent Changes in Social Conditions of Countries in Transition, United
Nations Research Institute for Social Development.Social Report 1997, Ministry of Welfare, Riga, 1998.Social Report 1998, Ministry of Welfare, Riga, 1999.Some Poverty Measures: 1996–1998, Central Statistical Bureau of Latvia.Statistical Bulletin on Social Assistance in Latvia 1999, Social Assistance Fund, Riga, 2000.Statistical Yearbook of Latvia 1999. Central Statistical Bureau of Latvia, 2000.Steinich, M. (2000) Monitoring and Evaluating Support to Decentralisation: Challenges
and Dilemmas, ECDPM Discussion Paper 19, Maastricht: ECDPM.Strategy Paper by the Government of Latvia (OECD).Straussman, J.D. and K. Lévai (eds.) (1996) Innovative Local Authorities, Local Society
Research Group, Budapest.Taylor, F. and L. Gaster (2001) In the Neighbourhood. Area Decentralisation and New
Political Structures. Designing Governance. Issues in Modernisation, Local GovernmentAssociation.
The Survey of Living Conditions in Latvia 1999: Informative Bulletin, Central StatisticalBureau of Latvia and FAFO Institute for Applied Social Science (Norway), Riga,2000.
Towns and Civil Parishes in the Administrative Districts of Latvia: A Collection of StatisticalData, Central Statistical Bureau of Latvia, Latvian Statistical Institute, Riga, 1998.
U.S. Department of State, Latvia Report on Human Rights Practises for 1997, Latvia.Ukraine—Memorandum for Economic Policies—for 1 July 1998-30 June 2001, 11
August 1998—in the Context of the Request of Ukraine for Financial Supportfrom the IMF.
UNICEF Annual Report, 1999.Vanags, E. and I. Vilka, Local Government in Latvia, in: T.M. Horváth (ed.) Decentraliza-
tion: Experiments and Reforms, OSI/LGI, Budapest. p. 138.Who and Where are Poor in Latvia, UNDP, Ministry of Welfare, Riga, 2000.Zám, M. (1998) A decentralizáció folyamata és az önkormányzat szociális támogatási
stratégiája, Magyar Közigazgatás, 1998/8.

C H A P T E R 2
The Impact
of Decentralization
on Social Policy
in Hungary
Baláz s Kr émer
■
I s t ván Sz ik la i
■
Kata l in Tau sz

90
T H E I M PA C T O F D E C E N T R A L I Z AT I O N O N S O C I A L P O L I C Y

91
Table of Contents
1. Social and Economic Consequences of the Transition ...................................... 931.1 Economic Recession ................................................................................ 931.2 Inflation ................................................................................................... 941.3 Public Finances ....................................................................................... 951.4 Unemployment ....................................................................................... 951.5 The Changing Nature of Poverty ............................................................ 97
2. Legacy of the Past ............................................................................................. 992.1 Demographic Indicators Influencing Social Policy ................................. 992.2 Institutional Arrangements .................................................................... 100
3. The Administrative System in Hungary .......................................................... 101
4. The Hungarian Social Security System ........................................................... 1034.1 General Remarks ................................................................................... 1034.2 The Actors of Social Policy ................................................................... 1044.3 Financing Social Policy ......................................................................... 1064.4 Family Support System .......................................................................... 1084.5 Social Provisions Offered by Self-governments ..................................... 1124.6 Personal Social Services ......................................................................... 1134.7 Social Assistance .................................................................................... 118
5. Decentralization and Social Policy: Conclusions ............................................ 1245.1 Legislation ............................................................................................. 1255.2 Social Provisions .................................................................................... 125
Notes ..................................................................................................................... 129
References ............................................................................................................. 130

92
T H E I M PA C T O F D E C E N T R A L I Z AT I O N O N S O C I A L P O L I C Y
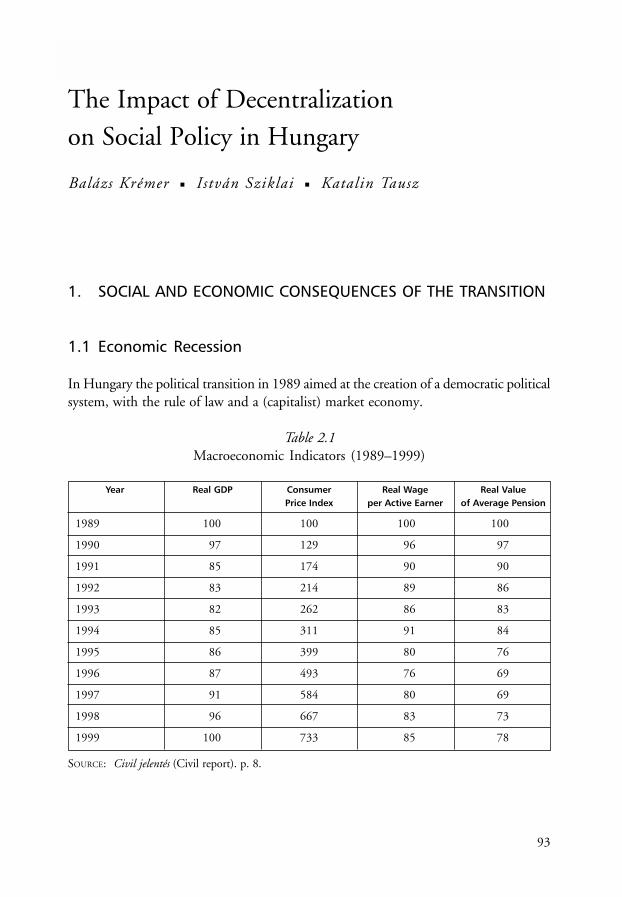
93
The Impact of Decentralization
on Social Policy in Hungary
Balázs Krémer ■ István Sziklai ■ Katalin Tausz
1. SOCIAL AND ECONOMIC CONSEQUENCES OF THE TRANSITION
1.1 Economic Recession
In Hungary the political transition in 1989 aimed at the creation of a democratic politicalsystem, with the rule of law and a (capitalist) market economy.
Table 2.1Macroeconomic Indicators (1989–1999)
Year Real GDP Consumer Real Wage Real ValuePrice Index per Active Earner of Average Pension
1989 100 100 100 100
1990 97 129 96 97
1991 85 174 90 90
1992 83 214 89 86
1993 82 262 86 83
1994 85 311 91 84
1995 86 399 80 76
1996 87 493 76 69
1997 91 584 80 69
1998 96 667 83 73
1999 100 733 85 78
SOURCE: Civil jelentés (Civil report). p. 8.

94
T H E I M PA C T O F D E C E N T R A L I Z AT I O N O N S O C I A L P O L I C Y
The transformation was accompanied by economic crisis, a heavy drop in GDP,high inflation, decreasing personal incomes, and the emergence and rapid growth of un-employment. The economy started to grow again in 1995, and GDP reached its 1989level in the year 2000. The most important social indicators—employment, wages, andpensions—are improving much more slowly.
Positive consequences of the change are a healthier economic structure with a potentialfor growth, the emergence of the rule of law, and the opportunity for civil society tosurface. However, the major part of society paid a very heavy price in the first ten years.Moreover, it is uncertain how the increase of resources will “trickle down” to the losersand how the social deficits will be corrected.
1.2 Inflation
Inflation has a great effect on the different strata of the population, though to a varyingextent. During the last decade, consumer prices significantly increased, but this variedconsiderably from product to product.
Table 2.2Consumer Price Indices by Main Group of Expenditure
1990=100%
Year Food Alcohol, Clothing, Durable Electricity, Other Services TotalTobacco Footwear Goods Gas Goods Incl.
and Other MotorFuels Fuels and
Lubricants
1991 121.9 125.1 132.1 131.7 181.0 143.4 141.9 135.0
1992 145.6 149.6 162.5 150.5 259.2 182.4 178.8 166.1
1993 188.1 177.5 189.6 167.1 311.8 221.8 221.9 203.4
1994 232.1 206.6 220.1 186.8 348.3 263.9 267.0 241.6
1995 304.3 248.1 264.6 231.6 522.5 335.9 336.4 309.7
1996 356.9 314.1 332.3 276.1 692.3 422.2 425.2 382.8
1997 419.4 373.5 394.4 299.6 899.3 490.2 506.8 452.9
1998 479.8 430.6 450.0 323.9 1,060.3 542.7 588.9 517.7
1999 493.8 480.1 497.7 345.3 1,160.0 622.5 676.1 569.5
SOURCE: Statistical Yearbook of Hungary 2000, HCSO, Budapest, 2001. p. 342.

95
T H E I M PA C T O F D E C E N T R A L I Z AT I O N O N S O C I A L P O L I C Y I N H U N G A R Y
The increase in the prices of basic consumer goods (food, housing, medicine) mostseriously affected the more vulnerable strata of the population thereby contributing signi-ficantly to the increase of poverty in Hungary.
1.3 Public Finances
It was considered that one of the most effective ways of handling the economic crisiswould be to decrease public expenditure. The cuts in the central budget had already beensignificant as a result of which the proportion of welfare expenditures decreased between1991 and 1998 by more than 10% within the GDP.
Table 2.3Public Expenditures as % of GDP, 1990–1999
1990 1991 1992 1993 1994 1995 1996 1997 1998 1999
Health 6.5 7.6 7.2 7.6 7.1 6.4 5.3 4.5 4.6 4.4
Education 8.2 9.3 8.5 9.3 9.9 8.5 7.7 4.8 4.8 4.7
Housing subsidies 3.6 2.5 1.2 1.1 0.8 1.2 0.9 1.7 1.6 1.4
Unemployment 0.1 0.7 1.6 1.7 1.2 0.9 0.7 0.5 0.7 0.6
Social provisions 0.2 0.9 1.0 1.8 1.8 1.7 1.6 2.2 2.1 2.3
Social insurance 14.9 17.2 15.5 15.6 14.7 12.9 11.8 12.4 12.2 12.0and family benefits
Total 33.5 38.2 35.0 37.1 35.5 31.6 28.0 26.1 26.0 25.4
SOURCE: A munkanélküliség ára, 2001. p. 36.
The unusually sharp cutback of social expenditures has not only been due to dimi-nishing resources. Ideological priorities, the weakness of the actors of the social sector,as well as the lack of democratic procedure played an important role in this process.
1.4 Unemployment
The rapid increase in unemployment was the most serious social problem in Hungaryafter 1989. Unemployment reached a peak in 1992 when 663,000 people were registeredat the labor market offices. This figure gradually declined, to about 400,000 in 1999.Meanwhile the number of people receiving a pension but below the eligible age limitrose from 260,000 in 1990 to 600,000 in 1998, and there are about 500,000 peoplewho withdrew completely from the labor market.
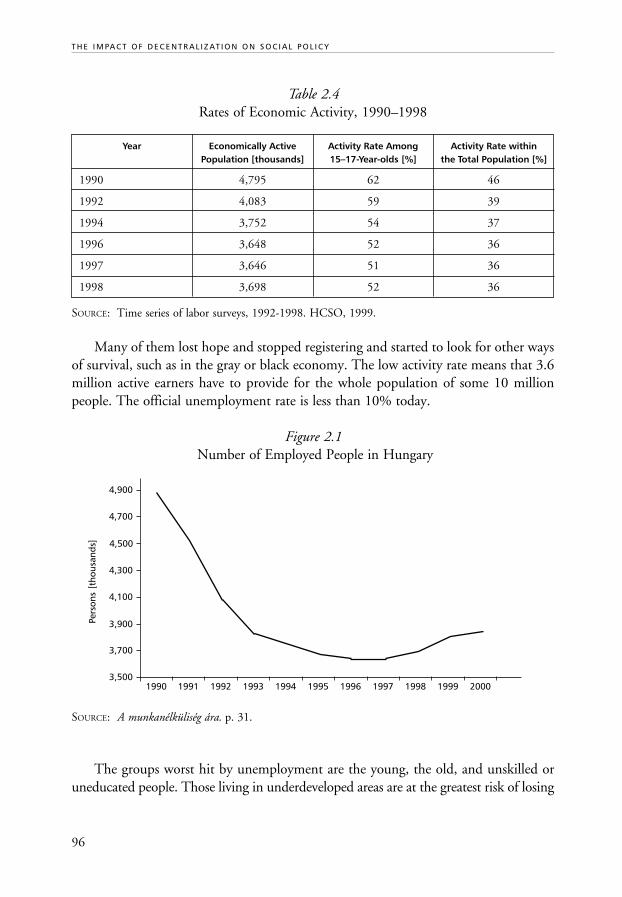
96
T H E I M PA C T O F D E C E N T R A L I Z AT I O N O N S O C I A L P O L I C Y
Table 2.4Rates of Economic Activity, 1990–1998
Year Economically Active Activity Rate Among Activity Rate withinPopulation [thousands] 15–17-Year-olds [%] the Total Population [%]
1990 4,795 62 46
1992 4,083 59 39
1994 3,752 54 37
1996 3,648 52 36
1997 3,646 51 36
1998 3,698 52 36
SOURCE: Time series of labor surveys, 1992-1998. HCSO, 1999.
Many of them lost hope and stopped registering and started to look for other waysof survival, such as in the gray or black economy. The low activity rate means that 3.6million active earners have to provide for the whole population of some 10 millionpeople. The official unemployment rate is less than 10% today.
Figure 2.1 Number of Employed People in Hungary
SOURCE: A munkanélküliség ára. p. 31.
The groups worst hit by unemployment are the young, the old, and unskilled oruneducated people. Those living in underdeveloped areas are at the greatest risk of losing
Pers
ons
[tho
usan
ds]
3,500
3,700
3,900
4,100
4,700
1990
4,900
4,300
4,500
1991 1992 1993 1994 1995 1996 1997 1998 1999 2000

97
their jobs. The unemployment rate of Roma is significantly higher than that for otherethnic groups. The rate of the long-term unemployed—those who are unemployed formore than 12 months—has rapidly escalated. It reached 50% in 1995. Since then ithas slightly diminished. The decrease is due more to the withdrawal of the long-termunemployed from registration than to re-entry to the labor market.
Table 2.5Number and Characteristics of the Unemployed
Year Registered Unemployed According to International (LFS) Standards
Unemployed Total Number Women Long Term[thousands] [thousands] [%] Over 12 months [%]
1990 80 — — —
1991 406 — — —
1992 663 442 40.1 21.0
1993 632 519 39.1 35.2
1994 520 451 39.0 43.2
1995 496 417 37.0 50.6
1996 477 400 39.0 54.4
1997 464 349 38.6 51.3
1998 404 313 39.6 49.8
SOURCE: Civil jelentés (Civil report). p. 31.
1.5 The Changing Nature of Poverty
As a result of the economic reform measures prior to the change of the political systemin 1989, inequalities in income had already begun to increase in the 1980s.
In 1982 incomes in the highest income decile were 3.8 times higher than in thelowest one; by 1999, however, this value had increased 8-fold. The existential securityof a growing number of families was endangered and several groups were facing poverty.The change of the “official” income of households has still not reached the inflation rate;the net income of households has decreased. The growth in income inequalities and ofpoverty was due to the labor market situation (the radical decrease of the number ofthose employed, the stabilization and increase of long-term unemployment, etc.), and tothe withdrawal of price subsidies, as this was rooted in the system of income redistri-bution.
T H E I M PA C T O F D E C E N T R A L I Z AT I O N O N S O C I A L P O L I C Y I N H U N G A R Y

98
T H E I M PA C T O F D E C E N T R A L I Z AT I O N O N S O C I A L P O L I C Y
Table 2.6Changes in Poverty Rates [%]
1992 1993 1994 1995 1996 1997 1998
O B J E C T I V E P O V E R T Y
Relative income poverty 10.1 10.4 11.6 12.4 14.9 13.4 15.1(under 50% of mean income)
Absolute income poverty 10,1 12.5 16.1 19.9 26.6 28.3 —
S U B J E C T I V E P O V E R T Y
Monthly financial crisis 26 26 25 25 28 31 —
No financial crisis at all 29 39 41 41 31 36 —
SOURCE: Civil jelentés (Civil report). p. 11.
The ratio of those who live under the subsistence minimum calculated for 1990 bythe Hungarian Central Statistical Office has tripled: it was around 10% in 1990. By1993 this figure had increased to 22-25%, and since then it has been around 30%.
Table 2.7Proportion of the Relatively Poor
(under 50% of the mean equivalent income) in Some Typical Groups
1992 1997 1998/99
Total 10 14 14
0–2 year-old children 15 35 31
3–6 year-old children 14 28 23
Couple with 3 children — — 41
One parent with a child — — 33
Roma 46 58 60
Unemployed 17 37 46
SOURCE: Civil jelentés (Civil report). p. 27.
In Hungary the economic transition changed the living conditions of all households.It brought improvement for about one third of the population, and significant improve-ment for a much narrower group. Meanwhile, the situation of the broadest strata hasdeteriorated to a smaller or larger extent, sometimes to a tragic extent. Poverty has hitseveral, well definable groups, and has many causes.
99
The groups most at risk are the following:• Unemployed, first and foremost long-term unemployed, or families where the
head of household is unemployed, or where there are no wage earners at all. Thesituation of seasonal or occasional workers is not much better;
• Families with children, particularly those with several children, those who havevery small children with the mother on child-care benefit, or single-parent families,headed mostly by women;
• the elderly, particularly those living in single households, and among them mainlythe oldest women;
• the Roma, who are hit simultaneously by many causes of poverty: their unemploy-ment rate is high, their educational level is low, many of them live in dis-advantagedvillages or regions, their health status is bad, their number of children is high;
• the disabled;• the homeless.
As far as regional differences are concerned, the north-west part of the country isthe best off (the rate of poverty is 9%), the north east is worst off (18% poverty). Therisk of poverty is twice as high in the villages as in Budapest.
In the redistribution of incomes both cash benefits and taxation play an importantrole. Although this research project does not cover the effects of the taxation system onpoverty it is important to emphasize that one of the major negative characteristic featuresof the Hungarian personal income tax system is that it makes even the smallest incomestaxable, thereby contributing towards increasing the number of the working poor. Thesystem of tax allowances results in a bottom-up (perverse) redistribution of incomes.These features broaden rather than reduce vertical income inequalities.
2. LEGACY OF THE PAST
2.1 Demographic Indicators Influencing Social Policy
Since 1980 the Hungarian population has been decreasing. The decline is greater amongthe male population. One of the most serious demographic problems of Hungarian society—and one that strongly affects social policy, especially the social insurance system—isthe ageing of the population.
The following trends are the main causes of such demographic problems:
• the number of live births has decreased, while the number of deaths has becomestable at a high level;
T H E I M PA C T O F D E C E N T R A L I Z AT I O N O N S O C I A L P O L I C Y I N H U N G A R Y
100
T H E I M PA C T O F D E C E N T R A L I Z AT I O N O N S O C I A L P O L I C Y
• fertility, and the willingness of young age-groups to have children continued todecrease in the 1990s; the numbers of first-borns fell as did the number of secondchildren; however, more people are willing to give birth to three and more children;
• since 1980 the tendency of ageing became a stable process though with smallerfluctuation;
• the percentage of the population of economically active age fell;• the marriage rate is decreasing year by year;• more and more children are being born out of wedlock.
In Hungary, for the year 1999, the average life expectancy at birth was 66.14 yearsfor males (roughly the same as at the end of 1960); the average life expectancy for femaleswas more favorable, it has reached 75.18 years. From the 1960s until 1989 it showedan increasing trend, and since 1989 it has remained almost constant.
2.2 Institutional Arrangements
In state-socialist Hungary (i.e. prior to the change in the political system) there existeda wide range of social provisions, but they were embedded into a completely differentarchitecture than in the traditional Western welfare states.
The main actors of the socialist social policy were the state-owned companies. As aconsequence of the labor-extensive economic and investment strategy, as well as for ideo-logical reasons, there was full and compulsory employment in Hungary. The low levelof productivity, of product-quality, and the lack of innovation and effective incentivescontributed to the collapse of the command economy giving no chance of maintainingthe former level of employment.
The extended system of consumption subsidies and subsidized consumer prices wasanother important characteristic of socialist welfare policy. Cheap food, housing, heating,energy, public transport, medicine and many other consumer goods were somehow afford-able for the vast majority of the population. This system, however, could never workproperly, mostly due to the shortages of certain basic necessities, first of all housing. Theshortage of subsidized basic goods multiplied the unjust “perversity” of distribution asthe better-off groups had access to these consumer goods as well as obtaining the majorityof the subsidies.
Occupational welfare (housing, pre-school institutions, cheap meals, recreationalfacilities, etc.) can be regarded as the third decisive element of the socialist welfare system.
The Hungarian welfare services included:
• almost full coverage in pension, old-age income security;• broad (but low quality) health care system;

101
• an efficient and effective family benefit system;• a relatively developed care system, especially regarding nursing and residential
care for elderly people;• an extended child protection system;• certain types of social assistance.
Most of the social provisions, however, were provided as a gift from the CommunistParty, the state. Thus the social provisions were based on people’s rights.
It would not be a huge mistake to state that social problems played a crucial role inthe crises of the socialist regime, at least in Hungary. The regime was evidently unableto fulfil its own promises concerning the well being of the citizens. Despite the originaldesire for the “big leap” to achieve Western standards, the gap became wider and widerbetween the West and the East. In spite of full employment, significant price subsidiesand other social policy measures, poverty existed in state-socialist Hungary, but most ofthe population were not subjected to the deepest levels of misery from the 1950s onwards.In this period, elderly citizens living on low pensions, disabled people, and the Romanypopulation were mostly hit by existential insecurity and very low income. The standardof living and the quality of life of the population fell short of those of the developedWestern societies.
3. THE ADMINISTRATIVE SYSTEM IN HUNGARY1
Hungary has 10.1 million inhabitants. One fifth of the population lives in Budapest,the capital, and almost half of the country’s citizens reside in settlements (cities, towns,and villages) of less than 20,000 inhabitants. The total number of settlements exceeds3,100.
Hungary has a market-based economy functioning in a parliamentary democracy.The establishment of democratically elected governments and the institution of free andfair elections were the first and most important achievements of the post-1989 transitionprocess. Over the past ten years Hungary has achieved a relatively transparent structureof competing political parties.
The Act on Local Self-Governments sets out in detail the general rights of localgovernments following the principles defined in the Constitution. A key step in trans-forming the socialist system was the introduction in 1990 of the system of local self-governments instead of the Soviet-type council system. The Act on Local Self-Governmentscreated two basic types of local self-governments: local community based- and countylevel municipalities.
T H E I M PA C T O F D E C E N T R A L I Z AT I O N O N S O C I A L P O L I C Y I N H U N G A R Y

102
T H E I M PA C T O F D E C E N T R A L I Z AT I O N O N S O C I A L P O L I C Y
Table 2.8Number of Administrative Units as at 1 January 2000
Counties 19
Capital, towns of county rank 23
Other towns 199
Villages 2,913
A local self-government is entitled to take the responsibility for practicing local publicaffairs, and for their direction and management, and can take care of meeting local needs.Decisions made by a local self-government can be questioned in court or in the Constitu-tional Court only by claiming a violation of the law.
At the same time, local self-governments deal with the mandatory tasks defined bylaw. The financial resources necessary for implementing these tasks need central provision.As it has become necessary to define the mandatory tasks of the various levels of local self-governments in detail, the law stipulates in a differentiated manner the responsibilities ofthe municipalities (local self-governments of communities, towns, cities, the capital, andits districts) and those of county self-governments.
The law sets forth the legal status, tasks and responsibilities, organization, guaranteesfor operation, basic rules of business management, election, rights, and obligations of localgovernments in detail.
The local municipality is one of the basic types of local self-government. The functionof a town’s local self-government is somewhat broader than that of a village: the institutionsof the former have to meet district level needs as well. The council of representatives electsthe mayor. Budapest has a special legal status.
The community level local self-governments are obliged to provide pre-school childcare, primary education, health and social care, and healthy drinking water, as well as publiclighting; they are responsible for the maintenance of local public roads and cemeteries;and they are required to ensure the enforcement of national and ethnic minority rights.
The county municipality is an independent body. The county municipality, a regionalgovernment, is obliged to cope with the tasks provided for by the law and which are out-side the scope of a community government. County municipalities are responsible forthe organization of such public services which are designed to meet the middle level needsof the county’s population and which cannot be covered by any of the townships or localgovernment associations effectively and in a democratic way.
County municipalities are entitled to freely manage their income, to make decisionsor decrees in which they define surplus allowances beyond the minimum mandatoryservices and subsidies determined as statutory obligations.

103
The county municipalities have the following tasks as mandatory functions: secondarylevel education; collection, preservation and scientific processing of matters relating tocounty level natural and cultural heritage, and historical documents; county library services;educational consultancy and services; management of county level sports and physicaleducation; children’s and young people’s rights; education of children under permanentmedical treatment in medical institutions, education and care of mentally disabledchildren; special health care beyond basic health care; children and youth protectionspecial care; regional harmonization of special social services.
County municipalities and the Budapest Municipality arrange those special care serviceswhich are beyond the scope of the mandatory tasks of community local governments;the regional co-ordination of special social services.
Community local governments are not subordinate to county level municipalities.Sometimes county municipalities are nothing more than operators whose responsibility
involves the maintenance of social, educational and children’s institutions that are beyondthe possibilities of community self-governments. When enforcing special standards, manyproblems arise from this conflict: several county municipalities are not very eager to takethis responsibility, for in most cases normative subsidies from the state destined to coverthe costs of operating such institutions usually do not make up more than 70% of theactual costs.
The general assembly of the elected members of local and county self-governmentsis the main decision-making authority. It can transfer certain responsibilities to its com-mittees and other types of bodies to ensure the management of the affairs. The work ofthese bodies is assisted by the municipality office in the preparation of the decision-making processes and in the organization as well as the supervision of the implementationof decisions made. The role of the mayor (in the local self-governments) and of the chair-person (in the county self-governments) is primarily political; the head of the office (thenotary) exercises the executive power, being responsible for the management of the admi-nistration and for the operation of the office of the self-government.
The public administration offices in the capital and at the counties are the regionalpublic administration bodies of the government. The main responsibility of these regionalpublic administration offices covers the examination of the legality of the decision-makingprocesses and of the operation of the local self-governments.
4. THE HUNGARIAN SOCIAL SECURITY SYSTEM2
4.1 General Remarks
The transition period can be interpreted not only in political and economic terms, butalso as the birth of a new welfare system.
T H E I M PA C T O F D E C E N T R A L I Z AT I O N O N S O C I A L P O L I C Y I N H U N G A R Y

104
T H E I M PA C T O F D E C E N T R A L I Z AT I O N O N S O C I A L P O L I C Y
The basic features of the new system are the following:• social policy or the social sector became an independent sub-system within society;• with the Social Act (1993), social provisions became, if not rights based, legally
based;• with the appearance of mass unemployment, employment- or social insurance
related social provisions have gained a new meaning;• social policy has had to face real-life situations, resulting from a huge number of
people being left with no income and having become dependent on social transfers;• local self-governments have gained a key role in social provisions;• different forms of means testing have gained increasing importance in the social
protection system;• a pluralistic welfare system or, in other words, a welfare mix has come into exis-
tence: in addition to the public and informal sector, non-profit and market-based participants are also present in the various services.
Social services are financed either from the central state budget and various socialinsurance funds (pension fund, health care, and labor market funds), or by the local self-governments.
4.2 The Actors of Social Policy
The central and the local state, the market, the non-profit as well as the informal sectortake part in providing social services in Hungary.
Table 2.9Non-profit Organizations Providing Welfare Services [%]
Total NGOs=100%
1995 1996 1997 1998
Child protection 1.2 1.3 1.4 1.5
Family protection 0.8 0.8 0.8 0.9
Support for disabled persons 1.5 1.7 1.9 2.0
Support for the elderly 0.6 0.6 0.7 0.8
Self-help 0.4 0.3 0.3 0.2
Other support for people in need 0.4 0.6 0.7 0.8
Total NGOs 43,051 45,316 47,365 47,384
SOURCE: Szociális Statisztikai Évkönyv 1998. KSH 2000.

105
Within the central government the Ministry of Welfare (now called the Ministry ofSocial and Family Affairs) is responsible for social policy. Several people referred to theweak lobbying capacity of the ministry during the interviews carried out in the courseof the research work.
The local self-governments form different alliances in Hungary. These actors mayexpress their views in the various public forums, directly lobby the political parties, andparticipate in the activities of the institutionalized forms of social dialogue. There areseven national alliances in Hungary available to represent the self-governments, howeveralmost half of the local self-governments do not form part of any of these alliances. Thisfact, the lack of the decision-making power of the council as well as its incompetencies,do not make it possible to deal with social policy issues there. In effect, even though theresponsibility for the majority of social policy related problems falls to the local self-governments they have no effective legally guaranteed means of influencing social policyrelated legislation.
There are three principal institutions for social dialogue: the National ReconciliationCouncil superseded by the Economic Council, the National Labor Council and its regionalbranches, and the Social Council.
The National Reconciliation Council was founded in 1990. It was based on a tri-partite system with the participation of the representatives of the employers’ associations,the trade unions, and the government. It had the right to discuss any piece of legislationbefore the process of being enacted. Concerning social legislation, this responsibilitywas exercised primarily by the social committee of the National Reconciliation Council.On several occasions the trade unions expressed their views on social issues and stressedthe necessity of a more generous social provision system, but had never threatened withstrikes or demonstrations for social policy. As a matter of fact, whenever social policyclashed with labor issues, they took sides against those living on social assistance.
The Economic Council took over some of the National Reconciliation Council’sroles when the latter was done away with as one of the first activities of the new governmentin 1998. The participants of economic life take part in the Economic Council, whichacts as a consultative organization of the government though it has no right or power toenforce the priorities of the organizations representing the employers’ or employees’interests.
The National Labor Council works with the participation of the representatives ofthe employers, the employees, and the local self-governments, but its activities are limitedto the process of labor-related disputes and agreements; it has no mandate to discussother types of social issues.
The Ministry of Welfare initiated the establishment of the Social Council at the be-ginning of the 1990s by voluntarily joining non-profit and interest-representing organi-zations “to monitor some of the social problems and to elaborate proposals for theirsolution.”3 Neither the objectives, nor the mandate of the Social Council are clear.Principally, it can be characterized as a consultative body for the Minister.
T H E I M PA C T O F D E C E N T R A L I Z AT I O N O N S O C I A L P O L I C Y I N H U N G A R Y
106
T H E I M PA C T O F D E C E N T R A L I Z AT I O N O N S O C I A L P O L I C Y
As is apparent, the system of social dialogue is heavily dependent on party politicsand those organizations have the chance to influence parliamentary or governmental decision-making processes which are in some way linked with one or some political parties.
All these processes can be interpreted as having a contradictory character: the abolitionor weakening of the institutions of social dialogue reflects the intention of the centralgovernment to re-centralize certain institutions of social policy, while the increasing roleof local self-governments in the social sector is a strong indicator of decentralization, or—it is more correct to say—of over-centralization.
The national government, the most important actor in financing social policy doesnot know what it buys or gets for its money because of the lack of an appropriate moni-toring and evaluating system.
Politically independent civic organizations can appeal only to the public. In a countryof scores of NGOs, but without a strong civil society, this means of expressing opinioncannot be too successful.
4.3 Financing Social Policy
Different normative state subsidies provide the basic financial resources of local socialpolicy in Hungary. According to the recent legal regulations, the state is obliged toensure these financial resources for the local self-governments, but they are given theright to decide their utilization, even for other purposes.
Local self-governments are entitled to manage their incomes independently, thoughthey are required by law to operate certain services. In practice, free management meansthat the council of representatives can decide what kind of services they prefer. In severalcases the local self-governments, because of the lack of resources, use these resources forother purposes such as financing primary education, developing the local infrastructure,etc.
One of the basic findings of our research was that local self-governments do not haveany clear concepts with regard to their social security systems. Frequently they providethe minimum required by law on a residual basis. Other budgetary and fiscal considerationsusually overwrite social aspects in defining annual budgets. (We have met a county muni-cipality, for instance, where the normative state subsidy dedicated to cover the costs ofboarding institutions for mentally disabled people was not used for this purpose but itwas “rescheduled” for educational purposes even though the standard of living in theinstitutions did not meet the standards required by law.)
The majority of the representatives of the local welfare administration would liketo have fixed (earmarked) subsidies to protect the welfare expenditure during the localfinancial bargaining, which may be interpreted as them being in favor of diminishingthe scope of financial decentralization.

107
Figure 2.2Role of the State in Local Government Financing
1991=100%*
* in real terms
SOURCE: http://www.b-m.hu/onkormanyzat
The centrally provided financial resources do not cover the total costs of the servicesand the poorer settlements meet the local needs on a lower level than the cities withhigher revenues. The method of calculating normative subsidies does not realisticallyreflect the local employment situation or the income inequalities. The consequence is agap between the regional level and settlement level is widening.
The revenues and the public expenditure of the local self-governments show anegative correlation: the deficit is continuously increasing in the social sector in the weakersettlements—the latter being forced to use developmental resources to avoid bankruptcy.The constant widening of the responsibilities of local self-governments (e.g. the supportof the unemployed) may add to the financial difficulties of the local self-governments asa result of which they may apply absurd forms of local discretion. The financial planningprocedure of the local self-governments is compelled to adjust to the dysfunctional systemof state subsidies, thus planning based on the budget of the previous year will be thedominant approach thereby hindering the spread of social policy innovations.
T H E I M PA C T O F D E C E N T R A L I Z AT I O N O N S O C I A L P O L I C Y I N H U N G A R Y
[%]
0
5
10
15
30
1991
35
20
25
40
1992 1993 1994 1995 1996 1997 1998 1999
Year
The ratio of state normativesubsidies within the total budget
of local governments
The ratio of state subsidiesfor local governments
within the total state budget
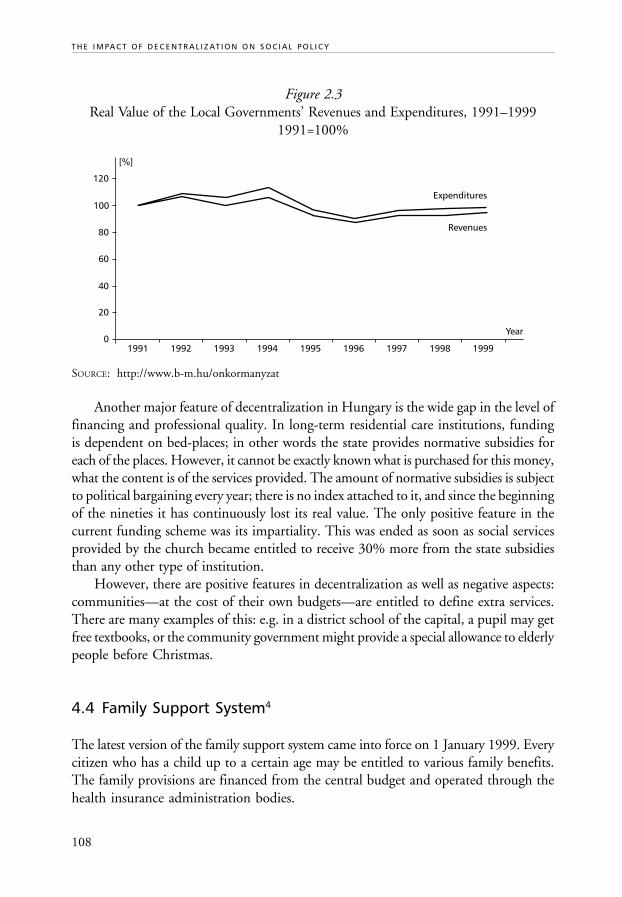
108
T H E I M PA C T O F D E C E N T R A L I Z AT I O N O N S O C I A L P O L I C Y
Figure 2.3Real Value of the Local Governments’ Revenues and Expenditures, 1991–1999
1991=100%
SOURCE: http://www.b-m.hu/onkormanyzat
Another major feature of decentralization in Hungary is the wide gap in the level offinancing and professional quality. In long-term residential care institutions, fundingis dependent on bed-places; in other words the state provides normative subsidies foreach of the places. However, it cannot be exactly known what is purchased for this money,what the content is of the services provided. The amount of normative subsidies is subjectto political bargaining every year; there is no index attached to it, and since the beginningof the nineties it has continuously lost its real value. The only positive feature in thecurrent funding scheme was its impartiality. This was ended as soon as social servicesprovided by the church became entitled to receive 30% more from the state subsidiesthan any other type of institution.
However, there are positive features in decentralization as well as negative aspects:communities—at the cost of their own budgets—are entitled to define extra services.There are many examples of this: e.g. in a district school of the capital, a pupil may getfree textbooks, or the community government might provide a special allowance to elderlypeople before Christmas.
4.4 Family Support System4
The latest version of the family support system came into force on 1 January 1999. Everycitizen who has a child up to a certain age may be entitled to various family benefits.The family provisions are financed from the central budget and operated through thehealth insurance administration bodies.
[%]
0
20
40
60
120
1991
80
100
1992 1993 1994 1995 1996 1997 1998 1999
Year
Revenues
Expenditures

109
The new family support act declares that the objectives of the family support schemesare to increase the equality of opportunity for families with children, to recognize theadditional costs of bringing up children and to promote the realization of the government’spopulation policy.
The most important schemes promoting families with children are: the educationbenefit consisting of a family allowance (paid till school age) and education support,child care allowance (GYES, for parents who are taking care of their children under age3 and under age 10 for disabled children), child care fee (GYED) and child care support(GYET, for a mother or a father who is bringing up three or more children), birth grant(lump sum payment for those giving birth).
The local self-government has true decision-making power in the case of education support, allthe other rights-based provisions are centralized. If a school has indicated a problem relating toa child, the local self-government investigates the situation through the child protectionorganizations and, if necessary, intervenes. This intervention may take place in different forms.The notary may decide to provide the cash education support in in-kind form.
It is important, however, what the different settlements consider a problematic situationand what kind of interventions are enacted. There is not a clear-cut definition of the situationwhen a child is endangered.
SOURCE: Interview with the Head of Department of Welfare at a district self-government in Budapest.
In the final years of the state-socialist system, family allowance per child coveredabout one fifth of the gross average wage for families with two parents and two children.By 2000 this amount had decreased to approximately 6% of the average wage. Nowadaysthe sum of the child care allowance and child care support is equal with that of the mini-mum old-age pension; thus these are in principle indexed, but in reality the politicaldecision on the minimum old-age pension is dependent on the “budgetary” preferencesof the ruling political elite. When evaluating the adequacy of family provisions one mustrealize that in spite of the important poverty relief effect of these schemes, a significantloss in the real value of these benefits took place.
Table 2.10 Main Characteristic Features of Child Care Benefits: Child Care Allowance(GYES), Child Care Fee (GYED), Child Care Support (GYET) After 19985
Objectives GYES–GYET: guarantee subsistence bases; GYED:guarantees previous living standard,but with a ceiling in the sum to be provided
Means GYES–GYED–GYET: compensation for economic losses
Personal scope GYES–GYET: as of right; GYED: people in work
T H E I M PA C T O F D E C E N T R A L I Z AT I O N O N S O C I A L P O L I C Y I N H U N G A R Y

110
T H E I M PA C T O F D E C E N T R A L I Z AT I O N O N S O C I A L P O L I C Y
Table 2.10 (continued) Main Characteristic Features of Child Care Benefits: Child Care Allowance(GYES), Child Care Fee (GYED), Child Care Support (GYET) After 19985
Allocation criteria GYES–GYET: universal; GYED: employment-and earnings-related, selective right
Allocation entity GYES–GYET: any parent; GYED:mother, father after the child is one-year-old
Criteria for benefit calculation GYES–GYET: flat rate; GYED: earning-related with a ceiling
Sources of finance GYES–GYED–GYET: taxes
Administration Health insurance administration
Table 2.11Real Value of Some Family Benefits, 1990=100%
1990 1991 1992 1993 1994 1995 1996 1997 1998
Family allowance/child 100.0 91.9 82.1 70.0 57.1 48.1 37.5 39.2 37.1for families withtwo children
Child care allowance 100.0 104.5 90.7 84.5 84.5 80.1 71.6 75.5 71.1
Child care fee 100.0 98.9 91.6 90.2 84.2 84.0 78.6 77.0 92.2
Maternity benefit 100.0 81.7 91.4 27.2 22.2 17.8 20.9 66.4 59.3
SOURCE: Garzó, 2000.
All sorts of calculations prove that family allowance can play an important role inreducing poverty. Analysis of household data of the 1980s had already shown that familyallowance had been the best-targeted benefit for the truly needy among the more signifi-cant social provisions.
Table 2.12 Effectiveness of Poverty Reduction [%] (Poverty threshold: the lowest quintile.The 100% level illustrates the extent of poverty with those incomes elements)
Year Poverty Reduction Effect of
Pre-family Pre-unemployment Pre-pension Pre-socialAllowance Poverty Benefit Poverty Poverty Assistance Poverty
1991–92 136 112 203 105
1992–93 130 114 247 104
1993–94 123 112 248 104

111
Table 2.12 (continued) Effectiveness of Poverty Reduction [%] (Poverty threshold: the lowest quintile.The 100% level illustrates the extent of poverty with those incomes elements)
Year Poverty Reduction Effect of
Pre-family Pre-unemployment Pre-pension Pre-socialAllowance Poverty Benefit Poverty Poverty Assistance Poverty
1994–95 135 110 217 105
1995–96 128 111 216 102
1996–97 117 106 231 104
1997–98 120 110 227 107
SOURCE: Medgyesi, M., M. Sági, and P. Szívós, 1999. pp. 32–33.
In view of the information provided in Table 2.12, it is all the more remarkablethat children, especially those living in families with three or more children, and singleparent families, are the hardest hit by the inadequacy of the family support system:neither the welfare provisions nor the family can financially compensate the disadvantagesresulting from having children. The results of the Household Panel Surveys of TÁRKIindicate that the child poverty is not a transitory phenomenon. In fact, the last HouseholdMonitor survey of TÁRKI showed a striking risk of poverty of children.
Table 2.13Number of Registered Children at Risk by Reason
Reason for Registration 1988 1992 1996 1998of Children at Risk N = 109 909 N = 305 113 N = 331 923 N = 380 341
Financial 32.13 74.57 75.31 82.83
Family circumstances 44.74 15.75 14.62 10.22
Behavioral 21.09 8.51 8.68 5.57
Health 2.02 1.14 1.37 1.38
Total 100.00 100.00 100.00 100.00
Children at risk in the 0–18 3.95 11.32 13.46 16.27years of age population [%]
SOURCE: Tájékoztató a család, gyermek- és ifjúságvédelemrôl. Népjóléti Minisztérium, 1996.
Summing up:• the existing family protection system cannot solve the problem of child poverty;• there are no adequate measures to maintain the real value of the cash benefits for
families with children;
T H E I M PA C T O F D E C E N T R A L I Z AT I O N O N S O C I A L P O L I C Y I N H U N G A R Y
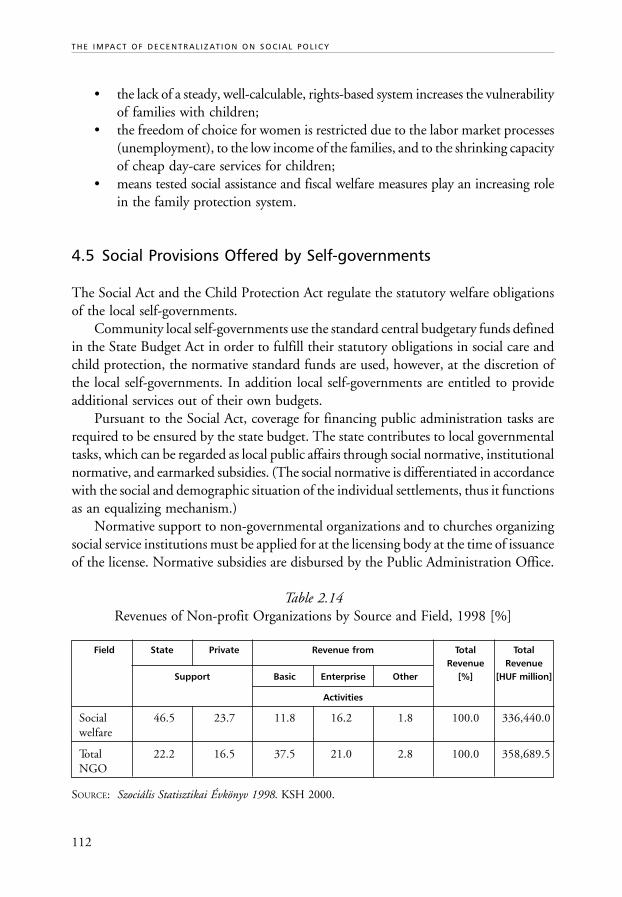
112
T H E I M PA C T O F D E C E N T R A L I Z AT I O N O N S O C I A L P O L I C Y
• the lack of a steady, well-calculable, rights-based system increases the vulnerabilityof families with children;
• the freedom of choice for women is restricted due to the labor market processes(unemployment), to the low income of the families, and to the shrinking capacityof cheap day-care services for children;
• means tested social assistance and fiscal welfare measures play an increasing rolein the family protection system.
4.5 Social Provisions Offered by Self-governments
The Social Act and the Child Protection Act regulate the statutory welfare obligationsof the local self-governments.
Community local self-governments use the standard central budgetary funds definedin the State Budget Act in order to fulfill their statutory obligations in social care andchild protection, the normative standard funds are used, however, at the discretion ofthe local self-governments. In addition local self-governments are entitled to provideadditional services out of their own budgets.
Pursuant to the Social Act, coverage for financing public administration tasks arerequired to be ensured by the state budget. The state contributes to local governmentaltasks, which can be regarded as local public affairs through social normative, institutionalnormative, and earmarked subsidies. (The social normative is differentiated in accordancewith the social and demographic situation of the individual settlements, thus it functionsas an equalizing mechanism.)
Normative support to non-governmental organizations and to churches organizingsocial service institutions must be applied for at the licensing body at the time of issuanceof the license. Normative subsidies are disbursed by the Public Administration Office.
Table 2.14Revenues of Non-profit Organizations by Source and Field, 1998 [%]
Field State Private Revenue from Total TotalRevenue Revenue
Support Basic Enterprise Other [%] [HUF million]
Activities
Social 46.5 23.7 11.8 16.2 1.8 100.0 336,440.0welfare
Total 22.2 16.5 37.5 21.0 2.8 100.0 358,689.5NGO
SOURCE: Szociális Statisztikai Évkönyv 1998. KSH 2000.

113
The legality of the use of normative state subsidies is checked by the Public Administ-ration Office once a year. Supervision and checking take place at the same time as theannual accounts are prepared but not later than 31 March of the following year. Whensending the accounts, the Office is required to inform the Ministry of Social and FamilyAffairs about the scope of institutions receiving subsidies during the current year, indicatingthe name, address, and activity of the institution in question.
Non-governmental organizations and church-operated social institutions are obligedto handle the use of normative state subsidies and contribution fees separately—in abreakdown by tasks—in their books.
Both the Home Office and the Public Administration Office debit any excess subsidydisbursed and credits any unpaid and valid claims arising during the ongoing accountingperiods for the subsequent period.
4.6 Personal Social Services6
Personal social services can be categorized into two main groups: child protection andcare services in the form of basic and special services, and “adult care” services in the formof basic and special services.
Basic services include:
• catering;• home help;• family assistance service;• child welfare service;• day care services for children (nursery, family day-care service, home child-care);• temporary care of children (replacement/foster parent, temporary home for
children, temporary family homes).
Special services include:
• institutions providing care and nursing (old people’s club, homes for the disabledand for psychiatric patients, addictive patients, the homeless and children);
• rehabilitation institutions (giving psychiatric and rehabilitation care to thedisabled, the homeless and addicts);
• day-care institutions (old people’s club, daytime institution for handicappedpeople, daytime shelter, day-care institutions for addicts, day-care institution forpsychiatric patients);
• institutions providing temporary shelter (old people’s home, home for handi-capped people, temporary home for psychiatric patients and addicts, night shelterand night accommodation for homeless people);
T H E I M PA C T O F D E C E N T R A L I Z AT I O N O N S O C I A L P O L I C Y I N H U N G A R Y

114
T H E I M PA C T O F D E C E N T R A L I Z AT I O N O N S O C I A L P O L I C Y
• nursing homes (for psychiatric patients, and the handicapped);• foster parents;• regional child protection service.
Adult users of the personal care services are required to contribute towards the serviceutilized, based on the regular monthly income of the service user. Anybody who is unableto pay or who has no relative to pay for him or her is entitled to use the service free of charge.
Local self-governments are obliged to provide basic adult care and child welfare services,and they are required to organize the day care and temporary care services for children.
Homes and nursing homes providing care and nursing services, and rehabilitationand daytime services and institutions offering temporary shelter are organized by localself-governments on whose territory:
• there are more than 2,000 permanent residents—in addition to the basic careservices, provision of day-care institutional services;
• there are more than 10,000 permanent residents—provision of basic care services,day-care services, and the operation of an institution offering a temporary homefor the elderly;
• there are more than 20,000 permanent residents—provision of basic care services,day-care services, operation of an institution offering temporary home for oldpeople, and day-care institutions;
• there are more than 30,000 permanent residents —provision of basic care services,day-care services, operation of an institution offering temporary home for oldpeople, day-care institutions, institutions providing temporary shelter.
County and Budapest local governments are responsible for providing services incare and nursing institutions, rehabilitation institutions and nursing homes as well asspecialized child protection services.
There is not enough money to operate and develop the necessary facilities. But other reasons alsocontribute to the deficiencies. In a focus group discussion, local politicians mentioned as an examplethe services for homeless people. It has been impossible to solve the reconstruction and buying ofthe rented building used as a temporary shelter. The inhabitants opposed all the plans. Some ofthe local politicians do not want to go against the “mood” of the public and sometimes theythemselves excite it.
SOURCE: Interview with a representative of the local self-government in Székesfehérvár.
The social services system “inherited” the socialist network of large and closed socialhomes. The system has since been opened up but sometimes the operation of homeswith 200 or more residents poses great problems, and the constant improvement of thequality of life of those living in them results in considerable expense. When the responsi-
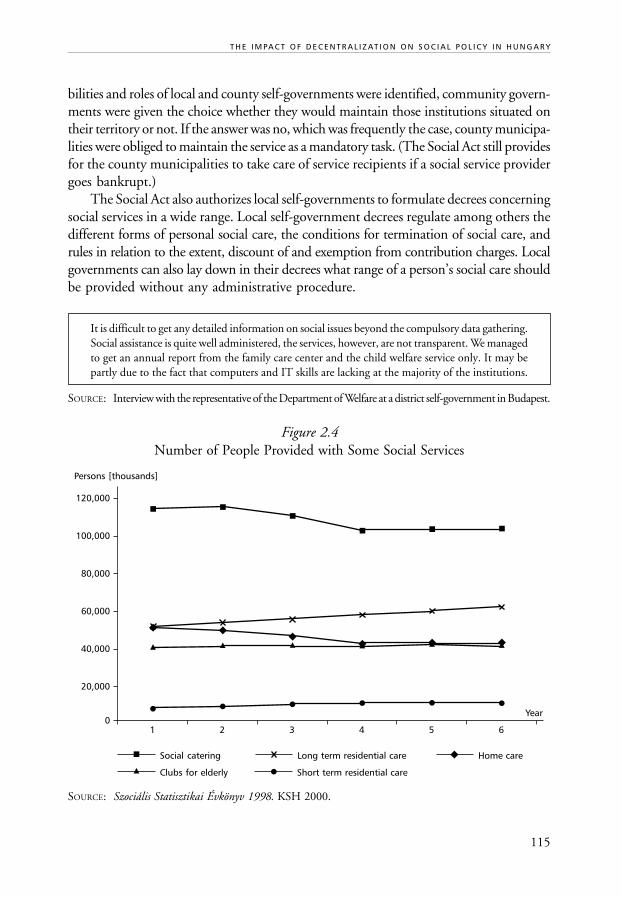
115
bilities and roles of local and county self-governments were identified, community govern-ments were given the choice whether they would maintain those institutions situated ontheir territory or not. If the answer was no, which was frequently the case, county municipa-lities were obliged to maintain the service as a mandatory task. (The Social Act still providesfor the county municipalities to take care of service recipients if a social service providergoes bankrupt.)
The Social Act also authorizes local self-governments to formulate decrees concerningsocial services in a wide range. Local self-government decrees regulate among others thedifferent forms of personal social care, the conditions for termination of social care, andrules in relation to the extent, discount of and exemption from contribution charges. Localgovernments can also lay down in their decrees what range of a person’s social care shouldbe provided without any administrative procedure.
It is difficult to get any detailed information on social issues beyond the compulsory data gathering.Social assistance is quite well administered, the services, however, are not transparent. We managedto get an annual report from the family care center and the child welfare service only. It may bepartly due to the fact that computers and IT skills are lacking at the majority of the institutions.
SOURCE: Interview with the representative of the Department of Welfare at a district self-government in Budapest.
Figure 2.4Number of People Provided with Some Social Services
SOURCE: Szociális Statisztikai Évkönyv 1998. KSH 2000.
T H E I M PA C T O F D E C E N T R A L I Z AT I O N O N S O C I A L P O L I C Y I N H U N G A R Y
0
20,000
40,000
60,000
80,000
1
100,000
120,000
2 3 4 5 6
Year
Persons [thousands]
Social catering Long term residential care Home care
Clubs for elderly Short term residential care
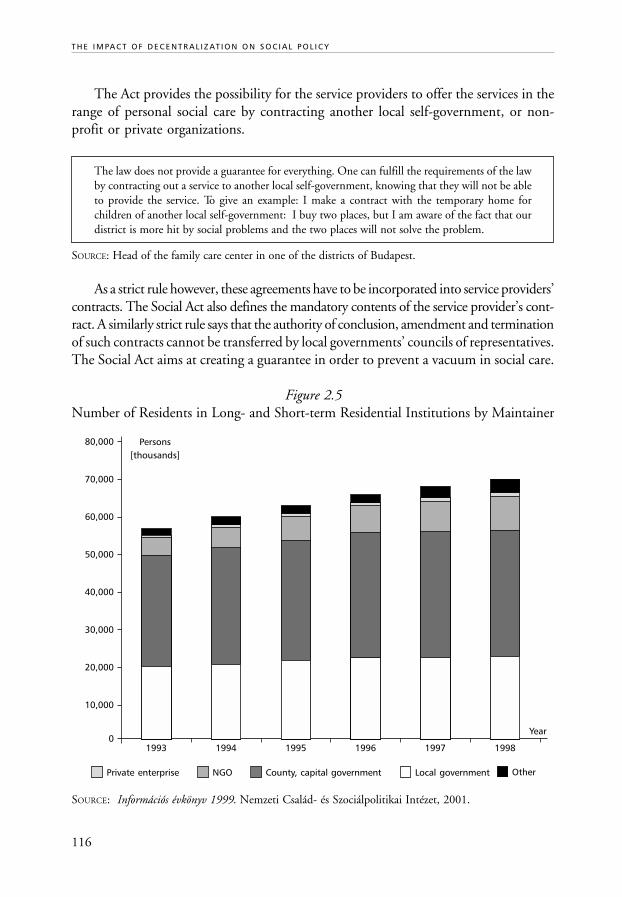
116
T H E I M PA C T O F D E C E N T R A L I Z AT I O N O N S O C I A L P O L I C Y
The Act provides the possibility for the service providers to offer the services in therange of personal social care by contracting another local self-government, or non-profit or private organizations.
The law does not provide a guarantee for everything. One can fulfill the requirements of the lawby contracting out a service to another local self-government, knowing that they will not be ableto provide the service. To give an example: I make a contract with the temporary home forchildren of another local self-government: I buy two places, but I am aware of the fact that ourdistrict is more hit by social problems and the two places will not solve the problem.
SOURCE: Head of the family care center in one of the districts of Budapest.
As a strict rule however, these agreements have to be incorporated into service providers’contracts. The Social Act also defines the mandatory contents of the service provider’s cont-ract. A similarly strict rule says that the authority of conclusion, amendment and terminationof such contracts cannot be transferred by local governments’ councils of representatives.The Social Act aims at creating a guarantee in order to prevent a vacuum in social care.
Figure 2.5Number of Residents in Long- and Short-term Residential Institutions by Maintainer
SOURCE: Információs évkönyv 1999. Nemzeti Család- és Szociálpolitikai Intézet, 2001.
01993 1994 1995 1996 1997 1998
Year
Persons[thousands]
10,000
20,000
30,000
40,000
50,000
60,000
70,000
80,000
OtherPrivate enterprise NGO County, capital government Local government
117
Non-profit organizations play an increasing role in providing social services in our city. Ouranalyses show, however, that the level of autonomy and of professional skills is rather low. Theforms of co-operation between the local self-government and the NGOs are functioning, buttheir evaluation and reform is still lacking.
SOURCE: Case study, Nyíregyháza.
The city or capital district notary issues operational licenses. Non-governmental,church-operated social service institutions are inspected at least once a year by the licensingbody—in conjunction with the county, capital or church methodological institution as aconsultant—to determine whether the institution is operated appropriately. Institutionsmust comply with the obligations relating to separation, use of one-bullet allowances andcontribution fees as specified in the law, the competent preparation of internal regulations,specific competence requirements of the services are enforced, liability insurance coveringdamages caused in the process of special service provision and in the case of accommodationinstitutions, the pre-care tasks prior to permanent placement were correctly carried out.
Civic organizations provided with subsidies are obliged to make annual reports on their activities.On this basis was the subsidy withdrawn from the Drug-Free Foundation in our district. Thecriteria concerning the content of these reports are not elaborated in a detailed form. Thus itdepends on the organizations what they put into the reports.
SOURCE: Interview with the head of a family care center in Budapest.
In the case of institutions operated by the state or not receiving state normative sub-sidies, the licensing body—in conjunction with the county, capital or church methodo-logical institution as a consultant—inspects at least once every two years to see whetherthe institutions are operated in accordance with the regulations.
The subsidies generally do not cover the cost of operation of the social service institutions. Thelocal self-government has to contribute to the costs. The only exception is the family care and childwelfare center in our city: it covers its costs from the state subsidies and 7% of their annual budgetis utilized in other areas.
SOURCE: Interview with the representative of the local self-government in Székesfehérvár.
If the license provider identifies deficiencies in relation to the operation of a givensocial service institution, the operator of the institution shall be called upon to provide aremedy within 120 days. If the operator does not take any measure to restore lawful operationby the deadline specified in the order, the license provider shall either repeal the operatinglicense (and in the event that the operation is necessary or justified from the viewpointof service providing interests, the authority will issue a preliminary license under newconditions), or shall permanently repeal the license to operate.
T H E I M PA C T O F D E C E N T R A L I Z AT I O N O N S O C I A L P O L I C Y I N H U N G A R Y

118
T H E I M PA C T O F D E C E N T R A L I Z AT I O N O N S O C I A L P O L I C Y
Data on welfare issues, including figures in the budget and the statistical data sheets, is contradictoryin the different data sources in Mór. Tables, data collection, and reports indicate different datarelating to the same matter.
SOURCE: Case study, Mór.
As a rule, the use of services in the range of personal social care is on an optionalbasis.
The Social Act also deals with the protection of rights and interests of those receivingpersonal care; therefore the obligation of the head of the institution on informing theresidents and their relatives is stipulated there. Also, a fixed rule is the requirement ofapproval of the house rules by the operator of the institution and these rules have to bemade accessible to all those being cared for. In order to establish more efficient protectionof the interests of those who are eligible, the Social Act provides for the creation of an in-terest representation forum in all of the institutions. This forum is responsible for examiningthe claims and complaints of both residents and their relatives and for taking measuresto eliminate the causes. In that a forum cannot be dedicated to settling all the problemsappearing in the life of such an institution, the act also requires the head of the institutionto examine the complaint.
4.7 Social Assistance
One of the most important events in formulating the post-socialist welfare system wasthe drafting and approval of the Social Act.7 This act expresses that, on the basis of theprinciple of subsidiarity, the local community takes responsibility for meeting the basicneeds of the citizens. The act specifies—among other matters —the individual types offinancial and in-kind social benefits, and the eligibility criteria.8 Act XXXI/1997 on theprotection of children and trusteeship administration extended the role of local governmentsin child protection.
In addition to the obvious political considerations, the allocation of power as wellas responsibility to local governments in the area of welfare services can also be justifiedby the fact that the local needs and the actual living conditions of the potential beneficiariesare known best at this level. However, by now the disadvantages of decentralizationhave also become obvious. For example, the “freedom” to issue local regulations couldresult in more than 3,000 different local welfare systems.9
The social assistance system is partly financed by the central budget and partly bythe local self-governments’ own budget.
The recent social assistance system in Hungary consists of various benefits. Thissystem, however, does not make the social protection system better targeted, as there isa serious leakage in the self-government managed cash benefits.

119
In the wording of the legal regulations and even in the rhetoric of the professionals, services foradults and children are differentiated. For instance, the network of child welfare services isresponsible for child-related issues whereas the family care centers deal with the problems offamilies and adults. This kind of approach leads to a lack of harmonization of the two types ofprovisions. Families as units ought to be supported, not the different parts of them.
SOURCE: Case study in district self-government in Budapest.
The most important types of social assistance benefits are the following:
• Old-age allowance (social assistance for senior citizens),• Occasional or crisis assistance (one-off and urgent payment),• Care benefit,• Child protection benefit,• Income supplement benefit,• Regular social assistance for unemployed people,• Housing allowance,• Death grant.
Only the professionals have appropriate information on all the forms of social assistance. Thecitizens generally do not know the eligibility criteria or the provisions, nor do they know theirown situation in this respect.
SOURCE: Representative of a local-self government in one of the districts in Budapest.
Social assistance for senior citizens is provided for those elderly who are not entitledto an old-age pension.
Table 2.15Number of Recipients of the Most Frequent Types of Benefit [thousand]
1990 1997 1998
Regular social assistance 46 27 28
Income replacement of unemployed — 186 175
Housing allowance in cash — 206 167
In-kind housing allowance — 95 103
Occasional cash assistance 807 742 537
Occasional in-kind assistance 370 223
Public health assistance — 468 481
Regular assistance for raising children 101 656 806
SOURCE: Yearbook of CSO, 1988, p. 168; CSO 1997, 1998; articles.
T H E I M PA C T O F D E C E N T R A L I Z AT I O N O N S O C I A L P O L I C Y I N H U N G A R Y
120
T H E I M PA C T O F D E C E N T R A L I Z AT I O N O N S O C I A L P O L I C Y
The introduction of the flat-rate, regular child protection benefit provided as of rightfor every needy child was one of the major features of the reform measures of the socialassistance system in Hungary in 1997. Although the legally formulated objective of thebenefit is to guarantee the subsistence level and the upbringing of children in theirfamilies, this benefit is hardly sufficient to prevent the impoverishment of children orto impede the child protection authorities from taking away children from their familiesbecause of financial reasons without basic changes in the family support system. Eventhough the benefit is based on national eligibility criteria, because of the income andproperty-tested character of the benefit, the local self-governments have a broad spacefor applying different considerations as a result of home-visits. In order to ensure the“good use of public money” a municipality may decide to give this benefit in in-kindforms. As opposed to the preliminary calculations (500-550,000 children) more than800,000 children proved to be eligible for child protection benefit in 1999.
Although two separate acts regulate the field of social policy, the responsibilities of our local self-government were comprised in one regulation. It was a political decision in our district to helpthe citizens to understand the possibilities. It is another question, however, that we neglected thenumerous new pieces of legislation, as a consequence of which the local regulations have to becontinually modified.
SOURCE: Head of the department of Welfare at a district self-government of Budapest.
In the case of crisis assistance (one-off and urgent payment), local self-governmentshave the right to elaborate the detailed regulation concerning the allocation criteria.Although by definition this benefit is provided in exceptional crisis situations, since1995 it can be provided monthly, indicating the holes in the social safety net.
It is a general feature of social provisions for unemployed people that entitlementcriteria has become gradually tighter over the last ten years. The income supplementbenefit, for unemployed people no longer entitled to unemployment benefit, wasintroduced in the Social Act and will gradually be abolished from 2000 onwards. Thiswas a means-tested benefit with an obligation to co-operate with the labor marketorganization and, from 1996 onwards, to accept public work. The maximum amountof the benefit was equal to 80% of the minimum old-age pension. The income andproperty tested regular social assistance for unemployed people amounts to 70% of theminimum old-age pension only and compulsory public work as well as co-operation witha social work organization are also included in the allocation criteria.
The government intention to strengthen the role of public work as a precondition for regularsocial assistance gave new tasks to the local self-governments. Some people interpret it as thewithdrawal of the state from this responsibility and its laying new burdens on the localities.
SOURCE: Representative of a local self-government.

121
In Hungary—as in many of the CEE countries—housing costs have increasedconsiderably, resulting in payment problems for a significant portion of the population.Several government measures have been created to promote debt management, includinghousing allowances.
There are two main causes for the arrears of the utility companies: (i) the gradual decrease of thereal value of the income of households, (ii) the withdrawal of price subsidies. The proportion ofarrears in the eastern part of the country is double that of the national average. The estimatesindicate that some 8,000-10,000 families ran into debt in our city. The situation of the familiesliving in flats rented from the local self-government (social housing) is especially worrying as65% of them ran into debt with the rents and rates.
SOURCE: Case study, Nyíregyháza.
In Hungry, although the Social Act defines the framework of the eligibility criteria(means-tested benefits for families if housing costs exceed 35% of the household’sincome), local governments are entitled to set the housing “norms” on the basis of thestandard housing stock within their constituencies. In most cases the benefits are paiddirectly to the communal service companies.
Figure 2.6Changes in the Average Income, Minimum Wage, Average Old-age Pension,
Minimum Old-age Pension, Subsistence Minimum,and Unemployment Benefit, 1990–1999 [HUF]
SOURCE: Garzó, 2001.
T H E I M PA C T O F D E C E N T R A L I Z AT I O N O N S O C I A L P O L I C Y I N H U N G A R Y
Minimal old-age pension
Average pension Unemployment benefit
Subsistance minimum
Average wage
Minimal wage
0
10,000
20,000
30,000
40,000
1990
50,000
Year
1991 1992 1993 1994 1995 1996 1997 1998 1999
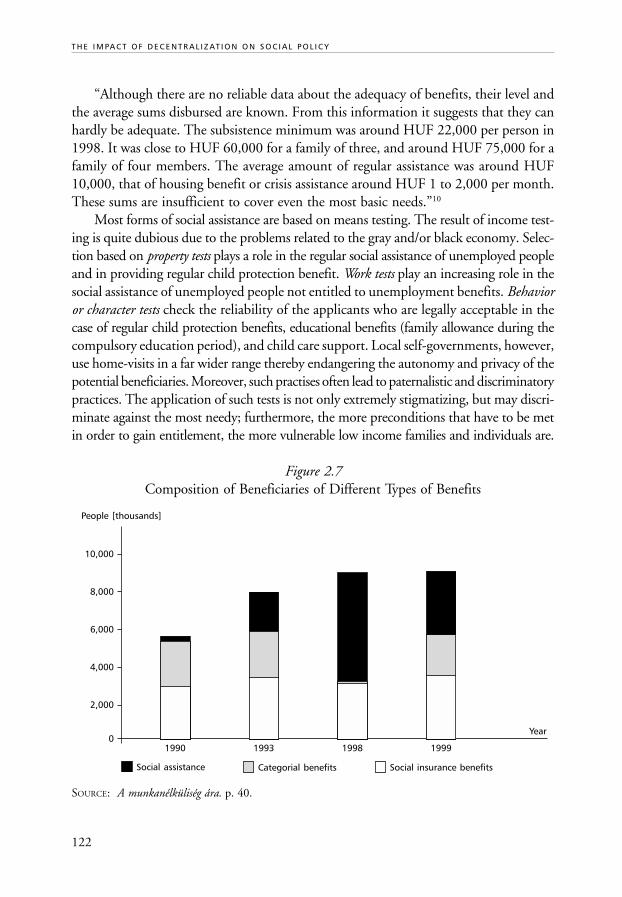
122
T H E I M PA C T O F D E C E N T R A L I Z AT I O N O N S O C I A L P O L I C Y
“Although there are no reliable data about the adequacy of benefits, their level andthe average sums disbursed are known. From this information it suggests that they canhardly be adequate. The subsistence minimum was around HUF 22,000 per person in1998. It was close to HUF 60,000 for a family of three, and around HUF 75,000 for afamily of four members. The average amount of regular assistance was around HUF10,000, that of housing benefit or crisis assistance around HUF 1 to 2,000 per month.These sums are insufficient to cover even the most basic needs.”10
Most forms of social assistance are based on means testing. The result of income test-ing is quite dubious due to the problems related to the gray and/or black economy. Selec-tion based on property tests plays a role in the regular social assistance of unemployed peopleand in providing regular child protection benefit. Work tests play an increasing role in thesocial assistance of unemployed people not entitled to unemployment benefits. Behavioror character tests check the reliability of the applicants who are legally acceptable in thecase of regular child protection benefits, educational benefits (family allowance during thecompulsory education period), and child care support. Local self-governments, however,use home-visits in a far wider range thereby endangering the autonomy and privacy of thepotential beneficiaries. Moreover, such practises often lead to paternalistic and discriminatorypractices. The application of such tests is not only extremely stigmatizing, but may discri-minate against the most needy; furthermore, the more preconditions that have to be metin order to gain entitlement, the more vulnerable low income families and individuals are.
Figure 2.7Composition of Beneficiaries of Different Types of Benefits
SOURCE: A munkanélküliség ára. p. 40.
01990 1993 1998 1999
Year
People [thousands]
2,000
4,000
6,000
8,000
10,000
Social assistance Categorial benefits Social insurance benefits
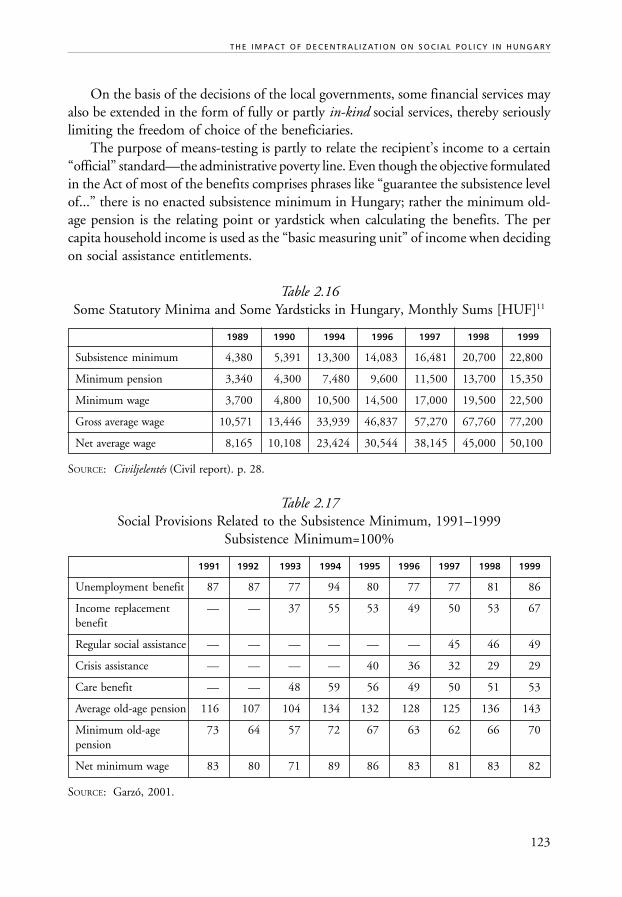
123
On the basis of the decisions of the local governments, some financial services mayalso be extended in the form of fully or partly in-kind social services, thereby seriouslylimiting the freedom of choice of the beneficiaries.
The purpose of means-testing is partly to relate the recipient’s income to a certain“official” standard—the administrative poverty line. Even though the objective formulatedin the Act of most of the benefits comprises phrases like “guarantee the subsistence levelof...” there is no enacted subsistence minimum in Hungary; rather the minimum old-age pension is the relating point or yardstick when calculating the benefits. The percapita household income is used as the “basic measuring unit” of income when decidingon social assistance entitlements.
Table 2.16Some Statutory Minima and Some Yardsticks in Hungary, Monthly Sums [HUF]11
1989 1990 1994 1996 1997 1998 1999
Subsistence minimum 4,380 5,391 13,300 14,083 16,481 20,700 22,800
Minimum pension 3,340 4,300 7,480 9,600 11,500 13,700 15,350
Minimum wage 3,700 4,800 10,500 14,500 17,000 19,500 22,500
Gross average wage 10,571 13,446 33,939 46,837 57,270 67,760 77,200
Net average wage 8,165 10,108 23,424 30,544 38,145 45,000 50,100
SOURCE: Civiljelentés (Civil report). p. 28.
Table 2.17Social Provisions Related to the Subsistence Minimum, 1991–1999
Subsistence Minimum=100%
1991 1992 1993 1994 1995 1996 1997 1998 1999
Unemployment benefit 87 87 77 94 80 77 77 81 86
Income replacement — — 37 55 53 49 50 53 67benefit
Regular social assistance — — — — — — 45 46 49
Crisis assistance — — — — 40 36 32 29 29
Care benefit — — 48 59 56 49 50 51 53
Average old-age pension 116 107 104 134 132 128 125 136 143
Minimum old-age 73 64 57 72 67 63 62 66 70pension
Net minimum wage 83 80 71 89 86 83 81 83 82
SOURCE: Garzó, 2001.
T H E I M PA C T O F D E C E N T R A L I Z AT I O N O N S O C I A L P O L I C Y I N H U N G A R Y
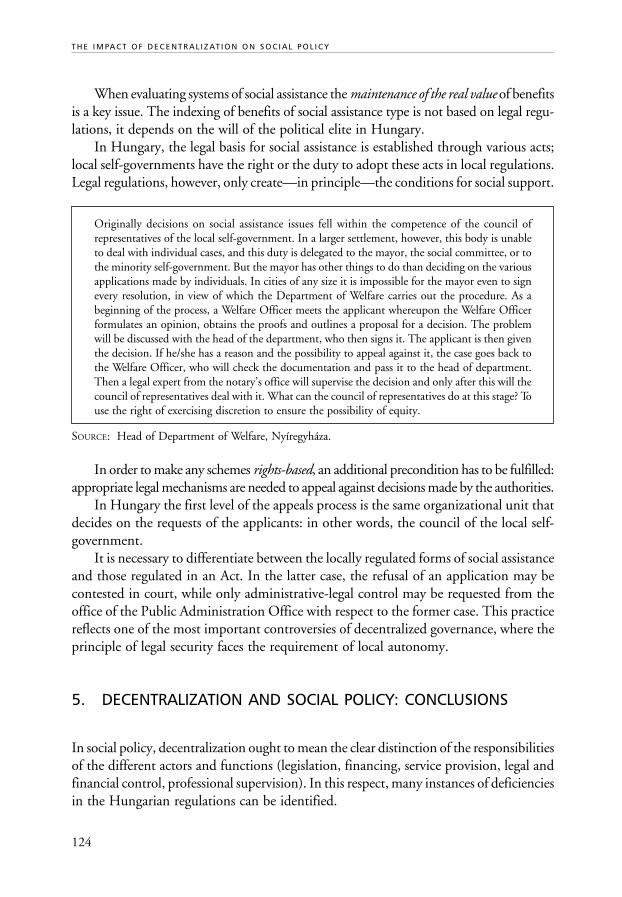
124
T H E I M PA C T O F D E C E N T R A L I Z AT I O N O N S O C I A L P O L I C Y
When evaluating systems of social assistance the maintenance of the real value of benefitsis a key issue. The indexing of benefits of social assistance type is not based on legal regu-lations, it depends on the will of the political elite in Hungary.
In Hungary, the legal basis for social assistance is established through various acts;local self-governments have the right or the duty to adopt these acts in local regulations.Legal regulations, however, only create—in principle—the conditions for social support.
Originally decisions on social assistance issues fell within the competence of the council ofrepresentatives of the local self-government. In a larger settlement, however, this body is unableto deal with individual cases, and this duty is delegated to the mayor, the social committee, or tothe minority self-government. But the mayor has other things to do than deciding on the variousapplications made by individuals. In cities of any size it is impossible for the mayor even to signevery resolution, in view of which the Department of Welfare carries out the procedure. As abeginning of the process, a Welfare Officer meets the applicant whereupon the Welfare Officerformulates an opinion, obtains the proofs and outlines a proposal for a decision. The problemwill be discussed with the head of the department, who then signs it. The applicant is then giventhe decision. If he/she has a reason and the possibility to appeal against it, the case goes back tothe Welfare Officer, who will check the documentation and pass it to the head of department.Then a legal expert from the notary’s office will supervise the decision and only after this will thecouncil of representatives deal with it. What can the council of representatives do at this stage? Touse the right of exercising discretion to ensure the possibility of equity.
SOURCE: Head of Department of Welfare, Nyíregyháza.
In order to make any schemes rights-based, an additional precondition has to be fulfilled:appropriate legal mechanisms are needed to appeal against decisions made by the authorities.
In Hungary the first level of the appeals process is the same organizational unit thatdecides on the requests of the applicants: in other words, the council of the local self-government.
It is necessary to differentiate between the locally regulated forms of social assistanceand those regulated in an Act. In the latter case, the refusal of an application may becontested in court, while only administrative-legal control may be requested from theoffice of the Public Administration Office with respect to the former case. This practicereflects one of the most important controversies of decentralized governance, where theprinciple of legal security faces the requirement of local autonomy.
5. DECENTRALIZATION AND SOCIAL POLICY: CONCLUSIONS
In social policy, decentralization ought to mean the clear distinction of the responsibilitiesof the different actors and functions (legislation, financing, service provision, legal andfinancial control, professional supervision). In this respect, many instances of deficienciesin the Hungarian regulations can be identified.

125
5.1 Legislation
• One may experience quite contradictory views concerning the legislative powerof the local self-governments in the social sector. Some of the professionalsemphasize that local self-governments have strong regulatory and decision-making power concerning social assistance benefits. The local self-governmentshave to formulate, on the basis of the Social Act or other laws, their own localregulations and they exercise a strong discretionary right when deciding on thecriteria of entitlements. Thus, the current social assistance system does not ensureeven the minimum existential security of the citizens. Consequently, some kindof centrally organized and guaranteed minimum income support scheme wouldbe needed. According to other opinions there are too many normative benefits,and the local self-government is unable to enforce its concepts in social policyas the centrally regulated (e.g. in government Acts) eligibility criteria cannottake into consideration the local situation and the specific local needs.
• One way of interpreting the exercise of discretion is to consider it a special formof decentralization. In theory, the requirement of exercising discretion can beinterpreted as a way to increase the decision-making power of local governments.In this understanding on the basis of the principle of subsidiarity the locallyassessed needs may most effectively be met by locally adapted or outlined measures.However, especially when resources are scarce, this may lead to decisions basedon discrimination or on the subjective judgment of the decision-makers. Theelaboration of the local social support system is not preceded by needs assessmentat the majority of the local self-governments. Those social support schemes thatare not centrally defined are heavily dependent on local power relations and financialresources; the professional quality of the local regulations is strongly determinedby the professional skills of the representatives of the local administration.
Quite often formulation of the acts and local regulations is based on trial and error:something is enacted, experiences are collected, and then legal regulations are modified.In most cases, either the preconditions of the implementation are missing or the deadlinesprove to be unrealistic.
5.2 Social Provisions
The political transition brought about a wide-ranging change in social policy. Localself-governments were formed and this, in conjunction with the principle of regulatingthe social assistance and service functions at local level, resulted in a rarefied and diversesocial service care system. The proponents of decentralization efforts argued that it
T H E I M PA C T O F D E C E N T R A L I Z AT I O N O N S O C I A L P O L I C Y I N H U N G A R Y

126
T H E I M PA C T O F D E C E N T R A L I Z AT I O N O N S O C I A L P O L I C Y
would provide more flexible services, more efficient compliance with local needs, andwould mean an economically more efficient and transparent operation. These can in-deed be noticed in minute traces, yet the system possesses significant problems anddistortions.
The main deficiencies of the social support system are the following:
Benefits in cash and in kind tend to:
• preserve poverty;• apply corrective measures rather than prevent the sliding down of certain social
groups;• function in a confused, frequently bureaucratic and non-effective way;• be unjust as it is impossible to test the real income of households;• lack harmony with the big re-distributive systems.
The main characteristic features of the social services are that:
• the level of quality of the services is frequently unsatisfactory;• in several cases the institutions have high operational costs due first of all to the
high maintenance cost of the buildings they are situated in;• the necessary financial resources to operate and develop these services are missing;• several institutions do not meet even the obligatory legal requirements.
Problems arise from the situation that no serious consequences can be felt when alocal government violates legal requirements (such as not operating mandatory day-careinstitutions). Statistical data clearly shows that only a fraction of local governments operateall the services stipulated by law.
On one hand, the Social Act reacts realistically on the Hungarian settlement structureand that of the financial capacity of the municipalities when it differentiates the servicesaccording to the size of the settlements. This solution, however, assumes that the consumerswould “travel” to obtain the services provided in other settlements, which—as a resultof the problems of the clients and their financial difficulties—is often not the case.Thus the actual practice unintentionally violates the principle of equal access to services.
One of the most striking consequences of decentralization is the non-uniform qualityof services provided: characteristically, the situation is worst in large institutions operatedby the county (as confirmed by reports of the Ombudsman), while in most of the privatelyrun homes and in certain cases in old-age homes operated by community governmentsthe level of services is appropriate.
Currently the number of different social assistance schemes might equal the numberof local governments. Their social policy activities can be seen only through very indirect
127
ways, such as through the annual statistical data. Moreover, there is usually a year’s delaybefore the statistical data is processed and evaluated and, due to the structure of datagathering, it is highly unlikely that the data will cast any light on all the possible serviceforms. Such data is also not suitable to demonstrate such features (individual evaluation,special conditions, tests), which in practice bear real significance. Targeting of social assis-tance is not ensured: it cannot be said for sure that the service and the care are given tothe most needy.
Decentralization of social assistance has resulted in such low level benefits that theyare most definitely inappropriate as a means of raising the income of a household to thesubsistence minimum. Administration of benefits is so complicated and frequentlyhumiliating that a substantial part of those in need probably give up applying from thevery start. Only a minute part of the benefits can be obtained by legal action in court;in the case of the rest of the benefits there is no such possibility available. All this meansthat existential security cannot be ensured in the current cash-benefit system.
It is a professional problem as well as diminishing the quality of the services thatthe institutions have no clear profile. In several cases young alcoholics lived in homesfor senior citizens, or people suffering from metal illness live together with disabledpeople thereby causing severe tensions in these institutions.
Decentralization ought to mean an effort to solve the social problems in the frameworkof the compulsory basic services. As a result of the scarce financial and human resourcesand the lack of capacity, local self-governments tend to be motivated to pass on both the“problem” and the costs of provision to a higher level of governance, i.e. to the countyself-governments.
Decentralization has resulted in a stronger role gained by the church and non-governmental organizations. Non-governmental organizations are generally more flexiblein several respects and more innovative than the state sector. The pioneering role of thethird sector is obvious and indisputable; the introduction of some compulsory new typesof services became necessary just because of their activities.
The picture is more diverse in the case of services provided for senior citizens: non-governmental organizations appeared here in a more business-like manner, meaning thedifferences in quality levels are felt more intensively. Many of the typically boarding-typeinstitutions of non-governmental organizations react on demand since there is a willingnessto pay market prices for appropriate levels of services.
Interviews with the representatives of non-governmental organizations demonstratedthat the rigidity of relations as well as the difficulties in communication with the localself-governments are recurring problems. In practice, only after many difficulties arenon-governmental service providers accepted. We did not find a single example of asettlement which would have been inclined from the very start to comply with itsobligation to provide social care and services in the framework of a contract to beconcluded with a non-governmental organization.
T H E I M PA C T O F D E C E N T R A L I Z AT I O N O N S O C I A L P O L I C Y I N H U N G A R Y

128
T H E I M PA C T O F D E C E N T R A L I Z AT I O N O N S O C I A L P O L I C Y
The local self-governments responsible for service provision do not have a long-term concept or vision of who is going to provide what kind of services and to what extent.Frequently, a local self-government appears as a contracting party in service contracts,while at the same time it maintains and operates the same services.
The range of means and “skills” by which local government officers would be ableto ensure transparency, efficiency and effectiveness of the various organizations providingsocial services is generally missing. Currently, local governments are bad “customers”or “clients”: they are not fully aware of what they really want in return for their support.They are traditionally inclined to maintain such a system in which they can intervene,and do so whenever they consider it appropriate. Indirect regulation and a horizon forone are still unknown to local government officials despite the latter factors being im-portant conditions for the stable and reliable operation of the non-governmental sector.
Problems of communication with non-governmental organizations are explainedby local government decision-makers by their mistrust such organizations: local govern-ments find the means too weak for controlling activities so they would rather ensureservices within their own local government systems.
In the case of services, however, decentralization brought about real results: flexibility,new types of services, and institutions more sensitive to the perceived needs of the users.
129
NOTES
1 Kukorelli István (ed.) (1993): Alkotmánytan, Budapest, Századvég; The HungarianConstitution and the Act on the Local Governments (1990/ LXV).
2 This part of the study is partly based on a paper prepared by Katalin Tausz withinthe project Comparative Institutional Reform in Social Policy. East-Central Europein a European Context (1989-2001). IWM (Vienna), 2000.
3 1960/1990. (XII.20.) Kormány Határozat. Szociális Tanács létrehozásának kezdemé-nyezésérôl.
4 Ideas on family benefits are based on: Ágnes Darvas: Utak vagy tévutak? Család-támogatások Közép-Kelet-Európában a rendszerváltás óta, 2000, Manuscript.
5 GYES is a cash benefit to provide financial support for a parent staying at home witha child aged under three. The sum of the benefit is equal to that of the minimumold-age pension.GYED is a cash benefit to provide financial support for a parent staying at home witha child aged under two. It is equal to 70% of the daily average earnings but not morethan the minimum wage.GYET is a cash benefit to ensure a sufficient (minimum) living standard of the parentwho raises three or more children in his/her house, if the youngest child is at leastthree years old but has not yet reached the age of eight years. The monthly amountof GYET is—irrespective of the number of children—equivalent to the currentminimum old-age pension.
6 Based on the Home page of the Ministry of Social and Family Affairs:http://www.szcsm.gov.hu
7 Act III./1993. on social administration and social services.8 Act III./1993. on social administration and social services 3.§ (3).9 Several studies deal with these issues in the volume of Denationalisation dilemmas:
social policy constraints and choices. ATA 1995.10 Ferge, Zs. et al (2000a) p. 19.11 Ferge, Zs. et al (2000a) p. 21.
T H E I M PA C T O F D E C E N T R A L I Z AT I O N O N S O C I A L P O L I C Y I N H U N G A R Y

130
T H E I M PA C T O F D E C E N T R A L I Z AT I O N O N S O C I A L P O L I C Y
REFERENCES
Andorka, R. and Zs. Spéder (1997): Szegénység. (Poverty), TÁRKI Working Papers,TÁRKI, Budapest.
Andorka, R. and Zs. Spéder (1994): Szegénység. (Poverty), TÁRKI Working Papers,TÁRKI, Budapest.
Andorka, R. and Zs. Spéder (1996): A szegénység Magyarországon (Poverty in Hungary)1992-1995. Esély. No. 4.
Az egyszülôs családok adatai (Data on single-parent families), Mikrocenzus 1996, KSH,1997.
Barr, Nicholas (1999) Reforming Welfare States in Post-Communist Countries, Paperpresented at: Ten Years After: Transition and Growth in Post-Communist Countries,Warsaw 15-16 October 1999.
Ferge, Zs., T. Morva, I. Sziklai and N. Wells (eds.) (2000) Report on the World BankStructural Adjustment Program Loans to Hungary 1988-1998, SAPRI Report. 1st
Working Group.Ferge, Zs., E. Sík, P. Róbert and F. Albert (1997): Social Costs of Transition, International
Report, Institut für Wissenschaften vom Menschen, Wien, Manuscript.Ferge, Zs. (1996): A magyar segélyezési rendszer reformja 1–3., (The Reform of the
Hungarian Social Assistance System) Esély. No. 6, 1996; Nos. 1, 2, 1997.Ferge, Zs. (1996a): Social Policy Challenges and Dilemmas in Ex-socialist Systems. The
Need for Social Policy Reforms, Invited paper prepared for the workshop “EconomicTransformation—Institutional Change and Social Sector Reform” organized by theNational Research Council’s Task Force on Economic Transition, Washington,19-20 September, 1996.
Ferge, Zs., L. Garzó, G. Juhás, T. Morva, I. Sziklai and K. Tausz (eds.) (2000a): Civiljelentés a szegénységrôl. A szociális fejlôdéssel foglalkozó 1995-ös koppenhágai csúcs-találkozó vállallásainak megvalósulása Magyarországon, Szociális Szakmai Szövetség-Szociális Jóléti Nemzetközi Tanácsa (ICSW) Magyar Bizottsága, Budapest, 2000.(Implementing the Copenhagen commitments adopted at the World Summit forSocial Development Copenhagen 1995, Civil Report for Hungary 2000, May 2000.)Report of the National Committee of ICSW—Alliance of Social Professionals for theCopenhagen+5 special session of the UN GENEVA 2000 Forum, Geneva, June 2000.
Ferge, Zsuzsa (1999): Az állami szociálpolitika változásainak irányai a rendszerváltás óta.(The directions of the changes in state social policy since the change of the regime)in: Politika és társdalom 1989–1998, Magyarország az ezredfordulón, Stratégiaikutatások a Magyar Tudományos Akadémián, Mûhelytanulmányok, Magyar Tudo-mányos Akadémia.
Ferge, Zsuzsa and Katalin Tausz (2001): Social Security in Hungary: a Balance Sheetafter Twelve Years. To be published in Social Policy and Administration, 2002.

131
T H E I M PA C T O F D E C E N T R A L I Z AT I O N O N S O C I A L P O L I C Y I N H U N G A R Y
Garzó, Lilla (2000): A szociális (és munkanélküli) ellátórendszer munkára ösztönzô hatásánakfelülvizsgálata és erôsítése (The revision and strengthening of the work-incentiveeffects of the social (unemployment) provisions), Manuscript.
Garzó, Lilla (ed.) (2001): A munkanélküliség ára (The price of unemployment), SzociálisSzakmai Szövetség.
Habich, R. and Zs. Spéder (1998): Vesztesek és nyertesek: a társadalmi változáskövetkezményei három országban (Losers and winners: consequences of the socialtransformation in three countries) Társadalmi Riport (Social Report), TÁRKI,Budapest.
Horváth, Á. (1995): Törvény és anarchia avagy törvényes anarchia. A Szociális Törvényrôlés az önkormányzati rendeletekrôl (Legality and anarchy or legal anarchy. The SocialAct and the local government regulations) in: Landau, Simonyi, Szalai and Vince(eds) Az államtalanítás dilemmái: szociálpolitikai kényszerek és választások, AktívTársadalom Alapítvány, Budapest.
Jarvis, S.J. and J. Micklewright (1994): A családi pótlék célzottsága és célzása Magyaror-szágon (The level of targeting of the family allowance in Hungary) Esély, No. 2.
Jövedelemeloszlás Magyarországon, 1995 (Income distribution in Hungary) KSH, 1998.Kolosi, T., I. Bedekovics and E. Sik (1997) Munkaerôpiac és jövedelmek (Labor market
and incomes) TÁRKI, Budapest.Kormányközi konferencia a Magyar Köztársaság Európai Únióhoz történô csatlakozásáról.
A Magyar Köztársaság kormányának tárgyalási álláspontja. 13. fejezet. Szociálpolitikaés foglalkoztatás (Inter-governmental conference on the accession of the Republicof Hungary to the European Union).
Medgyesi, M., M. Sági and P. Szívós (1999): Az idôsek jövedelmi helyzetérôl (On theincome of senior citizens) Esély, No. 6.
National Program for the Adoption of the Aquis, Hungary, Revised version.Semjén, A. (1996): A pénzbeli jóléti ellátások ösztönzési hatásai (Incentive effects of
cash benefits) Közgazdasági Szemle, No. 10.Spéder, Zs. (1998): Szegénység (Poverty) Társadalmi Riport 1998, TÁRKI, Budapest.Szalai, J. (1995): Hatalom és szegénység (Power and poverty) in: Landau, Simonyi,
Szalai and Vince (eds) Az államtalanítás dilemmái: szociálpolitikai kényszerek ésválasztások, Aktív Társadalom Alapítvány, Budapest.
TÁRKI Monitor jelentések (TÁRKI Monitor reports) MONITOR, 1999, TÁRKI.Tóth, I.Gy. (1998): Gazdasági aktivitás vagy szociális támogatások? A jóléti újraelosztás
megváltozott keretfeltételei (Economic activity or social provisions? The transformedconditions of welfare re-distribution) Háttértanulmányok a középtávú szociálpolitikaikoncepcióhoz. Zárótanulmány 1. TÁRKI, Budapest, Manuscript.

C H A P T E R 3
Social Sector
Development
in Latvia
Linda Z ivar t e
■
Dace Jan s one

134
T H E I M PA C T O F D E C E N T R A L I Z AT I O N O N S O C I A L P O L I C Y

135
Table of Contents
Introduction .......................................................................................................... 137
1. Legacy of the Past in the Social Sector ............................................................ 1371.1 Latvian Social Protection System: Historical Overview ......................... 1371.2 Main ‘Old’ Structural and Institutional Social Problems ...................... 139
2. Transition: Political, Economic and Social Changes ....................................... 1392.1 General Information .............................................................................. 1392.2 Political System, the Administrative Organization
of the Country and Key Institutions Involved in Social Policy ............. 1402.3 Administrative System ........................................................................... 1402.4 Main Actors of Social Policy ................................................................. 144
2.4.1 Commission on Social and Labor Issues ................................... 1442.4.2 Ministry of Welfare ................................................................... 1442.4.3 Local Self-governments ............................................................. 1452.4.4 The Non-governmental Sector ................................................. 145
2.5 Macro-economic Development and Societal ChangesSince Independence ............................................................................... 147
2.6 Labor Market Situation ......................................................................... 1482.7 Basic Demographic Indicators Influencing
the Social Protection System.................................................................. 1502.8 Standard of Living and Poverty ............................................................. 151
3. The Social Protection System.......................................................................... 1533.1 Values, Principles, Objectives ................................................................ 1543.2 Main Stages of Social Legislation .......................................................... 1553.3 Implementation of Social Policy ........................................................... 155
3.3.1 Social Insurance—Generally ..................................................... 1553.3.2 State Social Insurance System ................................................... 156
3.4 Social Assistance .................................................................................... 1573.5 Family Policy ......................................................................................... 1593.6 Child Protection .................................................................................... 1593.7 Funding of Social Policy ....................................................................... 1613.8 Administration of Social Policy ............................................................. 161
4. The Outcome of Decentralized Social Policy ................................................. 162

136
T H E I M PA C T O F D E C E N T R A L I Z AT I O N O N S O C I A L P O L I C Y
Bibliography .......................................................................................................... 165
Legislation ............................................................................................................. 165
Research Methodology .......................................................................................... 166
Social Insurance .................................................................................................... 167The Pension System ........................................................................................ 167Maternity and Sickness Benefits ..................................................................... 168Employment—Unemployment ...................................................................... 168Occupational Accidents and Diseases ............................................................. 169Funding of Social Insurance ........................................................................... 169
Social Insurance Administration ........................................................... 171
Annexes ................................................................................................................. 173Annex 1 ........................................................................................................... 173Annex 2 ........................................................................................................... 174Annex 3 ........................................................................................................... 175Annex 4 ........................................................................................................... 176Annex 5 ........................................................................................................... 177Annex 6 ........................................................................................................... 178Annex 7 ........................................................................................................... 181Annex 8 ........................................................................................................... 182Annex 9 ........................................................................................................... 183Annex 10 ......................................................................................................... 184Annex 11 ......................................................................................................... 185Annex 12 ......................................................................................................... 186Annex 13 ......................................................................................................... 188Annex 14 ......................................................................................................... 189Annex 15 ......................................................................................................... 190Annex 16 ......................................................................................................... 191Annex 17 ......................................................................................................... 192Annex 18 ......................................................................................................... 193Annex 19 ......................................................................................................... 194Annex 20 ......................................................................................................... 195Annex 21 ......................................................................................................... 195
137
Social Sector Development in Latvia
Linda Z iv e r t e ■ Dace Jan sone
INTRODUCTION
This research report on the decentralization of social policy in Latvia was done in theframework of a comparative study. The main intention of the research project ‘TheImpact of Decentralization on Social Policy’ was to analyze decentralization in threeformer socialist countries. Hungary, Latvia and the Ukraine.
The structure of this part of the study is as follows: first, an introduction to the socialand economic context of developments in Latvia in the 1990s will be given to providethe context showing the need to develop a social policy. This is followed by a descriptionand analysis of the design, development and implementation of the social security systemin Latvia focusing on the formulation of the relevant legislation, on the agents of socialpolicy, and on the system for financing social policy activities. The next part will presenta discussion on the decentralization of the social policy in reality by analyzing the benefitsand problems related to this process, with a special focus on the effect of decentralizationon the living conditions of the population.
1. LEGACY OF THE PAST IN THE SOCIAL SECTOR
1.1 Latvian Social Protection System: Historical Overview
When analyzing current developments in the social sector, it is necessary to take intoaccount the historical background, which has influenced social transformations to amuch greater extent than have any theoretical considerations.
From a historical point of view concerning the developments in the social sector,three main periods can be highlighted:
1. Latvia as an independent state before World War II;2. Latvia as a part of the Union of Soviet Socialist Republics (USSR);3. Latvia after the restoration of independence.
138
T H E I M PA C T O F D E C E N T R A L I Z AT I O N O N S O C I A L P O L I C Y
In this section the main focus will be on the first two periods; the rest of article willbe devoted to a more detailed analysis of the third period. During these three periods thebasic conditions and principles of social security have changed radically and these develop-ments can be considered as revolutions in the social sphere itself.
The first period began in 1918 with the establishment of the Republic of Latvia.The initial years can be described as a period of considerable uncertainty; this was alsotrue of the social sphere. The basis of the social provision system was limited to the ruleselaborated by the local governments. It is important to stress that in general, during thefirst period, the social security system was developed in the “bottom-up” approach: thelaws gave the local administration the right to regulate social issues. The rights to socialassistance strongly depended on where a person lived.
It was not until ten years later, in 1928, that the general law On Social Provision waspromulgated and the system of social protection was established. The basic principlesof this system can be defined as the concepts of reward (what you did) and compensation(what you get). The concept of compensation was implemented by various social assistanceactivities at the local level. In general the social legislation of this period can be characte-rized as fragmented and incomplete.
In the second period (1940-1990) the approach to social issues radically changed.The previous, locally-oriented system was reorganized to become a highly centralizedone, which was also ideology-oriented. The Soviet system was, in general, based on theconcept of status (who you are). The weak point of this approach was the inability toprovide the appropriate level of social protection. Formally, the social rights of the Sovietpeople were declared as almost welfare state rights: guaranteed pensions, free healthprotection, comprehensive and free child care, full employment, etc. The financial resourceswere guaranteed from the centralized Soviet state budget that was formulated in Moscow.The financial responsibility for the social sector was then shifted to the Council of USSRTrade Unions, which further delegated part of this to the Council of Trade Unions of theLatvian SSR. All pensions, maternity allowances, sickness benefits, etc. were provided inaccordance with the centralized standards and only in a few cases were they adapted tothe specific Latvian context. Local governments had no independent financial basesand tended to act as symbolic entities with no direct responsibilities regarding socialissues. During the 50 years of the Soviet regime the Latvian population becameaccustomed to obtaining a great deal of assistance from the state. Personal initiative andpersonal contributions did not play any role regarding social protection conditions. Allcalculations were based on a highly formalized approach. There was no official un-employment in the Soviet Union because everyone had the right and obligation to work.If there were no possibilities to find a relevant job in one place, the person was sent toanother place where there was a lack of the given kind of worker or specialist. The Sovietadministrative system used social policy measures as political tools so as to prove theegalitarian nature of its society. This system, however, basically worked as an instrument

139
of unification and rejected any personal initiative. This approach facilitated the develop-ment and strengthening of the party administrative elite (nomenclature), which wasprovided with exclusive social benefits.
1.2 Main ‘Old’ Structural and Institutional Social Problems
During Soviet times there was no official open unemployment, hence no unemploymentbenefit system existed; poverty did not exist (at least officially), hence no poverty reliefsystem functioned. Because of the main characteristics of the Soviet welfare system (flatincome distribution meaning insignificant income inequalities, universal benefits, non-existence of personal income tax), the administrative capacity of the states in the socialsector was weak.
In the late 1980s and early 1990s job security ended, income inequalities widened,and economic output fell, all of which led to a disproportionate decline in tax revenues.The consequences of this were the sharp increase of unemployment and poverty.
The reform processes of these years led to a new distribution of responsibilities.Individuals and families were made responsible for their own lives and their own livingconditions and well-being instead of the state. The underdeveloped social infrastructure,the lack of resources, the huge number of persons in need, and the negative attitudetowards individual problem-solving were the most crucial factors and obstacles duringthe implementation of the new social policy approach.
2. TRANSITION: POLITICAL, ECONOMIC AND SOCIAL CHANGES
2.1 General Information
On 21 August 1991, Latvia declared the restoration of its de facto independence. Latviais situated at a trading crossroads, and has long since served as a bridge between WesternEurope and Russia. The geopolitical situation explains many complexities related toeconomic, political, as well as demographic developments; these will be mentioned later.
At the beginning of the year 2000 the Latvian population was about 2.4 million ofwhom nearly one third live in the capital—Riga. The ethnic mix of Latvia’s populationis largely the consequence of the massive post-war immigration, which resulted in adecline in the proportion of ethnic Latvians from 77% in 1935 to 52% in 1989 (Annex 1).Latvia’s complex historical past is also reflected in the citizenship issue (Annex 2), whichwas one of the main topics in political discussions in the 1990s—apart from thediscussions on the status of the national language.
S O C I A L S E C T O R D E V E LO P M E N T I N L AT V I A

140
T H E I M PA C T O F D E C E N T R A L I Z AT I O N O N S O C I A L P O L I C Y
2.2 Political System, the Administrative Organizationof the Country and Key Institutions Involved in Social Policy
Latvia is a democratic, parliamentary republic. The electoral system in Latvia is proportionalrepresentation. There is universal suffrage for Latvian citizens over 18 years of age.Legislative power is vested in a one-chamber parliament—the Saeima, consisting of 100deputies (Members of Parliament). Parliamentary elections take place every four years.The head of the state is the President, who is elected by the Saeima for a period of fouryears by secret ballot based on a simple majority of not less than 51 MPs. The Presidentsigns laws, performs representative functions, and chooses the Prime Minister, who headsthe government. The President represents the State in international relations, is theCommander-in-Chief of the Armed Forces, and has the right of legislative initiative.The current President of the Republic of Latvia is Vaira Vike-Freiberga, the first femalepresident in Central and Eastern Europe.
In 1990 the Supreme Council of the Latvian SSR enacted the Declaration on Inde-pendence from the USSR, and the constitution of 1922 was reinstated. The Constitutionwas amended in 1994 and 1997 (with regard to national elections), and also in 1998 (asection on human rights was added). Since the restoration of independence three parlia-mentary elections have been held. Traditionally there is a great deal of competition forthe 100 seats in the Saeima. For example, in June 1993, eight parties out of 23 wereelected to the 5th Saeima; in October 1995, nine parties from 19 were elected to the 6th
Saeima; and in the 7th Saeima elections in October 1998, six parties out of 21 wereelected. The next parliamentary elections in Latvia are due to be held in 2002. Govern-ments are formed on a coalition basis. The only party which has been represented in allpost-Soviet governments is the Latvian Way (a centrist and liberal party). The averageduration of coalition governments is approximately one year, generating uncertainty aboutthe political will to continue reforms as well as the sequence of reform efforts due to lackof clearly defined priorities.
The Government consists of the Prime Minister (also known as the President ofMinisters) and the ministers appointed by the Prime Minister. The administrative institu-tions of the State are under the authority of the Government.
The Saeima votes on the basis of confidence or no-confidence in the Prime Ministerand the established government. The Cabinet of Ministers consists of the Prime Minister,the ministers, and the ministers of state.
2.3 Administrative System
The ministries are the principal institutions of the executive power through which theCabinet of Ministers performs tasks determined in the Satversme (Constitution) and on

141
the basis of legal regulations. In some cases, ministries and other national administrationbodies have territorial offices—mainly at a regional level. These offices work in close co-operation with the regional and local governments. The distribution of main functionsbetween the central government and local governments is described in Annex 4.
The administrative system consists of 12 ministries (thus, 12 ministers) and twoministers without portfolio. Efforts to de-concentrate the state administrative structureand to de-centralize state functions have been undertaken. The central government hasdeveloped a number of (de-concentrated) administrative units that are responsible forstate functions at regional level. The main approach to de-concentration is to empowerindividual ministries to decide on the principles of how to de-concentrate units. Someministries have regional structures that were established during the Soviet period (e.g.the Ministry of Agriculture, the Ministry of Environmental Protection and RegionalDevelopment); others created regional structures during the 1990s (e.g. the Ministryof Finance (the State Revenue Service) and the Ministry of Justice (the NaturalizationBoard)). These ministries that created their own regional administrations have not alwayscoincided with each other. Different ministries have completely different regionalstructures organized in accordance with various territorial and structural divisions. Someministries chose the principle of administrative regions (26 units); others are organizedin accordance with the principle of the historical division of the country into 6 regions.This diversity can be explained by the difference in needs and aims of various de-concentrated government institutions. The lack of a unified principle creates a complexand controversial service delivery system; from the citizens’ point of view, such a systemis both irrational and extremely time-consuming. In order to solve problems arising fromuneven access to administrative services, a rational administrative-territorial reform isessential at both the local government and regional level; however, there has been noreal progress in resolving this issue.
The existing reform concept offers some prospects for future development: therationalization of the institutional system will be achieved by enacting a law on the dis-tribution of functions and tasks at different government levels. Competencies will bedivided on the basis of the subsidiarity principle, which ensures decentralization anddemocratization. To avoid the duplication of competencies and to achieve greaterefficiency, some functions will be exclusively assigned to one level of governance. Therelationships between the levels of government will be based on co-operation and co-ordination. The administrative-territorial reform is related to changes in the boundariesof administrative territories. The basic prerequisite of an administrative territory is thatthere is a municipality. The central and local governments can organize their functionsin other territories without directly coinciding with the municipal territory. A changein the administrative territories and the organization of administration in the territoryis not a goal in itself, but changes are linked to many other issues of public administration.Actually, there are three reform processes underway: the unification of territories for the
S O C I A L S E C T O R D E V E LO P M E N T I N L AT V I A

142
T H E I M PA C T O F D E C E N T R A L I Z AT I O N O N S O C I A L P O L I C Y
performance of de-concentrated public functions; the territorial reform of the regionalgovernments; and the territorial reform of local governments. The purpose of the uni-fication of territories for de-concentrated public functions is to improve the accessibilityand quality of public services. The development of public administration aims at creatinga rational division of competencies between the central government and local governmentauthorities, a clear definition of responsibility and public accountability mechanisms,effective vertical and horizontal co-ordination, a professional civil service, an efficientpublic finance management system, and predictable performance of public institutions.
Local governments
There is a two-level system of local governments in Latvia consisting of towns and ruralmunicipalities on the first level, and districts on the second level. In addition, there areseven cities, which combine these two levels into one thereby fulfilling the functions ofboth the first and second levels of local government.
The organizational structure of local governments is determined by the law On LocalGovernments (1994) and by a charter approved by each local government’s council.Each type of local government has a council; the councils are elected directly by Latvia’scitizens under a proportional representation system.
The economic basis for local governments is the property and possessions in governanceand usage of the corresponding local government as well as the financial resources accu-mulated from:
• tax payments of legal and natural persons to the local budget,• specific grants and block grants (targeted grants) from the state budget,• loans,• local fees and other payments to the local budget,• fines (e.g. for traffic offences, not paying local taxes, spreading garbage, etc.) to
be transferred to the local budget,• revenues from local government property and the business activities of local
government institutions,• voluntary contributions of legal and natural persons for the accomplishment of
certain goals,• other revenues.
The allocation of income between central and local government budgets as well asthe amounts of grants and catch-up facilities are regulated by special laws or by the annualbudget law.
It has not yet been decided which local government institutions and jobs will becovered by the civil service system. It is anticipated that most local government employeesworking in education, medical, and commercial activities will be excluded.

143
The law On Local Governments specifies that the Cabinet of Ministers must consultwith local government representatives before adopting decisions that will affect any orall local governments. Consultation is realized through a system of negotiations thathas been established between the Cabinet of Ministers and the local governments. TheUnion of Local Governments, a nation-wide organization that unites 496 of the 586local governments in Latvia, represents local governments in the negotiations. TheCabinet must review any areas of disagreement that emerge from the negotiation meetings.
The law On Local Governments stipulates stronger supervision of local governmentsby the central government, particularly to ensure the legality of local government decisions.The Minister-without-Portfolio for State Administration and Local Government Reformscurrently supervises the legality of decisions taken by local government councils. ThisMinister can suspend any legally unacceptable decisions of the local government councils,but only the courts have the right to nullify decisions. The Minister can also suspend thechair of a local government council if they violate the constitution, the law and regulationsof the Cabinet of Ministers, or court orders. In addition, the Cabinet of Ministers hasthe right to submit to parliament a request to dismiss a local government council if thiscouncil has repeatedly violated the constitution, the law and regulations of the Cabinetof Ministers, or court orders.
Local governments have the right to co-operate with or to establish non-governmentalorganizations to fulfil tasks of common interest or to decide on joining or seceding fromthese organizations. After mutual agreement, the local government can delegate certainfunctions to other local governments. Financing comes from the budget of that localgovernment which is the contracting, and supervising authority. Local governments canalso co-operate with local governments in other countries.
As regards local self-governing authorities in Latvia, there are municipal governmentsand administrative regions (rayons). Local governments operate under the law On LocalGovernments and are independent of any interference by the state. They are governed byelected councils and have partly independent budgetary resources. The main problems ineveryday activities arise because of the lack of a clearly defined division of functions betweenadministrative levels and the provision of adequate financial resources. In order to stabilizethe budgetary issues in local governments and provide municipalities with the necessaryfinancial resources for the provision of services on an equal basis for all citizens, the systemof budget alignment was created. Any conflict between the state and the local municipalitiescan be solved in court. Since 1992 there has been an ongoing discussion about the necessityfor an administrative-territorial reform in order to create efficient and competitive local andregional administrative structures. The arguments of the economy of scales and democracyare being discussed to create balanced governance at all three administrative levels.
To understand the reform processes in Latvia it is necessary to consider not only thepolitical and administrative context of these processes but also their economic and socialaspects.
S O C I A L S E C T O R D E V E LO P M E N T I N L AT V I A

144
T H E I M PA C T O F D E C E N T R A L I Z AT I O N O N S O C I A L P O L I C Y
Local government reform is one of the most important targets for transformingLatvia. The concept of reform was approved by the Cabinet of Ministers in 1993. Themain goals are the democratization and decentralization of state power and public ad-ministration, the development of accountability of local governments in fulfilling tasksdelegated to them, the improvement of the quality of public services rendered to localresidents, and an increase in public participation in the process of administration.
The main principles of local government reform in Latvia are:
• democratization and decentralization of administration,• autonomy of local government from the central government,• independence of activities within the limits of the law,• development of municipal and private property,• establishment of independent local budgets,• use of market (rather than command) methods of management.
2.4 Main Actors of Social Policy
2.4.1 Commission on Social and Labor Issues
The Commission on Social and Labor Issues is a structural unit of the Saeima. TheCommission’s members are deputies (MPs). The basic task of the Commission is totake part in the formulation of draft laws and their discussion, and the review of appli-cations received from the population, agencies, and other organizations.
2.4.2 Ministry of Welfare
The Ministry of Welfare was established at the end of 1991 within the framework ofthe general administrative reform by merging the Ministry of Health, the Ministry ofSocial Insurance, the Committee of Labor and Social Affairs, and the Department ofWelfare of the Ministry of Economics.
The main tasks of the Ministry of Welfare are to formulate a national policy in theareas of social security and health care, to administer and to use political, economic andlegal means in resolving issues of social insurance, social care and social assistance, healthcare and protection, as well as issues of public health and pharmaceuticals, labor, laborprotection, and employment- and unemployment-related problems, thereby creatingthe prerequisites for securing the subsistence minimum and the quality of life for thepopulation of Latvia, as well as the social security network which would reduce thelikelihood of social risks and help to improve the standard of living.

145
2.4.3 Local Self-governments
According to the law On Local Governments, the main function of towns and rural localgovernments is to organize public services and activities in the fields of education,culture, primary health, and social assistance. The towns and other municipalitiesdetermine and collect local taxes and fees in accordance with the respective laws. Thedistrict governments possess responsibilities in the fields of health, education, culture,and social assistance at district level (Annex 6).
The participation in local government of inhabitants who are not citizens of Latviais intended to include—as suggested by the Council of Europe Convention on theParticipation of Foreigners in Public Life—participation as experts in the work of specialcommittees established to deal with the problems of non-citizens in areas where thereare a large number of them.
The local government council approves the local government charter, the budget,plans for socio-economic development, and environmental protection. It elects, and canrecall, the council chairman, vice-chairman and members of standing committeesestablished by the council.
The execution of functions that are assigned by the law On Local Governments isfinanced fully from the budget of the corresponding local government (Annex 5). TheCabinet of Ministers or individual ministries may delegate specific tasks to local govern-ments. In delegating such tasks the Cabinet of Ministers or the relevant ministry mustaccordingly transfer financial resources to the local government, or the local governmentmay voluntarily support the task through its own resources. State administrative institutionsdo not have the right to delegate functions and tasks to the local governments if thefinancing is not provided.
Analysis of the impact of decentralization on the division of functions between thestate and local governments has revealed that one of the most important problems is theexcessive overloading of local governments. This means that although the state delegatesfunctions to local governments, funding does not match these functions. This situationcauses dissatisfaction of local governments and their dissociation from the state; the dia-logue between the state and local governments is obstructed. In this impossible situationlocal governments are forced to take their own decisions and thus it is not possible to speakabout a uniform, national social policy which is implemented on the basis of equal criteria.
2.4.4 The Non-governmental Sector
In the non-governmental sector, those institutions operate which are driven neither bystriving for a profit (the private sector) nor as part of the state (the public sector); theseinstitutions are essential factors in the development and preservation of a stable democracy.
S O C I A L S E C T O R D E V E LO P M E N T I N L AT V I A
146
T H E I M PA C T O F D E C E N T R A L I Z AT I O N O N S O C I A L P O L I C Y
Moreover, the involvement of non-governmental organizations reduces budgetary expen-diture as well as offering the likelihood of innovative and more economical solutions forsociety’s myriad problems. Non-governmental organizations are also a means of promotingpublic and political integration. They operate in areas where public resources are insufficientand which are not profitable for the private sector. Non-governmental organizationsoffer various ways of addressing problems, they publicize the differing opinions of society’srepresentatives, express social needs, help to protect public interests, and are in a positionto create a dialogue with the state and other political forces.
During the transition of the economy at a time when the role of the state is decreasing,non-governmental organizations conduct important work, taking upon themselves partof the responsibilities of the state. In recent years the state has become aware of the use-fulness of delegating responsibilities to non-governmental organizations.
The delegation of functions increases the client’s options for choice and offers thelikelihood of improving the qualityof services. The delegation of functions is most evidentin the area of social assistance: offering various alternative social services such as homecare, day centers for the disabled, the elderly, persons with special needs, etc.
On the other hand, the decentralization of functions creates problems related tocontrol, supervision, and assessment. In the year 2000, draft regulations of the Cabinetof Ministers “Requirements for Providers of Social Assistance Services” were formulated.These regulations prescribe general demands to providers of social assistance services.The service provider may be a local government, a private organization or association, ora non-governmental organization. Institutions to which these regulations apply are socialcare institutions for children/adults, crisis centers, day-care centers for the mentally disabled,night shelters, social assistance services, providers of home-care services, etc. Regulationsprescribe requirements in relation to the organization of work, the number of staff, thedistribution of tasks among the staff, and the professional qualifications of the staff.
One of the worries of decentralization in Latvia is how to achieve a uniform qualityof social services, and to ensure that the social service is of quality irrespective of the placewhere it is provided, who receives the service, and who provides the service. The diversityof service providers jeopardizes the uniformity of services under the same given terms.Thus the formulation of regulations is a very relevant result of decentralization, and onewhich is directly linked to the quality of social services and service quality standards.
Problems that exist and hinder the efficient activities of non-governmental organiza-tions (NGOs) are related to the acquisition of status. The process of acquiring status isone that is full of uncertainties and, at times, arbitrary assumptions. With the acquisitionof status, NGOs are freed from the payment of taxes. According to the annual financialreports, most non-governmental organizations have quite modest financial resources,which are mostly constituted by donations “in-kind, not in-cash.” One of the trendsobserved in the development of non-governmental organizations in Latvia is that theactivities of most non-governmental organizations in Latvia break down soon after their
147
establishment as they are unable to attract volunteers and to ensure the required funding.By 1999 more than 4,500 NGOs had been registered in Latvia, however only a smallpart of them have resources exceeding LVL 5,000 (USD 8,000) per year. About 80% ofresources received by NGOs come from foreign not domestic sources; however, eventhe support of international organizations has been irregular and limited because inter-national donors do not have a concentrated, organized approach to supporting anorganization or a sector. The financial basis for NGOs in Latvia is not diverse and, as arule, each organization relies on only one or two sources of funding. On the whole, thereare few non-governmental organizations which are financially stable and these tend toexist only from one project until the next.
2.5 Macro-economic Developmentand Societal Changes Since Independence
Since the restoration of independence (August 1991), Latvia has been consistentlyfollowing the path of transition from the command economy to a market economy.Within a relatively short period of time, the foundations of a market economy were laidand good macro-economic preconditions for economic growth were created (low inflation,low level of government debt, stable national currency, positive balance of payments,etc.). The privatization of public enterprises is nearing completion. The share of theprivate sector in agriculture, manufacturing, construction and trade now exceeds 90%(Report on the Development of the Economy of Latvia 1999). During the years ofindependence, Latvia has been able to restructure its economy and at present closely60% of its foreign trade is with the countries of the European Union. On 10 February1999, Latvia was the first of the Baltic countries to become a full member of the WorldTrade Organization. Membership has offered an opportunity to expand external economicactivities on the basis of most-favored nation treatment with the 135 member states.The activation of the economy and the rapid growth of exports together have resultedin an increase in total GDP (Annex 9). Under the impact of external factors the develop-ment of Latvia in 1998 and 1999 was slower than potentially possible (Annex 7). Thecomplicated economic situation throughout the world and especially in Russia has in-fluenced the development rate of the Latvian economy. Consequently, in the secondhalf of 1998 and the beginning of 1999 Latvian export volumes declined, bankingindicators deteriorated, budgetary revenues did not accrue as planned, and unemploymentrose. Since the second quarter of 1999 the economic situation has improved, with agrowing foreign trade turnover, increasing exports and manufacturing output, and fallingunemployment rates. Although the Russian crisis has had a negative impact on the eco-nomic development of Latvia, real wages and pensions have continued to go up. In thesecond half of 1998 and at the beginning of 1999 under the impact of the Russian crisis,
S O C I A L S E C T O R D E V E LO P M E N T I N L AT V I A
148
T H E I M PA C T O F D E C E N T R A L I Z AT I O N O N S O C I A L P O L I C Y
many enterprises were forced to lay off people. The highest peak of unemployment wasin April 1999, yet by May it started to go down (Report on the Development of theEconomy of Latvia 1999). Today the financial system in Latvia is stable: the nationalcurrency in circulation is fully covered by foreign currencies and the gold reserves.
Accession to the European Union is one of the top priorities of the political andeconomic development of Latvia. December 1999 marked a new phase in the relationsbetween Latvia and the European Union as the EU Council decided to continue theEU enlargement process and also invited Latvia to start accession negotiations. Thisdecision is, in a way, an evaluation of Latvia’s progress.
As mentioned, budget expenditures have increased over the past few years. So far asthe social budget expenditures are concerned, they have increased substantially—by 20%.There have similarly been increases in expenditure on public order and safety, on thejudiciary, as well on health care, recreation, sport, culture and religion, and on economicaffairs. In only two instances did expenditure go down: general public expenditure anddefense (Report on the Development of the Economy of Latvia 1999). According tothe human development index (HDI) calculated by the United Nations, in 1999 Latviaoccupied the 74th position in the world (92nd in 1998).
2.6 Labor Market Situation
During the 1990s, Latvia, like other CEE states, experienced huge economic reforms—privatization, restructuring of the economy, etc., accompanied by changes in the employ-ment structure. The dominant trends are illustrated in Annex 10.
The employment growth that had been apparent since 1996 came to a halt in thesecond half of 1998 due to the Russian crisis. With regard to the unemployment situation(Annex 11), it should be mentioned that the actual unemployment rate in the countryis much higher. Labor surveys carried out by the Central Statistical Bureau in accordancewith the methodology of the International Labor Organization show that the numberof people seeking jobs in the third quarter of 1999 was 13.9% (in the third quarter of1998—13.7%) of the economically active population.
The unemployment rate varies from region to region and from city to city. Themost difficult situation exists in the regions and cities of Latgale. Here, every fourthunemployed person is unskilled. The number of job-seekers in the economically activepopulation showing the actual level of unemployment in the country is described inAnnex 12.
There is a trend in the growth of unemployment among people between 20 and 25years of age. At the end of 1995 the share of this age group in the total number of theunemployed was 11.6% and at the end of 1998 it was already 12.7%; at the end of thefirst half of 1999 it had slowed down to give a figure of 12.2% of the total number of
149
unemployed. The same trend can be seen in the changes of unemployment in the 25-30age group.
Many unemployed people are unskilled; this situation has not changed over recentyears, remaining at the level of 26-27% of the total number of unemployed. The numberof unemployed without any profession (without training) in the total number of un-employed at the end of 1995 was 3.2%, and in the following years 4.7-4.9%. The majorityof unemployed are people with general secondary education and incomplete primaryeducation (at the end of 1998 these proportions were 31.3% and 23.9% respectively).The number of unemployed with higher education at the end of 1998 was 6.8% of thetotal number of unemployed.
Long-term unemployment is a serious problem in Latvia. Lately there is evidenceof improvement. At the end of 1998 there were 29,300 long-term unemployed peopleregistered with the State Employment Service (registered for more than one year), or26.3% of the total number of the unemployed (38.1% at the end of 1997). At the endof the first half of 1999 the share of the long-term unemployed reached 25.4%. Theproportion of long-term unemployed in different districts of Latvia varies, e.g. in Latgalein 1999 had reached 54.2% (and these are only the official figures).
As regards the length of the job-seeking period:
• 54.6% have been seeking a job for 1-5+ years;• 16.7% have been seeking a job for 6-12 months.
Long-term unemployment is related to several other social problems, includingdepression and lack of faith in oneself. The longer an individual is out of work the quickerthe professional skills and the ability to adapt to the new labor market conditions andrequirements are lost.
At the end of 1998 the State Employment Service had about 3,000 vacancies on itsbooks. The highest demand was for senior specialists, skilled workers and craftsmen.There is a trend towards an increase in vacancies in the private sector. At the end of 1995,of the total number of vacancies, 29% of jobs were in the private sector; at the end of1998 this figure was already 62%. The long-term goal of the employment policy ofLatvia is the full employment of individuals able to work, ensuring that all Latvians whoare willing to work have the possibility of finding a job, becoming part of the labormarket, and ensuring people’s economic and social mobility (Report on the Developmentof the Economy of Latvia 1999).
The basis for the employment policy was formulated in 1992 when the law OnEmployment took effect. Alongside passive activities for promoting employment, wideactive measures were undertaken, such as vocational training or retraining, and temporarypaid community work (TPCW). In 1993, 2,816 people were given training or retrainingcourses and 6,692 persons were engaged in TPCW; in 1998, the respective figures were
S O C I A L S E C T O R D E V E LO P M E N T I N L AT V I A

150
T H E I M PA C T O F D E C E N T R A L I Z AT I O N O N S O C I A L P O L I C Y
six times and two times greater. Total expenditures from the budget earmarked for em-ployment activities increase annually. The budget is linked with the increase in both thenumber of unemployed and the size of the unemployment benefit and the expansion ofthe scope of active employment measures. Budgetary allocations for financing employmentactivities also increase annually. However, the amounts paid in unemployment benefitsconsiderably exceeded the total amount of resources spent to support active employmentmeasures.
The following priorities in the development of the Latvian employment policy are:
• improvement in the quality of the workforce;• promotion of employment among young people;• shortening of the length of the unemployment period;• development of special employment programs to integrate people of pre-retirement
age into the labor market;• improvement of the quality and efficiency of services provided to job-seekers
and the unemployed (Report on the Development of the Economy of Latvia1999).
2.7 Basic Demographic Indicators Influencingthe Social Protection System
The natural growth of the population changed from positive to negative during the1990s (Annex 3, Annex 13). Bearing in mind the negative balance of migration, thepopulation has decreased by 226,000 people since 1989, or 8.8%. Even so, there arealso some positive trends. In a nine-month period of 1999 compared to the same periodin the preceding year the number of newly-born children went up by 7.4% and thenumber of deceased dropped by 1%. Thus the overall decline in the population levelwas smaller than in previous years (Central Statistical Bureau of Latvia).
The average life expectancy is low: in 1998 for men it was 64.1 years, for women itwas considerably higher—75.5 years. These figures remain at the level of 1990 and are,on the whole, lower than in most economically developed countries where the averagelife expectancy for men exceeds 70 years and for women 80 (Annex 14).
In 1998 the government approved a program for improving the demographic situa-tion. The main goal of the program is to secure an increase in the population. Strategicdirections in its implementation are to strengthen families and stimulate the birth rate,and to improve the level of education and culture. However, in order to achieve theseobjectives it is necessary to invest considerable resources in the development of the nationaleconomy, to increase the possibilities of employment, to promote research and education,and to improve the health-care system.
151
2.8 Standard of Living and Poverty
Since the restoration of independence in Latvia and the shift to a market economythere has been evidence of the social stratification of the population. This stratificationwas rapid in the initial stages, becoming stable during recent years. Two clearly distin-guishable social groups have emerged—the affluent and the poor; those in between donot have very clearly defined characteristics.
There are considerable regional differences regarding the income of Latvia’s population.Data concerned with the household budget survey shows that in 1998 a higher level ofincome and more rapid growth rates characterized the households of the Riga region.Here, the monthly disposable income of a household amounted to LVL 74 per householdmember which is higher than the national average by 18.7%. The second highest levelof income was in Zemgale (LVL 57) closely followed by Vidzeme (LVL 56). The lowestincome and growth rates, lagging behind the inflation rate, were in Latgale’s households.The monthly disposable income in this region was only LVL 45.54 per householdmember—by LVL 16.79 (or by 26.9%) lower than the national average.
The income level is strongly determined by the demographic (family) situation of thehouseholds. The situation is worse in single parent families.
Food and housing maintenance costs are still the main consumer priorities in house-holds. In this respect there are significant regional differences as well.
At the initial phase of the transition period (until 1996) a falling trend in real wagesand salaries was observed every year whereas in recent years real wages have been con-tinuously rising. Statistical data shows that the Russian crisis has not significantly affectedthe income of people employed in the national economy and it keeps going up thoughat a slower rate than in preceding years (Central Statistical Bureau of Latvia).
The average wages—converted into dollars—of people employed in the nationaleconomy fell behind other candidate countries of the European Union, except Bulgariaand Romania. The income of people employed in educational institutions, health careand social assistance, and those who work in recreation, culture and sport are at approxi-mately the same level, viz. LVL 116–117; this amount is still below (by approximatelyone-sixth) the average income of people employed in the national economy. At thebeginning of 1999 the minimum monthly wage in Latvia was raised to LVL 50 (approxi-mately USD 110). Yet at the end of May 1999 a general agreement was signed betweenthe Employers’ Confederation of Latvia and the Latvian Free Trade Union Confederationon raising the minimum monthly wage to LVL 65 in enterprises of the Confederations(Report on the Development of the Economy of Latvia 1999).
In nine months of 1999 compared to the same period in the preceding year theaverage old-age pensions went up from LVL 50.2 to LVL 58.02. This growth of pensionswas basically related to amendments to the law On State Pensions passed by the Saeimaon 21 October 1998. The said, amendments allowed employed pensioners who had
S O C I A L S E C T O R D E V E LO P M E N T I N L AT V I A

152
T H E I M PA C T O F D E C E N T R A L I Z AT I O N O N S O C I A L P O L I C Y
worked for at least three years after 1 January 1996 to have their pensions recalculatedin accordance with the new pension calculation rules. The above-mentioned amendmentsand other changes together with the dynamic growth of unemployment demandedconsiderable additional expenditure from the social insurance special budget. With theintention of improving the situation, on 5 August 1999 the Saeima passed the law OnAmendments to the law On State Pensions. The new law stated that working pensionerscould not receive pensions, and the age set for qualifying for an old-age pension wouldbe progressively raised to 62 years for both men and women. The opposition parties,supported by the trade unions, the Pensioners’ Federation and many non-governmentalorganizations, requested a referendum on this law. This request was supported by thesignatures of approximately 180,000 voters. At the same time the government was tryingto find ways to solve the conflict and worked out a set of less stringent amendments tothe On State Pensions law stipulating that working pensioners were eligible to receivepensions of LVL 60 and less; also, the transition to the pension age of 62 years would beslowed down. The majority of the electorate was satisfied with the proposed new packageof legislative amendments and therefore did not participate in the November 1999referendum. Consequently, the Central Election Commission declared that the referendumhad not taken place, and the President of Latvia announced that the above amendmentshad taken effect. Despite the problems with the budget, in May and November 1999the government continued the adjustment of pensions (indexing). However, in view ofthe negligible changes in the consumer prices and the deficit in the social insurance budgetthe adjustment was rather of a symbolic character—increased by 0.3% (on average,LVL 0.18 per pensioner) and 0.7% (on average, LVL 0.42 per pensioner). Until 2002,the adjustment for pensions that do not exceed three minimum wages will be conductedonce a year. The living standards of pensioners and in particular of working pensionershave slightly improved. The number of working pensioners is also growing (Report onthe Development of the Economy of Latvia 1999).
The number of poor in Latvia has been calculated on the basis of the poverty relativityindicators and it constitutes about 60-80% of the total population. This social back-ground in which most people are living on the border of relative poverty creates socialtension, which has recently manifested itself with large segments of the populationsuffering from depression. Certain districts in Latvia particularly exhibit this; in thesedistricts, unemployment, hopelessness, alcoholism, and other types of unfortunate ordeviant behavior are prevelent. Long-term unemployment and poverty generate feelingsof helplessness, which leads to apathy and passivity. Life under the Soviet system hasleft a feeling among elderly people that the state must incessantly take care of everybody;this phenomenon helps to stimulate such an attitude among the younger generation.
A considerable difference in poverty levels between cities/towns and rural areas can beobserved. In rural areas, even though the level of economic activity and the number ofeconomically active inhabitants who have jobs is much higher, they are still poorer thancities/towns (Poverty and Labor Market in Latvia 2000, p. 55).

153
The government has started to implement a poverty eradication program. In ac-cordance with the European Council’s recommendations in the last four years, statebenefits to families will be increased. Measures are being developed to ensure theavailability of education and health care as well as to facilitate the availability of loansto purchase housing and pay for studies.
The Ministry of Welfare has prepared the concept “On Minimum Income Guaranteesto Poor People” for submission to the government with proposals on how to ensurethat people who are unable to earn a living are provided with a guaranteed minimumincome level which would be uniform for the whole country. In this respect it is plannedto establish a guaranteed minimum income at national level, to define the obligationsof local governments to ensure this minimum income, and to outline the framework ofstate participation in financing the scheme. This concept will be the basis for amendingthe law On Social Assistance.
3. THE SOCIAL PROTECTION SYSTEM
The transition from a planned state economy to a market economy, and the economicand social consequences of this process, aggravated a whole range of social problems—poverty, unemployment, social exclusion—and resulted in the falling of specific groupsof the population into social risk situations.
Social problems cause social tensions; this, in turn, affects whole communities, andparticularly specific groups of the population. A vulnerable group may be defined as abody of people who are unable to satisfy their needs without the support of the community.
The situation of vulnerable people in Latvia is characterized by several features,including:
• income below the subsistence minimum;• education which does not correspond to the labor market demand;• low professional qualifications;• lack of social support in the family or any other small group;• defects in physical or mental development;• a disoriented or deformed value system;• inability of people’s psychological mobilization to achieve their aims.
Groups which are unable to satisfy their needs in many areas of life are:
• low income families with children (single-parent families, families with manychildren, families of the unemployed, substance abusers, as well as families whohave a disabled or severely sick child);
S O C I A L S E C T O R D E V E LO P M E N T I N L AT V I A

154
T H E I M PA C T O F D E C E N T R A L I Z AT I O N O N S O C I A L P O L I C Y
• orphans and children deprived of parental care;• the disabled;• old, single people;• ex-convicts;• the unemployed, in particular the long-term unemployed, women of pre-
retirement age and young people;• substance abusers;• those who are terminally ill, e.g. HIV/AIDS patients.
The changes required the restructuring of the social policy inherited from the Sovietperiod. Both the strategy and the objectives of social policy changed as they had to beadjusted to the new conditions of the market economy. A comprehensive social securityreform has been implemented in Latvia.
3.1 Values, Principles, Objectives
The new social security system was designed around the following main objectivesdeclared in the “Concept Paper on Social Security”:
• to guarantee the social security and the protection of inhabitants of the countrywho are unable to provide for themselves or to overcome specific difficulties oflife, and who do not receive sufficient assistance from anyone;
• to develop a system which is compatible and complies with the social securityobjectives and principles of the developed European countries;
• to guarantee individuals social rights and the implementation of those rights,and to create in individuals a feeling of social security, while at the same timemotivating the individual.
The main lines of activities ensuing from the current problems include:
• a decrease in poverty; to define a poverty line which corresponds to the conditionsof Latvia, regulating only one municipal benefit by law; channeling assistanceto those who need it most of all as well as to prevent the risk of falling into thepoverty trap; constant dependence on social assistance programs which are focusedon the poor;
• dealing with families with children—including taking measures to change thetrend of a growing number of children being deprived of parental care (orphansof living parents), and paying more attention to the issue of parental responsibilityfor supporting a child;
155
• ameliorating the situation of the disabled and other risk groups; paying particularattention to the understanding of the notion of disability, rehabilitation, andintegration services provided by qualified staff;
• improving co-operation with local governments; ensuring the introduction ofminimum standards established at the central level, while at the same time leavingoppor-tunities for local governments to promote flexible activities;
• developing various co-operation models among different areas of welfare; intro-ducing an integrated approach to providing social services, proceeding from theprinciple that welfare includes co-operation of various sectors, viz. economics,education, etc.
3.2 Main Stages of Social Legislation
In 1995 the Saeima enacted a package of social security laws paying particular attentionto the establishment of a financially strong, client-oriented independent social securitysystem. The basic principles of the social security system, the main social rights of theindividual and prerequisites for their exercise, are regulated by the law On Social Security(1995). This law determines the basic principles of social security: equal access to theservices, solidarity, social insurance and assistance, preventive measures, self-governanceand individual approach. This law also defines the main social rights and obligations ofthe people and the main criteria for the law’s implementation. This law also describesthe various types of social services. The section on social rights describes the principlesof social insurance in Latvia including activities for protecting, maintaining and improvingpeople’s health and the ability to work as well as restoring (benefits in kind) and providingmaterial support in cases of illness, maternity, disability, old age and unemployment(benefits in cash).
Each of the areas of social security—social assistance, social insurance, the labormarket, and health care (this last area is not described in the report)—are regulated bymore specific legal acts.
3.3 Implementation of Social Policy
3.3.1 Social Insurance—Generally
The social security system of Latvia covers the following areas: social protection, the labormarket, and health. The main emphasis in the research study was placed on describingand analyzing the social protection system. The social protection system is targeted at
S O C I A L S E C T O R D E V E LO P M E N T I N L AT V I A

156
T H E I M PA C T O F D E C E N T R A L I Z AT I O N O N S O C I A L P O L I C Y
preventing social risks and/or the mitigation of its consequences. The term “social risk”applies to the incapacity to work due to old age, sickness or disability, unemployment,child-care, poor health, or the inability to earn an income for some other reason.
3.3.2 State Social Insurance System
The state social insurance system is a set of activities organized by the state, with activitiesbased on compensation for the decrease or loss of an individual’s income in proportion tothe social insurance contributions made by the individual. All social insurance activitiesare organized by the state; they are centralized and regulated by law. The state social in-surance system covers employed individuals who either themselves make social insurancecontributions or to whom social insurance contributions are paid. The social insurancecontributions that have been made provide guarantees to the individual to receive incomecompensation in the event of a social risk listed by law.
Table 3.1Social Risks Included in the State Social Insurance System
Social Risk Type of Insurance Payment
1. Sickness Sickness benefit
2. Disability Disability pension
3. Unemployment Unemployment benefit
4. Old age Old-age pension
5. Occupational accident or occupational disease Compensation for the loss of capacityto work due to an occupational accidentor an occupational disease
6. Maternity Maternity benefit
7. Death of a dependent family member Funeral allowanceof the insured individual
The “umbrella” law On State Social Insurance took effect on 1 January 1998. Thepurposes of this law are as follows:
• to systematize the scope of socially insured persons;• to establish a differentiated contribution rate depending on risks which are likely
to arise;• to give the opportunity to participate in the voluntary pension insurance scheme;• to establish the maximum amount of the contribution object;
157
• to ensure the transparency of budget expenditure by establishing four specialbudgets: pension, employment, occupational accident, and disability, maternityand illness—instead of the State social insurance special budget;
• to separate the administration of contributions from the administration of pay-ments;
• to enhance (as of 2002) the responsibility of the employee and to reduce theemployer’s tax burden by reducing the compulsory contribution rate as well asby redistributing the tax rate between the employer and the employee (33% =16.5%+16.5%).
Other laws in the area of social insurance determine who receives, as well as theprocedure for, the accrual and expenditure of resources for specific types of social in-surance or social risks.
3.4 Social Assistance
The purpose of social assistance efforts is to ensure social protection to those inhabitantswho find themselves in poverty or in any other social risk situation and to whom othersocial safety efforts do not apply or are insufficient. Social assistance is based on theassessment of the situation and the income of the given individual.
The responsibility for providing social assistance is divided between the state andlocal governments (Annex 16). In Latvia social assistance services include demogrant-type (categorical social assistance) universal services (based on the person’s belonging to aspecific group of the population) and services provided after the assessment of a person’sspecific needs.
Social assistance includes three types of services:
• material assistance;• social care;• social rehabilitation
The law On Social Assistance (October 1998) regulates issues of social assistance nation-wide; it stipulates:
• types of social assistance;• types of state- and local government-provided social assistance;• obligations of the state and local governments in the provision of social assistance;• the range of individuals who are eligible to receive social assistance and social
benefits;
S O C I A L S E C T O R D E V E LO P M E N T I N L AT V I A
158
T H E I M PA C T O F D E C E N T R A L I Z AT I O N O N S O C I A L P O L I C Y
The law also defines payments such as birth grant, child-care grant, and familybenefit. Services provided by different kinds of social assistance institutions are essentialcomponents of the social assistance system.
Uniform minimum requirements for the providers of social services were formulatedduring 1997 and approved at the beginning of 1998. The requirements define the contentof the provided services and the operational ideology of the providing institution forseven providers of various types of social services, viz. social care institutions for children,social care institutions for adults, crisis centers, day-care centers for people with mentaldifficulties, night shelters, social assistance services, home care.
Cash payments or benefits in-kind to individuals or families are financed either fromthe national or local government budget. Social benefits are categorized according totheir financial sources: state social benefits (generally they are part of a universal character)and municipal social benefits.
The law On Social Assistance defines four key objectives for which local governmentsocial benefits are to be granted:
• social assistance benefits to low-income families to help stabilize the family incomeat a certain level;
• housing benefits—assistance to the family in paying rent, for utilities and incovering expenses related to the purchase of fuel;
• care allowance—for the retired, disabled or a child if such care is necessary basedon a medical certificate;
• funeral benefits—coverage of the minimum interment expenses in the event ofa person’s death if there is no right to any other funeral benefit.
The same law stipulates that local governments may also grant benefits for otherpurposes within the limits of their respective budgets.
There are specific legal acts, which establish social protection for specific (socialrisk) groups or for specific situations:
• disabled or people with special needs—the law On Medical and Social Assistancefor the Disabled (1992);
• participants of the liquidation operations after the Chernobyl accident—thelaw On Social Protection of Participants of the Liquidation Operations after theChernobyl Accident and Families of Victims of the Chernobyl Accident. The lawestablishes the social and medical services for which these individuals are eligibleas well as the scale of these services.
• poor people—Regulations of the Cabinet of Ministers No. 75 “Regulations on SocialAssistance Benefits to Poor Families and the Assessment of the Material Situation ofPoor Families” (March 1996).

159
3.5 Family Policy
In the present social and economic situation many families are unable, by themselves,to cope with the many problems which have appeared as a result of the rapid changes insociety. The social and economic instability, insecurity about their future, the radicalchanges of values, together with perplexing challenges and new opportunities haveconsiderably decreased the ability of the family to adapt to the new conditions and thismanifests itself in the spread of socially unfavorable trends. The demographic crisis, theaggravation of poverty, the spread of alcoholism and drug addiction, the increase in thenumber of divorces, children born in unregistered partnerships and out-of-wedlock, thegrowth of the number of children deprived of parental care and placed in child-careinstitutions, etc. are all consequences of the insufficient support and absence of purpose-fulness in addressing family problems relying rather on the hope that the problems willresolve themselves or that the families will resolve them on their own. However, theactual situation shows that relying on the family alone has not been justified.
One of the basic problems is that there is no uniform national family policy in thecountry, a policy that would be aimed at strengthening the role of the family and thepreservation of family values, and the development of a healthy social and economicenvironment, which would stimulate the development of the family. The current measuresare more focused on the individual and the resolution of their problems, and in this waythe problems of the family are neglected.
The current situation is complicated by the fact that:
• during the formulation of policies their impact on the family is not assessed andtaken into account;
• services available for families are fragmented and not accessible to all families(depending on the income level and the place of residence);
• at present, preventive activities, e.g. family counseling, education and rehabili-tation, do not have sufficient funding;
• the officials who deal with family issues do not have sufficient skills and knowledgefor work with the family as a whole; likewise they lack appropriately formulatedtasks for resolving such family problems;
• the division of responsibility between the state, local governments and the non-governmental sector for the organization and funding of these services has notbeen defined.
3.6 Child Protection
Every year sees an increase in the number of children deprived of proper parental care.These are children who grow up in high-risk families. Generally speaking, the problems
S O C I A L S E C T O R D E V E LO P M E N T I N L AT V I A
160
T H E I M PA C T O F D E C E N T R A L I Z AT I O N O N S O C I A L P O L I C Y
are related to the upbringing and support of children. There are cases when the motheris interested in placing the child in a shelter as there the child will be fed and taken careof. Often these are families with many children who do not have the same father. Forstatistical information regarding child protection see Annexes 20 and 21.
The most relevant legal acts prescribing social guarantees for children are:
• the law On Custody Courts and Civil Parish Courts (January 1996). Custody courtsare a comparatively new institution in Latvia. In fact, custody courts started tooperate in 1997. They are local government institutions and are at present amongthe important bodies addressing family-related problems, the protection ofchildren’s interests, the suspension of parental power, the appointment of guardiansand dealing with adoption issues. The law prescribes the procedure for establishingcustody courts and their competence.
• Regulations of the Cabinet of Ministers No. 80 On Operation of Custody Courtsand Civil Parish Courts (March 1996) (issued in accordance with the law OnCustody Courts and Civil Parish Courts). The regulations prescribe the procedurefor the submission, review and receipt of documents and the operation of custodycourts, i.e. all procedures for the internal organization and rules of operation ofcustody courts.
• guardianship—Regulations of the Cabinet of Ministers No. 87 On State SocialBenefit for a Guardian (March 2000) (issued in accordance with the law OnSocial Assistance);
• foster families—Regulations of the Cabinet of Ministers No. 211 On FosterFamilies (June 1997) (issued in accordance with the law On Custody Courts andCivil Parish Courts);
• adoption—Regulations of the Cabinet of Ministers No. 312 On Adoption (August1996).
A number of forms of alternative care have been introduced in Latvia recently such as:
• home care;• guardianship;• foster families;• adoption;• day centers.
The introduction and organization of the various forms of alternative care for allgroups of the population fall within the competence of the local governments and mostof them are financed from the local budgets.
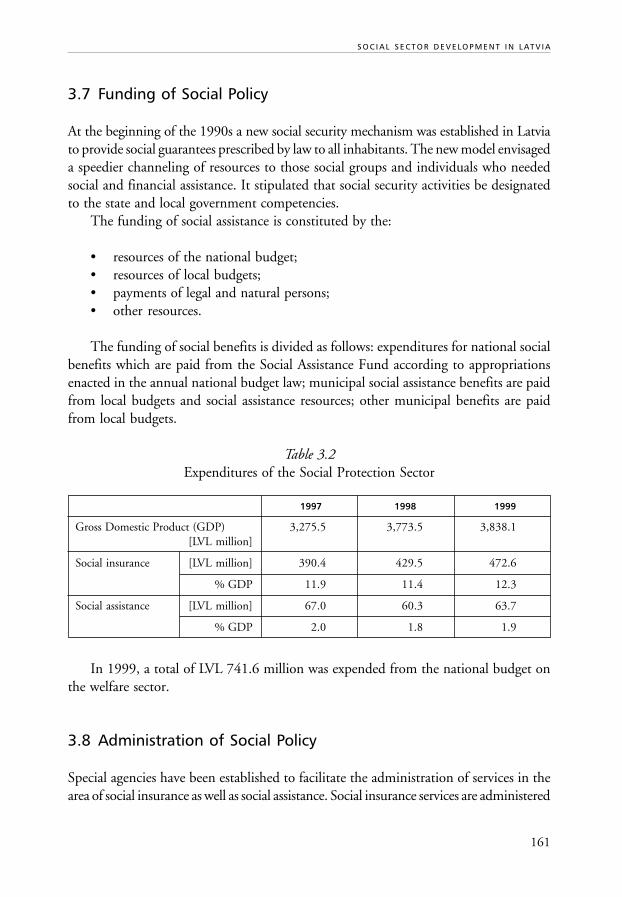
161
3.7 Funding of Social Policy
At the beginning of the 1990s a new social security mechanism was established in Latviato provide social guarantees prescribed by law to all inhabitants. The new model envisageda speedier channeling of resources to those social groups and individuals who neededsocial and financial assistance. It stipulated that social security activities be designatedto the state and local government competencies.
The funding of social assistance is constituted by the:
• resources of the national budget;• resources of local budgets;• payments of legal and natural persons;• other resources.
The funding of social benefits is divided as follows: expenditures for national socialbenefits which are paid from the Social Assistance Fund according to appropriationsenacted in the annual national budget law; municipal social assistance benefits are paidfrom local budgets and social assistance resources; other municipal benefits are paidfrom local budgets.
Table 3.2Expenditures of the Social Protection Sector
1997 1998 1999
Gross Domestic Product (GDP) 3,275.5 3,773.5 3,838.1[LVL million]
Social insurance [LVL million] 390.4 429.5 472.6
% GDP 11.9 11.4 12.3
Social assistance [LVL million] 67.0 60.3 63.7
% GDP 2.0 1.8 1.9
In 1999, a total of LVL 741.6 million was expended from the national budget onthe welfare sector.
3.8 Administration of Social Policy
Special agencies have been established to facilitate the administration of services in thearea of social insurance as well as social assistance. Social insurance services are administered
S O C I A L S E C T O R D E V E LO P M E N T I N L AT V I A
162
T H E I M PA C T O F D E C E N T R A L I Z AT I O N O N S O C I A L P O L I C Y
by the State Social Insurance Agency (SSIA) while social assistance services are administeredby the Social Assistance Fund (SAF).
Services administered by the Social Assistance Fund include:
• financial management of public agencies and of the social assistance system;• supervision and control over state and municipal social assistance institutions;• analysis and provision of information;• assessment of the quality of social assistance services;• development of the market of social services, the promotion of co-operation bet-
ween local governments, non-governmental organizations, and the private sector;• provision of methodological assistance, co-ordination of the training for employees
working in the social assistance system;• business activities with the purpose of attracting additional resources for carrying
out social assistance tasks.
In social assistance local governments may delegate (Annexes 19, 20) certain functionsto NGOs and natural persons:
• home care;• day-care centers;• sheltered workshops for the mentally disabled, the blind, etc.
4. THE OUTCOME OF DECENTRALIZED SOCIAL POLICY
Market economy principles, competition, contracting, cost efficiency (e.g. the delegationof functions to the non-governmental sector), operate in the creating and distribution ofsocial services.
One of the problems caused by decentralization is that the quality of social servicesprovided varies from place to place. Regulations of the Cabinet of Ministers “Require-ments for Providers of Social Assistance Services” have been drafted to address this issue.However the problem continues to exist and the drafting of Cabinet Regulations is onlythe first step towards establishing a system that provides a uniform quality of servicesthroughout the entire country.
When analyzing the benefits of decentralization of social policy in Latvia, one of theimportant advantages to be pointed out is that social policy has become closer to individuals,meaning that local governments are now responsible for decision-making on many socialissues. They have considerable discretion in this field, they can be very flexible and reactto most of the important problems in the most appropriate way.

163
As was mentioned in an interview in the village of Gaujiena: “We know that otherlocal governments do not give financial support for weddings, but we think that it isimportant for the future of our local government and we found resources for it....” It wasalso stressed in many interviews that in local government “everybody knows everybody,”and this helps on focusing social assistance to real problems which probably could notbe observed from a central viewpoint, and it also allows space to think about preventiveactivities where possible.
Poverty (not only as lack of income but also as lack of opportunities) and social ex-clusion are presently among the main social problems in the country. Families with childrenare in the most disadvantaged situation. The risk of poverty increases with the numberof children in the family. Among the consequences of decentralization of social assistance—when each local government is accorded considerable discretion in allocating support—is that social assistance does not always reach those individuals who most need it. Nordoes it always reach the poorest.
Another advantage that can be pointed out is the involvement of NGOs in the pro-vision of services and in the social area. Several NGOs are interested in participating inthe provision of social assistance: examples of activities that were mentioned in discussionswere pensioners’ organizations, family associations, helping local people with clothes,advice, etc. There were also comments that decentralization facilitated the involvementof the private sector in social activities in local governments because businessmen couldsee in what way and how their help or the resources they offered were used and it led tothem accepting joint responsibility for the general situation.
Some problems related to decentralization are connected with the current administ-rative territorial division of local governments which, in general, is unequal therebycreating a number of problems. Most local governments are small and due to their verylimited resources their social assistance activities are limited. There is thus a tendencyin Latvia for rich local governments to invest more money in social programs, but poorlocal governments where more poor people are concentrated to invest less. As a rule,urban local governments are wealthier than rural ones. One solution could be administ-rative territorial reform, which aims to increase the size of local governments, but asthis is an ongoing process it is very difficult to predict the results.
One of the problems of decentralization is that it creates a very complicated pathfor the cash flow, which is difficult to supervise. It is, in fact, almost impossible to followthe cash flow. Each separate local government is financed from several sources. First ofall there are the special-purpose grants: central funding by the government (this sourceconstitutes 71.4% of personal income tax), funding from the national special budget,and from the national general budget. In addition, local governments receive fundsfrom the Local Government Finance Equalization Fund, which was instituted to reducedifferences among local governments with differing basic funding. Local governmentfunding also comes from local fees, real estate tax, and payments for services; local govern-
S O C I A L S E C T O R D E V E LO P M E N T I N L AT V I A
164
T H E I M PA C T O F D E C E N T R A L I Z AT I O N O N S O C I A L P O L I C Y
ments may also receive state-guaranteed loans or gifts/donations. The possibility of wastingmoney without due purpose cannot be excluded. The distribution of funding in smallerfinancial operations allows dubious economic measures to be undertaken. For example,the local government allocates funding for the purchase of fuel for the low-incomepopulation. The new regulations prescribe that tenders should be sought for the companyoffering the best and cheapest services; however, this does not always pay off as transportcosts make the provision of this assistance more expensive and result in unnecessary ex-pending of resources. If such an activity were to be organized on a centralized basis thenit could be calculated which place of fuel supplies would be more economical for thetransportation of the fuel.
There is evidence in certain places of a tendency to re-centralize social assistance, inparticular in Riga. This means that money will be more concentrated in the hands ofthe central agencies and it will require much more time to ensure that social assistancereaches the individual who needs this assistance along the shortest route. Financialcentralization, in turn, will allow the allocation of resources for larger projects.
One of the obstacles to decentralization is the absence of a uniform database in thecountry. In a situation where there are 585 local governments in the country and eachlocal government has its own system and methods of data collection and processing, itis impossible to gain a realistic picture of the national situation. This is also true of theprovision of social services: local governments have different systems for registering thesocial services provided, their costs, the time involved in dealing with clients, etc. Moreover,local governments have a very diverse level of information technologies and their applica-tion. Even the types of records for social assistance services and clients vary. In 1999,553 local governments had a total of 173 computers; only 14% of local governmentsmaintain computerized databases.
This lack of uniform information makes it impossible to develop national statisticsin the area of social assistance. The transmission and collection of data, and access tonational records is not possible.
One of the ways the state tries to resolve the problem in the area of social assistanceis to use the Social Assistance Fund. Every year each local government is sent a questionnairerequiring the social demographic description of the population/clients, and the scale,types, and recipients of social assistance services, as well as information about the socialworkers employed by local governments.
The problem is that not all local governments are honest when answering thesequestionnaires, and thus the credibility of the data is dubious. Nevertheless, at presentthis is the only source for acquiring information about social services in the country.
With regard to social insurance, this function (i.e. records, data, statistics, etc.) isperformed by the Social Insurance Agency, which has 33 offices in the country.
So far as human resources are concerned the most serious problem is the shortageof staff. Lack of professionally trained staff is felt acutely in social work. For example,

165
in Riga’s Kurzeme district only 4-5% of local government staff has any specializededucation. The majority of these people are volunteers. A similar situation has developedin other local governments in the country. Usually people who work in social assistanceservices do it on a part-time basis, often they have insufficient information about theessence of social work and they restrict themselves to the provision of the minimumsocial benefit or assistance of any other type. No efficient political capacity in providingsocial assistance has been developed in the country. Local governments focus attentionon those who receive assistance.
As a result of decentralization, local governments have become highly independent.Local governments themselves are now taking many of the decisions and in this waythe state is losing control. This means that even though it is gradually emerging thatthere is a current trend to centralize specific functions, e.g. the quality control of servicesand the monitoring of social programs, it has become apparent that at national levelthere is no longer a clear understanding of what is actually going on in local governments.
BIBLIOGRAPHY
Report on the Development of the Economy of Latvia, 1999. Human DevelopmentReport—Latvia 1999, UNDP.
Vanags, E. and I. Vilka, (2000) “Local Government in Latvia,” in: T.M. Horváth (ed.)Decentralization: Experiments and Reforms, Vol. I, LGI/OSI, Budapest, 2000.
Towns and Civil Parishes in the Administrative Districts of Latvia, A collection of statisticaldata, Central Statistical Bureau of Latvia, Latvian Statistical Institute, Riga, 1998.
Demographic Yearbook of Latvia, Central Statistical Bureau of Latvia, 2000.Statistical Yearbook of Latvia, 1999. Central Statistical Bureau of Latvia, 2000.Statistical Yearbook of Latvia, 2000. Central Statistical Bureau of Latvia, 2001.Administrative Districts and Major Cities of Latvia, Statistical Yearbook 1999, Central
Statistical Bureau of Latvia, Latvian Statistical Institute, Riga, 1999.Macro-economic Portrait of Latvia’s Regions, Statistical Bulletin, Central Statistical Bureau
of Latvia, Riga, 2000.The Survey of Living Conditions in Latvia 1999, Informative Bulletin, Central Statistical
Bureau of Latvia and FAFO Institute for Applied Social Science (Norway), Riga, 2000.
LEGISLATION
• Law On Employment (1991)• Law On Labor Protection (1993)• Law On Local Governments (1994)
S O C I A L S E C T O R D E V E LO P M E N T I N L AT V I A
166
T H E I M PA C T O F D E C E N T R A L I Z AT I O N O N S O C I A L P O L I C Y
• Law On Social Security (1995)• Law On State Pensions (1995)• Law On Maternity and Sickness Benefits (1995)• Law On Compulsory Social Insurance against Unemployment (1995)• Law On Compulsory Social Insurance against Occupational Accidents and Occupational
Diseases (1995)• Law On State Social Insurance (1997)• Law On Private Pension Funds (1998)• Law On Social Assistance (1998)• Law On State Funded Pensions (2000)
RESEARCH METHODOLOGY
In this research project decentralization was investigated in the wider context of socialpolicy. Apart from the fiscal aspect of decentralization, the present research was stronglycommitted to examining legal, institutional and social issues as well. To understand theforms and mechanisms of decentralization in the social sector we will describe the structureof administration, in particular that of social administration, the distribution of decision-making competencies between the central, regional and local levels, the infrastructureof social services, and the financial mechanisms of local social policy. The adequacy ofexisting administrative and service provider capacities for implementing the statutoryobligations was also analyzed.
At the same time, the intention was also to clarify: (i) whether decentralization hasan effect on all the incentives of public administration and public sector management;(ii) what the overall implications of decentralization are as regards the accountabilitystructures in public administration and public sector management; (iii) if any form oflocal decision-making exists; (iv) whether the decision-making capacity of local govern-ments impacts on the efficiency and relevance of service delivery; (v) what forms, and towhat extent and composition of resource allocation exist in the social sector; (vi) whetherdecentralization decreases or increases access to social services within society and acrossregions as well as among the different types of settlements.
The present research attempts to describe the main constraints and factors of thedecentralization process during the transition: what the main shifts of social welfare regimesare within this period, and how these two important factors of the general and funda-mental on-going reforms interact. The research methodology included a review of theliterature on decentralization and social services in the country; a legislative review includinginformation on the relevant legal regulations concerning decentralization and social policyto outline the institutional framework, the financing mechanisms, the decision-making
167
system as well as the accessibility, eligibility and entitlement criteria of social services; adescription of the social, economic and demographic indicators to present informationon the main characteristic features of Latvian society; and also a quantitative and quali-tative analysis of national data and case studies.
The research covers developments during the 1990s and was done in the summerand autumn of 2000 by a team of four researchers representing both academics and prac-titioners in the field.
SOCIAL INSURANCE
The Pension System
The Pension Reform Concept was drafted with the purpose of creating a financiallysound system based on compulsory individualized social insurance contributions thatwould ensure a stable substitution of income in old age. According to the above concept,the new pension system in Latvia is being developed with three tiers:
a) the first tier—the state compulsory non-funded pension scheme (based on the principleof the solidarity of generations). The law On State Pensions (1995) became effectiveas of 1 January 1996. The objectives of this law are as follows:
• to ensure compensation for income in old age in proportion to the social insurancecontributions made during the whole period of employment;
• to ensure the transparency and stability of the system;• to facilitate the increase in the number of social tax payers;• to create incentives for the individual to prolong their working life;• to ensure pension indexation.
b) the second tier—the state compulsory funded pension scheme, constituted by indivi-dual contributions. The law On State Funded Pensions (2000) regulates the secondtier. The purpose of the state funded pension scheme is:
• to achieve the growth of the pension capital and an increase in the pension amountby investing part of the contributions without increasing the total social insurancecontribution rate for state old-age pensions (20% of the wages from which socialinsurance contributions are paid);
• to facilitate the formation of financial reserves thereby helping to promote thedevelopment of the national economy.
S O C I A L S E C T O R D E V E LO P M E N T I N L AT V I A
168
T H E I M PA C T O F D E C E N T R A L I Z AT I O N O N S O C I A L P O L I C Y
c) the third tier—the private voluntary pension scheme—is regulated by the law OnPrivate Pension Funds (1998).
Maternity and Sickness Benefits
Temporary incapacity to work during the pre-natal and the post-natal period, or due toillness is covered by the law On Maternity and Sickness Benefits (1995). The purposes ofthis law are as follows:
• to ensure compensation for income in the event of sickness and maternity inproportion to the social insurance contributions paid;
• to ensure that the sickness benefits for the first 14 days of incapacity to workare paid by the employer in accordance with the following scheme:– no payment for the 1st day;– 75% of average earnings for the 2nd and 3rd day;– 80% for the period from the 4th till 14th day;– only from the 15th day does the payment become an obligation of state social
insurance institutions.
The sum of the benefit is related to the average salary of the given individual.
Employment—Unemployment
The most important regulations concerning labor relations are the following:
• the Latvia Labor Code enacted in 1972, which regulates labor relations;• the law On Employment (1991), which prescribes the regulation of employment
and social guarantees for the unemployed;• the law On Labor Protection (1993). The purpose of the law On Labor Protection
is to establish the legal basis in laws and other normative acts for the implemen-tation of social, economic, technical, sanitary hygienic, medical preventive, andorganizational measures which can ensure the improvement of the workingenvironment, labor safety, as well as a decrease in the number of accidents atwork-places and a decrease in occupational diseases;
• regulation of the Cabinet of Ministers No. 439 On Minimum Wages, establish-ing the minimum wage rate in the country. At present it is LVL 50 or aboutUSD 100.
169
The purpose of the law On Compulsory Social Insurance against Unemployment (1995) is:
• to ensure the compensation of income in the event of unemployment;• to grant unemployment benefits in proportion to the social insurance contributions
paid and the length of registered social insurance;• to encourage the unemployed to be more active in seeking a job by establishing a
differentiated benefit amount depending on the length of the unemploymentperiod, reducing this amount after every three months;
• to provide vocational training or retraining for the unemployed.
Occupational Accidents and Diseases
The law On Compulsory Social Insurance against Occupational Accidents and OccupationalDiseases (1995) became effective on 1 January 1997. The purposes of this law are as follows:
• to compensate for the loss of income in the event of an occupational accidentor disease;
• to provide a set of services in order to integrate the affected individuals into society;• to stimulate the improvement of working conditions, contributions being made
only by employers;
The following services are available to the insured person as benefits in kind: medicaltreatment, (including rehabilitation) vocational training, and vocational rehabilitation.
Funding of Social Insurance
The financial basis for social insurance is the social insurance budget. The social insurancebudget is structured in four special budgets:
• occupational accident special budget 1%• employment special budget 8%• disability, maternity and sickness special budget 16%• state pension special budget 75%
The current national social insurance system is based on the following principles:
• the social insurance service corresponds to the social contributions made;• solidarity between those who pay social insurance contributions and the recipients
of social insurance services.
S O C I A L S E C T O R D E V E LO P M E N T I N L AT V I A

170
T H E I M PA C T O F D E C E N T R A L I Z AT I O N O N S O C I A L P O L I C Y
Table 3.3State Social Insurance Special Budgets and Services
State Pension Disability, Maternity & Employment OccupationalSpecial Budget Sickness Special Budget Special Budget Accident Special Budget
• old-age pension, • disability benefit, • unemployment • sickness benefit,• disability pension, • maternity benefit, benefit, • compensation for• survivor’s pension, • sickness benefit, • unemployment grant, the loss of capacity• service pension, • funeral allowance • unemployment to work,• funeral allowance in the event of the training and • lump sum benefit
in the event of death of an insured retraining in the event ofa pensioner’s death person or a • job-seekers’ clubs, incapacity to work,
dependent of an • professional guidance • compensation in theinsured person and counseling event of the loss
of the provider,• funeral allowance
in the event of thedeath of an insuredperson,
• additional services(rehabilitation)
The law On State Social Insurance (1997) regulates the funding of social insurancewith the aims of:
• systematizing the set of socially insured persons;• establishing a differentiated contribution rate according to risks;• providing an opportunity to join a pension insurance scheme on a voluntary basis;• harmonizing the employees’ obligatory contributions with the personal income
tax system;• establishing the maximum amount of contributions;• establishing the minimum amount of obligatory contributions for the self–
employed;• ensuring the transparency of budgetary spending by establishing special social
security budgets instead of the state social insurance special budget;• entrusting the administration of obligatory contributions to the State Revenue
Service;
A non-profit organization/joint-stock company known as the “State Social InsuranceAgency” has been established. As of 1991, it has a separate source of funding by virtueof the introduction of the social tax. The resources of the social insurance budget wereformed from social tax payments made by employers, employees, and the self-employedas well as payments from the national general budget and other revenues.
171
Until 1996 the social tax rate in general cases was 38% of the tax base. A reducedrate was paid by working disabled people (8%), those employed in agriculture (18.5%),farmers (19%). Once the law On State Social Insurance was enacted, it introduced seve-ral changes: the term “social tax” was substituted by “social insurance contributions.” Itmeant essentially that the social insurance principle should be changed in order toprovide social insurance services from the contributions.
In 1998 the social insurance system was financed from obligatory contributions,voluntary contributions, and payments to the national general budget and other revenues(collection for regress claims, dividends for the transferred shares of the capital, etc.).
In that expenditures on pension insurance and insurance against unemploymentare related to the country’s demographic and economic situation there is a need to formaccruals for a longer period of time. The following insurance budgets were approved:
• the state pension special budget;• the employment special budget;• the special budget for accidents at work;• the disability, maternity, and sickness special budget.
Total special budget expenditures in 1998 were LVL 444.2 million, in 1999—LVL472.6 million.
Social Insurance Administration
The State Social Insurance Agency was established in 1998. It was founded to take theplace of the State Social Insurance fund. The Agency’s main task is to administer thespecial budgets and services. Administration of the obligatory contributions was trans-ferred to the State Revenue Service, this being a non-profit organization, a public joint-stock company established by the Cabinet of Ministers with the purpose of performingpublic administration functions to help ensure social rights.
Normative acts, effective at present, regulate the procedure for making contributions,for ensuring social insurance services, and for handling the procedure of granting socialbenefits; however, no normative acts in the area of social insurance regulate the recordingand protection of information.
The State Social Insurance Agency’s tasks include:
• the administration of social insurance special budgets;• the provision of social insurance and assistance services.
S O C I A L S E C T O R D E V E LO P M E N T I N L AT V I A

172
T H E I M PA C T O F D E C E N T R A L I Z AT I O N O N S O C I A L P O L I C Y
The distribution of functions between the state and local governments in socialassistance is described in Annex 16.
The Agency has 33 branch offices in all districts of Latvia. Their main concern is:
• to provide individual consultations in the area of state social insurance and socialassistance services;
• to deal with the granting, calculating and recalculating of pensions, benefits, andcompensations;
• to register socially insured persons and to deal with contributions to the accountsof insured persons.

173
ANNEX 1
Table 3A.1Resident Population by Nationality
1935 1989 1996 1997 1998 1999 2000
P O P U L AT I O N
Population—total 1,905,936 2,666,567 2,501,660 2,479,870 2,458,403 2,439,445 2,424,150
P E R C E N T D I S T R I B U T I O N
Population—total 100.0 100.0 100.0 100.0 100.0 100.0 100.0
O f w h i c h :
Latvians 77.0 52.0 55.1 55.3 55.5 55.7 55.8
Russians 8.8 34.0 32.6 32.5 32.4 32.3 32.3
Belarussians 1.4 4.5 4.0 4.0 3.9 3.9 3.9
Ukrainians 0.1 3.5 2.9 2.9 2.9 2.9 2.9
Poles 2.5 2.3 2.2 2.2 2.2 2.2 2.2
Lithuanians 1.2 1.3 1.3 1.3 1.3 1.3 1.3
Jews 4.9 0.9 0.5 0.4 0.4 0.4 0.3
Roma 0.2 0.3 0.3 0.3 0.3 0.3 0.3
Estonians 0.4 0.1 0.1 0.1 0.1 0.1 0.1
Germans 3.3 0.1 0.1 0.1 0.1 0.1 0.1
Other nationalities 0.2 1.0 0.9 0.9 0.9 0.8 0.8
SOURCE: Statistical Yearbook of Latvia, 2000, CSB.
S O C I A L S E C T O R D E V E LO P M E N T I N L AT V I A
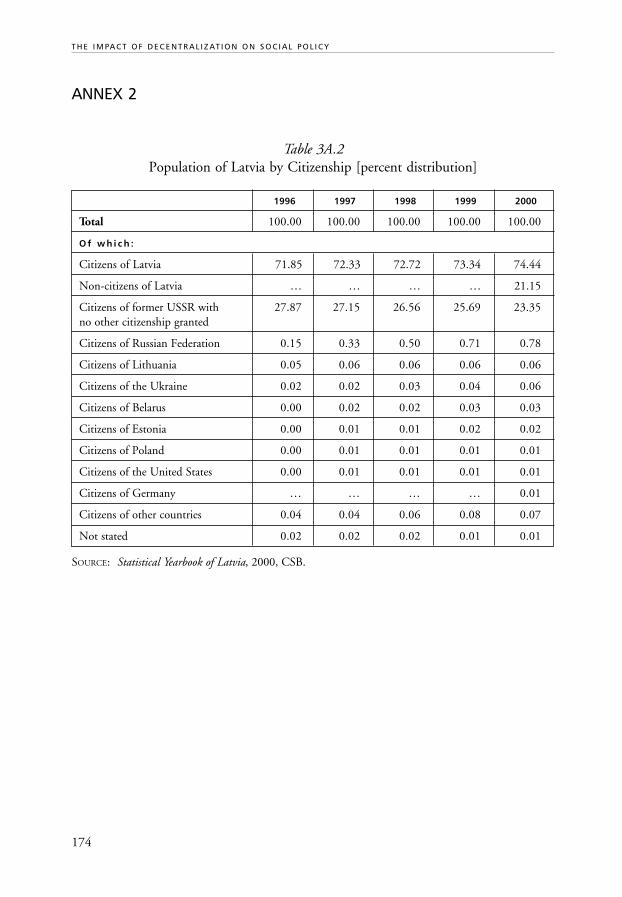
174
T H E I M PA C T O F D E C E N T R A L I Z AT I O N O N S O C I A L P O L I C Y
ANNEX 2
Table 3A.2Population of Latvia by Citizenship [percent distribution]
1996 1997 1998 1999 2000
Total 100.00 100.00 100.00 100.00 100.00
O f w h i c h :
Citizens of Latvia 71.85 72.33 72.72 73.34 74.44
Non-citizens of Latvia … … … … 21.15
Citizens of former USSR with 27.87 27.15 26.56 25.69 23.35no other citizenship granted
Citizens of Russian Federation 0.15 0.33 0.50 0.71 0.78
Citizens of Lithuania 0.05 0.06 0.06 0.06 0.06
Citizens of the Ukraine 0.02 0.02 0.03 0.04 0.06
Citizens of Belarus 0.00 0.02 0.02 0.03 0.03
Citizens of Estonia 0.00 0.01 0.01 0.02 0.02
Citizens of Poland 0.00 0.01 0.01 0.01 0.01
Citizens of the United States 0.00 0.01 0.01 0.01 0.01
Citizens of Germany … … … … 0.01
Citizens of other countries 0.04 0.04 0.06 0.08 0.07
Not stated 0.02 0.02 0.02 0.01 0.01
SOURCE: Statistical Yearbook of Latvia, 2000, CSB.
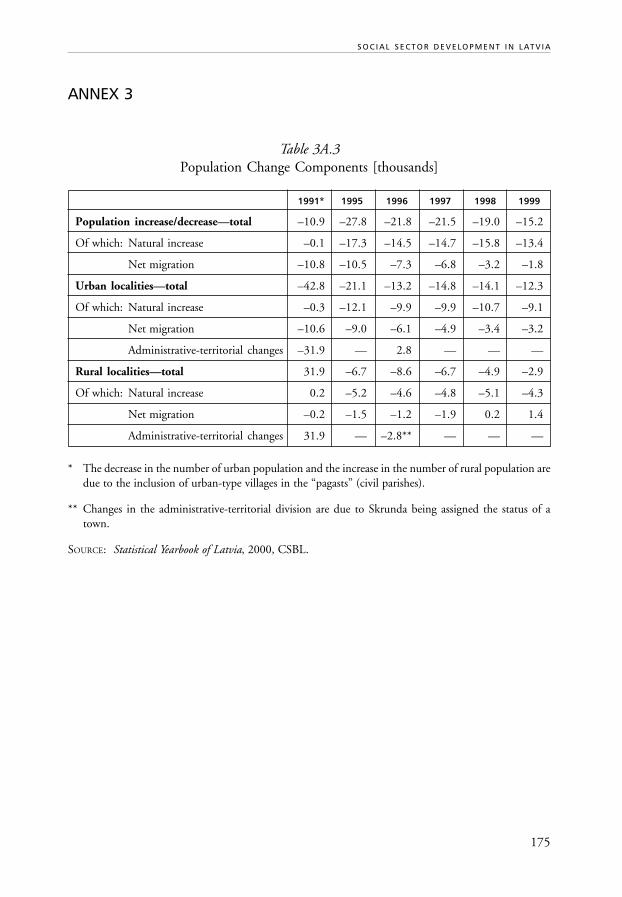
175
ANNEX 3
Table 3A.3Population Change Components [thousands]
1991* 1995 1996 1997 1998 1999
Population increase/decrease—total –10.9 –27.8 –21.8 –21.5 –19.0 –15.2
Of which: Natural increase –0.1 –17.3 –14.5 –14.7 –15.8 –13.4
Net migration –10.8 –10.5 –7.3 –6.8 –3.2 –1.8
Urban localities—total –42.8 –21.1 –13.2 –14.8 –14.1 –12.3
Of which: Natural increase –0.3 –12.1 –9.9 –9.9 –10.7 –9.1
Net migration –10.6 –9.0 –6.1 –4.9 –3.4 –3.2
Administrative-territorial changes –31.9 — 2.8 — — —
Rural localities—total 31.9 –6.7 –8.6 –6.7 –4.9 –2.9
Of which: Natural increase 0.2 –5.2 –4.6 –4.8 –5.1 –4.3
Net migration –0.2 –1.5 –1.2 –1.9 0.2 1.4
Administrative-territorial changes 31.9 — –2.8** — — —
* The decrease in the number of urban population and the increase in the number of rural population aredue to the inclusion of urban-type villages in the “pagasts” (civil parishes).
** Changes in the administrative-territorial division are due to Skrunda being assigned the status of atown.
SOURCE: Statistical Yearbook of Latvia, 2000, CSBL.
S O C I A L S E C T O R D E V E LO P M E N T I N L AT V I A
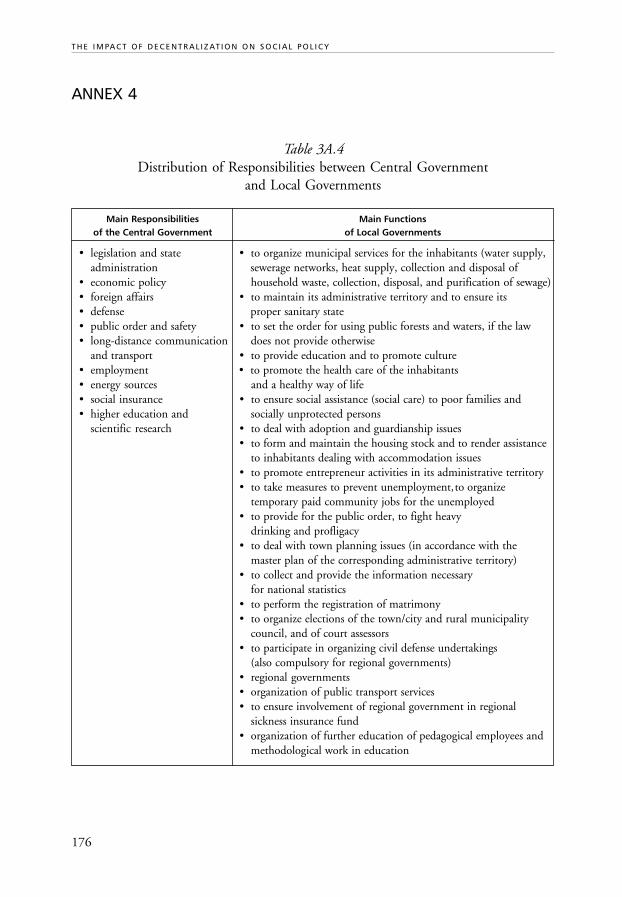
176
T H E I M PA C T O F D E C E N T R A L I Z AT I O N O N S O C I A L P O L I C Y
ANNEX 4
Table 3A.4Distribution of Responsibilities between Central Government
and Local Governments
Main Responsibilities Main Functionsof the Central Government of Local Governments
• legislation and state • to organize municipal services for the inhabitants (water supply,administration sewerage networks, heat supply, collection and disposal of
• economic policy household waste, collection, disposal, and purification of sewage)• foreign affairs • to maintain its administrative territory and to ensure its• defense proper sanitary state• public order and safety • to set the order for using public forests and waters, if the law• long-distance communication does not provide otherwise
and transport • to provide education and to promote culture• employment • to promote the health care of the inhabitants• energy sources and a healthy way of life• social insurance • to ensure social assistance (social care) to poor families and• higher education and socially unprotected persons
scientific research • to deal with adoption and guardianship issues• to form and maintain the housing stock and to render assistance
to inhabitants dealing with accommodation issues• to promote entrepreneur activities in its administrative territory• to take measures to prevent unemployment,to organize
temporary paid community jobs for the unemployed• to provide for the public order, to fight heavy
drinking and profligacy• to deal with town planning issues (in accordance with the
master plan of the corresponding administrative territory)• to collect and provide the information necessary
for national statistics• to perform the registration of matrimony• to organize elections of the town/city and rural municipality
council, and of court assessors• to participate in organizing civil defense undertakings
(also compulsory for regional governments)• regional governments• organization of public transport services• to ensure involvement of regional government in regional
sickness insurance fund• organization of further education of pedagogical employees and
methodological work in education
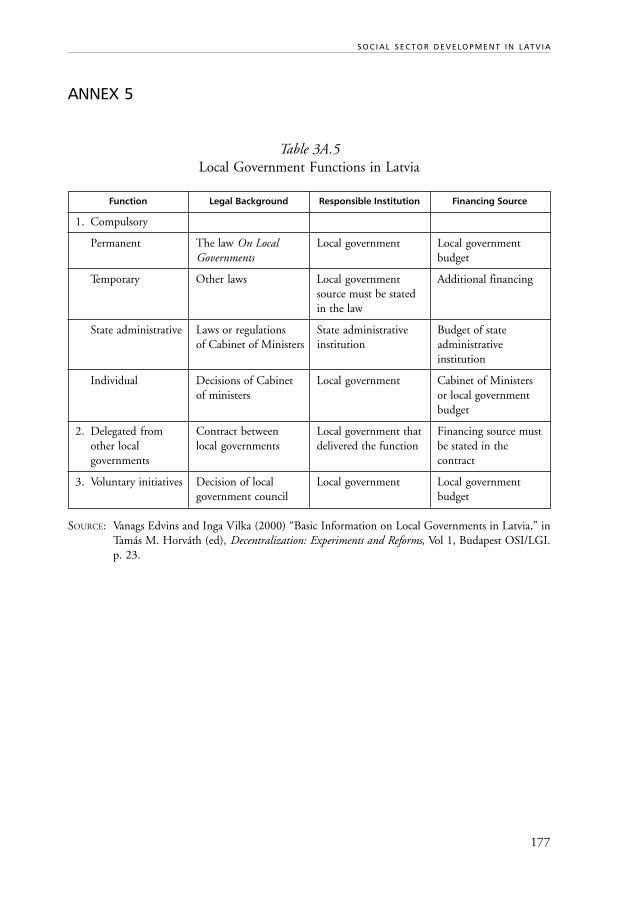
177
ANNEX 5
Table 3A.5Local Government Functions in Latvia
Function Legal Background Responsible Institution Financing Source
1. Compulsory
Permanent The law On Local Local government Local governmentGovernments budget
Temporary Other laws Local government Additional financingsource must be statedin the law
State administrative Laws or regulations State administrative Budget of stateof Cabinet of Ministers institution administrative
institution
Individual Decisions of Cabinet Local government Cabinet of Ministersof ministers or local government
budget
2. Delegated from Contract between Local government that Financing source mustother local local governments delivered the function be stated in thegovernments contract
3. Voluntary initiatives Decision of local Local government Local governmentgovernment council budget
SOURCE: Vanags Edvins and Inga Vilka (2000) “Basic Information on Local Governments in Latvia,” inTamás M. Horváth (ed), Decentralization: Experiments and Reforms, Vol 1, Budapest OSI/LGI.p. 23.
S O C I A L S E C T O R D E V E LO P M E N T I N L AT V I A

178
T H E I M PA C T O F D E C E N T R A L I Z AT I O N O N S O C I A L P O L I C Y
ANNEX 6
Table 3A.6Competencies of Local Governments
Functions All Regional Central or Other RemarksMunicipalities Governments State Government
TerritorialAdministration
E D U C AT I O N
Pre-school ✓ also private
Primary ✓ also private
Secondary ✓ also private
Technical ✓ ✓
Other ✓
S O C I A L W E L FARE
Nurseries ✓ also private
Kindergartens ✓ also private
Welfare homes ✓
Personal services ✓
(e.g. Homeless)
Social housing ✓
Other ✓ ✓
H E A LT H S E R V I C E S
Primary health care ✓ ✓ also private
Health protection ✓ ✓ ✓
Hospitals ✓ ✓ ✓ also private
Public health ✓ ✓ ✓
Other ✓
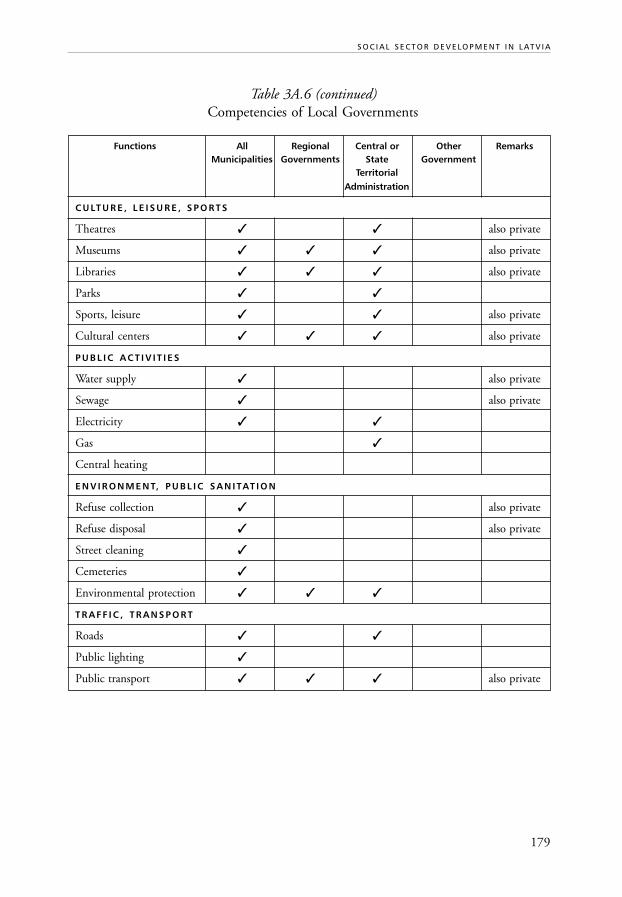
179
Table 3A.6 (continued)Competencies of Local Governments
Functions All Regional Central or Other RemarksMunicipalities Governments State Government
Territorial
Administration
CULT U R E , L E I S U R E , S P O R T S
Theatres ✓ ✓ also private
Museums ✓ ✓ ✓ also private
Libraries ✓ ✓ ✓ also private
Parks ✓ ✓
Sports, leisure ✓ ✓ also private
Cultural centers ✓ ✓ ✓ also private
P U B L I C A C T I V I T I E S
Water supply ✓ also private
Sewage ✓ also private
Electricity ✓ ✓
Gas ✓
Central heating
E N V I R O N M E N T, P U B L I C S A N I TAT I O N
Refuse collection ✓ also private
Refuse disposal ✓ also private
Street cleaning ✓
Cemeteries ✓
Environmental protection ✓ ✓ ✓
T R A F F I C , T R A N S P O R T
Roads ✓ ✓
Public lighting ✓
Public transport ✓ ✓ ✓ also private
S O C I A L S E C T O R D E V E LO P M E N T I N L AT V I A

180
T H E I M PA C T O F D E C E N T R A L I Z AT I O N O N S O C I A L P O L I C Y
Table 3A.6 (continued)Competencies of Local Governments
Functions All Regional Central or Other RemarksMunicipalities Governments State Government
TerritorialAdministration
U R B A N D E V E LO P M E N T
Town planning ✓
Regional/spatial planning ✓ ✓ ✓
Local economic ✓ ✓ ✓
development
Tourism ✓ ✓ ✓ also private
G E N E R A L A D M I N I S T R AT I O N
Authoritative functions ✓ ✓
Other state administrative ✓ ✓
matters
Local police ✓
Fire brigades ✓ ✓
Civil defense ✓ ✓ ✓
Consumer protection ✓
SOURCE: Vanags Edvins and Inga Vilka (2000) “Basic Information on Local Governments in Latvia,” inTamás M. Horváth (ed), Decentralization: Experiments and Reforms, Vol 1, Budapest OSI/LGI.p. 40.

181
ANNEX 7
Figure 3A.1Trend in Gross Domestic Product
(increase as percent against the corresponding quarter of previous year)
SOURCE: Statistical Yearbook of Latvia, 2000, CSBL.
S O C I A L S E C T O R D E V E LO P M E N T I N L AT V I A
1996 1997 1998 1999
I. II. III. IV. I. II. III. IV. I. II. III. IV. I. II. III. IV.
3.1
1.7
5.1
3.5
5.0
8.5
10.010.7
9.5
6.0
2.4
–1.7 –1.5 –1.1
0.2
2.8
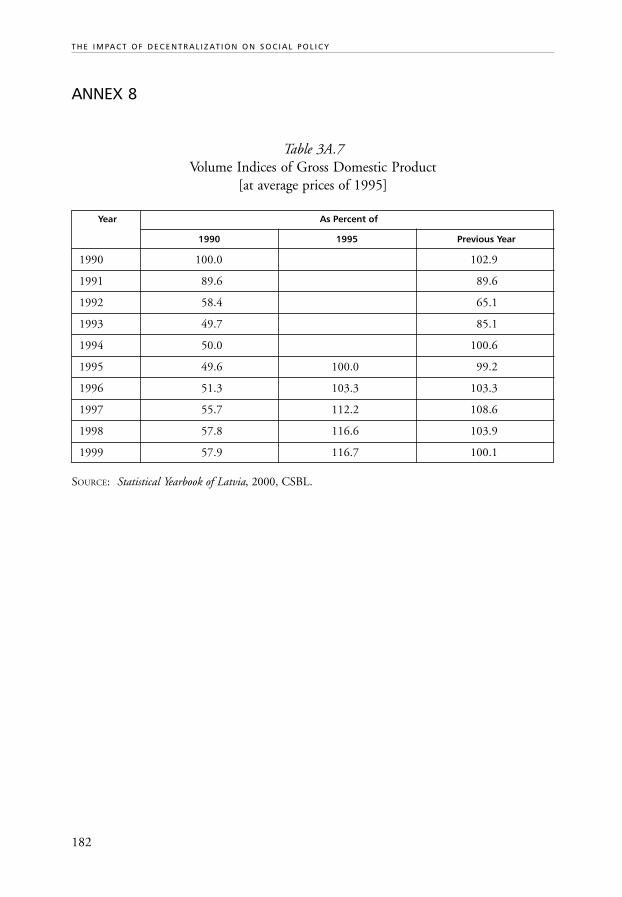
182
T H E I M PA C T O F D E C E N T R A L I Z AT I O N O N S O C I A L P O L I C Y
ANNEX 8
Table 3A.7Volume Indices of Gross Domestic Product
[at average prices of 1995]
Year As Percent of
1990 1995 Previous Year
1990 100.0 102.9
1991 89.6 89.6
1992 58.4 65.1
1993 49.7 85.1
1994 50.0 100.6
1995 49.6 100.0 99.2
1996 51.3 103.3 103.3
1997 55.7 112.2 108.6
1998 57.8 116.6 103.9
1999 57.9 116.7 100.1
SOURCE: Statistical Yearbook of Latvia, 2000, CSBL.
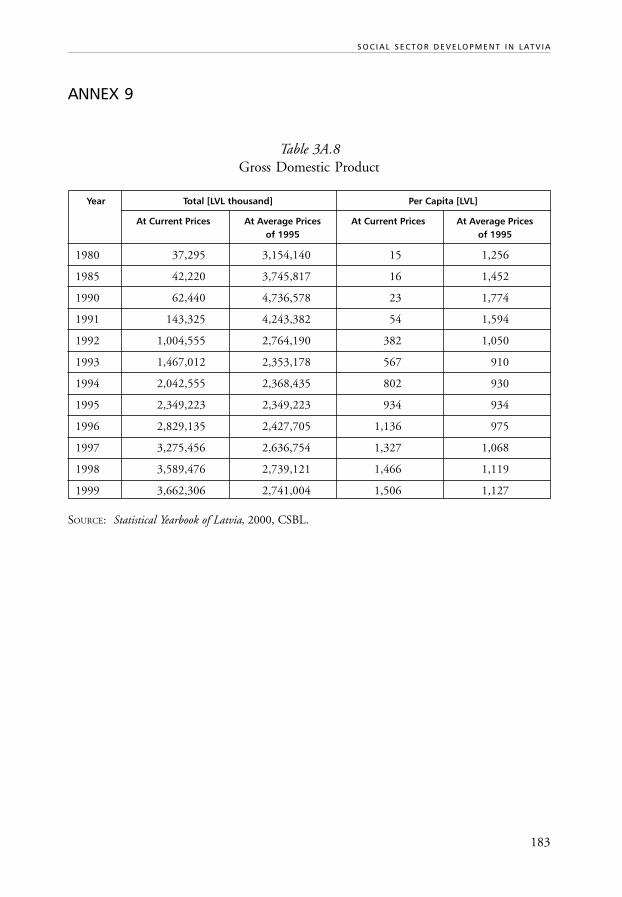
183
ANNEX 9
Table 3A.8Gross Domestic Product
Year Total [LVL thousand] Per Capita [LVL]
At Current Prices At Average Prices At Current Prices At Average Pricesof 1995 of 1995
1980 37,295 3,154,140 15 1,256
1985 42,220 3,745,817 16 1,452
1990 62,440 4,736,578 23 1,774
1991 143,325 4,243,382 54 1,594
1992 1,004,555 2,764,190 382 1,050
1993 1,467,012 2,353,178 567 910
1994 2,042,555 2,368,435 802 930
1995 2,349,223 2,349,223 934 934
1996 2,829,135 2,427,705 1,136 975
1997 3,275,456 2,636,754 1,327 1,068
1998 3,589,476 2,739,121 1,466 1,119
1999 3,662,306 2,741,004 1,506 1,127
SOURCE: Statistical Yearbook of Latvia, 2000, CSBL.
S O C I A L S E C T O R D E V E LO P M E N T I N L AT V I A

184
T H E I M PA C T O F D E C E N T R A L I Z AT I O N O N S O C I A L P O L I C Y
ANNEX 10
Table 3A.9Rates of Economic Activity, Employment and Job-seekers in November 1999
[according to Labor Force Survey data; percent distribution]
Rate of Economically Active Rate of Employed Population Rate of Job-seekersPopulation to Total Population to Total Population to Economically Active
Population
Total Males Females Total Males Females Total Males Females
Total 58.2 67.8 50.3 49.8 57.3 43.6 14.5 15.5 13.3
O F W H I C H AT A G E ( Y E A R S ) :
15–19 17.1 21.5 12.5 10.8 14.4 7.0 36.6 33.0 44.0
20–24 68.7 76.5 60.9 54.0 59.9 48.2 21.3 21.5 20.9
25–29 83.9 92.1 75.0 72.0 78.4 65.1 14.2 14.9 13.4
30–34 87.3 92.2 82.3 74.9 79.6 70.1 14.1 13.7 14.8
35–39 89.0 92.3 85.8 75.0 73.9 76.1 15.7 19.9 11.4
40–44 88.8 90.9 86.9 78.1 80.2 76.3 12.0 11.7 12.3
45–49 85.9 87.3 84.6 74.5 73.6 75.2 13.2 15.6 11.0
50–54 81.9 85.0 79.3 70.6 71.9 69.4 13.9 15.5 12.5
55–59 53.9 73.2 39.0 49.5 66.6 36.2 8.2 9.0 7.1
60–64 25.1 34.2 18.8 23.0 31.6 17.2 8.2 7.6 8.4
65–69 16.9 24.8 11.8 15.1 22.8 10.2 10.4 7.4 13.3
70+ 4.9 7.0 4.0 4.7 6.5 4.0 3.6 6.8 1.5
SOURCE: Statistical Yearbook of Latvia, 2000, CSBL.

185
ANNEX 11
Table 3A.10Number of Unemployed Persons [at end of the year]
Year Of which
Non-working Persons Unemployed Persons of the Total Number RegisteredRegistered with the of Unemployed Unemployed PersonsState Employment Persons, Long-term Receiving Unemploy-
Board Unemployed ment Benefit*(over 1 year)
1992 43,765 31,284 — 25,175
1993 93,360 76,744 2,702 44,306
1994 90,143 83,946 14,829 42,704
1995 88,123 83,231 21,242 27,022
1996 95,421 90,819 28,342 28,740
1997 86,531 84,934 32,360 30,894
1998 112,990 111,383 29,334 30,678
1999 111,102 109,497 34,042 47,741
* Data for 1992-1994 are end-period data, but beginning in 1995—annual average.
SOURCE: Statistical Yearbook of Latvia, 2000, CSBL.
S O C I A L S E C T O R D E V E LO P M E N T I N L AT V I A

186
T H E I M PA C T O F D E C E N T R A L I Z AT I O N O N S O C I A L P O L I C Y
ANNEX 12
Table 3A.11Economically Active Population, Annual Average, by City and District [thousands]
Of which
Economi- Employed Non-working of which of which As percent ofcally Active Job-seekers Non-working Unemployed EconomicallyPopulation, Persons Active Population
Total Registered[thousands] with the
StateEmployment Non-working Registered
Board Job-seekers Unemployed
Total 1,200.4 1,037.8 162.6 118.5 115.9 13.5 9.7
C I T I E S
Riga 465.1 422.6 42.5 25.4 24.6 9.1 5.3
Daugavpils 68.8 58.8 10.0 8.0 7.8 14.6 11.4
Jelgava 39.0 33.4 5.6 4.0 3.9 14.4 10.0
Jurmala 24.6 21.4 3.2 2.5 2.4 12.9 9.8
Liepaja 51.3 43.1 8.2 8.0 7.9 16.0 15.3
Rezekne 25.7 21.0 4.7 3.9 3.9 18.3 15.0
Ventspils 25.8 23.5 2.3 2.2 2.2 8.9 8.4
D I S T R I C T S
Aizk-raukles 17.9 14.8 3.1 2.2 2.1 17.3 11.9
Aluksnes 10.2 8.3 1.9 1.2 1.1 18.5 11.1
Balvu 12.7 9.1 3.6 3.0 2.9 28.1 23.3
Bauskas 22.1 19.2 2.9 2.1 2.1 13.1 9.4
Cesu 24.9 21.5 3.4 2.1 2.0 13.8 8.1
Daugavpils 14.6 11.4 3.2 3.0 2.9 21.7 20.1
Dobeles 19.1 16.0 3.1 2.2 2.2 16.4 11.5
Gulbenes 12.1 10.1 2.0 1.3 1.3 16.5 10.3
Jelgavas 13.7 11.4 2.3 1.7 1.6 16.8 12.0
Jekabpils 24.2 18.9 5.3 3.6 3.6 21.8 14.8

187
Table 3A.11 (continued)Economically Active Population, Annual Average, by City and District [thousands]
Of which
Economi- Employed Non-working of which of which As percent ofcally Active Job-seekers Non-working Unemployed EconomicallyPopulation, Persons Active Population
Total Registered[thousands] with the
StateEmployment Non-working Registered
Board Job-seekers Unemployed
Kraslavas 16.6 11.6 5.0 3.9 3.9 30.0 23.3
Kuldigas 14.5 12.6 1.9 1.2 1.2 12.9 8.0
Liepajas 16.6 13.8 2.8 2.4 2.3 16.7 14.1
Limbazu 16.5 13.9 2.6 2.1 2.1 15.6 12.8
Ludzas 16.6 12.6 4.0 3.4 3.4 24.1 20.3
Madonas 22.1 17.8 4.3 3.0 2.9 19.4 13.3
Ogres 24.5 21.9 2.6 1.8 1.7 10.5 7.1
Preilu 18.7 13.5 5.2 4.4 4.3 27.8 23.1
Rezeknes 17.1 11.1 6.0 4.9 4.8 35.1 28.3
Rigas 57.0 50.6 6.4 4.6 4.5 11.3 7.9
Saldus 16.7 14.8 1.9 1.1 1.1 11.4 6.3
Talsu 20.1 17.2 2.9 2.5 2.5 14.4 12.2
Tukuma 21.8 19.2 2.6 1.9 1.9 11.9 8.7
Valkas 15.7 13.6 2.1 1.5 1.5 13.4 9.6
Valmieras 28.1 23.9 4.2 2.8 2.7 14.9 9.8
Ventspils 6.0 5.2 0.8 0.6 0.6 13.3 10.4
SOURCE: Statistical Yearbook of Latvia, 2000, CSBL.
S O C I A L S E C T O R D E V E LO P M E N T I N L AT V I A
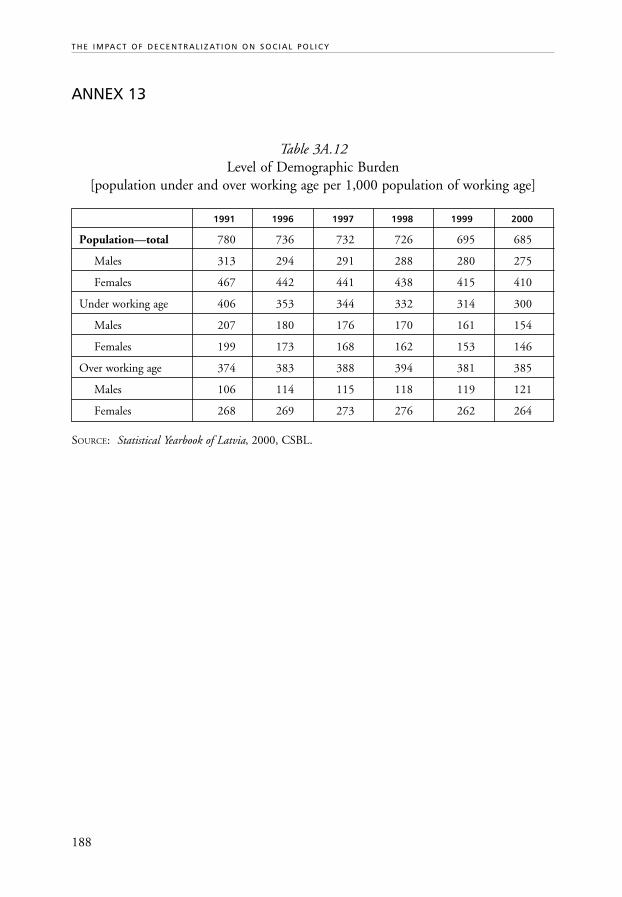
188
T H E I M PA C T O F D E C E N T R A L I Z AT I O N O N S O C I A L P O L I C Y
ANNEX 13
Table 3A.12Level of Demographic Burden
[population under and over working age per 1,000 population of working age]
1991 1996 1997 1998 1999 2000
Population—total 780 736 732 726 695 685
Males 313 294 291 288 280 275
Females 467 442 441 438 415 410
Under working age 406 353 344 332 314 300
Males 207 180 176 170 161 154
Females 199 173 168 162 153 146
Over working age 374 383 388 394 381 385
Males 106 114 115 118 119 121
Females 268 269 273 276 262 264
SOURCE: Statistical Yearbook of Latvia, 2000, CSBL.

189
ANNEX 14
Table 3A.13Life Expectancy by Age and Sex in 1999
Age [Years] Males Females
0 64.9 76.2
1 64.6 76.2
2 63.7 75.2
3 62.7 74.3
4 61.7 73.3
5 60.8 72.3
10 55.8 67.4
15 51.0 62.5
20 46.3 57.7
25 41.9 52.9
30 37.6 48.1
35 33.2 43.3
40 28.9 38.6
45 24.8 34.1
50 20.9 29.7
55 17.4 25.5
60 14.1 21.5
65 11.3 17.8
70 8.8 14.5
75 6.8 11.5
80 5.1 9.0
85 3.8 6.9
SOURCE: Statistical Yearbook of Latvia, 2000, CSBL.
S O C I A L S E C T O R D E V E LO P M E N T I N L AT V I A
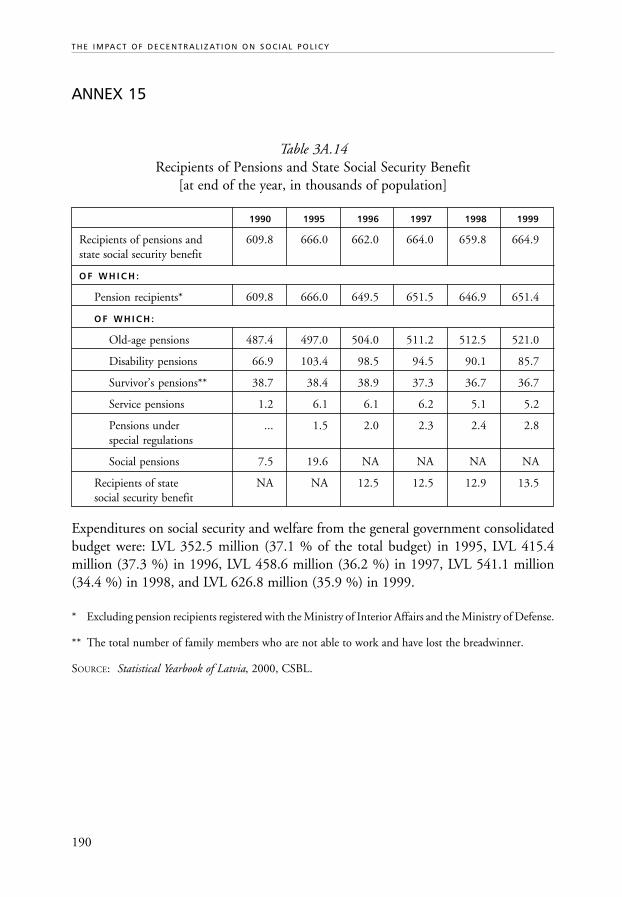
190
T H E I M PA C T O F D E C E N T R A L I Z AT I O N O N S O C I A L P O L I C Y
ANNEX 15
Table 3A.14Recipients of Pensions and State Social Security Benefit
[at end of the year, in thousands of population]
1990 1995 1996 1997 1998 1999
Recipients of pensions and 609.8 666.0 662.0 664.0 659.8 664.9state social security benefit
O F W H I C H :
Pension recipients* 609.8 666.0 649.5 651.5 646.9 651.4
O F W H I C H :
Old-age pensions 487.4 497.0 504.0 511.2 512.5 521.0
Disability pensions 66.9 103.4 98.5 94.5 90.1 85.7
Survivor’s pensions** 38.7 38.4 38.9 37.3 36.7 36.7
Service pensions 1.2 6.1 6.1 6.2 5.1 5.2
Pensions under ... 1.5 2.0 2.3 2.4 2.8special regulations
Social pensions 7.5 19.6 NA NA NA NA
Recipients of state NA NA 12.5 12.5 12.9 13.5social security benefit
Expenditures on social security and welfare from the general government consolidatedbudget were: LVL 352.5 million (37.1 % of the total budget) in 1995, LVL 415.4million (37.3 %) in 1996, LVL 458.6 million (36.2 %) in 1997, LVL 541.1 million(34.4 %) in 1998, and LVL 626.8 million (35.9 %) in 1999.
* Excluding pension recipients registered with the Ministry of Interior Affairs and the Ministry of Defense.
** The total number of family members who are not able to work and have lost the breadwinner.
SOURCE: Statistical Yearbook of Latvia, 2000, CSBL.

191
ANNEX 16
Table 3A.15Distribution of Functions between the State and Local Governments
in Social Assistance
State Local Governments
Material Assistance
State Social Benefits Municipal Social Benefits
Social Care
Support children whose parents are not known Support orphans and childrenwho have been deprivedof parental care
Social care institutions: Social care institutions:• homes and centers for mentally disabled children and adults • shelters for orphans• homes and centers for blind adults • old people’s homes• social care centers for orphansOther specialized centers Alternative care
(home care, day centers):• for disabled children• for persons of retirement age• mentally or physically
disabled persons
Social Rehabilitation
• State occupational training and rehabilitation for the disabled • for disabled children• Provision of technical support devices • for mentally disabled• Assistance to the homeless whose last place of residence • employment for the blind
cannot be proved at sheltered workshops• service apartment for
Social rehabilitation services: individuals requiring special1. at institutions: for the disabled, the politically repressed, care;
non-working persons, victims of the Chernobyl nuclear power • ex-convictsplant disaster, abused children • alcoholics
2. at institutions: for the disabled, the politically repressed, • drug addictsnon-working pensioners; liquidators of the consequences of • the homelessthe Chernobyl nuclear power plant disaster, abused children (a place in a shelter)
3. alternatives to institutions: for individuals with severely impairedeyesight and hearing, the politically repressed, mentally disabled(at day centers); for abused children (at their place of residence);payment of the debt servicing for the adaptation of an apartmentto the needs of a disabled person; support towards thedevelopment of alternative social assistance services in localgovernments.
S O C I A L S E C T O R D E V E LO P M E N T I N L AT V I A

192
T H E I M PA C T O F D E C E N T R A L I Z AT I O N O N S O C I A L P O L I C Y
ANNEX 17
Table 3A.16State Social Benefits and Allowances [monthly average, in thousand units]
1991 1995 1996 1997 1998 1999
State social security benefit: X X 12.5 12.5 12.7 13.5number of beneficiaries*
Birth allowance: number of allowances 2.6 1.8 1.6 1.6 1.5 1.6
Child-care benefit for a child aged 83 58 55 53 51 46under 3 years—number of beneficiaries
Of which: for a child under 1.5 years 46 27 25 25 24 24
for a child aged 1.5–3 years 37 31 30 28 27 22
State family allowance 560 546 540 506 494 481—number of allowances
Supplementary payment to the state X X 6.4 7.3 7.6 8.4family allowance for a disabled child
Sickness allowance:** 891 363 298 99 168 178number of paid disability days
Maternity benefit:** 209 70 64 74 95 96number of paid disability days
Funeral allowance:** 1.7 2.6 2.3 2.3 2.2 2.3number of allowances
* Until 1995 inclusive, social pension was granted to the recipients of state social security benefit and todisabled children.
** Including the allowance for a disabled child.
SOURCE: Statistical Yearbook of Latvia, 2000, CSBL.
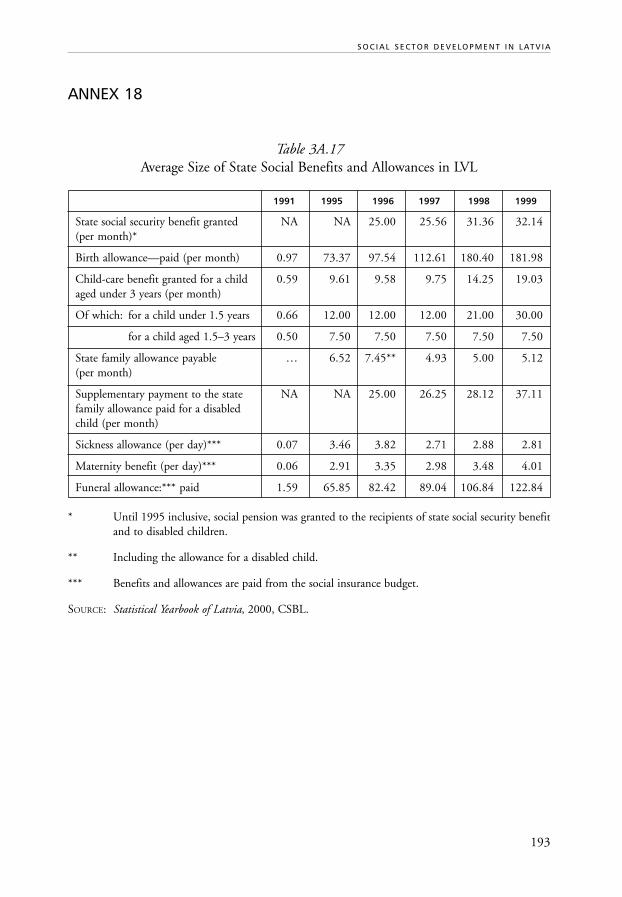
193
ANNEX 18
Table 3A.17Average Size of State Social Benefits and Allowances in LVL
1991 1995 1996 1997 1998 1999
State social security benefit granted NA NA 25.00 25.56 31.36 32.14(per month)*
Birth allowance—paid (per month) 0.97 73.37 97.54 112.61 180.40 181.98
Child-care benefit granted for a child 0.59 9.61 9.58 9.75 14.25 19.03aged under 3 years (per month)
Of which: for a child under 1.5 years 0.66 12.00 12.00 12.00 21.00 30.00
for a child aged 1.5–3 years 0.50 7.50 7.50 7.50 7.50 7.50
State family allowance payable … 6.52 7.45** 4.93 5.00 5.12(per month)
Supplementary payment to the state NA NA 25.00 26.25 28.12 37.11family allowance paid for a disabledchild (per month)
Sickness allowance (per day)*** 0.07 3.46 3.82 2.71 2.88 2.81
Maternity benefit (per day)*** 0.06 2.91 3.35 2.98 3.48 4.01
Funeral allowance:*** paid 1.59 65.85 82.42 89.04 106.84 122.84
* Until 1995 inclusive, social pension was granted to the recipients of state social security benefitand to disabled children.
** Including the allowance for a disabled child.
*** Benefits and allowances are paid from the social insurance budget.
SOURCE: Statistical Yearbook of Latvia, 2000, CSBL.
S O C I A L S E C T O R D E V E LO P M E N T I N L AT V I A
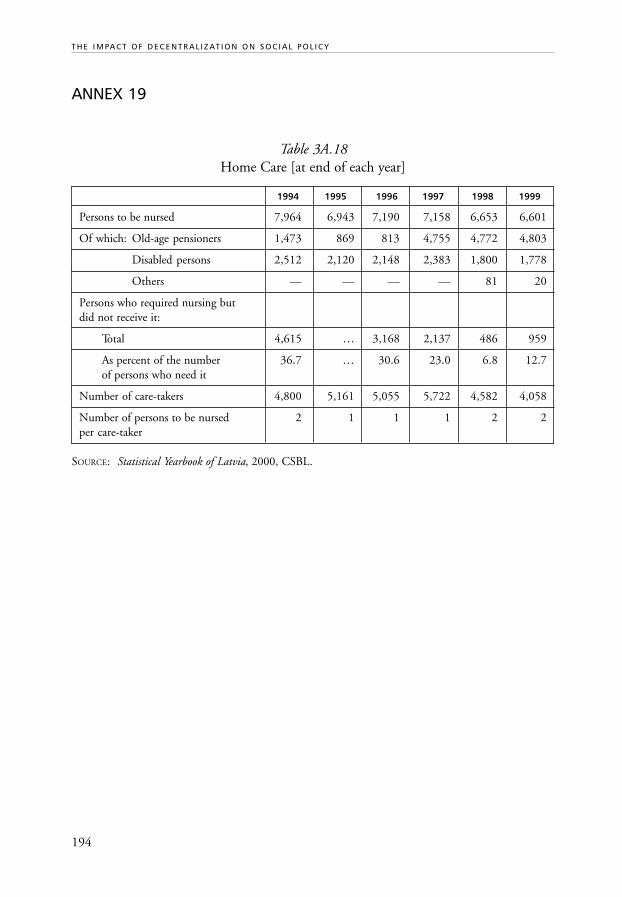
194
T H E I M PA C T O F D E C E N T R A L I Z AT I O N O N S O C I A L P O L I C Y
ANNEX 19
Table 3A.18Home Care [at end of each year]
1994 1995 1996 1997 1998 1999
Persons to be nursed 7,964 6,943 7,190 7,158 6,653 6,601
Of which: Old-age pensioners 1,473 869 813 4,755 4,772 4,803
Disabled persons 2,512 2,120 2,148 2,383 1,800 1,778
Others — — — — 81 20
Persons who required nursing butdid not receive it:
Total 4,615 … 3,168 2,137 486 959
As percent of the number 36.7 … 30.6 23.0 6.8 12.7of persons who need it
Number of care-takers 4,800 5,161 5,055 5,722 4,582 4,058
Number of persons to be nursed 2 1 1 1 2 2per care-taker
SOURCE: Statistical Yearbook of Latvia, 2000, CSBL.

195
ANNEX 20
Table 3A.19Specialized Social Care Centers for Children, Aged People and Invalids,
and Those Who Are Mentally Ill [at end of the year]
1990 1995 1996 1997 1998 1999
Number of places:
Total 9,006 9,235 8,832 8,924 9,089 9,055
Per 10,000 population 33.8 36.9 35.6 36.3 37.3 37.4
Of the total number of places:
For aged people and adult invalids 8,472 8,799 8,394 8,445 8,605 8,571
For handicapped children 534 436 438 479 484 484
SOURCE: Statistical Yearbook of Latvia, 2000, CSBL.
ANNEX 21
Table 3A.20Orphanages and Local Government Children’s Homes [at end of the year]
1990 1995 1996 1997 1998 1999
Orphanages:
Number 7 6 6 6 6 6
Enrolment 802 791 771 760 797 719
Local government children’s homes:
Number 8 31 43 43 49 48
Enrolment 381 1,618 1,989 2,081 2,386 2,456
SOURCE: Statistical Yearbook of Latvia, 2000, CSBL.
S O C I A L S E C T O R D E V E LO P M E N T I N L AT V I A
C H A P T E R 4
The Ukrainian
Social Protection System
and the Methods
of Governance
Anato l i y Chemery s
■
Andr i y L ip en t s e v
■
Oksana Muzychuk
■
V ira Ts ypuk

198
T H E I M PA C T O F D E C E N T R A L I Z AT I O N O N S O C I A L P O L I C Y
199
Table of Contents
1. The Past .......................................................................................................... 2031.1 General Remarks ................................................................................... 2031.2 Social Provisions in the Soviet System ................................................... 204
1.2.1 Pension System ......................................................................... 2041.2.2 Labor Market Situation ............................................................ 2051.2.3 Family Benefits ......................................................................... 2061.2.4 Other Cash Benefits .................................................................. 206
2. The Transition ................................................................................................ 2072.1 Political System...................................................................................... 2072.2 Administrative Structure ....................................................................... 2072.3 Macroeconomic Development .............................................................. 2102.4 Labor Market Situation ......................................................................... 213
2.4.1 Observation of Labor Rights ..................................................... 2132.4.2 Labor Migration ....................................................................... 215
2.5 Basic Demographic Indicators Affectingthe Social Protection System.................................................................. 215
2.6 Standard of Living ................................................................................. 2172.7 Poverty .................................................................................................. 218
3. The Social Protection System.......................................................................... 2203.1 Social Insurance ..................................................................................... 2213.2 Family Protection .................................................................................. 2223.3 Social Services and Cash Benefits .......................................................... 226
3.3.1 Housing Subsidies .................................................................... 2263.3.2 Social Protection of Disabled People ........................................ 2283.3.3 Social Services for Single People
and for Elderly People Unable to Work .................................... 2313.4 Exemptions ............................................................................................ 234
4. The Main Actors of Social Policy ................................................................... 235
200
T H E I M PA C T O F D E C E N T R A L I Z AT I O N O N S O C I A L P O L I C Y
5. Financing Social Policy ................................................................................... 2425.1 Peculiarities of Local Budget Formation and
Inter-budgetary Relations ...................................................................... 2425.2 Revenues of Local Budgets .................................................................... 2465.3 Financial Equalization and Social Standards ......................................... 247
6. Conclusions and Policy Recommendations ..................................................... 2506.1 Financial and Institutional Arrangements ............................................. 2506.2 Service Delivery ..................................................................................... 252
Notes ..................................................................................................................... 254
Bibliography .......................................................................................................... 255Documents and Statistics ................................................................................ 255Literature ........................................................................................................ 255Reports, Seminar Papers ................................................................................. 257
Annex 1. ................................................................................................................ 258Research Methodology.................................................................................... 258
Annex 2. ................................................................................................................ 259The Pension System ........................................................................................ 259
Annex 3. ................................................................................................................ 264Unemployment Insurance .............................................................................. 264
Annex 4. ................................................................................................................ 267Financing of Social Protection and Social Provision Programsfrom the Ukrainian Consolidated Budget ....................................................... 267
Annex 5. ................................................................................................................ 277Social Provisions ............................................................................................. 2771. Unemployment Benefit ......................................................................... 2772. Housing Subsidies ................................................................................. 2783. Targeted Social Benefit for Low-Income Families ................................. 2794. Temporary Disability Benefit ................................................................. 2815. State Benefits for Families with Children .............................................. 282
5.1 Maternity and Child-birth Benefits .......................................... 2825.2 Lump Sum Child-birth Allowance ........................................... 283

201
5.3 Child Care Benefit in Respect of ChildrenAged up to 3 for Working and Non-working Mothers ............. 284
5.4 Cash Benefit to Mothers (Fathers) Taking Care of3 or More Children Under the Age of 16 ................................. 285
5.5 Disabled Child Care Benefit ..................................................... 2865.6 Child Benefits in Respect of Children Aged up to 16
(School Pupils Aged up to 18) .................................................. 2875.7 Child Benefit for Single Mothers .............................................. 2875.8 Benefit in Respect of Fostered Children ................................... 2885.9 Temporary Benefit in Respect of Minors Whose Parents
Avoid Paying Alimony, or When It is Impossibleto Collect Alimony ................................................................... 289
6. Pension Provision .................................................................................. 290
Annex 6. ................................................................................................................ 292Exemptions set by Legal Regulations and FundsNecessary to Grant These Exemptions ........................................................... 292
Annex 7. ................................................................................................................ 302Payments to Chernobyl Disaster Victims ....................................................... 302
Notes for Annexes ................................................................................................. 304

202
T H E I M PA C T O F D E C E N T R A L I Z AT I O N O N S O C I A L P O L I C Y

203
The Ukrainian Social Protection System
and the Methods of Governance
Anatoliy Chemerys ■ Andriy LipentsevOksana Muzychuk ■ Vira Tsypuk
1. THE PAST
1.1 General Remarks
With a total land area of 603,700 sq. km, Ukraine is the biggest country (after Russia)on the European continent. According to the National Statistics Committee, as of 1January 2000 the population of Ukraine was 49.7 million (almost 68% of them livingin urban areas, 32% or 15.9 million people make up the rural population). The ethniccomposition of the population is as follows: 72.7% Ukrainian, 22.1% Russian; with theremaining 5.2% of the population made up of numerous national minorities including(in alphabetical order): Armenians, Belorusians, Bulgarians, Greeks, Jews, Moldovans,Poles, and others.
The dominant religion is the Eastern Orthodox Church, which has several branchesin Ukraine. The Ukrainian Catholic Church (“Uniat” Church) is dominant in the westernpart of the country, in the former Galychyna (better known as Galicia) and Bukovynaregions. Following the demise of communism, there has been widespread revival of religion.
Ukrainian 20th century history has been extremely complicated and in many waystragic. This period of history saw great upheaval and subjegation of the population and leftmany Ukrainians greatly in need of the restoration of social justice and social assistance.
Forced collectivization of rural areas (undertaken from 1929-1933 in eastern Ukraineand from 1948-1949 in western Ukraine) led to an immense loss of life. The famines of1932-1933 and 1946-1947 claimed a further 10 million Ukrainian lives. Millions ofpeople died or were sent to concentration camps in Siberia during the mass repressionsfrom 1937-1946.
In their attempts to resist the Soviet regime, the most advanced part of Ukrainiansociety formed a military opposition movement, which was extinguished in the early1920s in the east. Meanwhile western Ukrainian intelligentsia and peasants formed the

204
T H E I M PA C T O F D E C E N T R A L I Z AT I O N O N S O C I A L P O L I C Y
Ukrainian Rebellion Army (UPA—Ukranian abbreviation) which supported partisanactivities in the western regions until 1952 when they too were extirpated.
Thus, from the perspective of social protection and support, veterans of the UPA aswell as victims of the political repressions of the 1930s, ‘50s, and ‘70s, constitute aconsiderable part of the groups in need of social assistance, along with the victims ofthe Chernobyl disaster.
Ukraine was proclaimed independent on 24 August 1991. On 1 December 1991,91.6% of the population confirmed their wish for independence in a referendum.
1.2 Social Provisions in the Soviet System
As a Soviet republic, Ukraine belonged to the socialist society which guaranteed itscitizens a minimum standard of living. In accordance with the ruling Marxist ideology,the government favored workers and displayed tolerance towards peasants, though itwas, to a certain extent, skeptical towards the intelligentsia. Such an attitude to thesethree main social groups affected the respective levels of income, the working classhaving received relatively higher pay along with better access to social welfare. Duringthe roughly fifty years of the Soviet system the state made no cash payments to peasants(no wages or pensions).
1.2.1 Pension System
The first Soviet laws on pensions were adopted between 1928-32. These laws determinedthe age limits for retirement (55 years for women and 60 for men). The USSR Constitutionadopted in 1936 declared the right of all citizens to financial provision when theyreached a certain age. However, in reality, only blue- and white-collar workers weregiven the right to pension provision under the approved Decrees of the CentralCommittee of the All-Russian Communist Party. Peasants received nothing.
It was only in 1956 that the USSR law On State Pensions was approved. This lawfurther rubber-stamped the existing inequality in the social provisions of the blue- andwhite-collar workers, on the one hand, and peasants, on the other. In addition, this lawseparated pension provision from state social insurance, which can be traced through thefinancing mechanisms. Whereas social insurance payments were financed from the insur-ance fund filled by contributions from all enterprises and institutions, pensions werefinanced from the national budget. Although the Social Insurance Fund (managed bythe Trade Union Board) was also part of the national budget, at the time it was filled atthe expense of a separate insurance duty (paid to the Salary and Wage Fund) rather than
205
at the expense of overall tax revenues. That employees made no insurance contributionswas regarded as a socialist achievement.
The amount of old-age pension for blue- and white-collar workers varied accordingto employment record and profession, with a 55% bonus paid to those involved in hazar-dous work, and mothers of four or more children. For every year above 25 years of em-ployment for men and above 20 years for women, 1% was added to their pension therebyincreasing the maximum level from 55% to 75% of the maximum salary.
On the whole, during the roughly fifty years of Soviet government half of the econo-mically active population of Ukraine was excluded from the state pension scheme. It wasnot until 1964 that peasants got the right to a pension, under the law On Pensions andBenefits for Collective Farmers. The amount of their pension was much lower than thatof workers. For instance, in 1970 retired collective farmers made up 42% of all pensioners,whereas their average old-age pension was four times less than the state old-age pension.The difference in pension provision of blue- and white-collar workers and collectivefarmers was cancelled only two years before the collapse of the USSR.
It can thus be seen that the Soviet pension scheme was not insurance-based and wasfar from keeping the principles of justice and equality. The USSR Government managedto provide a relatively decent amount of pension for certain categories of the populationbecause:
• the demographic situation favored a consolidated pension scheme;• there was a general work obligation for those in the active age cohort;• the unofficial employment rate was small and there was actually no tax evasion.
1.2.2 Labor Market Situation
The labor market structure the Ukraine greatly differed from that in other Europeancountries. In particular, at the time the USSR collapsed, the labor market was characterizedby relatively high employment in agriculture (19.8%) and in industrial production(53.8%), and by low employment in the service sector (26.4%). This structure reflectsthe priorities of the Soviet economic system. It was mostly focused on industrial produc-tion, on investments, on accumulating resources, and on the production of weapons.Therefore, despite high production, Ukraine lagged behind in consumption.
Under the conditions of the command economy, unemployment did not existofficially, as there was—as mentioned above—a general work obligation for the active-aged population and the actual situation of the Ukrainian labor market was concealed.Accordingly, there was neither a statistical system that would be able to analyze thephenomenon, nor was there social protection against de facto unemployment.
T H E U K R A I N I A N S O C I A L P R O T E C T I O N S Y S T E M A N D T H E M E T H O D S O F G O V E R N A N C E

206
T H E I M PA C T O F D E C E N T R A L I Z AT I O N O N S O C I A L P O L I C Y
1.2.3 Family Benefits
The principal Soviet legal regulations on maternity leave and on various maternitybenefits were adopted in 1947; in 1981 the scope of these regulations was considerablyincreased The period of paid maternity leave was 56 days before delivery and 56 daysafter. Maternity leave with moderate monthly social payments, with the understoodcondition of preserving the job, could be extended up to one year.
There also were lump-sum allowances to mothers, and benefits for mothers of fouror more children. Single mothers of children under the age of 16 received a benefitequal to 20% of their average monthly salary.
Apart from these benefits for mothers, no other family benefits were guaranteed bythe Soviet legal regulations. The only new type of family benefit was subsidies for low-income families introduced in 1974. It was a cash benefit (approximately 10% of theaverage salary/wage). In 1987 additional exemptions were introduced: free schooluniform and free lunches in school canteens (in respect of low-income families andfamilies with three or more children). Total expenditure on family benefits andexemptions in the USSR equalled only half that spent in Hungary.
1.2.4 Other Cash Benefits
During Soviet times there were also other cash benefits such as sick leave and holiday allow-ances paid from the social insurance fund and in 1955 a funeral allowance was introduced.
Summing up, we can infer that Ukraine inherited a social protection system which:
• was class-targeted (workers were generally more privileged than others);• was declaredly universal for all categories, which resulted in a haphazard disburse-
ment of benefits and assistance, that often did not reach those most in need;• had an imperfect social insurance system which did not cover pensions, health,
and unemployment insurance;• was rigidly centralized, as local governments acted only as administrators of some
social protection programs financed in full from the central budget;• was based on the benefit policy in the area of price definition of consumption
products and services (including apartment payments and payments for publicutility services).
In this system, the basic social service providers were state bodies. However, the biggestenterprises, in particular those of the defense industry, also played an important part. Theycould provide better conditions for the social protection of their employees (they financedtwo-thirds of kindergartens and nurseries, free housing, rest homes, health services, etc.).

207
2. THE TRANSITION
2.1 Political System
The head of the Ukrainian political system is the democratically elected president. Thepresident has the right to appoint the prime minister and the cabinet, albeit with the app-roval of parliament.
The Parliament of Ukraine consists of 450 members elected for a four-year period.(The president is elected for a period of five years.) In the March 1998 election, half ofParliament was elected under the “majority” principle, the other half under the politicalparties’ system (parliamentarian political parties have to overcome the 4% voting barrier).
The constitutional process began in July 1990 by adopting The Declaration on StateSovereignty of Ukraine. This document ratified the principles of sovereignty, democracy,inviolability of the territory of Ukraine, the division of power (legislative, executive, andjudicial), the equality of citizens and a state guarantee for their rights and freedoms. TheConstitution of Ukraine was adopted on 28 June 1996 after a lengthy political struggle. TheConstitution created a strong legislative foundation for the development of sovereigntyand a democratic state, and for the regulation of public relations.
2.2 Administrative Structure
The present administrative structure of the country comprises 24 regions/provinces, oroblasts. In addition, the Crimea has the status of an autonomous republic. In each region,there are local self-governments and local state executive bodies headed by a presidentialrepresentative. The Crimea has its own parliament and cabinet of ministers.
The structure of the state executive power in Ukraine is organized according tothe administrative and territorial division of the state and comprises three levels (seeFigure 4.2):
• central (national);• oblasts (the cities of Kyiv and Sevastopol are regarded as oblasts);• rayons (districts within the cities of Kyiv and Sevastopol are regarded as rayons).
At the central level, the President of Ukraine—as Head of State—assumes the administ-rative functions of the state through the Cabinet of Ministers, which is the central corporatebody of state executive power. Functional and branch (inter-branch) administration iscarried out by ministries and departments that are specially authorized central stateexecutive branch bodies.
T H E U K R A I N I A N S O C I A L P R O T E C T I O N S Y S T E M A N D T H E M E T H O D S O F G O V E R N A N C E

208
T H E I M PA C T O F D E C E N T R A L I Z AT I O N O N S O C I A L P O L I C Y
Figure 4.1Administrative Structure of Ukraine
At the regional (oblast) level, oblast state administrations (for Kyiv and Sevastopolcity administrations) are organized. These form part of the unified system of state exe-cutive power and are subordinated to the President and the Cabinet of Ministers.
At the rayon level (city district level for Kyiv and Sevastopol), there are respectivestate administrations, which also form a part of the state executive power. These reportto the Head of the Oblast State Administration (a governor) who than reports to thePresident and the Cabinet of Ministers. The autonomous republic of the Crimea is in aspecial situation representing a distinct level between the central and regional levels ofgovernment.
At the lowest level of administrative and territorial division (i.e. city, town, and village),state executive bodies are not formed. Here the administration is carried out by the localself-governments.
In recognition and reinforcement of the idea of local self-governance, the Constitutionof Ukraine defines the right of local self-governments to resolve local development issuesin villages, towns and cities, as well as city districts. The special differences of local self-governance in Kyiv and Sevastopol are determined by specific laws.
According to the law, local self-governance is carried out by “a territorial community”both directly and via local self-governmental bodies: village-, town- and city councils andtheir executive bodies. The local self-governmental authorities representing the commoninterests of villages, towns, and cities are rayon and oblast councils.
Ukraine
24 OblastsAutonomous Republic
of the CrimeaKyiv City
Sevastopol City
490 Rayons
894 Towns 28,739 Villages448 Cities
121 City Districts
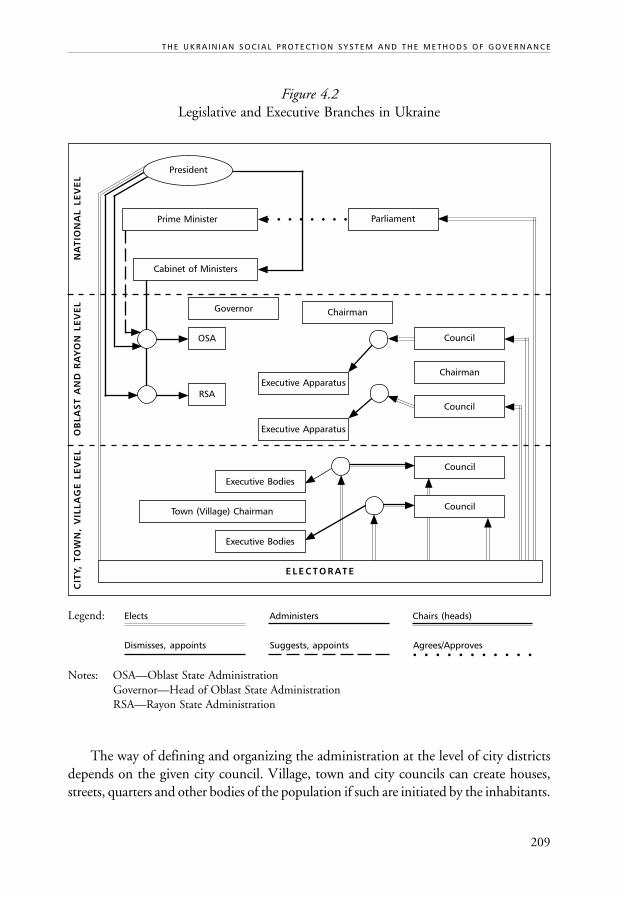
209
Figure 4.2Legislative and Executive Branches in Ukraine
Legend: Elects Administers Chairs (heads)
Dismisses, appoints Suggests, appoints Agrees/Approves
Notes: OSA—Oblast State AdministrationGovernor—Head of Oblast State AdministrationRSA—Rayon State Administration
The way of defining and organizing the administration at the level of city districtsdepends on the given city council. Village, town and city councils can create houses,streets, quarters and other bodies of the population if such are initiated by the inhabitants.
T H E U K R A I N I A N S O C I A L P R O T E C T I O N S Y S T E M A N D T H E M E T H O D S O F G O V E R N A N C E
CIT
Y, T
OW
N,
VIL
LAG
E L
EV
EL
NA
TIO
NA
L LE
VE
LO
BLA
ST
AN
D R
AY
ON
LE
VE
L
E L E C T O R AT E
Council
Council
Town (Village) Chairman
Executive Bodies
Executive Bodies
Chairman
Council
Council
ChairmanGovernor
OSA
RSAExecutive Apparatus
Executive Apparatus
Cabinet of Ministers
Prime Minister Parliament
President
○ ○ ○ ○ ○ ○ ○ ○
○ ○ ○ ○ ○ ○ ○ ○ ○ ○ ○

210
T H E I M PA C T O F D E C E N T R A L I Z AT I O N O N S O C I A L P O L I C Y
The councils can confer these organizations with part of their own authority, financeand property.
Village, town or city communities have the right to merge communal properties ona contractual basis; they also can combine budget resources in order to implement jointprojects or to jointly finance communal enterprises, organizations, institutions, or tocreate bodies and services for specific purposes.
The state takes part in forming local budget revenues. It also provides financial supportto local self-governments. The expenditure incurred by a local self-government as aresult of state resolutions is reimbursed by the state.
According to the law, oblast and rayon councils, being local self-governments, approvesocio-economic and cultural development programes in regions or rayons respectively, andcontrol their implementation. They also approve respective budgets, the latter being formedfrom the national budget funds allocated under relevant budget lines. The allocations forjoint development projects are also made from other local budgets (settlements). Councilsare also authorized to decide other issues within their terms of reference.
Local self-governments can be delegated some power of the executive branch. Thestate financially provides the ability to exercise this power at the expense of the nationalbudget or by referring specified national taxes to local budgets. The state also has theauthority to transfer public property objects to local self-governments.
With respect to exercising the power originally defined as that of the state executivebodies, local self-governments are answerable to the respective superior state executivebodies (e.g. towns to the rayon).
The delegation of mandates to local public administrations had also been in practicebefore the adoption of the latest Constitution.
2.3 Macroeconomic Development
The transition process in Ukraine has proved to be difficult and controversial. As partof the Soviet centralized system, the Ukrainian economy was closely linked with theeconomies of the other republics. This situation created a heavy reliance on externalresources and markets, first and foremost those of Russia. Prior to independence, inter-republic trade accounted for more than 80% of the total “exports” and “imports.” Ukraineaccounted for a major share—about 25%—of the GDP of the former Soviet Union,and some 40% of its industrial output.
Ukrainian fertile black soil generated over one-fourth of Soviet agricultural output,and its farms provided substantial quantities of meat, milk, grain, and vegetables to theother republics. Likewise, its diversified heavy industry supplied equipment and raw ma-terials to industrial and mining sites in other regions of the USSR. Ukraine was and ishighly dependent on external energy supply, especially natural gas.
211
Shortly after the breakdown of the USSR in December 1991, the Ukrainian Govern-ment liberalized most prices and set up a legal framework for privatization. The widespreadresistance to the reform within the government and the legislature, however, stalled reformefforts and led to some backtracking. According to the National Statistics Committee,the current GDP of Ukraine is less than 40% of that in 1990. Loose monetary policiesresulted in hyper-inflationary levels in 1993.
Energy is the “Achilles heel” of the economy, since the country’s industry and agri-culture are heavy and inefficient users. Ukraine is self-sufficient in coal, but the countryimports 75% of its natural gas and 90% of its oil. Oil comes almost exclusively fromRussia, which has substantially raised its prices and reduced deliveries.
The onset of the financial crisis in Russia in 1998 dashed Ukraine’s hopes for its firstyear of economic growth in 1998 due to a sharp fall in export revenue and reduced do-mestic demand. Output continued to drop slightly in 1999. The government has alsonot been able to significantly decrease its huge backlog of wage and pension arrears.Despite increasing pressure from the IMF to accelerate reform, substantial economicrestructuring remains unlikely in 2000 largely because of the communist-dominatedlegislature’s resistance to further privatization.
Private sector development, with or without foreign direct investment, has madevery little progress, the business climate being seriously affected by very high corruptionand considerable uncertainty surrounding the legal basis for private activities. Accordingto the World Bank, 47% of the Ukrainian economy is gray.
In 1999, industrial production increased in comparison with the previous year by4.3%. Production increased in the food and woodworking industries. Over 70% ofindustrial output in 1999 was produced by private enterprises.
Despite some positive indicators, on the whole there was no easing of the difficulteconomic situation in Ukraine in 1998-99. The state budget revenue was collectedwith great difficulty; the budgets of most enterprises and institutions were not balanced.Moreover, there was no decrease in debt payments among enterprises, and backlogs ofsalaries, wages, pensions and other social cash payments were not eliminated. Even so,financial stabilization was achieved to some extent, inflation decreased to 10% andthere was no increase in the negative growth rates of the Gross Domestic Product andindustrial output. According to the data presented by the World Bank in its CountryEconomic Memorandum for Ukraine, GDP per capita was as follows: 1995—USD1,350, 1996—USD 1,210, 1997—USD 1,040, 1998—USD 850, 1999—USD 800(forecast). The national debt of Ukraine continues to grow. December 1999 saw theamount reach over USD 12.8 billion, out of which some USD 3.2 billion was paid backto creditors or restructured in the year 2000.
The underlying cause of the economic recession, according to World Bank experts,1
was that “Ukraine has sunk in hasty measures and has left behind its overall goals. Thedeclared direction of the economic policy has little in common with its practical imple-mentation. Thus the country descends from one crisis into another.”
T H E U K R A I N I A N S O C I A L P R O T E C T I O N S Y S T E M A N D T H E M E T H O D S O F G O V E R N A N C E

212
TH
E IM
PA
CT
OF
DE
CE
NT
RA
LIZ
AT
ION
ON
SO
CIA
L P
OL
ICY
Table 4.1Basic Macroeconomic Indicators
Indicator 1989 1990 1991 1992 1993 1994 1995 1996 1997 1998 1999
Real GDP, changes in comparison 100 96.6 85.4 73.7 63.2 48.7 42.7 38.5 37.2 36.6 35.7with 1989
Annual inflation rate [%] 4.2 91.0 1,210.0 4,735.0 891.0 346.0 80.0 16.0 11.0 25.0
Unemployment rate (ILO methodology) 5.6 7.6 8.9 11.3 12.9
Officially registered unemployment rate 0.3 0.3 0.4 0.6 1.6 2.7 4.3 5.1
Actual GDP per capita [USD] 2,040.0 2,200.0
Actual GDP annual growth –8.7 –9.9 –14.2 –22.9 –12.2 –10.0 –3.0 –1.9 –0.4
Exports [as % of GDP] 27.7 26.1 24.0 25.9 35.4 47.1 45.6 40.6 39.8
Imports [as % of GDP] –28.7 –23.9 –22.0 –26.2 –38.6 –50.2 –48.2 –43.7 –42.8
Budget revenues [million USD] 8.3
Overall budget deficit [as % of GDP] 7.1 13.8 5.1 8.9 6.6 4.9 6.1 2.2
Foreign Direct Investment in Ukraine 219.4 483.5 896.9 1,438.2 2,053.8 2,809.9[million USD at the beginning of the year]
External debt [million USD] 3.69 4.47 5.67 8.69 9.46 12.60
Social security benefit and exemption 19.0 3.6 18.7 31.5 11.2 13.7 12.0 16.4 13.6 13.7expenditures [as % of total GDP]
SOURCE: Ukraine in Figures. Short Statistical Abstract. Kyiv, 2000; Human Development Report Ukraine. UNDP, 2000.

213
T H E U K R A I N I A N S O C I A L P R O T E C T I O N S Y S T E M A N D T H E M E T H O D S O F G O V E R N A N C E
One of the major reasons for the decrease in the industrial capacity of Ukraine is thatno distinct system for the distribution of resources has yet been set up. Discriminationagainst market actors has been increasing. The present regulatory mechanism is unfavor-able: numerous approvals are needed to register a business, and most business activitiesneed a license. The private sector is being destroyed through inequality of conditions,e.g. too wide a price range, and individual tax rates. A significant portion of the privatesector is supported by the state due to the mechanism of direct and indirect subsidiesfrom the budget: tax exemption; debt re-structuring or debt writing-off; state loans withsubsidized interest rates; failure to return loans; etc. Many enterprises get tax exemptionsdue to the legislation on free economic zones and on special modes of investment activities.
In 1992-1996, the human development index (HDI) calculated by the United Nationssharply dropped in Ukraine. The country dropped from 32nd position to 95th among 175countries. In 1999, Ukraine rated 91st among 185 countries. It is important to notethat the HDI varies greatly from region to region.
2.4 Labor Market Situation
2.4.1 Observation of Labor Rights
Over the last few years the protection of labor rights of citizens has significantly deteriorated.The number of illegal dismissals is increasing; there are many cases of salaries not beingpaid on time, and holidays going unpaid. At most of the non-state owned enterpriseslabor relations are not registered officially in accordance with the legal regulations. Thestate does not adequately monitor and control the fulfillment of labor regulations.
The major problems regarding the social sphere are, in my opinion, as follows: low employmentrate, low manpower demand, low manpower cost, low manpower quality, and low performancepotential. Those who are on forced leave for months, or working for two or three days a week—moreover using equipment that has not been modernized for ten years—cannot, in fact, be suffi-ciently skilled. Ukrainian manpower is becoming non-competitive on the domestic market, notto mention the markets abroad.
SOURCE: An interview with a social policy official.
The economically active population (aged 15-70) amounted to 23 million peoplein September 1999; the number of people actually employed was 20.6 million or 89.7%of the economically active population. The unemployment level (based on the methodo-logy of the International Labor Organization, ILO) was 11% in September 1999, which

214
T H E I M PA C T O F D E C E N T R A L I Z AT I O N O N S O C I A L P O L I C Y
was more than double the indicator of registered unemployment (5.4%) within thiscategory of citizens.
... According to the Constitution, the state provides full employment, but according to the ILOmethodology the unemployment rate in Ukraine today exceeds 11%. Official data state that theaverage period of unemployment lasts for over 11 months; according to unofficial data it is morethan 18 months. Furthermore, my expert judgement tells me that the unemployment rate inUkraine exceeds 25%. In other words, every fourth person lives beyond social laws... The secondproblem is again connected with employment. Supposing somebody comes to the Job Centerand is registered as unemployed, this person would be granted benefits for a certain time. Whetheror not the benefits are sufficient, this is what they are given anyway. The benefit provision termfinally expires (360 days in the course of two years) and this person no longer gets anything....
SOURCE: From an interview with a social policy official.
The trend of inefficient use of officially employed citizens is still a threat. In the lastthree years the number of workers on “forced” holiday and of those employed part timeremains high. In 1999 the figures for those groups were 2.8 million and 2.2 millionpeople respectively, or 19.4% and 15.3% of the average registered number of employed.Over 727,000 people were unemployed for over one month. For example, in the const-ruction industry such “forced” holidays of various durations covered every second employedperson, in industry every third, while in other fields such holidays covered every fourthperson. The greatest number of people on administrative holidays were in the oblastsof Vinnytsya, Zakarpattya, Lviv, Mykolaiv, Cherkassy and Chernivtsi.
The imbalance between workforce supply and demand is getting worse. On 1 January2000, the number of registered unemployed stood at 1.2 million, while the number ofregistered vacancies was only 50,700. On average, there were 24 people for every vacancy.
...The state itself is the main guilty party in not observing the law. There is a law that salary/wages are to be paid twice a month. But sometimes salaries/wages are not paid for years, and thisis accepted as normal. The law says that people have to work for the period as stated in the contractconcluded with the employer whereas the employer is able to force them to take holidays lastingfor six months or even up to three years, without any adequate sanctions being taken against theemployer. At present, the State remains the main employer or employs the most people, and theState itself violates these laws.
SOURCE: From an interview with a social policy official.
Among the unemployed population registered during 1999, the share of those whohad completed higher education (university, academy) totaled 10%; with basic high edu-cation—22%; with professional and technical education (college)—32%; completedsecondary education—30%; with basic or primary secondary education—6%. The durationof unemployment is consistently growing. In 1996 the average period of unemployment
215
T H E U K R A I N I A N S O C I A L P R O T E C T I O N S Y S T E M A N D T H E M E T H O D S O F G O V E R N A N C E
was 6.8 months; in 1999 it amounted to 11 months. Considering that most people hada long break in employment, the actual level of their professional knowledge and qualifi-cations neither corresponds to the appropriate level of education nor meets the require-ments of the employers.
2.4.2 Labor Migration
The lack of labor market participation, the decline in real wages and the stagnant or declinein social investments have contributed to the significant and sustained levels of emigration.Most people go to other countries—whether near or far—without appropriately completeddocuments. As an example, from Chernivtsi oblast alone, with its population of 938,000,over 45,000 people went abroad in the year 2000 in order to work illegally (according tothe Monitoring Committee of Chernivtsi Oblast State Administration). Officially only33 persons left the oblast.2 Official statistics have no objective data about temporary workleave and emigration from Ukraine because of the lack of any mechanism for recordingillegal migration.
The majority of Ukrainian emigrants tend to be individuals of working age with skillsmarketable on the world labor market. A sustained outflow of competitive core workersobviously has very damaging effects on the national economy.
2.5 Basic Demographic IndicatorsAffecting the Social Protection System
The major tendency of the last ten years with respect to demographic trends was theconstant decrease in the total population and in the birth rate. The age structure ofUkraine’s population demonstrates a constant increase of people of retirement age, and adecrease in the “active” proportion of the population. The number of elderly citizenswill continue to increase in the near future. In the regions Zhytomyr, Chernihiv andLuhansk, the retired population is close to 70%.
In 1999, the total population decrease remained, on average, at the same level of theprevious years (see Table 4.2); however, the process of natural decrease became morerapid: in 1998 the there was a natural decrease in the population by 300,700 in contrastto 350,000 in 1999.
The depopulation process in Ukraine can be specifically described by the simultaneousworsening of both the birth rate and the death rate. In the 1990s, the average decreasein the birth rate stood at 5.37%, while the average increase in the death rate was 2.77%.Compared with 1990, the year 1999 revealed a 59.2% decrease of newborns and an 11%increase of the deceased.
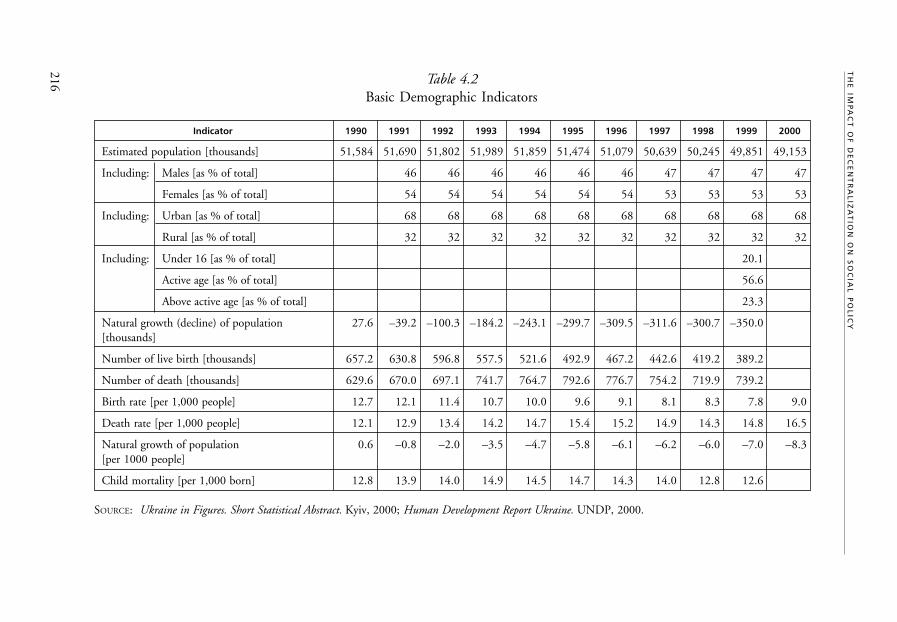
216
TH
E IM
PA
CT
OF
DE
CE
NT
RA
LIZ
AT
ION
ON
SO
CIA
L P
OL
ICY
Table 4.2Basic Demographic Indicators
Indicator 1990 1991 1992 1993 1994 1995 1996 1997 1998 1999 2000
Estimated population [thousands] 51,584 51,690 51,802 51,989 51,859 51,474 51,079 50,639 50,245 49,851 49,153
Including: Males [as % of total] 46 46 46 46 46 46 47 47 47 47
Females [as % of total] 54 54 54 54 54 54 53 53 53 53
Including: Urban [as % of total] 68 68 68 68 68 68 68 68 68 68
Rural [as % of total] 32 32 32 32 32 32 32 32 32 32
Including: Under 16 [as % of total] 20.1
Active age [as % of total] 56.6
Above active age [as % of total] 23.3
Natural growth (decline) of population 27.6 –39.2 –100.3 –184.2 –243.1 –299.7 –309.5 –311.6 –300.7 –350.0[thousands]
Number of live birth [thousands] 657.2 630.8 596.8 557.5 521.6 492.9 467.2 442.6 419.2 389.2
Number of death [thousands] 629.6 670.0 697.1 741.7 764.7 792.6 776.7 754.2 719.9 739.2
Birth rate [per 1,000 people] 12.7 12.1 11.4 10.7 10.0 9.6 9.1 8.1 8.3 7.8 9.0
Death rate [per 1,000 people] 12.1 12.9 13.4 14.2 14.7 15.4 15.2 14.9 14.3 14.8 16.5
Natural growth of population 0.6 –0.8 –2.0 –3.5 –4.7 –5.8 –6.1 –6.2 –6.0 –7.0 –8.3[per 1000 people]
Child mortality [per 1,000 born] 12.8 13.9 14.0 14.9 14.5 14.7 14.3 14.0 12.8 12.6
SOURCE: Ukraine in Figures. Short Statistical Abstract. Kyiv, 2000; Human Development Report Ukraine. UNDP, 2000.

217
T H E U K R A I N I A N S O C I A L P R O T E C T I O N S Y S T E M A N D T H E M E T H O D S O F G O V E R N A N C E
Negative trends related to the increasing death rate were already visible at the endof the 1960s. As a result, the life expectancy of the population as a whole also decreased:currently it is 65.9 years (60.3 years for males, 71.8 for females). The considerable increasein the death rate is mostly due to respiratory diseases, infectious and contagious diseases,as well as to diseases of the digestion system.
2.6 Standard of Living
Within the last ten or so years, the structure of cash income of the Ukrainian populationhas undergone a considerable change mostly as a result of the declining wages and salaries.
Table 4.3Structure of Cash Income of the Ukrainian Population [percentage]
1990 1991 1992 1993 1994 1995 1996 1997 1998 1999
Total cash incomes 100.0 100.0 100.0 100.0 100.0 100.0 100.0 100.0 100.0 100.0
I N C LU D I N G
Salaries and wages 70.9 66.2 69.7 56.6 62.7 59.0 58.8 51.1 48.2 49.7
Income from selling 5.5 6.4 3.0 4.0 2.5 2.5 3.0 2.7 3.6 4.6agricultural products
Pensions, benefits, 15.5 17.6 17.7 22.2 19.8 19.5 24.5 25.0 23.4 24.8scholarships
Income from selling — — — — — 3.0 6.7 12.4 13.2 5.9currencies
Other incomes 8.2 9.8 9.6 17.1 15.0 15.9 7.2 8.5 11.7 15.0
SOURCE: Labor and Social Policy in Ukraine. Kyiv: Socioinform, 2000.
In the structure of the cash income of the population there is a decrease in the salaries/wages ratio: in1990 it made up 70.9% whereas in 1998—only 48.2%; in the year 2000it equalled 48.9%.
Real money income decreased 4.4 times as compared to 1990, real wages—3.8 times,real pension—6.5 times.3 In addition, the hyper-inflation of 1992-1993 completelydevalued the savings of the population in the banking system.
Obviously the main source of cash income of working citizens is salaries/wages. InUkraine the average monthly wage in 1999 was USD 43, this was 31.7% less than in 1998.The wages of 40% of employees involved in the economic sphere were lower than theofficially established level of low income, which is in turn two times less than the minimumliving standard.

218
T H E I M PA C T O F D E C E N T R A L I Z AT I O N O N S O C I A L P O L I C Y
For reference: in the CIS countries the average salary/wage in USD according to theofficial exchange rates determined by CIS National Banks in 1999 was as follows: RussianFederation—64, Belarus—72, Uzbekistan—59, Azerbaijan—43.3, Armenia—37, Mol-dova—28, Kyrgyzstan—26, Tajikistan—9, Kazakhstan—90.
At the beginning of 2001 over 6.5 million employees did not receive their wages ontime. The average wages debt for one employee was more than three times their monthlywage.
Table 4.4Dynamics of Actual Cash Income of Population, December 1990-December 1999 [%]
Years Index of Actual Actual Salary Index Actual Pension IndexCash Income
1990 100.0 100.0 100.0
1991 78.1 106.1 79.5
1992 64.4 65.1 68.4
1993 21.1 31.6 23.1
1994 21.1 27.0 15.9
1995 26.1 34.5 18.5
1996 23.5 29.7 17.3
1997 23.8 29.0 15.7
1998 24.0 25.3 15.3
1999 22.5 26.2 15.3
For reference:
1992 1993 1994 1995 1996 1997 1998 1999
Inflation index for the 1,658.2 4,835.3 991.4 476.8 180.3 115.9 110.6 122.7previous period, [%]
SOURCE: Labor and Social Policy in Ukraine. Kyiv: Socioinform, 2000.
2.7 Poverty
Most of the characteristics of poverty in Ukraine are common to most or all of the countriesin transition. Many aspects, such as declining real wages and employment in the formaleconomy together with increasing inequality and informal economic activities can befound across a broad group of countries undergoing liberalization and economic reform.
Poverty is not simply a matter of lack of income. Human poverty is a lack of accessto the opportunities available to other members of the society as a result of social, political

219
or other restraints or barriers. It is thus of extreme importance to distinguish betweenthe simple assessment of income poverty and a broader and more complex understandingof the concept of human poverty. Poverty lines based on cash or non-cash incomes playa central role in the discussion of policy issues.
Setting a poverty line intuitive (that is based on a clear definition and is convincing)and politically acceptable is extremely difficult. Attempts to produce an absolute povertyline based on studies of the real expenditures of poor households or the calculation of aminimum consumption basket have produced a number of very different ‘poverty lines’(ranging from UAH 90 to UAH 270 per month). Even such an apparently objectiveapproach as a calculation based on a minimum calorific intake level becomes problematicwhen the long-term health effects of a poor diet (e.g. lack of vitamins, micro-nutrients,etc.) are taken into consideration.
One of the most visible results of wage decreases is the decline in consumption offood products as well as their structure and quality. Between 1990 and 1999 the con-sumption of meat, dairy products, eggs, fish and fruit fell by roughly 50%, whereas onlybread consumption rose above its pre-transition level.4 A considerable part of the Ukrainianpopulation now subsists on a diet consisting almost exclusively of carbohydrates andvegetables. The alarming rise in cases of tuberculosis or of iron-deficiency anemia amongpregnant women and new mothers are indications of poor diet and nutritional insuffi-ciency which is seriously threatening the health of the next generation.
According to the data of the selective inspection of households carried out by theNational Statistics Committee of Ukraine, differentiation of the population based onthe level of welfare has increased. The difference between the richest 10% of the popula-tion and the poorest 10% at the time of the study was six to seven times.
Material problems and the process of becoming poor and the decreasing ability topay are most painfully perceived in people’s subjective opinions. According to the resultsof sociological surveys carried out by SOCIS and by the Democratic Initiative Fund inMarch 2001, almost 9 out of 10 Ukrainians considered themselves poor. Moreover, 38%of respondents found their material status to be very low; 32% considered it as low, and16% as below average. Only 13% of respondents found their material status to be averageand only 1% estimated it as being higher than average. The drop in living standards, theincrease of unemployment, the pressure of such pathological phenomena as deteriorationof the population’s health together with the lack of qualified medical assistance, the extentof corruption, etc., is having an extremely negative effect on the level of satisfaction withlife on the whole. Sociological data show that the proportion of those unsatisfied withtheir life in 1994 constituted 48.7% of the respondents whereas in the year 2000 thisfigure rose to 60.9%.5
If we define the level of poverty with the help of the estimates on consumption,40% out of all households of Ukraine belong to the category of poor.6
According to the World Bank, 75% of Ukrainian families live below the povertyline.7
T H E U K R A I N I A N S O C I A L P R O T E C T I O N S Y S T E M A N D T H E M E T H O D S O F G O V E R N A N C E

220
T H E I M PA C T O F D E C E N T R A L I Z AT I O N O N S O C I A L P O L I C Y
Official figures (received with the help of the relevant criterion—75%-mean levelof expenditure calculated for one adult) show 27.8% (13.7 million people) of the Ukrainianpopulation belong to the category of poor and 14.2% to the category of destitute. Povertyin Ukraine is characteristic not only of educated and qualified people, but also of thosewho work full time. Families with three or more children are at the highest risk of becomingpoor. In fact almost all families with many children are destitute.
On the whole, all types of households are represented within the categories of poorand destitute:
• families with children, including families with many children make up 43.4%;• families of pensioners 29.1%;• families without dependents 27.6%.
Most poor and destitute households are concentrated in rural areas (36.6% and 37.0%respectively). There are a great number of poor households in the large cities (35.2%);but these households are typically close to the poverty line, which is confirmed by thesmaller portion of destitute households in large cities (32.9%). In contrast, the share ofpoor households in small cities (under 100,000 citizens) is 18.2%, and of destitute house-holds it is 30.2%.
The poverty rate and other indices characterizing the living standard of the populationvary substantially in the different oblasts of Ukraine. The highest indexes of poverty(37 to 42%) are in the oblasts of Luhanska, Mykolayivska, and Khmelnitska. The lowestpoverty rate (13.2%) is in Kyiv; also comparatively low (17-19%) are Chernihivska,Kharkivska, and Zakarpatska oblasts.
In 2000 the problem of poverty started to be discussed at the highest level of govern-ment. The annual presidential speech to Parliament contained, for the first time, a specialsection entitled “The Problem of Poverty in the context of the Policy of Social and Eco-nomic Changes and the Strategy of Reforms.” It was officially stated that “the processesof economic growth were not accompanied by any substantial qualitative changes, structuralchanges, or overcoming of the accumulated renewing deformations and deformationsin the social sphere.” Ukraine was found to be “a country not only with a high level ofpoverty but also with growing poverty. As a result the problem of poverty is becomingthe problem of the future of the nation.”8
3. THE SOCIAL PROTECTION SYSTEM
In the late 1980s, starting with the collapse of the Soviet economic system, it became clearthat the social protection system lacked justice and objectivity. As a result the amount ofmoney allocated to the social programes was considerably increased in 1992 when Ukraine
221
began to finance its social protection programs itself. In that year the total amountallocated to social protection made up over 40% of the GDP or two-third of the totalexpenses of the country. All in all, about 60 programs of allowances of different kindswere introduced. In fact 40% of Ukrainians were provided with some kind of allowancefrom the central government.9 Thus, the result of the first changes carried out by theUkrainian government in order to meet the increasing demand to reform the social pro-tection system, was the policy that had heightened, rather than relieved, the problemsspecific to the social provision system of the former USSR.
3.1 Social Insurance
The Constitution of Ukraine defines the right of citizens to social protection includingthe right receive benefits in case of full, part, or temporary loss of working capacity, lossof the bread-winner, unemployment for other reasons, as well as for old age and in othercases defined by law. This right is guaranteed first of all by obligatory state social insurancecovered from the insurance contributions of the citizens, enterprises, institutions andorganizations, as well as from the budget.
In order to implement the norms of the Constitution and to develop The Conceptof Social Provision of the Population of Ukraine, on 14 January 1998 the Parliamentadopted a framework law as a means of introducing obligatory state social insurance inUkraine alongside The Basic Principles of the Ukrainian Legislation on Obligatory StateSocial Insurance (hereafter referred to as The Basic Principles). These basic principles deter-mine the general legal, organizational and financial principles of social insurance forUkrainian citizens and aim at:
• determining the categories of the population to be covered by social insurance;• determining state guarantees with regard to protecting the rights and interests of
citizens entitled to a pension as well as to social services and cash allowances incase of permanent or temporary inability to work, unemployment, birth of achild, necessity to look after a small child, disease of a family member, death ofa citizen and members of their family, etc.
The financial costs of these programs are to be covered by the contributions of em-ployers and employees (the exception is industrial accident and occupational diseaseinsurance).
The rate of the contributions will be determined annually by the Parliament alongwith national budget.
Every insurance fund will have an independent institutional framework. The respon-sibility of the social insurance institutions will be limited to administrative issues. Parliament
T H E U K R A I N I A N S O C I A L P R O T E C T I O N S Y S T E M A N D T H E M E T H O D S O F G O V E R N A N C E
222
T H E I M PA C T O F D E C E N T R A L I Z AT I O N O N S O C I A L P O L I C Y
and the government determine all the key issues such as the amount of benefits andcontributions. Each of the funds will be managed on a tri-partite basis (equal number ofdelegated representatives of the trade unions, the employers, and the state). Hence, thestate does not manage insurance funds centrally, it delegates the management functionsto the social partners.
The Ukrainian Parliament has adopted the law On Obligatory State Social InsuranceAgainst Industrial Accidents and Occupational Disease Resulting in Loss of Working Capacity,introduced as a practical development of The Basic Principles. The draft laws OnObligatory State Social Insurance against Unemployment and On Obligatory State SocialInsurance against Temporary Loss of Working Capacity and Expenditures on Birth andFuneral were adopted by the Parliament after the first reading on 17 December 1999.It is planned that the Draft Law On Obligatory State Pension Insurance will be consideredin the near future. The Government is planning to introduce a new social insurancesystem in 2001. [Ed.: At the time of going to press in 2002 the new insurance system isbeing introduced.]
For various reasons most of the legislative standards (particularly those that refer tothe amounts of the allowances) have not been realized and the more radical reformshave not been implemented at all. Thus the social insurance system does not ensure thebasic existential security of the Ukrainian citizens.
3.2 Family Protection
The law of Ukraine On State Benefits for Families with Children sets out a completesystem of cash benefits to support working and non-working women in case of maternity,child-birth and child care (see Annex 5 parts 5.1-5.7 for the details of these benefits). Inaccordance with this law, the following types of state benefits are granted:
• for maternity;• for lump sum child-birth allowance;• for child-care;• for cash child-care rewards to parents with three or more children under the
age of 16;• for disabled children;• for temporary inability to work (sick child care);• for children aged up to 16 (school pupils aged up to 18);• for single mothers;• for children under obligatory military service;• for foster children;

223
• for minors whose parents evade paying alimony or when the levying of alimonyis impossible;
The amount of state benefits based on the above-mentioned law is calculated as apercentage and as a divisible ratio of the minimum wage/salary. At present, benefits aregranted and paid in the amounts determined by the Decree of the Cabinet of Ministersof Ukraine dated 24 January 2000, No. 122, On Extending the Period of Effect of theDecree of the Cabinet of Ministers of Ukraine of 27 May 1999, No. 915.
The amount of child benefit differs depending on the source of financing, theinstitution paying the benefit, and on the amount of the benefit.
Child-care benefits in respect of children aged two to three for non-working women,cash child-care benefits for parents in respect of three or more children aged up to 16,and benefits in respect of children up to 16 (school pupils aged up to 18) are grantedunder the condition that the average total monthly income for one family member forthe 6 calendar months before applying for a benefit does not exceed the determinedamount (UAH 46). Other types of benefits are granted regardless of the family’s income.
A maternity benefit is granted and paid by the woman’s place of employment.Lump sum child-birth allowance, child-care benefit, cash child-care benefits for mothers
(or fathers) in respect of three and more children aged up to 16 (school pupils aged upto 18); benefit in respect of a disabled child; child benefit for single mothers; benefit inrespect of children of those under obligatory military service and temporary benefit forminors whose parents evade paying alimony or when the levying of alimony is impossible,are granted and paid by the Labor and Social Protection bodies at the place of residence.
A benefit with respect to foster children is granted by state administrations or executivecommittees of the Councils and is paid by local bodies of the Education Department atthe place of residence.
On the surface, the list of benefits corresponds to the legal regulations adopted bymany other countries. Even so, problems related to the realization of certain articles ofthe law emerged immediately after it was put in effect in January 1993.
For example, Article 17 has never been fulfilled in terms of payment of lump sumchild-birth benefit. Under the law On State Benefits for Families with Children, the amountof this benefit directly depends on the amount of the minimum wage and is calculatedon its basis. The specification is presented in Annex 5. In theory, other benefits oughtto be calculated in the same way. In practice, however, the amount of the benefit isdefined by the Cabinet of Ministers, and it is considerably lower than it would be if cal-culated according to the legal regulations in effect (see Annex 5).
... Those tiny drops of funds that the state pays to mothers for child-care and particularly tosingle mothers cannot be called anything other than humiliation of these people by the state.
SOURCE: From an interview with a social policy official.
T H E U K R A I N I A N S O C I A L P R O T E C T I O N S Y S T E M A N D T H E M E T H O D S O F G O V E R N A N C E

224
T H E I M PA C T O F D E C E N T R A L I Z AT I O N O N S O C I A L P O L I C Y
... In practice we do not help anybody. It is only a sham. This sum of money, for example UAH7.4 per month for child-care for non-working mothers is paid solely as a means of showing thatthe state takes care of and provides for its citizens.
SOURCE: Focus group discussion, Lviv.
The declared but financially unsupported social priorities, as well as the fact thatthe problems of family development and support, maternity and childhood are ignored,have led to a drastic decrease in child-birth in Ukraine (by 59.2% in 1999 in comparisonwith 1990), as well as to the deterioration of the competitiveness of Ukrainian womenon the labor market. These are the main reasons for refusing to make use of the three-year child-care leave.
It is obvious that many social standards related to the family support schemes needto be reconsidered. The Child Benefit Program (divided into 11 types) covers 2.3 millionfamilies. The payments are carried out from different sources and by different bodies:from the Social Insurance Fund, from the state budget, from local budgets, from thePension Fund through the branch offices of social protection, through the branchoffices of the Pension Fund, etc. The total amount of the Program’s funds is UAH231.9 million (see Annex 4 for details) and the average benefit is about UAH 15 permonth for one child, which is simply a symbolic sum. For example, an unemployedsingle mother receives UAH 7.4 per month. The amount of assistance does not in mostcases depend on the family income. Thus, the assistance is not distributed fairly, as it isalso received by those who do not need it. It would be more expedient to give assistanceprovided within the Child Benefit Program only to the poorest families (on the basis ofthe official level of poverty and the needs). This Program should be reconsidered with theaim of strengthening the target character of the assistance simultaneously with increasingthe amount of benefit.
A targeted benefit to low-income families was introduced in April 1999. The benefitis provided in cash if the total average monthly income of the family—consisting ofpensioners and children under age 16 as well as unemployed persons caring for childrenunder age 16 or disabled of the first group—does not exceed UAH 46 per person. Theprocedure for the provision of such a benefit is as follows: a person applies to the relevantsocial assistance department and sends an application to the head of the rayon/city admi-nistration with the relevant documents attached (certificate of family members, certificatesof income and the general material status). In the rayon/city state administrations thereare special commissions on provision which, on the basis of the submitted documentsand examination of the given household decide on the possibility of administering abenefit and its amount. Since these benefits are provided from the local budgets, they arequite small, and they mainly depend on the financial status of the local budgets.

225
... In my opinion, the size of the benefit should be defined only at state level because even in Kyivthere are “sleeping areas” with no industrial companies on their territory and their budgets requirebenefits. They cannot allocate funds for family allowances at all. I mean that it is impossible tosolve this problem in this way. The family allowance should not depend on the local budget.I should repeat that this issue should be defined at state level; it is essential that guarantees beprovided, there should be some fixed part of family allowances provided from the state and anotherpart could be from the local budget.
... In Kyiv, social benefits are paid from the district administrations and from the city admi-nistration. We are aware that not every district is able to provide low-income allowances orallowances in respect of children or disability benefits. This is why the City Fund of SocialProtection for Citizens with Low-Income was established in the city. The funds of the City Fundare allocated by the department of city administration, that distributes the benefits to all citizensof the city irrespectively of the district they live in.
SOURCE: From an interview with a key employee of the Department of Social Protection in Kyiv.
According to statistical data, 32,245 families applied for assistance as of 1 January2000. Of these, only 23% (7,165 families) had the right to receive assistance (becauseof the strict conditions governing the administering of benefits) (see Annex 5, Part 3).As decided by local authorities, this benefit was granted to 2,437 families (34% out ofthe families that were appointed to receive the targeted benefit). The average amount ofthe benefit is very limited: UAH 12 per family. Furthermore, only 47% of this benefitwas paid out, the rest remains backlogged. This entirely discredited the program andthe whole concept of a guaranteed minimum income.
It is essential that this program of targeted benefits for low-income families behandled by the state and not dealt with from local budgets. Local authorities can haveonly administrative functions. Furthermore, many social workers consider that it isurgent to make changes in the criteria of the right to receive this kind of benefit.
Despite the economic situation in Ukraine the social protection of working womencould be more efficient if the financial system were to be more decentralized and if itwere not integrated into other financial mechanisms. Because of the imperfection ofthe legal regulations, a considerable amount of the financial resources of the SocialInsurance Fund are wasted. The Fund pays benefits to working women who are notcovered by social insurance, particularly to women in military service working for theMinistry of Home Affairs and for the Security Service of Ukraine and to unemployedwomen (if the unemployment period exceeds 10 months), graduates from higher edu-cation institutions, technological colleges, etc. All women receive the same amount ofbenefit in respect to child-birth and maternity. Thus the state transferred its duty tosupport families with children to the Fund, although the main purpose should be toprotect working (contribution-paying) people.
At the same time there are working women in Ukraine who do not have the right toreceive numerous social benefits (i.e. for hospital treatment for children, maternity,
T H E U K R A I N I A N S O C I A L P R O T E C T I O N S Y S T E M A N D T H E M E T H O D S O F G O V E R N A N C E
226
T H E I M PA C T O F D E C E N T R A L I Z AT I O N O N S O C I A L P O L I C Y
child-birth, etc.). As a result of the introduction of a single agricultural tax and a tradelicense (a monthly paid tax for small private vendors), funds which do not go directly tothe Social Insurance Fund, these women remain with little social support. (For example,they do not get paid sick leave.)
It is a general problem of almost every working woman that the scope of child careservices (nursery, kindergarten, etc.) that was earlier financed both from national andlocal budgets and from numerous institutions (e.g. utilities and pre-school institutions)are decreasing. Only very few people can afford to pay for services of modern non-statecommunal services and amenities, non-governmental kindergartens or baby-sitters. Allthis prevents women from working to the full extent. The increase of their additionalinvolvement in household work (household maintenance, care for children and sick rela-tives, etc.) is not included in the market relations/calculations and is not taken into accountin national economic calculations.
3.3 Social Services and Cash Benefits
3.3.1 Housing Subsidies
The Housing Subsidies Program was introduced in Ukraine in 1995. This program isone of the few examples of public bodies implementing efficient social policy. Theobjective of this program was to relieve society’s social tensions under the conditions ofincreasing prices and the amount of rent for housing, and the increasing cost ofcommunal services and energy resources, where the prices and rates for these wereapproaching the production costs. Until 1995, 6% of the payments for utility serviceswere paid by the population and 94% by the state. From 1 February 1995 up till theend of July 1996, 20% was paid by the citizens, and since 30 July 1996—80% of it. Asa result of this change, over a third of the population stopped paying for utility services.
Housing subsidies are a monthly targeted in-kind benefit for citizens to compensatefor the expenses of paying for housing and using the communal services (water, heating,electricity and gas supply). It is granted if the amount to be paid for these services consumedwithin the determined standards differs from (is above) the amount of obligatory paymentdetermined by the government (as of today—15% or 20% of the total household income).That is, if housing rent exceeds 15% (for the unemployed) or 20% (for the employed)of the total household income, housing subsidies are granted. Subsidies are non-repayable;receiving them is not connected with and does not result in any change in the propertyform of the house/flat (see Annex 5, Part 2 for the criteria of receiving a housing subsidy).
Although the criteria and procedures for providing this benefit have been greatlychanged since the beginning of the program, there are still a lot of drawbacks according
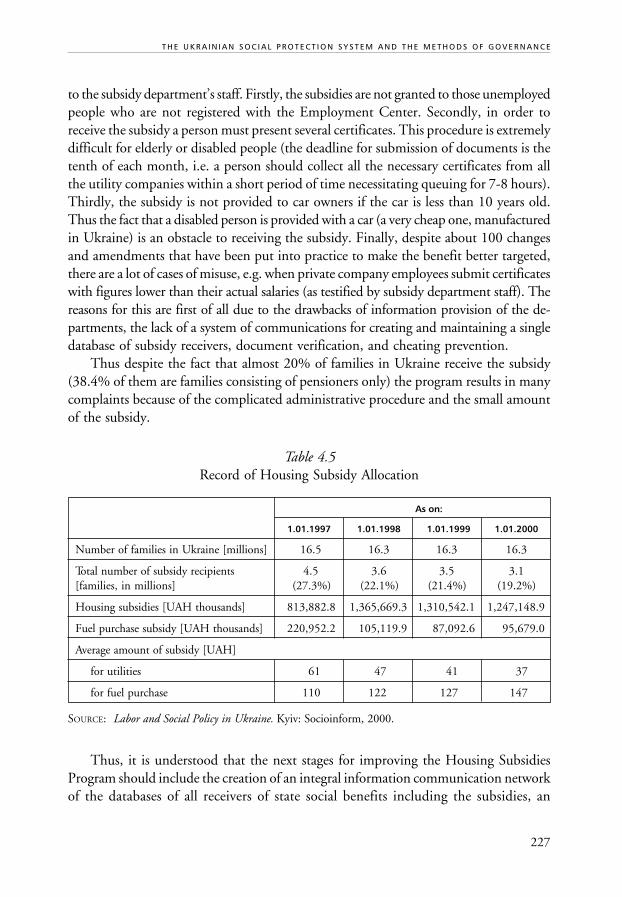
227
to the subsidy department’s staff. Firstly, the subsidies are not granted to those unemployedpeople who are not registered with the Employment Center. Secondly, in order toreceive the subsidy a person must present several certificates. This procedure is extremelydifficult for elderly or disabled people (the deadline for submission of documents is thetenth of each month, i.e. a person should collect all the necessary certificates from allthe utility companies within a short period of time necessitating queuing for 7-8 hours).Thirdly, the subsidy is not provided to car owners if the car is less than 10 years old.Thus the fact that a disabled person is provided with a car (a very cheap one, manufacturedin Ukraine) is an obstacle to receiving the subsidy. Finally, despite about 100 changesand amendments that have been put into practice to make the benefit better targeted,there are a lot of cases of misuse, e.g. when private company employees submit certificateswith figures lower than their actual salaries (as testified by subsidy department staff). Thereasons for this are first of all due to the drawbacks of information provision of the de-partments, the lack of a system of communications for creating and maintaining a singledatabase of subsidy receivers, document verification, and cheating prevention.
Thus despite the fact that almost 20% of families in Ukraine receive the subsidy(38.4% of them are families consisting of pensioners only) the program results in manycomplaints because of the complicated administrative procedure and the small amountof the subsidy.
Table 4.5Record of Housing Subsidy Allocation
As on:
1.01.1997 1.01.1998 1.01.1999 1.01.2000
Number of families in Ukraine [millions] 16.5 16.3 16.3 16.3
Total number of subsidy recipients 4.5 3.6 3.5 3.1[families, in millions] (27.3%) (22.1%) (21.4%) (19.2%)
Housing subsidies [UAH thousands] 813,882.8 1,365,669.3 1,310,542.1 1,247,148.9
Fuel purchase subsidy [UAH thousands] 220,952.2 105,119.9 87,092.6 95,679.0
Average amount of subsidy [UAH]
for utilities 61 47 41 37
for fuel purchase 110 122 127 147
SOURCE: Labor and Social Policy in Ukraine. Kyiv: Socioinform, 2000.
Thus, it is understood that the next stages for improving the Housing SubsidiesProgram should include the creation of an integral information communication networkof the databases of all receivers of state social benefits including the subsidies, an
T H E U K R A I N I A N S O C I A L P R O T E C T I O N S Y S T E M A N D T H E M E T H O D S O F G O V E R N A N C E

228
T H E I M PA C T O F D E C E N T R A L I Z AT I O N O N S O C I A L P O L I C Y
automated checking system of the right to receive the benefits, and a complex system ofauditing and monitoring.
3.3.2 Social Protection of Disabled People
The law On Basic Principles of Social Protection of the Disabled in Ukraine identifies aperson to be considered as disabled and thus eligible for social protection: it should bea person with a dysfunction caused by illness, injury or an inborn defect that limitstheir ability to work. Furthermore, disability is defined as a degree of health damage. Thedisability may result from general disease, industrial accident or occupational disease,disability since childhood, disability as a result of wounding, contusion, health damagereceived at the front or during the performance of military service, or from the Chernobyldisaster. It is identified by means of an examination undertaken by the Medical andSocial Expert Commission at the Ministry of Health. Based on the level a health assess-ment, the disability may be of one of three groups. At the beginning of 2000 the SocialProtection System of the Disabled provided services to 2.431 million people includingthe following categories:
Table 4.6Disabled Population in Ukraine
World War II disabled 297,000
Disabled since delivery or early childhood 283,200
General disease (those who are not in any other category) 1,780,500
Disabled children 146,900
Industrial accident, occupational disease 113,100
Chernobyl disaster victims 66,100
At the beginning of 1991 there were 1.629 million disabled people in Ukraine. Theyrepresented 3% of the total population and about 13% of pensioners. Today, these figuresare 4.72% and 17.4% respectively. The number of disabled persons increases everyyear by 250,000 people.
In our opinion, special attention should be paid to the legal restoration of social in-justice relating to the pension provision for the disabled, that is financed from the PensionFund of Ukraine. As the next table shows, in some cases the pension for a given categorydiffers from another by more than five-fold.
Since disability is defined as a degree of health damage, the amount of pension shouldnot be based on the reasons that led to the disability but on the degree of health damage.Regardless of the cause of disability, the beneficiaries should have equal legal status.

229
T H E U K R A I N I A N S O C I A L P R O T E C T I O N S Y S T E M A N D T H E M E T H O D S O F G O V E R N A N C E
Table 4.7Disabled and their Pension in Ukraine
No. Category of Disabled Number of Disabled Average Pension[thousands] per Month [UAH]
1. Disabled because of the Afghan war 341.5 141.81
2. Disabled as a result of the Chernobyl disaster 66.1 230.81
3. War disabled 297.0 148.16
4. General illness disabled 1,495.0 65.23
5. Handicapped 109.7 71.2
6. Disabled from childhood 283.2 42.0
Another public institution dealing with the social protection of the disabled is theUkrainian Fund for Social Protection of the Disabled. There are two aspects of the Fund’sactivities. The first of these is financing six basic programs for social protection of thedisabled (see Annex 4):
• providing transport;• compensation for petrol;• resort treatment, compensation for unused resort treatment tickets (the disabled
on the waiting list are entitled to a free bi-annual resort treatment ticket);• financial benefits;• installing telephones for the disabled of the 1st and 2nd groups in the general
disease category;• providing orthopedic prosthetic devices and wheel-chairs.
The other aspect of the Fund’s activities is to ensure that the law On the Basic Principlesof Social Protection of the Disabled in Ukraine is observed by the various enterprises. Accordingto law, all private and public enterprises have to employ a certain number of disabledpeople (4% of the total number of their employees; e.g. if there are 15 to 25 employees,this means one job). If companies do not fulfill their legal obligations they are fined byway of paying an average salary/wage to the Fund for Social Protection of the Disabled.
The main problems of the Fund according to the Fund Manager in Lviv oblast are the loopholesand contradictions of the legal regulations. Article 19 of the law On the Basic Principles of SocialProtection of the Disabled defines the general obligatory standards of jobs for the disabled and thelaw On the Railway and Energy System limits the possibilities of the disabled to work in theseareas.
There are also problems in fulfilling sentences determined by an arbitration tribunal becausethe Law of Ukraine does not define the sources of payment that enterprises are required to make

230
T H E I M PA C T O F D E C E N T R A L I Z AT I O N O N S O C I A L P O L I C Y
for not providing jobs for the disabled. Very often, payments should be made from a bank andthe enterprise is insolvent or has had the opportunity to open several accounts and then claimslack of financial resources to pay. The tax authorities refuse to provide information about enterprisesbecause the information is considered classified.
SOURCE: Case study report, Lviv.
In order to provide all the social services determined by the law On the Basic Principlesof Social Protection of the Disabled in Ukraine, in 1999 UAH 2.4 billion would havebeen necessary whereas the expenditure on these services totaled UAH 107million (seeAnnex 4 for the main items of expenditure of Social Protection of the Disabled Fund).The actual need for cars for the disabled was 172,172 whereas in 1999 only 689 carswere provided. In terms of wheelchairs, 34,218 disabled people were in need whereasonly 6,656 were supplied.
City/rayon departments of social protection finance all the programs relating tothe Social Protection of the Disabled Fund from resources of the national budget.
In Ukraine today, there are 146,900 disabled children under 16 years old, or 141.5disabled children out of 10,000 in this age group. The index of child disability inUkraine increases every year. Since 1994 it has increased by 22.4%. The basic reasonsfor child disability are diseases of the nervous system and of the sense organs. Almosthalf of this group are children with cerebral palsy. Diabetes is also a major illness thatafflicts many children.
Every fifth registered disabled child lives in a foster home. The network of publicfoster homes includes 433 foster homes where 69,100 children are placed and 122specialized foster homes for children with various diseases where 16,000 children live.
An important part of the state support for the disabled is the issue of professionaltraining for disabled children. Six institutions form the network of educational institutionsworking under the auspices of the Labor and Social Protection Ministry. Five of these sixare specialized boarding-type institutions. Three institutions for disabled children havethe first and the second level of accreditation. They are the only institutions in Ukrainewhere the disabled can gain Junior Specialist or Bachelor degrees. It is obvious that thisis not sufficient and it is necessary to introduce benefits for the disabled to enable themacquire a degree in higher education institutions.
Currently Ukraine has about 30 associations serving the disabled, and about 8.5%of NGOs claim that their main focus is aiding the disabled. The most prominent NGOsare the Ukrainian Society for the Blind (75 enterprises employing 15,000) and theUkrainian Society for the Deaf (74 enterprises employing 13,000). To some extent thegaps in the state social policy are filled by the activities of NGOs for the disabled (e.g. thefinancing and repair of prosthetic devices, the distribution of humanitarian aid, foodstuffs, medical treatment, etc.) as well as promoting re-integration of the disabled (disabledchildren in particular), and assisting them in becoming involved in an active social life
231
through creating new computer classes, interest groups, clubs, and by applying thelatest methods and approaches in training them, all of which substantially facilitatetheir adaptation into society.
The receiving of international aid for disabled people is hindered by the present taxsystem (sometimes the amount of VAT to be paid by the sponsor may exceed the cost ofthe aid) and by the bureaucratic procedure for registering such aid.
To improve the social provisions targeted to disabled people it would be necessary to:
• remove the social injustice in the legislation regarding pension provision (certaincategories e.g. those disabled from childhood, receive considerably smaller pensionsthan other categories);
• strengthen the control over the violation of Articles 19 and 20 of the law Onthe Basic Principles of Social Protection of the Disabled;
• increase the amount of benefits for disabled children (the current benefit averagesUAH 25.9 a month) and their careers;
• provide grants for those disabled persons who wish to take advantage of highereducation;
• solve the problem of transportation and ensure that public and administrativeinstitutions are accessible;
• create a functioning public financing system for the purchase of wheelchairs andcars;
• reconsider some form of exemption to certain aspects of the legislation becauseof its irrational approach (in particular, the disabled are given a subsidy forpublic transport fares during the winter period when it is the most difficult forthem to move. At the same time there is an unsolved problem of road duty/taxon cars which are the common means of transportation for the disabled. A disabledperson who owns a car loses his/her right to receive subsidies for public transport,etc.).
3.3.3 Social Services for Single Peopleand for Elderly People Unable to Work
Currently, there are 2.89 million poor pensioners, disabled, and single citizens unableto work who need various types of social assistance.
In 1999, there were 700 territorial centers and 60 independent departments providingservices to about 600,000 single people unable to work. By means of these services over3 million citizens of this category received cash- and in-kind benefits totaling UAH130 million. This trend of social servicing will gradually be extended.
T H E U K R A I N I A N S O C I A L P R O T E C T I O N S Y S T E M A N D T H E M E T H O D S O F G O V E R N A N C E

232
T H E I M PA C T O F D E C E N T R A L I Z AT I O N O N S O C I A L P O L I C Y
Table 4.8Network of Social Service Institutes for Pensioners
and Single Persons Unable to Work
Number of Institutions Number of Patients
1998 1999 1998 1999
The number of territorial centers: 631 700 563,994 569,094(including departments below)
• visiting social assistance departments 130,891 61,905 385,629 391,214
• departments of social rehabilitation 203 235 85,947 114,329
• departments of medical social 138 149 58,908 49,679rehabilitation
• care institutions: 220 246 11,428 13,872– temporary stay 94 111 8,376 10,506– permanent living 126 135 3,052 3,366
• departments providing cash and 356 443 563,994 858,908in-kind benefits for low-incomepersons unable to work
• special workshops and divisions 75 78 17,873 10,636
• secondary economies 36 46 1541 2 410
• special apartment homes 15 13 564 516
Cheap Boarding Houses 5 7 4,678 8,681
• Cheap boarding homes for people 7 3 168 142without a place to live
• Boarding homes of collective 347 368 2,621 2,616agricultural enterprises
However, the newly created territorial centers do not operate at full capacity yetbecause of their poor material and technical basis. That is why social servicing of over100,000 pensioners in need of such services (as concluded by medical experts) has notbeen organized. In Kirovohrad, Odessa and Ternopil oblasts alone, 16,000 people arenot provided with services. In 12 oblasts the departments have not yet been fully re-organized into territorial centers of home social assistance. For example, in this respectDonetsk, Kyiv, Kirovohrad and Chernihiv oblasts are lagging behind.
In 1999, 276 nursing homes provided generally successful services for about 48,000elderly and disabled citizens. In 1999, a sum of UAH 198.09 million was provided forupkeeping nursing homes, this was 87% of the amount planned.

233
Table 4.9Network of Nursing Homes in Ukraine as of 1 January 2000
Total Number of Places
Available Occupied Vacant
Nursing homes of general type 72 15,891 14,240 1,651(including those below):
• Rest homes for the elderly and disabled 54 12,670 11,563 1,107
• Rest homes for individual categories 15 2,756 2,369 387
• Special rest homes 3 465 308 157
Psychoneurology institutions 146 28,108 25,443 2,665
Foster homes 58 9,181 7,947 1,234
Total 276 53,180 47,630 5,550
In view of the lack of state financing, the Labor and Social Protection Ministry alongwith the oblast departments for social protection are seeking innovative forms of economicactivity and new ways and sources of self-financing for boarding homes. In most oblastssuch self-financing is carried out by developing secondary economies, small-scale produc-tion activities, and the creation of manufacturing processes
For example, 96 mini-bakeries and 24 pasta production lines supply 70% of boardinghomes with bread and pasta products. The price of these products is three times lessthan the usual market price.
On the whole, in 1999 the economic activities of boarding homes allowed them tosupply their residents with vegetables, meat and milk.
Another problem stems from the fact that those living in institutions for single elderlypeople receive only 25% of the granted pension, while the rest of the amount remainsin the Pension Fund instead of being transferred to the accounts of geriatric institutions.
As a result of sociological surveys in the field it is possible to define the followingproblems and urgent tasks to be fulfilled in order to improve the work in the sphere ofsocial services provision for people unable to work:
• to enlarge the functions and kinds of services provided by territorial centers;• to facilitate the development of manufacturing processes for agricultural products,
and of small-scale production activities within the structure of boarding homesthat would supply them with goods for their own consumption;
• to provide territorial centers with means of transport in order to facilitate the mobilityof social workers and the transportation of elderly people with health problems;
• to facilitate social workers’ training in filling in documents (for pensions, subsidies,etc.), basic training in medicine and psychology;
T H E U K R A I N I A N S O C I A L P R O T E C T I O N S Y S T E M A N D T H E M E T H O D S O F G O V E R N A N C E

234
T H E I M PA C T O F D E C E N T R A L I Z AT I O N O N S O C I A L P O L I C Y
• to regulate the issue of 75% of the pension amount for people living in publicsocial institutions being transferred from the Pension Fund account to that ofthe social institution the person lives in;
• to improve legislation in order to facilitate the active involvement and co-operationof territorial centers and supporting enterprises, NGOs, and the Church.
3.4 Exemptions
While conducting these case study interviews the various officials repeatedly stated thatthe review and liquidation of most of the exemptions ought to be the major objective ofthe reform process. In their opinion it would be an important step towards social equality(as most exemptions depend either on the status of the potential recipient or on politicalmotives). Furthermore, these steps on exemptions would promote the finding of fundsfor the benefits of those who really need them.
In theory, budget expenditures on the financing of about 50 types of exemptionsfor over 18 million people should amount to UAH 35 billion, or nearly 78% of the totalUkrainian budget (see Annex 6 for the main exemptions and the financial needs to providethem). Therefore, the government unofficially differentiates the exemptions into thosedetermined by law, those that should be financed from the budget, and those actuallyfinanced. This brings about backlogs of payments. Because the state is unable to financethe exemptions, it shifts them onto the enterprises involved. For example, exemptions onpaying for public transport fares and payment for utilities are a heavy burden for transportand municipal enterprises.
For example, under the law On War Veterans and Guarantees of their Social Protection5.3 million people receive various exemptions. The total amount of these exemptionsin 1999 totaled UAH 3.6 billion. And an additional 3.6 million people claim that theyshould receive war participant status.
... According to my analysis we often protect people who do not need it. These are people wholearnt how to fool everybody. I think we should reconsider all the exemptions that exist today.
... It would be more reasonable to transfer exemptions into cash allowances. But I think that ourgrandees are manipulating these privileges. ... Why should a pensioner living in Kyiv have thepossibility to get free public transport and can do it four or even twenty four times a day? Butwhat about a pensioner living in a remote village, who not only hasn’t traveled on the underground(metro) but who hasn’t even seen a bus, and he/she can use such a possibility only once or twicea week. ... Why does it happen? Is the social category of Kyiv citizens better than the social categoryin villages? Why should the exemptions for veterans in Kyiv include exemption from paying forutilities, exemption from paying for the telephone, special medical care, special shops, etc. Andin villages utility compensation amounts to 1 hryvna?

235
... it is necessary to reconsider the status of war veterans and other recipients of benefits, theappropriateness of the provision of exemptions, the amount of the given exemptions, and therecipients of the exemptions.
... I think that politics has a direct influence on the state in the social sphere. For example, let ustake the elections of the political leaders... What do they build their election campaigns on? Onsocial issues. You can see speeches, advertisements, meetings. But whom do they meet? Do any ofthem meet with young people? A lot of attention is paid to veterans because veterans and pensionersare the most active voters.
SOURCE: From interviews with social policy officials.
The liquidation of most of the existing exemptions is first of all a political decision.Thus everything depends on the Ukrainian Parliament.
4. THE MAIN ACTORS OF SOCIAL POLICY
At present, public institutions in Ukraine are still the main agents for implementingsocial policy. These public institutions can be categorized into the following two groups:public authority bodies and state social institutions (the latter are part of the state infra-structure, but they are recipients rather than performers of executive functions).
During the 1990s Ukraine’s social protection system was reorganized. Specifically,territorial social services centers that serve single and other citizens unable to work werecreated. Their work was carried out in parallel with the state divisions of social assistance.This period was when the Departments for Social Protection were established, whichcombined the territorial centers and social assistance divisions.
The major institutions of social policy at various administrative levels are accountableto the Ministry of Labor and Social Policy. Schematically they look as shown in Figure4.3.
In that state institutions are the main agents in social policy, it is fair to say that weobserve a quite centralized system of social security. However the problem of centralizationcan be viewed from a different angle as well, i.e. the centralization in the system of statebodies that demonstrates a remote position of the decision-making center along the ad-ministrative “vertical line.” The problem of mandate intersections and oppositionbetween different administrative levels should also be considered.
Departments for social guarantees and compensation tend to be concerned with co-ordination and consultancy instead of providing cash assistance directly (these depart-ments are not legal bodies, thus even minor assistance come up against bureaucraticbarriers and lack of financing).
T H E U K R A I N I A N S O C I A L P R O T E C T I O N S Y S T E M A N D T H E M E T H O D S O F G O V E R N A N C E

236
T H E I M PA C T O F D E C E N T R A L I Z AT I O N O N S O C I A L P O L I C Y
Figure 4.3Structure of State Bodies in Charge of Social Policy
Most of the state institutions of the social sphere (except for employment centers)have a low level of office automation and lack of computer software facilities. No systemsfor communication between different institutions have been established so far. The levelsof financial control and of financial audit are also seen as insufficient.
What is more, each local government has its own systems and methods of datacollection, maintenance, and processing, thus it is impossible to get a realistic pictureof the situation.
The fieldwork identified several problems related to human resources:
• the lack of personnel;
The Ministry of Labor and Social Policy of Ukraine
Central Departmentof Social Protection
of the Population of OblastState Administration (24)
Departmentsof Social Protection
of the Population of Rayon,City and State Administration
NurseryHomes
Territorial Center forSocial Services
• divisions of homesocial assistance
• divisions of social–medicalrehabilitation
• divisions of socialevery-day-life rehabilitation
• divisions providing in-kindand cash benefits
• cheap boarding homes
Departments of SocialGuarantees and Compensations
• social benefits to the familieswith children
• targeted benefits to lowincome families
Departmentsof
Subsidies
Departmentsof
PensionAllocation
and Payment
237
• all institutions of the social sphere, in practically all regions, demonstrate a highdemand for qualified specialists (in Ukrainian educational institutions it wasonly three years ago that the specialty of Social Worker was introduced; moreover,it is taught in very few institutions: the Kyjevo-Mohylanska Academy, and Kyiv’sNational University of Culture and Arts among them);
• the salary of social workers is extremely low: the average monthly salary standsat UAH 136 (approximately USD 25);
• although working in governmental institutions, social workers do not qualify forthe status of public servant/civil servant;
• inadequate level of knowledge of the essentials of medicine and psychology arecharacteristic of social workers;
• at the same time, no professional further education programs exist for socialworkers so far;
• the lack of personnel (see above) also affects the capacity of local administrationsto monitor and evaluate the quality and effectiveness of social work and socialprograms.
... Now a few words should be said about the competence level of the rayon social workersconcerning social policy. It is possible to state that in general the key figures know about theamounts of payments determined by the legal regulations. They also have a fairly good knowledgeof the legal regulations themselves. But they don’t have information about the actual results oftheir work (except for the staff of the Territorial Center). Their work is basically impersonal andthis should not be regarded as their fault because they work with a large number of people. Whatis more, it seems as if social workers deal only with paper rather than with people.
... As for the decentralization of social protection bodies the interviewees considered that thisprocess is more convenient for the recipients but not for the careers (giving the latter moreresponsibility but limiting their opportunities). The financial aspect of the issue is quite gloomybecause under such conditions, the expenditures from the local budget will increase (and fundingis already inadequate).
SOURCE: Case study report, Shchyrets.
Many regions in Ukraine are experimenting in order to define optimal ways of provid-ing social assistance at the local level. The most advanced in terms of a consistent andcomplex approach appears to be Mykolaiv oblast. Starting from 1991, wide-ranging workhas been carried out on establishing a brand new social protection system. This modelincludes the following:
• a basic element: village-based and larger-settlement-based centers of social pro-tection (SP), as well as SP centers in remote districts of a city;
• an element at rayon (town) level, i.e. rayon departments for social protection.These assume organizational and control functions;
T H E U K R A I N I A N S O C I A L P R O T E C T I O N S Y S T E M A N D T H E M E T H O D S O F G O V E R N A N C E

238
T H E I M PA C T O F D E C E N T R A L I Z AT I O N O N S O C I A L P O L I C Y
• an element at regional level, i.e. departments for SP at regional state administrationsincluding a computer center and foster homes. These ensure the necessary organi-zational, technical and methodological pre-conditions for further development andimprovement of the system, as well as co-ordinated functioning of all its divisions.
A self-contained computerized cycle of assignment, transfer and payment of pensions,housing subsidies and social assistance benefits has been created. A corporate network forinformation exchange between departments has been launched. Re-distribution of termsof reference as well as delegation of terms of reference between different administrativelevels has been undertaken.
Hence, a system has been created in Mykolaiv in which specialization is clearly defined.A “production” section is functioning (it is a center in close connection with people), aswell as a capable management section. It is planned that the experience of Mykolaiv beapplied in other regions of Ukraine.
Four rayons in the Lviv region have been participating in the Capacity Developmentof Social Protection Authorities in the Field of the Social Assistance Delivery Projectsince December 1999. The project is financed and methodologically supported by Britain’sDepartment for International Development. Those participating relayed their optimismabout the Project.
The main goal of the project is to try out an improved model of organizational work in the fieldof providing social assistance to the most needy people using the British example. The activitiesinclude informing the population, providing reception facilities for citizens, as well as establishinga unified approach of assigning all types of assistance and subsidies on the basis of a singleapplication instead of 17 different inquiries to numerous institutions. The project also foreseesthe creation of a system to monitor the efficiency of the changes introduced and the level ofcitizens’ satisfaction.
There is a plan to create social inspectorates in the future. It will be the inspectors’ duty,having relevant status, to oversee the appropriateness of an applicant to receive social benefits andto test the applicant’s means. Every village council will have reception offices for people whoneed social protection. Post offices and savings banks will carry out the payment of benefits. Allthe information received from the reception offices will be concentrated in the rayon department(creation of the database), which will co-ordinate and control the performance of the differentactors.
SOURCE: Report on the results of Yavoriv case study.
An important constituent activity of the public institutions in the social sphere is theenvisaged feedback, i.e. dialogue between the socially unprotected population groups andpublic administration bodies. Citizens’ appeals are a form of such a dialogue (they areregulated by Article 40 of the Constitution and the Law of Ukraine On Citizens’ Appeals,1996). Article 40 of the Constitution reads: “Everyone has the right to file individual or

239
T H E U K R A I N I A N S O C I A L P R O T E C T I O N S Y S T E M A N D T H E M E T H O D S O F G O V E R N A N C E
collective petitions, or to appeal personally to bodies of state power, bodies of local self-government, and to the officials and officers of these bodies; the respective officials areobliged to consider the petitions and to provide a substantiated reply within the termestablished by law.”
The law On Citizens’ Appeals determines the following procedure and deadlines:“Appeals are addressed to bodies or office holders whose terms of reference include settlingthe problems raised. If the problem raised is beyond the terms of reference of the addresseethe appeal is forwarded to the respective body or office holder within five days. It isrequired that problems raised in the appeal be settled within one month of their reception.If it is impossible to settle the problems raised within one month, the head of the res-pective body or their deputy determines the deadline for the consideration and informsthe appellant. The overall period for settling the problems raised in the appeal may notexceed 45 days.”
At the same time, appeals are a sort of indicator of those social problems that arethe most pressing.
The main role in organizing health-related improvements is assigned to the tradeunions, which have accumulated some experience and have their own net of curative andhealth-improvement establishments. In such a way, under the supervision of the Federationof Trade Unions there are:
• more than 170 sanatoriums and rest homes;• about 100 tourist hotels, camp sites and tourist centers.
Also, over 450 rest homes and dispensaries operate directly at the enterprises, andthere are more than 10,000 camps for children with a view to improving their health.Annually, two-thirds of all resting grown-ups and 90% of children improve their healthon this basis. Given that the average cost of a place in a sanatorium for a grown-up isUAH 620, and for a child UAH 240, the payments made for this facility taking intoaccount subsidies from social funds constituted 10-30%. Almost every fifth place wasgiven free of charge by the trade unions for orphaned children, disabled children, andfamilies with many children. The Social Insurance Fund directs up to 32% of the totalincome towards health improvement.
Temporary disability benefits and benefits sick children under the age of 14 aregranted also from this Fund. The Fund also provides women with maternity benefits atthe rate of 100% of their earnings for a period of 126 calendar days and a single benefitfor the child-birth. Since 2001 the Fund is managed on a tri-partite basis, viz. repre-sentatives of the trade unions, the employers, and the state. In 1999, a sum of UAH1.35 billion (1.3% of the GDP) was spent from the Social Insurance Fund.
However, treatment centers/sanatoriums and rehabilitation institutions, both thosepublicly and privately owned, are not fully used. This is due primarily to the difficulty
240
T H E I M PA C T O F D E C E N T R A L I Z AT I O N O N S O C I A L P O L I C Y
in making payments of enterprises and workers; the latter may well need to improvetheir health, but cannot afford it. A further factor is the regular deductions by the statefrom expenditures on maintenance of the socio-cultural sphere. The rate of taxation onsanatoriums plus 20% value-added tax, which is deducted when places in sanatoriumsand health resorts are taken up, is a further burden.
As for the non-public sector, non-profit and charity activities are considerably restrictedbecause of the lack of any law on charity, and because of the high taxes imposed onhumanitarian aid. Moreover, activities of private enterprises providing social services (firstof all, in health care and education) became rather complicated when the ConstitutionalCourt of Ukraine found it unconstitutional to provide fee-charging medical and educa-tional (secondary education) services. However, it should be noted that in big cities suchas Lviv and Kyiv there is a well developed network of private enterprises, and medical andeducational institutions, which partly assume state functions in providing social services.
The Church and other religious organizations can be considered another group facili-tating the resolution of social problems by virtue of their arranging charity actions, helpingto distribute humanitarian aid, assuming the guardianship of public social institutions, etc.
The non-profit sector in Ukraine is still in the process of formation. Ukraine has oneof the lowest NGO ratios in the world: 0.02 per 10,000 people. It should also be notedthat the number of NGOs varies from region to region. Twenty percent of all NGOswork in the oblast of Kyiv whereas less than 1% of all NGOs are active in the oblasts ofSumy and Poltava. This promising instrument of social change is hardly involved inthe decentralization process.
Even so, the very fact of their activities in social policy apart from public bodies ispositive. However, the number of activities carried out by public bodies greatly exceedsthat of the non-governmental sector. It should be added that these quantities are difficultto compare.
Problems restraining the growth of the non-governmental sector are, first of all, theimperfection of the legal regulations (e.g. lack of any law on charity) on NGOs (registration,taxation), as well as bureaucratic pressure (public bodies demanding reports on theiractivities), but there are other problems as well.
Thus, for example, organizations of war veterans and the repressed are often de factodepartments of certain political parties, while issues of social protection of its membersare of a lower priority. At the same time some of the NGOs consider that their efficiencyis conditioned by helping the state in resolving social problems by means of attractingadditional funds. They are convinced that it is the state that ought to resolve socialproblems and the role of NGOs would only be to assist the state in this respect.
Frequently NGO leaders consider that the role of their organization is mostly reducedto seeking foreign donors and to applying for grants, or to organizing specific, frequentlynarrow-scope, actions (seminars, excursions, publishing activities) and to disseminatingcollected foodstuffs and humanitarian aid. Such actions as lump-sum humanitarian aid,

241
aimed at assisting low-income population groups, can be considered to be only partlyefficient. Essentially, these actions can support a low-income person, but on the otherhand, they do not resolve the very problem of low income, unemployment, or othersocial problems.
NGO leaders frequently do not work to consolidate the efforts and resources ofmany organizations working in a certain sector. They also neglect such functions of NGOslike informing the public, developing public opinion, or lobbying for the interests of thepopulation groups they represent in administrative or legislative authority bodies, nor dothey promote legislative initiatives, etc.
The lack of standards and legal support for NGOs has resulted in a number of problemsas specified below:
• The services provided are not always of good quality. Clients’ rights are oftenviolated, while the state does not have a mechanism for controlling the situation.
• There is no mechanism for interaction between governmental and non-governmentalorganizations. State social services often refuse to provide support to individualswho receive non-permanent/occasional support from NGOs. The number ofcases is increasing when local state administrations conclude agreements withNGOs although these agreements are not backed up with relevant standardsand legislation.
• The state does not motivate the establishment of non-governmental socialservices. With greater motivation, new types of services could possibly be pro-vided, and modern technologies might be introduced that could not be deve-loped by state services within the near future because of the lack of funding(e.g. social adaptation—in terms of introduction of equality and justice—forwomen, etc.).10
The draft document of “Regulation on the Activity of NGOs in the Area of SocialSecurity” aims at the creation of a legal framework for NGOs acting in the social sphere.It was developed within a TACIS project entitled Fostering the Development of a SocialAssistance Policy and Social Services Delivery in Ukraine. The document defines thegeneral principles of NGO activity in the social protection sphere, as well as the legalregulation of relations from the viewpoint of providing social services. It also guaranteesstate support. Based on their complexity and specialization, social services are subdividedinto three categories. 1) those requiring licensing; 2) those requiring specific approval;and 3) those not requiring any permission. The draft assumes that “local bodies of thestate executive power are allowed to conclude contracts in the form of an order forsome social service or other with NGOs, provided the latter have licenses or approvalson providing specific services to the defined individuals qualified for state social support.”
T H E U K R A I N I A N S O C I A L P R O T E C T I O N S Y S T E M A N D T H E M E T H O D S O F G O V E R N A N C E

242
T H E I M PA C T O F D E C E N T R A L I Z AT I O N O N S O C I A L P O L I C Y
5. FINANCING SOCIAL POLICY
Within the last ten years practically the whole burden of social protection has been puton local budgets—but with no decentralization of management and, more importantly,no decentralization of finances.
The shortcoming of the existing budgetary system, which has changed little since theSoviet regime, is the main factor accounting for the unsatisfactory financing of socialprograms, the low levels of social benefits, and the unfair distribution of the nation’smeans among territorial communities and citizens.
Paradoxically, in the post-totalitarian political systems the decentralization of powerand responsibilities can be accomplished only by the initiative and efforts of the centralgovernment (i.e. by a top-down reform), as this is the only legitimate source of powerfor the majority of the population. Thus, the administrative reform declared by thegovernment is a major prerequisite for the successful transition of social policy in Ukraine.
The legislative basis of the administrative reform was established by the adoptionof the law On Local Self-Government. This law is one of the most liberal in Europe interms of the independence of local authorities and the scope of their mandate. In reality,most of the mandates are assumed by central power institutions (local state administrationsin oblasts and rayons). Therefore, local authorities have limited mandates and a restrictedlevel of autonomy to exercise them. Putting the law On Local Self-Government into effectrequires drastic changes in the current administrative-territorial system of Ukraine.
There are four administrative-territorial levels in Ukraine. Legally, all four levels aresocial policy subjects (having responsibilities related to social policy). However, in practice,the two levels below rayon (village and town) cannot actually exercise their mandate inthis respect.
5.1 Peculiarities of Local Budget Formationand Inter-budgetary Relations
Notwithstanding that Ukraine is an independent state, its current budget system ischaracterized by a multilevel structure (see Figure 4.1). This structure consists of a generalnational level (revenues and general financing of the state), a sub-national level (oblast budgets,budgets of the Crimean Autonomous Republic, and of the cities of Kyiv and Sevastopol)and the local level (rayons, cities that are under the jurisdiction of rayon and oblast authorities,towns, villages). All the budgets except the national one refer to the local level.

243
Table 4.10Social Budget [ratio to GDP]
Expenditures 1999
Pensions 8.74
Short-term benefits from Pension Fund 0.96
Health care 3.50
Unemployment benefit 0.38
Short-term benefits 0.91
Benefit for families with children 0.64
Social benefits 0.03
Housing subsidies 1.11
“Chernobyl” Fund 1.04
Other expenditures 2.13
Total social expenditures 19.44
Revenues
Total social revenues 19.44
Payments to social protection system 9.33
• pension insurance 7.38
• medical insurance 0
• social insurance 0.87
• unemployment insurance 0.41
“Chernobyl” Fund 0.66
Other revenues 0
Revenues from national taxes 10.12
SOURCE: Labor and Social Policy in Ukraine. Kyiv: Socioinform, 2000.
The share of local budgets in the expenditure part on Social Protection of the budgetadds up to 44.4%.11
After the gaining independence the budgetary system of Ukraine changed little,although a few steps towards decentralization were made and supported by the laws Onthe Budgetary System of Ukraine (adopted in 1995) and On Local Self-Government inUkraine (1997).
Analysis of the existing legal basis and the actual functioning of the local financesystem shows contradictions. For example, under the law On Local Self-Government inUkraine local authorities have the mandate to deal with the following issues: utility
T H E U K R A I N I A N S O C I A L P R O T E C T I O N S Y S T E M A N D T H E M E T H O D S O F G O V E R N A N C E
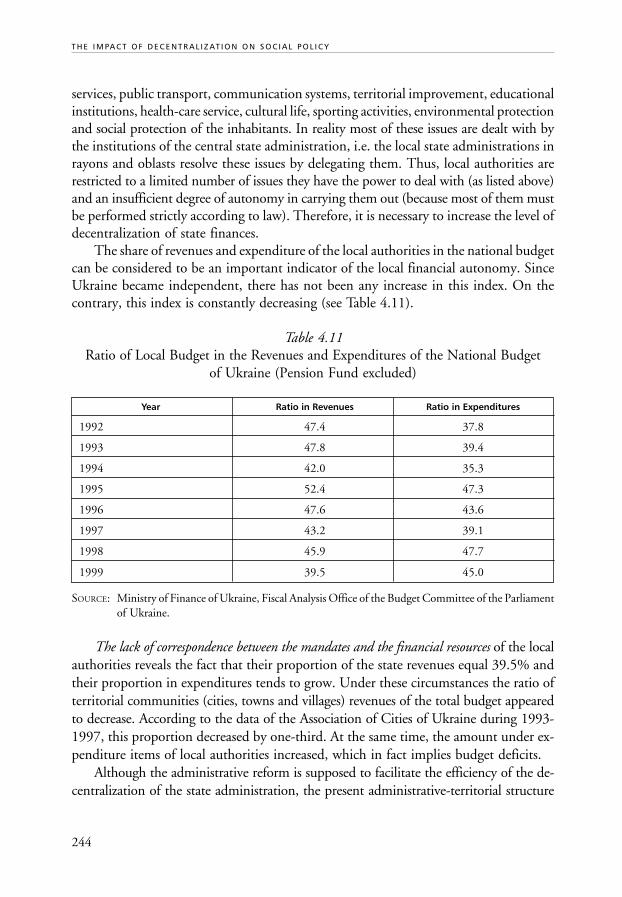
244
T H E I M PA C T O F D E C E N T R A L I Z AT I O N O N S O C I A L P O L I C Y
services, public transport, communication systems, territorial improvement, educationalinstitutions, health-care service, cultural life, sporting activities, environmental protectionand social protection of the inhabitants. In reality most of these issues are dealt with bythe institutions of the central state administration, i.e. the local state administrations inrayons and oblasts resolve these issues by delegating them. Thus, local authorities arerestricted to a limited number of issues they have the power to deal with (as listed above)and an insufficient degree of autonomy in carrying them out (because most of them mustbe performed strictly according to law). Therefore, it is necessary to increase the level ofdecentralization of state finances.
The share of revenues and expenditure of the local authorities in the national budgetcan be considered to be an important indicator of the local financial autonomy. SinceUkraine became independent, there has not been any increase in this index. On thecontrary, this index is constantly decreasing (see Table 4.11).
Table 4.11Ratio of Local Budget in the Revenues and Expenditures of the National Budget
of Ukraine (Pension Fund excluded)
Year Ratio in Revenues Ratio in Expenditures
1992 47.4 37.8
1993 47.8 39.4
1994 42.0 35.3
1995 52.4 47.3
1996 47.6 43.6
1997 43.2 39.1
1998 45.9 47.7
1999 39.5 45.0
SOURCE: Ministry of Finance of Ukraine, Fiscal Analysis Office of the Budget Committee of the Parliamentof Ukraine.
The lack of correspondence between the mandates and the financial resources of the localauthorities reveals the fact that their proportion of the state revenues equal 39.5% andtheir proportion in expenditures tends to grow. Under these circumstances the ratio ofterritorial communities (cities, towns and villages) revenues of the total budget appearedto decrease. According to the data of the Association of Cities of Ukraine during 1993-1997, this proportion decreased by one-third. At the same time, the amount under ex-penditure items of local authorities increased, which in fact implies budget deficits.
Although the administrative reform is supposed to facilitate the efficiency of the de-centralization of the state administration, the present administrative-territorial structure
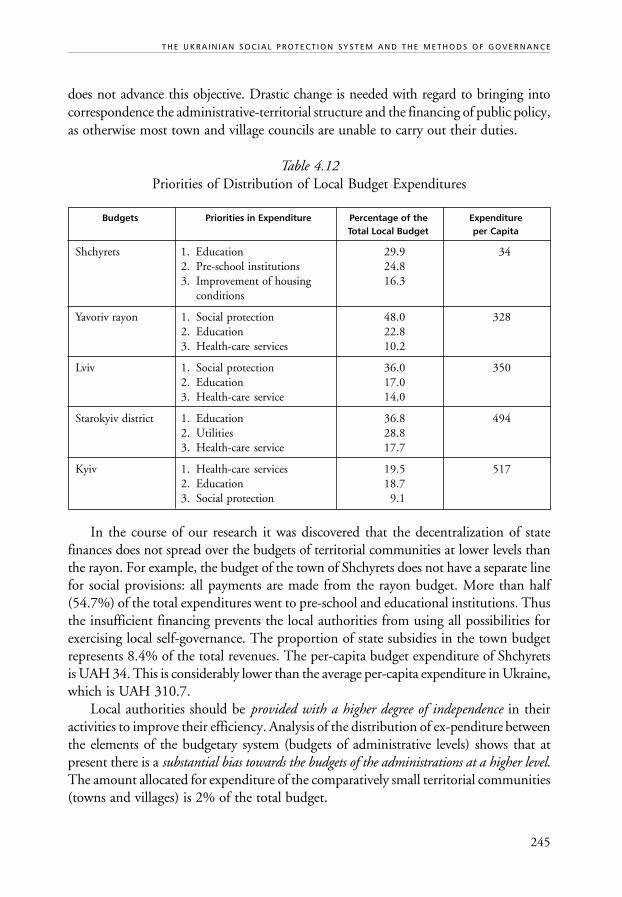
245
does not advance this objective. Drastic change is needed with regard to bringing intocorrespondence the administrative-territorial structure and the financing of public policy,as otherwise most town and village councils are unable to carry out their duties.
Table 4.12Priorities of Distribution of Local Budget Expenditures
Budgets Priorities in Expenditure Percentage of the ExpenditureTotal Local Budget per Capita
Shchyrets 1. Education 29.9 342. Pre-school institutions 24.83. Improvement of housing 16.3
conditions
Yavoriv rayon 1. Social protection 48.0 3282. Education 22.83. Health-care services 10.2
Lviv 1. Social protection 36.0 3502. Education 17.03. Health-care service 14.0
Starokyiv district 1. Education 36.8 4942. Utilities 28.83. Health-care service 17.7
Kyiv 1. Health-care services 19.5 5172. Education 18.73. Social protection 9.1
In the course of our research it was discovered that the decentralization of statefinances does not spread over the budgets of territorial communities at lower levels thanthe rayon. For example, the budget of the town of Shchyrets does not have a separate linefor social provisions: all payments are made from the rayon budget. More than half(54.7%) of the total expenditures went to pre-school and educational institutions. Thusthe insufficient financing prevents the local authorities from using all possibilities forexercising local self-governance. The proportion of state subsidies in the town budgetrepresents 8.4% of the total revenues. The per-capita budget expenditure of Shchyretsis UAH 34. This is considerably lower than the average per-capita expenditure in Ukraine,which is UAH 310.7.
Local authorities should be provided with a higher degree of independence in theiractivities to improve their efficiency. Analysis of the distribution of ex-penditure betweenthe elements of the budgetary system (budgets of administrative levels) shows that atpresent there is a substantial bias towards the budgets of the administrations at a higher level.The amount allocated for expenditure of the comparatively small territorial communities(towns and villages) is 2% of the total budget.
T H E U K R A I N I A N S O C I A L P R O T E C T I O N S Y S T E M A N D T H E M E T H O D S O F G O V E R N A N C E

246
T H E I M PA C T O F D E C E N T R A L I Z AT I O N O N S O C I A L P O L I C Y
... With regard to analyzing the current situation in the area of social policy, it is the rayon thatshould be considered as a “unit of measurement,” and not a settlement (even one as big as thetown of Shchyrets), as there are no means for it. Thus, there is no official institution in theresearched sector that would carry out social policy; there is no primary center of state organizationwhose activities would be connected with social work at least to some extent.
... Decentralization does not spread over to the settlements, or to levels lower than rayonand it seems that there will be no changes in this respect in the immediate future.
SOURCE: Case study report, Shchyrets.
The mandates of the local authorities should be reconsidered so that only thosethat perform appropriately are extended. Issues of national importance should be fullyfinanced from the state budget. Recently, the amount of money earmarked for financingpublic services, including social services from the territorial communities’ budgets, hastended to decrease (its growth was observed only at the level of rayon and oblast budgets)although this is their primary task. Thus, there is an obvious discrepancy between the de-clared increase in mandates of local authorities and the actual financial means they are givento carry out those mandates. This can be accounted for not only by the crisis of theUkrainian economy but also by the fact that the local authorities do not want to assumeadditional functions because of the lack of financial resources. Furthermore, the centralstructures do not want to lose their mandates. Sufficient funds allocated to the localauthorities for financing their mandates is a prerequisite for their effective functioning.
5.2 Revenues of Local Budgets
The revenues of the local administrations are divided into the following main groups:local revenues, earmarked revenues, regulated revenues, and transfer revenues. Local revenuesare local taxes and duties, payments for utilities, revenues from property, profits fromcommunal enterprises, etc. Earmarked revenues are a part of the total state revenue (theirconcrete percentage is determined by law) that is fixed and left in the local budgets.Regulated revenues are the revenues obtained in order to balance local budgets. It is usuallya percentage of various general national taxes, duties or payments. Transfer revenues arethe funds that come from higher-level budgets in the shape of state grants-in-aid (subsidiesand subventions).
The main sources of local revenues in Ukraine are the fixed national taxes, regulatedrevenues and transfers. Local revenues do not play an important role (see Table 4.13).The limited mandate of local authorities to fix the rate of local taxes and duties, and theincompleteness of the tax list (there is no tax on real estate and property of citizens) donot allow local revenues to become more substantial. Under these circumstances theimportant role belongs to the so-called beyond-budgetary funds (specialized funds financed
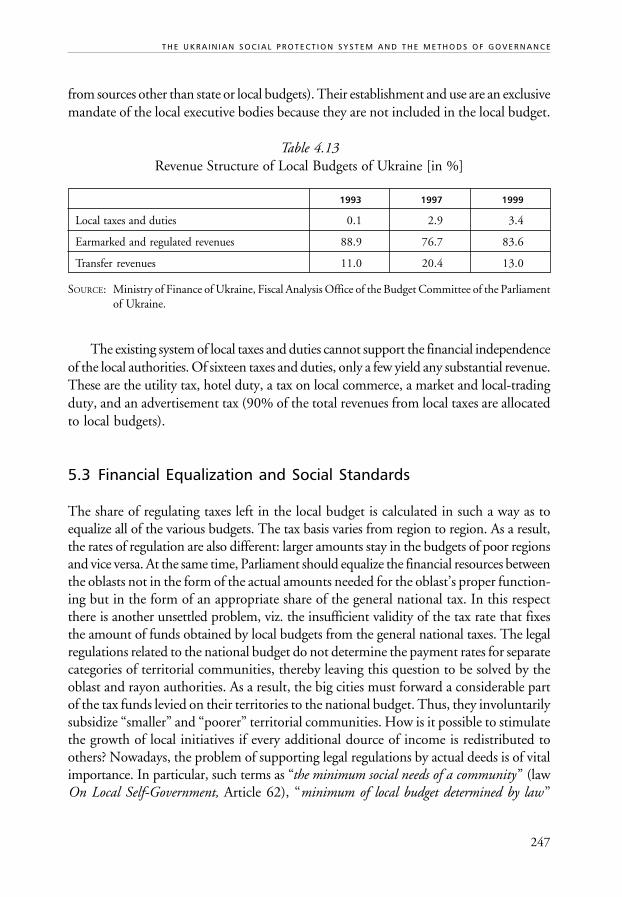
247
from sources other than state or local budgets). Their establishment and use are an exclusivemandate of the local executive bodies because they are not included in the local budget.
Table 4.13Revenue Structure of Local Budgets of Ukraine [in %]
1993 1997 1999
Local taxes and duties 0.1 2.9 3.4
Earmarked and regulated revenues 88.9 76.7 83.6
Transfer revenues 11.0 20.4 13.0
SOURCE: Ministry of Finance of Ukraine, Fiscal Analysis Office of the Budget Committee of the Parliamentof Ukraine.
The existing system of local taxes and duties cannot support the financial independenceof the local authorities. Of sixteen taxes and duties, only a few yield any substantial revenue.These are the utility tax, hotel duty, a tax on local commerce, a market and local-tradingduty, and an advertisement tax (90% of the total revenues from local taxes are allocatedto local budgets).
5.3 Financial Equalization and Social Standards
The share of regulating taxes left in the local budget is calculated in such a way as toequalize all of the various budgets. The tax basis varies from region to region. As a result,the rates of regulation are also different: larger amounts stay in the budgets of poor regionsand vice versa. At the same time, Parliament should equalize the financial resources betweenthe oblasts not in the form of the actual amounts needed for the oblast’s proper function-ing but in the form of an appropriate share of the general national tax. In this respectthere is another unsettled problem, viz. the insufficient validity of the tax rate that fixesthe amount of funds obtained by local budgets from the general national taxes. The legalregulations related to the national budget do not determine the payment rates for separatecategories of territorial communities, thereby leaving this question to be solved by theoblast and rayon authorities. As a result, the big cities must forward a considerable partof the tax funds levied on their territories to the national budget. Thus, they involuntarilysubsidize “smaller” and “poorer” territorial communities. How is it possible to stimulatethe growth of local initiatives if every additional dource of income is redistributed toothers? Nowadays, the problem of supporting legal regulations by actual deeds is of vitalimportance. In particular, such terms as “the minimum social needs of a community” (lawOn Local Self-Government, Article 62), “minimum of local budget determined by law”
T H E U K R A I N I A N S O C I A L P R O T E C T I O N S Y S T E M A N D T H E M E T H O D S O F G O V E R N A N C E
248
T H E I M PA C T O F D E C E N T R A L I Z AT I O N O N S O C I A L P O L I C Y
(Article 63), and the constitutional norm that “...a budgetary system is established on thebasis of fair and unbiased distribution of social riches between the citizens and territorialcommunities,” need to be supported. Only when these terms receive their actual meaningwill there be a possibility to establish a minimum standard of living in Ukrainian cities.Once the minimum of the social needs required to meet social standards has been defined,it will help determine the formula necessary to calculate the budgetary supply per citizendepending on the conditions particular to a given settlement.
As was presented in the case studies, only 18% of all taxes levied on the city of Lvivgo to the local budget. The problem lies in the mechanism of horizontal leveling of localbudgets. The budget of Lviv is part of the oblast budget determined by the Oblast Council.Under these circumstances Lviv becomes the donor for other settlements of the oblast.Because of this procedure the city does not receive enough funds to carry out the activitiesneeded to facilitate its development. In due course, this leads to a deterioration in thecity’s infrastructure and the quality of services provided by executive bodies of the CityCouncil. This also leads to a confrontation between the Lviv City Council and the LvivOblast Council: the former finds the procedure of horizontal leveling of local budgetsto be non-transparent and discriminating.
According to a number of indexes, the expenditures from Lviv city’s budget (inparticular, on social protection) are less than the expenditures of some other local budgetsin the oblast (although these are financed from the funds coming from the city). Forinstance, 37% of all taxes collected on the territory of Kyiv’s Starokyiv district go to itsdistrict local budget. The rest belongs to the city budget. Such a distribution witnessesthe lack of system and clarity of the procedures utilized to calculate the amounts to goto higher level budgets (the per-capita expenditures from the budget of Starokyiv districtamount to UAH 494, and from the Lviv budget—UAH 350).
Based on details from the Association of the Cities of Ukraine, 35% of the taxescollected remain in those cities whose population is over 500,000; 40-50% stays intowns with a population of 200,000 to 500,000; 45-70% stays in towns with 100,000 to200,000 people, 50% stays in towns with a population of 50,000 to 100,000, and almost75% stays in settlements with less than 50,000 people.
Up till now, no defined proportion of state funds has been earmarked for distributionthrough the mechanism of regulated taxes in Ukraine. It should be emphasized thatthe stability of the sources of revenue is very important to local authorities; i.e. a definiteknowledge of the earmarked tax list and of the rates from the regulated revenues.
Only in the formulation of Kyiv city’s budget are the standards of revenues fromthe general national taxes and duties stable under the law On the Capital of Ukraine:Kyiv. This knowledge facilitates the forecasting of the budget revenues and enables thecity to plan its programs in advance.
Transfer revenues represent one of the most important revenue items of the budgetsof levels lower than the oblast. The lower the level of the local budget, the higher itsshare. Although this proportion is quite normal, it is difficult to consider this situation as
249
normal when almost two-thirds of the revenues of most villages and towns are financedby transfer revenues from the budgets of higher levels. This makes them too dependenton external financing. In view of this, it can be stated that the system of budget transfersin Ukraine is by no means perfect since it does not provide stability for the local budgets.Its main fault, however, is the lack of definiteness of the tasks and the revenues betweenthe levels of power.
Budget transfers in Ukraine are of two kinds: subsidies (general transfers) and subventions.Subventions (on education and payment for energy resources) were introduced in 1999.In 1999 subsidies from the national budget amounted to over UAH 2 billion and therevenues of the state budget from Kyiv city totaled UAH 382,216,000; subventions oneducation totaled UAH 341,167,700; subventions for energy resources payment totaledUAH 5,2 billion. Thus, the ratio of the general and specific transfers is 23:73, therebyproving the imperfection of the transfer system: for the most part, such transfers are spe-cific ones that are provided to make up for a certain part of local budget expenditures.
In 1999 the share of subsidies in total revenues of the oblast budgets ranged from0.1% (Poltava oblast) to 49.8% (Volyn and Ternopil oblasts). The average share of sub-sidies provided to the local budgets from the state budget (without targeted subventions)totaled 13%.
Development of the transfer system as an important source of local authority revenuescontinues to be a vital problem. The practice of transfer provision in modern Ukraineis characterized by the following features:
• an absence of any standard definition of the main elements of the transferprovision procedure;
• the formation of the transfer fund as a total difference between the standard bud-getary expenditures and the forecast revenues of the total oblast budgets;
• the availability of only one criterion for its distribution, i.e. the difference betweenthe standard budgetary expenditures and the forecast expenditures accordingto the previous year’s data on revenues from the correspondent administrative-territorial units;
• a multilevel procedure for transfer funds distribution and a lack of direct transfersfrom the national budget to the territorial communities of different levels. As aresult the process of subsidy provision is not transparent;
• an absence of motivation in the territorial communities to broaden their revenuebasis because the distribution of subsidies was made depending on the revenuesfor the previous year; the bigger the revenues, the smaller the amount of subsidiesallocated;
• elements of leveling distribution because the revenue potential of the regionsand separate territorial communities accompanied by the attempt to fully coverthe budget deficit was not considered;
• unsolved problems of horizontal leveling among the territorial communities.
T H E U K R A I N I A N S O C I A L P R O T E C T I O N S Y S T E M A N D T H E M E T H O D S O F G O V E R N A N C E

250
T H E I M PA C T O F D E C E N T R A L I Z AT I O N O N S O C I A L P O L I C Y
One way to resolve the problem of transfer distribution would be to establish definiteand simple methods for determining the financial needs and the financial potential. Themost suitable approach for this is the formula approach as this would allow for the dif-ference between the funding needs and the revenues of the various territorial communities.
A specific feature of local expenditure is that it usually creates additional sourcesfor municipal improvement and the improvement of citizens’ conditions. The minimumsocial product should be provided by the state and the rest by local authorities. Normally,the financing of social provision is within the mandate of the central government, whilethe responsibility for managing social programs and for defining the (local) recipientsare delegated to the local authorities. In Ukraine, however, determination of the criteriaof eligibility for social assistance as well as the minimum levels of expenditure on socialservices, is carried out by the state. Local authorities are those that actually provide thefinancial resources from their budgets. Given that regional income differs throughoutthe country, the funding of social programs varies from one region to another.
It would therefore be necessary to redistribute the budget income between the centraland the local budgets and to establish a means of regulating inter-budget relations towardsdecentralizing budget finances.
6. CONCLUSIONS AND POLICY RECOMMENDATIONS
6.1 Financial and Institutional Arrangements
Unlike in other countries, most of Ukraine’s expenditure on social protection can be foundin the local budgets. This does not include pensions and disability benefits. In this respect,the social protection system appears to be rather decentralized. On the other hand, thedistribution of national taxes is not transparent; there is no regular formula for determiningthe share of national taxes to be left with the local budgets. The amount of cash allocatedto local budgets is determined annually under the law On the National Budget of Ukraine.It is self-evident that this does not allow the efficient use of resources nor does it allowlong-term planning. As it is, the inter-budgetary relation system is quite centralized andit contradicts the legal principles regulating local self-governance. Furthermore, the currentsystem of local taxes and duties is unable to support the independence of the local author-ities. Territorial communities are hardly motivated to increase their revenue base as thedistribution of transfers depends on the budget receipts of the previous year: i.e. thebigger the receipts, the smaller the allocated transfers will be. Local authorities, in particularthose at the two lowest levels (town and village), are restricted in their financial activities.
When analyzing the actual distribution of expenditures between the budgetary unitsone has to realize that currently there is a substantial bias in the actual distribution of

251
tasks towards the budgets at higher levels of the administration. In particular, the budgetexpenditure share allocated to relatively small territorial communities comprises about2% of the consolidated budget. Thus, there is a discrepancy between the declared increasein the mandates of local self-governments and their actual financial situation, whichmakes the decentralization of social policy almost impossible.
The most urgent tasks in reforming local self-government and inter-budgetary relationsshould be:
• to reform the system of local state administrations in oblasts and rayons since thepresent system often reveals duplication of duties with local self-governments;
• to distribute functions and mandates in the area of public service provision betweenthe central and local executive bodies and between the local authorities of dif-ferent levels;
• to reform inter-budgetary relations, which could help to fix the expendituresand revenues between the levels of the budgetary system and would bring theminto line with the mandates of executive bodies and local authorities;
• to introduce obligatory spending by local self-governments as well as a set ofminimum public social standards that would provide the basis for equal accessof the citizens of different regions, villages and towns to public services;
• to decrease the ratio of general national expenditures to higher level budgetswith the aim of increasing the financial potential of local budgets; this would, indue course, facilitate the social development of the territorial communities;
• to clearly distinguish between the given mandates and the delegated ones of localstate bodies and local self-governments on every territorial level;
• to introduce a formula and a transparent approach to budget transfers, and toincrease the provision of targeted subvention;
• to transfer the mandates over the financing of social programs from local budgetsto state budgets. Currently, housing subsidies, targeted benefits to low-incomefamilies, and child benefits are granted from local budgets. The system of inter-budgetary transfers lacks transparency and effectiveness, which often bringsregions into different conditions of social service financing.
If all these measures were to be carried out, it would lead to the liquidation of oblastbudgets and, in turn, this would lead to an increase in the importance of the budgets ofterritorial communities, that are closer to the public service recipients.
A further factor is that if the laws On Communal Property and On Local Taxes andDuties were to be adopted it would facilitate growth in local budget revenues.
It is of paramount importance that control over local budget expenditures on socialbenefits and assistance be increased. Naturally, this would be the role of local governments.At present, there is no systematic control over local budget expenditures and if there arecases of misuse there are no legal sanctions that can be taken.
T H E U K R A I N I A N S O C I A L P R O T E C T I O N S Y S T E M A N D T H E M E T H O D S O F G O V E R N A N C E

252
T H E I M PA C T O F D E C E N T R A L I Z AT I O N O N S O C I A L P O L I C Y
6.2 Service Delivery
With regard to service delivery, in order to improve the work of Rayon and Oblast SocialProtection Departments the most important tasks would be:
• the creation of social protection departments in villages (at present such depart-ments exist only in Mykolaiv Oblast);
• the provision of comprehensive assistance to applicants for different types ofbenefits at a single place (this would avoid the need for people to visit severalinstitutions in order to apply for benefits);
• the introduction of a single (unified) database on social assistance, and improve-ment of the reporting procedure (by utilizing a unified format for reports).
Most of the social protection actions as presented in the research merely aim at meetingthe most pressing needs of the socially unprotected population groups, but not at creatingand developing infrastructure. In particular, no steps are taken to prevent deviant behaviorof teenagers or to improve the environment for young people; what we see, therefore, is astruggle to cope with the consequences but without addressing the underlying causes.Such an approach to resolving social problems is simplistic and renders social policynext to inefficient from a strategic perspective.
Thus, the top-priority tasks of Ukraine’s social policy should be:
• to maintain the existing infrastructure while developing a new one;• to improve the quality of the services;• to increase their quantitative indicators (which is a rather complicated task taking
into account a permanent lack of funds in the national and local budgets).
In relation to reforming the pension system, among the principal objectives should be:
• to reorganize the solidarity system and introduce greater correspondence betweenthe pension amount and the period of employment;
• to raise the retirement age and the general period of employment;• to introduce a fully integrated and automated accounting system;• to liquidate the most preferential pensions;• to introduce the necessary legislative and standardized framework for creating
an obligatory accumulating system;• to introduce the necessary legislative and standardized framework as a means of
facilitating the operation of voluntary non-governmental pension funds;• to decrease contributions to the Pension Fund, which would help eliminate
motivation for hiding income, avoiding job creation, and decreasing salarylevels.

253
It is necessary to liquidate all exemptions that entitle certain segments of thepopulation to receive some services at a very low price or even for free. It would be astep towards social equality (as most exemptions depend either on the status of thepotential recipient or on political motives). Furthermore, this would release funds forthe benefit of those who are really in need.
Another complicated issue emerged in relation to cash benefits. As this analysis ofthe Ukrainian social protection legal regulations shows, in terms of social servicescovering different categories of the population, and in terms of the amount of socialpayments, Ukraine is among those countries which apply well targeted benefits. Intheory, the social payments are generally calculated on the basis of the minimum salary.But in reality most of the laws are not put into practice, and it is the state that violatesthem. The amounts of actual payments are determined by the Decrees of the Cabinetof Ministers and, on average, are just 10% of those stated in the legal regulations.
Benefits are granted according to various criteria, such as disability, old age, income,children under care, or political considerations. The last of these covers additional benefitsgranted to certain privileged groups, e.g. war veterans. Thus, the current social protectionsystem supports specific groups that are quite well-off while it often neglects those whoare in real need.
A single method ought to be introduced to determine who is really in need. Thesubsistence minimum would be the best poverty threshold for different kinds of benefits.Bearing in mind that 47% of the Ukrainian economy is gray, it is next to impossible toapply reliable means testing. One of the ways of improving the situation and discouragingfurther moves towards the gray economy might be to relieve the tax burden on the Salaryand Wage Fund at the expense of reviewing the rates of payments to social funds suchas pension, social insurance, employment and disability welfare funds. This could beaccomplished by stepping up the control over administrative expenditures of the fundsand might encourage the enterprises to increase the official salaries/wages of their employees.
There is significant potential for NGO involvement in some areas of social servicedelivery. Among the problems restraining the growth of the non-governmental sector are,first of all, the imperfection of the legal regulations on NGOs (registration, taxation, lackof laws relating to charity), as well as the pressure resulting from bureaucratic procedures.
T H E U K R A I N I A N S O C I A L P R O T E C T I O N S Y S T E M A N D T H E M E T H O D S O F G O V E R N A N C E
254
T H E I M PA C T O F D E C E N T R A L I Z AT I O N O N S O C I A L P O L I C Y
NOTES
1 Hansen, J. and D. Hook (1999) Economic Growth on the Basis of Justice, Kyiv: WorldBank. p. 2.
2 Ukrainian Regional Newsletter (2001) No. 22. p. 19.3 Living Standards of the Ukrainian Population in 1999 (2000) Kyiv: Resource Center
of the Labor and Social Policy Ministry of Ukraine. pp. 1-3.4 Rosenberg, Dorothy, Poverty Reduction Strategy for Ukraine.
http:// www.undp.com.ua.5 Ukrainian Society: Monitoring. Informational and Analytical Materials (2000) Kyiv:
Institute of Sociology.6 Kharchenko, N. (2000) Comparison of Methodological Approaches to Poverty
Evaluation, Sociology: Theory, Methods, Marketing, No. 3. p. 95.7 Hansen, J. and D. Hook (1999) Economic Growth on the Basis of Justice, Kyiv: World
Bank. p. 2.8 Ukraine: Progress in the 21st Century, Strategy of Economic and Social Development
for the Period of 2000-2004, Presidential Speech to the Parliament of Ukraine2000. Governmental Courier, 23 February 2000, No. 34. pp. 5-12.
9 Social Sphere in the Transition Period (1994) World Bank Analysis, Kyiv: OsnovyPublishing House. p. 92.
10 Semygina, T., Legislation-based Limitation Imposed on NGOs in the Sector of SocialServices.
11 Budget and Fiscal Review (2000) Annual Report, Kyiv: Fiscal Analysis Office of theVerkhovna Rada Budget Committee.

255
BIBLIOGRAPHY
Documents and Statistics
Concept of State Regional Policy of Ukraine (Kontseptsija derzhavnoyi regionalnoyipolityky Ukrainy) (2000) Kyiv.
Decree of the Cabinet of Ministers of Ukraine No. 89 On Granting Subsidies to Citizensfor Compensation Expenditures for Payment for Housing-communal Services, Purchaseof Fluid Gas and Solid Fuel (1995).
Decree of the Cabinet of Ministers of Ukraine On Calculation of the Amount of TemporaryDisability Benefit (1998).
Decree of the Cabinet of Ministers of 02.01.2000, No. 211.Insurance Legislation of Ukraine (Zakonodavstvo Ukrainy pro strahuvannia), Kyiv: Atika,
1999, p. 454.Labor Code of Ukraine (Kodeks zakoniv pro pratsiu Ukrainy), Kyiv: Urinkom Inter,
1999, p. 1040.Law On Local Self-government of Ukraine (1997).Law On Pension Security (1991).Law On Public Benefits to Families with Children (1992).Law On Status and Social Protection of Chernobyl Disaster Victims.Law On the Budgetary System of Ukraine (1995).Law On the Citizens’ Employment (1991).Legislation Regulations of Ukraine On Common Obligatory State Social Insurance (1998).National Statistical Committee, Statistical Yearbook, Ukraine in Figures in 1999, Kyiv,
2000.Provision of the Cabinet of Ministers of Ukraine No. 1156 On New Amount of Expendi-
tures for Payment for Housing-Communal Services, Purchase of Fluid Gas and SolidFuel in Cases of Granting Housing Subsidies (1998).
Ukraine: Into the 21st Century. Economic and social development strategy for 2000-2004,Address of the President of Ukraine to the Ukrainian Parliament. 2000. UryadovyiCourier, 23 February 2000, No. 34, p. 5.
Literature
Chemerys, A. (ed.) (1999) Local Self-government (Mistseve samovriaduvannia), Lviv:Liga-press. p. 320.
Employment and Labour Market (Zayniatist’ ta rynok pratsi), (1999) Kyiv: NAS ofUkraine. p. 240.
T H E U K R A I N I A N S O C I A L P R O T E C T I O N S Y S T E M A N D T H E M E T H O D S O F G O V E R N A N C E
256
T H E I M PA C T O F D E C E N T R A L I Z AT I O N O N S O C I A L P O L I C Y
Epifanov, A., I. Salo and I. Diakonova (1999) Budget and Financial Policy of Ukraine(Biudzet i finansova polityka Ukrainy) Kyiv: Naukova dumka. p. 302.
Kazanova, N. (1998) Model of Financial Provision of the Social Sphere, Finansy Ukrainy,No. 6.
Kharchenko N. (2000) Comparison of Methodological Approaches to Poverty Evaluation,Sociology: Theory, Methods, Marketing, No. 3.
Kimball, J.D. (ed.) (1999) The Transfer of Power Decentralisation in Central and EasternEurope. Budapest: ILO.
Krasiuk G. (1997) System of Social Protection of the Population under the Conditionsof the Transition of Ukrainian Society: Actual Situation and Development Prospects,Sotsialnyj zahyst, No. 4.
Kravchenko, B. (1997) Administrative Reform in Ukraine. Setting the Agenda. Budapest:OSI. p. 20.
Kravchenko, V. (1999) Local Finance of Ukraine (Mistsevi finansy Ukrainy). Kyiv:Znannia. p. 487.
Labour and Social Policy in Ukraine (Pratsia ta sotsial’na polityka v Ukraini) (2000) Kyiv:Sots-inform. p. 127.
Living Standards of the Ukrainian Population in 1999 (2000). Kyiv: Resource Center ofthe Labor and Social Policy Ministry of Ukraine.
Melnyk, S. and S. Krynytsia (2000) On the Formation of Local Budgets. EkonomikaUkrainy, No. 1.
Mikrukova, O. (1999) Ukrainian Social Protection System: Structure and Reforms—Im-proving Relations between the Administration and the Public. Sofia: NISPAcee. p. 420.
Public Administration in Ukraine: Centralisation and Decentralisation (Derzhavne uprav-linnia v Ukraini: tsentralizatsiya i detsentralizatsiya) (1997) Kyiv: UAPA Publishers.p. 448.
Romaniuk, O. (1999) Reforming the Social Protection System is the Most Important Taskin the Process of Market Transformation—Modern Economic Theory and Public Finance(Suchasna ekonomichna teoriya i derzhavni finansy) Kyiv: UAPA Publishers. p.423.
Sadova, I. (1999) Regional Social Policy: Essence, Problems and Development Prospectsin Ukraine, Ukraina: Aspekty pratsi, No. 4., Nos. 14-17.
Skurativsky V., O. Paliy and E. Libanova (1997) Social Policy (Sotsialna polityka) Kyiv:UAPA Publishers. p. 360.
The Ukrainian Challenge: Reforming the Labour Market and Social Policy (1994) Budapest:ILO. p. 314.
Ukraine. Social Sphere in the Transition Period (Ukraina. Sotsialna sfera u perehidnyperiod) (1994) Kyiv: Osnovy. p. 247.
Ukrainian Society: Monitoring. Informational and Analytical Materials (2000) Kyiv:Institute of Sociology. p. 390.

257
T H E U K R A I N I A N S O C I A L P R O T E C T I O N S Y S T E M A N D T H E M E T H O D S O F G O V E R N A N C E
Vegera, S. (1999) On the Conditions of the Disabled in Ukraine and Priority Directions inSocial Protection (Pro stanovyshche invalidiv v Ukraini ta priorytetni napriamy ihsotsial’nogo zahystu) Kyiv: Sotsinform. p. 124.
Women Worker’s Rights in Ukraine (1999) Kyiv: Ukrainian Institute for Social Research.p. 159.
Reports, Seminar Papers
Budget and Fiscal Review (2000) Annual Report, Kyiv: Fiscal Analysis Office of theVerkhovna Rada Budget Committee.
Geets, V. and V. Timofeev (2000) Macroeconomic Situation in Ukraine and its Impacton the Labour Market, Lecture presented at the seminar “Labour Market of Ukraine:Condition and Ways of Reforming,” Kyiv, 16-18 February.
Hansen, J. and V. Nanivska (eds) (1999) Economic Growth with Equity: Ukrainian Pers-pectives, Document No. 407, Kyiv: World Bank.
Hansen, J. and D. Hook (eds) (1999) Economic Growth with Equity, Document No.408, Kyiv: World Bank.
How to Provide for One’s Own Old Age: Development Prospects of Non-state PensionInsurance in Ukraine: Round-table Materials, 22 November 1999, Kyiv: UkrainianIndependent Centre for Political Researches. p. 42.
Ivanova N. (2000) Improvement of Social Insurance against Unemployment and of theFinancial System of Social Protection of the Unemployed, Lecture presented at theseminar “Labour Market of Ukraine: Condition and Ways of Reforming,” Kyiv,16-18 February.
Libanova, E. (2000) Managing Labour Market in the Context of the Overall SocialPolicy, Lecture presented at the seminar “Labour Market of Ukraine: Conditionand Ways of Reforming,” Kyiv, 16-18 February.
Osovyj, G. (2000) Improvement of Social Unemployment Insurance and of the FinancialSystem of Social Protection of the Employees, Lecture presented at the seminar“Labour Market of Ukraine: Condition and Ways of Reforming,” Kyiv, 16-18February.
Rosenberg, Doroty J, (2000) Poverty Reduction Strategy for Ukraine.http://www.undp.com.ua
Sahan’ I. (2000) Current Condition of the Labour Market and its Development Prospects.Lecture presented at the seminar “Labour Market of Ukraine: Condition and Waysof Reforming,” Kyiv, 16-18 February.
Social Budgeting in Ukraine: Report of the Joint Group of Ministry of Labour and SocialPolicy of the Ukraine and International Labour Bureau (1998) Kyiv: UNDP, 1998.
Ukraine Human Development Report (2000) Kyiv: UNDP. p. 94.
258
T H E I M PA C T O F D E C E N T R A L I Z AT I O N O N S O C I A L P O L I C Y
ANNEX 1.
Research Methodology
The methodology employed covered:
• analysis of the basic social, economic and demographic indicators of Ukrainiansociety;
• analysis of the legal regulations, and of the statistical and financial reports;• analysis of data received through qualitative studies (viz., interviewing agents
of social policy implementation and social service provision).
The studies were carried out at both national and micro levels covering all administ-rative levels. The following five selected sectors were studied: village of Shchyrets (Pus-tomyty Rayon, Lviv Oblast); Yavoriv Rayon (Lviv Oblast), City of Lviv; Starokyiv Districtof Kyiv; City of Kyiv.
All the case studies were done in the period July-October 2000.This report summarizes the results of the sector-focused case studies and of the analysis
of the relevant legal regulations and the quantitative data at the national level.

259
T H E U K R A I N I A N S O C I A L P R O T E C T I O N S Y S T E M A N D T H E M E T H O D S O F G O V E R N A N C E
ANNEX 2.
The Pension System
Pensions are considered to be one of the most important means of income protection.The main part of the social protection system in Ukraine is pension provision, coveringover 14.5 million people (29% of the population). In the year 2000, expenditure onpensions totaled UAH 16.5 million, representing 11% of the Gross National Product.Ukraine’s Pension Fund manages the financial aspect of pension provision (the Fundhas 733 regional branches).
Between 1991 and 1999, over 20 laws were accepted together with several decreesof the President of Ukraine; these act as a means of coordinating the pension provisionof certain groups of the population. These groups are mostly categorized on the basis ofprofessional criteria. These laws and decrees were a sign of retreat from the previouslyaccepted and declared pension policy principles according to which certain groups receivedsubstantially higher pensions despite the fact that during their working years they hadpaid the same amount to the Pension Fund. It is doubtful whether there is another countryin the world where the maximum pension is 55-60 times greater than the minimumpension. This means that the principle of insurance in the sphere of pension provisionis not implemented to the full extent; moreover it is by no means fully objective. Consi-derable amounts of payments—that are not connected with the labor contribution anddo not depend on the funding of pension provision—are carried out at the expense ofthe insurance investments.
... In terms of my obligations, most of my working time is occupied by pension provision problems.The reason for this is the seventeen Pension Legal Regulations of Ukraine, with each law posingits own problems. Unfortunately the Ukrainian Parliament adopts legal regulations that will notwork. Most of the legal regulations cover preferential pension provision. This means that there isa specific regulation for every population group. There are regulations relating to the Chernobyldisaster victims, to members of parliament, to prosecutors, and to public servants... There is alegal regulation for every person that receives benefits. Besides, there are regulations that onlyregulate the benefits. And it is all very complicated. There is no other country in the world thathas as many pension legal regulations as Ukraine. Very often the regulations are adopted withoutany financial basis. It is merely a game, a performance played by the MPs in order to seem importantto their electorate.
SOURCE: From a case study report, Kyiv.

260
T H E I M PA C T O F D E C E N T R A L I Z AT I O N O N S O C I A L P O L I C Y
Table 4A.1Indicators of Maximum and High Pensions that are Designated
on the Basis of the Current Legislation of Ukraine,Indicators of Average Wages/Income, and the Margin of Low Income [UAH]
Pensioners Maximum (High) Average Margin of(According to Ukrainian Legislation) Pension Wages/Income Low Income
(January 2000) (January 2000) (January 2000)
1 “Pension Provision”
• general 74.70 180.97 118.30
• general for war participants 83.01 180.97 118.30
• general for participants 99.63 180.97 118.30of battle actions
• employees of list No.1 99.60 180.97 118.30
• employees according to 107.91 180.97 118.30list No.1—war participants
• employees according to 124.53 180.97 118.30list No.1—participantsof battle actions
2 “On Public Service”* 1,400.00 180.97 118.30
3 “On the Prosecutor’s Office”* 1,700.00 180.97 118.30
4 “Disabled as a result of the 1,160.99 180.97 118.30Chernobyl disaster.”
5 “On the Status of the Deputy”* 1,305.00 180.97 118.30
* The data is selective because the legislation of Ukraine does not limit pension size.
... chaos in pension provision is “beneficial.” For example, one of the heads of Parliament, who isdisabled as a result of the Chernobyl disaster receives a huge pension (UAH 1,800). At the sametime he performs quite a difficult job. So, I ask myself: If he is disabled then he cannot work andif he can work then why does he receive this pension?
SOURCE: From an interview with a high-level member of the Federation Board of Ukrainian Trade Unions.
High pension contributions together with the low pension payments led to companiesand their employees opting for the gray economy in order to avoid paying taxes and pensioncontributions. According to official data the working population in Ukraine comprises22.4 million, but only 16 million of them regularly pay contributions to the country’sPension Fund. This became the principal reason for the decrease in the Pension Fund’sfinances.
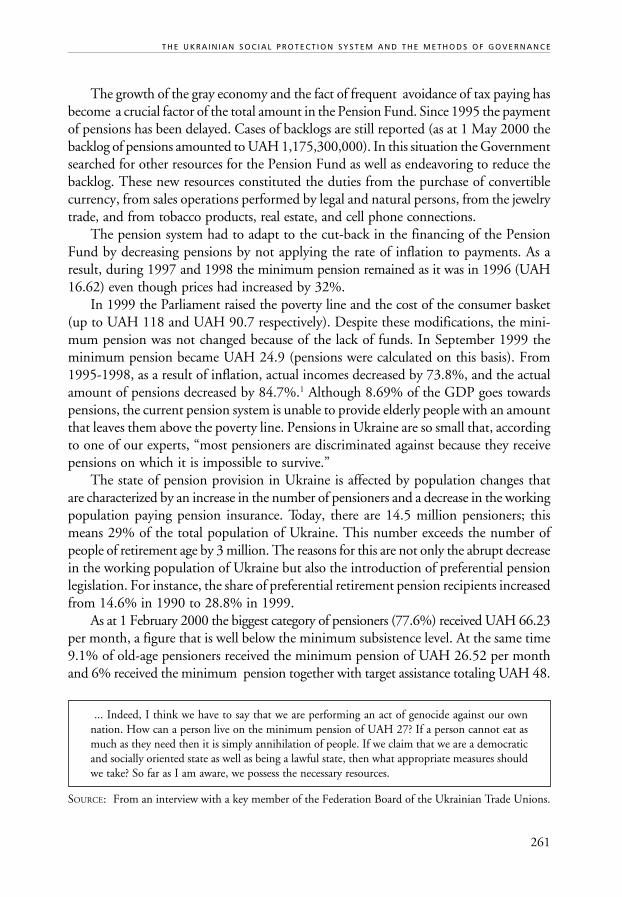
261
The growth of the gray economy and the fact of frequent avoidance of tax paying hasbecome a crucial factor of the total amount in the Pension Fund. Since 1995 the paymentof pensions has been delayed. Cases of backlogs are still reported (as at 1 May 2000 thebacklog of pensions amounted to UAH 1,175,300,000). In this situation the Governmentsearched for other resources for the Pension Fund as well as endeavoring to reduce thebacklog. These new resources constituted the duties from the purchase of convertiblecurrency, from sales operations performed by legal and natural persons, from the jewelrytrade, and from tobacco products, real estate, and cell phone connections.
The pension system had to adapt to the cut-back in the financing of the PensionFund by decreasing pensions by not applying the rate of inflation to payments. As aresult, during 1997 and 1998 the minimum pension remained as it was in 1996 (UAH16.62) even though prices had increased by 32%.
In 1999 the Parliament raised the poverty line and the cost of the consumer basket(up to UAH 118 and UAH 90.7 respectively). Despite these modifications, the mini-mum pension was not changed because of the lack of funds. In September 1999 theminimum pension became UAH 24.9 (pensions were calculated on this basis). From1995-1998, as a result of inflation, actual incomes decreased by 73.8%, and the actualamount of pensions decreased by 84.7%.1 Although 8.69% of the GDP goes towardspensions, the current pension system is unable to provide elderly people with an amountthat leaves them above the poverty line. Pensions in Ukraine are so small that, accordingto one of our experts, “most pensioners are discriminated against because they receivepensions on which it is impossible to survive.”
The state of pension provision in Ukraine is affected by population changes thatare characterized by an increase in the number of pensioners and a decrease in the workingpopulation paying pension insurance. Today, there are 14.5 million pensioners; thismeans 29% of the total population of Ukraine. This number exceeds the number ofpeople of retirement age by 3 million. The reasons for this are not only the abrupt decreasein the working population of Ukraine but also the introduction of preferential pensionlegislation. For instance, the share of preferential retirement pension recipients increasedfrom 14.6% in 1990 to 28.8% in 1999.
As at 1 February 2000 the biggest category of pensioners (77.6%) received UAH 66.23per month, a figure that is well below the minimum subsistence level. At the same time9.1% of old-age pensioners received the minimum pension of UAH 26.52 per monthand 6% received the minimum pension together with target assistance totaling UAH 48.
... Indeed, I think we have to say that we are performing an act of genocide against our ownnation. How can a person live on the minimum pension of UAH 27? If a person cannot eat asmuch as they need then it is simply annihilation of people. If we claim that we are a democraticand socially oriented state as well as being a lawful state, then what appropriate measures shouldwe take? So far as I am aware, we possess the necessary resources.
SOURCE: From an interview with a key member of the Federation Board of the Ukrainian Trade Unions.
T H E U K R A I N I A N S O C I A L P R O T E C T I O N S Y S T E M A N D T H E M E T H O D S O F G O V E R N A N C E
262
T H E I M PA C T O F D E C E N T R A L I Z AT I O N O N S O C I A L P O L I C Y
In 1998 the process of reforming the pension provision system started in Ukraine.The President’s Decree On Main Trends of Social Policy for the Period till 2004 adoptedon 24 May 2000 defines the introduction of a three-tier system of pension provision:
• the first level is a solidarity system of pensions paid from current revenues ofthe Pension Fund;
• the second level is a system of accumulating individual pension accounts withinthe obligatory pension insurance scheme;
• the third level is the system of non-state pension insurance from the voluntarypension payments of citizens.
The system is based on non-state pension funds and the solidarity system.In 1999-2000, based on the above-mentioned decree, various measures were taken
to introduce an automated personal account system of insurance payments to the PensionFund. This account system of obligatory public pension insurance was introducedthroughout Ukraine during the year 2000.
Another important problem related to pensions is the present system of pensionsubsidies that remained from Soviet times and that were reintroduced in recent years(Annex 3). Of the total number of pensioners, over 2.2 million (15.4%) are preferentialpension recipients (citizens who retired 5-10 years earlier than the official retirement age).The current system of pension provision does not correspond to the conditions of marketrelations, does not consider the change in working conditions, nor does it consider thetechnological processes that have considerably improved people’s working conditions.Many occupations listed among preferential pension recipients in terms of difficult workingconditions are no longer hazardous. The criteria of preferential pension provision shouldbe revised: it should be based on the criterion of deterioration in a particular worker’shealth; in other words, the individual approach should be taken in every case.
Another pressing problem is the age of retirement, which age in Ukraine is one ofthe earliest in the world (55 for women and 60 for men). At the same time, the minimumemployment period for pension entitlement is too small (20 years for women and 25for men). In addition, the pension insurance duty is not collected during certain periodsof employment (student years at secondary and higher educational institutions areincluded into the employment period as well as years of military service and time incaring for infants/small children.)
Early retirement age combined with the unfavorable demographic situation causedby the increased number of elderly people considerably burdens the work of the PensionFund. The usual ratio of a country’s working population to pensioners is 1:2 whereasin Ukraine it currently stands at 1:1. It is our belief that people can still bear a very highlevel of economic activity up to the age of 70 years. In 1998, 37.9% of the populationwas aged 60-64, and 27% of people at the age of 65-69 were offering their services on
263
the Labor Market.2 The draft law On Obligatory State Pension Insurance will set theretirement age at 63 years of age for men and women. It is proposed that the retirementage be raised in several stages.
The most heated debates are focused on the introduction of a cumulative system ofpension accounts. The depreciation of bank deposits and of the UAH in comparisonwith the USD (more than 3 times since the monetary reforms), and the failure of financialpyramids all hinder the formation of positive public opinion about the proposed system.There are no underlying conditions such as micro-economic stability, economic growth,and viable legal regulations that would ensure the efficacy of its functioning.
Thus, a number of pressing problems relate to the reforming of the solidarity systemof pension provision in order to:
• establish a closer relationship between the period of employment and the amountof pension;
• improve the procedure of payments collection;• establish a consolidated and automated accounting system;• abolish the most preferential pensions;• raise the age of retirement;• transfer the mandates of funding social benefits and of social assistance programs
to the Pension Fund. (One of the paramount conditions for reforming theobli-gatory pension contributions system is division of the sources of payments.The Pension Fund should only finance pensions, whereas in 1999 more than20% of the total amount of payments was allocated for other kinds of socialassistance. Funding for social pensions and social assistance programs shouldbe transferred to the state budget.)
Additional objectives would be to set up a computer network to support the ongoingwork of individual and obligatory cumulative pension systems and to create a generalUkrainian database on all pensioners and workers.
T H E U K R A I N I A N S O C I A L P R O T E C T I O N S Y S T E M A N D T H E M E T H O D S O F G O V E R N A N C E

264
T H E I M PA C T O F D E C E N T R A L I Z AT I O N O N S O C I A L P O L I C Y
ANNEX 3.
Unemployment Insurance
The Law of Ukraine On Citizens’ Employment (1991) (with amendments) defines theright of citizens to unemployment benefits (see table in Annex 5). On the basis of thislaw a new system was established during the 1990s. This system has the attributes thatcorrespond to the practice of developed countries and international standards concerningthe provision of employment rights. The responsible authority in this system is theState Employment Center with its network of branch offices. This authority performsthe whole range of standard functions necessary in the sphere of employment, viz.employment, activities to increase the compatibility of the temporarily unemployed,provision of different kinds of allowances, and arrangements for public work.
The financing of these functions is carried out at the expense of the State EmploymentFund. As from 1994 this Fund operated solely from taxes levied on employers and,starting from 1997, from the obligatory state insurance for unexpected unemploymentwithdrawn from employers (1.5% out of the Labor Payment Fund) and from employees(0.5% out of the total income without tax).
Analysis of the work and funding of the Employment Services together with inter-views with a number of key people in the sphere of social protection showed that:
• the Employment Fund stays within the state budget (it should be noted thatsince 1994 the state has not made any contributions to it). This leads to thesituation when the government uses the insurance funds to cover other needs;
• contrary to the law On Obligatory Social Security (1997) and contrary to theConvention of the Ministry of Labor Protection No. 88 On Organization ofthe Employment Service, the financing of more than 8,000 employees of theState Employment Fund, i.e. public servants, is carried out from the socialsecurity contributions and not from the budget funds. In 1999, 24.3% out ofthe total expenditure of the Employment Fund was spent on maintenance anddevelopment of its material base (see Annex 1 for details);
• a considerable part of the money (according to some evaluations up to 30%)from the Employment Fund is spent on financing the provision of given servicesto citizens who neither personally nor through the employers made any contri-butions to the Fund. There are many such people including: military personnelwho resigned or whose service terminated due to a reduction in staff without theright to a pension; people who are searching for a job after a long break; youngpeople who are searching for a job for the first time; and other insured people.Provision of social services to these categories of the population should be financedfrom the state budget and not from social security contributions;

265
• the creation of new job places is a direct function of the state (Articles 3 and 13of the law On Population Employment), and not of the Social Security Fund.This also means that the monies of the Fund are not used specifically for thetarget;
• the unemployment allowance is very small (the average is UAH 44 and theminimum is UAH 25). This is much lower than the existing limit of poverty.The reasons for this include those mentioned above.
Up till now, the services and cash benefits for the unemployed have not proved theirvalue despite the operational costs of the State Employment Service being high (forfinancing sources and basic expenditure items, see Annex 4). Cash benefits and servicesfor the unemployed do not correspond to their function for three reasons: firstly, hiddenunemployment figures considerably exceed the officially registered ones; secondly, theunemployment benefit is very small (the ratio of the average benefit to the average salaryis less than 14%); thirdly, the population has no trust in this institution (under 10% ofthose in search of a job turn to the Service).
The main problems related to the Employment Centers are as follows:
• low rate of job placement for those turning to the employment service (under20%);
• no actual vacancies, or no regular salary/wage payment in the available vacancies;• over-production of specialists with higher technical or engineering education.
The law On Obligatory State Social Insurance against Unemployment was due tocome into force on 1 January 2001.
... In my opinion, the main shortcoming of the newly created Unemployment Insurance Fund isthe fact that the State wants to make the insurance fund handle other matters than insurance. Inother words, the Fund should provide social services and financial support for those with noinsurance. Thus, if you and I make insurance contributions, they will not only be used to coverthe expenditure on accidents that may happen to us but also to cover the expenses of otherpeople: people who are allowed by the State, for some reason or other, not to pay any contributionto this fund. Therefore, our payments as well as those of the employers will be higher. Secondly,the state obliges the Fund to finance activities unrelated to insurance matters or those beyond theterms of reference of the Insurance Fund. But as of today, I do know that regarding the budgetfor 2001 the state is not going to assign even a kopiyka or enough money at least to enable theFund to perform public functions. As a result we will be forced to increase insurance contributionrates. The employees, however, have no spare money, their salaries/wages are below the povertyline, and employers are using every possibility to say that the tax burden is very heavy in thiscountry. These are the sorts of problems we are facing.
SOURCE: From interview with an official in the field of social policy.
T H E U K R A I N I A N S O C I A L P R O T E C T I O N S Y S T E M A N D T H E M E T H O D S O F G O V E R N A N C E
266
T H E I M PA C T O F D E C E N T R A L I Z AT I O N O N S O C I A L P O L I C Y
Under this law there is a fixed list of people who are required to take out obligatorysocial insurance against unemployment. This is the first time that the legislation containsmeasures for tackling the problem of temporary unemployment, a situation that is verypainful for Ukraine.
The main lines for reforming the unemployed social protection system should be:
• money from the Social Insurance Fund should be mainly used on compensation(as unemployment assistance) for those who are insured;
• as for the measures aimed at preventing or at least limiting insurance cases (im-plementation of creation programs of work-places, staff training programs, which—according to World Bank surveys—are not efficient), such measures shouldbe financed by the State Employment Service within the allocations from thestate budget. Specifically this means that the functions of protection of insuredpersons in case of unemployment should be separated from the function of statesocial assistance.
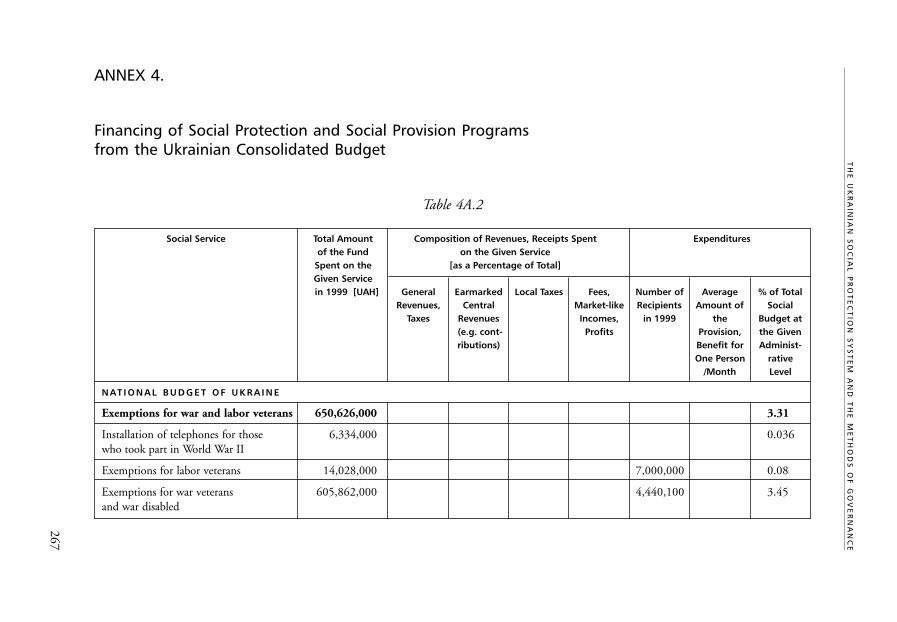
267
TH
E U
KR
AIN
IAN
SO
CIA
L P
RO
TE
CT
ION
SY
ST
EM
AN
D T
HE
ME
TH
OD
S O
F G
OV
ER
NA
NC
E
ANNEX 4.
Financing of Social Protection and Social Provision Programsfrom the Ukrainian Consolidated Budget
Table 4A.2
Social Service Total Amount Composition of Revenues, Receipts Spent Expendituresof the Fund on the Given Service
Spent on the [as a Percentage of Total]Given Servicein 1999 [UAH] General Earmarked Local Taxes Fees, Number of Average % of Total
Revenues, Central Market-like Recipients Amount of SocialTaxes Revenues Incomes, in 1999 the Budget at
(e.g. cont- Profits Provision, the Givenributions) Benefit for Administ-
One Person rative/Month Level
NAT I O N A L B U D G E T O F U K R A I N E
Exemptions for war and labor veterans 650,626,000 3.31
Installation of telephones for those 6,334,000 0.036who took part in World War II
Exemptions for labor veterans 14,028,000 7,000,000 0.08
Exemptions for war veterans 605,862,000 4,440,100 3.45and war disabled
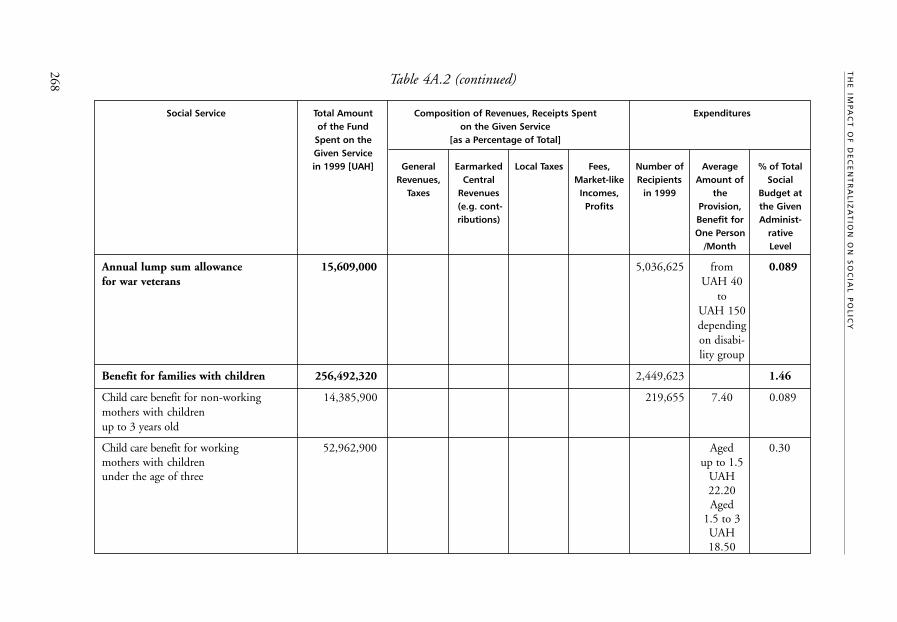
268
TH
E IM
PA
CT
OF
DE
CE
NT
RA
LIZ
AT
ION
ON
SO
CIA
L P
OL
ICY
Table 4A.2 (continued)
Social Service Total Amount Composition of Revenues, Receipts Spent Expendituresof the Fund on the Given Service
Spent on the [as a Percentage of Total]Given Servicein 1999 [UAH] General Earmarked Local Taxes Fees, Number of Average % of Total
Revenues, Central Market-like Recipients Amount of SocialTaxes Revenues Incomes, in 1999 the Budget at
(e.g. cont- Profits Provision, the Givenributions) Benefit for Administ-
One Person rative/Month Level
Annual lump sum allowance 15,609,000 5,036,625 from 0.089for war veterans UAH 40
toUAH 150dependingon disabi-lity group
Benefit for families with children 256,492,320 2,449,623 1.46
Child care benefit for non-working 14,385,900 219,655 7.40 0.089mothers with childrenup to 3 years old
Child care benefit for working 52,962,900 Aged 0.30mothers with children up to 1.5under the age of three UAH
22.20Aged
1.5 to 3UAH18.50

269
TH
E U
KR
AIN
IAN
SO
CIA
L P
RO
TE
CT
ION
SY
ST
EM
AN
D T
HE
ME
TH
OD
S O
F G
OV
ER
NA
NC
E
Cash benefits for mothers (fathers) taking 17,288,900 86,897 18.50 0.099care of three or more children aged up to 16
Benefit for taking care of a disabled child 7,885,900 36,195 25.90 0.045
Child benefit in respect of children aged 116,131,200 1,663,478 7.40 0.66up to 16, school pupils aged up to 18
Benefit in respect of fostered children 3,967,700 11,476 29.60 0.02
Temporary benefit in respect of minors 1,797,600 25,288 7.40 0.01whose parents evade paying alimony
Administrative costs 12 ,213,920 0.69
Other types of social benefit 8,017,300 0.046
• targeted benefit for low-income 473,000 7,165 12.00 0.003families including (including
2,473decidedby local
authorities)
• payment of compensation for the 7,544,300 60,000 0.04rehabilitated, cash benefit for refugees, rehabili-prosthetic device provision program, tatedmaintaining in-patient departments forprosthetic device provision, providingdomestic coal for some categoriesof the population
Maintaining social protection institutions 166,323,300 0.95
• boarding homes for the elderly 155,949,900 47,630 0.89including 276
institutions
— asylums for minors 10,373,400 0.006

270
TH
E IM
PA
CT
OF
DE
CE
NT
RA
LIZ
AT
ION
ON
SO
CIA
L P
OL
ICY
Table 4A.2 (continued)
Social Service Total Amount Composition of Revenues, Receipts Spent Expendituresof the Fund on the Given Service
Spent on the [as a Percentage of Total]Given Servicein 1999 [UAH] General Earmarked Local Taxes Fees, Number of Average % of Total
Revenues, Central Market-like Recipients Amount of SocialTaxes Revenues Incomes, in 1999 the Budget at
(e.g. cont- Profits Provision, the Givenributions) Benefit for Administ-
One Person rative/Month Level
Expenditures on social programs 36,164,100 0.21(social services for youth, programs andactivities of public bodies for family,women and youth affairs)
Expenditures on other activities 148,549,900 0.85in social policy (activities connectedwith the Crimean Tatars returning,maintaining points of temporaryresidence for refugees, etc.)
Housing subsidies 1,383,111,810 3,141,929 38 7.89
• of these: subsidy for purchasing 586,183 147.23gas and solid fuel per year
Administrative costs 40,284,810 0.23
Total expenditures 2,664,893,730 15.21from the national budget
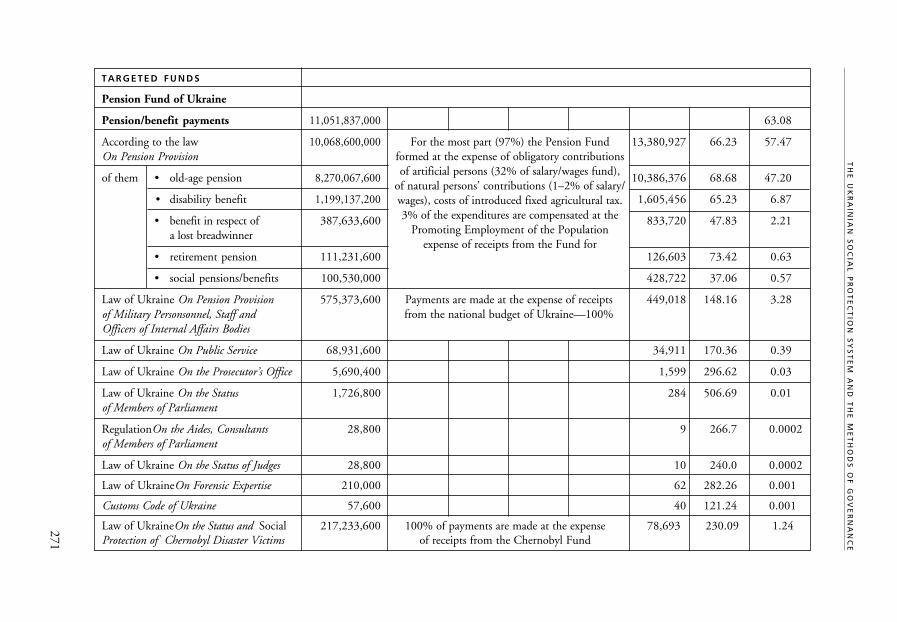
271
TH
E U
KR
AIN
IAN
SO
CIA
L P
RO
TE
CT
ION
SY
ST
EM
AN
D T
HE
ME
TH
OD
S O
F G
OV
ER
NA
NC
E
T A R G E T E D F U N D S
Pension Fund of Ukraine
Pension/benefit payments 11,051,837,000 63.08
According to the law 10,068,600,000 13,380,927 66.23 57.47On Pension Provision
of them • old-age pension 8,270,067,600 10,386,376 68.68 47.20
• disability benefit 1,199,137,200 1,605,456 65.23 6.87
• benefit in respect of 387,633,600 833,720 47.83 2.21a lost breadwinner
• retirement pension 111,231,600 126,603 73.42 0.63
• social pensions/benefits 100,530,000 428,722 37.06 0.57
Law of Ukraine On Pension Provision 575,373,600 Payments are made at the expense of receipts 449,018 148.16 3.28of Military Personsonnel, Staff and from the national budget of Ukraine—100%Officers of Internal Affairs Bodies
Law of Ukraine On Public Service 68,931,600 34,911 170.36 0.39
Law of Ukraine On the Prosecutor’s Office 5,690,400 1,599 296.62 0.03
Law of Ukraine On the Status 1,726,800 284 506.69 0.01of Members of Parliament
RegulationOn the Aides, Consultants 28,800 9 266.7 0.0002of Members of Parliament
Law of Ukraine On the Status of Judges 28,800 10 240.0 0.0002
Law of UkraineOn Forensic Expertise 210,000 62 282.26 0.001
Customs Code of Ukraine 57,600 40 121.24 0.001
Law of UkraineOn the Status and Social 217,233,600 100% of payments are made at the expense 78,693 230.09 1.24Protection of Chernobyl Disaster Victims of receipts from the Chernobyl Fund
For the most part (97%) the Pension Fundformed at the expense of obligatory contributionsof artificial persons (32% of salary/wages fund),
of natural persons’ contributions (1–2% of salary/wages), costs of introduced fixed agricultural tax.3% of the expenditures are compensated at the
Promoting Employment of the Populationexpense of receipts from the Fund for
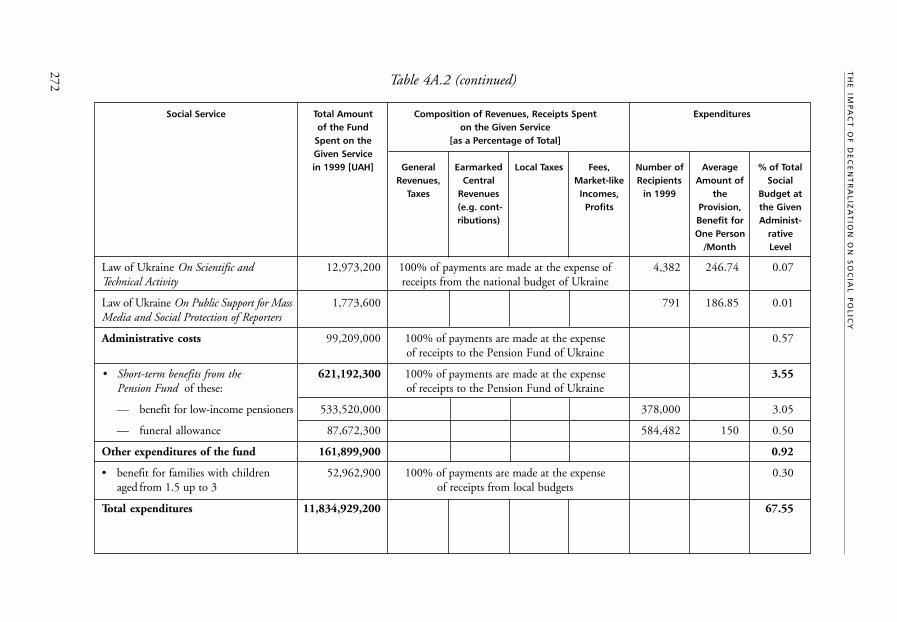
272
TH
E IM
PA
CT
OF
DE
CE
NT
RA
LIZ
AT
ION
ON
SO
CIA
L P
OL
ICY
Table 4A.2 (continued)
Social Service Total Amount Composition of Revenues, Receipts Spent Expendituresof the Fund on the Given Service
Spent on the [as a Percentage of Total]Given Servicein 1999 [UAH] General Earmarked Local Taxes Fees, Number of Average % of Total
Revenues, Central Market-like Recipients Amount of SocialTaxes Revenues Incomes, in 1999 the Budget at
(e.g. cont- Profits Provision, the Givenributions) Benefit for Administ-
One Person rative/Month Level
Law of Ukraine On Scientific and 12,973,200 100% of payments are made at the expense of 4,382 246.74 0.07Technical Activity receipts from the national budget of Ukraine
Law of Ukraine On Public Support for Mass 1,773,600 791 186.85 0.01Media and Social Protection of Reporters
Administrative costs 99,209,000 100% of payments are made at the expense 0.57of receipts to the Pension Fund of Ukraine
• Short-term benefits from the 621,192,300 100% of payments are made at the expense 3.55Pension Fund of these: of receipts to the Pension Fund of Ukraine
— benefit for low-income pensioners 533,520,000 378,000 3.05
— funeral allowance 87,672,300 584,482 150 0.50
Other expenditures of the fund 161,899,900 0.92
• benefit for families with children 52,962,900 100% of payments are made at the expense 0.30aged from 1.5 up to 3 of receipts from local budgets
Total expenditures 11,834,929,200 67.55

273
TH
E U
KR
AIN
IAN
SO
CIA
L P
RO
TE
CT
ION
SY
ST
EM
AN
D T
HE
ME
TH
OD
S O
F G
OV
ER
NA
NC
E
S O C I A L I N S U R A N C E F U N D
Benefit in respect of temporary 691,395,000 UAH 8.56 3.95unemployment per day
• Maternity benefit 82,763,000 UAH 5.86 0.67per day
• Child-birth allowance 10,640,000 206,014 FromUAH 51.5 0.06to UAH 74(for thosewho hada difficult
labor)
• Funeral allowance 4,025,000 26,729 150 0.02
Resort treatment and rest for employees 339,697,000 920,000 352.0 1.94and members of their families
Administrative costs 38,408,000 0.22
Total expenditures 1,166,928,000 6.66
F U N D F O R P R O M O T I N G E M P LOY M E N T
Payment of unemployment benefit 335,488,000 1,474,524 44.9 1.91(as at
01.01.200620,580)
Funeral allowance in respect 689,900 3,890 174.8 0.004of the death of an unemployed
Professional training and re-training 44,314,000 126,518 29.2 0.25of the unemployed
• including allowance during training 16,197,700 88,438 15.3 0.09
Payments are made from receipts to the SocialInsurance Fund formed from: contributions
for obligatory social insurance (4%) fromsalary/wages, which makes 93% of the total
amount of Social Insurance Fund revenues; socialinsurance duty (11%) of the single tax; deductionsfrom selling a special trade license (2%) and fixed
agricultural tax (2%); which makes 0.08% ofthe total amount of Social Insurance Fund Fund
revenues; receipts for resort treatment and resttickets, which makes 0.08% of the total amount
of Social Insurance Fund revenues;
100% of the receipts to the Fund whichis formed from: duties on obligatory social
insurance against unemployment—0.5% rateis deducted from the basic salary of an employee;
1.5% is deducted from the salary/wages fund

274
TH
E IM
PA
CT
OF
DE
CE
NT
RA
LIZ
AT
ION
ON
SO
CIA
L P
OL
ICY
Table 4A.2 (continued)
Social Service Total Amount Composition of Revenues, Receipts Spent Expendituresof the Fund on the Given Service
Spent on the [as a Percentage of Total]Given Servicein 1999 [UAH] General Earmarked Local Taxes Fees, Number of Average % of Total
Revenues, Central Market-like Recipients Amount of SocialTaxes Revenues Incomes, in 1999 the Budget at
(e.g. cont- Profits Provision, the Givenributions) Benefit for Administ-
One Person rative/Month Level
Public works organization 6,451,900 42%—funds from the Fund itself; 151,815 0.044.5% funds of local budgets; 53%—funds
the enterprises paying for public work
Allowance for moving families 1,000 Financed with the funds of enterprises 61to the countryside which invited the family
Information work connected with 2,322,700 100% of receipts to the Fund 0.01implementing employment program
Maintaining the fund, developing 126,273,100 0.72its material basis
Other expenditures 10,892,200 0.06
Total expenditures 520,500,200 2.97
U K R A I N I A N F U N D F O R S O C I A L P R O T E C T I O N O F T H E D I S A B L E D
Providing with cars 7,617,291 689 9 666 0.04
Compensation for petrol, repairs, 6,189,804 64,926 92.0 0.04and technical servicing of the car
Providing with wheel-chairs 4,659,253 6,656 700 0.03
100% of the receipts to the Fund, which is formedat the expense of allocations from the national
budget (49.09%) and 50.91% of the total amountof earmarked funds to the Fund in accordance
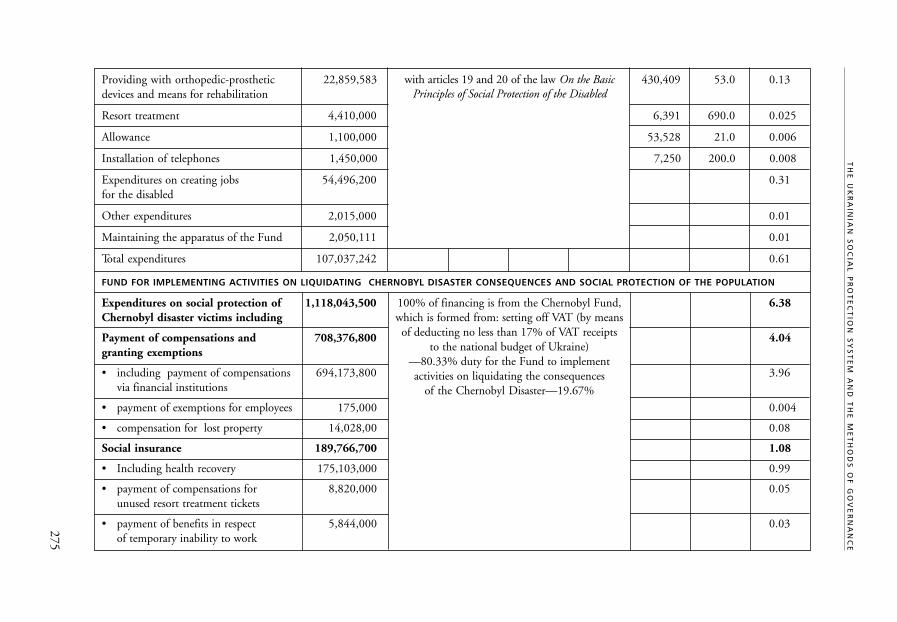
275
TH
E U
KR
AIN
IAN
SO
CIA
L P
RO
TE
CT
ION
SY
ST
EM
AN
D T
HE
ME
TH
OD
S O
F G
OV
ER
NA
NC
E
Providing with orthopedic-prosthetic 22,859,583 430,409 53.0 0.13devices and means for rehabilitation
Resort treatment 4,410,000 6,391 690.0 0.025
Allowance 1,100,000 53,528 21.0 0.006
Installation of telephones 1,450,000 7,250 200.0 0.008
Expenditures on creating jobs 54,496,200 0.31for the disabled
Other expenditures 2,015,000 0.01
Maintaining the apparatus of the Fund 2,050,111 0.01
Total expenditures 107,037,242 0.61
FUND FOR IMPLEMENTING ACTIVITIES ON LIQUIDATING CHERNOBYL DISASTER CONSEQUENCES AND SOCIAL PROTECTION OF THE POPULATION
Expenditures on social protection of 1,118,043,500 6.38Chernobyl disaster victims including
Payment of compensations and 708,376,800 4.04granting exemptions
• including payment of compensations 694,173,800 3.96via financial institutions
• payment of exemptions for employees 175,000 0.004
• compensation for lost property 14,028,00 0.08
Social insurance 189,766,700 1.08
• Including health recovery 175,103,000 0.99
• payment of compensations for 8,820,000 0.05unused resort treatment tickets
• payment of benefits in respect 5,844,000 0.03of temporary inability to work
with articles 19 and 20 of the law On the BasicPrinciples of Social Protection of the Disabled
100% of financing is from the Chernobyl Fund,which is formed from: setting off VAT (by means
of deducting no less than 17% of VAT receiptsto the national budget of Ukraine)
—80.33% duty for the Fund to implementactivities on liquidating the consequences
of the Chernobyl Disaster—19.67%
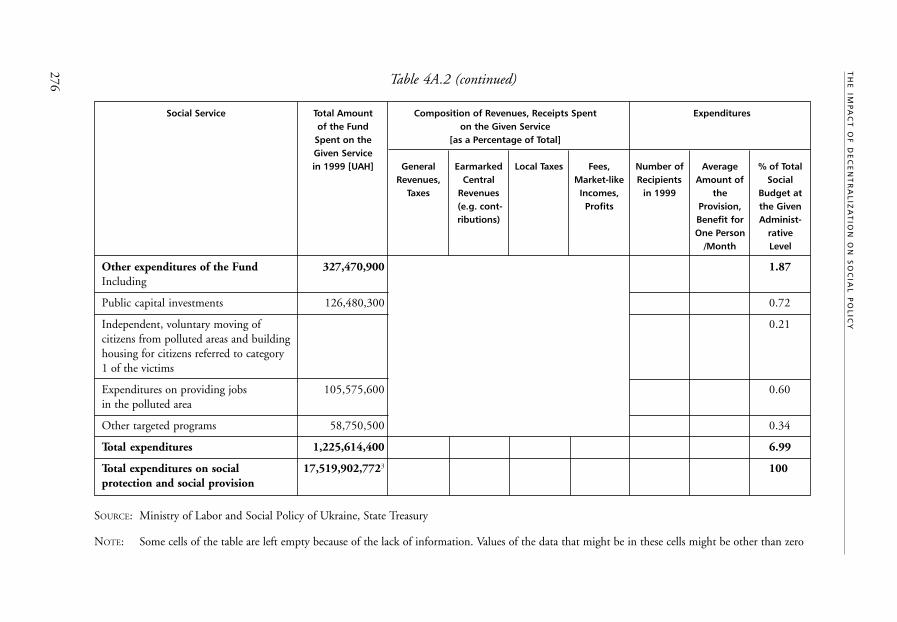
276
TH
E IM
PA
CT
OF
DE
CE
NT
RA
LIZ
AT
ION
ON
SO
CIA
L P
OL
ICY
Table 4A.2 (continued)
Social Service Total Amount Composition of Revenues, Receipts Spent Expendituresof the Fund on the Given Service
Spent on the [as a Percentage of Total]Given Servicein 1999 [UAH] General Earmarked Local Taxes Fees, Number of Average % of Total
Revenues, Central Market-like Recipients Amount of SocialTaxes Revenues Incomes, in 1999 the Budget at
(e.g. cont- Profits Provision, the Givenributions) Benefit for Administ-
One Person rative/Month Level
Other expenditures of the Fund 327,470,900 1.87Including
Public capital investments 126,480,300 0.72
Independent, voluntary moving of 0.21citizens from polluted areas and buildinghousing for citizens referred to category1 of the victims
Expenditures on providing jobs 105,575,600 0.60in the polluted area
Other targeted programs 58,750,500 0.34
Total expenditures 1,225,614,400 6.99
Total expenditures on social 17,519,902,7723 100protection and social provision
SOURCE: Ministry of Labor and Social Policy of Ukraine, State Treasury
NOTE: Some cells of the table are left empty because of the lack of information. Values of the data that might be in these cells might be other than zero

277
T H E U K R A I N I A N S O C I A L P R O T E C T I O N S Y S T E M A N D T H E M E T H O D S O F G O V E R N A N C E
ANNEX 5.
Social Provisions
1. Unemployment Benefit
Purpose of Service
Sum/Form of service Cash benefit. Amount:
a) not less than 50% of average salary received at a previous job,but not more than the average salary in public industry of thegiven oblast for the previous year and not less than theminimum salary determined by legal regulations, given thata citizen in the course of the 12 months preceding theunemployment period has been working for not less than12 calendar weeks;
b) not less than the minimum salary determined by legal regu-lations—in all other cases including those in search of workfor the first time or after a lengthy (over six months) break.
Duration of service The benefit is paid commencing from the eighth day afterregistration in the State Employment Department until the startof employment, but for a period of not more than 360 calendardays in the course of two years, for citizens near to retirement age(men aged 58 and women aged 53), about 750 calendar days;benefit is paid for a period of not more than 180 calendar daysfor those willing to work after a lengthy (over six months) breakand for those in search of a job for the first time.
Who sets the eligibility criteria Law of Ukraine On Citizens’ Employment (1991)granting benefit with amendments
Criteria for granting benefit Unemployment benefit recipients are those unemployedthat have been defined as such in the established order.
Body registering or State Department of Employment through the Funddefining recipients for Promoting Employment
Decision-making body State Employment Department
Service provider State Employment Department
Forms of Rights’ Protection Appealing to the hierarchically respective body of the StateEmployment Department or to court as defined by legalregulations
Financial responsibility (budge- Cabinet of Ministers of Ukraine(tary decision-making body)

278
T H E I M PA C T O F D E C E N T R A L I Z AT I O N O N S O C I A L P O L I C Y
Total budget of 1999 UAH 35,488,000
Average expenditures/benefit in in 1999—UAH 44.9 per month; in 1999 51.1% were receivingrespect to users/month or year UAH 25 per month, 30% were receiving from UAH 25
to UAH 74 per month.
Financial Control State Treasury of Ukraine(budget controlling body)
Administrative/Legal control Control and Inspection Department, Prosecution Departmentof Ukraine
Professional Control Supervisory Board of the Fund for Promoting Employment
Number of recipients/ 1,474,524/620,580 for 1 January 2000service users in 1999
2. Housing Subsidies
Purpose of service Providing help in payment for housing rent and utilities byincreasing the amount of benefit in respect of actual expendituresof citizens for rent payment.
Sum/form of service Monthly non-cash targeted benefit calculations defining the sumof the subsidy are carried out in the following sequence:
1. Average monthly household gross income is defined as well asthe share of payment for housing and utilities in the income.
2. Average monthly amount of payment for housing rent andutilities is defined. It is defined according to sanitary standardsof housing space (21 sq.m per-capita) and according to fixedstandards of use of utilities in a given locality.
3. Amount of subsidy is defined as the difference betweenpayment for housing rent and utilities within the sanitarystandards and within the standards of use of utilities and theamount of payment defined for the household.
Duration of service Granted for 6 months, starting with the month of applicationfor granting or recalculation of the subsidy. Decision on grantinga subsidy is taken within 10 days from the day of submittingthe application form.
Who sets the eligibility criteria Decree of the Cabinet of Ministers of Ukraine of 4.02.95, No. 89,for granting a subsidy On Granting Citizens with Subsidies for Compensating Expenditures
on Payment for Housing Rent and Utilities, Purchase of Fluid Gasand Solid Fuel. Decree of the Cabinet of Ministers of Ukraineof 27.07.98, No. 1156, On New Amount of Expenditures onPayment for Housing Rent and Utilities, Purchase of Fluid Gas andSolid Fuel, in Case of Housing Subsidy Granting.

279
T H E U K R A I N I A N S O C I A L P R O T E C T I O N S Y S T E M A N D T H E M E T H O D S O F G O V E R N A N C E
Criteria for granting a subsidy Subsidies are granted to families with a difference between theamount of payment for housing and utilities and the maximumobligatory rate of payment. Maximum obligatory payment rate isup to 20% of monthly average gross household income;for pensioners and other handicapped people it is up to 15%.To get the subsidy citizens must submit the following documents:application form, information on household members, onprovision with housing space and utilities, on incomes of everymember of the household according to typical forms, a pay book,receipts of actual payment for utilities for the previous period,confirmation of non-existence of debts to utility providers.
Body/bodies registering or Subsidy Departments of District State Administrationsdefining recipients
Decision-making body/bodies Subsidy Departments of District State Administrations
Service provider Subsidy Departments of District State Administrations
Forms of rights’ protection Decision on granting or not granting a subsidy may be debated inDistrict State Administrations, executive bodies of City andDistrict Councils, and in court.
Financial responsibility (budge- Executive Committees of City, District, and Village Councilstary decision-making body) and Ministry of Finances of Ukraine
Total budget of 1999 UAH 1,383,111,810
Average expenditures/benefits UAH 38in respect of recipents/monthor year in 1999
Financial control State Treasury of Ukraine(budget controlling body)
Administrative/Legal control Control and Inspection Department, Prosecution Departmentof Ukraine, State Taxation Administration
Professional control
Number of recipients/service 3,141,929users in 1999
3. Targeted Social Benefit for Low-Income Families
Purpose of service Providing assistance for low-income families
Sum/Form of service Cash benefit. The amount is defined as the difference betweenthe amount of gross income which entitles a family to receivesocial benefit and the gross income of the family.
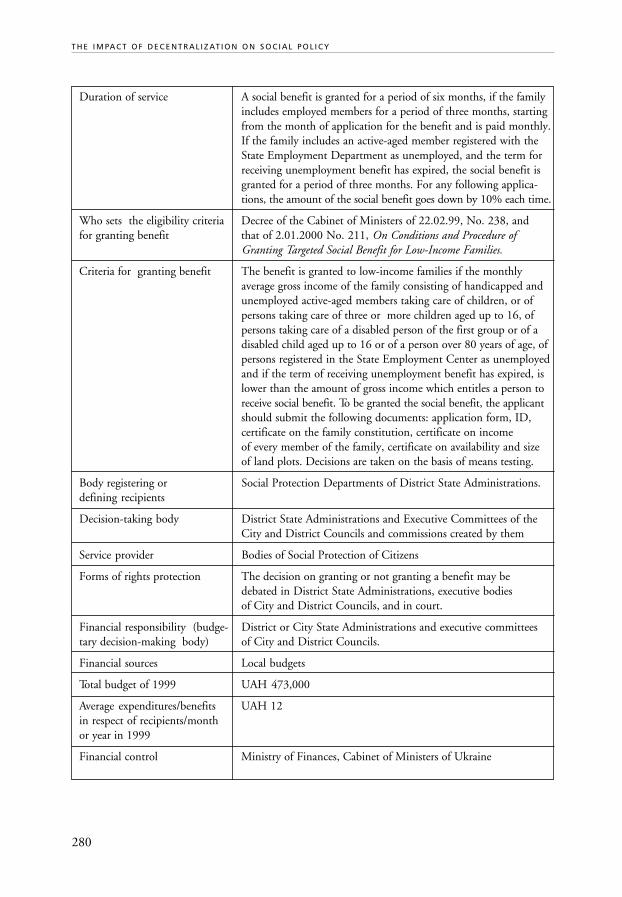
280
T H E I M PA C T O F D E C E N T R A L I Z AT I O N O N S O C I A L P O L I C Y
Duration of service A social benefit is granted for a period of six months, if the familyincludes employed members for a period of three months, startingfrom the month of application for the benefit and is paid monthly.If the family includes an active-aged member registered with theState Employment Department as unemployed, and the term forreceiving unemployment benefit has expired, the social benefit isgranted for a period of three months. For any following applica-tions, the amount of the social benefit goes down by 10% each time.
Who sets the eligibility criteria Decree of the Cabinet of Ministers of 22.02.99, No. 238, andfor granting benefit that of 2.01.2000 No. 211, On Conditions and Procedure of
Granting Targeted Social Benefit for Low-Income Families.
Criteria for granting benefit The benefit is granted to low-income families if the monthlyaverage gross income of the family consisting of handicapped andunemployed active-aged members taking care of children, or ofpersons taking care of three or more children aged up to 16, ofpersons taking care of a disabled person of the first group or of adisabled child aged up to 16 or of a person over 80 years of age, ofpersons registered in the State Employment Center as unemployedand if the term of receiving unemployment benefit has expired, islower than the amount of gross income which entitles a person toreceive social benefit. To be granted the social benefit, the applicantshould submit the following documents: application form, ID,certificate on the family constitution, certificate on incomeof every member of the family, certificate on availability and sizeof land plots. Decisions are taken on the basis of means testing.
Body registering or Social Protection Departments of District State Administrations.defining recipients
Decision-taking body District State Administrations and Executive Committees of theCity and District Councils and commissions created by them
Service provider Bodies of Social Protection of Citizens
Forms of rights protection The decision on granting or not granting a benefit may bedebated in District State Administrations, executive bodiesof City and District Councils, and in court.
Financial responsibility (budge- District or City State Administrations and executive committeestary decision-making body) of City and District Councils.
Financial sources Local budgets
Total budget of 1999 UAH 473,000
Average expenditures/benefits UAH 12in respect of recipients/monthor year in 1999
Financial control Ministry of Finances, Cabinet of Ministers of Ukraine

281
T H E U K R A I N I A N S O C I A L P R O T E C T I O N S Y S T E M A N D T H E M E T H O D S O F G O V E R N A N C E
Administrative/Legal control Control: Prosecution Department of Ukraine,—inspection administration
Professional control District or city state administrations and executive committeesof city and district councils
Number of recipients/ 7,165 (including 2,473 persons as decided by local authorities).service users in 1999
4. Temporary Disability Benefit
Purpose of service Financial assistance for employed citizens in respectof temporary disability.
Sum/form of service Cash benefit. The amount of benefit is calculated accordingto the general employment period of the employee and is grantedin the following amounts:
a) 100% of average salary calculated according to legal regulations:for employees with overall employment period of 8 and moreyears; for employees with temporary disability resulting fromindustrial accident; employees referred to categories 1-4 ofChernobyl disaster victims; for wives of military servicemen;for employees who were former orphans; for one of the parentstaking care of a sick child-victim of the Chernobyl disasteraged up to 14, including health resort treatment;
b) 80% of average salary for employees with overall employmentperiod from 5 to 8 years;
c) 60% of average salary for employees with overall employmentperiod of up to 5 years;
Duration of service Based on the disability certificate until complete recovery or untildisability status is granted.
Who sets the eligibility criteria Law of Ukraine On General Obligatory State Social Insurancefor granting benefit (1998); Decree of the Cabinet of Ministers of Ukraine On
Calculation of Amount of Temporary Disability Benefit(1998).
Criteria for granting benefit Disability certificate
Body/bodies registering Health care institution, personnel department of employeror defining recipients
Decision-taking body Health care institution
Service provider Social Insurance Fund
Forms of rights protection Lawsuit

282
T H E I M PA C T O F D E C E N T R A L I Z AT I O N O N S O C I A L P O L I C Y
Financial responsibility (budge- Cabinet of Ministers of Ukraine, Ministry of Finances of Ukrainetary decision-making body)concerning budget
Total budget of 1999 UAH 691,395,000
Average expenditures/benefits UAH 8.56 per dayin respect of recipients/monthor year in 1999
Financial control Supervising Board of the Social Insurance Fund(budget-controlling body)
Administrative/Legal control Federation of Trade Unions of Ukraine, State TaxationAdministration
Professional control Federation of Trade Unions of Ukraine
Number of recipients/serviceusers in 1999
5. State Benefits for Families with Children
5.1 Maternity and Child-birth Benefits
Purpose of service State cash allowance to families with children
Sum/form of service Cash allowance.
Amount: 100% of wages/salary of working women; womenhaving been registered with the State Employment Center asunemployed for a period not less than 10 months receive anallowance equal to the minimum wage/salary, female studentsreceive allowances equal to the monthly scholarship
Duration of service Allowance is paid to women for the whole period of absence dueto pregnancy and child birth, including 70 calendar days beforechild birth and 56 (in case of difficult delivery or birth of twoor more children—70) after child birth.
Who sets the eligibility criteria Law On State Benefits for Families with Children (1992)
Criteria for granting benefit Leave of absence in respect of temporary inability
Body/bodies registering Plant/factory, institution, organization of woman’s main jobor defining recipients (or place of study). Women exempted from work and those
registered with the State Employment Center receive theallowances from domiciliary social welfare bodies.
Decision-taking authority
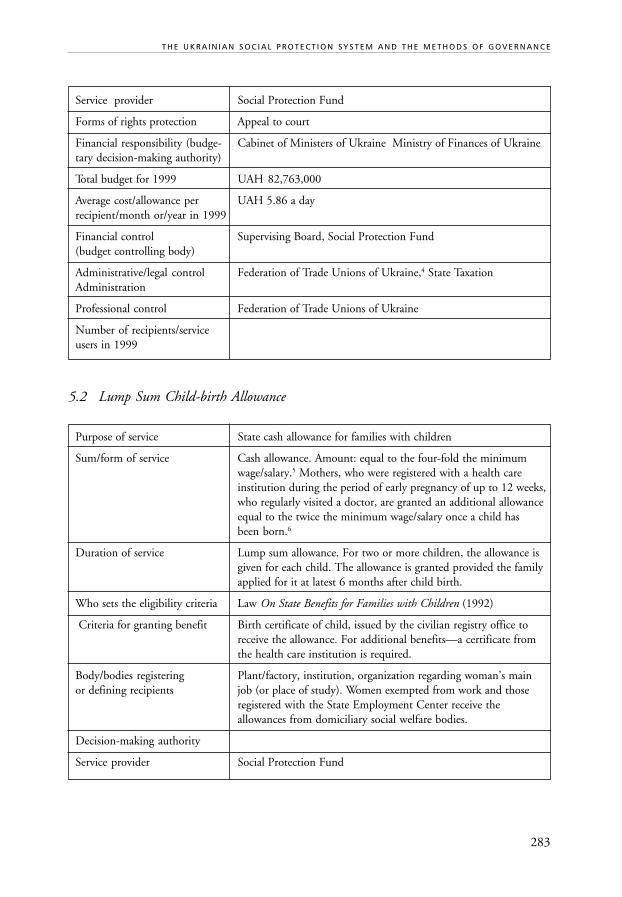
283
T H E U K R A I N I A N S O C I A L P R O T E C T I O N S Y S T E M A N D T H E M E T H O D S O F G O V E R N A N C E
Service provider Social Protection Fund
Forms of rights protection Appeal to court
Financial responsibility (budge- Cabinet of Ministers of Ukraine Ministry of Finances of Ukrainetary decision-making authority)
Total budget for 1999 UAH 82,763,000
Average cost/allowance per UAH 5.86 a dayrecipient/month or/year in 1999
Financial control Supervising Board, Social Protection Fund(budget controlling body)
Administrative/legal control Federation of Trade Unions of Ukraine,4 State TaxationAdministration
Professional control Federation of Trade Unions of Ukraine
Number of recipients/serviceusers in 1999
5.2 Lump Sum Child-birth Allowance
Purpose of service State cash allowance for families with children
Sum/form of service Cash allowance. Amount: equal to the four-fold the minimumwage/salary.5 Mothers, who were registered with a health careinstitution during the period of early pregnancy of up to 12 weeks,who regularly visited a doctor, are granted an additional allowanceequal to the twice the minimum wage/salary once a child hasbeen born.6
Duration of service Lump sum allowance. For two or more children, the allowance isgiven for each child. The allowance is granted provided the familyapplied for it at latest 6 months after child birth.
Who sets the eligibility criteria Law On State Benefits for Families with Children (1992)
Criteria for granting benefit Birth certificate of child, issued by the civilian registry office toreceive the allowance. For additional benefits—a certificate fromthe health care institution is required.
Body/bodies registering Plant/factory, institution, organization regarding woman’s mainor defining recipients job (or place of study). Women exempted from work and those
registered with the State Employment Center receive theallowances from domiciliary social welfare bodies.
Decision-making authority
Service provider Social Protection Fund

284
T H E I M PA C T O F D E C E N T R A L I Z AT I O N O N S O C I A L P O L I C Y
Forms of rights protection Appeal to court
Financial responsibility (budge- Cabinet of Ministers of Ukraine Ministry of Finances of Ukrainetary decision-making authority)
Total budget for 1999 UAH 10,640,000
Average cost/allowance per UAH 51.50, UAH 74 in case of difficult deliveryrecipient/month or/year in 1999
Financial control Supervisory Board of the Social Protection Fund(budget controlling body)
Administrative/legal control Federation of Trade Unions of Ukraine,7 State TaxationAdministration
Professional control Federation of Trade Unions of Ukraine
Number of recipients/ 206,014service users in 1999
5.3 Child Care Benefit in Respect of Children Aged up to 3for Working and Non-working Mothers
Purpose of service State cash benefit for families with children. Benefits are grantedtaking into account number of family members, family income,children’s age and health condition, etc.
Sum/form of service Cash benefit.Amount of benefit to be paid to working mothers: 100% ofminimum wage/salary without regard to the length ofemployment.8 Amount of benefit to be paid to non-workingmothers: 50% of minimum wage/salary.9
Duration of service Paid monthly till the day the child is 3 years old.
Who sets the eligibility criteria Law On State Benefits for Families with Children (1992)
Criteria for granting benefit The benefit is granted on the basis of partly paid child care leaveof absence issued under the plant/factory (organization) order
Body/bodies registering Domiciliary social welfare department.or defining recipients
Service provider The State
Forms of rights protection Appeal to court
Financial responsibility (budge- Cabinet of Ministers the Ukraine Ministry of Financestary decision-making authority) of Ukraine
Financial sources Local budgets
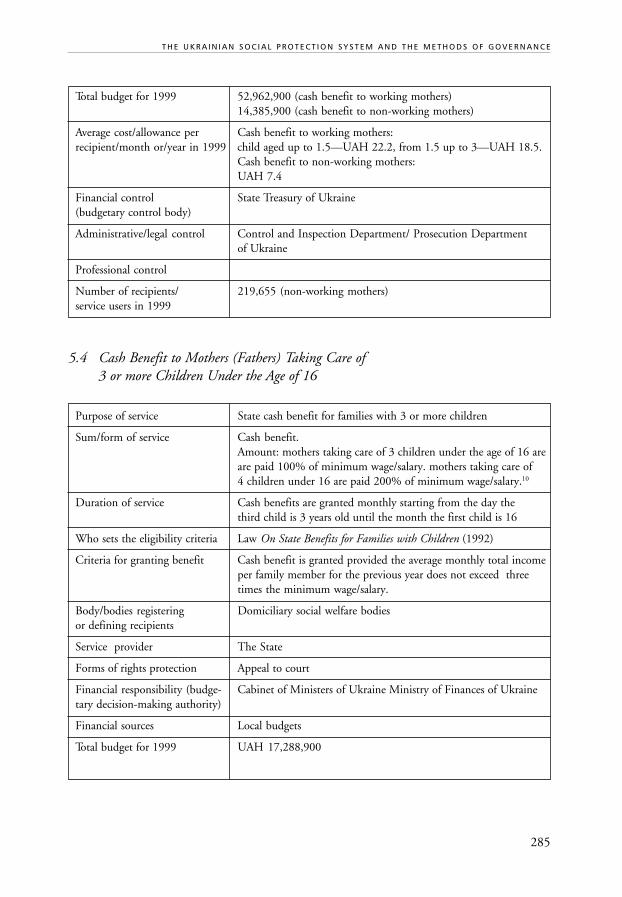
285
T H E U K R A I N I A N S O C I A L P R O T E C T I O N S Y S T E M A N D T H E M E T H O D S O F G O V E R N A N C E
Total budget for 1999 52,962,900 (cash benefit to working mothers)14,385,900 (cash benefit to non-working mothers)
Average cost/allowance per Cash benefit to working mothers:recipient/month or/year in 1999 child aged up to 1.5—UAH 22.2, from 1.5 up to 3—UAH 18.5.
Cash benefit to non-working mothers:UAH 7.4
Financial control State Treasury of Ukraine(budgetary control body)
Administrative/legal control Control and Inspection Department/ Prosecution Departmentof Ukraine
Professional control
Number of recipients/ 219,655 (non-working mothers)service users in 1999
5.4 Cash Benefit to Mothers (Fathers) Taking Care of3 or more Children Under the Age of 16
Purpose of service State cash benefit for families with 3 or more children
Sum/form of service Cash benefit.Amount: mothers taking care of 3 children under the age of 16 areare paid 100% of minimum wage/salary. mothers taking care of4 children under 16 are paid 200% of minimum wage/salary.10
Duration of service Cash benefits are granted monthly starting from the day thethird child is 3 years old until the month the first child is 16
Who sets the eligibility criteria Law On State Benefits for Families with Children (1992)
Criteria for granting benefit Cash benefit is granted provided the average monthly total incomeper family member for the previous year does not exceed threetimes the minimum wage/salary.
Body/bodies registering Domiciliary social welfare bodiesor defining recipients
Service provider The State
Forms of rights protection Appeal to court
Financial responsibility (budge- Cabinet of Ministers of Ukraine Ministry of Finances of Ukrainetary decision-making authority)
Financial sources Local budgets
Total budget for 1999 UAH 17,288,900
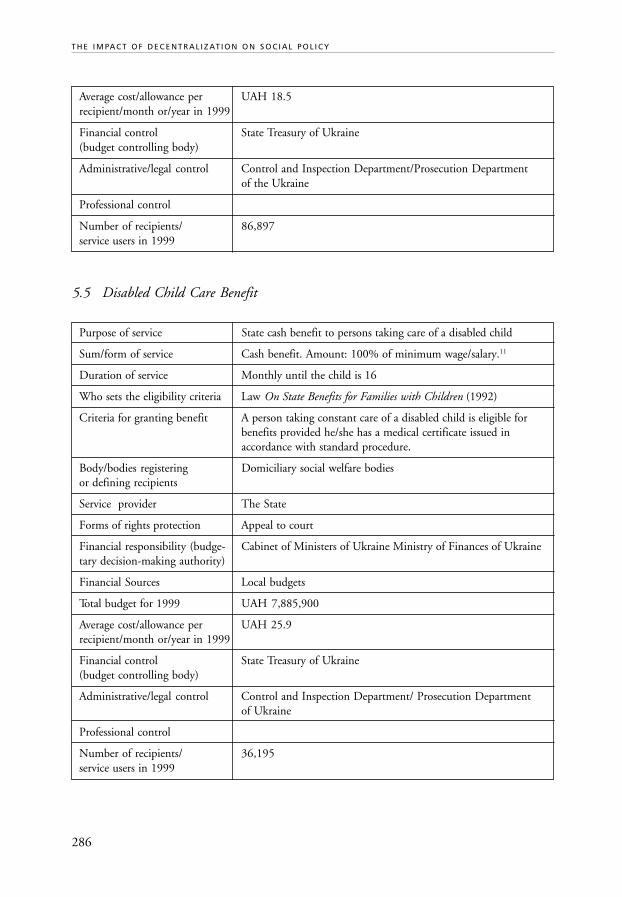
286
T H E I M PA C T O F D E C E N T R A L I Z AT I O N O N S O C I A L P O L I C Y
Average cost/allowance per UAH 18.5recipient/month or/year in 1999
Financial control State Treasury of Ukraine(budget controlling body)
Administrative/legal control Control and Inspection Department/Prosecution Departmentof the Ukraine
Professional control
Number of recipients/ 86,897service users in 1999
5.5 Disabled Child Care Benefit
Purpose of service State cash benefit to persons taking care of a disabled child
Sum/form of service Cash benefit. Amount: 100% of minimum wage/salary.11
Duration of service Monthly until the child is 16
Who sets the eligibility criteria Law On State Benefits for Families with Children (1992)
Criteria for granting benefit A person taking constant care of a disabled child is eligible forbenefits provided he/she has a medical certificate issued inaccordance with standard procedure.
Body/bodies registering Domiciliary social welfare bodiesor defining recipients
Service provider The State
Forms of rights protection Appeal to court
Financial responsibility (budge- Cabinet of Ministers of Ukraine Ministry of Finances of Ukrainetary decision-making authority)
Financial Sources Local budgets
Total budget for 1999 UAH 7,885,900
Average cost/allowance per UAH 25.9recipient/month or/year in 1999
Financial control State Treasury of Ukraine(budget controlling body)
Administrative/legal control Control and Inspection Department/ Prosecution Departmentof Ukraine
Professional control
Number of recipients/ 36,195service users in 1999
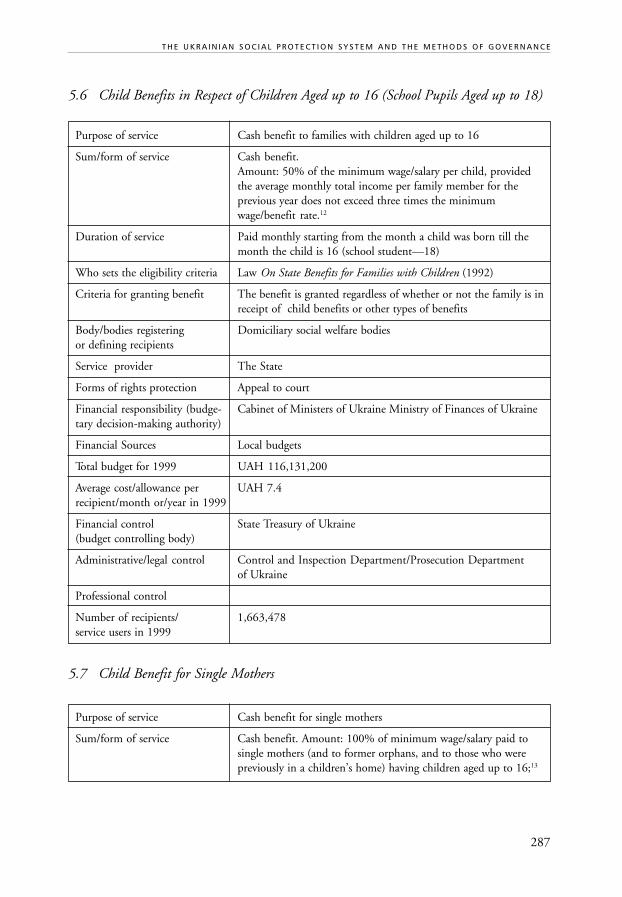
287
T H E U K R A I N I A N S O C I A L P R O T E C T I O N S Y S T E M A N D T H E M E T H O D S O F G O V E R N A N C E
5.6 Child Benefits in Respect of Children Aged up to 16 (School Pupils Aged up to 18)
Purpose of service Cash benefit to families with children aged up to 16
Sum/form of service Cash benefit.Amount: 50% of the minimum wage/salary per child, providedthe average monthly total income per family member for theprevious year does not exceed three times the minimumwage/benefit rate.12
Duration of service Paid monthly starting from the month a child was born till themonth the child is 16 (school student—18)
Who sets the eligibility criteria Law On State Benefits for Families with Children (1992)
Criteria for granting benefit The benefit is granted regardless of whether or not the family is inreceipt of child benefits or other types of benefits
Body/bodies registering Domiciliary social welfare bodiesor defining recipients
Service provider The State
Forms of rights protection Appeal to court
Financial responsibility (budge- Cabinet of Ministers of Ukraine Ministry of Finances of Ukrainetary decision-making authority)
Financial Sources Local budgets
Total budget for 1999 UAH 116,131,200
Average cost/allowance per UAH 7.4recipient/month or/year in 1999
Financial control State Treasury of Ukraine(budget controlling body)
Administrative/legal control Control and Inspection Department/Prosecution Departmentof Ukraine
Professional control
Number of recipients/ 1,663,478service users in 1999
5.7 Child Benefit for Single Mothers
Purpose of service Cash benefit for single mothers
Sum/form of service Cash benefit. Amount: 100% of minimum wage/salary paid tosingle mothers (and to former orphans, and to those who werepreviously in a children’s home) having children aged up to 16;13

288
T H E I M PA C T O F D E C E N T R A L I Z AT I O N O N S O C I A L P O L I C Y
50% of minimum wage/salary given to single mothers withchildren aged up to 16, to widows with children receivingno child benefits in respect of loss of the breadwinner.14
Duration of service Paid monthly starting from the month the child was born till themonth the child is 16 (school pupil—18)
Who sets the eligibility criteria Law On State Benefits for Families with Children (1992)
Criteria for granting benefit Certificate by civilian registry office stating the grounds forproviding information on the child’s father in the births’ registershould be submitted; single mothers (former orphans) shouldadditionally provide certificates proving their upbringing andeducation at a children’s boarding school. Benefits to singlemothers are granted regardless of whether or not they are in receiptof other types of child benefits.
Body/bodies registering Domiciliary social welfare bodiesor defining recipients
Decision-making authority
Service provider The State
Forms of rights protection Appeal to court
Financial responsibility (budge- Cabinet of Ministers of Ukraine Ministry of Finances of Ukrainetary decision-making authority)
Financial sources Local budgets
Total budget for 1999 UAH 29,858,300
Average cost/allowance per UAH 7.4recipient/month or/year in 1999
Financial control State Treasury of Ukraine(budget controlling body)
Administrative/legal control Control and Inspection Department/Prosecution Departmentof Ukraine
Professional control
Number of recipients/ 406,634service users in 1999
5.8 Benefit in Respect of Fostered Children
Purpose of service Cash benefit in respect of fostered children with the purpose ofprotecting their personal and property rights and interests
Sum/form of service Cash benefit. Amount: 200% of the minimum wage/salary15
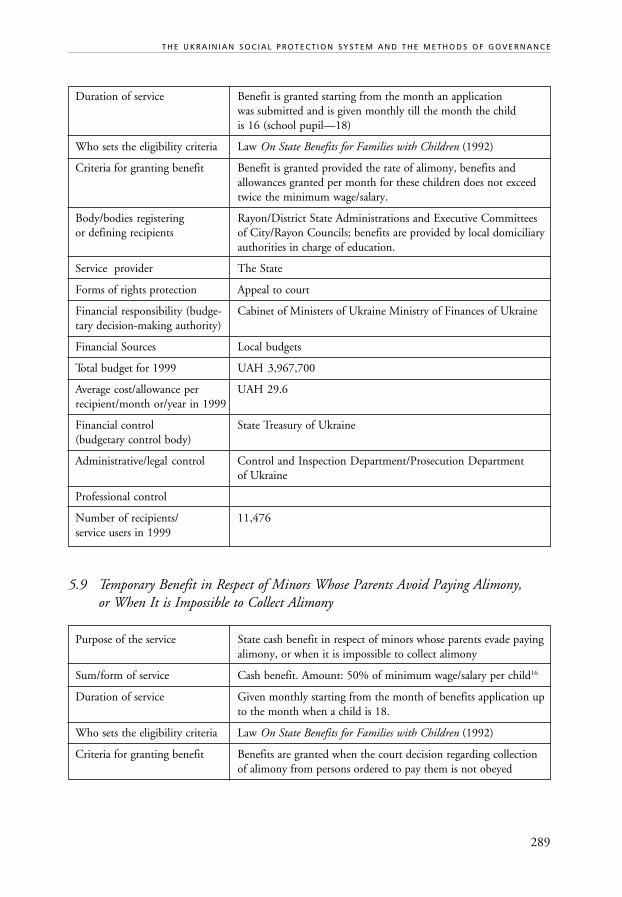
289
T H E U K R A I N I A N S O C I A L P R O T E C T I O N S Y S T E M A N D T H E M E T H O D S O F G O V E R N A N C E
Duration of service Benefit is granted starting from the month an applicationwas submitted and is given monthly till the month the childis 16 (school pupil—18)
Who sets the eligibility criteria Law On State Benefits for Families with Children (1992)
Criteria for granting benefit Benefit is granted provided the rate of alimony, benefits andallowances granted per month for these children does not exceedtwice the minimum wage/salary.
Body/bodies registering Rayon/District State Administrations and Executive Committeesor defining recipients of City/Rayon Councils; benefits are provided by local domiciliary
authorities in charge of education.
Service provider The State
Forms of rights protection Appeal to court
Financial responsibility (budge- Cabinet of Ministers of Ukraine Ministry of Finances of Ukrainetary decision-making authority)
Financial Sources Local budgets
Total budget for 1999 UAH 3,967,700
Average cost/allowance per UAH 29.6recipient/month or/year in 1999
Financial control State Treasury of Ukraine(budgetary control body)
Administrative/legal control Control and Inspection Department/Prosecution Departmentof Ukraine
Professional control
Number of recipients/ 11,476service users in 1999
5.9 Temporary Benefit in Respect of Minors Whose Parents Avoid Paying Alimony,or When It is Impossible to Collect Alimony
Purpose of the service State cash benefit in respect of minors whose parents evade payingalimony, or when it is impossible to collect alimony
Sum/form of service Cash benefit. Amount: 50% of minimum wage/salary per child16
Duration of service Given monthly starting from the month of benefits application upto the month when a child is 18.
Who sets the eligibility criteria Law On State Benefits for Families with Children (1992)
Criteria for granting benefit Benefits are granted when the court decision regarding collectionof alimony from persons ordered to pay them is not obeyed
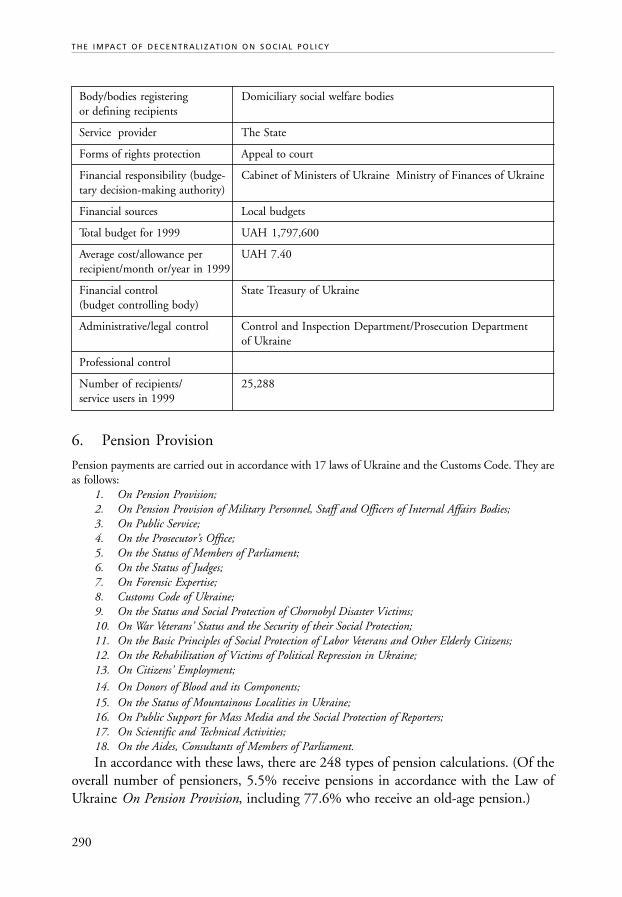
290
T H E I M PA C T O F D E C E N T R A L I Z AT I O N O N S O C I A L P O L I C Y
Body/bodies registering Domiciliary social welfare bodiesor defining recipients
Service provider The State
Forms of rights protection Appeal to court
Financial responsibility (budge- Cabinet of Ministers of Ukraine Ministry of Finances of Ukrainetary decision-making authority)
Financial sources Local budgets
Total budget for 1999 UAH 1,797,600
Average cost/allowance per UAH 7.40recipient/month or/year in 1999
Financial control State Treasury of Ukraine(budget controlling body)
Administrative/legal control Control and Inspection Department/Prosecution Departmentof Ukraine
Professional control
Number of recipients/ 25,288service users in 1999
6. Pension Provision
Pension payments are carried out in accordance with 17 laws of Ukraine and the Customs Code. They areas follows:
1. On Pension Provision;2. On Pension Provision of Military Personnel, Staff and Officers of Internal Affairs Bodies;3. On Public Service;4. On the Prosecutor’s Office;5. On the Status of Members of Parliament;6. On the Status of Judges;7. On Forensic Expertise;8. Customs Code of Ukraine;9. On the Status and Social Protection of Chornobyl Disaster Victims;10. On War Veterans’ Status and the Security of their Social Protection;11. On the Basic Principles of Social Protection of Labor Veterans and Other Elderly Citizens;12. On the Rehabilitation of Victims of Political Repression in Ukraine;13. On Citizens’ Employment;14. On Donors of Blood and its Components;15. On the Status of Mountainous Localities in Ukraine;16. On Public Support for Mass Media and the Social Protection of Reporters;17. On Scientific and Technical Activities;18. On the Aides, Consultants of Members of Parliament.In accordance with these laws, there are 248 types of pension calculations. (Of the
overall number of pensioners, 5.5% receive pensions in accordance with the Law ofUkraine On Pension Provision, including 77.6% who receive an old-age pension.)

291
Purpose of Service
Sum/form of service Cash benefit.Amount: old-age pensions are granted in the amount of 55%of the average annual income, but not less than the minimumpension amount. For every full year of employment (over 25 yearsfor men and over 20 years for women), the pension is increasedby 1% of the average annual income, but not less than by 1% ofthe minimum pension amount. The amount of old-age pensionsis calculated to be no less than the poverty level.
Duration of service Old-age pensions are granted lifelong regardlessof health condition
Who sets the eligibility criteria The law On Pension Provision (1991)
Criteria for granting pensions Old-age pensions are granted to men aged over 60 with workingexperience of not less than 25 years, to women aged over 55 withworking experience of not less than 20 years. Clauses 13-18 ofthe law On Pension Provision regulate granting old-agepension on preferential terms. Employees submit a pensionapplication form to their employer and to the District SocialProtection Department at the applicant’s place of abode.Documents on age, employment record, earnings, etc. are requiredto be attached to the application form.
Body/bodies registering Bodies of Social Protection at the place of abode.or defining recipients
Decision-making body Bodies of Social Protection at the place of abode
Service provider The State
Forms of rights protection Decision made by a pension-granting body may be debated in theDistrict Council or in the District Court
Financial responsibility (budge- The Cabinet of Ministers of Ukraine, Ministry of Financestary decision-making authority) of Ukraine
Total budget of 1999 UAH 8,270,067,600
Average expenditures/benefits UAH 68.68per recipient/monthor year in 1999
Financial control State Treasury of Ukraine(budget controlling body)
Administrative/Legal control State Treasury of Ukraine
Professional control
Number of recipients/ 10,386,376service users in 1999
T H E U K R A I N I A N S O C I A L P R O T E C T I O N S Y S T E M A N D T H E M E T H O D S O F G O V E R N A N C E

292
TH
E IM
PA
CT
OF
DE
CE
NT
RA
LIZ
AT
ION
ON
SO
CIA
L P
OL
ICY
ANNEX 6.
Exemptions set by Legal Regulations and FundsNecessary to Grant These Exemptions
Law Under Which a Privilege is Granted Exemption Type Number of FundsPersons Necessary
Eligible for the to Grant theExemption Exemption
1. The Law of Ukraine On the Status and Social Protection Exempting from paying or reducing 268,300 171,100,000of Chernobyl Disaster Victims the cost of housing rent, utilities,
electric power, gas/coal
2. The Law of Ukraine On Social and Legal Protection of Servicemen 210,500 113,700,000and Members of their Families*
3. The Law of Ukraine On the Status of Military Service Veterans * 484,900 146,600,000
4. The Law of Ukraine On Militia* 170,700 157,300,000
5. The Law of Ukraine On Fire Security* 25,200 9,800,000
6. The Law of Ukraine On Procurator’s Office * 16,000 6,200,000
7. The Law of Ukraine On Veterinary Medicine * 6,000 3,100,000
8. The Law of Ukraine On Education* 273,600 258,100,000
9. The Law of Ukraine On the Status of War Veterans and Guarantees 2,572,110 2,263,900,000for their Social Protection
10. The Law of Ukraine On the Status of Judges* 5,500 5,610,000
11. The Law of Ukraine On the Security Service of Ukraine * 13,200 5,100,000
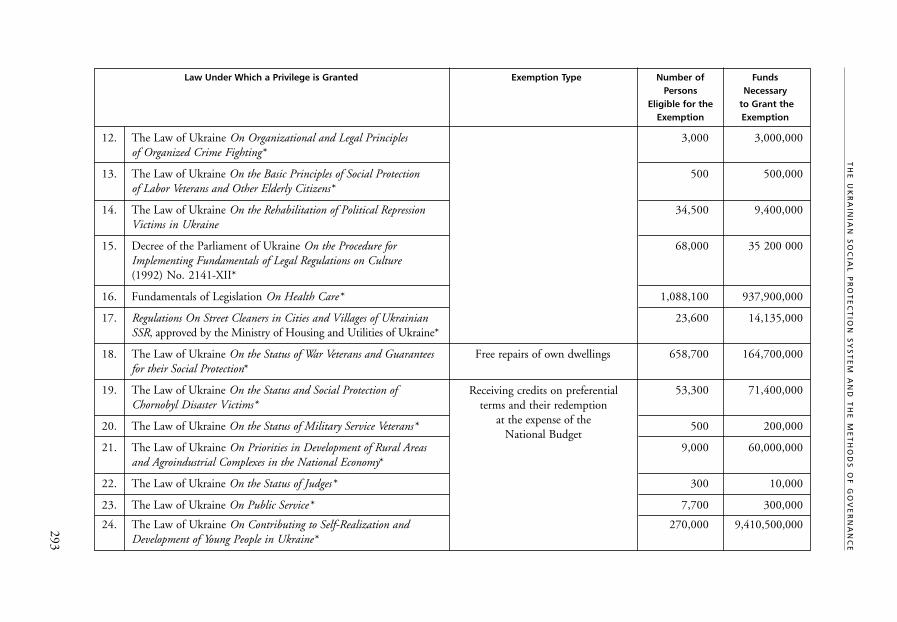
293
TH
E U
KR
AIN
IAN
SO
CIA
L P
RO
TE
CT
ION
SY
ST
EM
AN
D T
HE
ME
TH
OD
S O
F G
OV
ER
NA
NC
E
Law Under Which a Privilege is Granted Exemption Type Number of FundsPersons Necessary
Eligible for the to Grant theExemption Exemption
12. The Law of Ukraine On Organizational and Legal Principles 3,000 3,000,000of Organized Crime Fighting*
13. The Law of Ukraine On the Basic Principles of Social Protection 500 500,000of Labor Veterans and Other Elderly Citizens*
14. The Law of Ukraine On the Rehabilitation of Political Repression 34,500 9,400,000Victims in Ukraine
15. Decree of the Parliament of Ukraine On the Procedure for 68,000 35 200 000Implementing Fundamentals of Legal Regulations on Culture(1992) No. 2141-XII*
16. Fundamentals of Legislation On Health Care * 1,088,100 937,900,000
17. Regulations On Street Cleaners in Cities and Villages of Ukrainian 23,600 14,135,000SSR, approved by the Ministry of Housing and Utilities of Ukraine*
18. The Law of Ukraine On the Status of War Veterans and Guarantees Free repairs of own dwellings 658,700 164,700,000for their Social Protection*
19. The Law of Ukraine On the Status and Social Protection of 53,300 71,400,000Chornobyl Disaster Victims*
20. The Law of Ukraine On the Status of Military Service Veterans * 500 200,000
21. The Law of Ukraine On Priorities in Development of Rural Areas 9,000 60,000,000and Agroindustrial Complexes in the National Economy*
22. The Law of Ukraine On the Status of Judges * 300 10,000
23. The Law of Ukraine On Public Service * 7,700 300,000
24. The Law of Ukraine On Contributing to Self-Realization and 270,000 9,410,500,000Development of Young People in Ukraine*
Receiving credits on preferentialterms and their redemption
at the expense of theNational Budget

294
TH
E IM
PA
CT
OF
DE
CE
NT
RA
LIZ
AT
ION
ON
SO
CIA
L P
OL
ICY
Law Under Which a Privilege is Granted Exemption Type Number of FundsPersons Necessary
Eligible for the to Grant theExemption Exemption
25. The Law of Ukraine On the Status and Social Protection of Free ticket or preferential rate for 280,700 169,300,000Chornobyl Disaster Victims public transport or in luggagetransportation
26. The Law of Ukraine On Social and Legal Protection of Servicemen 895,700 51,300,000and Members of their Families*
27. The Law of Ukraine On the Status of Military Service Veterans* 134,000 7,100,000
28. The Law of Ukraine On Militia* 167,200 74,800,000
29. The Law of Ukraine On Fire Security* 33,900 8,00,000
30. The Law of Ukraine On Procurator’s Office* 5,300 2,100,000
31. The Law of Ukraine On the Prevention of AIDS and Social 1,100 100,000Protection of the Population*
32. The Law of Ukraine On Veterinary Medicine* 5,800 2,200,000
33. The Law of Ukraine On the Status of War Veterans and Guarantees 6,007,700 122,170,000for their Social Protection**
34. The Law of Ukraine On the Status of Judges* 5,500 100,000
35. The Law of Ukraine On the Security Service of Ukraine* 49,100 16,200,000
36. The Law of Ukraine On Elections of Members of Parliament 180,700 9,000,000of Ukraine*
37. The Law of Ukraine On Elections of the President of Ukraine* 15,000 162,000,000
38. 38The Law of Ukraine On the Status of Members of Local Councils* 68,700 6,600,000
39. The Law of Ukraine On Elections of Members of Local Councils* 8,500 2,600,000
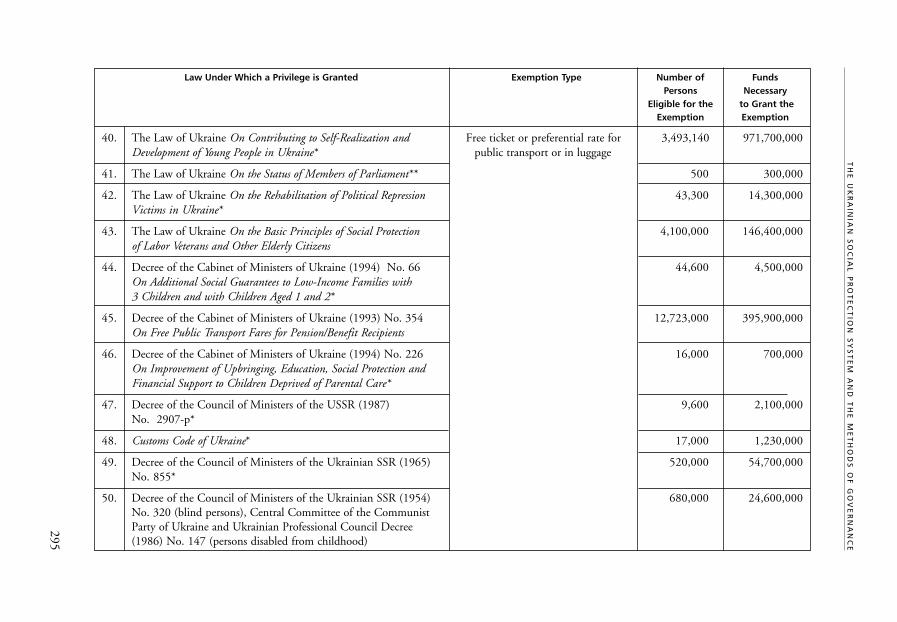
295
Law Under Which a Privilege is Granted Exemption Type Number of FundsPersons Necessary
Eligible for the to Grant theExemption Exemption
40. The Law of Ukraine On Contributing to Self-Realization and Free ticket or preferential rate for 3,493,140 971,700,000Development of Young People in Ukraine* public transport or in luggage
41. The Law of Ukraine On the Status of Members of Parliament** 500 300,000
42. The Law of Ukraine On the Rehabilitation of Political Repression 43,300 14,300,000Victims in Ukraine*
43. The Law of Ukraine On the Basic Principles of Social Protection 4,100,000 146,400,000of Labor Veterans and Other Elderly Citizens
44. Decree of the Cabinet of Ministers of Ukraine (1994) No. 66 44,600 4,500,000On Additional Social Guarantees to Low-Income Families with3 Children and with Children Aged 1 and 2*
45. Decree of the Cabinet of Ministers of Ukraine (1993) No. 354 12,723,000 395,900,000On Free Public Transport Fares for Pension/Benefit Recipients
46. Decree of the Cabinet of Ministers of Ukraine (1994) No. 226 16,000 700,000On Improvement of Upbringing, Education, Social Protection andFinancial Support to Children Deprived of Parental Care*
47. Decree of the Council of Ministers of the USSR (1987) 9,600 2,100,000No. 2907-p*
48. Customs Code of Ukraine* 17,000 1,230,000
49. Decree of the Council of Ministers of the Ukrainian SSR (1965) 520,000 54,700,000No. 855*
50. Decree of the Council of Ministers of the Ukrainian SSR (1954) 680,000 24,600,000No. 320 (blind persons), Central Committee of the CommunistParty of Ukraine and Ukrainian Professional Council Decree(1986) No. 147 (persons disabled from childhood)
TH
E U
KR
AIN
IAN
SO
CIA
L P
RO
TE
CT
ION
SY
ST
EM
AN
D T
HE
ME
TH
OD
S O
F G
OV
ER
NA
NC
E

296
TH
E IM
PA
CT
OF
DE
CE
NT
RA
LIZ
AT
ION
ON
SO
CIA
L P
OL
ICY
Law Under Which a Privilege is Granted Exemption Type Number of FundsPersons Necessary
Eligible for the to Grant theExemption Exemption
51. The Law of Ukraine On the Status and Social Protection of Preferential rates for communication 140,000 8,540,000Chornobyl Disaster Victims** services, free or preferential installation
and use of telephone and signaling
52. The Law of Ukraine On the Status of War Veterans and Guarantees 4,267,700 147,200,000for their Social Protection**
53. The Law of Ukraine On the Status of Judges* 5,500 1,650,000
54. The Law of Ukraine On the Basic Principles of Social Protection 24,000 3,700,000of the Disabled
55. The Law of Ukraine On the Status and Social Protection of Free medicine or preferential rates 3,374,100 1,027,000,000Chornobyl Disaster Victims for medicines
56. The Law of Ukraine On the Prevention of AIDS and Social 16,000 3,800,000Protection of the Population
57. The Law of Ukraine On the Basic Principles of Social Protection 500 40,000of Labor Veterans and Other Elderly Citizens
58. The Law of Ukraine On the Status of War Veterans and Guarantees 4,867,700 2,000,000,000 for their Social Protection
59. The Law of Ukraine On Rehabilitation of Political Repression 51,000 1,700,000Victims In Ukraine
60. The Law of Ukraine On Rehabilitation of Political Repression 9,700 600,000Victims In Ukraine
61. Decree of the President of Ukraine(1995) No. 904/95 200 10,000On Exemptions for Children who Suffered from Chemical IntoxicateAlopecia when Medically Treated
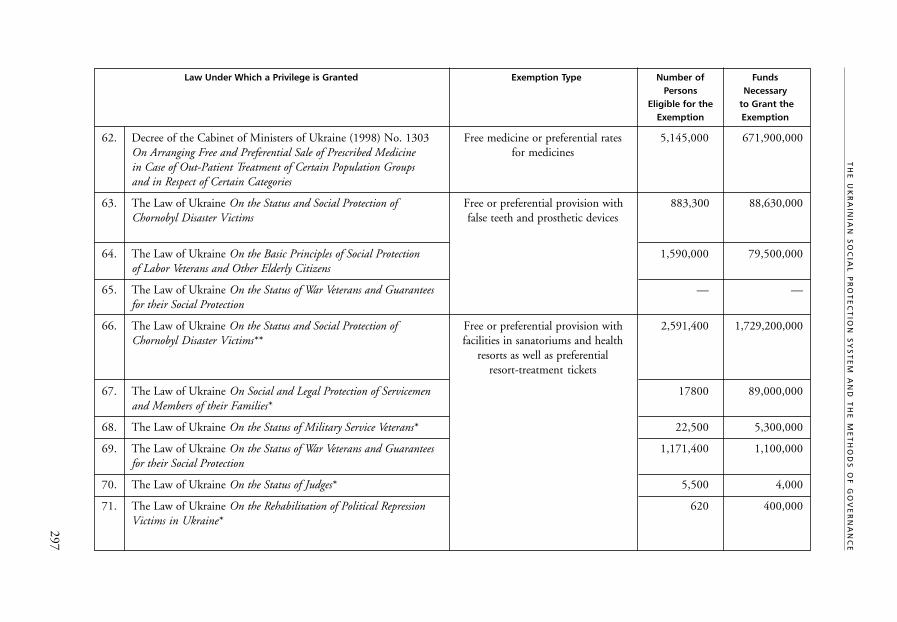
297
Law Under Which a Privilege is Granted Exemption Type Number of FundsPersons Necessary
Eligible for the to Grant theExemption Exemption
62. Decree of the Cabinet of Ministers of Ukraine (1998) No. 1303 Free medicine or preferential rates 5,145,000 671,900,000On Arranging Free and Preferential Sale of Prescribed Medicine for medicinesin Case of Out-Patient Treatment of Certain Population Groupsand in Respect of Certain Categories
63. The Law of Ukraine On the Status and Social Protection of Free or preferential provision with 883,300 88,630,000Chornobyl Disaster Victims false teeth and prosthetic devices
64. The Law of Ukraine On the Basic Principles of Social Protection 1,590,000 79,500,000of Labor Veterans and Other Elderly Citizens
65. The Law of Ukraine On the Status of War Veterans and Guarantees — —for their Social Protection
66. The Law of Ukraine On the Status and Social Protection of Free or preferential provision with 2,591,400 1,729,200,000Chornobyl Disaster Victims** facilities in sanatoriums and health
resorts as well as preferentialresort-treatment tickets
67. The Law of Ukraine On Social and Legal Protection of Servicemen 17800 89,000,000and Members of their Families*
68. The Law of Ukraine On the Status of Military Service Veterans* 22,500 5,300,000
69. The Law of Ukraine On the Status of War Veterans and Guarantees 1,171,400 1,100,000for their Social Protection
70. The Law of Ukraine On the Status of Judges* 5,500 4,000
71. The Law of Ukraine On the Rehabilitation of Political Repression 620 400,000Victims in Ukraine*
TH
E U
KR
AIN
IAN
SO
CIA
L P
RO
TE
CT
ION
SY
ST
EM
AN
D T
HE
ME
TH
OD
S O
F G
OV
ER
NA
NC
E

298
TH
E IM
PA
CT
OF
DE
CE
NT
RA
LIZ
AT
ION
ON
SO
CIA
L P
OL
ICY
Law Under Which a Privilege is Granted Exemption Type Number of FundsPersons Necessary
Eligible for the to Grant theExemption Exemption
72. The Law of Ukraine On the Basic Principles of Social Protection Free or preferential provision with 1,590,000 1,500,000,000of Labor Veterans and Other Elderly Citizens* facilities in sanatoriums and health
resorts as well as preferentialresort-treatment tickets
73. The Law of Ukraine On the Status and Social Protection of Preferential terms of granting 1,154,000 530,100,000Chornobyl Disaster Victims additional pensions/benefits
74. The Law of Ukraine On the Status of Mountainous Localities 100 20,000
75. The Law of Ukraine On the Status and Social Protection of Free or preferential provision 100 600,000Chornobyl Disaster Victims*** with a car
76. The Law of Ukraine On the Rehabilitation of Political Repression 13 100,000Victims in Ukraine
77. The Law of Ukraine On the Status and Social Protection of Compensating expenses on purchase 574,200 128,010,000Chornobyl Disaster Victims of fuel and paying for electric
power and gas
78. The Law of Ukraine On the Status of Military Service Veterans* 430 41,300,000
79. The Law of Ukraine On Militia* 170,000 16,300,000
80. The Law of Ukraine On Fire Security* 35,000 3,400,000
81. The Law of Ukraine On Priorities in Development of Rural Areas 3,866,200 62,600,000and Agroindustrial Complexes in the National Economy*
82. The Law of Ukraine On Veterinary Medicine* 2 ,100 100,000
83. The Law of Ukraine On the Status of War Veterans and Guarantees 206,367 600,000for their Social Protection
84. The Law of Ukraine On the Security Service of Ukraine* 18,000 1,700,000

299
Law Under Which a Privilege is Granted Exemption Type Number of FundsPersons Necessary
Eligible for the to Grant theExemption Exemption
85. The Law of Ukraine On Measures to Increase the Social Protection Compensating expenses on purchase 1,300 100,000of Procurators Office Employees* of fuel and paying for electric
power and consumed gas
86. The Law of Ukraine On Contributing to Self-Realization and Free or preferential rates 3,493,100 625,140,000Development of Young People in Ukraine in cultural, physical training,
and sports institutions
87. The Law of Ukraine On Physical Culture and Sport 13,325,100 2,576,000,000
88. The Law of Ukraine On the Status and Social Protection of Free or preferential rates for foodstuffs 1,189,000 1,240,200,000Chornobyl Disaster Victims
89. Decree of the Cabinet of Ministers of Ukraine (1994) No. 66 270,000 44,100,000On Additional Social Guarantees to Low-Income Families with3 Children and with Children Aged 1 and 2
90. Decree of the Central Committee of the Communist Party of the 55,500 10,000,000USSR and the Council of Ministers of the USSR (1960) No. 182
91. Decree of the Cabinet of Ministers of Ukraine (1996) No. 1032 2,000,000 314,400,000
92. Decree of the Collegium of the Ministry of Education 2,817000 591,600,000of the Ukrainian SSR
93. The Law of Ukraine On the Status and Social Protection of Providing various population 5,379,340 720,360,000Chornobyl Disaster Victims categories with benefits
and compensations
94. The Law of Ukraine On the Status of Mountainous Localities 168,100 12,800,000
95. The Law of Ukraine On the Prevention of AIDS and Social 400 100,000Protection of the Population
TH
E U
KR
AIN
IAN
SO
CIA
L P
RO
TE
CT
ION
SY
ST
EM
AN
D T
HE
ME
TH
OD
S O
F G
OV
ER
NA
NC
E

300
TH
E IM
PA
CT
OF
DE
CE
NT
RA
LIZ
AT
ION
ON
SO
CIA
L P
OL
ICY
Law Under Which a Privilege is Granted Exemption Type Number of FundsPersons Necessary
Eligible for the to Grant theExemption Exemption
96. The Law of Ukraine On the Status of War Veterans and Guarantees Providing various population 1,170,900 510,000for their Social Protection categories with benefits
and compensations
97. The Law of Ukraine On the Status of Judges 100 1,500
98. The Law of Ukraine On the Basic Principles of Social Protection 2,003,600 100,000of Labor Veterans and Other Elderly Citizens
99. The Law of Ukraine On Public Service 39,000 11,300,000
100. The Law of Ukraine On Contributing to Self-Realization and 160,800 11,900,000Development of Young People in Ukraine
101. The Law of Ukraine On the Rehabilitation of Political Repression 11,500 3,200,000Victims in Ukraine
102. Decree of the Cabinet of Ministers of Ukraine(1992) No. 143 120,000 24,600,000On the Urgent Problems of Teaching Young Children and theFunctioning of Educational Institutions
103. The Law of Ukraine On the Status and Social Protection of Other types of privileges 794,800 124,050,000Chornobyl Disaster Victims
104. The Law of Ukraine On Social and Legal Protection of Servicemen 183 ,00 6,200,000and Members of their Families
105. The Law of Ukraine On the Status of Military Service Veterans 15,700 9,600,000
106. The Law of Ukraine On the Status of War Veterans and Guarantees 3,696,700 200,000for their Social Protection
107. The Law of Ukraine On Physical Culture and Sport 1,800 400,000

301
TH
E U
KR
AIN
IAN
SO
CIA
L P
RO
TE
CT
ION
SY
ST
EM
AN
D T
HE
ME
TH
OD
S O
F G
OV
ER
NA
NC
E
Law Under Which a Privilege is Granted Exemption Type Number of FundsPersons Necessary
Eligible for the to Grant theExemption Exemption
108. Decree of the Cabinet of Ministers of Ukraine (1991) No. 352 Other types of privileges 23,500 11,200,000On Free Provision of Forestry Employees with Overalls
109. Decree of the Cabinet of Ministers of Ukraine (1996) No. 119 700 1,000,000On Approval of Temporary Procedure of Fish Industry Management
110. Decree of the Cabinet of Ministers of Ukraine (1992) No. 374 42,300 7,200,000and of 25.03.97 No. 260"
Total for all exemptions: 30,423,700,000
Under Article 62 of the Law of Ukraine On the National Budget of Ukraine for 2000 dated 17.02.2000 No. 1458-III.:* Realization is suspended for 2000** Realization is partly suspended for 2000*** Free or preferential provision with cars (apart from exceptional cases as defined by the Ministry of Labor and Social Policy of Ukraine for disabled persons
of 1st and 2nd groups with respect to locomotor disorders
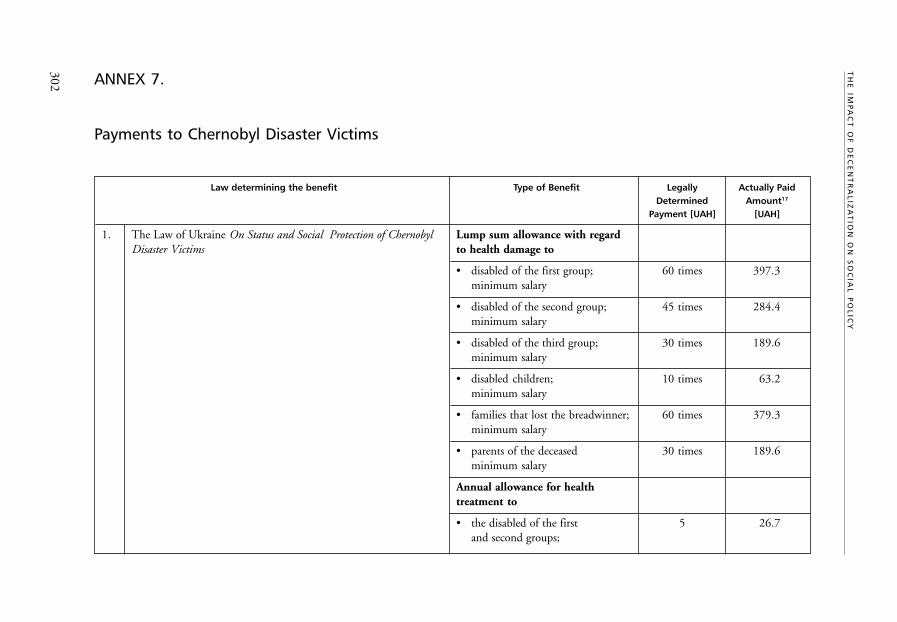
302
TH
E IM
PA
CT
OF
DE
CE
NT
RA
LIZ
AT
ION
ON
SO
CIA
L P
OL
ICY
ANNEX 7.
Payments to Chernobyl Disaster Victims
Law determining the benefit Type of Benefit Legally Actually PaidDetermined Amount17
Payment [UAH] [UAH]
1. The Law of Ukraine On Status and Social Protection of Chernobyl Lump sum allowance with regardDisaster Victims to health damage to
• disabled of the first group; 60 times 397.3minimum salary
• disabled of the second group; 45 times 284.4minimum salary
• disabled of the third group; 30 times 189.6minimum salary
• disabled children; 10 times 63.2minimum salary
• families that lost the breadwinner; 60 times 379.3minimum salary
• parents of the deceased 30 times 189.6minimum salary
Annual allowance for healthtreatment to
• the disabled of the first 5 26.7and second groups;
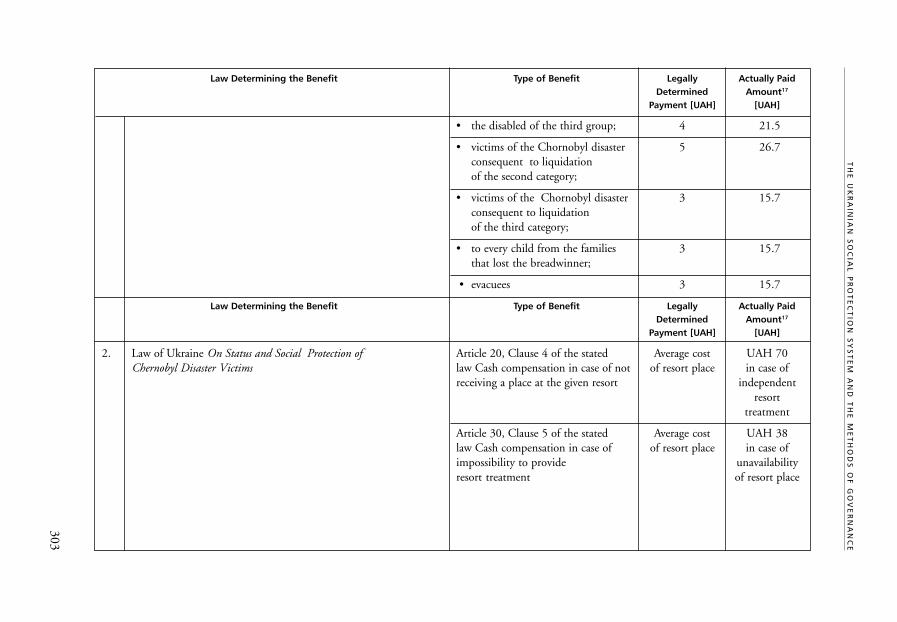
303
TH
E U
KR
AIN
IAN
SO
CIA
L P
RO
TE
CT
ION
SY
ST
EM
AN
D T
HE
ME
TH
OD
S O
F G
OV
ER
NA
NC
E
Law Determining the Benefit Type of Benefit Legally Actually PaidDetermined Amount17
Payment [UAH] [UAH]
• the disabled of the third group; 4 21.5
• victims of the Chornobyl disaster 5 26.7consequent to liquidationof the second category;
• victims of the Chornobyl disaster 3 15.7consequent to liquidationof the third category;
• to every child from the families 3 15.7that lost the breadwinner;
• evacuees 3 15.7
Law Determining the Benefit Type of Benefit Legally Actually PaidDetermined Amount17
Payment [UAH] [UAH]
2. Law of Ukraine On Status and Social Protection of Article 20, Clause 4 of the stated Average cost UAH 70Chernobyl Disaster Victims law Cash compensation in case of not of resort place in case of
receiving a place at the given resort independentresort
treatment
Article 30, Clause 5 of the stated Average cost UAH 38law Cash compensation in case of of resort place in case ofimpossibility to provide unavailabilityresort treatment of resort place

304
T H E I M PA C T O F D E C E N T R A L I Z AT I O N O N S O C I A L P O L I C Y
NOTES FOR ANNEXES
1 Labor and Social Policy in Ukraine (2000) Kyiv: Socioinform.2 According to the data of the National Statistics Committee of Ukraine.3 38.7% of the total amount of expenditures of the Consolidated Budget of Ukraine,
including the Pension Fund.4 Starting from 2001, Social Protection Fund management will be carried out on a
tri-partite basis.5 Under the law the benefit rate should amount to UAH 260 whereas the actually
paid allowance amounts to UAH 51.5 (or UAH 74 in case of difficult delivery).6 Under the law the benefit rate should amount to UAH 148 whereas the actually
paid allowance amounts to UAH 34.7 Starting from 2000, Social Protection Fund management will be carried out on a
tri-partite basis.8 Benefits rate determined by law should be UAH 74, whereas actually paid benefit
amounts to UAH 22.2 and less.9 Benefits rate determined by law should be UAH 37, whereas actually paid benefit
amounts to UAH 7.4.10 Under the law, the amount to be paid to mothers taking care of 3 children aged up
to 16 is UAH 74, and of 4 and more children aged up to 16—UAH 148. Actuallypaid benefit amounts to UAH 18.5 and 29.6 respectively.
11 Benefit rates determined by law amount to UAH 74, whereas actually paid benefitis UAH 25.9.
12 Benefit rates determined by law amount to UAH 37, whereas actually paid benefitamounts to UAH 7.4.
13 Benefit rates determined by law amount to UAH 74, whereas actually paid benefitis UAH 14.8.
14 Benefit rates determined by law amount to UAH 37, whereas actually paid benefitis UAH 7.4.
15 Benefit rates determined by law amount to UAH 148, whereas actually paid benefitis UAH 29.6.

305
Accessequal, 19, 57, 75standards of, 251to additional funds, 20to administrative services, 141to information, 75, 82to majority subsidies, 100to national records, 164to social benefits, 46, 75, 80, 204to social services, 76, 80, 81, 126, 155, 166rules of, 75
Accessibilityof public services, 142of social services, 8, 64, 167
Accountability, 82attenuated, 17for results, 82levels of, 9mechanisms, 142of good governance, 12of local governance, 8, 144of local political leaders, 40of the “need granting scheme,” 40structures, 166
Accountableto central government, 21to the Ministry of Labor and Social Policy, 235
Administration, 66, 110, 180, 208, 251, 283and the Public, 256budgets of, 245capable and functional local, 30central, 19Central Department of Social Protection of theOblast State, 236central or state territorial, 178-180, 244city, 225community, 26costs of, 78decentralization of, 245democratization and decentralization of, 144Department of Social Protection of the Rayon,City and State, 236development of, 142district, 71, 225District or City State, 280, 281financing, 112functional and branch, 207head of, 29
Head of the Oblast State (Governor), 208, 209health insurance, 108inspection, 281Kyiv City State, 70Kyiv and Sevastopol city, 208local, 34, 35, 36, 125, 138, 237local state, 241, 242, 244, 251members of, 16Minister-without-Portfolio for State, 143Monitoring Committee of the Chernivtsi OblastState, 215national, 141oblast state, 208, 209of benefits, 127of contributions, 157, 170, 171of local municipalities, 28of payments, 157of services, 161of social insurance, 171organization of, 141process of, 144public, 5, 8, 9, 12, 15, 21, 23, 25, 26, 27, 29, 32,75, 103, 112, 114, 124, 141, 166, 171, 210, 238Public, 256Public Policy and Administration, 86Rayon/city state, 224Rayon/District State, 289Rayon State, 209reform, 30, 75regional, 141regional state, 238revenues of, 246self-, 83social, 7, 129, 166Social Departments of District State, 280social insurance, 136, 171social policy, 26, 135, 161Social Policy and, 130state, 176, 208, 223State Taxation, 279, 281, 284structure of, 166sub-national level, 60Subsidy Departments of District State, 279to local level, 5trusteeship, 118U.S. Department of Social Policy and, 42welfare, 34, 106
Administrativeaccess to, 231accountable, 235
Index
306
T H E I M PA C T O F D E C E N T R A L I Z AT I O N O N S O C I A L P O L I C Y
actors, 82authority, 7authority bodies, 241budgets of, 245bureaucracy, 30capacities, 10, 29, 32, 139central, oblast and rayon, 75Conceptual and, 84, 86conditions, 25constraints, 56control, 278, 279, 281, 282, 283, 284, 285, 286,287, 288, 289, 290, 291costs, 36, 41, 269, 270, 272, 273data, 59decentralization, 21Districts, 85, 87, 165division, 207, 208duties, 36elite, 139expenditures, 253functions, 225institutions, 140, 145, 231issues, 221leave (holidays), 45, 214legal control, 124levels, 5, 143, 235, 238measures, 9organization, 140presidential-, 27procedure, 82, 115, 227provider, 166poverty line, 65, 123power, 30rayons, 143reform, 141, 143, 144, 242, 244Reform in Ukraine, 256regions, 141, 143responsibility, 32services, 141staff, 21, 82State, 177, 180structure, 10, 141, 143, 207, 208sub-national, 57, 63system, 11, 83, 101, 138, 140, 141tasks, 36-territorial, 141, 143, 175, 242, 244-5, 249territory, 141, 176traditions, 25, 26unit, 21units, 102, 141wills, 32
Allocationaccounts, 33allocations, 9, 76, 266and Financial Policy of Ukraine, 256and Fiscal Review, 254, 257
and taxes, 247annual, 106, 117approval of, 210arrears, 37budget, 9, 76budgetary, 150criteria, 110, 120Departments of Pension, 236entity, 110from central government, 10from national government, 274from state budget, 266for joint development projects, 210fund, 57Housing Subsidy, 227of income, 142of power, 118of resources, 6, 164of welfare systems, 76resource, 77, 166territorial, 39
Budgetbenefits, 225, 251beyond-budgetary funds, 246bias towards, 245burden of social protection on, 242cash benefit, 61central, 6, 14, 40, 61, 62, 95, 108, 118, 206central and local, 17central state, 104city, 35consolidated, 190, 251, 267-76consolidation, 40cuts in, 49data on welfare, 118decentralization, 245, 250deficit(s), 14, 33, 212, 244, 249disability, maternity and sickness, 169, 170, 171distribution, 35, 60, 249, 250employment, 169, 170, 171expenditure(s), 48, 148, 150, 234, 245, 251financing control, 277-303financing public services, 246Fiscal Analysis Office of the Budget Committeeof the Parliament of Ukraine, 244, 247for 2001, 46, 265forecasting, 248formation, 242funding, 264horizontal leveling of local, 248independent local, 144law, 142, 161law On the National Budget of Ukraine, 250lines, 210linked, 150

307
local, 35, 39, 57, 142, 143, 145, 160, 161, 177,210, 224, 225, 237, 243, 246, 247“minimum of local budget determined by law”, 247municipal, 77national, 161, 204, 207, 221, 230, 244, 267national general, 77, 163, 170, 171national or local, 158national special, 77, 163no money in, 43oblast, 57, 242, 246, 249occupational accident, 169, 170, 171of community-based care, 61of Kyiv and Sevastopol, 242, 248of local governments, 107of Lviv, 248of self-government institutions, 18of state administrative institution, 177of the Crimean Autonomous Republic, 242of total state, 107“own budget”, 32, 49, 108, 112planning, 38, 107preferences of political elite, 109poverty relief, 58public policy, 12ratio of, 244rayon, 66, 245, 246regulation of, 142resources, 210, 250revenues, 210, 211, 212, 244, 249salaries of administrators, 78self-governments’ own, 118social, 148, 243, 267social assistance, 40, 263Social Budgeting in Ukraine, 257social insurance, 169, 193, 221social insurance special, 152, 162, 170, 171social security, 170Soviet state, 138special, 157, 171state, 112, 142, 211, 224, 246, 264State, 50, 52, 53, 54State Budget Act, 112state pension, 169, 170, 171subsidies, 213, 245, 246, 247, 251surplus, 247survey, 151total, 60town, 67transfers, 249, 250, 251, 263transparency, 157Ukrainian, 234wage bill, 33welfare, 61
Budgetaryalignment, 143allocations for financing employment, 150
and fiscal considerations, 106basis of budgetary system, 248categories, 31crises, 64expenditure, 146figures and data, 57formula, 247funds, 21, 33, 112extra, 33independent resources, 143inter-budgetary relations, 242, 250, 251issues, 143law On Budgetary System of Ukraine, 244, 255means, 68netting-out, 33limits, 76limitations, 36plans, 60privileges, 33reforms, 34, 251revenues, 147rules, 63social, 74Social, 86stabilization, 34system, 242, 243, 245transparency, 170units, 250
Bureaucracy=Public administration, 29-30, 65
Bureaucratic-Bureaucraticallybarriers, 235control, 13hierarchy, 21pressure, 240procedure, 14, 15, 231, 253resistance, 32supervision, 21techniques, 74-75way of benefits, 126welfare administration, 76
Capacityadministrative capacity of the states, 139building, 6, 63Capacity Development of Social“capacity granting,” 38capacity-normative, 39decision-making, 166for interest enforcement, 73in providing social assistance, 165industrial capacity of Ukraine, 213lack of (financial), 127lobbying, 105loss of working, 156, 170, 221-222
I N D E X
308
T H E I M PA C T O F D E C E N T R A L I Z AT I O N O N S O C I A L P O L I C Y
negotiation, 17of cheap, day-care services for children, 55, 112of local administrators, 237of local communities, 76, 126of social care services, 58of territorial centers, 232of the decentralized agents of social policy, 10of the labor market institutions, 46Protection Authorities, 238
Care (social care) see social care
Cash allowance, 43, 67, 119, 221, 234
Cash-benefit 7, 206, 222, 226,based on, 55, 64-65, 69, 80, 126, 129, 155, 265,269, 277-291managed by, 61, 66, 118measuring, 36, 55-56, 58, 99, 111, 127transferred into in-kind benefit, 68regulated, 75, 158Soviet region, 47, 206, 211, 217, 222-224, 226,231-232, 236, 253
Cash-flow 44, 77-78, 163
Charges, 32, 37-38, 115
Civil servant, 78, 237
Civil service, 21, 27, 142
Communication, 14, 17, 76, 127-128, 176, 227, 236,244, 296
Community, 14, 26, 40, 102, 158, 208, 247based, 57-58, 60-61, 81, 101governments, 102, 108, 112, 115, 126jobs, 44, 68-69, 149, 176local, 26, 38, 6, 101, 103, 118rural, 9
Compensatory (mechanism), 19, 32, 36, 39, 67, 109,138, 156, 167-170, 172, 229, 234-235,
Competence, 20-21, 28, 55, 72, 117, 124, 160, 237
Competition, 13-14, 19, 23, 72, 140, 162
Conflict, 13, 16-17, 63, 72, 103, 143, 152
Contracting-out, 23, 116
Contribution, 48, 61, 113, 115, 117, 156-157, 167,170, 259, 265
Control, controlling, 4, 10, 18, 21, 31, 37, 55, 56, 58,63, 69, 74, 81-83, 128, 146, 162, 165, 210, 213, 231,237-238, 241, 278-279, 283-284, 286-288, 290-291
central, 82civil, 75-76
financial, 6, 31, 63, 124, 236, 251, 253, 278-291legal, 6, 71, 124, 278-291quality, 63
Co-operation, 9, 13, 17, 70, 117, 120, 141, 155, 162,234
Corporation-corporative, 10, 15, 21-22, 72
Cost, 38, 40, 48, 60, 62-63, 76-78, 83, 127, 164, 221,226, 231
administrative, 36, 41, 61, 269-270, 272-23average, 283-290, 292, 303, 239cost-effective, 36, 162housing, 67, 121, 151of the consumer basket, 261operational, 103, 117, 126, 265production, 18, 226transportation, 164
County, 8, 39, 62, 70-71, 73, 80, 101-103, 106,114-117, 126-127
Coverage, 41, 75, 100, 112
De-concentration, de-concentrated, 3, 11, 13, 21, 75, 141
Delegation (delegated), 5, 21, 34, 36, 73-74, 77, 124,138, 144, 146, 162, 177, 210, 222, 238, 250-251
Democracy, democratic, 5, 15, 25-27, 30, 43, 46, 63,65, 71, 73, 81-82, 95, 101-102, 143, 207, 261
grass root, 8local, 16, 81, 76participation, 16-17, 4representative-parliamentary, 15, 101, 25, 140transition, 30, 93
Demogrant, 47, 50
Discretion, 38, 58, 65, 70, 75, 79-80, 107, 112, 124-125,162-163
Discrimination, discriminatory, 17, 26, 31, 69, 55,80, 82, 122, 125, 213
Distribution, 17, 47, 49, 75, 79, 81, 164, 213, 248-250budgetary, 35, 60, 245, 248functions, 20141, 146, 166, 172, 238of income, 97, 99, 139perversity of, 62, 79, 100, 242responsibility, 20, 75, 139, 176, 191social services, 63-64, 162, 230
Earmarked revenue, 33-34, 246-247, 267-268, 270,272, 274, 276
Efficiencycost-effective, 36, 162
309
Eligibility, 8, 46, 65-67, 70-71, 78, 118-121, 125, 167,250, 277-278, 280-289, 291
Employment, 53, 69, 144, 149-150, 167-168, 176,191, 214-215, 252, 262, 264, 271, 273
Centers, 36, 46, 227, 236, 264-265, 280, 282-283council, 22for the disabled, 191full, 46, 100-101, 138, 214Fund, 33, 67, 83, 253, 264, 278inequalities, 38level of, 45, 94, 100, 107, 148, 184-187, 205,213, 218period, 262-263, 277, 281, 284policy, 5, 22, 149-150,record, 205, 291related social provisions, 104, 150rights, 264security of, 44skill, 68special employment budget, 157, 169-171State Employment Department, 277, 280State Service, 68, 149, 264-266structure, 44 ,148
Entitlement, 8, 47, 58, 69-70, 84, 120, 122, 167, 262
Equal access, 19, 57, 75, 77, 126, 155, 251
Equalization, 77, 163, 200, 247
Equity, equitable, 19, 38, 40, 63, 65, 75, 78, 80-81,124, 257
Evaluation, 4, 9, 73, 81, 87, 117, 127, 148, 254, 256
Exclusion (social), exclusionist, 38, 74, 77, 80, 82, 153,163
Expenses, 13, 36, 46, 56, 67, 69, 158, 221, 226, 265,298-299
Familyassistance, 40, 48-49, 66, 113,benefits, 42, 47, 50-54, 67, 72, 101, 108-111,158, 192-193, 206, 225,income, 66-67, 112, 158, 224, 284policy, 159protection, 55, 104, 112, 199, 222support, 4, 42, 47-49, 55, 84, 91, 108-109,120, 224
Fees, 142, 145, 163, 267-268, 270, 272, 274, 276
Financingexternal, 249insufficient, 245,local governments, 78of public services, 245-246, 264
social policy, 6, 38-39, 43, 44, 50-54, 61, 67,74, 76, 106, 137, 242, 250-251, 261, 264, 267state-, 23, 242
Fiscal, 32, 33, 37-38,aspects, 6, 8, 166control, 31, 63data, 57decentralization, 6-7, 31-32, 37, 40measures, 59, 63, 79, 112planning, 60resources, 59, 66system, 31-32
Governance, 7, 26, 28, 74, 141balanced, 143central, 31, 35decentralized, 71, 74, 124efficiency, 27failure, 11framework, 7good, 12, 15local, 8, 28, 29, 41, 74, 142methods, 10, 26, 60, 74, 197, 203middle level, 66, 127self-, 155, 208, 245, 250self-reliant, 32type, 7
Grantingarrangements, 38capacity-, 38exemptions, 275need assessment, 40normative, 38, 62of benefits, 68-69, 71, 171-172, 277,280-291, 298of subsidy, 278-279scheme, 40, 32, 38
Health service, health care, 5, 7, 22, 26, 44, 100,103-104, 144, 148, 151, 153, 155, 176, 178, 206,240, 243, 281, 283
Home visit, 55, 58, 66, 69, 120, 122,
Housing, 5, 22, 95, 100, 153, 176, 276, 278-279, 206allowances, 65, 67-68, 119, 121benefit, 68, 122, 158conditions, 245,costs, 67, 121, 151, 278policy, 5, 7,social, 121, 178subsidies, 32, 67, 95, 226-227, 238, 243, 251,270, 278
Incentive, 9, 73, 131
Income transfer, 47
I N D E X
310
T H E I M PA C T O F D E C E N T R A L I Z AT I O N O N S O C I A L P O L I C Y
Index, indexation, indexing, 40, 47, 49, 52, 55, 68, 93,108-109, 124, 148, 152, 167, 213, 218, 220, 230, 244,248
Inequality, 38, 81, 204, 213, 218
Information, 115, 119, 139
Labor market, 7, 22, 51, 65, 95, 97, 148-150, 153,155, 205, 213, 215, 263
funds, 104organizations, 21, 46, 120policy, 45,women on the, 55, 112, 224
Leakage, 80, 118
Legal, 8, 25, 166, 221, 242action, 127acts, 28, 32, 64, 155, 158, 160autonomy, 20,background, 177basis, 70, 104, 124, 168, 211, 243bodies, 235branch, 63control, 6, 71, 124, 278-291definition, 35expert, 124framework, 211, 241guarantee, 105mechanism, 124obligation, 22, 59, 229person, 66, 142, 161, 261regulation, 28, 40, 57-58, 65, 68, 73, 75, 106,119, 124-125, 141, 166, 206, 213, 223, 225,229, 237, 240-241, 247, 250, 253, 258-259,263, 277, 292requirement, 126rights, 7, 75sanctions, 251security, 71, 124semi-legal, 44,standard, 82status, 29, 81, 102, 228support, 241
Legislation, legislative, 6, 8-9, 26, 32, 35, 75, 98,105, 120, 124-125, 137-138, 155, 165, 231, 234,241, 260-261, 266
administration, 176authorities, 25, 241basis, 242,branch, 207economic, 213framework, 64, 252,initiative, 140, 241legislature, 211power, 6, 125, 140
review, 166standard, 222
Localauthority, 9, 22, 23, 25-26, 37, 57-58, 61-63, 68,75, 77, 225, 242-251, 249, 281community, 26, 38, 76, 81, 101, 118council, 28, 34, 294government, 3, 6, 9, 11, 18, 22-26, 33, 68, 71, 74,77, 79-81, 85-87, 102, 107, 116, 126, 128, 131,141-146, 158, 160-161, 163-165, 177, 195, 236regulation, 9, 28, 70, 118, 120, 124-125,self-government, 18, 28, 31, 38, 58, 67, 70, 75-76,78, 101-109, 112, 114-118, 120-128, 142, 145,207-208, 210, 242-243, 245, 247, 250-251
Low-income (families), 47-50, 54, 57, 65-66, 69, 158,164, 206, 224-225, 232, 241, 251, 269, 272, 279-280,295, 299
Management, 5, 10, 17, 30, 56, 63, 74, 78-79, 102-103,106,162, 222, 238
central, 21-22crisis, 13, 16, 71debt, 67, 79, 121decentralization, 74, 242of funds, 46, 304-305public, 15, 28, 166system, 28, 142techniques, 18, 144
Marginal-marginalization, 72, 82
Market (economy), 5, 12, 28, 93, 147, 151, 153-154, 162
Means-test(ed), 7, 36, 41, 47, 49-50, 58,
68-70, 4, 104, 112, 120-123, 253, 280
Monitoring, 17, 60, 82-84, 87, 165, 215, 228, 254, 256
Municipality, 26, 61, 102-103, 120, 141, 176
Non-governmental, NGO, 10, 13, 15, 18, 61, 74,83, 112-113, 117, 127-128, 135, 143, 145-147, 152,159, 162, 226, 240-241, 252-253
Non-profitorganization, 57, 62, 104-105, 112, 117, 170-171sector, 6-7, 16, 22, 104, 240
Oblast, 57, 75, 208-210, 215, 229, 233, 236-237,240, 242, 246-249, 251-252, 258
Parliament, 15, 20-21, 26-27decision-making in, 106elections, 25, 140, 207Hungarian, 101Latvian, 140Ukrainian, 65, 207, 209, 220-222, 235, 246,259-261

311
Pension, 7, 33, 43, 51, 53, 65, 100, 119-121, 138,190, 206, 211, 233, 238, 243
age, 43amount of, 93, 94 ,121, 123, 147, 151-152,167, 205, 217-218, 229, 234, 259-261, 291disability, 72, 156, 190, 228-229, 231Fund, 33, 43, 104, 224, 233-234, 252, 260-263,270-272history of, 42in kind, 18, 36indexing, 152, 167insurance based, 41, 44Law, 64, 204low-income pensioners, 68, 101, 109, 231number of pensioners, 43, 95, 190, 205, 220,227-228, 260, 262old-age, 205, 291pensioners’ organization, 152, 163privatized, 5, 22reform, 22, 167special pension budget, 157, 169, 171system, 36, 41-42, 136, 167, 204, 252, 259, 261voluntary, 43, 156, 168, 170, 252, 262
Poverty-, poverty relief, poor, 17-19, 38, 97, 101, 126,139, 151, 153, 163, 218
relief, 38, 50, 58-59, 109, 139, 149, 163
Report, 36,child, 54-55, 111extreme, 64,increasing, 16, 27, 51, 64, 95, 97, 159, 220line, 65, 75, 80, 110, 123, 152, 154, 218-220,253, 261, 265, 291local, 40,rate, 46, 51, 98-99, 152, 220reduction, 47, 49, 110, 153risk of, 99, 111
Predictability, 40, 73
Private, privatization, 3, 13-14, 22, 147-148, 178, 211enterprises, 5, 211, 226, 229, 240organizations, 10, 20, 22-23, 61-62, 116, 146, 148pension, 5, 42-43, 168property, 144sector, 7, 15-16, 145-147, 149, 162, 163, 211, 213welfare, 22
Professional standard, 63, 78
Publicadministration, 5, 8-9, 12, 15, 21, 23, 25-30, 32,75, 103, 112-113, 124, 141-142, 166, 171, 238expenditure, 31, 57, 61, 95, 107, 148finance, 84, 256services, 3, 8, 11, 13-14, 22-23, 28, 30, 38, 62,74, 81, 102, 142, 144-145, 246, 251, 260, 290,
293, 300spending, 18
Rayon, 35, 57, 59, 64, 66-67, 208-210, 224, 230,236-238, 242, 245-247, 252, 258, 289
Recession, 11-12, 49, 91, 93, 211
Recipient, 65-66, 68, 123, 234, 253, 283-291, 295
Redistribution, 5, 75, 83, 99
Region, regional, 30, 103, 114,authorities, 9, 22, 102, 103, 141-142, 176, 178-180difference, 19, 27, 77, 80-81, 99, 148, 151, 213,240, 247, 250-251level, 15, 19, 30, 107, 141, 166, 208, 239policy, 30regional units, 29-30, 32, 141, 143, 207
Residential (institutions), 23, 30, 56-57, 59-63, 114, 116
Responsibility, 5, 16, 33, 40, 55, 58, 68, 102-103, 105,118, 120, 142, 221, 237, 250
administrative, 32distribution, 20, 22, 159employee, 157financial, 138, 277, 291joint, 14, 163parental, 154public, 6shifting, 6-7, 9, 17, 77
Revenue, 4, 31, 33, 37-38, 141, 170-171, 211, 246-250
Romany, 101
Rural-urban divide, 77
Selection, 64-65, 75
Social assistance, 22, 35, 55, 64-71, 80, 112, 115, 118,124-125, 151, 157
benefits, 46, 80, 119, 125, 158, 161, 238by local governments, 5, 29, 55, 145, 162-163,191, 237cost of, 81decentralization, 163eligibility for, 80, 250,for the poor, 47, 154, 176, 238funding, 35-36, 38, 40, 71, 81, 161-162, 263institutions, 59, 158, 224, 232, 235-236legislation on, 71, 146, 155, 158living on, 105,minimum level, 75NGOs’ participation in, 163,regular, 50, 119-120, 122, 123,rights to, 138,types of, 70, 101, 119, 126, 157, 231
I N D E X
312
T H E I M PA C T O F D E C E N T R A L I Z AT I O N O N S O C I A L P O L I C Y
Social care, 4, 18, 56-59, 61-62, 86, 102, 112, 115-116,118, 127, 144, 146, 157-158, 176, 191, 195
Social insurance, 5, 21-22, 33, 42, 44, 47, 49, 52, 54,61, 64, 67, 95, 99, 104, 122, 135-136, 144, 152,155-157, 161, 164, 167-172, 176, 193, 199, 204,206, 221-222, 224-226, 239, 243, 253, 257, 266,273, 275, 281-282
Social protection system, 14, 33, 41, 43, 64-65, 104,118, 137, 150, 153, 155, 197, 203, 215, 228, 259
reform, 74, 221, 235, 237
Social provision, 13, 19, 21, 73, 105, 138, 200, 221,250, 267, 276
Social schemes, 12, 14
Social security, 8, 42, 50-55, 70, 91, 103, 106, 130,137-138, 144, 154-155, 161, 166, 170, 190, 192-193,212, 235, 241, 264-265
Social services, 4-8, 14, 18, 23, 26, 39, 46-47, 56,58-63, 75, 77-78, 83, 91, 103-104, 108, 113-115,117, 123, 126, 128-129, 146, 155, 158, 162, 164,166-167, 199, 221, 226, 230-231, 233, 235-236,240-241, 246, 250, 253, 264-265, 270
Social welfare, 8, 31, 33, 37, 46, 71, 72, 75, 178,282-290
Social work, 12, 56-61, 63, 69, 120, 164-165, 237,246
Statehood, 3, 20, 23-25
Stigmatizing, 69, 122
Sub-national, 24, 29-30, 32, 34-35, 37, 57, 60, 63, 242
Subsidiarity, 14-15, 118, 125, 141
Subsidy, 23, 53-54, 70, 113, 117, 226-227, 231, 249,270, 278-279
Supervision, supervisory, 4, 21, 63, 74, 81-83, 103,113, 124, 143, 146, 162, 239, 278, 284
Target groups, 14, 19, 75
Targeting, 31, 33, 36, 41, 47, 50, 60, 64, 76, 80, 83,127, 131
Taxavoidance, 260-261NGOs, 23, 146, 240policy, 6, 31-32, 38, 44, 46-47, 49, 54, 99, 226,240, 250-251, 253revenues, 17, 37, 61, 77-78, 110, 139, 142,145, 163, 167, 205, 243, 246-248, 264,
267-268-274system, 69, 79, 139, 157, 170-171, 210, 213,230-231, 265, 279, 282-284
Transitionof the budget, 5-7, 10, 16, 41, 48, 71-72, 103,125, 166, 242economic, 12, 18, 44, 64, 82, 98, 146-147,151-153, 210, 218-219political, 12, 20, 24, 26-28, 30, 93, 101, 207
Transparency, 8, 12, 33-34, 40, 82, 128, 157, 167,170, 251
Unemploymentbenefits, 36, 46, 72, 95, 104, 110-111, 120-123, 150, 153, 156, 169-170, 221, 243, 277-280comes together with, 19, 94,147-148, 149, 152, 156, 171, 219effects of, 12, 55, 96-97, 99, 112, 139, 144,148-149hidden, 44, 138-139, 205system, 36, 41-42, 44-46, 69, 79, 95-96,148-150, 152-153, 156, 166, 168-170, 176,206, 212-214, 225, 241, 264-266, 273
Urban, 30, 32, 40, 163, 175, 180, 203, 216
Welfare, 31, 33, 41, 130, 178program, 19, 76-81state, 5-6, 11, 12, 14, 26, 100, 130, 138system, 10, 14, 21-22, 64, 72-73, 76, 79, 82,100, 103-104, 118, 139


