The Impact of e-Commerce on the Japanese Raw Fish Supply Chain Kazunari Watanabe Northwestern University Chicago, Illinois Edmund W. Schuster‡ MIT Auto-ID Center 23 Valencia Drive Nashua, NH 03062 Email: [email protected]Web Site: www.ed-w.info ‡Corresponding Author
Transcript
The Impact of e-Commerce on the Japanese Raw Fish Supply Chain
ABSTRACT In this study, we conducted primary research to determine the state of e-commerce in Japan. Two groups of internet retailers selling fish were identified. The first group, small e-commerce companies, failed to meet consumer expectations because of channel conflict, logistics issues, and lack of resources. The second group, established retailers with e-commerce operations, had few incentives to increase Internet sales. Although Japanese consumers, businesses, and the government expected huge benefits from e-commerce, no evidence exists to support this supposition.
2
1. INTRODUCTION
During the late 1990’s, Japanese consumers, businesses, and the
government expected huge benefits from business-to-consumer (B2C)
electronic commerce. Consumers expected lower prices. Japanese and
foreign businesses expected a lower barrier to entry into the world’s
second largest consumer market. Finally, the Japanese government
expected an economic revival and source of future growth.
In 2001, the Ministry of Economy, Trade and Industry, or METI,a
forecasted that within five years the amount of Japanese B2C e-
commerce would become sixteen times larger.8 The Japanese business
press supported this forecast, citing various socio-demographic changes
that favored Internet shopping. Everyone agreed that e-commerce would
spur productivity, create new markets and reduce energy consumption.
To understand the validity of these projections, we conducted
primary research to determine the current state of Japanese e-commerce.
All data was gathered during a trip to Japan in January 2001. We chose
the fresh fish supply chain to assess the effectiveness of e-commerce.
Fresh fish was an important aspect of the Japanese diet and its
distribution system one of the most complicated in Japan.
The study is divided into five parts; 1) literature review, 2)
description of methodology, 3) presentation of the results, 4) discussion,
and 5) conclusion.
a METI is the new name for MITI (Ministry of International Trade and Industry) as of January 2001.
3
2.0 LITERATURE REVIEW
We found few references written in English about Japanese e-
commerce. However, a visit to Japan uncovered many local publications
on the topic. This literature consistently projected significant growth
opportunities for Japanese e-commerce, citing the greater number of
Internet users, an aging population, and the increasing number of working
women. According to a study conducted by the Japanese government, the
e-commerce market would dramatically expand from Yen 824 billion ($6.6
billion) b in 2000 to Yen 13.3 trillion ($106 billion) in 2005.8 Several
publications warned of problems, but criticism was limited to issues such
as fraud and security of personal information.
This sharply contrasted with the situation in the United States and
Europe, where researchers investigated e-commerce from many different
perspectives. Naming only a few recent works, researchers addressed
important topics including cross-industrial perspectives,14 pricing and
brand name,4 security,1 agents,2 and legal issues.15 The greater range of
analysis allowed for multifaceted discussion of Western e-commerce
opportunities and a great deal of entrepreneurial activity. In contrast, e-
commerce in Japan took a different direction.
b $ = Yen 125, unless otherwise stated.
4
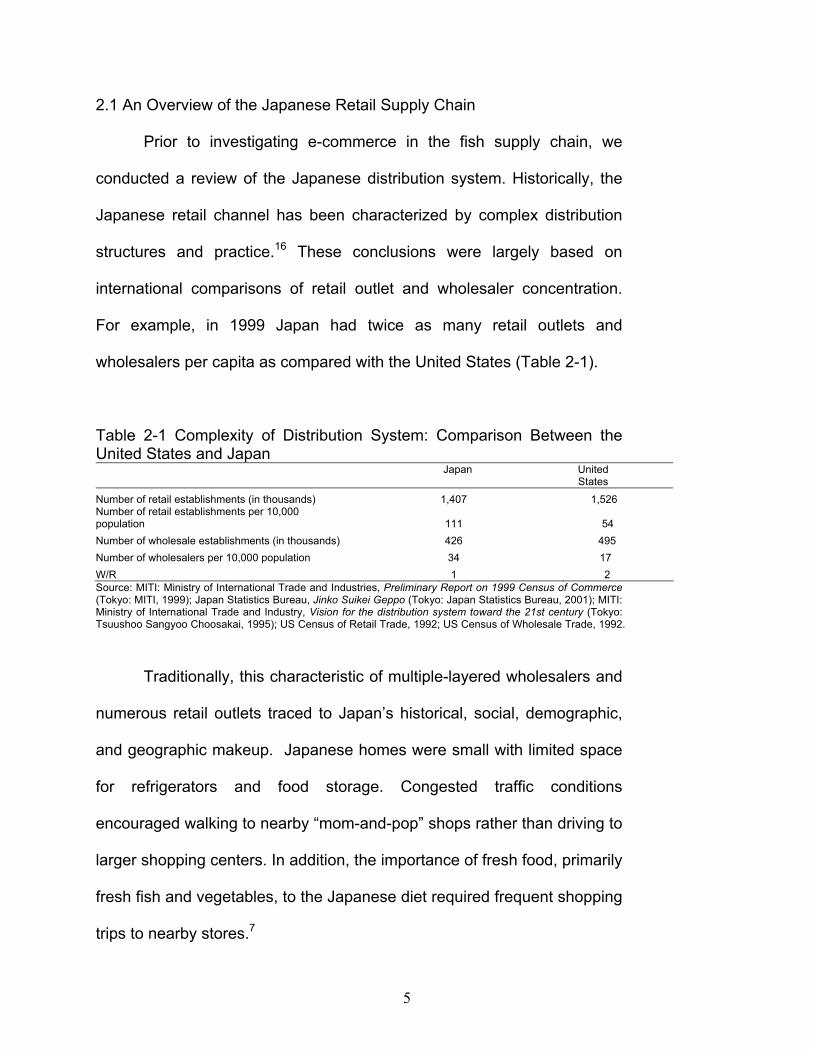
2.1 An Overview of the Japanese Retail Supply Chain
Prior to investigating e-commerce in the fish supply chain, we
conducted a review of the Japanese distribution system. Historically, the
Japanese retail channel has been characterized by complex distribution
structures and practice.16 These conclusions were largely based on
international comparisons of retail outlet and wholesaler concentration.
For example, in 1999 Japan had twice as many retail outlets and
wholesalers per capita as compared with the United States (Table 2-1).
Table 2-1 Complexity of Distribution System: Comparison Between the United States and Japan
Japan United States
Number of retail establishments (in thousands) 1,407 1,526 Number of retail establishments per 10,000 population 111
54
Number of wholesale establishments (in thousands) 426 495 Number of wholesalers per 10,000 population 34 17 W/R 1 2 Source: MITI: Ministry of International Trade and Industries, Preliminary Report on 1999 Census of Commerce (Tokyo: MITI, 1999); Japan Statistics Bureau, Jinko Suikei Geppo (Tokyo: Japan Statistics Bureau, 2001); MITI: Ministry of International Trade and Industry, Vision for the distribution system toward the 21st century (Tokyo: Tsuushoo Sangyoo Choosakai, 1995); US Census of Retail Trade, 1992; US Census of Wholesale Trade, 1992.
Traditionally, this characteristic of multiple-layered wholesalers and
numerous retail outlets traced to Japan’s historical, social, demographic,
and geographic makeup. Japanese homes were small with limited space
for refrigerators and food storage. Congested traffic conditions
encouraged walking to nearby “mom-and-pop” shops rather than driving to
larger shopping centers. In addition, the importance of fresh food, primarily
fresh fish and vegetables, to the Japanese diet required frequent shopping
trips to nearby stores.7
5
From a business perspective, small stores that required minimal
capital investment were a major source of employment for retired persons,
who historically received fewer social security benefits than in other
industrialized countries.18 Retirees frequently lived on the premises and
relied on family help to keep operating costs low. The large number of
small stores also served as a cushion against unemployment during
economic downturns, such the oil crises of the 1970s.7
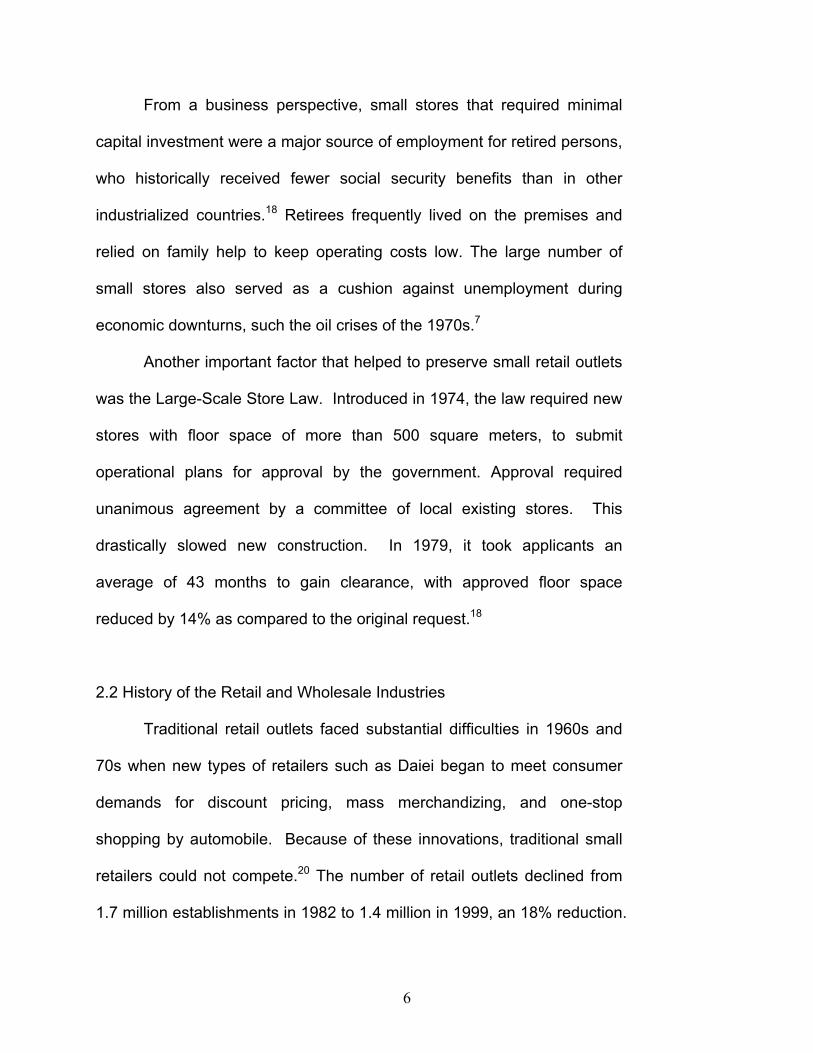
Another important factor that helped to preserve small retail outlets
was the Large-Scale Store Law. Introduced in 1974, the law required new
stores with floor space of more than 500 square meters, to submit
operational plans for approval by the government. Approval required
unanimous agreement by a committee of local existing stores. This
drastically slowed new construction. In 1979, it took applicants an
average of 43 months to gain clearance, with approved floor space
reduced by 14% as compared to the original request.18
2.2 History of the Retail and Wholesale Industries
Traditional retail outlets faced substantial difficulties in 1960s and
70s when new types of retailers such as Daiei began to meet consumer
demands for discount pricing, mass merchandizing, and one-stop
shopping by automobile. Because of these innovations, traditional small
retailers could not compete.20 The number of retail outlets declined from
1.7 million establishments in 1982 to 1.4 million in 1999, an 18% reduction.
6
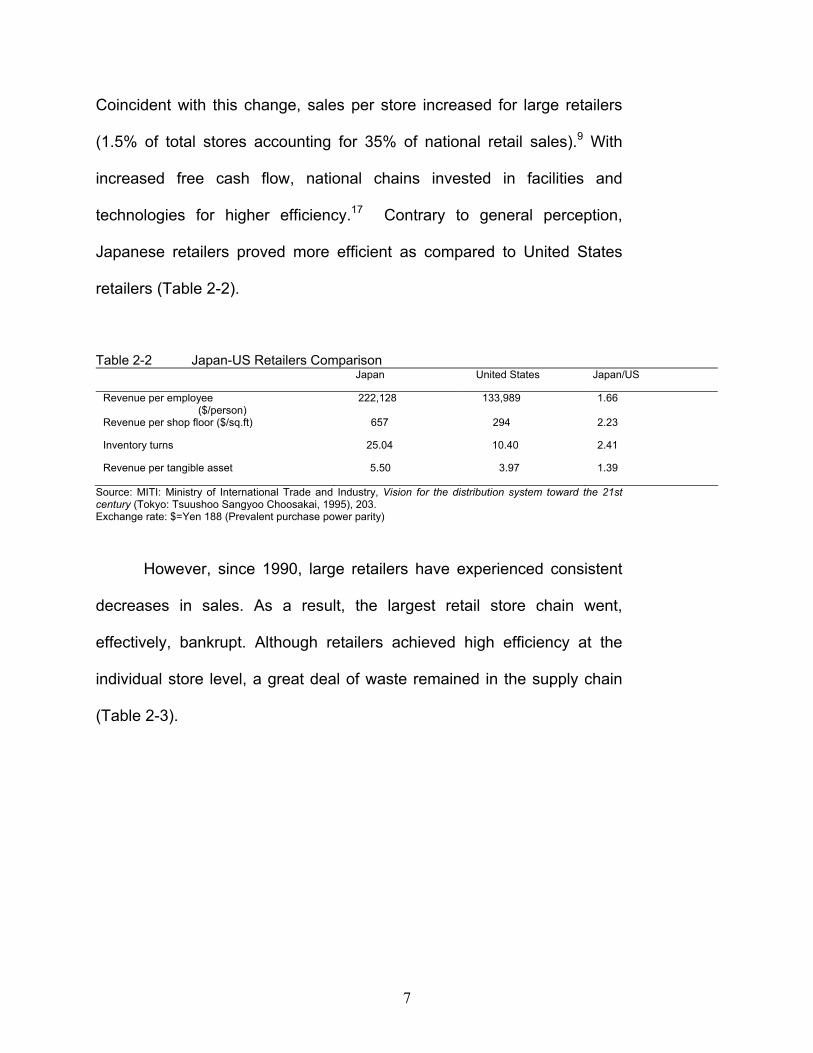
Coincident with this change, sales per store increased for large retailers
(1.5% of total stores accounting for 35% of national retail sales).9 With
increased free cash flow, national chains invested in facilities and
technologies for higher efficiency.17 Contrary to general perception,
Japanese retailers proved more efficient as compared to United States
retailers (Table 2-2).
Table 2-2 Japan-US Retailers Comparison Japan United States Japan/US
Revenue per employee ($/person)
222,128 133,989 1.66
Revenue per shop floor ($/sq.ft) 657 294 2.23
Inventory turns 25.04 10.40 2.41
Revenue per tangible asset 5.50 3.97 1.39
Source: MITI: Ministry of International Trade and Industry, Vision for the distribution system toward the 21st century (Tokyo: Tsuushoo Sangyoo Choosakai, 1995), 203. Exchange rate: $=Yen 188 (Prevalent purchase power parity)
However, since 1990, large retailers have experienced consistent
decreases in sales. As a result, the largest retail store chain went,
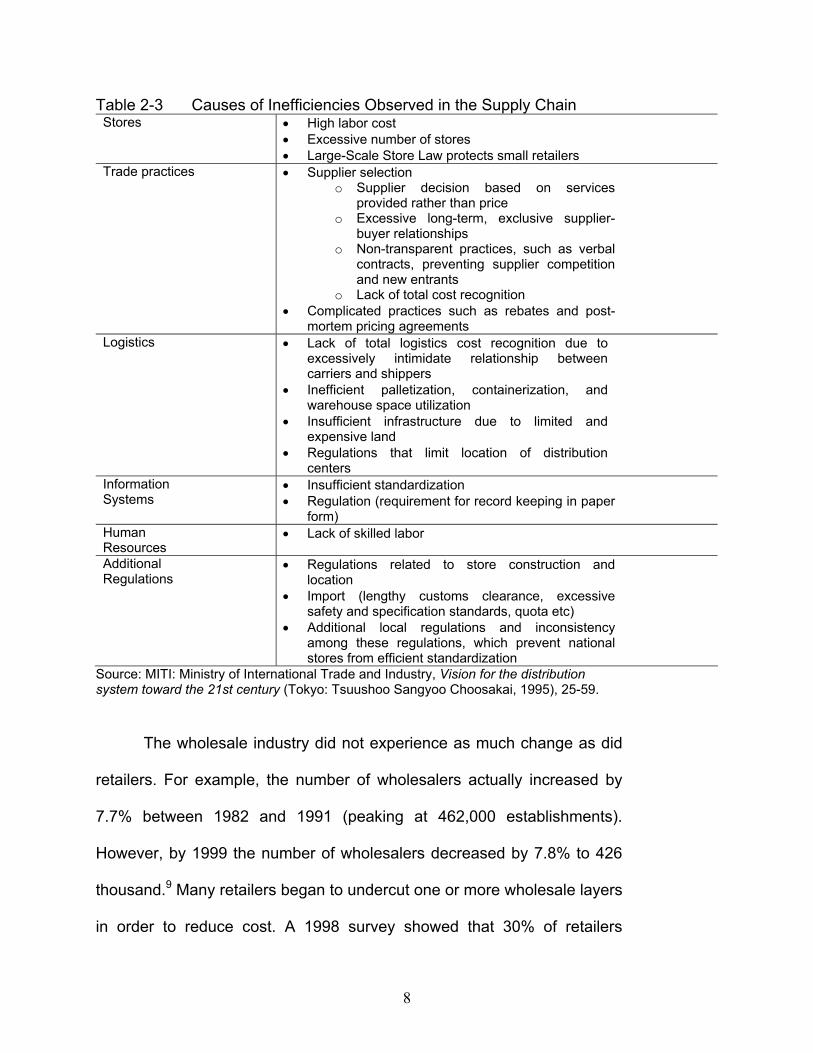
effectively, bankrupt. Although retailers achieved high efficiency at the
individual store level, a great deal of waste remained in the supply chain
(Table 2-3).
7
Table 2-3 Causes of Inefficiencies Observed in the Supply Chain Stores • High labor cost
• Excessive number of stores • Large-Scale Store Law protects small retailers
Trade practices • Supplier selection o Supplier decision based on services
provided rather than price o Excessive long-term, exclusive supplier-
buyer relationships o Non-transparent practices, such as verbal
contracts, preventing supplier competition and new entrants
o Lack of total cost recognition • Complicated practices such as rebates and post-
mortem pricing agreements Logistics • Lack of total logistics cost recognition due to
excessively intimidate relationship between carriers and shippers
• Inefficient palletization, containerization, and warehouse space utilization
• Insufficient infrastructure due to limited and expensive land
• Regulations that limit location of distribution centers
Information Systems
• Insufficient standardization • Regulation (requirement for record keeping in paper
form) Human Resources
• Lack of skilled labor
Additional Regulations
• Regulations related to store construction and location
• Additional local regulations and inconsistency among these regulations, which prevent national stores from efficient standardization
Source: MITI: Ministry of International Trade and Industry, Vision for the distribution system toward the 21st century (Tokyo: Tsuushoo Sangyoo Choosakai, 1995), 25-59.
The wholesale industry did not experience as much change as did
retailers. For example, the number of wholesalers actually increased by
7.7% between 1982 and 1991 (peaking at 462,000 establishments).
However, by 1999 the number of wholesalers decreased by 7.8% to 426
thousand.9 Many retailers began to undercut one or more wholesale layers
in order to reduce cost. A 1998 survey showed that 30% of retailers
8
decreased the number of wholesale layers supplying stores because of
price pressure from consumers.10
E-commerce, threatened to add further disruptions to the
relationships between wholesalers and retailers. The opportunity existed
for wholesalers to by-pass retailers and market directly to the end
consumer using the Internet. However, Japanese consumers’ inclination
to use e-commerce proved surprisingly low. In a 1999 survey, over half of
respondents expressed a lack of interest in using the Internet for shopping
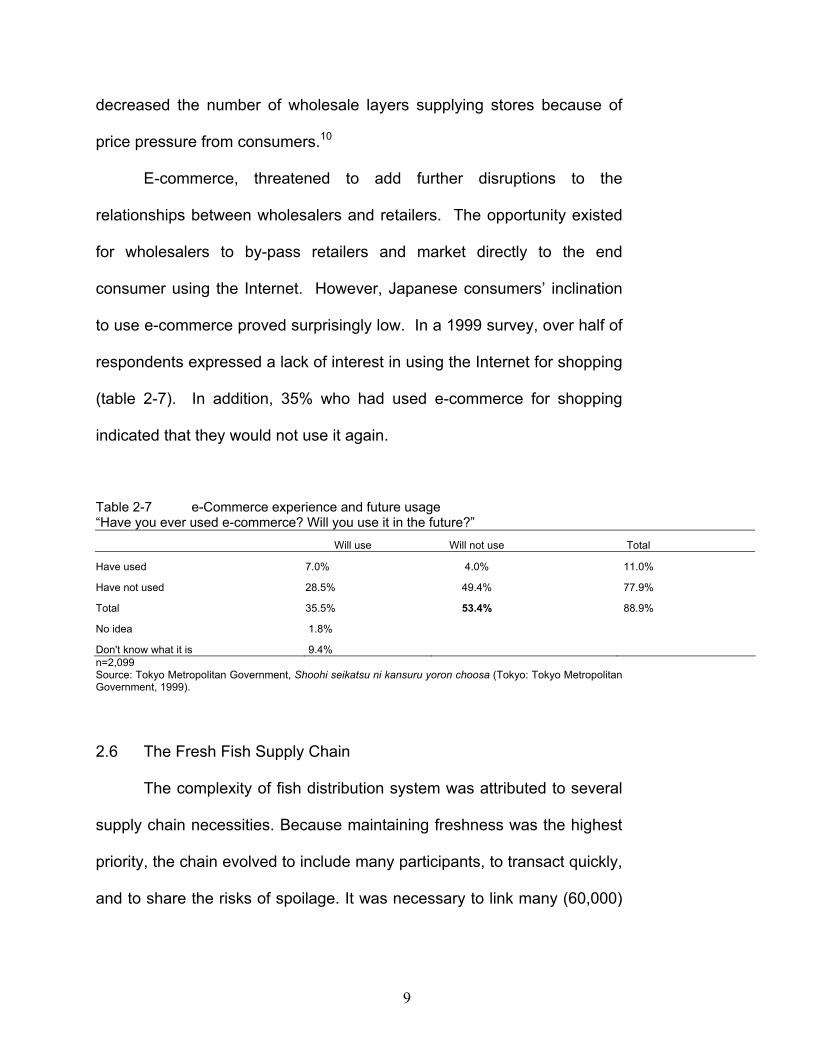
(table 2-7). In addition, 35% who had used e-commerce for shopping
indicated that they would not use it again.
Table 2-7 e-Commerce experience and future usage “Have you ever used e-commerce? Will you use it in the future?” Will use Will not use Total
Have used 7.0% 4.0% 11.0%
Have not used 28.5% 49.4% 77.9%
Total 35.5% 53.4% 88.9%
No idea 1.8%
Don't know what it is 9.4% n=2,099 Source: Tokyo Metropolitan Government, Shoohi seikatsu ni kansuru yoron choosa (Tokyo: Tokyo Metropolitan Government, 1999).
2.6 The Fresh Fish Supply Chain
The complexity of fish distribution system was attributed to several
supply chain necessities. Because maintaining freshness was the highest
priority, the chain evolved to include many participants, to transact quickly,
and to share the risks of spoilage. It was necessary to link many (60,000)
9
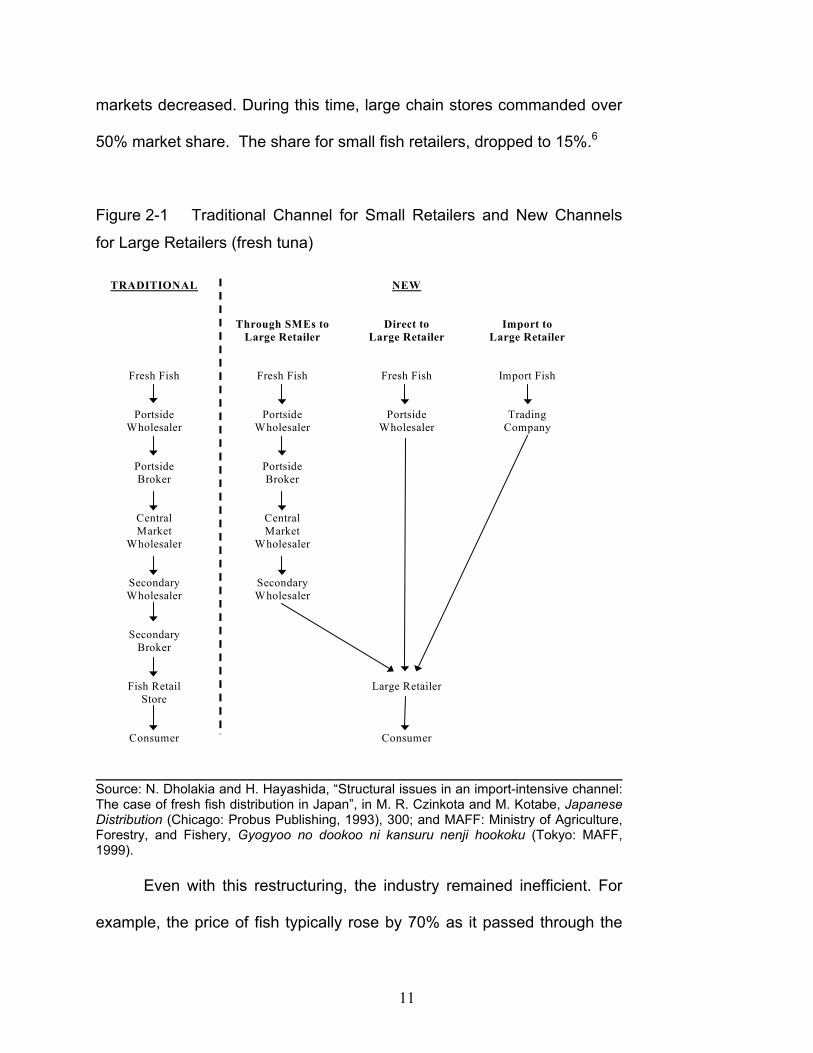
supply points to many (50,000) retailers.4 An example of the historical
fresh fish supply chain is shown on the left side of Figure 2-1.
This supply chain has changed drastically since the 1950s, as large
retailers emerged to serve the increasing population in urban areas.
Progress in transportation and food preservation methods became
important factors that enabled economies of scale and mass retailing.17
Wholesalers, mostly small and medium sized enterprises (SMEs), lost
control over the market channel as large retailers and trading firms gained
power.4
In the 1980s, consumer behavior also began to change. Increased
disposable income and the strong Japanese currency served to increase
total fresh fish demand, and the amount of imported fish.4 In 1999, imports
accounted for as much as 40% of the market.6 Because of changing
lifestyles, demography, and household structure, consumers came to
prefer small packaged and ready-to-cook fish products.
This forced changes to distribution practices. Leadership shifted
from the central market wholesaler, the undisputed channel captain, to
large chain stores that could meet new consumer demands for price and
convenience. In addition, trading companies integrated import channels
and increased their influence in fish distribution.4
Consequently, as shown in the right half in Figure 2-1, new supply
chains developed for fresh fish. The influence of central wholesale
10
markets decreased. During this time, large chain stores commanded over
50% market share. The share for small fish retailers, dropped to 15%.6
Figure 2-1 Traditional Channel for Small Retailers and New Channels
for Large Retailers (fresh tuna)
TRADITIONAL
Fresh Fish
Portside Wholesaler
Portside Broker
Central Market
Wholesaler
Secondary Wholesaler
Secondary Broker
Fish Retail Store
Consumer
Through SMEs to Large Retailer
Fresh Fish
Portside Wholesaler
Portside Broker
Central Market
Wholesaler
Secondary Wholesaler
NEW
Direct to Large Retailer
Fresh Fish
Portside Wholesaler
Large Retailer
Consumer
Import to Large Retailer
Import Fish
Trading Company
Source: N. Dholakia and H. Hayashida, “Structural issues in an import-intensive channel: The case of fresh fish distribution in Japan”, in M. R. Czinkota and M. Kotabe, Japanese Distribution (Chicago: Probus Publishing, 1993), 300; and MAFF: Ministry of Agriculture, Forestry, and Fishery, Gyogyoo no dookoo ni kansuru nenji hookoku (Tokyo: MAFF, 1999). Even with this restructuring, the industry remained inefficient. For
example, the price of fish typically rose by 70% as it passed through the
11
supply chain from producers to households. This was the highest markup
among all the grocery items, including fresh vegetables (50%).6
In conclusion, we found little specific research, published in Japan
or the United States, to understand Japanese e-commerce in its unique
context. Taking a next step, we sought to gain greater insight from
interview research on the nature of Japanese e-commerce.
3. METHODOLOGY
In this study, a SME was defined as a firm with less than Yen 50
million ($400,000) net worth or fewer than 50 employees. c For large
retailers sales ranged from Yen 114 billion ($0.9 billion) to Yen 774 billion
($6.2 billion).
As summarized in APPENDIX A, we conducted telephone
interviews in Japanese with various e-commerce firms to gather relevant
information. Interviewees from large organizations were managers in
public relations. Those from SMEs ranged from staff members to the CEO.
Typically, in medium sized companies, one or two staff members were
assigned to Internet sales, while in smaller sized companies, CEO or other
executives were in charge.
Because of the non-random nature of the sample, we make no
claim that the results of this survey are statistically un-biased. However,
c A definition under the Japanese Small and Medium Sized Company Law.
12
the large majority responses to particular questions provided the authors
with confidence that our conclusions are valid.
4. RESULTS
4.1 SME e-Commerce Operations
SMEs were found to be the most active in terms of e-commerce.
We identified more than 500 small online fish stores, mostly in “web malls”
that provided various technical and commercial administrative support for
a fee starting at Yen 50,000 ($400) per month. Fees depended on the
amount of items listed. Rakuten was identified as the largest web mall in
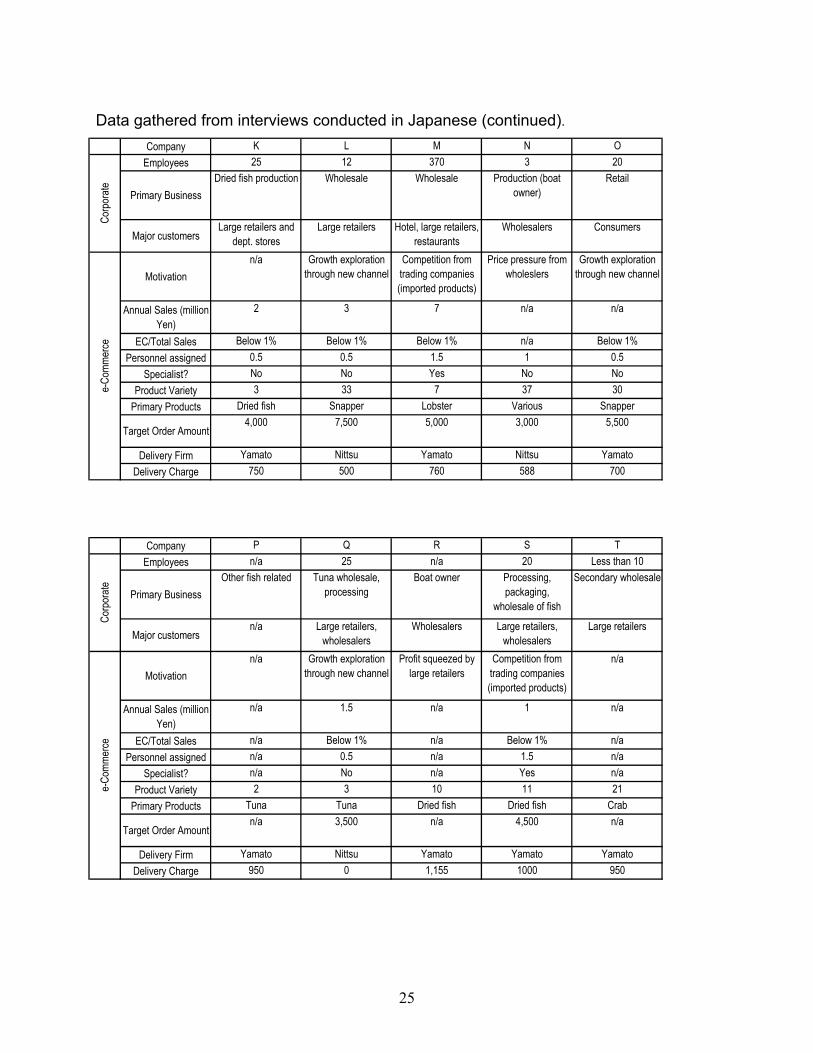
Japan. We interviewed 20 individual businesses from this mall. Raw data
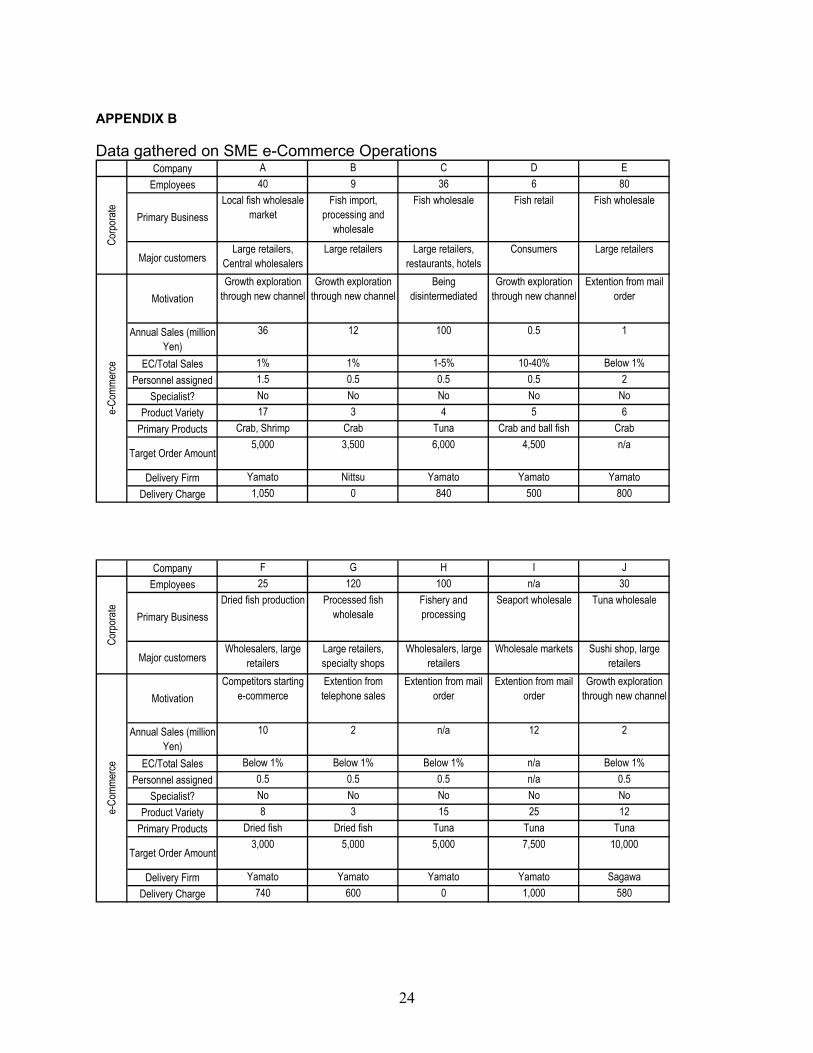
obtained from the interviews appears in APPENDIX B. We summarized
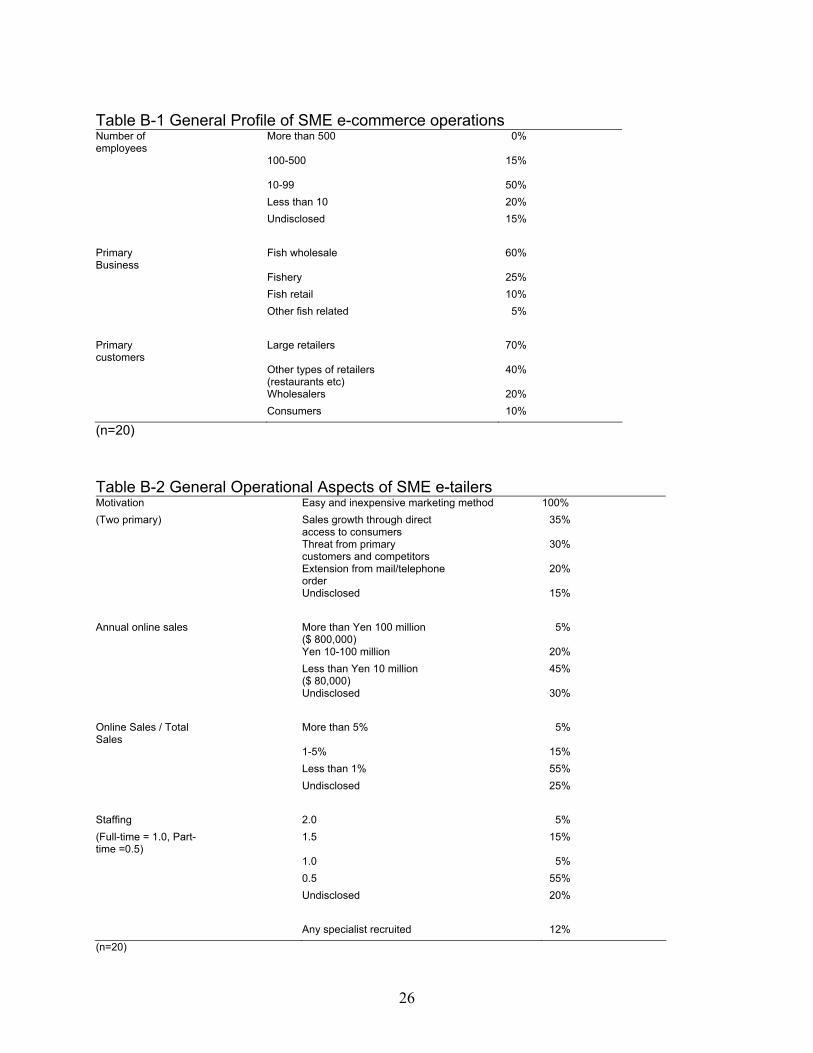
the data into a sample profile (Table B-1).
All the interviewees responded that they initiated e-commerce
because it was easy and inexpensive (Table B-2). Most firms already had
PCs, Internet access, and the minimum ability to manage web sites.
Typical start-up costs were Yen 10 million ($80,000) or less. The second
largest motivation was growth. While some already had direct access to
consumers through mail and telephone sales, many SMEs launched e-
commerce to reach select individual and small trade customers such as
restaurants. The third motivation was to counter threats, either from
current customers (retail chain stores) or competitors (such as trading
firms importing fish from abroad).
13
These efforts resulted in negligible incremental sales. In a typical
situation, we found that e-commerce contributed $80,000 in annual
revenue after one to three years of operation. This was less than 1% of
total company revenue. Most firms neither assigned full-time employees to
manage e-commerce, nor employed specialists such as web designers or
online marketing experts.
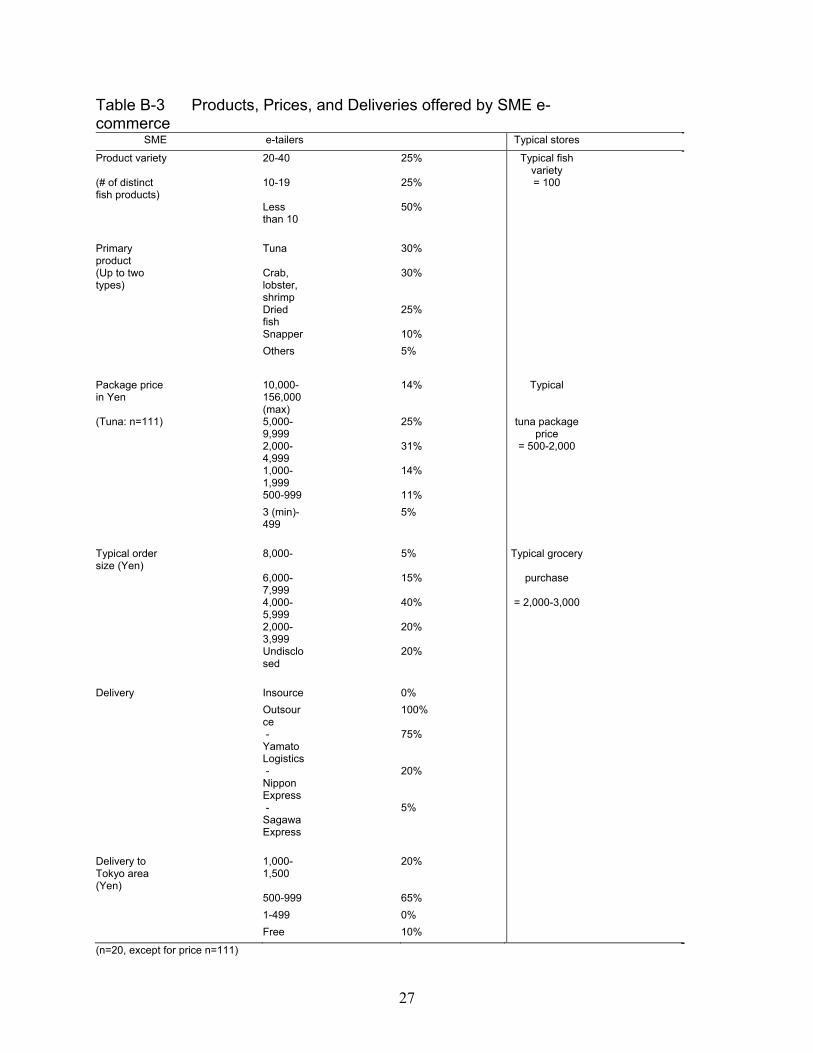
Compared to typical grocery supermarkets, SME e-commerce firms
offered limited variety; most products were either high-end (tuna, crab,
lobster, shrimp, and snapper) or preserved fish (Table B-3). The average
price was substantially higher than products sold at stores.
All of the SME e-commerce firms outsourced delivery, using one of
three major third party logistics (3PL) providers. Most of the 3PL firms
charged Yen 1,000 ($8) for a delivery in the Tokyo area. Typical lead-time
from pick-up to delivery was two days.
4.2 Large e-Commerce Operations
National retail chain stores launched online sales in 2000,
compared to 1997 when web malls began operations. Unfortunately, our
interviews with these large firms resulted in little information,
predominantly because of the short sales history of e-commerce and
limited disclosure. We obtained supplementary information through visits
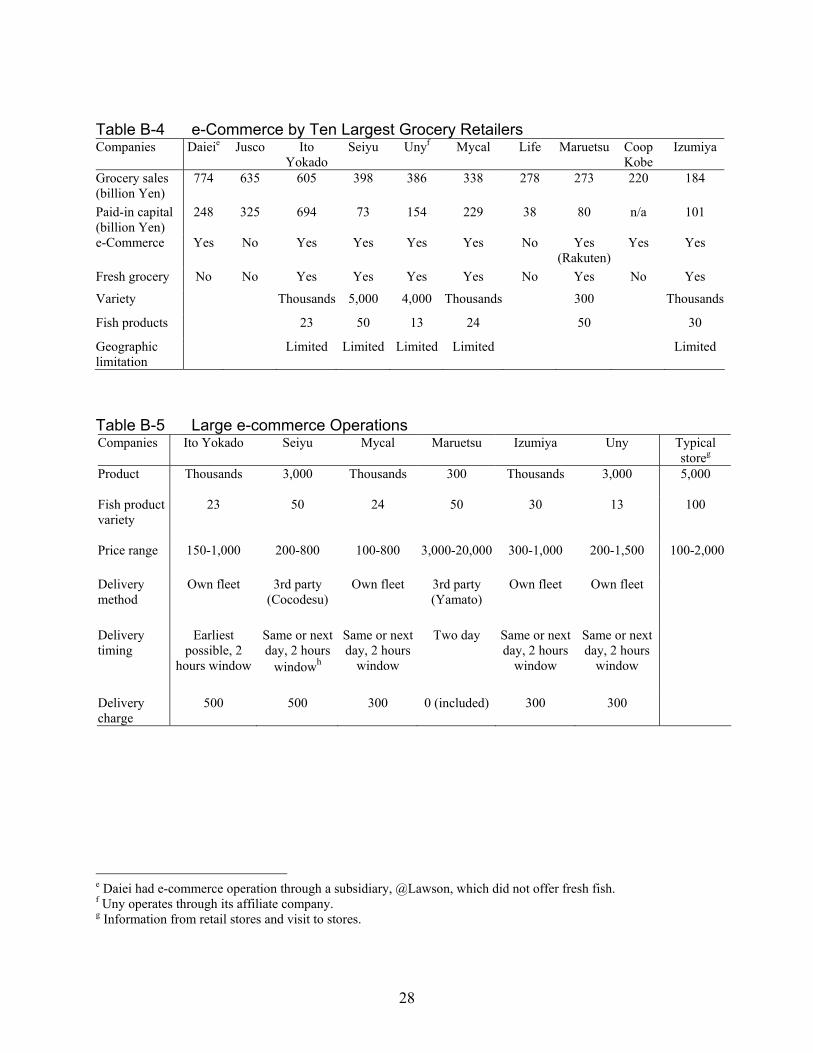
to company web sites (Table B-4).
14
Of the ten largest grocery retailers in Japan, six were engaged in
fresh fish e-commerce. Five of the six retailers used private fleets to cover
a limited delivery area. For example, Ito Yokado allowed only residents in
Edogawa ward (Tokyo) which had a population of 633,000, to purchase
online. Products were delivered directly from existing stores. Maruetsu
was the only national retailer that used 3PL companies for countrywide
deliveries.
For the six major retailers, we investigated products and pricing
offered for online purchase (Table B-5). The variety of fish products was
less than a typical store. However, total variety, which included grocery
and other convenience items, was almost as large as a typical store.
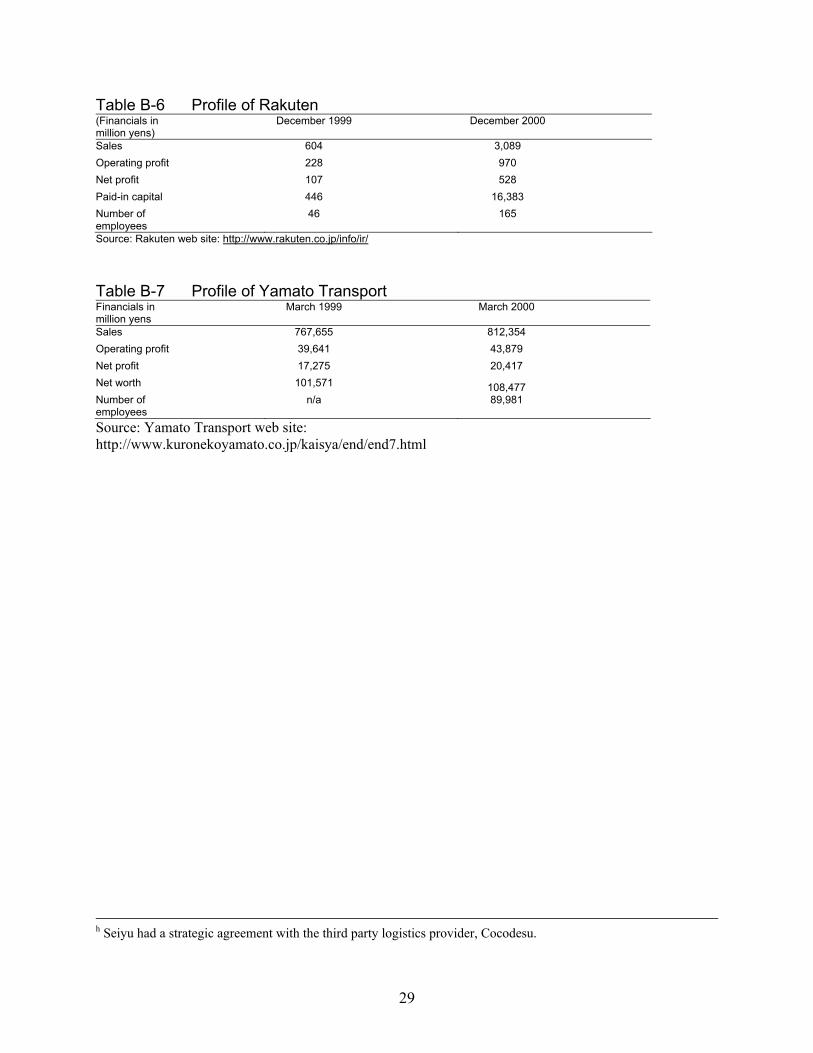
4.3 Service Providers in e-Commerce Industry
While most online stores operated by large retailers were
autonomous in terms of web operation and delivery, all the SMEs used
services provided by web mall providers, such as Rakuten (Table B-6).
More than 5,000 online stores operated in this web mall. Although revenue
and profit were dramatically increasing, the amount of turnover was great.
More than half the online stores operated at a loss.13
Other businesses that provided services to e-commerce included
logistics companies, such as Yamato Transport (Table B-7). Yamato, an
innovator in door-to-door parcel delivery services, held one third of this
segment, or 828 billion parcel shipments per year. Both shipments and
15
profits were increasing, partly due to e-commerce. We found that this
market was dominated by four major organizations; Yamato, Sagawa,
Seino and Japan Post Office. Pricing and services offered by these four
firms were nearly identical.
5. DISCUSSION
At the beginning this research, we anticipated observing a group of
entrepreneurial companies attempting to revolutionize the complex
Japanese distribution system. However, what we observed was quite the
opposite; players were small to medium enterprises previously engaged in
fish production and wholesaling. The motivation was not toward an
entrepreneurial opportunity but rather toward an attempt to survive
increasing pressure from large retail customers and huge trading
companies. Unfortunately, these attempts were unsuccessful, yielding
negligible sales and profit. We attributed this lack of effectiveness to three
issues:
Channel Conflict
The most challenging hurdle for the SMEs in pursuing e-commerce
was channel conflict with their primary “offline” customers, large retail
chain stores.
Large retailers had dramatically changed fish distribution. During
the 1990s, many retailers streamlined the wholesaler base through
disintermediation. As a result, thousands of wholesalers disappeared.
16
Remaining wholesalers increased reliance on large retailers. This harsh
business environment influenced many SMEs engaged in fish wholesaling
to consider new market channels like e-commerce. However, SMEs
voluntarily limited the scope of e-commerce operations in terms of
products and pricing to maintain good relationships with primary
customers, the large retailers. This drastically limited the effectiveness of
e-commerce.
Logistics Challenge
For most SMEs, direct transaction with an individual consumer was
a new business activity. Nationwide distribution of fresh fish was
impossible without expensive third party, door-to-door delivery service.
This logistics issue posed several operational constraints:
• Delivery cost
Ranging from Yen 500 to 1,000 ($4 – $8), the delivery cost was
prohibitively high for a casual fresh fish order that typically amounted
to Yen 1,000 ($8) or less.
• Delivery method and lead-time
Although logistics companies provided refrigerated delivery with a
lead-time of two days, occasional product spoilage did exist. As a
result, most SMEs observed very few consumers purchasing fresh
fish during the summer months. Long lead-times also affected
availability of consumers at time of delivery. Multiple SMEs
commented that the most time-consuming part of e-commerce was
17
communicating with consumers concerning delivery date and time. In
spite of coordination efforts, absence at pre-agreed delivery
appointments happened, often causing product spoilage. Because it
was often not clear exactly when products spoiled, most SMEs gave
full refunds to customers. Nearly all the SMEs commented that it was
impossible to seek remedy from logistics providers.
Lack of resources
There were overwhelming differences between SMEs and large
store chains in terms of financial and human resources devoted to e-
commerce. In addition to these quantitative factors, quality of human
resources at the large retail chains was generally much higher. As an
additional observation, both corporate and employee motivations towards
e-commerce were relatively low. We attribute this attitude to the
fundamental e-commerce objective of defending against competitive
threats rather than the desire to exploit new opportunities.
Large retailers were not constrained by the same issues that limited
the e-commerce potential for SMEs. They commanded strong power in
the market channel with huge resources in terms of capital, employees,
existing store facilities and transportation infrastructure.
Nonetheless, large retailers were not sufficiently motivated to make
a shift to e-commerce. They observed cannibalization of existing store
business because of Internet sales. The initial motivation for e-commerce
was to expand marketing area (households with limited access to stores)
18
and customer segments (such as senior citizens). However, a large
percentage of online shoppers were from the current customer base
(homemakers and working women between 25 - 40). For this reason,
large retailers remained active in e-commerce but had little incentive to
expand operations.
6. CONCLUSION
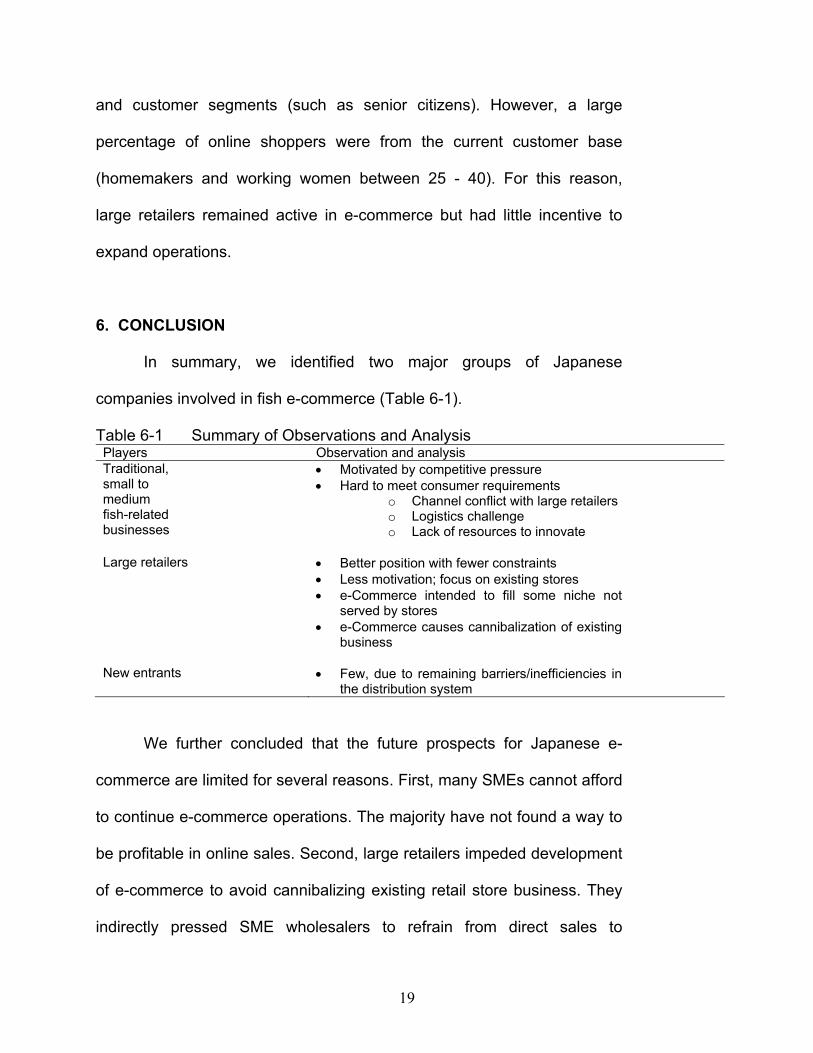
In summary, we identified two major groups of Japanese
companies involved in fish e-commerce (Table 6-1).
Table 6-1 Summary of Observations and Analysis Players Observation and analysis Traditional, small to medium fish-related businesses
• Motivated by competitive pressure • Hard to meet consumer requirements
o Channel conflict with large retailers o Logistics challenge o Lack of resources to innovate
Large retailers • Better position with fewer constraints
• Less motivation; focus on existing stores • e-Commerce intended to fill some niche not
served by stores • e-Commerce causes cannibalization of existing
business
New entrants • Few, due to remaining barriers/inefficiencies in the distribution system
We further concluded that the future prospects for Japanese e-
commerce are limited for several reasons. First, many SMEs cannot afford
to continue e-commerce operations. The majority have not found a way to
be profitable in online sales. Second, large retailers impeded development
of e-commerce to avoid cannibalizing existing retail store business. They
indirectly pressed SME wholesalers to refrain from direct sales to
19
consumers using e-commerce. Third, most importantly, consumers
showed a weak response to purchasing goods online. For these reasons,
e-commerce will develop slowly.
Despite sweeping wholesale reorganization led by retailers, the
wholesalers still tried to maintain relationships with retailers and voluntarily
avoided conflict with them by offering non-competing products for e-
commerce. In fact, during our interviews with an executive vice president
of a wholesaler, he stated, “supermarket chains do not object to our direct
transaction with consumers, but they occasionally ask us how our e-
commerce business was going, and we assured them that we have no
intention to compete against them.” He interpreted “questions” from large
retailers as a “warning” and considered this when choosing products to be
offered online.d
We also observed that retailers had retained a long-term set of
wholesalers as market channel partners. Only the severe economic
conditions experienced during the 1990s motivated retailers to reorganize
the wholesale structure. Even large, efficient retailers had tried to maintain
relationships with specific wholesalers for a long time.
Nakane pointed an important aspect of Japanese society that
explained these two observations.12
d In general, Japanese might interpret a question as an expression of discomfort. We did not find specific research that explained this issue, however, this is attributed to Japanese culture and traditional practices.
20
“The widely observed Japanese ethic is that, once firmly established, a relationship should be maintained even despite economic loss. Such loss, however, may be offset in the long run, since the rigid relationship develops a high credit relationship benefiting mutual interests.”
We concluded that, although the Japanese ethic had not changed,
there was a great pressure to break firmly established social relationships.
The economic pressure for social change will influence the rate of e-
commerce adoption in practice.
References
1. Alexandris, N, M. Burmester, V. Chrissikopoulos and Y. Desmedt, “Secure linking of customers, merchants and banks in electronic commerce,” Future Generation Computer Systems, 16, No. 4 (2000), 393-401.
2. Conway, D.G. and G. J. Koehler, “Interface agents: caveat mercator in electronic commerce,” Decision Support Systems, 27, No. 4 (2000), 355-366.
3. Degeratu, A.M., A. Rangaswamy, and J. Wu, “Consumer choice behavior in online and traditional supermarkets: The effects of brand name, price, and other search attributes,” International Journal of Research in Marketing, 17, No. 1 (2000), 55-78.
4. Dholakia N. and H. Hayashida, “Structural issues in an import-intensive channel: The case of fresh fish distribution in Japan”, in M. R. Czinkota and M. Kotabe, Japanese Distribution (Chicago: Probus Publishing, 1993), 295-307.
5. Kano, I. “Newly emerging seafood markets in Japan,” Info-Fresh fish International, 5 (1989), 12-15.
6. MAFF: Ministry of Agriculture, Forestry, and Fishery, Gyogyoo no dookoo ni kansuru nenji hookoku (Tokyo: MAFF, 1999). †
7. Manifold, D.L., “Accessing Japan’s distribution channels,” in M. R. Czinkota and M. Kotabe, Japanese Distribution (Chicago: Probus Publishing, 1993), 43-66.
21
8. METI: Ministry of Economy, Trade, and Industry, Accenture, and ECOM, Market Research on Japanese Electronic Commerce 2000 (Tokyo: METI, 2001).
9. MITI: Ministry of International Trade and Industry, Census of Commerce 1994 (Tokyo: MITI, 1995). †
10. MITI: Ministry of International Trade and Industry, Chusho kigyo hakusho 1997 (Tokyo: MITI, 1998). †
11. MITI: Ministry of International Trade and Industries, Preliminary Report on 1999 Census of Commerce (Tokyo: MITI, 1999). †
12. Nakane, C., Japanese society (Berkeley and Los Angeles, CA: University of California Press, 1970), 98-99.
13. Nikkei Ryutsu Shinbun, November 21, 2000.†
14. Rao, B., “The Internet and the revolution in distribution: a cross-industry examination,” Technology in Society, 21, No. 3 (1999), 287-306.
15. Rowe, H., “Legal implications of consumer-oriented electronic commerce,” Computer Law & Security Report, 14, No. 4 (1998), 232-242.
16. Shimaguchi M. and W. Lazer, “Japanese distribution channels: Invisible barriers to market entry,” Michigan State University Business Topics, 27, No. 1, 49-62.
17. Shiraishi, Y., Seisen EDI de shokuhin ryutsu wa kou kawaru (Tokyo: Tsukuba Shobo, 2000), 21-24.†
19. Vogel, E., Japan as number one (Cambridge, MA: Harvard University Press, 1981), 195.
20. Yahagi, T., “Sogo supa no seiritsu,” in M. Shimaguchi, H. Takeuchi, H. Katahira and J. Ishii, Marketing kakushin no jidai (Tokyo: Yuhikaku, 1998), 133-134.†
† Publications written in Japanese.
22
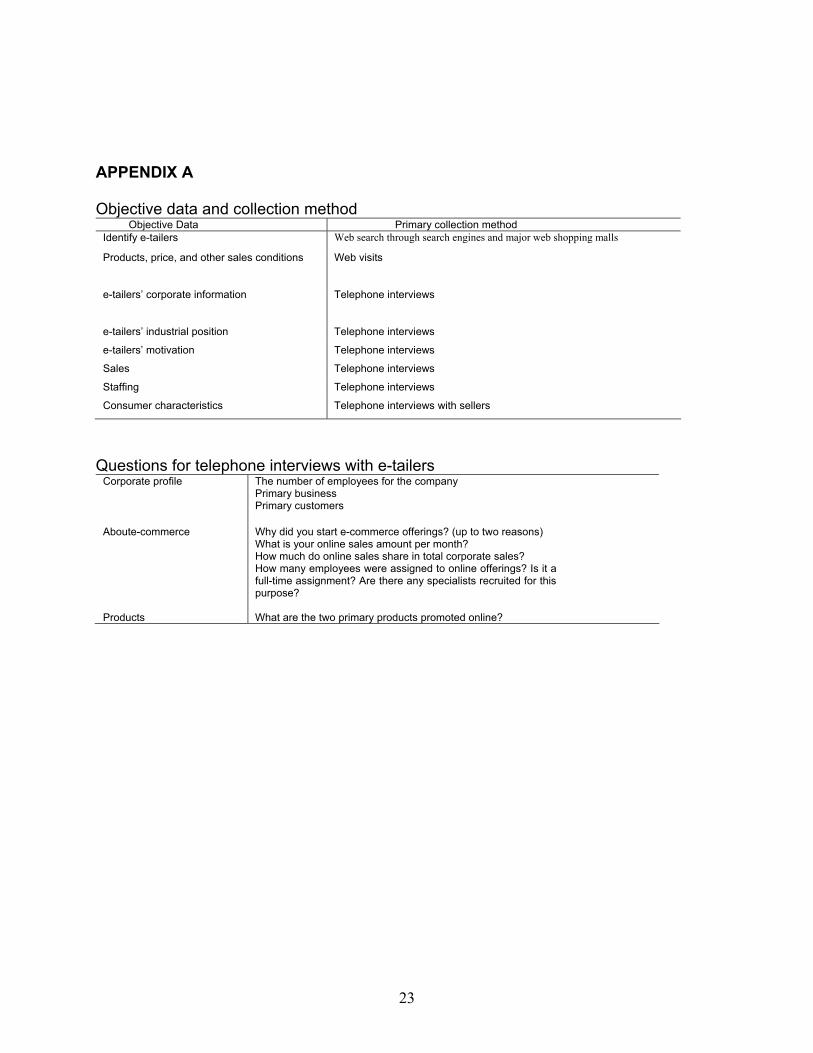
APPENDIX A Objective data and collection method
Objective Data Primary collection method Identify e-tailers Web search through search engines and major web shopping malls
Products, price, and other sales conditions Web visits
e-tailers’ corporate information Telephone interviews
e-tailers’ industrial position Telephone interviews
e-tailers’ motivation Telephone interviews
Sales Telephone interviews
Staffing Telephone interviews
Consumer characteristics Telephone interviews with sellers
Questions for telephone interviews with e-tailers
Corporate profile The number of employees for the company Primary business Primary customers
Aboute-commerce Why did you start e-commerce offerings? (up to two reasons) What is your online sales amount per month? How much do online sales share in total corporate sales? How many employees were assigned to online offerings? Is it a full-time assignment? Are there any specialists recruited for this purpose?
Products What are the two primary products promoted online?
23
APPENDIX B Data gathered on SME e-Commerce Operations
Company A B C D EEmployees 40 9 36 6 80
Primary BusinessLocal fish wholesale
marketFish import,
processing and wholesale
Fish wholesale Fish retail Fish wholesale
Major customersLarge retailers,
Central wholesalersLarge retailers Large retailers,
Price range 150-1,000 200-800 100-800 3,000-20,000 300-1,000 200-1,500 100-2,000
Delivery method
Own fleet 3rd party (Cocodesu)
Own fleet 3rd party (Yamato)
Own fleet Own fleet
Delivery timing
Earliest possible, 2
hours window
Same or next day, 2 hours
windowh
Same or next day, 2 hours
window
Two day Same or next day, 2 hours
window
Same or next day, 2 hours
window
Delivery charge
500 500 300 0 (included) 300 300
e Daiei had e-commerce operation through a subsidiary, @Lawson, which did not offer fresh fish. f Uny operates through its affiliate company. g Information from retail stores and visit to stores.
28
29
Table B-6 Profile of Rakuten (Financials in million yens)
December 1999 December 2000
Sales 604 3,089 Operating profit 228 970 Net profit 107 528 Paid-in capital 446 16,383 Number of employees
46 165
Source: Rakuten web site: http://www.rakuten.co.jp/info/ir/
Table B-7 Profile of Yamato Transport Financials in million yens
March 1999 March 2000
Sales 767,655 812,354 Operating profit 39,641 43,879 Net profit 17,275 20,417 Net worth 101,571 108,477 Number of employees
n/a 89,981
Source: Yamato Transport web site: http://www.kuronekoyamato.co.jp/kaisya/end/end7.html
h Seiyu had a strategic agreement with the third party logistics provider, Cocodesu.