Page 1
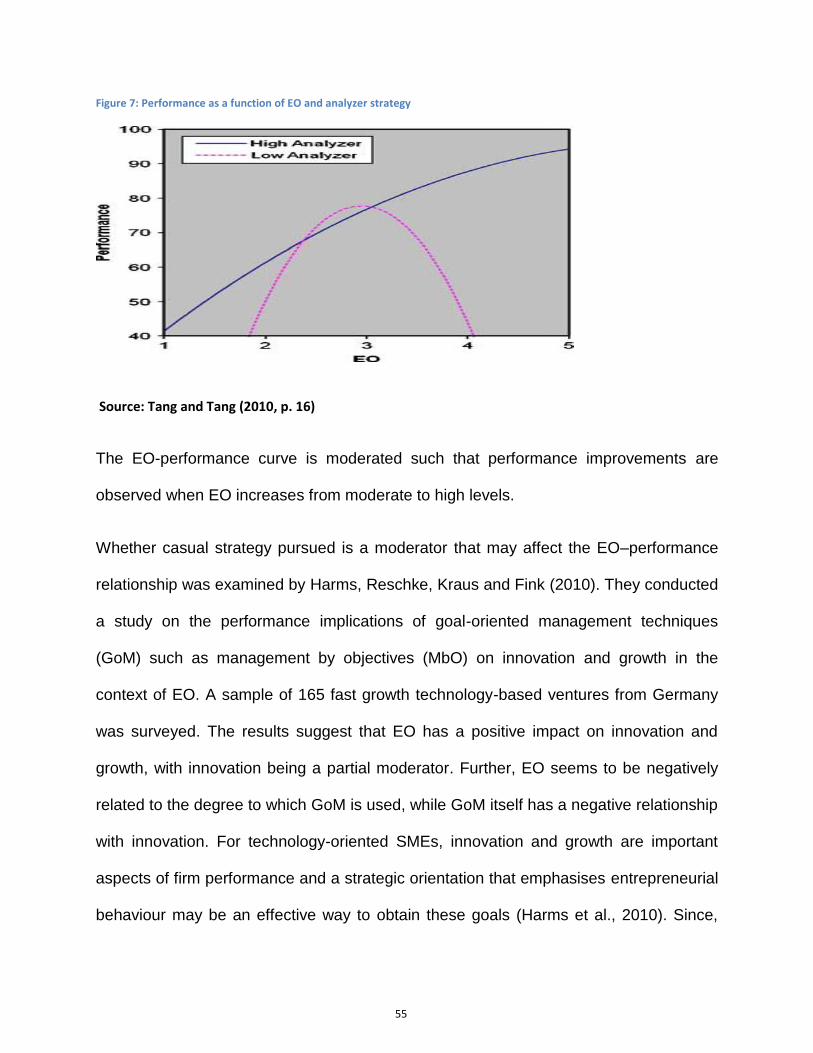
The impact of effectuation on the
performance of South African
medium and high technology firms
Thanti Sibonelo Mthanti
Student number: 573139
Tel: 0791406477
Supervisor: Dr Bareirra
Co-Supervisor : Prof. Urban
A research report submitted to the Faculty of Commerce, Law and
Management, University of the Witwatersrand, in partial fulfillment of the
requirements for the degree of Master of Management.
Wits Business School
March 2012
Page 2
i
ABSTRACT
South Africa is blighted by high levels of unemployment and poverty.
Entrepreneurship and particularly technology entrepreneurship has been
seen as a possible solution to generate innovation, grow the economy and
create jobs, thus reducing poverty. However, the country has struggled to
commercialise its research output. This research sought to empirically test
the effectiveness of the non-predictive strategy, effectuation, in improving
technology commercialisation amongst South African firms. Effectuation
was considered as a moderator of the EO-performance relationship
amongst firms. Further, the research also tackled a research gap by
exploring relationships between effectuation and established
entrepreneurship and management theories such as EO and environmental
hostility. Questionnaires were distributed to South African companies via
email containing the web link to the survey on Qualtrics. Of the 500 emails
sent, 94 companies responded with usable responses. Multiple regression
analysis was used as the main statistical tool to test the hypotheses. The
main findings of this study are that, for entrepreneurial high and medium
technology companies, EO and environmental hostility positively predict
effectuation. Further, effectuation positively moderates the relation between
EO and innovative performance. The results of this study suggest
entrepreneurial firms, Venture Capitalists (VCs) and government officials
who wish to optimise innovative performance should revisit their emphasis
on causal planning and market research.
Page 3
ii
DECLARATION
I, Thanti Sibonelo Mthanti, declare that this research report is my own work except
as indicated in the references and acknowledgements. It is submitted in partial
fulfilment of the requirements for the degree of Master of Management in the
University of the Witwatersrand, Johannesburg. It has not been submitted before
for any degree or examination in this or any other university.
-------------------------------------------------------------
Thanti Sibonelo Mthanti
Signed at ……………………………………………………
On the …………………………….. day of ………………………… 2012
Page 4
iii
DEDICATION
This thesis is dedicated to my late parents Nomsa Caldas Mthanti and Fanley
Hendry Mthanti. Mom and Dad, I hope I made you proud.
Page 5
iv
ACKNOWLEDGEMENTS
I would like to thank my supervisors Dr Barreira and Professor Urban for your
guidance over the last 15 months. Further, I would thank Mrs Merle Werbeloff.
Your guidance, assistance and teaching have made me grow as a person. I will
certainly miss the conversations we had. I hope you will be proud of this work.
To Zimasa and her admin staff, thank you for the job well done. I would also like to
thank members of my MM class. I hope the friendships made will last a life time
Finally, I would like to thank my little girl Nephadi. Your daddy’s “big book” is done
now. I hope you will read it someday.
Page 6
v
TABLE OF CONTENTS
Contents
ABSTRACT ......................................................................................... I
DECLARATION .................................................................................. II
DEDICATION ..................................................................................... III
ACKNOWLEDGEMENTS ................................................................. IV
LIST OF TABLES ........................................................................... VIII
LIST OF FIGURES ........................................................................... XI
CHAPTER 1: INTRODUCTION ........................................................ 14
1.1 INTRODUCTION ....................................................................................... 14 1.1.1 PURPOSE OF THE STUDY ............................................................................................... 14 1.1.2 CONTEXT OF THE STUDY ............................................................................................... 14
1.2 PROBLEM STATEMENT ....................................................................................... 18 1.2.1 MAIN PROBLEM ............................................................................................................ 18 1.2.2 SUB-PROBLEMS ............................................................................................................ 18 SUB-PROBLEMS .................................................................................................................... 18 SUB-PROBLEMS .................................................................................................................... 18
1.3 SIGNIFICANCE OF THE STUDY ............................................................................. 19
1.4 DELIMITATIONS OF THE STUDY ........................................................................... 20
1.5 DEFINITION OF TERMS ....................................................................................... 21
1.6 ASSUMPTIONS ............................................................................................. 22
CHAPTER 2 : LITERATURE REVIEW ............................................. 23
2.1 INTRODUCTION ................................................................................................. 23
2.1.1 CREATION THEORY ........................................................................................ 24
2.2 EFFECTUATION ................................................................................................. 27 2.2.1 EFFECTUATION- CONCEPTUAL LITERATURE ................................................................... 31 2.2.3 EXPERIMENTAL EFFECTUATION LITERATURE .................................................................. 36 2.2.4 EMPIRICAL LITERATURE AND HYPOTHESES DEVELOPMENT .............................................. 41
2.3 ENTREPRENEURIAL ORIENTATION ...................................................................... 44 2.3.1 THE DIMENSIONS OF EO AND EFFECTUATION ................................................................ 46 2.3.2 INNOVATIVENESS .......................................................................................................... 47 2.3.3 RISK TAKING ................................................................................................................ 48 2.3.2 PROACTIVENESS .......................................................................................................... 49
2.4 EO AND PERFORMANCE .................................................................................... 51
Page 7
vi
2.5 PERFORMANCE ................................................................................................. 56 2.5.1 THEORETICAL BACKGROUND ON DETERMINANTS OF FIRM PERFORMANCE ...................... 56 2.5.2 RESOURCE-BASED VIEW OF THE FIRM ........................................................................... 57 2.5.3 DEFINITION OF PERFORMANCE ...................................................................................... 58 2.5.4 CONTROL AND MODERATOR VARIABLES ........................................................................ 60 2.5.5 TIME FRAME OF PERFORMANCE MEASUREMENT ............................................................ 61 2.5.6 SUBJECTIVE MEASURES OF ORGANIZATIONAL PERFORMANCE ........................................ 62 2.5.7 INNOVATIVE PERFORMANCE .......................................................................................... 63
2.6 ENVIRONMENTAL HOSTILITY ............................................................................... 64 2.6.1 EMERGING MARKETS .................................................................................................... 66
CONCLUSION OF LITERATURE REVIEW ..................................................................... 69
CHAPTER 3: RESEARCH METHODOLOGY ................................... 74
3.1 RESEARCH METHODOLOGY ................................................................................ 74 3.1.1 RESEARCH METHODOLOGY / PARADIGM ......................................................................... 74
3.2 RESEARCH DESIGN ........................................................................................... 76 3.2.1 POPULATION AND SAMPLE ............................................................................................. 77 3.2.2 SAMPLE AND SAMPLING METHOD................................................................................... 77
3.3 THE RESEARCH INSTRUMENT ............................................................................. 78 3.3.1 MEASUREMENTS OF CONSTRUCTS ................................................................................ 80 3.3.3 PROCEDURE FOR DATA COLLECTION.............................................................................. 81 3.3.4 DATA ANALYSIS AND INTERPRETATION ........................................................................... 82
3.4 LIMITATIONS OF THE STUDY ............................................................................... 85
3.5 VALIDITY AND RELIABILITY .................................................................................. 85 3.5.1 VALIDITY ...................................................................................................................... 85 3.5.2 RELIABILITY .................................................................................................................. 87
CHAPTER 4: RESULTS ................................................................... 88
4.1 DESCRIPTIVE STATISTICS ................................................................................... 88 4.1.1 DESCRIPTION OF RESPONDENTS ................................................................................... 88 4.1.2 RESPONDENTS ............................................................................................................. 89
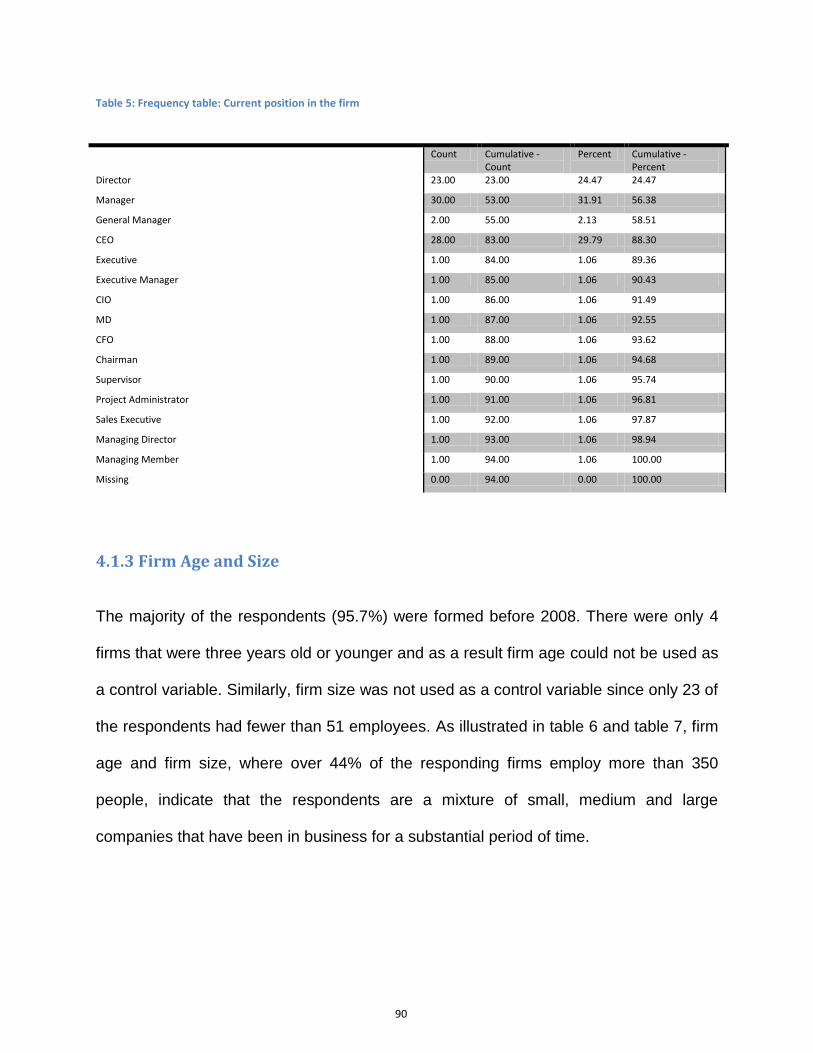
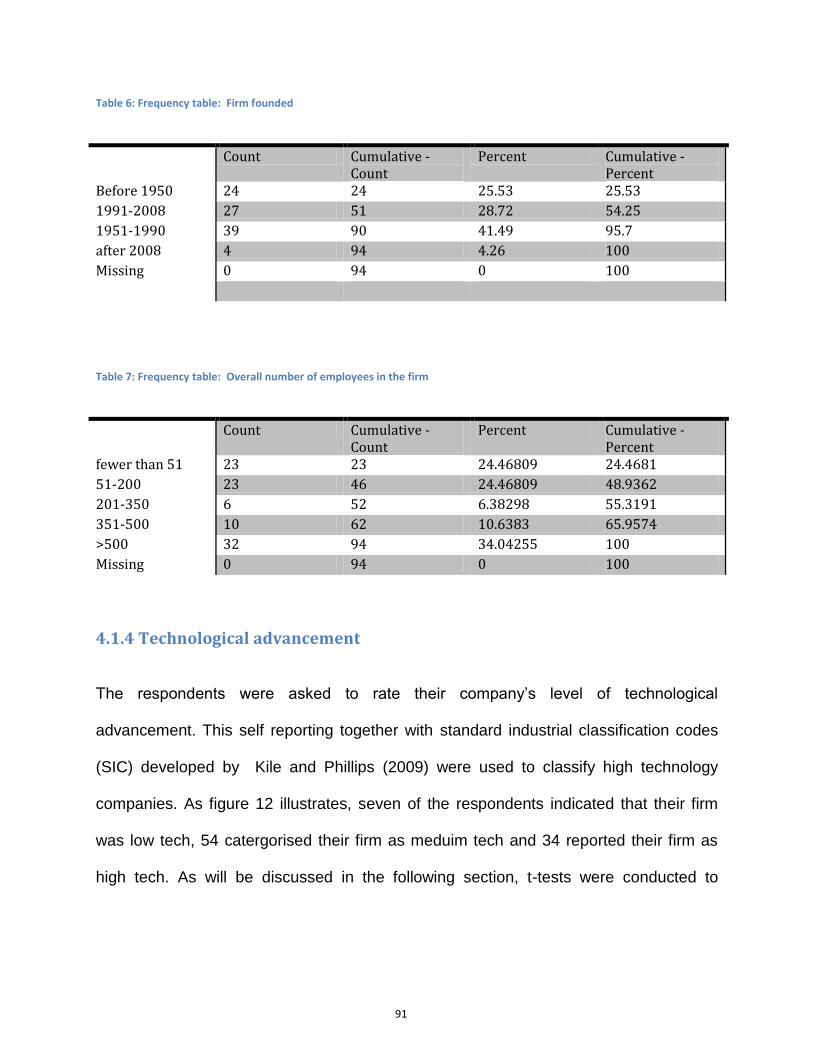
4.1.3 FIRM AGE AND SIZE ....................................................................................... 90
4.1.4 TECHNOLOGICAL ADVANCEMENT ..................................................................... 91
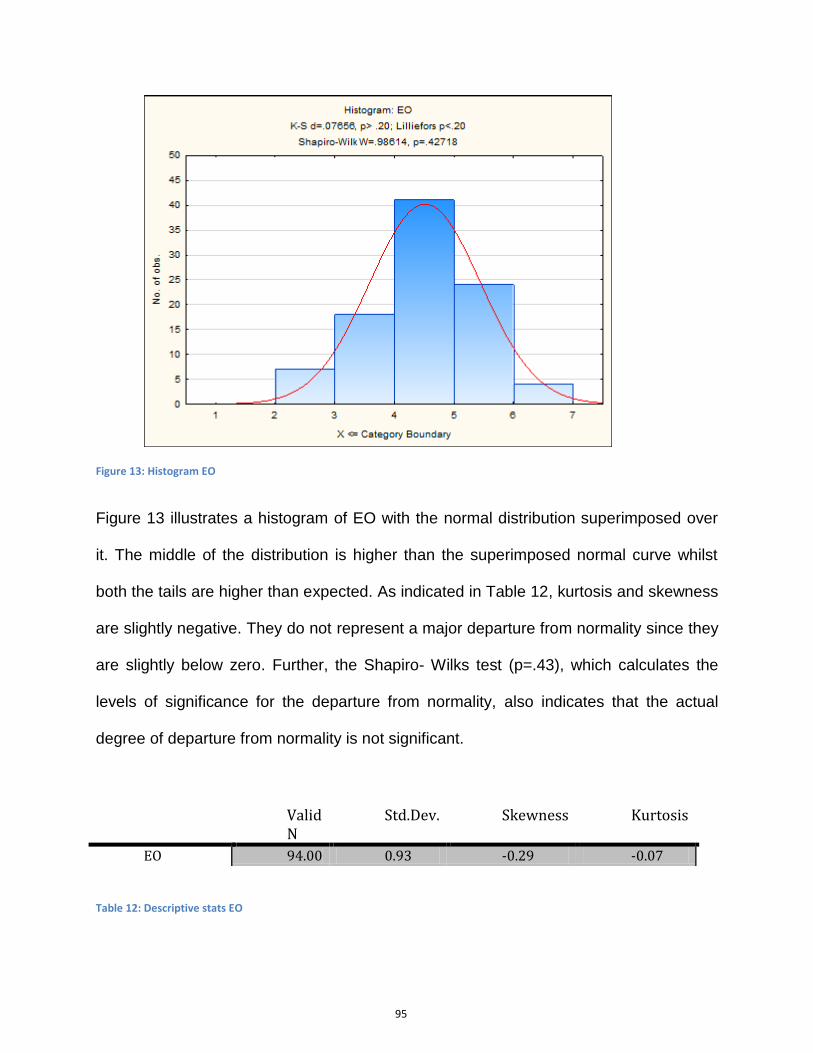
4.2 MEASUREMENT ASPECTS OF THE MODEL EO....................................................... 92 4.2.1 MEASUREMENTS OF CONSTRUCTS ................................................................................ 92 4.2.2 DESCRIPTIVE STATISTICS .............................................................................................. 94 4.2.2 PSYCHOMETRIC PROPERTIES EO .................................................................................. 96 4.2.3 VALIDITY ...................................................................................................................... 97
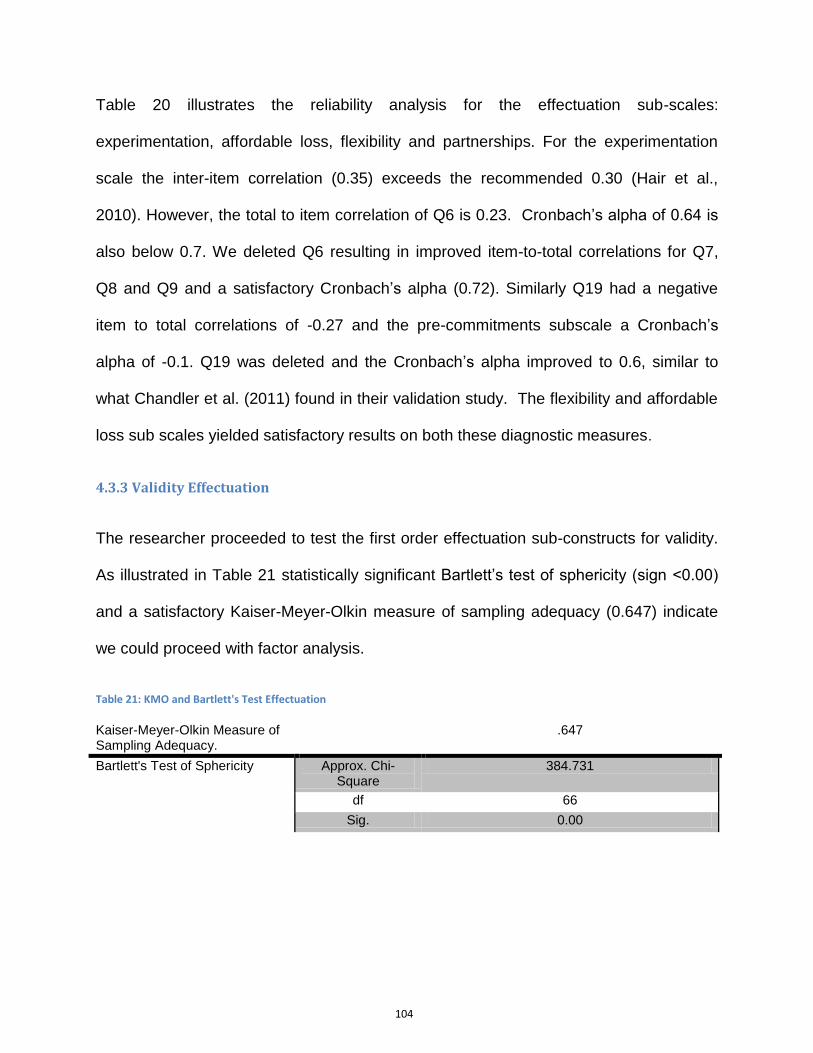
4.3 EFFECTUATION ............................................................................................... 100 4.3.1 DESCRIPTIVE STATISTICS ............................................................................................ 100 4.3.2 PSYCHOMETRIC PROPERTIES EFFECTUATION .............................................................. 101 4.3.3 VALIDITY EFFECTUATION ............................................................................................ 104
4.4 MEASUREMENT ASPECTS OF PERFORMANCE .................................................... 106 4.4.1 DESCRIPTIVE STATISTICS ............................................................................................ 106 4.4.2 PSYCHOMETRIC PROPERTIES PERFORMANCE .............................................................. 107 4.4.3 VALIDITY PERFORMANCE ............................................................................................ 108
4.5 MEASUREMENT ASPECTS OF HOSTILITY ............................................................ 111 4.5.1 DESCRIPTIVE STATISTICS ........................................................................................... 111 4.5.2 PSYCHOMETRIC PROPERTIES ENVIRONMENTAL HOSTILITY ............................................ 112 4.5.3 VALIDITY HOSTILITY .................................................................................................... 113
Page 8
vii
4.6 DISCRIMINANT VALIDITY: EO AND EFFECTUATION ............................................... 115 4.6.1 DISCRIMINANT VALIDITY MTMM EO AND EFFECTUATION ............................................. 119
4.7 DISCRIMINANT VALIDITY: ENVIRONMENTAL HOSTILITY AND EFFECTUATION ........... 120 4.7.1 DISCRIMINANT VALIDITY EFFECTUATION AND HOSTILITY ............................................... 123
4.8 T-TESTS: HIGH TECHNOLOGY VS MEDIUM TECHNOLOGY ...................................... 123
4.8 STRUCTURAL ASPECTS OF THE MODEL .............................................................. 126 4.8.1 RATIONALE BASED ON CORRELATIONS ......................................................................... 126 4.8.2 PREDICTIVE HYPOTHESES- SIMPLE REGRESSION .......................................................... 128 4.8.3 TESTING HYPOTHESIS H1, H1A AND H1B ..................................................................... 129 4.8.4 TESTING HYPOTHESIS H2 ........................................................................................... 129 4.8.5 TESTING HYPOTHESIS H3, H3A, H3B AND H3C ............................................................ 131 4.8.6 TESTING HYPOTHESIS H4, H4A, H4B AND H4C ............................................................ 131 4.8.7 TESTING HYPOTHESIS H5, H5A, H5B AND H5C ............................................................ 132 4.8.9 TESTING HYPOTHESIS H6, H6A, H6B AND H6C ............................................................ 132 4.8.10 TESTING HYPOTHESIS H7, H7A, H7B AND H7C .......................................................... 133 4.8.11 TESTING HYPOTHESIS H8, H8A, H8B AND H8C .......................................................... 133
4.9 TESTING THE MODERATION HYPOTHESES .......................................................... 134 4.9.1 TESTING HYPOTHESIS H9, H9A AND H9B (HOSTILITY AS MODERATOR) .......................... 134 4.9.2 TESTING HYPOTHESIS H10, H10A, H10B AND H10C (EFFECTUATION AS MODERATOR) .. 136
CHAPTER 5: DISCUSSION OF THE FINDINGS ............................ 140
5.1 INTRODUCTION ............................................................................................... 140
5.2 DEMOGRAPHIC PROFILE OF THE RESPONDENTS ................................................. 140
5.3. DISCUSSION OF HYPOTHESIS .......................................................................... 141 5.3.1 DISCUSSION OF HYPOTHESIS H1, H1A AND H1B .......................................................... 141 5.3.2 DISCUSSION HYPOTHESIS H2 ...................................................................................... 143 5.3.3 DISCUSSION HYPOTHESIS H3, H3A, H3B AND H3C ....................................................... 144 5.3.4 DISCUSSION HYPOTHESIS H4, H4A, H4B AND H4C ....................................................... 144 5.3.5 DISCUSSION HYPOTHESIS H5, H5A, H5B AND H5C ....................................................... 145 5.3.6 DISCUSSION HYPOTHESIS H6, H6A, H6B AND H6C ....................................................... 146 5.3.7 DISCUSSION HYPOTHESIS H7, H7A, H7B AND H7C ....................................................... 147 5.3.8 DISCUSSION HYPOTHESIS H8, H8A, H8B AND H8C ....................................................... 148 5.3.9 DISCUSSION HYPOTHESIS H9, H9A AND H9B (HOSTILITY AS MODERATOR) .................... 148 5.3.10 DISCUSSION HYPOTHESIS H10, H10A, H10B AND H10C (EFFECTUATION AS MODERATOR)
....................................................................................................................................................... 149
5.4 DISCUSSION OF SIGNIFICANT FINDINGS ............................................................. 151
5.5 CONCLUSION .................................................................................................. 153
CHAPTER 6: CONCLUSIONS OF THE STUDY ............................ 155
6.1 INTRODUCTION ............................................................................................... 155
6.2 CONCLUSIONS OF THE STUDY .......................................................................... 155
6.3 ADVANCEMENT OF CREATION THEORY AND EFFECTUATION ................................. 156
6.4 MANAGERIAL CONTRIBUTIONS ......................................................................... 158
6.5 POLICY CONTRIBUTIONS ................................................................................. 159
6.6 LIMITATIONS OF THE STUDY ............................................................................. 160
6.7 SUGGESTIONS FOR FUTURE RESEARCH ............................................................ 162
Page 9
viii
REFERENCES ................................................................................... 164
APPENDIX A- LETTER TO RESPONDENTS ................................ 182
APPENDIX B- QUESTIONNAIRE .................................................. 183
APPENDIX C- RESULTS ............................................................... 184
MODERATION RESULTS ......................................................................................... 184
REGRESSION RESULTS ......................................................................................... 192
DESCRIPTIVE STATISTICS ...................................................................................... 201
RESIDUAL ANALYSIS ............................................................................................. 205
LIST OF TABLES
Table 1: Contrasting causation with effectuation .................................................. 30
Table 2: Definitions of Entrepreneurial Orientation .............................................. 45
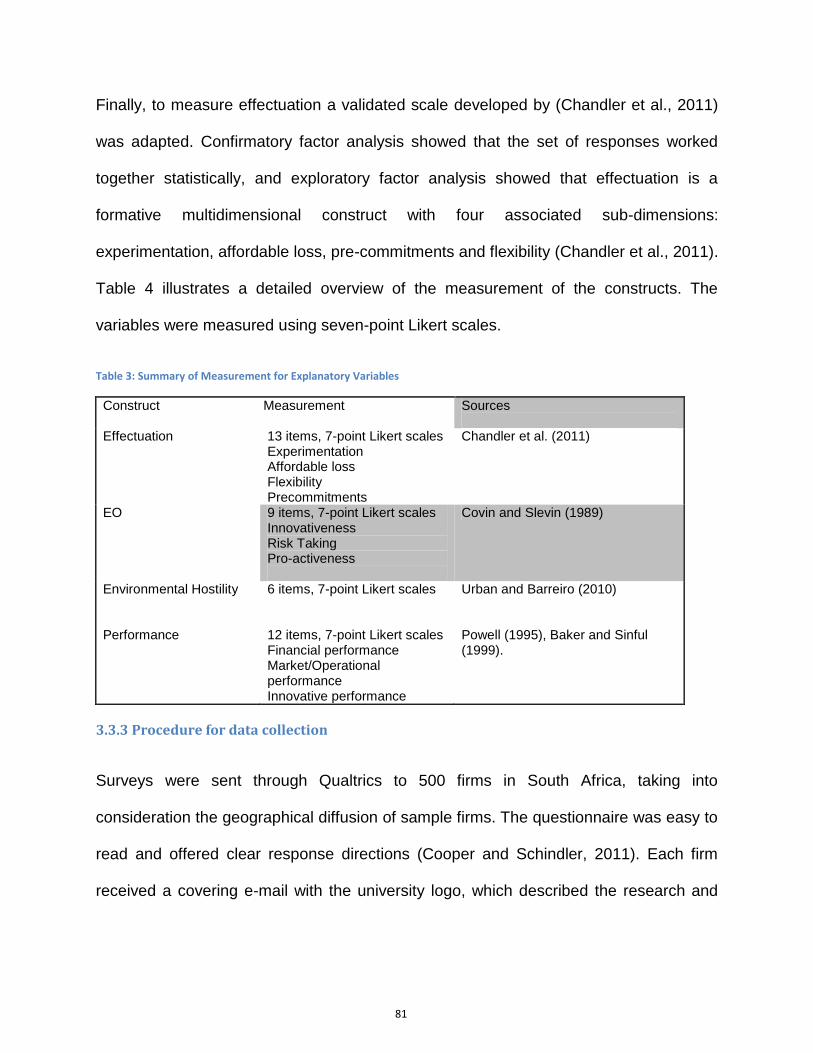
Table 3: Summary of Measurement for Explanatory Variables ............................ 81
Table 4: Descriptive Statistics .............................................................................. 88
Table 5: Frequency table: Current position in the firm ......................................... 90
Table 6: Frequency table: Firm founded ............................................................. 91
Table 7: Frequency table: Overall number of employees in the firm ................... 91
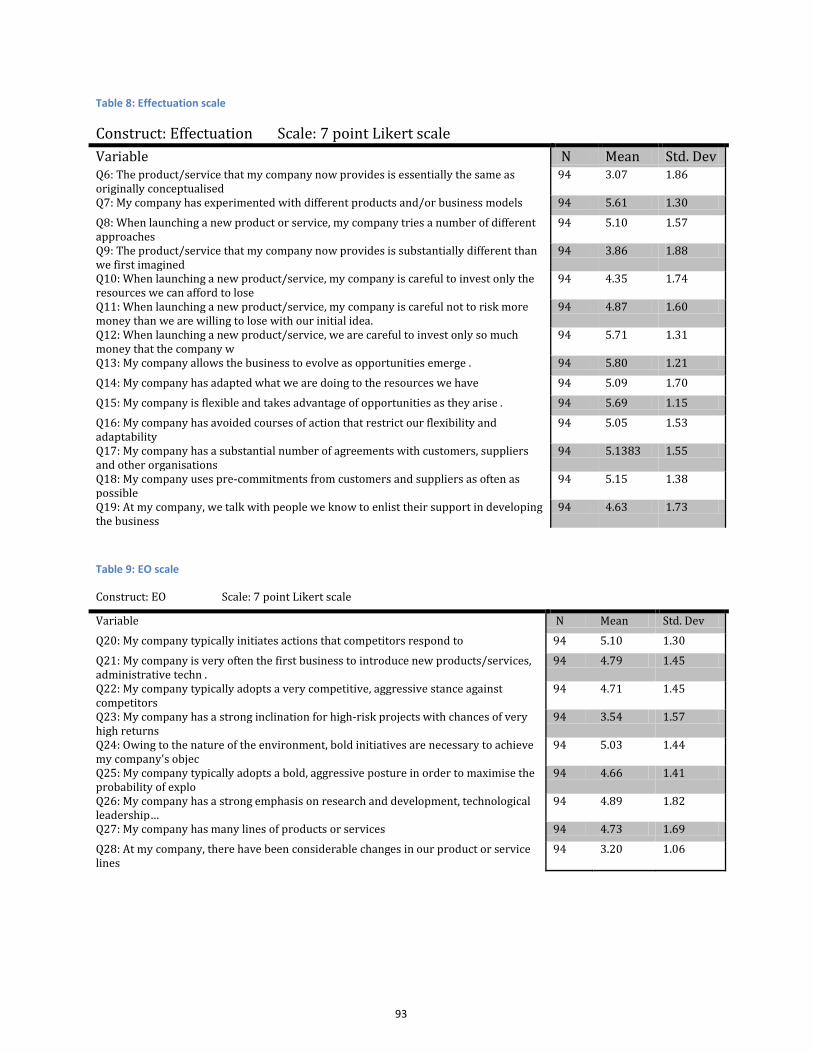
Table 8: Effectuation scale ................................................................................... 93
Table 9: EO scale ................................................................................................ 93
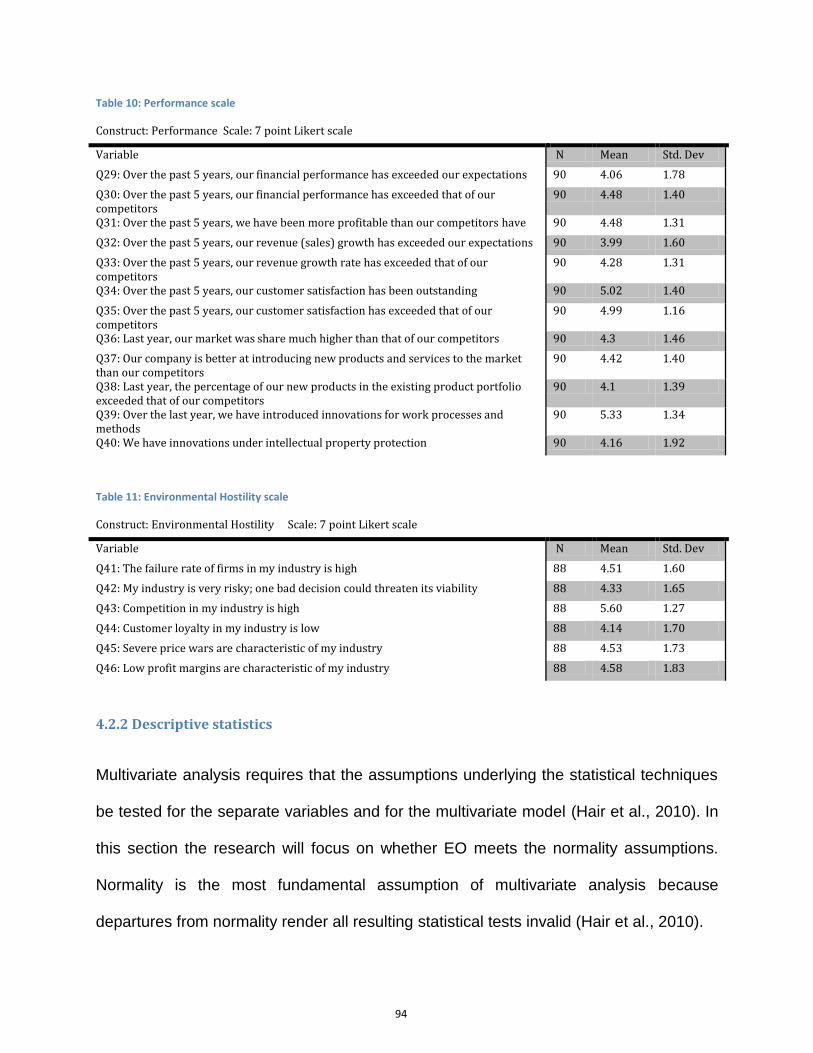
Table 10: Performance scale ............................................................................... 94
Table 11: Environmental Hostility scale ............................................................... 94
Table 12: Descriptive stats EO ............................................................................. 95
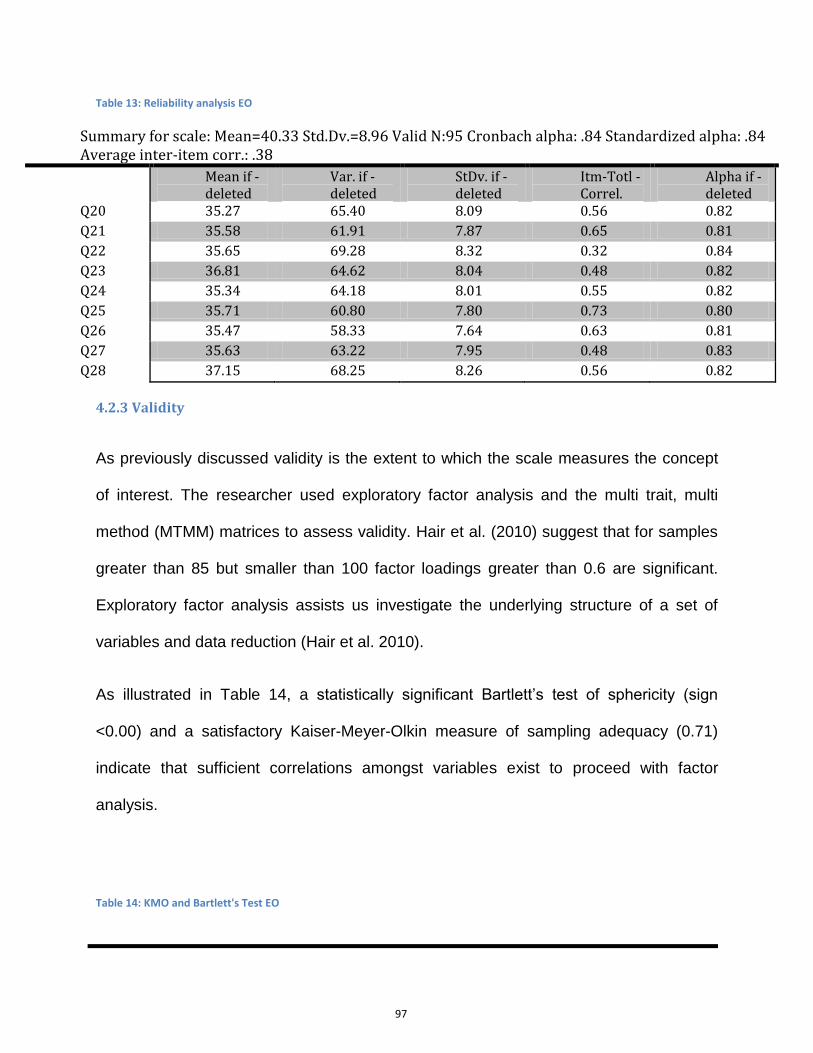
Table 13: Reliability analysis EO .......................................................................... 97
Table 14: KMO and Bartlett's Test EO ................................................................. 97
Table 15: Exploratory Factor Analysis EO ........................................................... 99
Table 16 : Eigenvalues EO ................................................................................. 99
Page 10
ix
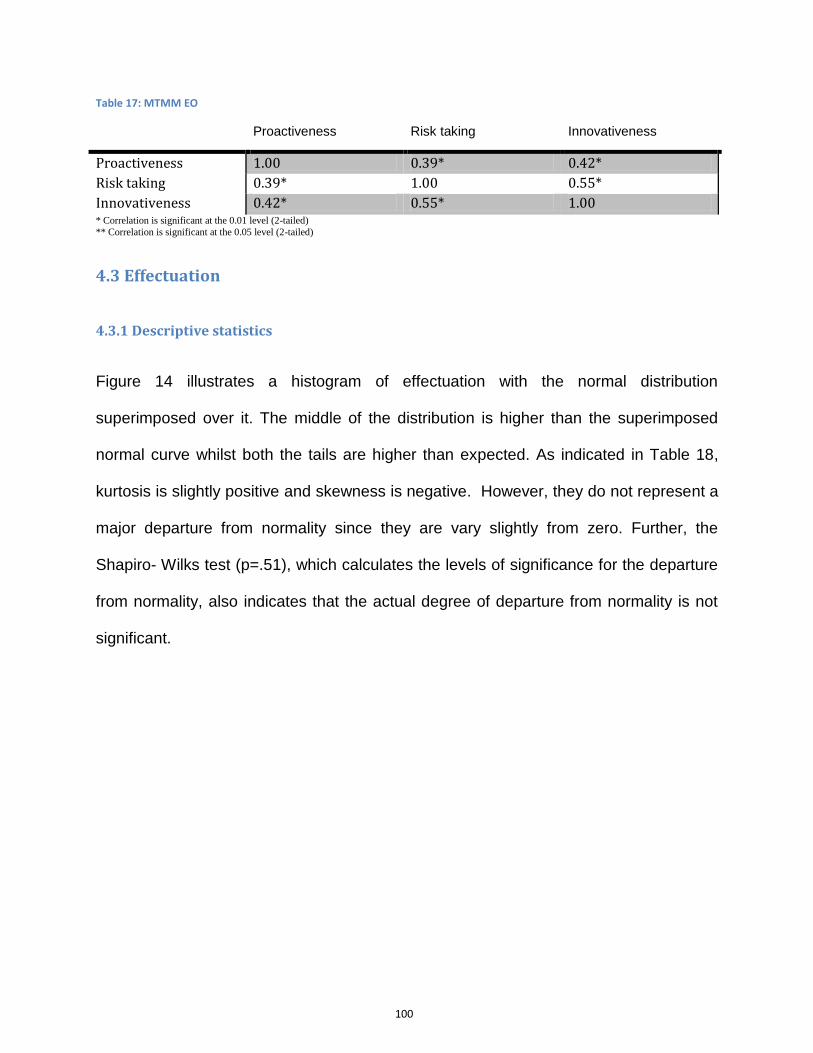
Table 17: MTMM EO .......................................................................................... 100
Table 18: Effectuation descriptive statistics ....................................................... 101
Table 19: MTMM Effectuation ............................................................................ 102
Table 20: Reliability analysis: Effectuation sub scales ...................................... 103
Table 21: KMO and Bartlett's Test Effectuation ................................................. 104
Table 22: Factor Loadings Effectuation ............................................................. 105
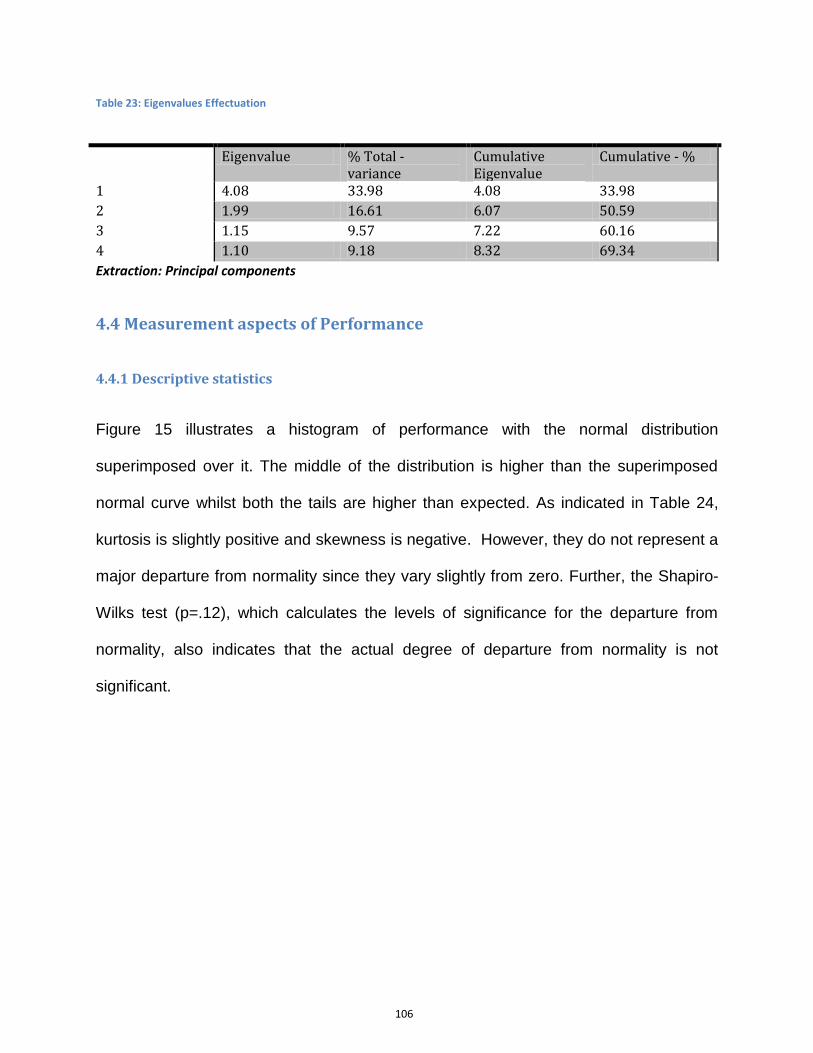
Table 23: Eigenvalues Effectuation .................................................................... 106
Table 24: Performance descriptive statistics ...................................................... 107
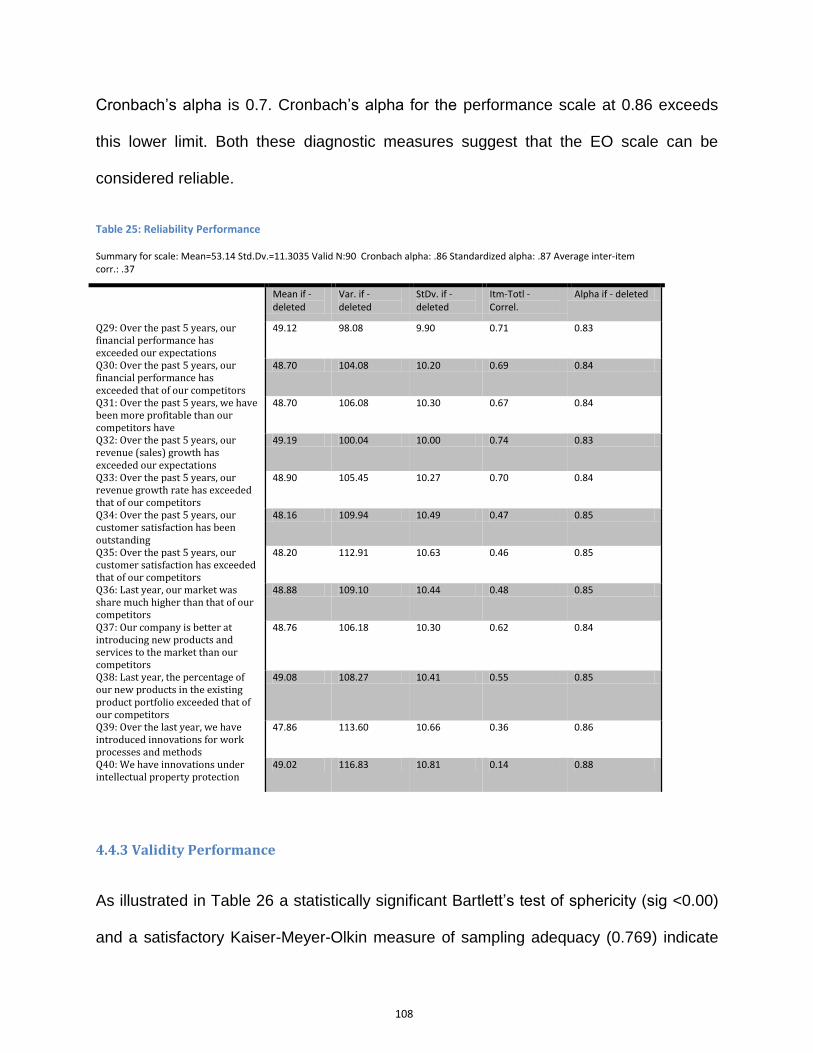
Table 25: Reliability Performance ...................................................................... 108
Table 26: KMO and Bartlett's Test Performance ................................................ 109
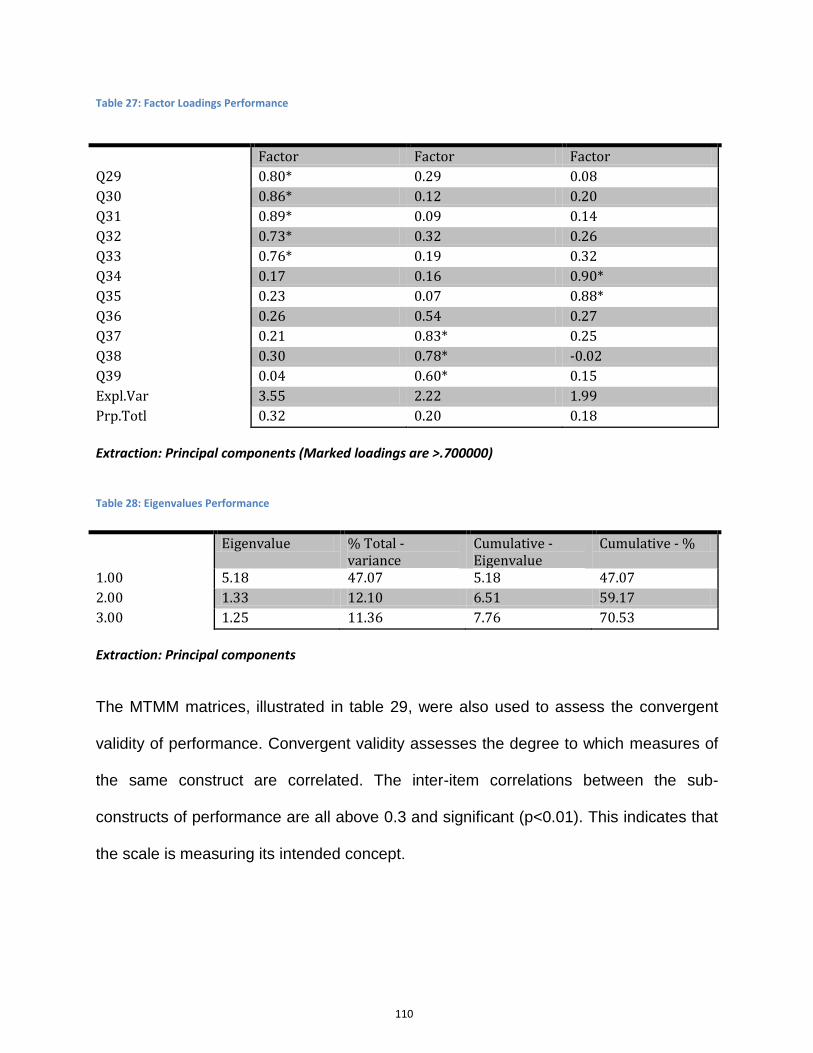
Table 27: Factor Loadings Performance ............................................................ 110
Table 28: Eigenvalues Performance .................................................................. 110
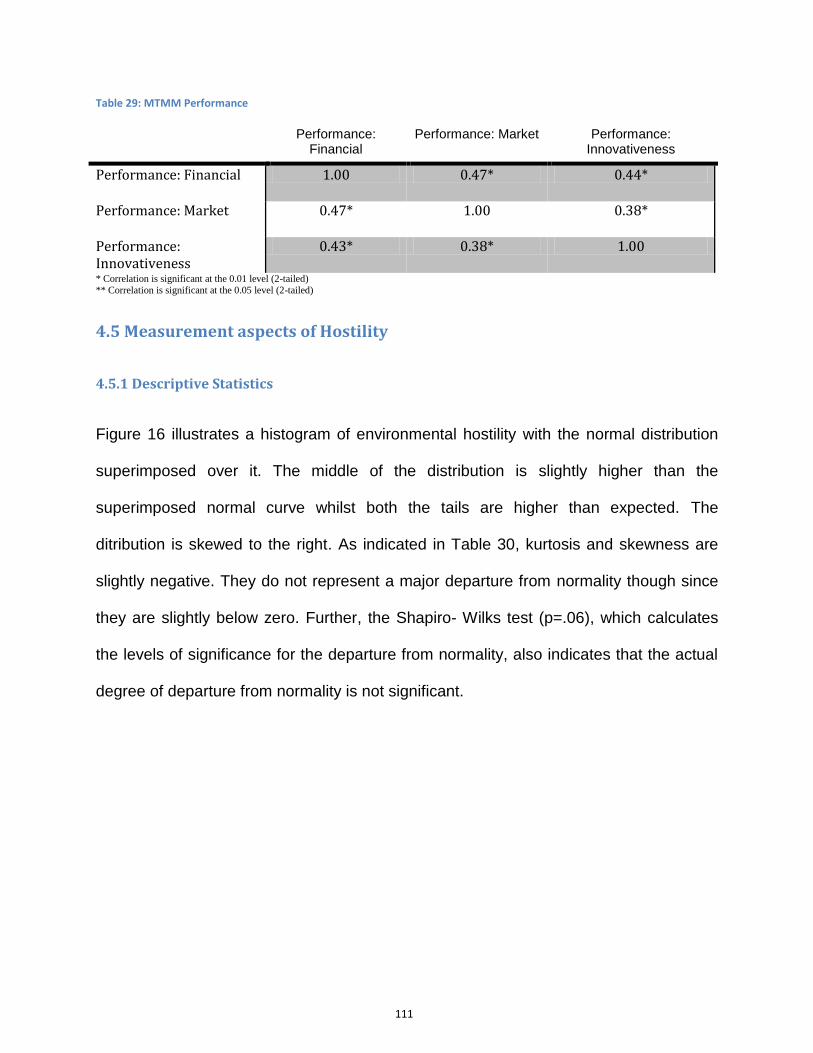
Table 29: MTMM Performance .......................................................................... 111
Table 30: Hostility descriptive statistics .............................................................. 112
Table 31: Reliabilty Analysis Hostility ................................................................. 113
Table 32: KMO and Bartlett's Test Hostility ....................................................... 114
Table 33: Factor Loadings Hostility .................................................................... 114
Table 34: Eigenvalues Environmental hostility .................................................. 115
Table 35: MTMM Environmental Hostility........................................................... 115
Table 36: KMO and Bartlett's Test EO and Effectuation .................................... 116
Table 37: Factor loadings EO and Effectuation ................................................. 118
Table 38: Eigenvalues EO and Effectuation....................................................... 118
Table 39: MTMM EO and Effectuation ............................................................... 119
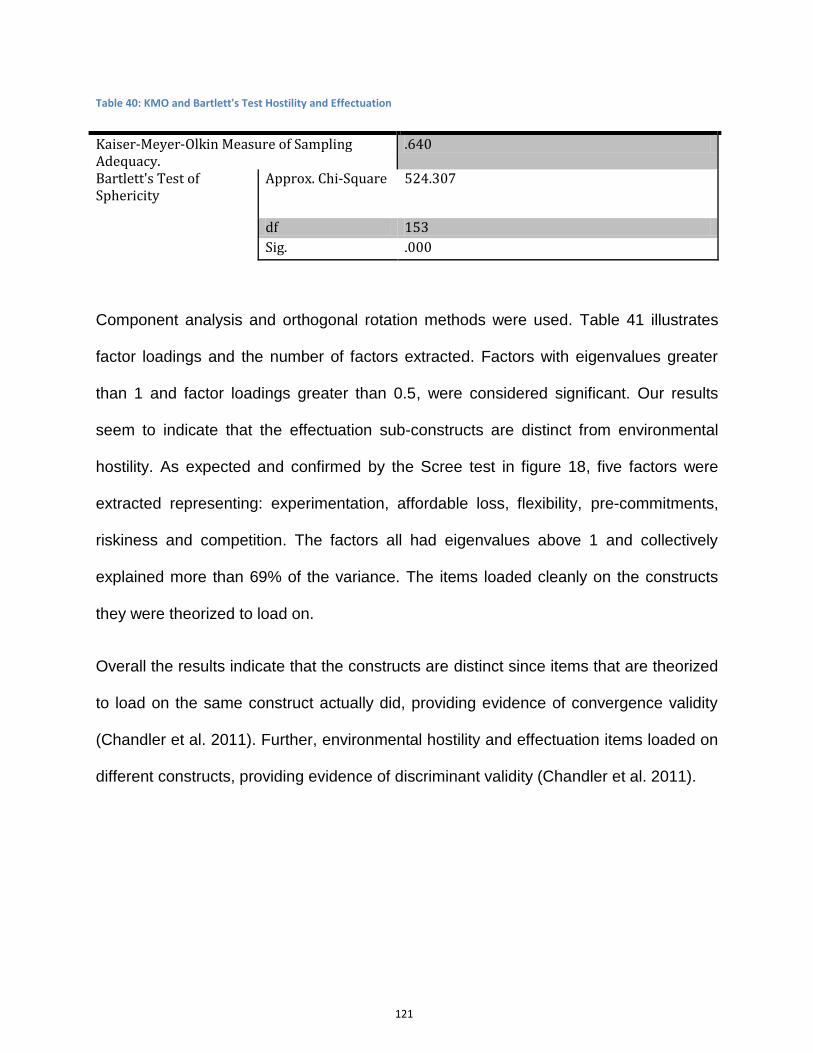
Table 40: KMO and Bartlett's Test Hostility and Effectuation ............................. 121
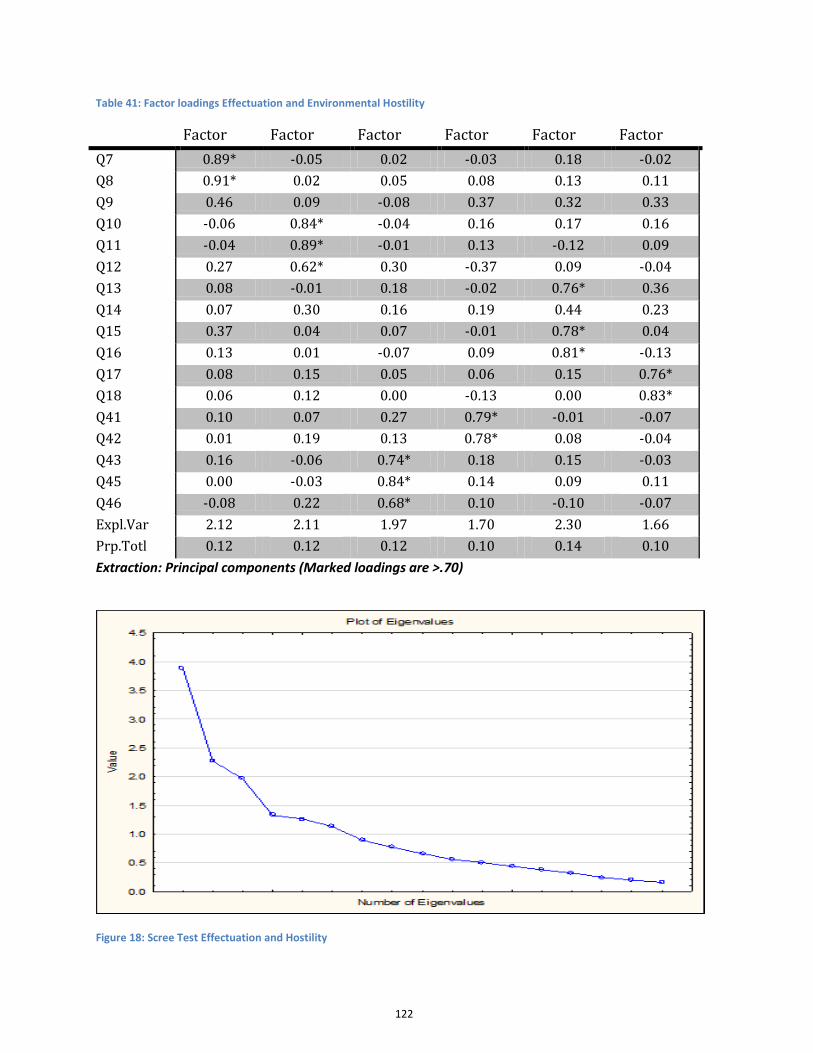
Table 41: Factor loadings Effectuation and Environmental Hostility .................. 122
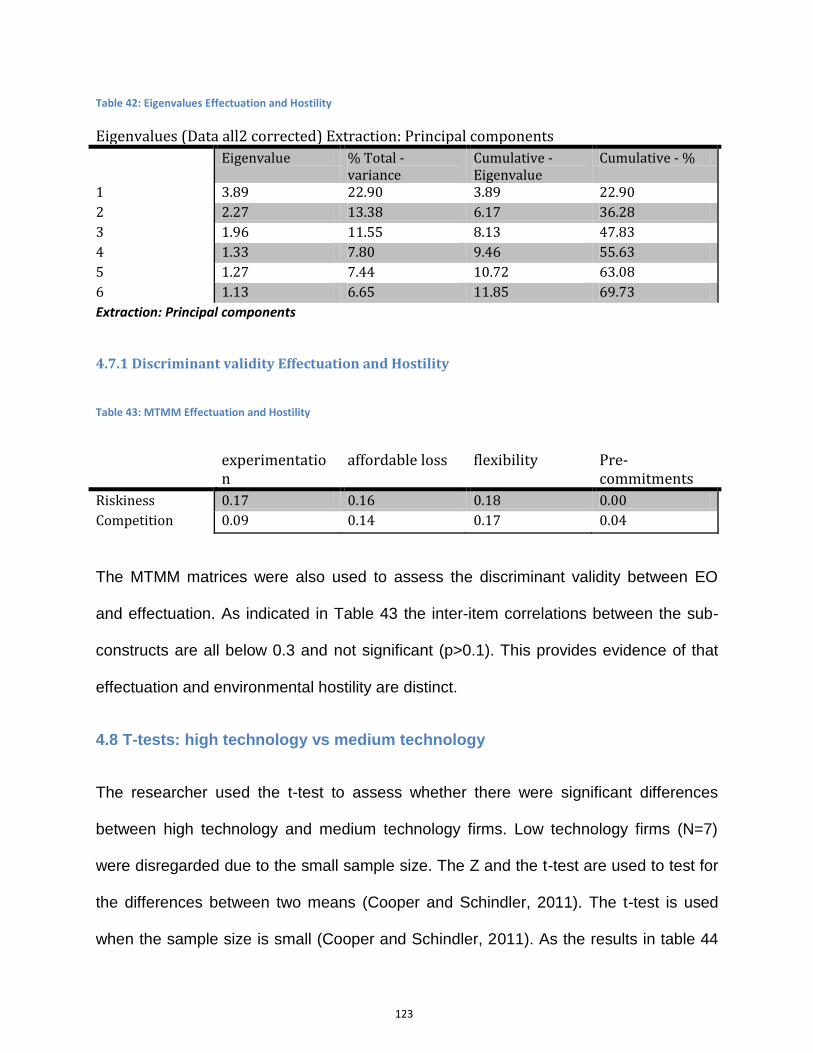
Table 42: Eigenvalues Effectuation and Hostility ............................................... 123
Page 11
x
Table 43: MTMM Effectuation and Hostility........................................................ 123
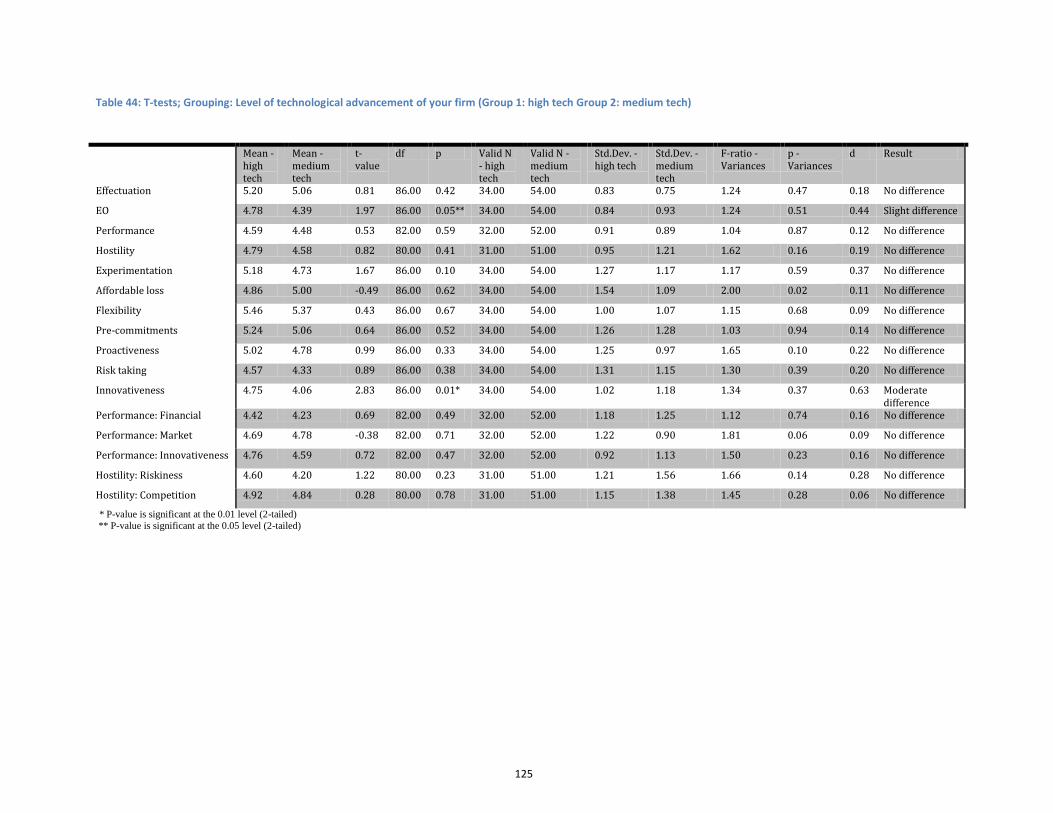
Table 44: T-tests; Grouping: Level of technological advancement of your firm
(Group 1: high tech Group 2: medium tech) ....................................................... 125
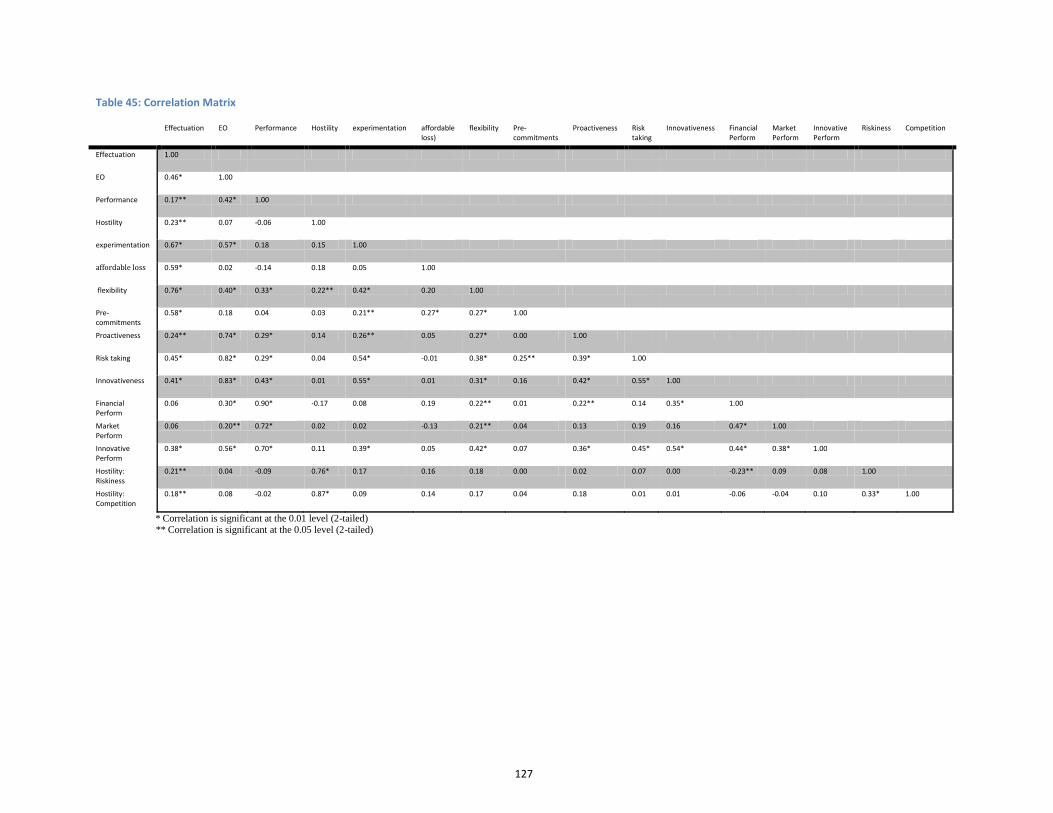
Table 45: Correlation Matrix ............................................................................... 127
Table 46: A summary of the regression results .................................................. 130
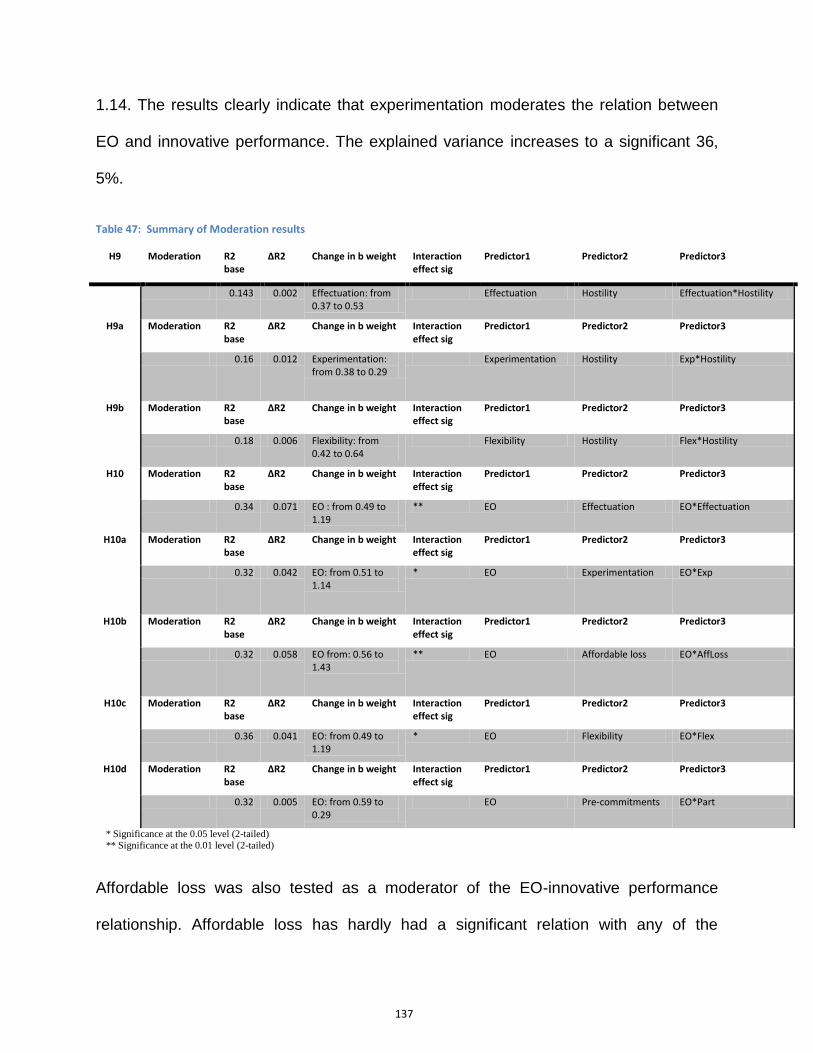
Table 47: Summary of Moderation results ........................................................ 137
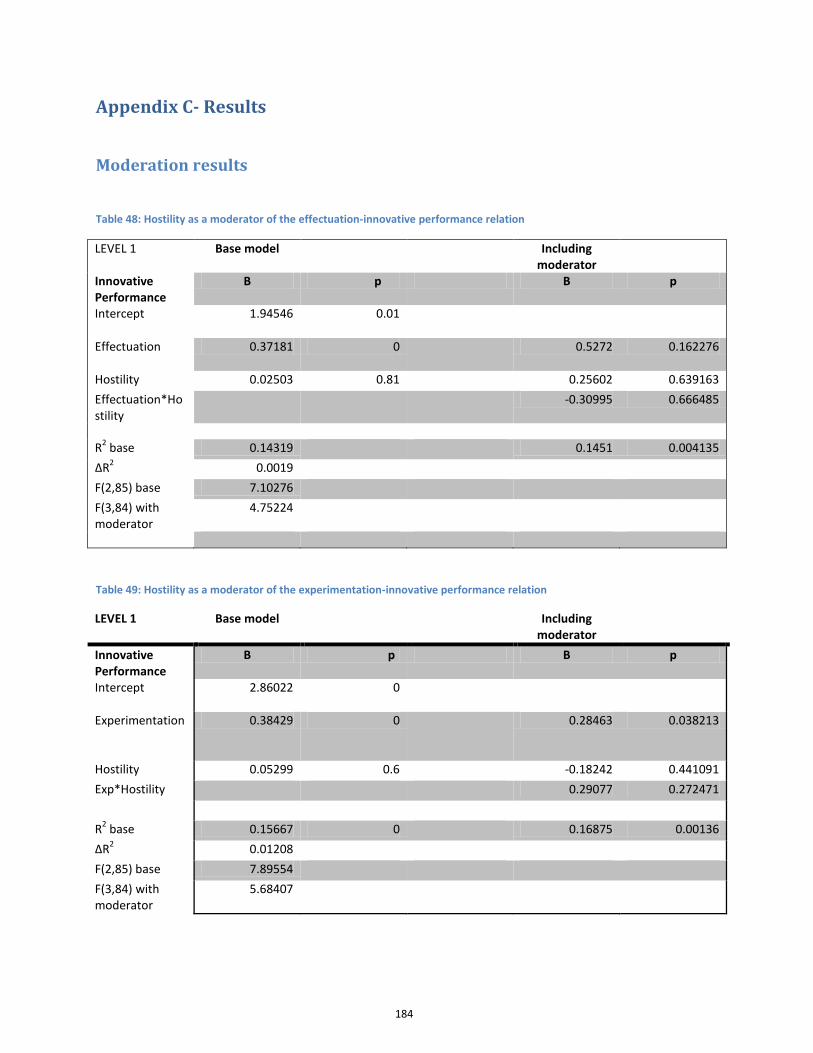
Table 48: Hostility as a moderator of the effectuation-innovative performance
relation ............................................................................................................... 184
Table 49: Hostility as a moderator of the experimentation-innovative performance
relation ............................................................................................................... 184
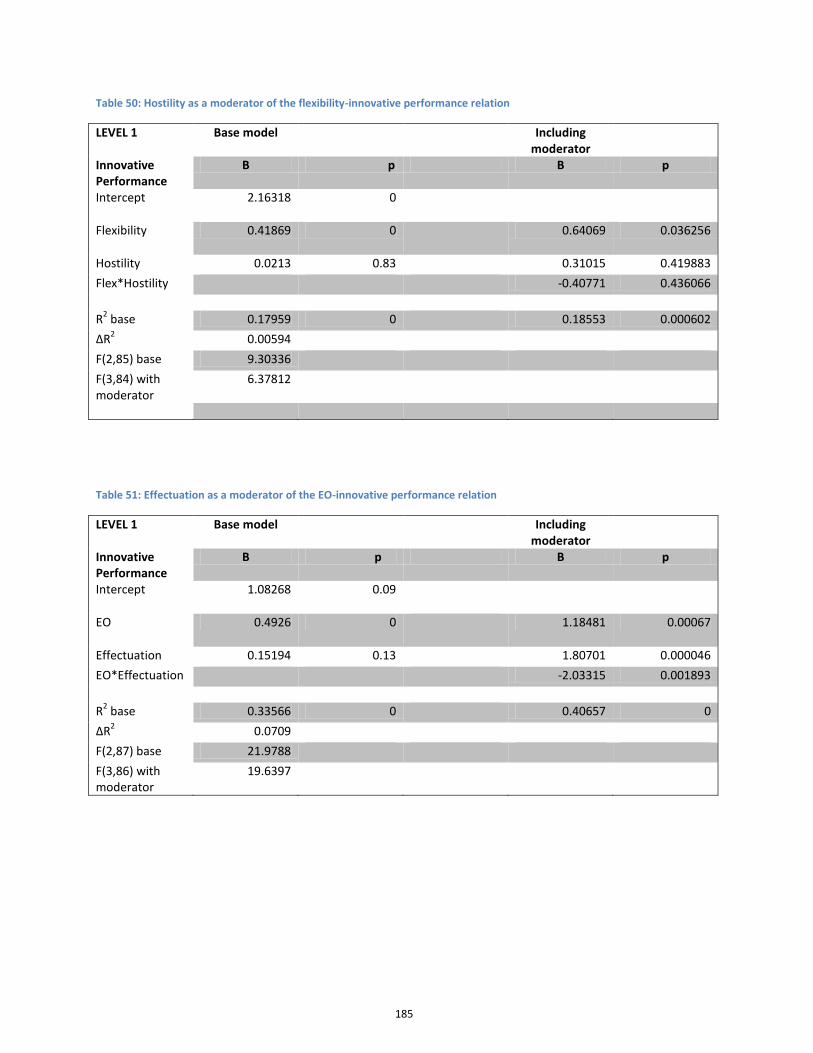
Table 50: Hostility as a moderator of the flexibility-innovative performance relation
........................................................................................................................... 185
Table 51: Effectuation as a moderator of the EO-innovative performance relation
........................................................................................................................... 185
Table 52: Experimentation as a moderator of the EO-innovative performance
relation ............................................................................................................... 186
Table 53: Affordable loss as a moderator of the EO-innovative performance
relation ............................................................................................................... 186
Table 54: Flexibility as a moderator of the EO-innovative performance relation 187
Table 55: Pre-commitments as a moderator of the EO-innovative performance
relation ............................................................................................................... 187
Table 56: Regression results: IV EO and DV Effectuation ................................. 192
Table 57: Regression results: IV Environmental Hostility and DV Effectuation .. 193
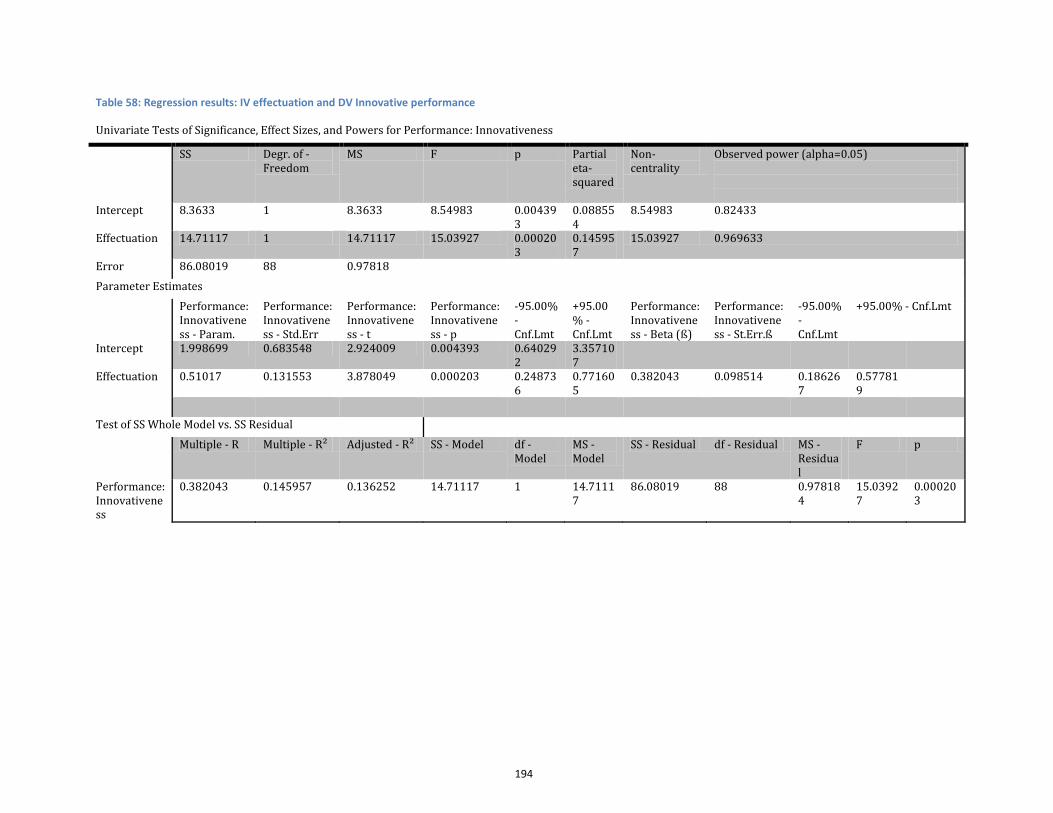
Table 58: Regression results: IV effectuation and DV Innovative performance . 194
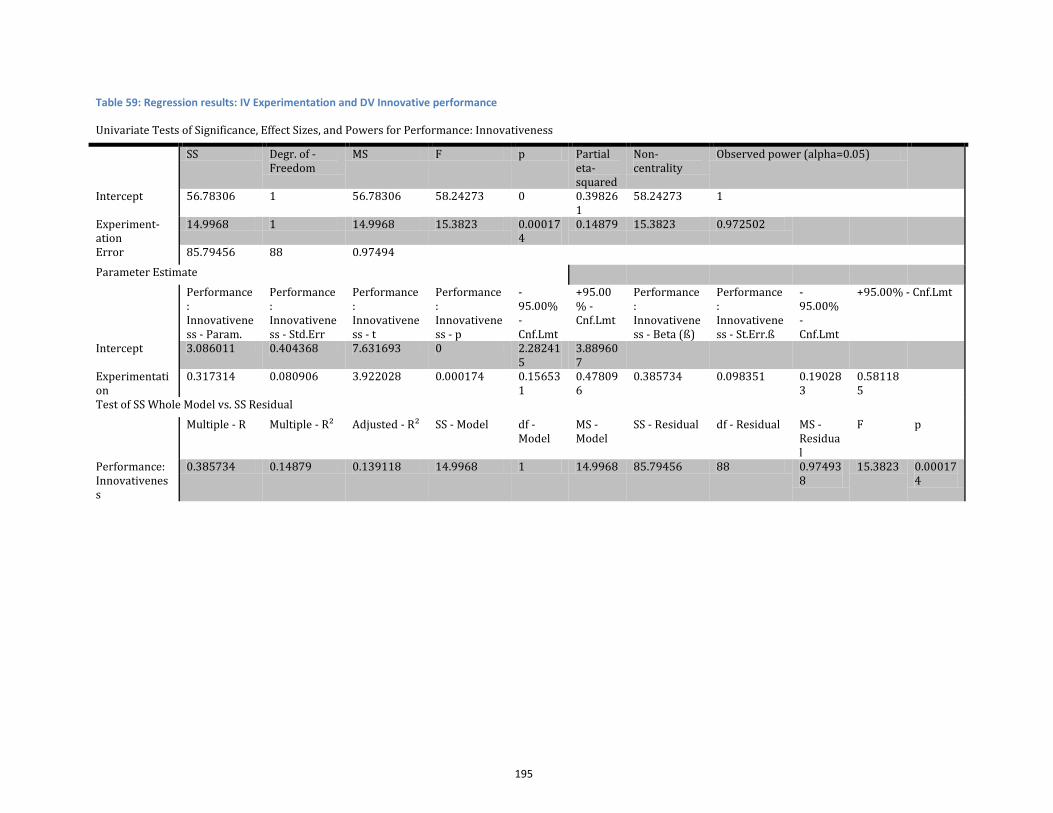
Table 59: Regression results: IV Experimentation and DV Innovative performance
........................................................................................................................... 195
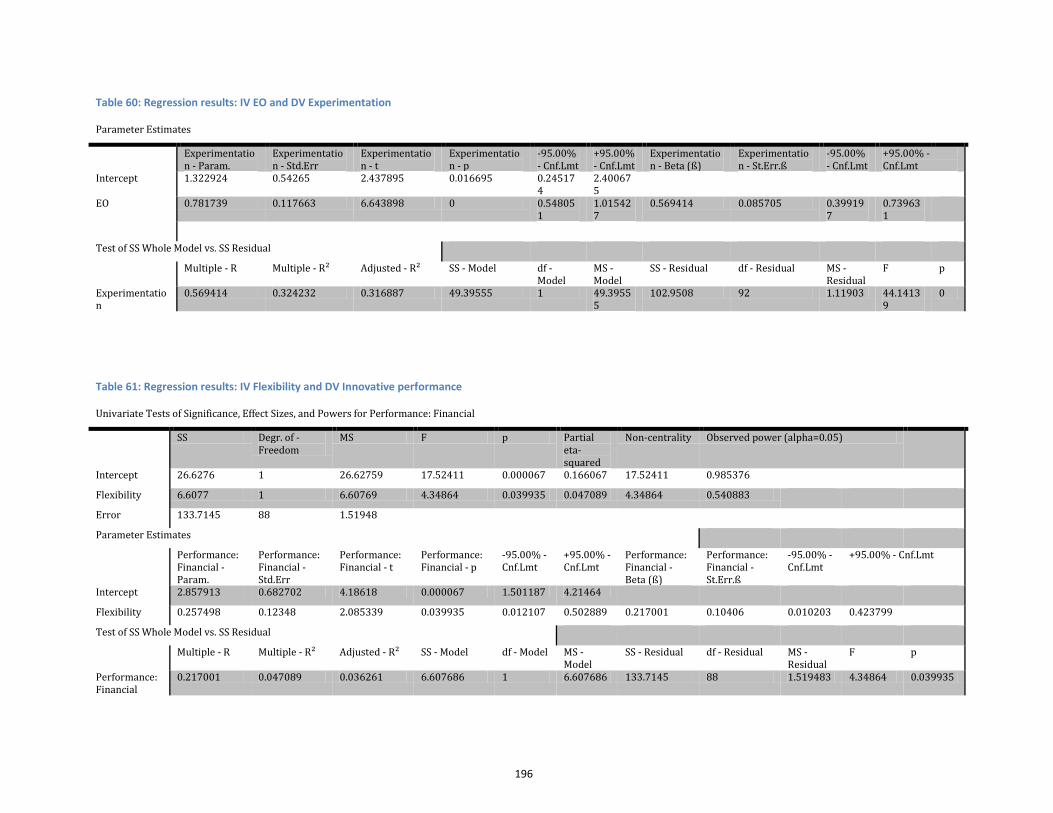
Table 60: Regression results: IV EO and DV Experimentation .......................... 196
Table 61: Regression results: IV Flexibility and DV Innovative performance ..... 196
Page 12
xi
Table 62: Regression results: IVs Effectuation and EO, and DV Innovative
performance ....................................................................................................... 197
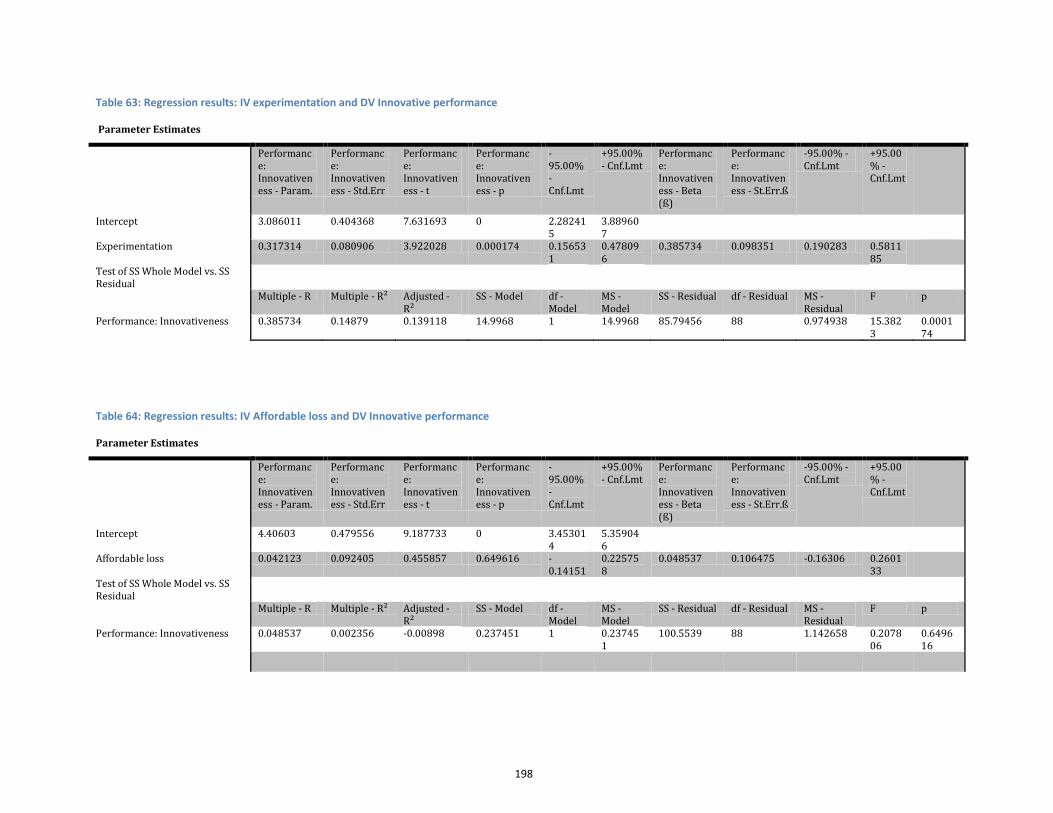
Table 63: Regression results: IV experimentation and DV Innovative performance
........................................................................................................................... 198
Table 64: Regression results: IV Affordable loss and DV Innovative performance
........................................................................................................................... 198
Table 65: Regression results: IV Flexibility and DV Innovative performance ..... 199
Table 66: Regression results: IV Pre-commitments and DV Innovative
performance ....................................................................................................... 199
Table 67: Regression results: IV EO and DV Performance ............................... 200
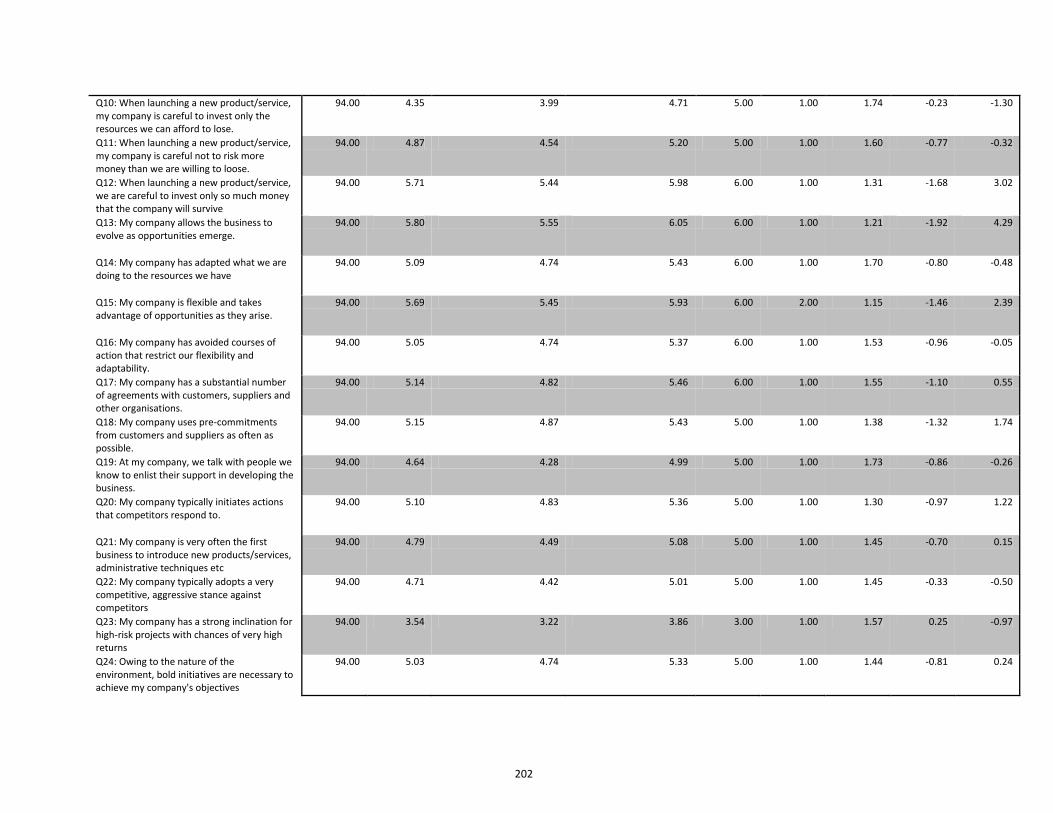
Table 68: Descriptive statistics (all data) ............................................................ 201
LIST OF FIGURES
Figure 1: Effectual Process .................................................................................. 28
Figure 2: The theory of effectuation ..................................................................... 33
Figure 3: Type of reasoning approach with respect to experience and firm lifecycle
............................................................................................................................. 38
Figure 4: Contrasting the textbook paradigm in marketing with effectuation ........ 39
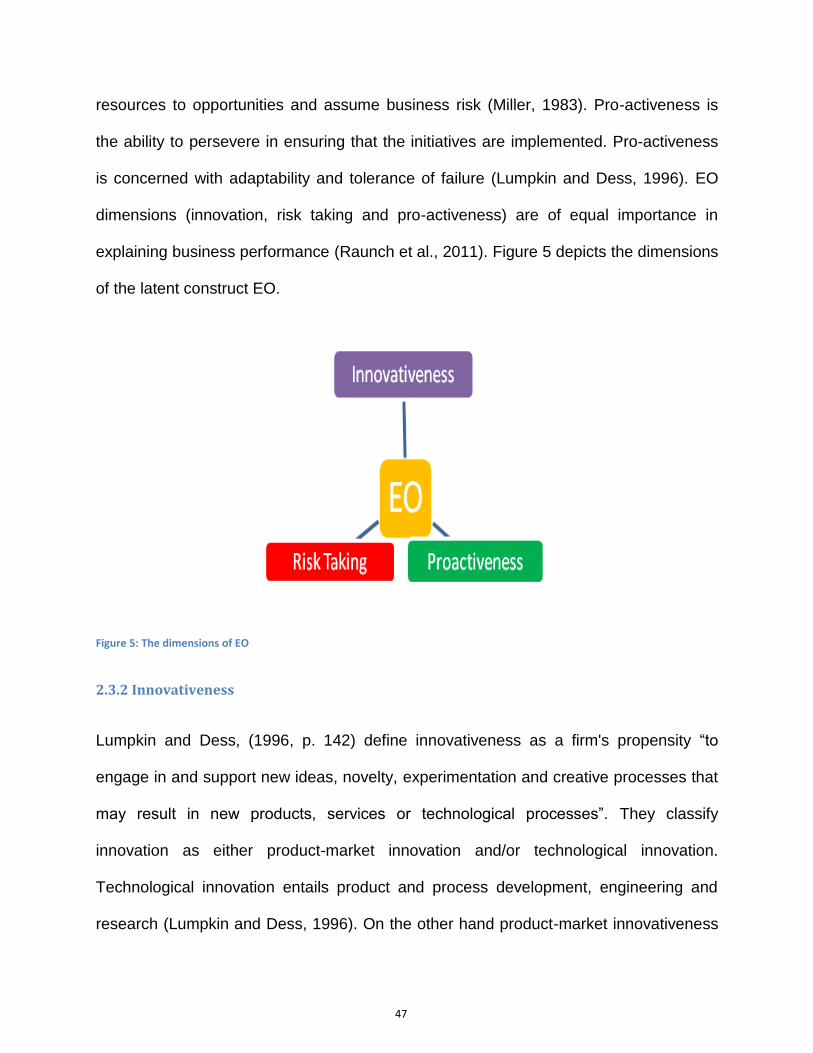
Figure 5: The dimensions of EO .......................................................................... 47
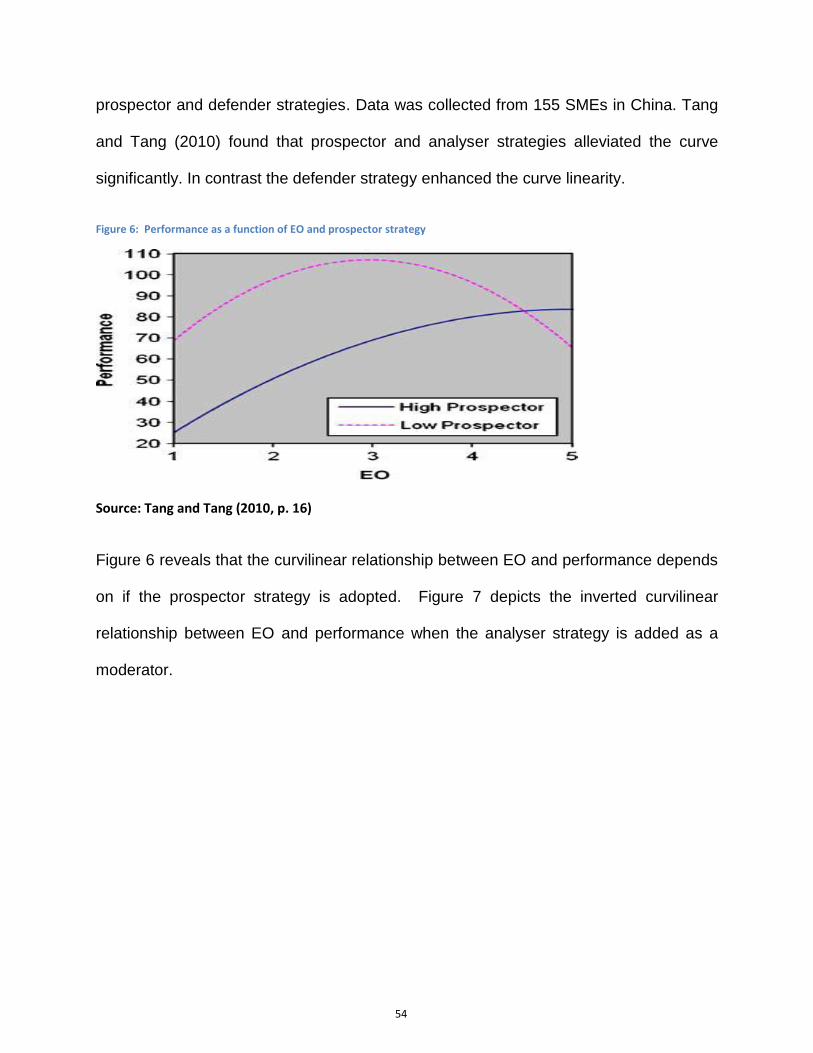
Figure 6: Performance as a function of EO and prospector strategy .................. 54
Figure 7: Performance as a function of EO and analyzer strategy ....................... 55
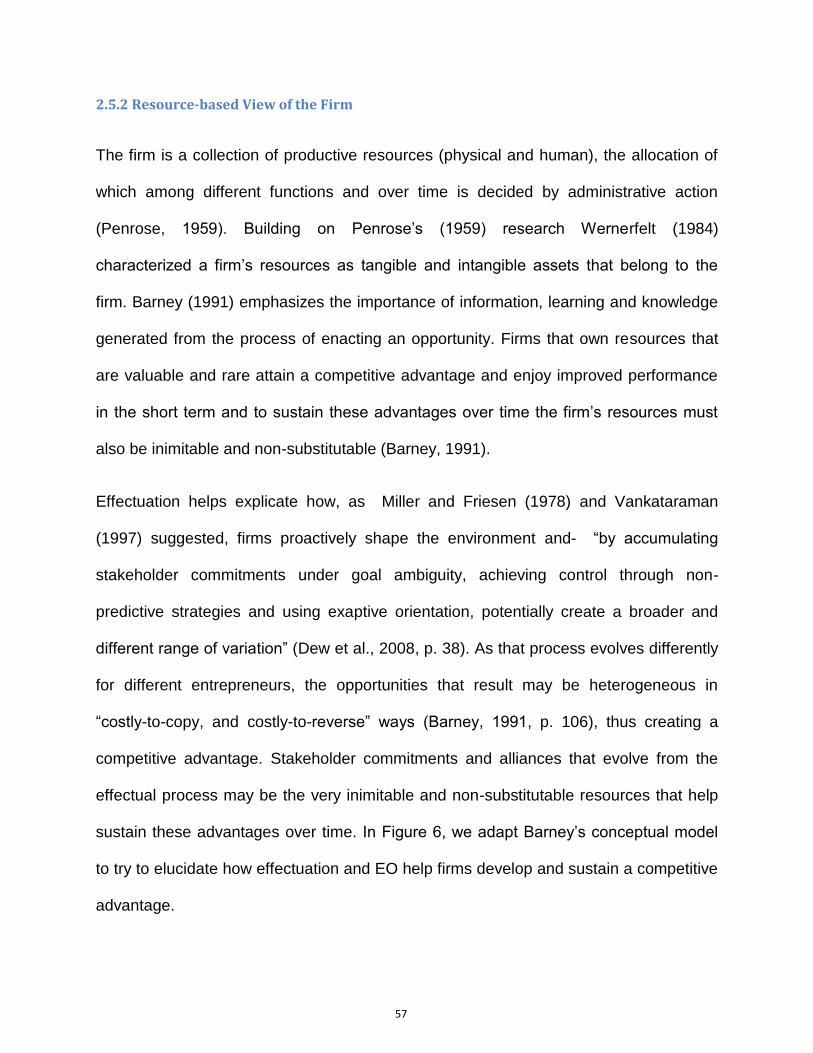
Figure 8: Creating competitive advantage ........................................................... 58
Figure 9: The Domains of Business Performance ................................................ 60
Figure 10: Hostility as a moderator of Effectuation and Performance .................. 72
Figure 11: Effectuation as a moderator of EO and Performance ......................... 72
Figure 12: Level of technological advancement ................................................... 92
Page 13
xii
Figure 13: Histogram EO ..................................................................................... 95
Figure 14: Histogram Effectuation ...................................................................... 101
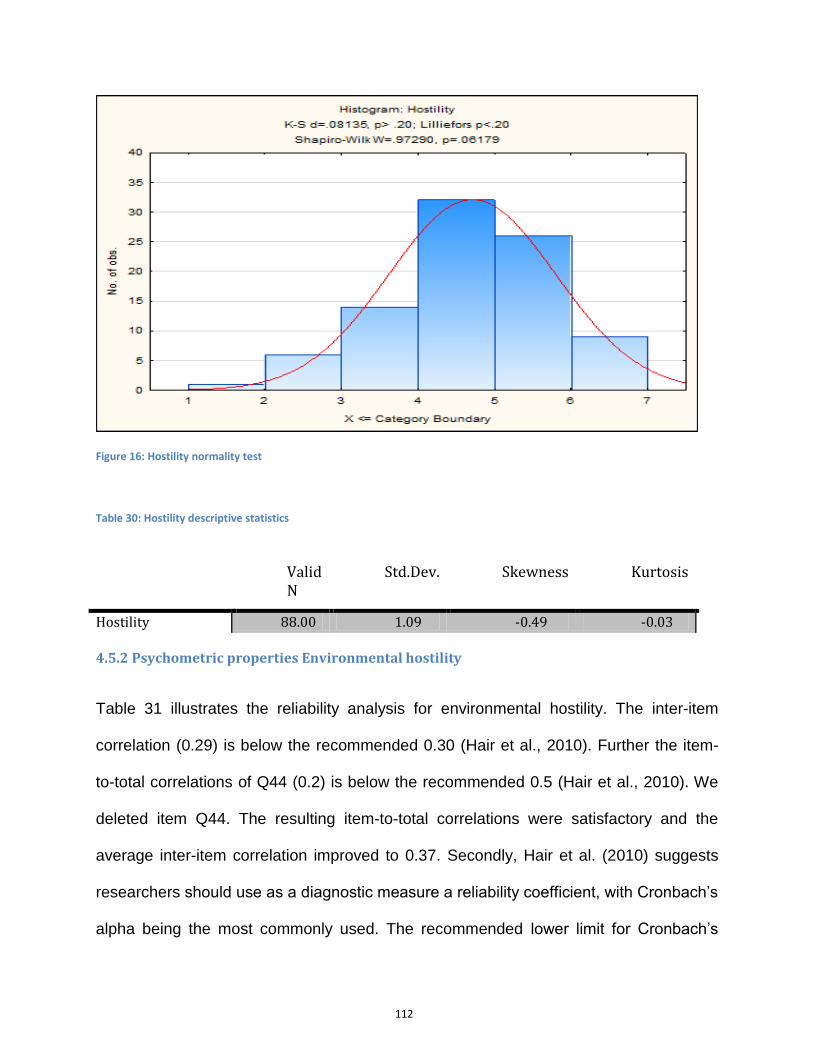
Figure 15: Performance normality test ............................................................... 107
Figure 16: Hostility normality test ....................................................................... 112
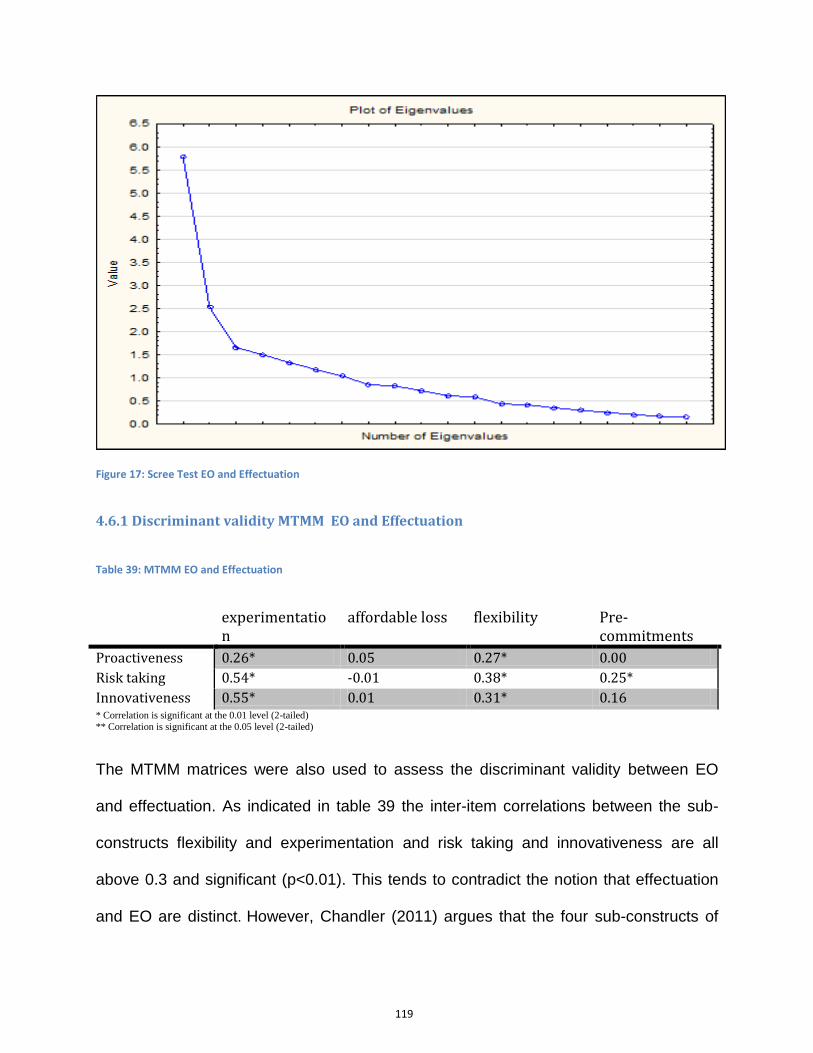
Figure 17: Scree Test EO and Effectuation........................................................ 119
Figure 18: Scree Test Effectuation and Hostility ................................................ 122
Figure 19: Scatterplot of Effectuation against EO ............................................. 188
Figure 20: Scatterplot of Effectuation against Hostility ....................................... 188
Figure 21: Scatterplot of Innovative performance against Effectuation .............. 188
Figure 22: Scatterplot of Innovative performance against experimentation ....... 189
Figure 23: Scatterplot of Innovative performance against Affordable loss ......... 189
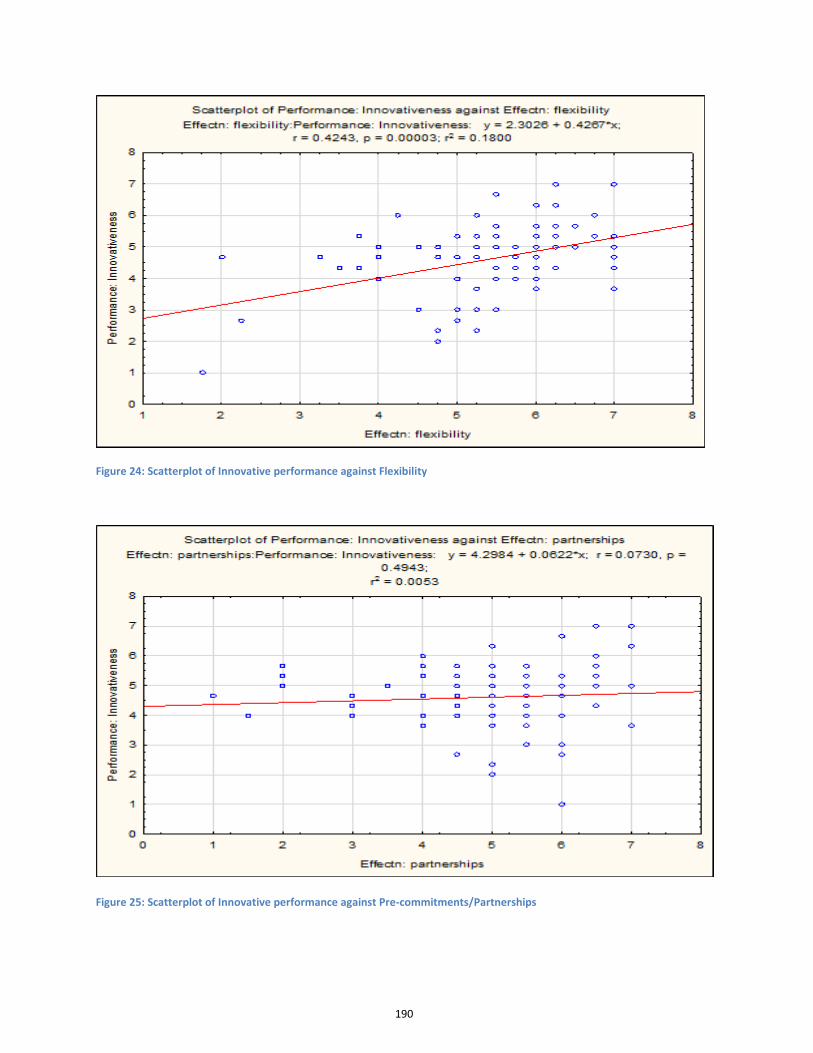
Figure 24: Scatterplot of Innovative performance against Flexibility .................. 190
Figure 25: Scatterplot of Innovative performance against Pre-
commitments/Partnerships ................................................................................. 190
Figure 26: Scatterplot of Performance against EO ............................................. 191
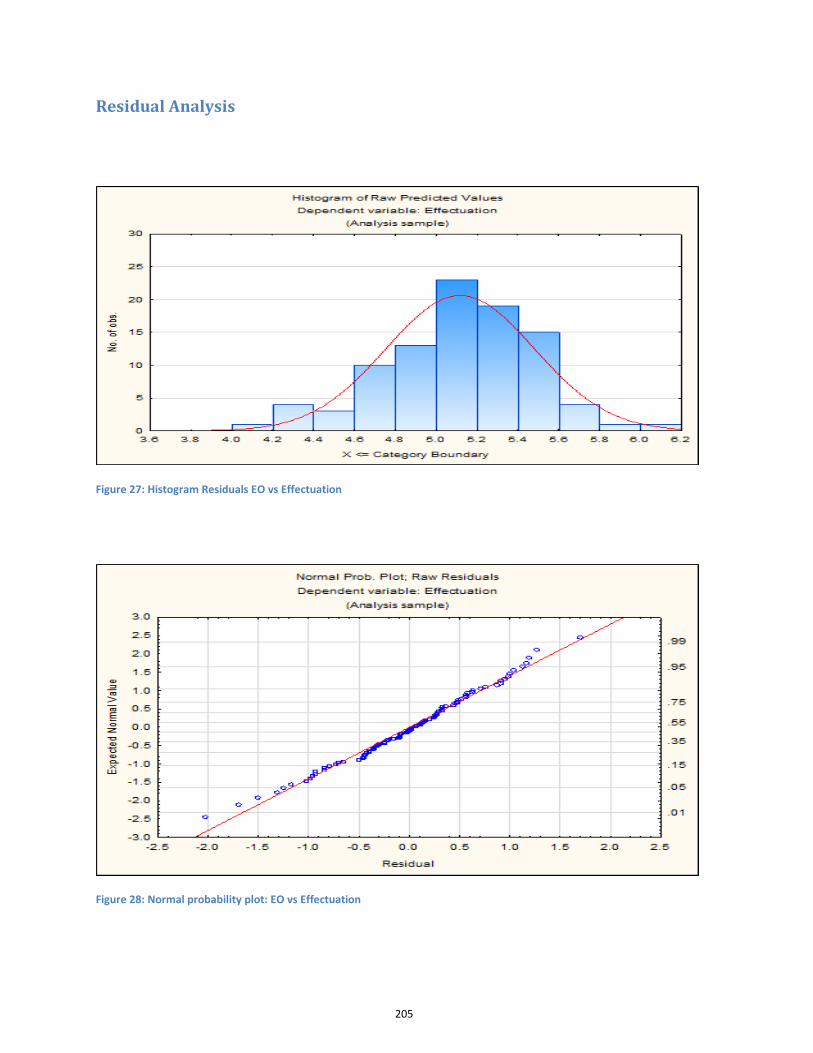
Figure 27: Histogram Residuals EO vs Effectuation .......................................... 205
Figure 28: Normal probability plot: EO vs Effectuation ....................................... 205
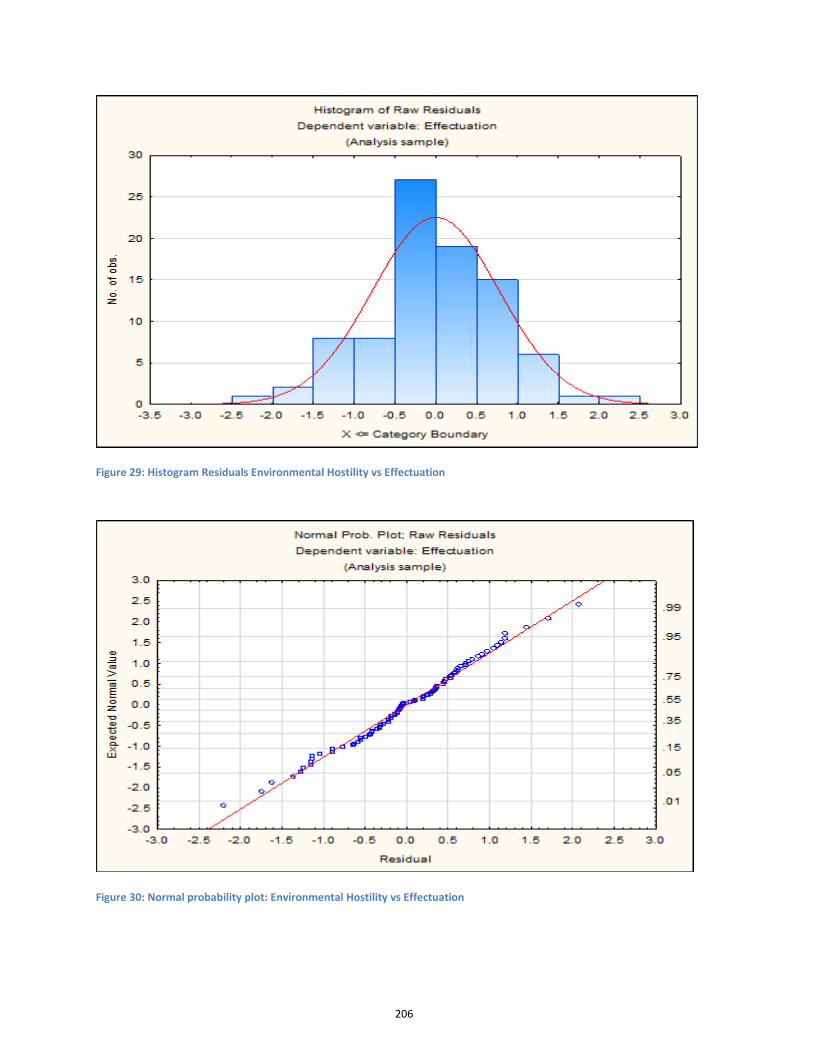
Figure 29: Histogram Residuals Environmental Hostility vs Effectuation ........... 206
Figure 30: Normal probability plot: Environmental Hostility vs Effectuation ....... 206
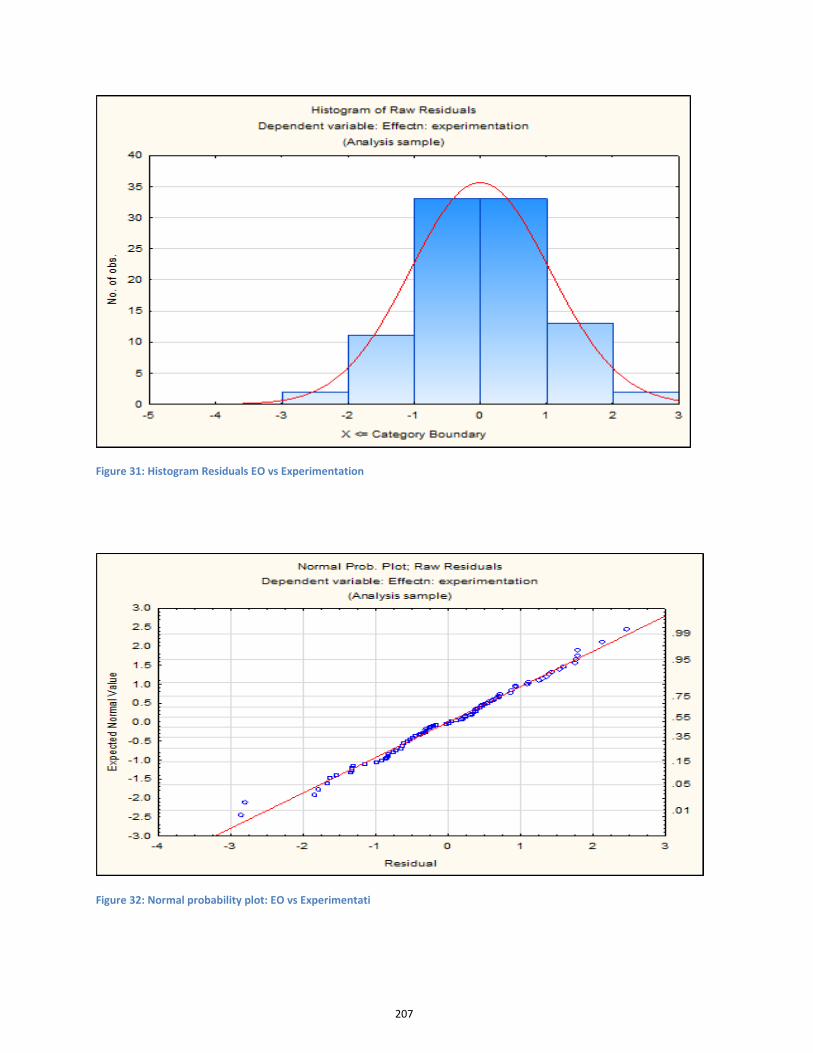
Figure 31: Histogram Residuals EO vs Experimentation ................................... 207
Figure 32: Normal probability plot: EO vs Experimentati .................................... 207
Figure 33: Histogram Residuals EO vs Flexibility .............................................. 208
Figure 34: Normal probability plot: EO vs Flexibility ........................................... 208
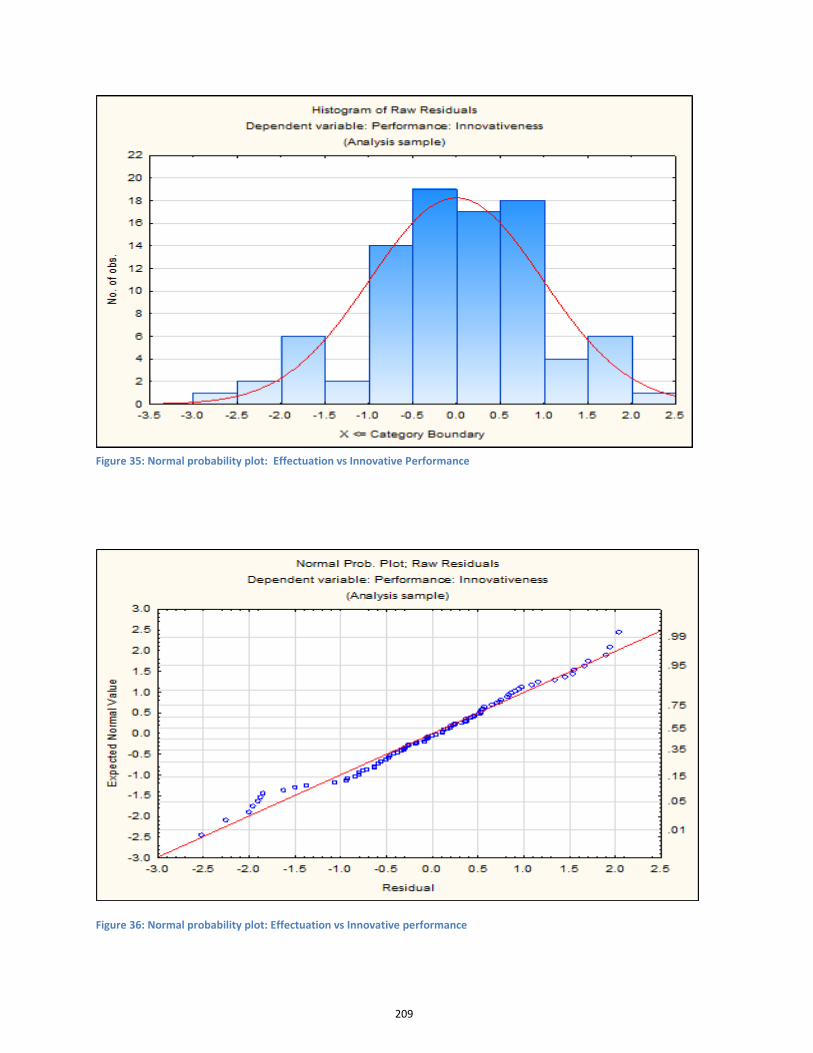
Figure 35: Normal probability plot: Effectuation vs Innovative Performance ..... 209
Figure 36: Normal probability plot: Effectuation vs Innovative performance ...... 209
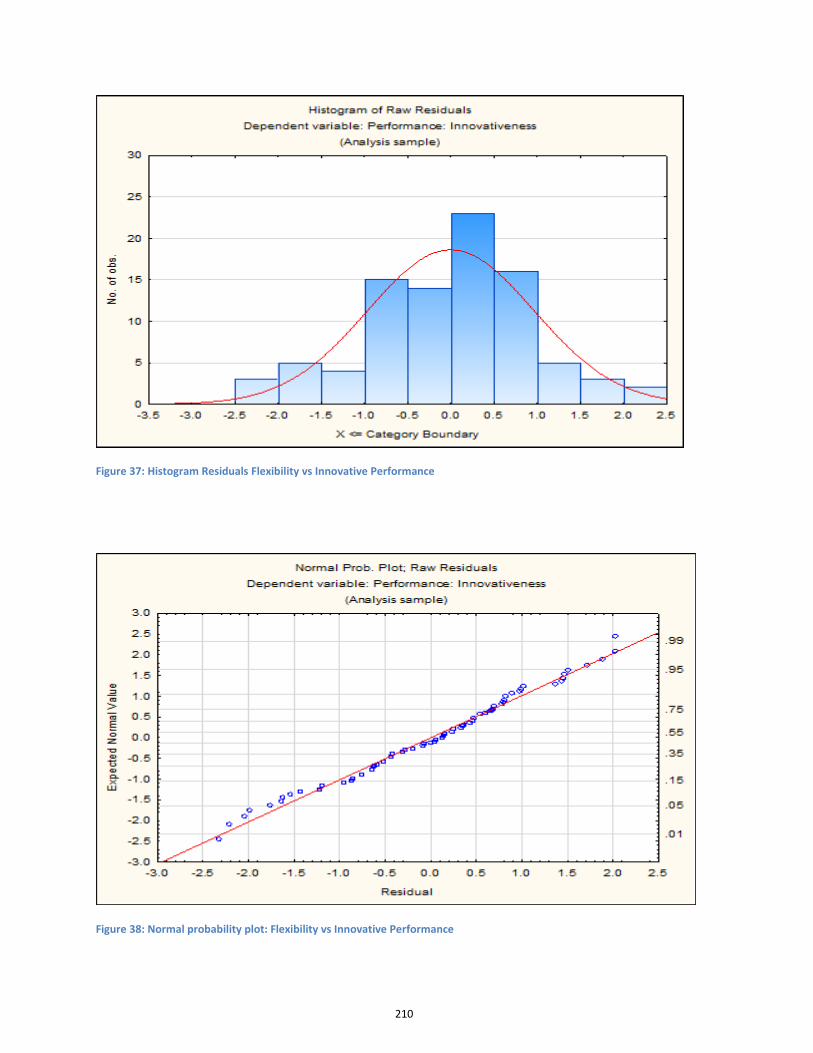
Figure 37: Histogram Residuals Flexibility vs Innovative Performance .............. 210
Page 14
xiii
Figure 38: Normal probability plot: Flexibility vs Innovative Performance .......... 210
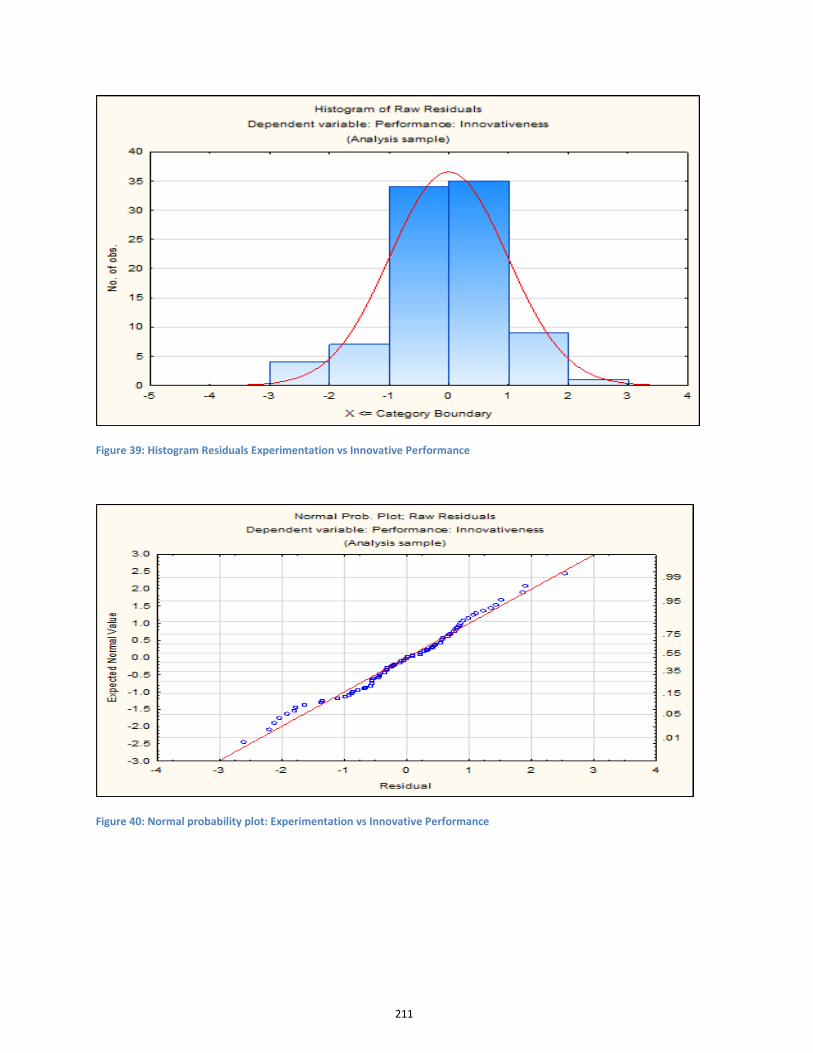
Figure 39: Histogram Residuals Experimentation vs Innovative Performance ... 211
Figure 40: Normal probability plot: Experimentation vs Innovative Performance 211
Figure 41: Histogram Residuals Effectuation as moderator ............................... 212
Figure 42: Normal probability plot: Effectuation as moderator ........................... 212
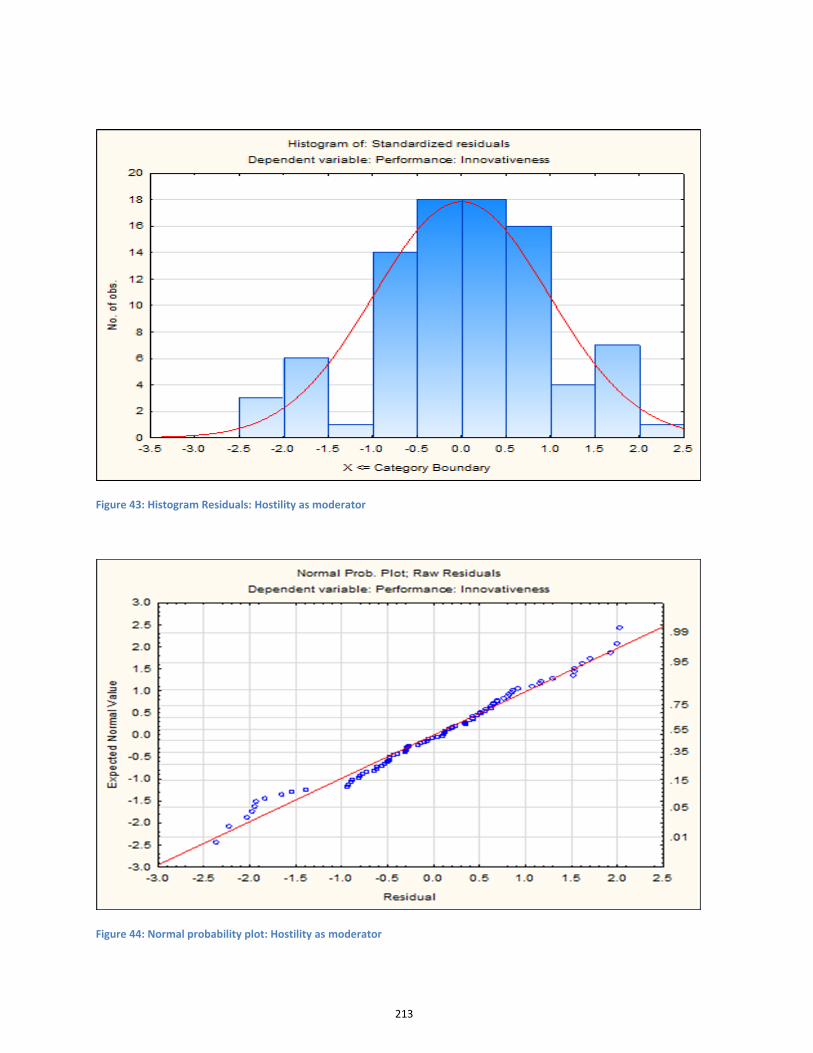
Figure 43: Histogram Residuals: Hostility as moderator .................................... 213
Figure 44: Normal probability plot: Hostility as moderator .................................. 213
Page 15
14
Chapter 1: Introduction
1.1 INTRODUCTION
1.1.1 Purpose of the study
The purpose of this research is to test the moderating impact of effectuation on the
relationship between entrepreneurial orientation (EO) and high technology firm
performance in a hostile environment. The research will consider whether effectuation
influences performance in the South African high technology sector. Further, the study
also addresses a research gap suggested by Perry, Chandler and Markova (2011) in
terms of exploring relationships between effectuation and established entrepreneurship
and management theories such as EO and environmental hostility.
1.1.2 Context of the study
South Africa is blighted by high levels of unemployment and poverty. From 2000 until
2008, South Africa's unemployment rate averaged 26.38%. It reached a historical high
of 31.20% in March 2003 and a record low of 25% in September of 2007 (Statistics
South Africa, 2011). In the first quarter of 2011, the unemployment rate in South Africa
was 25.7 %, one of the highest in the world (Statistics South Africa, 2011).
The United Nations has developed a measure of human development, called the
Human Development Index (HDI). The HDI assesses citizens of a particular country in
terms of longevity, knowledge and income. South Africa is ranked 121st out of 177
countries with an HDI score of 0.674 (Venter, Urban and Rwigema, 2007). The HDI is
Page 16
15
deemed a strong indicator of poverty levels (Venter et al., 2007). In contrast to other
emerging markets that have shown an improvement, South Africa’s HDI score has
tended to decline (Venter et al., 2007). Unemployment and poverty rates seem to be on
the increase. These challenges are rooted in historical inequality and are a direct result
of apartheid (Venter et al., 2007).
The South African government has sought to ameliorate this social deficit by introducing
social grants/welfare. These initiatives have fallen short of expectations, largely due to
the scale of the social deficit and a limited tax base.
Entrepreneurship and particularly technology entrepreneurship has been seen as a
possible solution to generate innovation, grow the economy and create jobs, thus
reducing poverty. The government has launched a wide array of initiatives: the
Technology Innovation Agency (TIA), SEDA Technology Programme (STP), the
National Technology Transfer Centre (NTTC), the Industrial Development Corporations’
(IDC) Venture Capital Fund and the Jobs Fund. These initiatives have been
implemented to foster, secure and accelerate the creation and growth of technology
ventures.
The 1996 White Paper on Science and Technology, the 2002 National Research and
Development Strategy and in 2007 the Ten-Year Innovation initiated the system of
innovation (NSI) concept. Over the subsequent decade, research and development
expenditure has increased fivefold from R4 billion to R21 billion and 14000 scientists,
engineers, technologists, technicians, managers and other technical staff are now
directly involved in research and development (OECD Innovation Review, 2007).
Page 17
16
Further, South Africa has targeted gross expenditure on research and development to
be 1, 5% of GDP by 2014. The 2007 OECD review of the NSI indicates that South
Africa is a world leader in research in fields such as environment/ecology, social
science, engineering, plant and animal sciences and clinical medicine (OECD
Innovation Review, 2007). However, the OECD review suggested a critical need to
ensure the flow of innovation through to commercialisation.
South Africa has struggled to commercialise its research output. Even though many
statistics that typically measure the knowledge economy progress have improved from
the 1990s, South Africa still trails other middle-income countries (Lorentzen, 2009).
Upper middle-income countries have increased their share of technological and
scientific output, along with research and development (R&D). Further, they have
increased investments and royalty payments and receipts. Although part of the middle-
income group, South Africa has fallen behind in the past decade (Lorentzen, 2009).
Nevertheless, how firms go about innovating and the dynamics of technological
upgrading at the micro level have yet to be explored on a large scale in emerging
markets, let alone in South Africa (Lorentzen, 2009).
Further, high technology ventures seem to be characterised by both high potential
future profits and high uncertainty (Blanco, 2007). Knight (1921) conceptualised high
uncertainty as consisting of non-existent distributions where the very instances are
unclassifiable. This description might be particularly apt for the uncertainty South
African high technology ventures face. Besides dealing with new entry, which in a high
technology context introduces more novelty, new eventualities related to R&D and
specific constraints and risks (Blanco, 2007), South African high technology firms face
Page 18
17
additional uncertainty because they operate in an emerging market characterised by
high interest rates and currency volatility, racial polarisation and a volatile regional
political environment.
In addition, environmental turbulence seems to be a major catalyst for entrepreneurial
activity in transition economies since the more dynamic, hostile and complex the
environment, the higher the level of innovation, risk-taking and proactivity among the
most successful entrepreneurial firms (Hitt, Dacin, Levitas, Arregle and Borza. 2000).
Lau and Bruton (2011) argue that entrepreneurs and the start-ups they establish
produce prosperity in locations conventionally hostile to private enterprise through
prospector and guerrilla strategies, extensive networking and altering boundaries.
Further, they posit that effective strategies in an emerging market should strengthen the
firm's capabilities to produce more innovative products and processes. Lastly, they
suggest strategies that strengthen the firm's capabilities in such areas allow the
entrepreneurial firms to enhance their competitiveness and that this is particularly
important in the high technology industry which commonly relies on differentiation. In
sum, appropriate entrepreneurial and strategic orientations are crucial for
entrepreneurial high technology firms in South Africa since they face an institutional
environment, which is hostile and more turbulent than in those developed economies
and high-technology ventures that possess a high EO can explore and exploit
opportunities more easily than those that do not (Li and Li, 2009).
Managers, Venture Capitalists (VCs) and the government might be interested, as they
invest resources, to know how successful entrepreneurs deploy technology and create
new markets in conditions of high uncertainty. This research will seek to test empirically
Page 19
18
the effectiveness of non-predictive strategies pursued. Essentially, for an
entrepreneurial firm, what is the optimal strategic posture in a hostile environment?
1.2 Problem statement
1.2.1 Main problem
Entrepreneurial South African high technology firms face high uncertainty, which may
have an impact on performance. Although much research has been conducted on the
EO-performance relationship, little is known about effectuation as a moderator of the
EO-performance relationship in a hostile environment. Rauch, Wiklund, Lumpkin and
Frese (2009) and Miller (2011) suggest that the EO-performance relationship might be
improved by examining potential moderators such as strategy pursued and
environmental hostility.
1.2.2 Sub-problems
The first sub-problem is to test the relation between effectuation and established
constructs in entrepreneurship literature such as EO and hostility.
Sub-problems
The second sub-problem is to test whether effectuation moderates the relation between
EO and performance in high technology firms based in South Africa.
Sub-problems
The third sub-problem is to test whether environmental hostility moderates the relation
between effectuation and performance.
Page 20
19
1.3 Significance of the study
The study fills a gap in that there is limited research addressing the moderating impact
on EO of effectuation by high technology firms in a hostile environment and the
resultant impact on performance. The existing non-experimental empirical effectuation
literature has not measured or controlled for environmental uncertainty (Perry et al.,
2011). Perry et al. (2011) suggest in the next stage of development of effectuation
research, scholars should explore relationships between effectuation and established
entrepreneurship and management theories such as EO and environmental hostility.
According to Johns (2006), EO researchers ignore context and compile too many
heterogeneous samples, thus making it difficult to derive cumulative results.
Entrepreneurship and EO differ according to context, their sources are varied and
multifaceted and their performance implications alter from context to context (Miller,
2011). Rauch et al. (2009) also suggest that examining potential moderators such as
strategy pursued and environmental hostility might improve the estimate of the true
correlation between EO and performance.
The researcher has sought to answer these calls of Miller, Perry et al. and Rauch et al.,
for future research, building on previous findings to evaluate effectuation as a moderator
of the EO-performance relationship and environmental hostility as a moderator of the
effectuation-performance relationship in a specific context: high technology firms based
in South Africa. Further, the researcher has sought to positively link effectuation to
established constructs in entrepreneurship research, namely: EO and environmental
hostility.
Page 21
20
Testing the moderating impact of effectuation on the relation between EO and
performance requires a methodology that allows us to test for correlation and causation
between the variables. Thus, due to the confirmatory nature of our research, a
quantitative approach using factor analysis and regression analysis as the most
appropriate. Exploratory factor analysis facilitates ascertaining construct and
discriminant validity and multiple regression analysis assists us in the testing of casual
relationships between variables (Hair, Anderson, Babin and Black, 2010).
Potentially, this study could guide entrepreneurs, Venture Capitalists (VCs) and
government officials who wish to understand the relation between EO, strategy pursued
and performance.
1.4 Delimitations of the study
This study will only address effectuation as a moderator of EO-performance relation.
Further, environmental hostility will be evaluated as a moderator of effectuation-
performance relation. Other non-predictive strategy formulations such as the value
curve creation (Kim and Maubourge, 1997) and backing in to the future (Hayes, 1985)
are not addressed. Other moderators are similarly not tackled.
The study will not adopt a longitudinal approach. The current strategy and performance
observed will be the subject of study.
The study will address high technology firms operating in South Africa. Other countries
are not considered.
Page 22
21
1.5 Definition of terms
DTI: the department of Trade and Industry
DV: Dependent variable
EH: Environmental Hostility
EDA: Exploratory Data Analysis
EO: Entrepreneurial Orientation
GoM: Goal-oriented management techniques
HDI: Human Development Index
HRIM: Human resources information management
IDC: Industrial Development Corp
IV: Independent variable
MbO: Management by objectives
MNE: Multinational Enterprise
MTMM: Multitrai, multimethod matrices
NSI: National System of Innovation
R&D: Research and Development
Page 23
22
RBV: Resource Based View
SME: Small and medium sized enterprises
SSE: Sum of squared errors
NTTC: National Technology Transfer Centre
TIA: Technology Innovation Agency
VC: Venture Capitalist
1.6 Assumptions
The following assumptions have been made regarding the study:
The sample respondents will be able to share information on the strategy
formation process due to their seniority in the organisation. Lack of knowledge of
strategy will negatively affect the credibility of study. In other words, they will
have the required knowledge and information
The total number of respondents will be sufficient to gain adequate data
Strategy formation information will be conveyed honestly and truthfully by the
respondents. False data will have a severely detrimental effect on the study’s
results.
The respondent sample will reflect the general experiences of the office within
which they work. Non-representative views will skew the results of the study and
reduce its validity.
Page 24
23
Chapter 2 : Literature review
2.1 Introduction
The EO construct developed from strategy-making process literature such as Mintzberg
(1973). Strategy making is a firm-wide endeavour that involves planning, analysis,
decision making, culture, value system and mission (Hart, 1992). Strategy making
facilitates action and the commitment of resources (Mintzberg, Raisinghani and Theoret,
1976). EO represents the firm level procedures that provide the foundation for
entrepreneurial choices and deeds (Lumpkin and Dess, 1996). Therefore, EO may be
described as the entrepreneurial strategy-making processes that key decision makers
use to implement their organization’s objectives and fashion a competitive advantage
(Covin, Green and Slevin, 2006).
Mainstream strategic management literature can be divided into two schools of thought:
the planning school and the learning school (Brews and Hunt, 1999). The planning
school advocates rational strategies that emphasise prediction and the learning school
engenders firms to adopt adaptive strategies (Brews and Hunt, 1999). Wiltbank, Dew,
Read and Sarasvathy (2006) note that the prescription a firm is to follow is contingent
upon how assured the firm is in its ability to forecast fluctuations in its environment.
Wiltbank et al. (2006) argue that both adaptive and planning approaches place an
emphasis on positioning the organization within an exogenously given environment.
The two schools seem to differ only in how they cope with that given uncertainty
(Wiltbank et al., 2006).
Page 25
24
2.1.1 Creation Theory
On the other hand, entrepreneurship literature can be divided into two schools of
thought: discovery theory and creation theory (Alvarez and Barney, 2007). Opportunity
is the central construct of entrepreneurship theory (Venkataraman, 1997).
Entrepreneurs are said to recognize, find and make opportunities (Alvarez and Barney,
2007; Sarasvathy, Dew, Velamuri, and Venkataraman, 2003). Three important
differences of discovery and creation theory are summarised in Table 1.
Table 1: Discovery and creation: alternative theories of entrepreneurial action.
Central assumptions of discovery and creation theories of entrepreneurial action Discovery Theory Creation Theory
Nature of Opportunities Opportunities exist,
independent of entrepreneurs. Applies a realist philosophy.
Opportunities do not exist independent of entrepreneurs. Applies an evolutionary realist philosophy.
Nature of Entrepreneurs Differ in some important ways from non-entrepreneurs, ex ante.
May or may not differ from non-entrepreneurs, ex ante. Differences may emerge, ex post.
Nature of Decision Making Context Risky
Risky Uncertain
Source: Alvarez and Barney (2007, p.13).
Discovery theory stresses the importance of exogenous shocks in opportunity
recognition. Shane (2003) suggests technological transformations, political and
regulatory vagaries and social and demographic changes can disrupt the competitive
balance in a market or industry, hence forming opportunities. Discovery theory suggests
that alert entrepreneurs methodically search the environment to discover opportunities
to supply new products or services.
Page 26
25
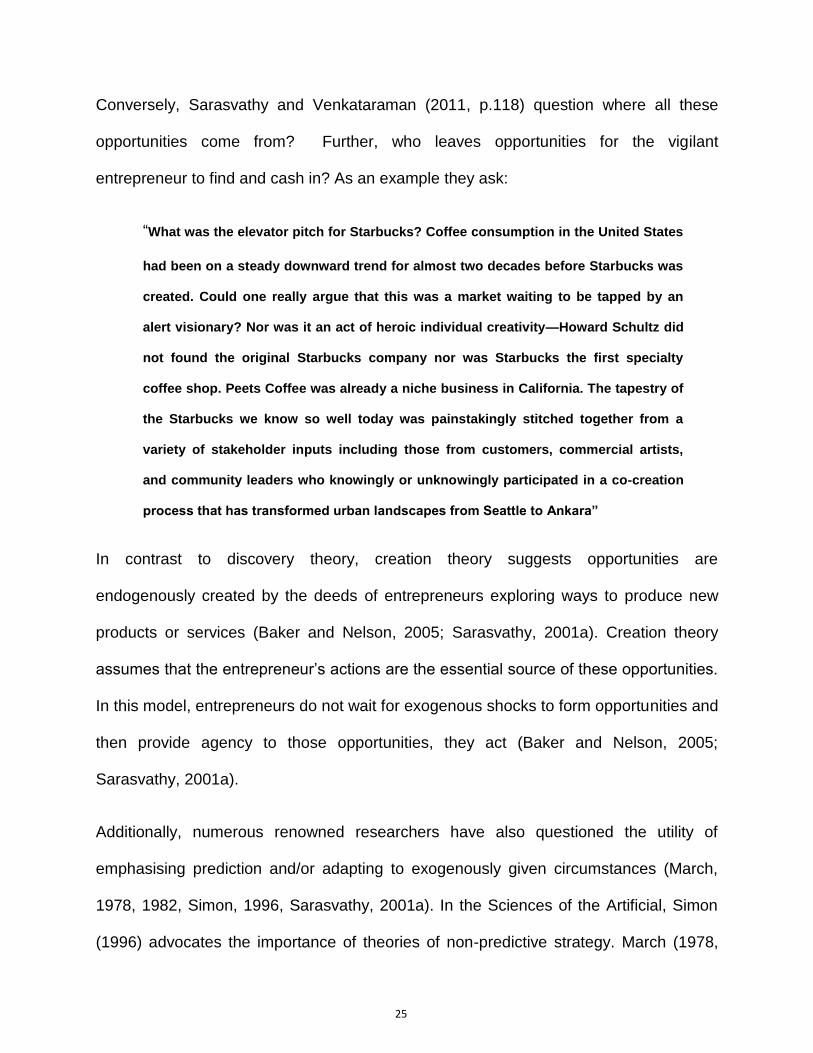
Conversely, Sarasvathy and Venkataraman (2011, p.118) question where all these
opportunities come from? Further, who leaves opportunities for the vigilant
entrepreneur to find and cash in? As an example they ask:
“What was the elevator pitch for Starbucks? Coffee consumption in the United States
had been on a steady downward trend for almost two decades before Starbucks was
created. Could one really argue that this was a market waiting to be tapped by an
alert visionary? Nor was it an act of heroic individual creativity—Howard Schultz did
not found the original Starbucks company nor was Starbucks the first specialty
coffee shop. Peets Coffee was already a niche business in California. The tapestry of
the Starbucks we know so well today was painstakingly stitched together from a
variety of stakeholder inputs including those from customers, commercial artists,
and community leaders who knowingly or unknowingly participated in a co-creation
process that has transformed urban landscapes from Seattle to Ankara”
In contrast to discovery theory, creation theory suggests opportunities are
endogenously created by the deeds of entrepreneurs exploring ways to produce new
products or services (Baker and Nelson, 2005; Sarasvathy, 2001a). Creation theory
assumes that the entrepreneur’s actions are the essential source of these opportunities.
In this model, entrepreneurs do not wait for exogenous shocks to form opportunities and
then provide agency to those opportunities, they act (Baker and Nelson, 2005;
Sarasvathy, 2001a).
Additionally, numerous renowned researchers have also questioned the utility of
emphasising prediction and/or adapting to exogenously given circumstances (March,
1978, 1982, Simon, 1996, Sarasvathy, 2001a). In the Sciences of the Artificial, Simon
(1996) advocates the importance of theories of non-predictive strategy. March (1978,
Page 27
26
1982) contends that a technology of foolishness, both non-analytical and non-prophetic,
could be beneficial. Sarasvathy (2001a, 2001b) further develops Simon and March’s
arguments to show how expert entrepreneurs use an effectual logic that is non-
predictive to fashion new markets and transform environments. She suggests that
firstly, entrepreneurial opportunities are co-constructed through entrepreneurial
endeavour; secondly, demographic, regulatory and institutional variations themselves
can result from the entrepreneurial process and finally, even when opportunities may
originate in demographic, regulatory and technological alterations, they are said to be
discoverable partly because of the entrepreneurial process that helped discover them.
The most experienced entrepreneurs deliberately implement such a co-creation
process—that is, they operate and act in ways that spawn a competitive advantage
(Sarasvathy, 2001a, 2001b).
Further, the resource-based theory in strategic management also emphasizes the
import of experiential learning and expertise engendered by the process of enacting an
opportunity. As that process progresses differently for assorted entrepreneurs, the
opportunities that result may be heterogeneous in “costly-to-copy and costly-to-reverse”
ways (Barney, 1991, p.106).
In the following paragraphs we will review the literature on some of the key themes that
have been introduced in this introductory section: effectuation, EO, environmental
hostility and performance. The section will conclude with a summary of key learning.
Page 28
27
2.2 Effectuation
Causation involves forecasting the reactions of opposing companies, the course of
market progression with its attendant opportunities and threats and factors affecting the
costs of resources (Wiltbank, Dew, Read and Sarasvathy, 2006). Predictions come with
qualifications about their precision, seek to circumvent exigencies and to manipulate
current realities to reach preconceived goals (Wiltbank et al., 2006).
In contrast, effectuation originates through three kinds of resources: Identity; Expertise
and Contacts (Sarasvathy, 2001a). Sarasvathy (2001a), Dew (2003) and Sarasvathy
and Dew (2005) developed a theory of effectuation generated from two empirical
studies; one involving a think-aloud protocol analysis of 27 expert entrepreneurs and
another entailing the historical evaluation of unique markets fashioned by the Radio
Frequency Identity industry. They found that actors begin with who they are, what they
know and whom they know to envisage firms they can found. Further, stakeholder
allegiances are secured. Actors assume that future exogenous factors are generally
non-existent and endeavour to piece them together through collaboration and goal
creation with others to imagine plausible opportunities that can be developed from
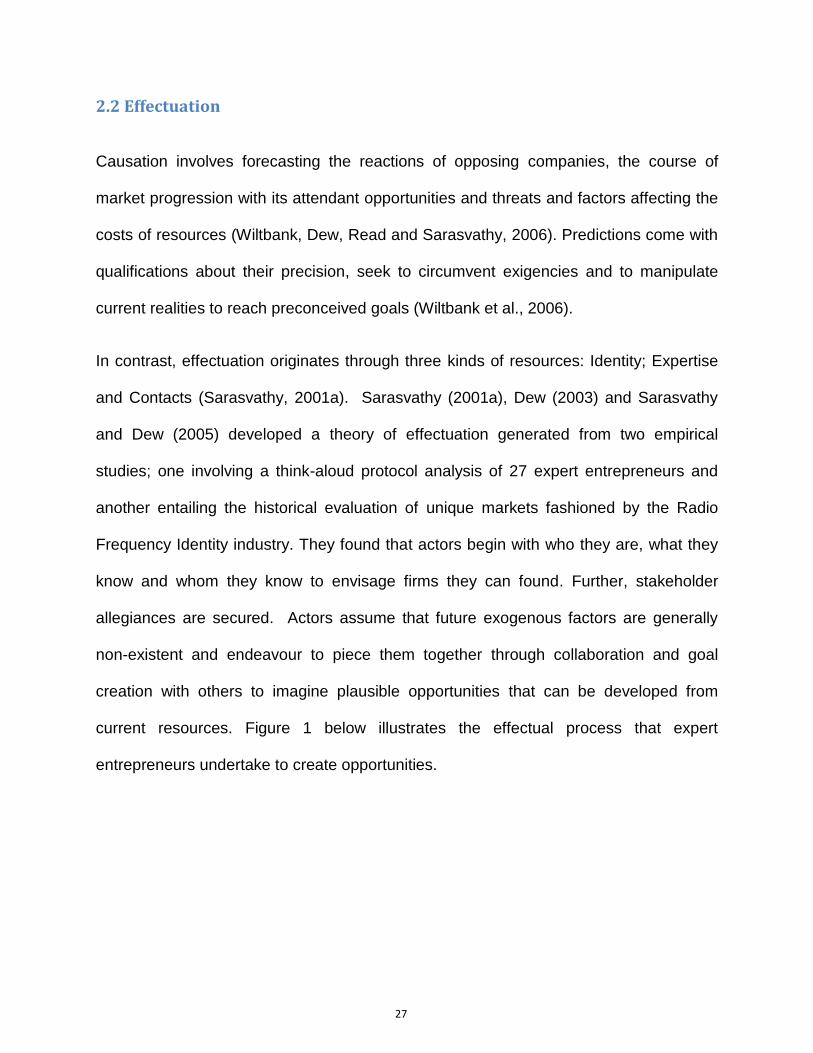
current resources. Figure 1 below illustrates the effectual process that expert
entrepreneurs undertake to create opportunities.
Page 29
28
Figure 1: Effectual Process
Source: Sarasvathy, S.D. and Dew, N. (2005, p. 543)
The three main principles that stakeholders use and that provide a basis for effectual
action are (Wiltbank et al., 2006, p.992):
• “Means-driven (rather than goal-oriented) action. Each effectual stakeholder
considers who he is, what he knows and whom he knows. Stakeholders imagine
possible courses of action based on their means and engage others whose strategies
are driven by other types of identity, knowledge and networks.
Page 30
29
• Affordable loss (rather than expected return) as evaluation criterion. Each effectual
stakeholder strives to invest only what he or she can afford to lose.
• Leveraging (rather than avoiding) contingencies. While predictive efforts seek to avoid
or hedge against contingencies, effectuation seeks to capitalize on these occurrences”.
Whereas predictive strategies are ways to influence current realities to reach
preconceived ends, effectual strategies spawn unique goals and new worlds from
current realities. An effectual entrepreneur maintains flexibility, utilizes experimentation
and seeks to exert control over the future by making alliances with, and getting pre-
commitments from, potential suppliers, competitors and customers (Chandler,
DeTienne, McKelvie, and Mumford, 2011). Table 2 below contrasts causation and
effectuation.
Page 31
30
Table 1: Contrasting causation with effectuation
Issue Causal position Effectual position
View of the future Prediction. The future is a continuation
of the past; can be acceptably predicted
Design. The future is contingent on actions by
wilful agents
Constructs pertaining to individual decisions
Givens Goals are given Means (Who I am, what I know, and whom I
know) are given
Decision agenda Resources. What resources ought I to
accumulate to achieve these goals?
Effects. What effects can I create with the means
I have?
Basis for taking
action
Desired worlds. Vision of a desired
world determines goals; goals determine
sub-goals, commitments, and actions
Possible worlds. Means and stakeholder
commitments determine possible sub-goals—
goals emerge through aggregation of sub-goals
Basis for
commitment
Should. Do what you ought to do—
based on analysis and maximization
Can. Do what you are able to do—based on
imagination and satisficing
Stakeholder
acquisition
Instrumental view of stakeholders.
Project objectives determine who comes
on board
Instrumental view of objectives. Who comes on
board determines project objectives
Constructs in terms of responses to the environment
Predisposition
toward risk
Expected return. Calculate upside
potential and pursue (risk adjusted) best
opportunity
Affordable loss. Calculate downside potential
and risk no more than you can afford to lose
Predisposition
toward
contingencies
Avoid. Surprises may be unpleasant. So
invest in techniques to avoid or
neutralize them.
Leverage. Surprises can be positive. So invest in
techniques that are open to them and leverage
them into new opportunities.
Attitude toward
success/failure
Outcomes. Success and failure are
discrete outcomes to be sought after or
avoided, respectively
Process. Successes and failures are inputs into
a process that needs to be managed such that
failures are outlived and successes are
accumulated
Attitude toward
probability estimates
Update beliefs. Estimates are used in a
Bayesian fashion—to update ones
beliefs about the future.
Manipulate conditionals. Estimates signal, which
conditionals may, reified or falsified so the future
can be skewed through action.
Attitude toward
others
Competition. Constrain task
relationships with customers and
suppliers to what is necessary
Partnership. Build YOUR market together with
customers, suppliers and even prospective
competitors
Underlying logic To the extent we can predict the future,
we can control it
To the extent we can control the future, we do
not need to predict it
Source: Sarasvathy and Dew (2005, p.390)
Page 32
31
2.2.1 Effectuation- Conceptual Literature
Several conceptual articles have addressed theoretical issues underlying effectuation
and developed propositions. They have addressed market creation (Sarasvathy, Dew,
Velamuri, and Venkataraman, 2003), how firms are created (Sarasvath, 2001), how
entrepreneurial firms transform environments in contrast to operating within existing
environments (Dew, Read, Sarasvathy and Wiltbank, R., 2008) and to address
Christensen’s (2000) “Innovators’ dilemma” (Dew, Sarasvathy, Read and Wiltbank,
2008). Over the following paragraphs, we will review in detail these conceptual studies
and expand on their findings.
Firstly, Sarasvathy, Dew, Velamuri, and Venkataraman, (2003, p.3) contest the notion,
advocated by Arrow, inspiring contemporary theories of technological change that
assume "when a market could be created, it would be" and yet the history of
technological invention is full of unanticipated economic consequences. Literature on
entrepreneurial opportunities is based upon three approaches: the market as an
allocative process, the market as a discovery process and the market as a creative
process (Sarasvathy et al., 2003). The market as an allocative process assumes that
markets for goods and services are given and the market merely efficiently allocates
resources based on exogenous demand and supply. Approaches based on the view of
the market as a discovery process view opportunities as objective reality that merely
needs to be recognised and alert entrepreneurs fulfil this task. Sarasvathy et al. (2003,
p. 26) suggest that the view of the market as a discovery process is simplistic and as an
illustration of this argument, they point out that “before we can recognize or discover
great art that art has to have been created”. Similarly, this also applies to
Page 33
32
entrepreneurial opportunities (Sarasvathy et al., 2003). The creative view, which
highlights the judgements and deeds of the agents, making both the geneses and
effects dependent upon those decisions and deeds, might be more general than and
antecedent to the discovery view (Sarasvathy et al., 2003).
Further, Sarasvathy (2001a, 2001b) addressed, using effectuation, the question of how
firms are created. She argues that an explanation for the creation of firms requires the
notion of effectuation that rests on “the logic of control, endogenous goal creation and a
(partially) constructed environment” (p. 256). Further, she suggests that effectuation
could explain the lack of empirical findings from the traits literature and posits that “we
need to learn to deal with a rain forest of individuals and firms and markets and
societies, intermeshed and woven together with completely coherent yet vastly diverse
local patterns that add up to a complex, interdependent ecology of human artefacts and
only then can we begin to explain why people of all types seem to build successful
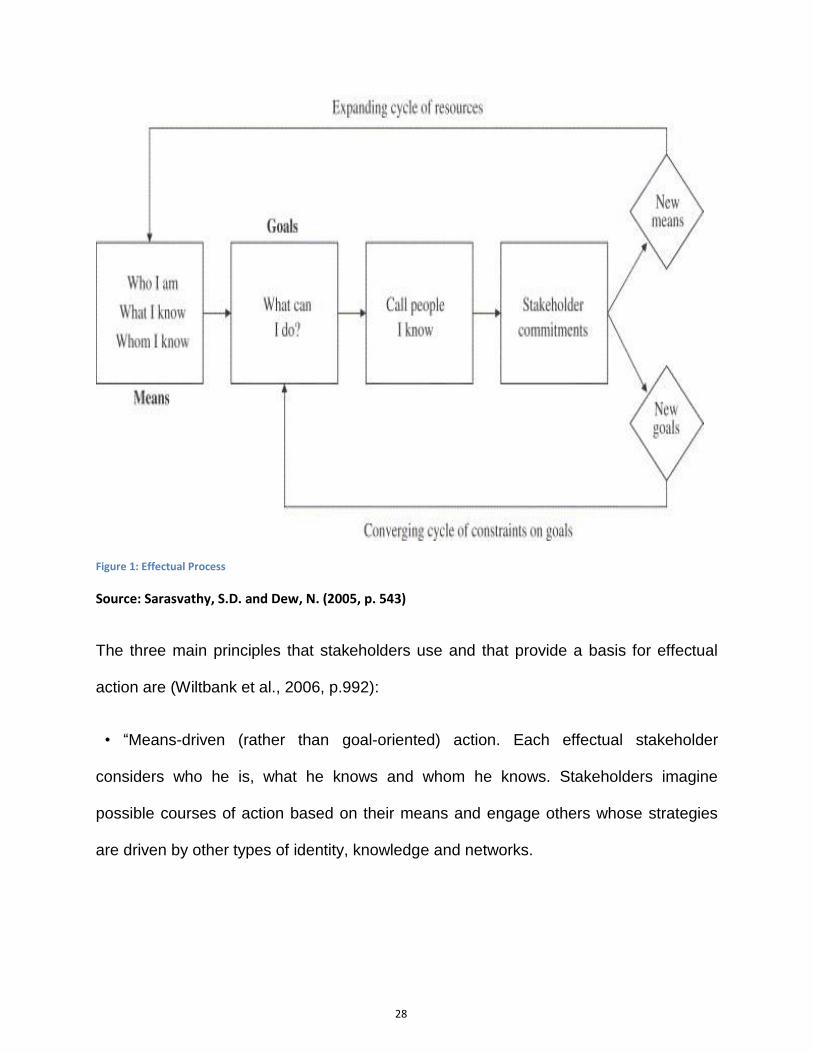
companies and other economic artefacts” (p. 258). Figure 2 illustrates the theory of
effectuation, which emphasizes that individuals with different traits and aspirations can
create lasting effects.
Page 34
33
Figure 2: The theory of effectuation
Source: Sarasvathy (2001a, p. 253)
Additionally, effectuation also provides a possible explanation of the behaviour of
entrepreneurial firms in transforming environments in contrast to operating within
existing environments (Dew, Read, Sarasvathy and Wiltbank, R., 2008). Dew et al.
(2008) postulate that the key difference between entrepreneurial firms and existing firms
is that firms and markets are not assumed as exogenous in entrepreneurship. They
theorise that “either the firms are new, or the markets are new or both” (p. 41). Decision
makers are conceived as dividing the environment into parts they can control and parts
that are uncontrollable. Entrepreneurs focus on what they can control deploying the
means they have to transform the environment.
Page 35
34
These alteration processes are characterised as exaptation (Dew et al, 2008).
Exaptation describes the process of the creation of unique resource-stakeholder
relationships (Dew et al., 2008). Effectual entrepreneurs, “by accumulating stakeholder
commitments under goal ambiguity, achieving control through non-predictive strategies
and using exaptive orientation, potentially create a broader and different range of
variation” (Dew et al., 2008, p.38).
Likewise, Dew, Sarasvathy, Read and Wiltbank (2008) use effectuation to address
Christensen’s (2000) “Innovators’ dilemma”. The innovators dilemma tackles situations
where entrepreneurial firms using inferior technologies disrupt established firms
deploying superior technologies. Dew et al. (2008) argue that the “innovator's dilemma”
implies that by listening to current customers existing firms often lose their markets to
newcomers as a result. Further, Dew et al. (2008) posit that innovation managers
should not seek to predict technology paths more accurately or strive to build immortal
firms in mortal markets. Rather, they should focus on building new markets since in an
effectual universe needs, wants and desires do not equal demand; and demand and
supply does not equate to market. The relationships between supply and demand are
“circular, interactive, intermediated and contingent rather than linear, unilateral,
independent and inevitable” Dew et al. (2008, p. 321). They argue that not only are
markets created through human action; they are also often destroyed through human
agency. They contend that the innovator’s dilemma is not the story of better predicting
technological trajectories with a view to substituting one technology for another in
existing markets. Rather it is a story about technology commercialization – i.e., about
Page 36
35
investing in and building new markets. To answer the question of how does one create
immortal firms in mortal markets? They suggest “you don’t; you build markets” (p. 324).
Prediction is a central issue in strategic management owing to the presumption that
what can be predicted can be controlled, whereas expert entrepreneurs pursue
successful outcomes through control-oriented approaches that may be non-predictive
(Wiltbank, Dew, Read, and Sarasvathy, 2006). Wiltbank et al. (2006) contend that
emphasizing control and managing the failures it might entail, keeping them small and
quick, may positively influence the costs and risks of firm strategies as well as the firm’s
incessant efforts to innovate. They suggest that creativity and effectuation are important
elements of strategizing that make it cheaper by eliminating costs of trying to predict the
future as well reducing the costs of failure.
Finally, Dew and Sarasvathy (2002, p.3) have sought to clarify the nine things that
effectuation is not. The nine things effectuation does not include are:
“Effectuation is not merely a set of heuristic deviations from rational choice – it is
a non-overlapping alternative paradigm to rational choice.
Effectuation is not a wholesale replacement for predictive rationality – it exists in
parallel to it.
Effectuation is not irrational or non-rational – it helps, along with other notions, to
pluralize the notion of rationality, not to negate it.
Page 37
36
Effectuation is not a random process – it is textured and systematic with
eminently learnable and teachable principles, and practical prescriptions of its
own.
Effectuation is not a theory of "anything goes" – it is a theory of constrained
creativity.
Effectuation is not a resource-based view of individual decision-making – it does
not assume valuable resources, it enquires into what makes things valuable and
how one can acquire and/or create value in resources.
Effectuation is not just for small, start-up firms – it can be applied to large firms
and economies as well.
Effectuation is not restricted to the domain of entrepreneurship -- just like the
philosophy of rational choice, it can under-gird all the sciences of human action
(Dew and Sarasvathy, 2002).
Effectuation is not an independent theory – it builds on and integrates the work
of several well-received theories in economics and management.”
2.2.3 Experimental Effectuation Literature
Most of the early empirical effectuation articles have been experimental studies.
Mukhopadhyay, Vicinanza and Prietula (1992) used protocol analysis on a panel of
experts in software project cost estimation. Sarasvathy, Simon and Lave (1998) used
cluster analysis and protocol analysis to contrast entrepreneurs with bankers in their
management of risks. Dew, Read, Sarasvathy and Wiltbank (2009) employed protocol
Page 38
37
analysis to ascertain whether expert entrepreneurs framed business decision making
problems differently than novices. Read, Dew, Sarasvathy, Song and Wiltbank, (2009)
applied protocol analysis to evaluate how 27 expert entrepreneurs approach marketing
under uncertainty compared to 37 managers with little entrepreneurial expertise and
finally, Andersson (2011) utilised an exploratory case study to explore how effectual
born globals internationalised. Over the following paragraphs the researcher will review
in detail these experimental studies and expand on their findings.
Dew, Read, Sarasvathy and Wiltbank (2009) used protocol analysis to ascertain
whether expert entrepreneurs framed business decision making problems differently
than novices. Twenty seven expert entrepreneurs and thirty seven MBA students were
asked to think aloud continuously as they unscrambled common decision-making
problems in creating a new venture. Transcripts were analysed using methods from
cognitive science. They found that expert entrepreneurs identified more potential
markets, focused more on building the venture as a whole, paid less attention to
predictive information, worried more about making do with resources on hand to invest
only what they could afford to lose and emphasize stitching together networks of
partnerships. However, MBA students used a “predictive frame” and tended to use
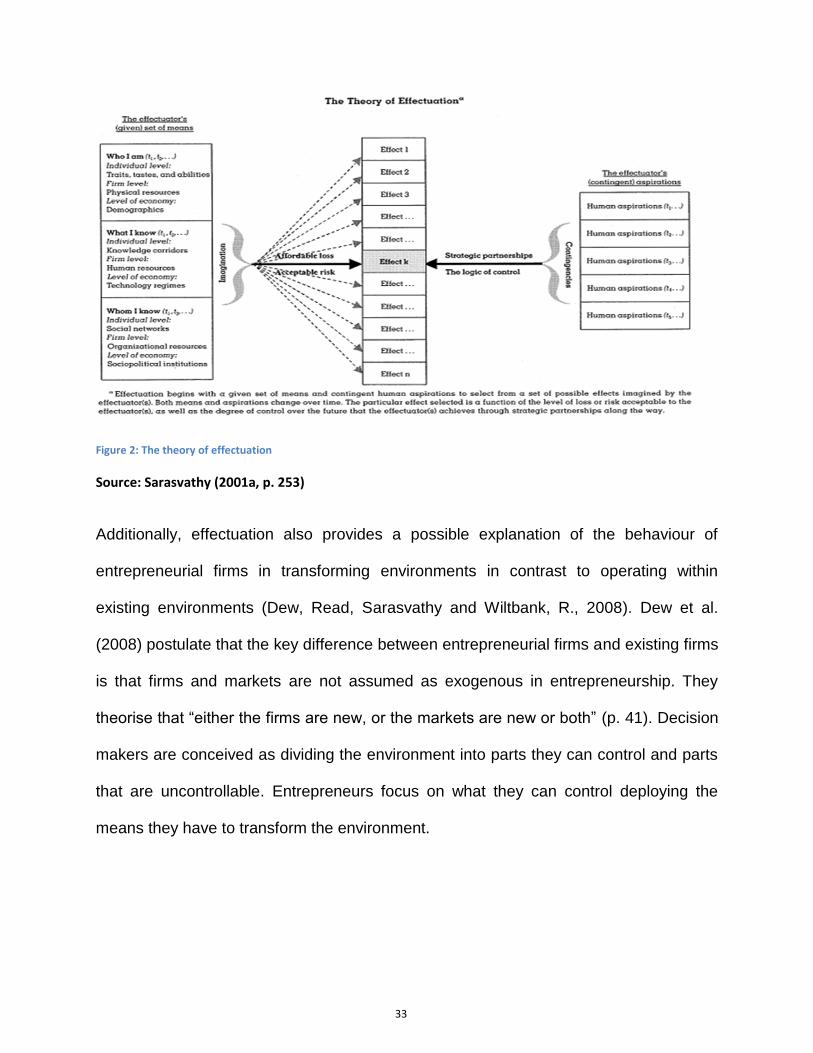
causal analytical tools. As Figure 3 illustrates novice entrepreneurs and large firms are
theorised to use causal strategy, whereas expert entrepreneurs and start-ups tend to
use effectual logic. The relationship between strategy pursued and experience is
moderated by resources.
Page 39
38
Figure 3: Type of reasoning approach with respect to experience and firm lifecycle
Source: Read and Sarasvathy (2005, p. 36)
Marketing under uncertainty has also been assessed using an effectual frame. Read,
Dew, Sarasvathy, Song and Wiltbank (2009) used protocol analysis to evaluate how 27
expert entrepreneurs approach such a problem compared to 37 managers with little
entrepreneurial expertise. They found that whereas managers sought to underprice,
expert entrepreneurs “have learned that more-for-less is not a good pricing strategy for
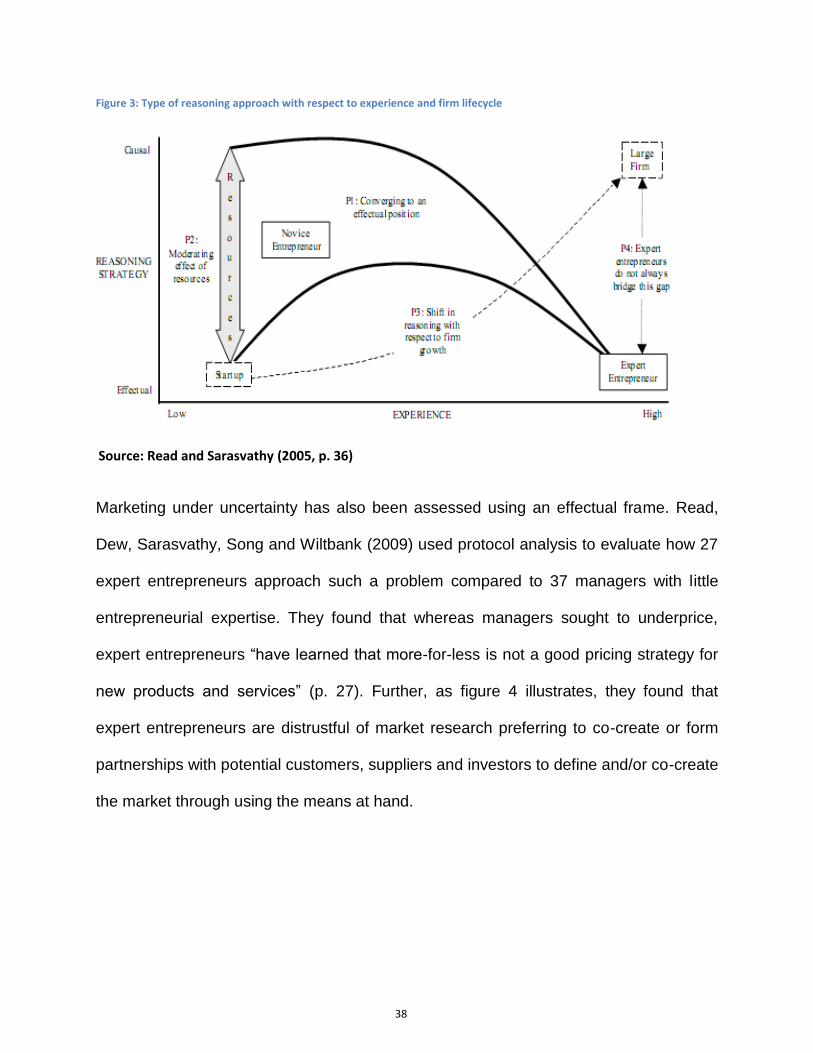
new products and services” (p. 27). Further, as figure 4 illustrates, they found that
expert entrepreneurs are distrustful of market research preferring to co-create or form
partnerships with potential customers, suppliers and investors to define and/or co-create
the market through using the means at hand.
Page 40
39
Figure 4: Contrasting the textbook paradigm in marketing with effectuation
Source: Sarasvathy (2001b, p. 22)
Affordable loss is an effectuation sub-construct that entails managers determining what
they are willing to risk by following a particular strategy (Dew, Sarasvathy, Read and
Wiltbank, 2009). They evaluate an investment according to whether the business could
absorb the loss from the total failure of a venture (Dew et al., 2009). Mukhopadhyay,
Vicinanza and Prietula (1992) used protocol analysis on a panel of experts in software
project cost estimation. They found that experts utilising affordable loss produced better
performance compared to mathematical models and computer simulations.
Bankers, like entrepreneurs, have to deal with decision making under uncertainty
Sarasvathy, Simon and Lave (1998) used cluster analysis and protocol analysis to
contrast entrepreneurs with bankers in their management of risks. Subjects were four
Page 41
40
entrepreneurs and four bankers each with over five years’ experience. The
entrepreneurs were founders of their companies. Their companies’ annual turnover
ranged from $5M to $30M. Sarasvathy et al. (1998) found that firstly, entrepreneurs
concentrated on controlling the outcomes at any given level of risk, tolerating risk as a
given; secondly, they framed their problem spaces based on their personal values and
lastly, entrepreneurs accepted greater personal responsibility for success/failure. In
contrast, bankers sought to control risk in a systematic way, avoided situations where
they were exposed to elevated levels of personal responsibility and focused on targeted
outcomes.
Effectuation theory has also been used to study born globals’ internationalisation
process and the entrepreneur's decision making regarding internationalisation.
Andersson (2011) used an exploratory case study to explore how effectual born globals
internationalised. He found that effectuating born globals entered multiple markets in a
short time by co-operating with local network partners. Further, rapid internationalisation
was positively associated with prior knowledge and networks. They argue that since
effectuation emphasises strategic alliances and partnerships, it is a useful tool to
understand the development of born global firms.
In sum, the effectuation heuristic has been codified from experimental empirical studies.
Scholars have studied what entrepreneurs do to cope with uncertainty in different
settings- born globals, marketing under uncertainty, finance and software project cost
estimation- rather than seek to impose theoretical frame works that are not grounded in
reality. Over the following paragraphs, we will review quantitative empirical literature to
delineate findings and develop hypothesis.
Page 42
41
2.2.4 Empirical Literature and hypotheses development
Effectuation literature is still in its nascent phase of development. Few quantitative,
empirical studies have been conducted. Chandler et al. (2011) examined whether the
sub-constructs' underlying effectuation are distinct. They found that effectuation formed
a multidimensional construct composed of four sub-constructs: affordable loss,
experimentation, flexibility and pre-commitments and proposed that effectuation might
be better viewed as a formative construct. Read, Song and Smit (2009) conducted an
empirical meta-analysis that tested whether there is a positive relationship between
effectuation and performance. The relationship between the sub-constructs
experimentation, flexibility and pre-commitments and new venture performance was
supported. However, the relationship between venture performance and affordable loss
was not significant.
Effectuation theory has also been used to study innovation and R&D research
performance (Brettel, Mauer, Engelen and Küpper, 2012). Innovativeness is a critical
sub-construct of entrepreneurial orientation (EO) and EO has been shown in literature
to be positively related to performance (Raunch et al., 2009). Brettel et al. (2011) argue
that large companies have difficulties in executing highly innovative R&D. They suggest
an effectual approach could be beneficial. Brettel et al. (2012) used expert interviews
and a pilot study (123 R&D projects) to develop a multi-factor measurement model of
effectuation and causation. These measures were validated in a follow-up study with a
larger sample of 400 projects and were used to ascertain whether the effectuation sub-
constructs- affordable loss, means driven, partnerships and leveraging contingencies-
were positively related to performance. They found that the sub-constructs affordable
Page 43
42
loss, preference for partnerships and leveraging contingencies had a positive influence
on R&D performance when innovativeness is high, whereas means-driven does not
exert any significant influence on R&D output and efficiency when innovativeness is
high.
Wiltbank, Dew, Read and Sarasvathy (2009), in a cross sectional study of 121 angel
investors who had made 1038 new venture investments established that angel investors
who employed an effectual strategy experienced a reduction in investment failures
without a reduction in the number of their successes.
Firstly, since a reduction in investment losses for a firm without a corresponding
reduction in expected return would imply higher profitability, secondly, since innovation
and R&D research performance is crucial to the performance of high technology firms
and finally, concomitant with Read et al.’s (2009) findings; we propose that effectuation
has a positive relation with perceived performance.
Entrepreneurial strategy formation may be more nascent rather than planned in
disposition because it enables entrepreneurial firms to manage the risk fundamental to
their ventures (Mintzberg and Waters, 1985). Planned strategies in entrepreneurial firms
will frequently suggest inferences should be accepted on conviction and thus are not
likely to be confirmed based on the assumptions of strategic planning (Block and
MacMillan, 1985; McGrath and MacMillan, 1995). If the crucial assumptions, on which
entrepreneurial firms’ plans are based, are erroneous, these strategies may not serve
the firms’ objectives.
Page 44
43
Covin et al. (2006) examined the effects of three strategic process variables—strategic
decision making participativeness, strategy formation mode, and strategic learning from
failure—on the entrepreneurial orientation (EO)–firm sales growth rate relationship.
Results based on a sample of 110 manufacturing firms indicated a positive effect of EO
on sales growth rate. Further, they found that the relationship between EO and sales
growth rate was more positive among firms that employ autocratic decision making and
that exhibit an emergent strategy formation process. EO appears to facilitate firm growth
when entrepreneurial firms employ strategy development processes that complement
the prerequisites of an entrepreneurial posture.
Wiklund and Shepherd (2011) characterize the underlying approach of the majority of
previous EO research as “EO-as-advantage”—explained as the view that it pays to
pursue an EO—and offer “EO-as-experimentation”—reflecting the notion that EO is
concomitant with greater outcome variance, which increases the likelihood of both
failure and success. In literature, exploration is associated with experimenting, freely
associating and entering into new product markets, while exploitation is associated with
“refining, producing, reusing existing routines and improving existing product markets”
(Wiklund and Shepherd, 2011, p. 930). Wiklund and Shepherd (2011) provide empirical
evidence that supports an EO-as-experimentation perspective. The researcher will
adopt this EO-as-experimentation perspective and since effectuation is a
multidimensional construct with four associated sub-dimensions: experimentation,
affordable loss, pre-commitments and flexibility (Chandler et al., 2011), we propose that
EO positively predicts the formative construct effectuation and its sub-constructs
experimentation and flexibility.
Page 45
44
2.3 Entrepreneurial Orientation
Entrepreneurship is concerned with understanding how, in the absence of markets for
future goods and services, these goods and services manage to come into existence
(Venkataraman, 1997). It is mainly concerned with new entry either by a start-up or
through an existing firm (Lumpkin and Dess, 1996). New entry is the fundamental notion
in entrepreneurship (Lumpkin and Dess, 1996).
EO can be regarded as “the processes, practices, and decision-making activities that
lead to new entry” (Lumpkin and Dess, 1996, p. 136). Pearce, Fritz, and Davis (2010, p.
219) define EO as “a set of distinct but related behaviors that have the qualities of
innovativeness, proactiveness, competitive aggressiveness, risk taking, and autonomy.”
We know entrepreneurs through their actions, not their traits (Gartner, 1988). The
underlying assumption of EO is that action is crucial to the exploration, creation and
exploitation of opportunities. Thus, EO can be considered as a firm-level trait that can
be deciphered through the display of sustained innovation, risk taking and action (Covin
and Lumpkin, 2011). Table 3 lists the definitions of EO as they have evolved from the
early 70s till today.
Page 46
45
Table 2: Definitions of Entrepreneurial Orientation
Mintzberg (1973) “In the entrepreneurial mode, strategy-making is dominated by the active search for new
opportunities” as well as “dramatic leaps forward in the face of uncertainty” (p. 45).
Khandwalla
(1976/1977)
“The entrepreneurial [management] style is characterized by bold, risky, aggressive decision-
making” (p. 25, [ ] added).
Miller and Friesen
(1982)
“The entrepreneurial model applies to firms that innovate boldly and regularly while taking
considerable risks in their product-market strategies” (p. 5).
Miller (1983) “An entrepreneurial firm is one that engages in product-market innovation, undertakes
somewhat risky ventures, and is first to come up with ‘proactive’ innovations, beating
competitors to the punch” (p. 771).
Morris and Paul
(1987)
“An entrepreneurial firm is one with decision-making norms that emphasize proactive,
innovative strategies that contain an element of risk” (p. 249).
Covin and Slevin
(1998)
“Entrepreneurial firms are those in which the top managers have entrepreneurial management
styles, as evidenced by the firms’ strategic decisions and operating management philosophies.
Merz and Sauber
(1995) “.
Non-entrepreneurial or conservative firms are those in which the top management style is
decidedly risk-averse, non-innovative, and passive or reactive” (p. 218). entrepreneurial
orientation is defined as the firm’s degree of proactiveness (aggressiveness) in its chosen
product-market unit (PMU) and its willingness to innovate and create new offerings” (p. 554)
Lumpkin and
Dess (1996)
“EO refers to the processes, practices, and decision-making activities that lead to new entry”
as willingness to innovate and take-risks, and a tendency to be aggressive toward competitors
and characterized by one, or more of the following dimensions: “a propensity to act
autonomously, a
proactive relative to marketplace opportunities” (pp. 136–137).
Zahra and
Neubaum (1998)
EO is “the sum total of a firm’s radical innovation, proactive strategic action, and risk taking
activities that are manifested in support of projects with uncertain outcomes” (p. 124)
Voss, Voss, and
Moorman (2005),
“. . . we define EO as a firm-level disposition to engage in behaviors [reflecting risk-taking
innovativeness, proactiveness, autonomy, and competitive aggressiveness] that lead to
change in the organization or marketplace” (p. 1134, [ ] added).
Avlonitis and
Salavou (2007)
“EO constitutes an organizational phenomenon that reflects a managerial capability by which
firms embark on proactive and aggressive initiatives to alter the competitive scene to their
advantage” (p. 567).
Cools and Van
den Broeck
(2007/2008)
“Entrepreneurial orientation (EO) refers to the top management’s strategy in relation to
innovativeness, proactiveness and risk taking” (p. 27).
Pearce, Fritz, and
Davis (2010)
“An EO is conceptualized as a set of distinct but related behaviours that have the qualities of
innovativeness, proactiveness, competitive aggressiveness, risk taking, and autonomy” (p.
219).
Source: Covin and Wales (2011, p.3)
Page 47
46
Further, EO is a firm-level phenomenon (Covin and Lumpkin, 2011). If researches view
EO as a firm level trait, then logically the appropriate unit of analysis is the firm. Or more
precisely as Covin and Lumpkin (2011) suggest the “firm” can range from a non-
diversified small to medium-sized enterprise (SME) to a single business unit of a multi-
business firm.
Furthermore, there has been debate in the scholarly community about whether EO is a
multidimensional (Lumpkin and Dess, 1996) or a unidimensional (Miller 1983, Covin and
Slevin, 1989) construct. In the technology sector, EO has been viewed as a
unidimensional construct since amongst technology firms risk taking, innovativeness
and proactiveness are concurrently displayed (Raunch et al. 2009). Thus one or two of
these dimensions is inadequate for an entrepreneurial technology firm.
In sum, for the purposes of this study the researcher adopts the view that EO is
sustained behaviour not disposition, unidimensional or multidimensional and the
appropriate unit of analysis is the firm. This is consistent with the arguments of Miller
(1983) and Covin and Slevin (1989). In contrast, effectuation is viewed as the strategy
pursued. The unit of analysis is the firm. We ask: do firms that effectuate, as they
innovate, take risks and act, exhibit higher performance?
2.3.1 The Dimensions of EO and Effectuation
EO has three dimensions: innovativeness, risk taking and proactiveness (Miller, 1983,
Lumpkin and Dess, 1996, Covin and Slevin, 1997). Innovativeness can be described as
the firm’s ability and willingness to develop new products and/or services or invent new
processes (Drucker, 1979). Risk taking is defined as the willingness to commit
Page 48
47
resources to opportunities and assume business risk (Miller, 1983). Pro-activeness is
the ability to persevere in ensuring that the initiatives are implemented. Pro-activeness
is concerned with adaptability and tolerance of failure (Lumpkin and Dess, 1996). EO
dimensions (innovation, risk taking and pro-activeness) are of equal importance in
explaining business performance (Raunch et al., 2011). Figure 5 depicts the dimensions
of the latent construct EO.
Figure 5: The dimensions of EO
2.3.2 Innovativeness
Lumpkin and Dess, (1996, p. 142) define innovativeness as a firm's propensity “to
engage in and support new ideas, novelty, experimentation and creative processes that
may result in new products, services or technological processes”. They classify
innovation as either product-market innovation and/or technological innovation.
Technological innovation entails product and process development, engineering and
research (Lumpkin and Dess, 1996). On the other hand product-market innovativeness
Page 49
48
involves product design, market research, advertising and promotion (Lumpkin and
Dess, 1996). Innovativeness is an important element of how firms explore or as we
argue create opportunities, thus it is a vital element of EO.
Innovativeness encourages experimentation and trial-and-error in entrepreneurial firms
(Kreiser, 2011), hence facilitating the ability to combine and leverage knowledge
(Anderson, Covin and Slevin, 2009; Li, Huang and Tsai, 2009) and creativity is
positively related to firm-level innovation (Baron and Tang, 2010). Further,
innovativeness can lead to the development of new organizational competences
through the process of trial-and-error and creativity (Covin, Green and Slevin, 2006;
Lumpkin and Dess, 1996). Finally, innovative firms utilize new ideas and products, as
well as new technological processes, to develop new products, processes and/or
markets (Covin, Green and Slevin, 2006; Lumpkin and Dess, 1996).
2.3.3 Risk Taking
Lumpkin and Dess (1996) suggest the meaning of risk is context dependant. They
suggest three types of strategic risk: venturing into the unknown, committing a relatively
large portion of assets and borrowing heavily. Venturing into the unknown suggests a
degree of uncertainty whereas committing a relatively large portion of assets and
borrowing heavily relate to financial risk taking. Lumpkin and Dess (1996, p. 145) and
other scholars suggest that firms with an entrepreneurial orientation assume risks in
order to “obtain high returns by seizing opportunities in the marketplace”.
We posit that the theory of effectuation elucidates how managers and/or expert
entrepreneurs manage the risk taking embedded in EO. In an effectual context
Page 50
49
successes and failures are inputs into a process that needs to be managed such that
failures are outlived and successes are accumulated (Sarasvathy, 2001). Emphasizing
control and managing the failures it might entail, keeping them small and quick,
positively influences the costs and risks of firm strategies (Wiltbank et al., 2006).
Entrepreneurs concentrate on controlling the outcomes at any given level of risk,
tolerating risk as a given (Sarasvathy et al., 1998). In managing risks, expert
entrepreneurs pay less attention to predictive information, worry more about making do
with resources on hand to invest only what they could afford to lose, emphasize
stitching together networks of partnerships and leverage contingencies.
2.3.2 Proactiveness
Proactiveness can be characterised as an initiative to anticipate and pursue new
opportunities (Lumpkin and Dess, 1996). Miller and Friesen (1978) argued that the
proactiveness of a firm's decisions is determined by whether it shapes the environment
by initiating new products, technologies, administrative techniques or whether it just
reacts. Venkatraman (1989, p. 949)) has suggested that proactiveness is exemplified by
“seeking new opportunities which may or may not be related to the present line of
operations, introduction of new products and brands ahead of competition, strategically
eliminating operations which are in the mature or declining stages of life cycle". Further,
Anderson et al. (2009) suggest EO encourages firms to undertake experimentation and
exploration activities leading to new venture creation. Lastly, new combinative and
exploitative knowledge is largely developed through proactive behaviours (Li et al.,
2009).
Page 51
50
Creation theory suggests opportunities are endogenously created, by the deeds of
entrepreneurs exploring ways to produce new products or services (Baker and Nelson,
2005; Sarasvathy, 2001). It suggests that proactive behaviours allow firms not only to
anticipate future market changes and opportunities for new market entry, but also to
create them. Creation theory assumes that the entrepreneur’s proactiveness is the
essential source of these opportunities. In this model, entrepreneurs do not wait for
exogenous shocks to form opportunities and then provide agency to those
opportunities, they act (Baker and Nelson, 2005; Sarasvathy, 2001).
In effectuation theory entrepreneurial opportunities are co-created through the
entrepreneurial process; demographic, regulatory and institutional changes themselves
can result through entrepreneurial endeavour; and even when opportunities may
originate in demographic, regulatory and technological alterations, they are said to be
discoverable partly because of the entrepreneurial process that helped discover them
(Sarasvathy, 2001a, 2001b). The most experienced entrepreneurs explicitly implement
such a co-creation process—that is, they act and behave in ways that generate a
competitive advantage (Sarasvathy, 2001a, 2001b).
The researcher suggests that the proactiveness sub-construct of EO is positively related
to effectuation- that is proactive entrepreneurial firms use effectual strategies to
transform or shape the environment, leading to variation, which endows the firm with a
competitive advantage.
To conclude, EO is a unidimensional construct in the technology sector and thus, we
have sought to conceptually link each EO dimension to effectuation. EO is a strategic
Page 52
51
orientation- it engenders firms to be innovative, risk taking and proactive. The
conceptual literature suggests effectuation could provide answers to the question: how
do we innovate, take risks and be proactive? In the following paragraphs, we will review
literature on the EO-performance relationship and develop hypotheses around the
central question: How do entrepreneurial firms that effectuate perform?
2.4 EO and Performance
EO researchers have distinguished factors that forecast EO (Miller and Friesen, 1982;
Zahra, 1991), EO’s impact on various aspects of firm performance (Zahra and Covin,
1995, Wiklund, 1999, Lee, Lee, and Pennings, 2001, Wiklund and Shepherd, 2003),
and the detection of variables that moderate the EO-firm performance relationship
(Covin and Slevin, 1988; Lumpkin and Dess, 2001; Yusuf, 2002). However, scholars
have suggested that the effect of strategy pursued on the association between a firm’s
EO and its performance is an under-researched topic within the EO research sphere
(Lumpkin and Dess, 1996, Rauch et al., 2009, Miller, 2011).
Research on the EO-performance relationship has also investigated the role of
moderators. Raunch et al. (2009) conducted a meta-analysis of 51 studies that
researched the EO-performance relationship. Firstly, they found that size moderates the
EO–performance relationship. Secondly, they found that high-tech firms showed a
higher correlation between EO and performance than low-tech firms. Finally, they
suggest that based on their meta-analysis, the “true” correlation between EO and firm
performance is .242. They recommend that other studies use it as a benchmark to ask
“the question whether they have been able to increase explained variance, for example,
Page 53
52
by improving the scales of EO or by examining strategy pursued as a moderator that
may affect the EO–performance relationship” (p. 781).
The EO-performance relation has also been investigated in emerging markets, with
rather interesting results. Tang, Tang, Marino, Zhang and Li (2008) examined the role of
entrepreneurial orientation (EO) in firm performance in a Chinese context. They argued
that both the internal organizational structures and institutional environment in China are
noticeably different than those in developed countries. Firstly, they suggest that a
significant lack of “guanxi network, experienced management teams and organizational
formalization may impede high EO from benefiting organizations and secondly, the
concurrence of socialist and market-based capitalist systems, along with the fact that
government controls resources, financing and materials distribution, may all promote a
unique relationship between EO and performance” (p. 220). They used a two-study
approach to test the link between EO and performance. Both studies found an inverted
U-shaped, curve linear relationship. Whereas low-EO and high-EO firms showed poor
performance, middle-level EO firms related positively to performance. They suggest that
this is because low-EO firms do not attempt to compete forcefully and the lack of
institutional support and organizational formalization hinders high-EO firms.
Su, Xie and Li (2011) continued along this line of inquiry. They investigated the
differential impact of EO on performance in new technology ventures and established
firms in China. They found that the EO–performance relation is inverse U-shaped in
new ventures. However, it was positive in established firms. They argue that this is
because new ventures suffer from “the liability of newness” (Freeman, Carroll, and
Hannan 1983) and that established firms have “the resources, legitimacies and social
Page 54
53
ties and role formalization” (p. 559), that new ventures lack. They posit that that the
resources, legitimacies, social ties and role formalization all moderate the EO–
performance linkage (Covin and Slevin 1991).
There is little information on the internal organisational processes that link EO to
performance. However, researchers have begun to examine strategy pursued as a
mediator that may affect the EO–performance relationship. Rodrigues and Raposo
(2011) argue that entrepreneurial orientation interacts with market orientation to improve
performance and human resources information management (HRIM) is a critical
component of market orientation. They tested a structural model of relationships among
entrepreneurial orientation (EO), HRIM and firm performance using a sample of small
and medium sized enterprises (SMEs) from the manufacturing sector of Portugal.
Firstly, they found that EO had a positive direct effect on both performance and HRIM.
Secondly, HRIM also had a positive effect on firm performance and finally, EO indirectly
impacted firm performance through HRIM. The authors argue that generative learning
is inherently entrepreneurial and connected with knowledge acquisition through
exploration, experimentation and the rapid development of new behaviours to leverage
learning.
Similarly, Tang and Tang (2010) investigated whether strategy pursued moderates the
inverted U-shaped relationship between EO and performance in technology firms in
China. The prospector, analyser and defender typology was used to classify firms (Miles
and Snow, 1978). Prospector firms are defined as firms that constantly seek new
opportunities and initiate major product changes in order to lead market changes,
defenders seek to refine and exploit current product lines and analysers combine both
Page 55
54
prospector and defender strategies. Data was collected from 155 SMEs in China. Tang
and Tang (2010) found that prospector and analyser strategies alleviated the curve
significantly. In contrast the defender strategy enhanced the curve linearity.
Figure 6: Performance as a function of EO and prospector strategy
Source: Tang and Tang (2010, p. 16)
Figure 6 reveals that the curvilinear relationship between EO and performance depends
on if the prospector strategy is adopted. Figure 7 depicts the inverted curvilinear
relationship between EO and performance when the analyser strategy is added as a
moderator.
Page 56
55
Figure 7: Performance as a function of EO and analyzer strategy
Source: Tang and Tang (2010, p. 16)
The EO-performance curve is moderated such that performance improvements are
observed when EO increases from moderate to high levels.
Whether casual strategy pursued is a moderator that may affect the EO–performance
relationship was examined by Harms, Reschke, Kraus and Fink (2010). They conducted
a study on the performance implications of goal-oriented management techniques
(GoM) such as management by objectives (MbO) on innovation and growth in the
context of EO. A sample of 165 fast growth technology-based ventures from Germany
was surveyed. The results suggest that EO has a positive impact on innovation and
growth, with innovation being a partial moderator. Further, EO seems to be negatively
related to the degree to which GoM is used, while GoM itself has a negative relationship
with innovation. For technology-oriented SMEs, innovation and growth are important
aspects of firm performance and a strategic orientation that emphasises entrepreneurial
behaviour may be an effective way to obtain these goals (Harms et al., 2010). Since,
Page 57
56
effectuation is the antithesis of casual strategies such as GoM, prospector and analyser
strategies are experimental and lastly, generative learning and social networking are
important elements of the effectual process, we propose that effectuation moderates the
EO-performance relationship, i.e. firms that use effectuation as display EO behaviour
are likely to perform better.
EO exhibits a comparable relation between perceived financial performance, perceived
nonfinancial indicators of performance, and archival performance (Rauch et al., 2009).
Rauch et al. (2009) suggest that the EO-performance relationship remains vigorous to
modifications in performance dimensions and “common method variance, memory
decay or social desirability concomitant with self-reporting of performance does not
generally constitute a peril to the validity of the EO-performance relationship” (p. 780).
In closing, the use of perceived financial performance would not compromise the
legitimacy of this study.
2.5 Performance
2.5.1 Theoretical Background on Determinants of Firm Performance
In this section we review the literature on firm performance. We initially explicate the
Resource Based View and then address empirical studies on firm performance, the
measurement of firm performance and control and moderator variables. The resource
based view and the measurement of firm performance are reviewed in the following
section.
Page 58
57
2.5.2 Resource-based View of the Firm
The firm is a collection of productive resources (physical and human), the allocation of
which among different functions and over time is decided by administrative action
(Penrose, 1959). Building on Penrose’s (1959) research Wernerfelt (1984)
characterized a firm’s resources as tangible and intangible assets that belong to the
firm. Barney (1991) emphasizes the importance of information, learning and knowledge
generated from the process of enacting an opportunity. Firms that own resources that
are valuable and rare attain a competitive advantage and enjoy improved performance
in the short term and to sustain these advantages over time the firm’s resources must
also be inimitable and non-substitutable (Barney, 1991).
Effectuation helps explicate how, as Miller and Friesen (1978) and Vankataraman
(1997) suggested, firms proactively shape the environment and- “by accumulating
stakeholder commitments under goal ambiguity, achieving control through non-
predictive strategies and using exaptive orientation, potentially create a broader and
different range of variation” (Dew et al., 2008, p. 38). As that process evolves differently
for different entrepreneurs, the opportunities that result may be heterogeneous in
“costly-to-copy, and costly-to-reverse” ways (Barney, 1991, p. 106), thus creating a
competitive advantage. Stakeholder commitments and alliances that evolve from the
effectual process may be the very inimitable and non-substitutable resources that help
sustain these advantages over time. In Figure 6, we adapt Barney’s conceptual model
to try to elucidate how effectuation and EO help firms develop and sustain a competitive
advantage.
Page 59
58
Figure 8: Creating competitive advantage
Source: Own (Adapted from Barney’s (1991) conceptual model)
2.5.3 Definition of Performance
Organizational performance is an important dependant variable for strategy and
entrepreneurship scholars. Entrepreneurship and strategy are assessed based on their
contribution to organizational performance. Thus, measuring organizational
performance is essential in enabling researchers, entrepreneurs and managers
appraise the strategies they use against the objectives they seek to attain.
Venkataraman and Ramanujam (1986) distinguished between three different types of
performance: financial performance, operational performance and organizational
performance. Richard, Devinney, Yip and Johnson (2009) suggest that organisational
performance covers three specific areas of firm outcomes: financial performance,
product market performance and shareholder return.
Page 60
59
Financial performance involves the use of outcome based financial indicators that
reflect the attainment of economic goals. Indicators such as sales growth, profitability,
earnings per share, etc. are used to evaluate financial performance. Accounting and
financial market measures are frequently used to assess organisational performance.
Danielson and Press (2003) found that accounting and economic returns are associated
with a correlation above 0.75. However, Venkataraman and Ramanujam (1986) argue
that this approach assumes that firms prioritize financial goals. Richard et al. (2009)
also caution researchers against these measures arguing that accounting measures
can be rendered unreliable by differing accounting policies, human error and deception.
Financial market measures, predominantly shareholder return, have also been
employed in strategy and entrepreneurship literature to evaluate organizational
performance. They represent the discounted present value of future cash flows and also
reflect intangible assets more effectively than accounting data (Richard et al., 2009).
However, Richard et al. (2009) warn that instead of reflecting future cash flows, stock
market returns are often attributable to financial market volatility, momentum and
herding behaviour. Further, market returns are less useful for assessing the
performance for a product, unlisted firms or a strategic business unit.
Operational performance includes broader business performance measures. Measures
such as market share, customer satisfaction, product quality and manufacturing
efficiency are included in the definition of business performance. Venkataraman and
Ramanujam (1986) argue that the inclusion of operational performance measures is
useful since it accounts for operational success factors that might lead to financial
performance.
Page 61
60
Organizational effectiveness is a broader construct. It entails organizational
performance in addition to numerous internal performance measures usually connected
to efficient operations and other measures that include broader stakeholders such as
corporate social responsibility (Richard, Devinney, Yip and Johnson, 2009). Figure 9
illustrates Venkataraman and Ramanujam (1986) conceptual model of the three
domains of business performance.
Figure 9: The Domains of Business Performance
Source: Venkatraman and Ramanujam (1986, p. 803 )
2.5.4 Control and Moderator Variables
According to Raunch et al. (2009), there is a lack of research on control and moderator
variables in strategy and entrepreneurship literature. This may be ascribed to the fact
that control variables used in some studies may be used as explanatory variables in
others. Frequently used control variables are firm size, industry type and firm age
Page 62
61
(Raunch et al. 2009). Among moderator variables environmental turbulence, strategy
pursued and incentive and control systems used internally within the firm have been
employed as moderators of performance (Raunch et al, 2009).
2.5.5 Time Frame of Performance Measurement
The time frame of a firm’s performance refers to the time horizon over which
performance is measured. Katsikeas, Leonidou and Morgan (2000) suggest that there
are three time frames: historical, current and future. Strategy and entrepreneurship
literature have mainly used 3 and 5 year time frames.
Richard et al. (2009) caution against using short- or medium-term measures since they
can be heavily biased by random fluctuations, performance itself does not persist
indefinitely and they fail to account for the variability and stickiness in performance.
Further, Powell (2003) suggests differences in performance could also be attributable to
random Markov processes leading to differing performance outcomes in the absence of
firm-specific heterogeneity. In addition, Richard et al. (2009) suggest that reputation
effects, auto-correlation, bias arising from subjective measures and the temporal
properties of accounting rates of return may imply performance persistence whereas
performance persistence is partially attributable to the time series characteristics that
lead to stickiness in return measures. This warns researchers against interpretation of
performance differences without taking into account the temporal dimension (Richard et
al., 2009).
Page 63
62
2.5.6 Subjective Measures of Organizational Performance
Subjective measures have received growing attention due to the assessment of
performance based on the triple bottom line of economic, social and environmental
performance (Richard et al., 2009). Researchers use subjective measures to ask
knowledgeable key informants about their perceptions of organizational performance.
Subjective measures are thus suitable for modification to take into account the
dimensionality of the context of interest (Richard at al., 2009). However, there is
increased scope for bias due to increased error caused by imperfect human cognition
(Richard et al., 2009).
Subjective self-report measures ask the informant to compare the performance of the
company to that of a rival or to management expectations. They allow researchers to
address latent performance constructs directly and are naturally relative (Richard et al.
2009). This relativity provides flexibility allowing researchers to target the dimensions of
performance directly. However, relativity renders subjective measures erratic due to the
inconsistent objectives of the informants. Respondents tend to view themselves
positively, construe external criteria in their favour and rely on causal uncertainty to
claim responsibility for positive performance (Richard et al., 2009).
The validity of subjective measures can be improved by collecting the self-report closer
to the event of interest and by selecting knowledgeable informants (Richard et al.,
2009). Guthrie (2001) found a correlation 0.81 between subjective and objective
measures achieved using more specific subjective constructs. The measures were also
found to display strong construct validity (Wall et al., 2004). Richard et al. (2009) argue
Page 64
63
that subjective measures can help scholars fully assess the multidimensionality of
performance. Further, they assist researchers assess performance when no objective
financial market or accounting measures exist such as amongst unlisted firms and/or
strategic business units. However, there is limited convergence amongst researchers on
the definition of performance and/or its dimensions and this has produced wide variation
in the calibration of models used (Richard et al., 2009).
2.5.7 Innovative Performance
Innovative performance is composed of three dimensions: inventive performance,
technological performance and commercialisation (Hagedoorn and Cloodt, 2003).
Hagedoorn and Cloodt (2003, p. 1366) suggest inventive performance can be
characterized as “the achievements of companies in terms of ideas, sketches, models
of new devices, products, processes and systems”. Inventive performance is often
assessed by summing patents and patent citations. Hagedoorn and Cloodt (2003, p.
1367) define technological performance “as the accomplishment of companies with
regard to the combination of their R&D input, as an indicator of their research
capabilities, and their R&D output in terms of patents”. Commercialisation refers to the
level of new product introduction. An all-encompassing comprehension of the innovative
performance of firms incorporates “their research input, the size of their inventive
activities, the quality of their inventive output and their level of new product introduction”
(Hagedoorn and Cloodt, 2003, p. 1367).
Innovative performance is deemed crucial to organizational success. Kim and
Maubourgne (2005) submit that firms need to innovate in order to endure and flourish in
Page 65
64
global markets. Schumpeter (1934) contends that innovative performance bestows
monopoly rents and spawns enduring entrepreneurial success. The launch of new
innovative products, services and/or markets distinguishes entrepreneurial firms from
competitors (Porter, 1980). Innovative entrepreneurial firms differentiate themselves
from competitors, enjoy higher customer loyalty and can secure superior pricing for their
products (Porter, 1980). Further, through innovative performance entry barriers for
prospective challengers can be erected and the firm’s position in the industry
strengthened leading to continual high profits (Porter, 1980). Nevertheless, other
scholars question the supposed benefits of innovative performance since innovation
necessitates considerable means (Van de Ven, 1986), enhances uncertainty and
threats (Eisenhardt and Martin, 2000), is laden with elevated failure rates (Berggren and
Nacher, 2001) and implies short-term losses (Block and MacMillan, 1993).
2.6 Environmental hostility
Environmental characteristics activate technology and entrepreneurial choices (Urban
and Barreira, 2010). The entrepreneur’s perception of the external environment
moderates the relationship between EO and performance (Urban and Barreira, 2010).
Environmental Hostility (EH) refers to an unfavourable business climate. A hostile
environment is characterised by many competitors, unfavourable supply conditions and
strict regulation (Zahra and Bogner, 1999). Rosenbusch, Rauch and Bausch (2011)
suggest environmental hostility refers to legal, political and economic constraints, low
customer loyalty and severe consequences of wrong strategic decisions.
Page 66
65
Environmental hostility can have dire consequences for firms and the strategies they
pursue. Although the construct has been researched for over thirty years, literature is
not conclusive on the impact of environmental hostility on firm performance.
Rosenbusch, Rauch and Bausch (2011) conducted a meta-analysis on the impact of
the task environment on the EO-performance relationship. They found that hostility is
not related to EO and performance. Firstly, they suggest that this could be because in a
hostile environment firms face competition for resources and opportunities, which
decreases profit margins and limits strategic options. Access to human and financial
resources is limited. Since these resources are crucial for EO, innovativeness, risk
taking and proactiveness may be an inefficient response to a hostile environment.
Further, they postulate that moderators may account for the different effects reported in
the literature. Thus, certain groups of firms may increase their EO if hostility increases,
whereas other firms decrease it. For example, non-price hostility may increase EO
whereas price hostility might lead to a decrease. Finally, they note that EO in small and
medium-sized enterprises is negatively related to environmental hostility whereas it is
positively related to EO in large firms. They posit that this could be because large firms
have more resources that can be used to pursue entrepreneurial strategies, even in
hostile environments.
However, other scholars have found a positive relationship between environmental
hostility and EO and performance. EO has been positively associated with
environmental hostility (Zahra, 1993). Further, firms with a high EO have displayed
better performance (Covin and Slevin, 1989). Finally innovation, a sub-construct of EO,
has been associated with hostile environments (Miller, Droge and Toulous, 1988). In a
Page 67
66
South African context, Urban and Barreira (2010) in a cross sectional survey found that
EO is positively correlated with environmental hostility. They suggest that a plausible
explanation could be that firms operating in hostile environments need to innovate to
remain competitive and thus are more likely to be entrepreneurial.
Chow (2006) suggests that the relationship between environmental hostility and
performance is likely to be influenced by internal organizational factors. Peng (2001, p.
105) argues that “prospecting, networking and boundary blurring” are strategies used by
the most successful entrepreneurs in emerging markets to shape the environment.
Baker and Nelson (2005) found evidence of firms extracting profits from seemingly
invaluable resources in low growth industries. Incomplete market information and the
ability of firms to recombine resources in novel ways unforeseen by competitors can
increase returns to the firm (Denrell et al., 2003). Furthermore, firms adapt by
transforming unique resources to create value while considering environmental
contingencies (Sirmon, Hitt and Ireland, 2007). In sum, environmental hostility seems to
moderate the relationship between strategies pursued and firm performance. In the next
section we will review literature on emerging markets and develop hypotheses.
2.6.1 Emerging markets
Emerging markets are characterised by environmental turbulence (Peng, 2002), less
developed or more expensive external factor markets (Uhlenbruck et al., 2003) and
hostile institutional influences (Peng, 2001). Despite its complication and volatility,
environmental turbulence stimulates entrepreneurial endeavour in emerging markets
(Peng, 2001). Dynamic, harsh and multifaceted environments encourage an
Page 68
67
entrepreneurial orientation amongst firms (Peng, 2001). In addition, high-technology
ventures are normally regarded as more entrepreneurial; especially an emerging market
context because the environment is more risky and uncertain and competitive
advantages come from innovative and proactive orientation (Peng, 2001).
Support for entrepreneurial firms in emerging markets remains weak (Peng, 2001).
They are grudgingly accepted or face antagonism from large segments of the
population (Peng, 2000). Thus, cultural differences have an impact on entrepreneurial
high technology firms (Peng, 2000). High-technology entrepreneurial firms often employ
guerrilla strategies in order to successfully navigate the contextual constraints and
mitigate the negative performance implications of entrepreneurial activities in often-
hostile institutional environments (Peng, 2001). The weak regulatory environment,
which consists of laws, regulations and codified government policies, is often hostile to
change (Peng, 2000). Bruton, Ahlstrom and Obloj (2008) argue that hostile institutional
and cultural forces do not only constrain entrepreneurial firms, but they also enable
them. Further, those entrepreneurs that can understand and make the most of the local
institutional regime, form business systems that are distinctive and act to shape their
institutional environments will succeed. Should they fail to do so “they ultimately may be
overwhelmed by what often proves to be a hostile environment bent on extracting as
many resources as possible” (Ahlstrom and Bruton, 2002, p. 54).
The importance of institutional influences and environmental hostility on business
strategies is increasingly recognised in an emerging market context (Peng, 2002). As
noted in the preceding paragraphs, Peng (2001, p. 105) has argued that “prospecting,
networking and boundary blurring” are strategies used by the most successful
Page 69
68
entrepreneurs in emerging markets to mitigate environmental hostility. Although these
strategies are also used in developed markets, they are particularly important in
transition economies since substitute strategies such as buy outs are not easily
available (Lau and Bruton, 2011).
In an emerging market context, networking has been deemed important in ameliorating
some of the hostile institutional and cultural practises (Lau and Bruton, 2011). Further,
networking is deemed important in the success of technology ventures in transition
economy contexts (Peng and Luo, 2000). Lau and Bruton (2011) have found that the
entrepreneurial firms’ social network directly influences sales performance. In addition,
Peng and Luo, (2000) suggest that social networks of the high-technology venture affect
firm performance, since networking is a key intangible asset in a transition economy.
They posit that social networks positively influence the effect of entrepreneurial
strategies by providing resources that are critical to the firm.
The researcher contends that effectuation provides a possible explanation of the
behaviour of entrepreneurial firms in hostile environments since in such hostile
environments the use of non-predictive strategy can be beneficial to entrepreneurial
firms (Witlbank et al., 2009). Thus rather than trying to predict an uncertain
environment, they seek to control it. Instead of trying to work within hostile institutional
and cultural environments, they transform them. They achieve these ends by boundary
blurring, accumulating stakeholder commitments under goal ambiguity, achieving
control through non-predictive strategies and using exaptive orientation, to create a
broader and different range of variation (Dew et al., 2008). It is this very variation that
may lead to a competitive advantage.
Page 70
69
Further, in such environments entrepreneurial firms do not worry about the resources
they need, rather they focus on the resources they have (Sarasvathy, 2001). They begin
with who they are, what they know and whom they know to envisage artefacts they can
create (Sarasvathy, 2001). Resources are then secured from the environment through
self-selecting stakeholders. Opportunities are constructed through collaboration and
goal creation with others and each effectual stakeholder invests what they can afford to
lose; and environmental contingencies are leveraged (Sarasvathy, 2001). Thus means,
social networking, leveraging environmental contingencies and active boundary blurring
are used to transform hostile environments and build successful firms/markets. In sum,
expert entrepreneurs utilise effectuation to transform hostile environments and as a
result create a multiplicity of new and profitable ends (Venkataraman and Sarasvathy,
2001).
Conclusion of Literature Review
In conclusion, non-predictive strategy pursued is the focal area of this research. For
entrepreneurial firms, an effectual strategy development process can be decidedly
appropriate. Whereas predictive strategies are ways to manipulate current realities to
reach preselected goals; effectual strategies generate new goals and new environments
from current realities. The utility of emphasising prediction and/or adapting to
exogenously given circumstances is questionable in conditions of high uncertainty.
Whether an effectual or predictive strategy is optimal and in what context, has not been
resolved in literature.
Page 71
70
Testing the moderating impact of effectuation on the relation between EO and
performance requires a methodology that allows us to test for correlation and causation
between the variables. Thus, due to the confirmatory nature of our research, a
quantitative approach using factor analysis and regression analysis is the most
appropriate. Exploratory factor analysis facilitates ascertaining construct and
discriminant validity and multiple regression assists us in the testing of causal
relationships between variables (Hair et al., 2010). Thus, regression analysis will be
used to test whether effectuation moderates the relation between EO and performance
and whether environmental hostility moderates the relation between effectuation and
performance in South African firms. The hypothesis are summarised below:
H1: EO positively predicts effectuation.
H1a: EO positively predicts experimentation.
H1b: EO positively predicts flexibility.
H2: Hostility positively predicts effectuation.
H3: EO positively predicts performance.
H3a: EO positively predicts financial performance.
H3b: EO positively predicts market performance.
H3c: EO positively predicts innovative performance.
H4: Effectuation positively predicts performance.
H4a: Effectuation positively predicts financial performance.
H4b: Effectuation positively predicts market performance.
H4c: Effectuation positively predicts innovative performance.
H5: Flexibility positively predicts performance.
Page 72
71
H5a: Flexibility positively predicts financial performance.
H5b: Flexibility positively predicts market performance.
H5c: Flexibility positively predicts innovative performance.
H6: Experimentation positively predicts performance.
H6a: Experimentation positively predicts financial performance.
H6b: Experimentation positively predicts market performance.
H6c: Experimentation positively predicts innovative performance.
H7: Affordable loss positively predicts performance.
H7a: Affordable loss positively predicts financial performance.
H7b: Affordable loss positively predicts market performance.
H7c: Affordable loss positively predicts innovative performance.
H8: Pre- commitments positively predict performance.
H8a: Pre-commitments positively predicts financial performance.
H8b: Pre-commitments positively predicts market performance.
H8c: Pre-commitments positively predicts innovative performance.
H9: Environmental hostility moderates the relation between effectuation and
performance.
H9a: Environmental hostility moderates the relation between
experimentation and performance.
H9b: Environmental hostility moderates the relation between
experimentation and performance.
Figures 9 and 10 illustrate the moderation hypotheses.
Page 73
72
Figure 10: Hostility as a moderator of Effectuation and Performance
Figure 11: Effectuation as a moderator of EO and Performance
Page 74
73
H10: Effectuation moderates the relation between EO and performance.
H10a: Experimentation moderates the relation between EO and performance.
H10b: Affordable loss moderates the relation between EO and performance.
H10c: Flexibility moderates the relation between EO and performance.
H10d: Precommitments moderates the relation between EO and performance.
Page 75
74
Chapter 3: Research Methodology
3.1 Research methodology
This section outlines the methodology used to conduct this research. Firstly, the
literature around quantitative research will be discussed, followed by a review of the
research design and research instrument to be used. Issues of data collection and
analysis in relation to this study will be provided, followed by a discussion on the validity
and reliability.
3.1.1 Research methodology / paradigm
This study will adopt a positivist approach to research. Positivist social science is an
organised method for combining deductive logic with precise empirical observations of
individual behaviour in order to discover and confirm a set of probabilistic casual laws
that can be used to predict general patterns of human activity (Neuman, 2003). The
positivist approach uses scientific methods to study social science. Bryman and Bell
(2007) note that the positivist approach is based on five principles:
Only occurrences that are validated by the senses can be deemed knowledge.
The objective of research is to develop theories that can be assessed.
Understanding comes from assembling facts that are the basis for laws.
Science must be objective.
Page 76
75
Assumes an objective, social reality and that the researcher is independent of the
research subject.
Positivists believe in a single reality that can be measured reliably and validly using
scientific principles (Onwuegbuzie and Leech, 2005). Positivists believe social science
should be value free and objective (Neuman, 2003).
This study will use a quantitative research methodology in order to gather the most
appropriate data to answer the hypothesis. Quantitative research refers to the
systematic empirical investigation of social phenomena via statistical, mathematical or
computational techniques (Onwuegbuzie and Leech, 2005). The objective of
quantitative research is to develop and employ mathematical models, theories and/or
hypotheses pertaining to phenomena (Onwuegbuzie and Leech, 2005).
The research objective in quantitative studies can be classified as falling on a
continuum from exploratory to confirmatory (Onwuegbuzie and Leech, 2005). A
quantitative research objective is exploratory if the goal of the study is to examine
patterns from data collected by the investigator or the researcher (Onwuegbuzie and
Leech, 2005). A quantitative research objective is confirmatory if the goal of the
investigation is to use the underlying data collected to test hypotheses of interest
(Onwuegbuzie and Leech, 2005).
The process of measurement is central to quantitative research because it provides the
fundamental connection between empirical observation and mathematical expression of
quantitative relationships (Onwuegbuzie and Leech, 2005). The data will be collected
using a self-administered questionnaire, electronically solicited through Qualtrics. Self-
Page 77
76
administered questionnaires will enable the researcher to contact Chief Executive
Officers who might otherwise be inaccessible (Cooper and Schindler, 2011). They are
also relatively cost effective and time efficient (Cooper and Schindler, 2011).
The researcher shall assume that respondents were honest and candid.
3.2 Research Design
A web-based survey is used to collect data for this survey. In the following section, we
explicate the reasons for using a web-based survey, sample selection, survey
development and the measurement of constructs. Further, the multivariate statistical
techniques employed will be discussed.
The firm was selected as the most appropriate unit of analysis. The firm represents an
aggregate of different individuals and business activities. Operationalization of EO and
strategy formation implies measuring a senior manager’s perception of his firm’s
strategic orientation. In sum, what is really measured is the CEO’s perception and this
serves as a useful proxy for measuring strategy formation (Wiklund, 1999).
Further, using the firm as a unit of analysis brings about additional complications. Size,
size distributions, and heterogeneity need to be addressed (Davidsonn, 2004). Since
industry dynamics differ, firm heterogeneity raises concerns about generalizability and
applicability. To counteract such discrepancies the instruments will be carefully
operationalized and the level of analysis will be explained in detail.
Lastly, control variables in this study will include: firm age and firm size. Control
variables are variables that might affect a given relationship but their effect is not at the
Page 78
77
core of the problem that is under investigation (Cooper and Schindler, 2011). Measuring
the direct effect of the environment will partially account for other factors that may
moderate between the constructs.
3.2.1 Population and sample
The population of interest will be registered high technology firms in South Africa. Other
regions are not considered due to financial constraints. A comparison with other
markets would enrich the study.
3.2.2 Sample and Sampling method
The researcher used a non-probability sampling technique called judgement sampling.
Judgement sampling occurs when a researcher selects sample members to conform to
some criterion. When judgement sampling is used, there is greater risk of bias in the
sample which could distort the results of the study and similar to other non-probability
sampling techniques, the probability of selecting population elements is not known
(Cooper and Schindler, 2011).
The Technology Top 100, the department of Trade and Industry (DTI) and IT Web
databases were used to develop the sampling frame for this research. It is important to
note that both high technology and traditional firms were incorporated in the sampling
frame. Comparing between these two types of firms is likely to lead to more robust
results and offers a more integrated perspective on the determinants and measurement
of performance of high technology firms, relative to traditional firms.
To assess high technology firms, respondents we asked to describe their firms as:
Page 79
78
Low tech
Medium tech
High tech.
Secondly, an industry classification code developed by Kile and Phillips (2009) was
used. Kile and Phillips (2009) developed a set of eleven standard industrial
classification codes (SIC) that provide a preferred sampling combination for high
technology firms with a 94% accuracy rate, leading to a 6% Type II error rate. They
suggest that this classification method has the potential to generate samples containing
more high-tech firms, thus enabling more powerful statistical tests.
Multiple regression analysis was utilised to analyse our data. Hair, Black, Babin and
Anderson (2010) suggest that to produce stable solutions that are more likely to be
replicable, when using multiple regression analysis, sample size decisions need to be
made based on model complexity and basic measurement model characteristics. They
suggest a minimum sample size of 50 to improve generalizability, obtain adequate
power and address model parsimony.
3.3 The research instrument
The research instrument is a self-administered questionnaire. A self-administered
questionnaire is relatively cost effective and facilitates sample accessibility (Cooper and
Schindler, 2011). A web-based survey is used as the research instrument. A web base
survey facilitates access to a bigger geographic sample and an improved response
Page 80
79
speed (Cooper and Schindler, 2011). Further, reduced coverage bias is likely as most
managers of have access to the internet and regularly use e-mail (Cooper and
Schindler, 2011).
The computer software Qualtrics was selected to create a web based survey
instrument. Qualtrics is a professional survey instrument licensed by the University of
the Witwatersrand. The University endorsement further enhanced the credibility of the
study amongst respondents. The questionnaire consisted of five sections, namely:
Demographic
Effectuation
EO
Environmental Hostility
Performance
Likert scales were used for the questions covering the constructs. The participants were
asked whether they agree or disagree toward the question of interest, using a 7-point
Likert scale. Likert scales are commonly used in social science, strategy and
entrepreneurship research and help facilitate statistical analysis (Cooper and Schindler,
2011). The layout and design of the survey included page breaks and forced response
where applicable. To increase validity, the survey was thoroughly checked by the
author’s supervisor and his research assistant (Merle Werbeloff). Further, the
instrument was pre-tested on 5 MBA students. MBA students are good proxies for
Page 81
80
senior managers since they are aware of the subject of interest. Minor amendments
were made to wording, the order of questions and spelling errors, based on the
feedback received from the pre-test.
3.3.1 Measurements of Constructs
In order to test the hypothesis outlined in Chapter 2, measurements were adapted from
previously validated measures found in entrepreneurship literature. These scales were
assessed for validity and construct reliability. The variables were measured using
seven-point Likert scales.
Firstly, EO was measured based on Miller’s (1983) conceptualization of EO, using items
recommended by Covin and Slevin (1989). The scale comprises of nine items (Covin
and Slevin, 1989; Messeghem, 2003; Miles and Arnold, 1991; Naman and Slevin,
1993; Zahra, 1991; Zahra and Covin, 1995), measuring innovativeness, pro-activeness
and risk taking.
Secondly, the five items from Powell (1995) for the measurement of firm performance,
covering financial performance, sales growth, profitability and revenue growth were
adapted. The researcher also used an item for relative market share proposed by Baker
and Sinkula (1999). Further, items to measure innovative performance were added.
To operationalize environmental hostility an instrument developed by Urban and
Barreira (2010) was employed. Confirmatory factor analysis showed that the set of
responses were valid and reliable.
Page 82
81
Finally, to measure effectuation a validated scale developed by (Chandler et al., 2011)
was adapted. Confirmatory factor analysis showed that the set of responses worked
together statistically, and exploratory factor analysis showed that effectuation is a
formative multidimensional construct with four associated sub-dimensions:
experimentation, affordable loss, pre-commitments and flexibility (Chandler et al., 2011).
Table 4 illustrates a detailed overview of the measurement of the constructs. The
variables were measured using seven-point Likert scales.
Table 3: Summary of Measurement for Explanatory Variables
Construct Measurement Sources
Effectuation 13 items, 7-point Likert scales Experimentation Affordable loss Flexibility Precommitments
Chandler et al. (2011)
EO 9 items, 7-point Likert scales Innovativeness Risk Taking Pro-activeness
Covin and Slevin (1989)
Environmental Hostility
6 items, 7-point Likert scales Urban and Barreiro (2010)
Performance 12 items, 7-point Likert scales Financial performance Market/Operational performance Innovative performance
Powell (1995), Baker and Sinful (1999).
3.3.3 Procedure for data collection
Surveys were sent through Qualtrics to 500 firms in South Africa, taking into
consideration the geographical diffusion of sample firms. The questionnaire was easy to
read and offered clear response directions (Cooper and Schindler, 2011). Each firm
received a covering e-mail with the university logo, which described the research and
Page 83
82
asked for their participation. University endorsement tends to lend more credibility to
research requests, helping to increase response rates (Schneider and Johnson, 1995).
The initial e-mail contained the link to the web-based survey and assured the targets
that the survey is anonymous. The anonymity of responses, stated in the covering e-
mail, helps to increase response rates (Cooper and Schindler, 2011). Electronic
reminders, containing the survey link, were sent one week after the initial e-mail.
According to Cooper and Schindler (2011) questionnaires that are easy to read, have
reminders after the delivery of a self-administered survey and that give clear response
directions improve response rates. The web-based survey instrument is presented in
Appendix B, along with the initial postal cover letter (Appendix A).
The questionnaires were addressed to the CEO, Managing director and/or senior
executives. Proper instructions were given to this effect.
3.3.4 Data analysis and interpretation
Exploratory data analysis (EDA) involved the calculation of descriptive statistics and
frequencies to search for clues and patterns in the data (Cooper and Schindler, 2011).
EDA supports traditional statistics. Numerical summaries of location, shape and spread
were calculated. Further, graphical displays were used to provide an accurate
description of distributions and variable relationship (Cooper and Schindler, 2011).
Frequency tables were used to arrange data from the highest to the lowest with counts
and percentages. Bar charts and pie charts helped with relative comparisons of nominal
data (Cooper and Schindler, 2011).
Page 84
83
Multiple regression analysis was used as the main statistical tool to test the hypotheses.
Multiple regression analysis can describe the relationships among two or more intervally
scaled variables (Hair et al., 2010). Multiple regression analysis is appropriate for
analyzing the degree and character of relationships of a single dependent variable (DV)
and several independent variables (IV) (Hair et al., 2010). The objective of multiple
regression analysis is to use the several IVs to predict the single DV (Hair et al., 2010).
To measure predictive accuracy, when using multiple regression analysis, one squares
each error and adds the results together (Hair et al., 2010). This is referred to as the
sum of squared errors (SSE) which provides a measure of predictive accuracy that
varies based on the amount of prediction error (Hair et al., 2010). One wishes to obtain
the lowest amount of SSE. This is referred to as the concept of ordinary least squares
(Hair et al., 2010).
Multiple regression analysis assumes (Hair et al., 2010):
The linearity of the phenomenon measured
Constant variance of error terms
Independence of error terms
And normality of error term distribution
Residuals were plotted against predicted variables to identify potential violations of the
regression assumptions (Hair et al., 2010). Multicollinearity among the IVs was
assessed using pairwise correlation (Hair et al., 2010). The various measures of
Page 85
84
performance were used as the DV with the objective of understanding how EO and
effectuation and their sub-constructs explain the distinct aspects of performance.
Effectuation was also used in some regressions as a DV with the purpose of
understanding how environmental characteristics and strategic orientations explain
effectuation.
Moderation occurs when a third construct changes the relationship between two related
constructs (Hair et al., 2010). The moderator variable changes the form of the
relationship between another independent variable and the dependent variable (Hair et
al., 2010). We assessed whether effectuation and its sub-constructs moderated the
relationship between EO and the various dimensions of performance. Environmental
hostility was also assessed as a moderator of the relationship between effectuation and
the various dimensions of performance. As Hair et al. (2010) suggest we a three step
process was followed to determine whether the moderator effect was significant:
Estimated the original un-moderated equation
Estimated the moderated relationship
Assess the change in R2. If the incremental effect is significant then a significant
moderator effect is present.
Further, two independent sample t-tests were used to compare whether there were
significant differences in the strategy pursued by high technology firms and medium and
low technology firms and the resulting performance outcomes.
Page 86
85
All testing was done using 90%, 95% and 99% confidence level. The statistical software
Statistica was used for the quantitative analyses in the study.
3.4 Limitations of the study
The limitations are comprehensively dealt with in Chapter 6. In this section the
researcher merely summarises the important ones. Studies on EO apply only to
surviving firms. This could compromise the results due to survivor bias. Further, the
causal direction between EO and performance cannot be addressed. The study cannot
test the effect of EO on performance in a strict sense because cross-sectional data was
used.
3.5 Validity and reliability
3.5.1 Validity
Validity relates to the ability of the research instrument to measure what it is purported
to measure (Cooper and Schindler, 2011). Internal validity is assessed through
assessing construct validity. Construct validity is the extent to which a set of measured
items (questionnaire item) reflect the latent theoretical constructs (e.g. EO) those items
are designed to measure (Hair et al., 2010). Construct validity is made up of convergent
validity, discriminant validity, face validity and nomological validity (Hair et al., 2010).
Convergent validity helps assess whether the indicators of a specific construct share a
high proportion of variance in common (Hair et al., 2010). The researcher assessed the
correlations amongst the sub-constructs with the construct. Correlations were
satisfactory, thus establishing convergent validity.
Page 87
86
Discriminant validity is the degree to which a construct truly differs from others (Hair et
al., 2010). High discriminant validity evaluates whether a construct is distinctive and
describes phenomena that others do not and whether its summated scale is correlated
with a similar but conceptually distinct measure. The correlation between the two
measures should be low, to demonstrate that the two concepts are distinct. The
researcher assessed effectuation, environmental hostility and EO for discriminant
validity.
Face/Content validity gauges whether every item’s content or meaning on the
questionnaire adequately represents the constructs under study (Cooper and Schindler,
2011). Judgement and evaluation by the author’s supervisor and his assistant were
employed to ensure that our questionnaire has face validity (Cooper and Schindler,
2011).
Nomological validity assess whether correlations among constructs make sense (Hair et
al., 2010). The matrix of construct correlations was used to make this assessment.
Further, unidimensionality was assessed through exploratory factor analysis. The test of
unidimensionality is that each summated scale should consist of items loading highly on
a single factor. As Hair et al. (2010) suggests factor loadings> .5 were considered
significant. Lastly, the multitrait, multimethod matrices (MTMM) were also used to
assess validity.
Page 88
87
3.5.2 Reliability
Reliability relates to the degree to which a measure supplies results consistently
(Cooper and Schindler, 2011). As Hair et al. (2010) suggests the researcher used the
following reliability measures:
Cronbasch’s Alpha> .7
Item-to-total correlations> .5
Inter item correlations>.3
High construct reliability indicates that questionnaire items consistently represent the
same latent construct (Hair et al., 2010).
Page 89
88
Chapter 4: Results
4.1 Descriptive statistics
4.1.1 Description of respondents
Questionnaires were distributed to South African companies via email containing the
web link to the survey on Qualtrics. Of the 500 emails sent, 100 surveys were returned.
This corresponds to a total response rate of 20%. Six of the questionnaires had only
demographic information and they were deleted. The usable response rate achieved
was 18.8% (94 companies). Hair et al. (2010) suggest a minimum sample size of 50
when using multiple regression analysis. Further, Arrindel and van der Ende (1985)
argue sample sizes of less than 100 can produce stable factors when using exploratory
factor analysis. They used two large data sets to investigate the minimum sample sizes
and ratios and found stable factor structures with ratios as low as 1.3:1. Therefore, the
sample size of 94 is sufficient to conduct exploratory factor analysis, maintain adequate
power and undertake statistical analyses and modeling.
Table 4: Descriptive Statistics
Valid N
Mean
Confidence - -95.000%
Confidence - 95.000%
Median Minimum Maximum Lower - Quartile
Upper - Quartile
Std.Dev.
Effectuation 94.00 5.12 4.96 5.28 5.17 2.92 7.00 4.58 5.58 0.79
EO 94.00 4.52 4.33 4.71 4.61 2.11 6.78 4.00 5.11 0.93
Performance 90.00 4.49 4.30 4.69 4.50 1.55 6.27 4.00 5.09 0.92
Hostility 88.00 4.71 4.48 4.94 4.80 1.60 6.60 4.20 5.60 1.09
Missing data are information from a participant that is not available for one or more
variables of interest (Cooper and Schindler, 2011). In the survey, 4 respondents did not
Page 90
89
complete the performance variables and an additional 2 did not complete the
environmental hostility variables. The researcher used list wise deletion- a technique
that deletes cases with missing data on one variable from the sample for all analyses of
that variable- to salvage the data set (Cooper and Schindler, 2011). With this technique,
no bias is introduced to the sample because only fully complete cases are used for the
variable.
Table 4 presents the descriptive statistics for effectuation, EO, performance and
environmental hostility. The mean and the median are similar for all constructs,
indicating the absence of skewness. Effectuation has the highest mean at 5.12,
whereas environmental hostility has the highest standard deviation. The standard
deviation helps us calculate with a 95% level of confidence where the sample mean lies.
For example, for the construct effectuation one is 95% confident that the sample mean
lies between 4.96 and 5.28.
4.1.2 Respondents
The survey instrument was addressed to senior company executives who are assumed
to be aware of company strategy. As table 5 illustrates, 98% of the respondents were
senior executives, further ensuring validity. Richard et al. (2009) argues that the validity
of subjective measures can be improved by selecting knowledgeable informants. Two of
the respondents indicated that they were a Project administrator and a Supervisor.
These were deemed to be senior enough for the respondents to be aware of company
strategy and the cases were not deleted.
Page 91
90
Table 5: Frequency table: Current position in the firm
Count Cumulative - Count
Percent Cumulative - Percent
Director 23.00 23.00 24.47 24.47
Manager 30.00 53.00 31.91 56.38
General Manager 2.00 55.00 2.13 58.51
CEO 28.00 83.00 29.79 88.30
Executive 1.00 84.00 1.06 89.36
Executive Manager 1.00 85.00 1.06 90.43
CIO 1.00 86.00 1.06 91.49
MD 1.00 87.00 1.06 92.55
CFO 1.00 88.00 1.06 93.62
Chairman 1.00 89.00 1.06 94.68
Supervisor 1.00 90.00 1.06 95.74
Project Administrator 1.00 91.00 1.06 96.81
Sales Executive 1.00 92.00 1.06 97.87
Managing Director 1.00 93.00 1.06 98.94
Managing Member 1.00 94.00 1.06 100.00
Missing 0.00 94.00 0.00 100.00
4.1.3 Firm Age and Size
The majority of the respondents (95.7%) were formed before 2008. There were only 4
firms that were three years old or younger and as a result firm age could not be used as
a control variable. Similarly, firm size was not used as a control variable since only 23 of
the respondents had fewer than 51 employees. As illustrated in table 6 and table 7, firm
age and firm size, where over 44% of the responding firms employ more than 350
people, indicate that the respondents are a mixture of small, medium and large
companies that have been in business for a substantial period of time.
Page 92
91
Table 6: Frequency table: Firm founded
Count Cumulative - Count
Percent Cumulative - Percent
Before 1950 24 24 25.53 25.53
1991-2008 27 51 28.72 54.25
1951-1990 39 90 41.49 95.7
after 2008 4 94 4.26 100
Missing 0 94 0 100
Table 7: Frequency table: Overall number of employees in the firm
Count Cumulative - Count
Percent Cumulative - Percent
fewer than 51 23 23 24.46809 24.4681
51-200 23 46 24.46809 48.9362
201-350 6 52 6.38298 55.3191
351-500 10 62 10.6383 65.9574
>500 32 94 34.04255 100
Missing 0 94 0 100
4.1.4 Technological advancement
The respondents were asked to rate their company’s level of technological
advancement. This self reporting together with standard industrial classification codes
(SIC) developed by Kile and Phillips (2009) were used to classify high technology
companies. As figure 12 illustrates, seven of the respondents indicated that their firm
was low tech, 54 catergorised their firm as meduim tech and 34 reported their firm as
high tech. As will be discussed in the following section, t-tests were conducted to
Page 93
92
determine where there was a significant difference in strategy and performance
between high tech and meduim tech. Low tech firms, with a count of 7, were ignored.
Figure 12: Level of technological advancement
4.2 Measurement aspects of the model EO
4.2.1 Measurements of Constructs
As discussed in Chapter 3, the measurements were adapted from existing scales in
strategy and entrepreneurship literature. The variables and their psychometric
properties are discussed in detail in this Chapter. Please refer to Tables 8 to 11 for a
detailed description of the variables. The reader is advised to refer to these tables to
better comprehend the sections on validity and reliability. All the variables were
measured using seven-point Likert scales and thus the data is interval.
Page 94
93
Table 8: Effectuation scale
Construct: Effectuation Scale: 7 point Likert scale
Variable N Mean Std. Dev Q6: The product/service that my company now provides is essentially the same as originally conceptualised
94 3.07 1.86
Q7: My company has experimented with different products and/or business models 94 5.61 1.30
Q8: When launching a new product or service, my company tries a number of different approaches
94 5.10 1.57
Q9: The product/service that my company now provides is substantially different than we first imagined
94 3.86 1.88
Q10: When launching a new product/service, my company is careful to invest only the resources we can afford to lose
94 4.35 1.74
Q11: When launching a new product/service, my company is careful not to risk more money than we are willing to lose with our initial idea.
94 4.87 1.60
Q12: When launching a new product/service, we are careful to invest only so much money that the company w
94 5.71 1.31
Q13: My company allows the business to evolve as opportunities emerge . 94 5.80 1.21
Q14: My company has adapted what we are doing to the resources we have 94 5.09 1.70
Q15: My company is flexible and takes advantage of opportunities as they arise . 94 5.69 1.15
Q16: My company has avoided courses of action that restrict our flexibility and adaptability
94 5.05 1.53
Q17: My company has a substantial number of agreements with customers, suppliers and other organisations
94 5.1383 1.55
Q18: My company uses pre-commitments from customers and suppliers as often as possible
94 5.15 1.38
Q19: At my company, we talk with people we know to enlist their support in developing the business
94 4.63 1.73
Table 9: EO scale
Construct: EO Scale: 7 point Likert scale
Variable N Mean Std. Dev
Q20: My company typically initiates actions that competitors respond to 94 5.10 1.30
Q21: My company is very often the first business to introduce new products/services, administrative techn .
94 4.79 1.45
Q22: My company typically adopts a very competitive, aggressive stance against competitors
94 4.71 1.45
Q23: My company has a strong inclination for high-risk projects with chances of very high returns
94 3.54 1.57
Q24: Owing to the nature of the environment, bold initiatives are necessary to achieve my company's objec
94 5.03 1.44
Q25: My company typically adopts a bold, aggressive posture in order to maximise the probability of explo
94 4.66 1.41
Q26: My company has a strong emphasis on research and development, technological leadership…
94 4.89 1.82
Q27: My company has many lines of products or services 94 4.73 1.69
Q28: At my company, there have been considerable changes in our product or service lines
94 3.20 1.06
Page 95
94
Table 10: Performance scale
Construct: Performance Scale: 7 point Likert scale
Variable N Mean Std. Dev
Q29: Over the past 5 years, our financial performance has exceeded our expectations 90 4.06 1.78
Q30: Over the past 5 years, our financial performance has exceeded that of our competitors
90 4.48 1.40
Q31: Over the past 5 years, we have been more profitable than our competitors have 90 4.48 1.31
Q32: Over the past 5 years, our revenue (sales) growth has exceeded our expectations 90 3.99 1.60
Q33: Over the past 5 years, our revenue growth rate has exceeded that of our competitors
90 4.28 1.31
Q34: Over the past 5 years, our customer satisfaction has been outstanding 90 5.02 1.40
Q35: Over the past 5 years, our customer satisfaction has exceeded that of our competitors
90 4.99 1.16
Q36: Last year, our market was share much higher than that of our competitors 90 4.3 1.46
Q37: Our company is better at introducing new products and services to the market than our competitors
90 4.42 1.40
Q38: Last year, the percentage of our new products in the existing product portfolio exceeded that of our competitors
90 4.1 1.39
Q39: Over the last year, we have introduced innovations for work processes and methods
90 5.33 1.34
Q40: We have innovations under intellectual property protection 90 4.16 1.92
Table 11: Environmental Hostility scale
Construct: Environmental Hostility Scale: 7 point Likert scale
Variable N Mean Std. Dev
Q41: The failure rate of firms in my industry is high 88 4.51 1.60
Q42: My industry is very risky; one bad decision could threaten its viability 88 4.33 1.65
Q43: Competition in my industry is high 88 5.60 1.27
Q44: Customer loyalty in my industry is low 88 4.14 1.70
Q45: Severe price wars are characteristic of my industry 88 4.53 1.73
Q46: Low profit margins are characteristic of my industry 88 4.58 1.83
4.2.2 Descriptive statistics
Multivariate analysis requires that the assumptions underlying the statistical techniques
be tested for the separate variables and for the multivariate model (Hair et al., 2010). In
this section the research will focus on whether EO meets the normality assumptions.
Normality is the most fundamental assumption of multivariate analysis because
departures from normality render all resulting statistical tests invalid (Hair et al., 2010).
Page 96
95
Figure 13: Histogram EO
Figure 13 illustrates a histogram of EO with the normal distribution superimposed over
it. The middle of the distribution is higher than the superimposed normal curve whilst
both the tails are higher than expected. As indicated in Table 12, kurtosis and skewness
are slightly negative. They do not represent a major departure from normality since they
are slightly below zero. Further, the Shapiro- Wilks test (p=.43), which calculates the
levels of significance for the departure from normality, also indicates that the actual
degree of departure from normality is not significant.
Table 12: Descriptive stats EO
Valid N
Std.Dev. Skewness Kurtosis
EO 94.00 0.93 -0.29 -0.07
Page 97
96
4.2.2 Psychometric properties EO
Reliability analysis refers to the extent to which a set of variables measures what it is
intended to measure (Hair et al., 2010). In contrast to validity, it relates to how a
construct is measured not what is measured. Reliability analysis provides an indication
of how free a scale is from random error. There are four types of reliability analysis:
Test-retest
Inter rater
Parallel forms
Internal consistency
The researcher used internal consistency reliability analysis. The idea behind internal
consistency reliability analysis is that the variables should be measuring the same
construct and thus be highly inter-correlated (Hair et al., 2010). Firstly, Hair et al. (2010)
suggest that to diagnose internal consistency we should consider inter-item correlations
and item-to-total correlations. Table 13 illustrates the reliability analysis for EO. For the
scale, inter-item correlation (0.38) exceeds the recommended 0.30 (Hair et al., 2010).
Further, except for Q22 (0.32), item-to-total correlations of all variables are close to or
exceed the recommended 0.5 (Hair et al., 2010). Secondly, Hair et al. (2010) suggest
researchers should use as a diagnostic measure a reliability coefficient, with Cronbach’s
alpha being the most commonly used. The recommended lower limit for Cronbach’s
alpha is 0.7. As illustrated in Table 13, Cronbasch’s alpha for the EO scale at 0.84
exceeds this lower limit. Both these diagnostic measures suggest that the EO scale can
be considered reliable.
Page 98
97
Table 13: Reliability analysis EO
Summary for scale: Mean=40.33 Std.Dv.=8.96 Valid N:95 Cronbach alpha: .84 Standardized alpha: .84 Average inter-item corr.: .38
Mean if - deleted
Var. if - deleted
StDv. if - deleted
Itm-Totl - Correl.
Alpha if - deleted
Q20 35.27 65.40 8.09 0.56 0.82
Q21 35.58 61.91 7.87 0.65 0.81
Q22 35.65 69.28 8.32 0.32 0.84
Q23 36.81 64.62 8.04 0.48 0.82
Q24 35.34 64.18 8.01 0.55 0.82
Q25 35.71 60.80 7.80 0.73 0.80
Q26 35.47 58.33 7.64 0.63 0.81
Q27 35.63 63.22 7.95 0.48 0.83
Q28 37.15 68.25 8.26 0.56 0.82
4.2.3 Validity
As previously discussed validity is the extent to which the scale measures the concept
of interest. The researcher used exploratory factor analysis and the multi trait, multi
method (MTMM) matrices to assess validity. Hair et al. (2010) suggest that for samples
greater than 85 but smaller than 100 factor loadings greater than 0.6 are significant.
Exploratory factor analysis assists us investigate the underlying structure of a set of
variables and data reduction (Hair et al. 2010).
As illustrated in Table 14, a statistically significant Bartlett’s test of sphericity (sign
<0.00) and a satisfactory Kaiser-Meyer-Olkin measure of sampling adequacy (0.71)
indicate that sufficient correlations amongst variables exist to proceed with factor
analysis.
Table 14: KMO and Bartlett's Test EO
Page 99
98
Kaiser-Meyer-Olkin Measure of Sampling Adequacy. .71
Bartlett's Test of Sphericity Approx. Chi-Square 575.44
df 105.00
Sig. .00
Table 15 illustrates factor loadings and the number of factors extracted. Component
analysis and orthogonal rotation methods were used. Factors with eigenvalues greater
than 1 and factor loadings greater than 0.5, were considered significant. These results
do not settle the debate, discussed in the literature review, of whether EO is a uni-
dimensional or a multi-dimensional construct since the variables did not load on the
same factor. The items for the sub-construct proactiveness seem to load on the second
factor whereas the items risk taking (Q25) and for innovativeness (Q26) have significant
cross loadings. Irrespective of these inconclusive results, Covin and Slevin’s (1989) has
been validated in numerous studies (Raunch et al., 2009). Thus, it was decided not to
delete any of the items.
Page 100
99
Table 15: Exploratory Factor Analysis EO
Factor Factor
Q20 0.15 0.82*
Q21 0.24 0.85*
Q22 -0.015 0.63
Q23 0.72* 0.12
Q24 0.77* 0.15
Q25 0.69 0.46
Q26 0.51 0.54
Q27 0.46 0.38
Q28 0.79* 0.12
Expl.Var 2.77 2.51
Prp.Totl 0.31 0.28
Extraction: Principal components (Marked loadings are >.70)
Table 16 : Eigenvalues EO
Eigenvalue % Total - variance
Cumulative - Eigenvalue
Cumulative - %
1 4.02 44.71 4.02 44.71
2 1.25 13.93 5.28 58.64
Extraction: Principal components
The MTMM matrices, presented in table 17, were also used to assess convergent
validity. Convergent validity assesses the degree to which measures of the same
construct are correlated. The inter-item correlations between the sub-constructs of EO
are all above 0.3 and significant (p<0.01). This indicates that the scale is measuring its
intended concept.
Page 101
100
Table 17: MTMM EO
Proactiveness Risk taking Innovativeness
Proactiveness 1.00 0.39* 0.42*
Risk taking 0.39* 1.00 0.55*
Innovativeness 0.42* 0.55* 1.00 * Correlation is significant at the 0.01 level (2-tailed)
** Correlation is significant at the 0.05 level (2-tailed)
4.3 Effectuation
4.3.1 Descriptive statistics
Figure 14 illustrates a histogram of effectuation with the normal distribution
superimposed over it. The middle of the distribution is higher than the superimposed
normal curve whilst both the tails are higher than expected. As indicated in Table 18,
kurtosis is slightly positive and skewness is negative. However, they do not represent a
major departure from normality since they are vary slightly from zero. Further, the
Shapiro- Wilks test (p=.51), which calculates the levels of significance for the departure
from normality, also indicates that the actual degree of departure from normality is not
significant.
Page 102
101
Figure 14: Histogram Effectuation
Table 18: Effectuation descriptive statistics
4.3.2 Psychometric properties Effectuation
Initially a MTMM analysis was conducted to test the convergent validity of the
effectuation construct. Chandler et al. (2011) suggest that effectuation is a formative,
multidimensional construct based on their findings of low correlations amongst the
effectuation sub-constructs. They argued that the sub-constructs of formative constructs
Valid N
Std.Dev. Skewness Kurtosis
Effectuation 94.00 0.79 -0.21 0.56
Page 103
102
need not be correlated since they are the defining characteristic of the construct and
may be independent of each other.
Table 19: MTMM Effectuation
Experimentation Affordable loss
Flexibility Pre-commitments
Experimentation
1.00 0.05 0.42* 0.21**
Affordable loss) 0.05 1.00 0.20 0.27*
Flexibility 0.42* 0.20 1.00 0.27*
Pre-commitments 0.21** 0.27* 0.27* 1.00 * Correlation is significant at the 0.01 level (2-tailed) ** Correlation is significant at the 0.05 level (2-tailed)
Table 19 indicates the correlations between the sub-constructs of effectuation. Similar
to Chandler et al. (2011), low inter-item correlations were found between some of the
effectuation sub-constructs. The researcher proceeded to treat effectuation as a
formative construct consisting of reflective first order sub-constructs. The reflective first
order sub-constructs are assessed with commonly used statistics such as Cronbach’s
alpha and exploratory factor analysis even though the second order effectuation sub-
construct is a formative construct (Chandler et al., 2011).
Page 104
103
Table 20: Reliability analysis: Effectuation sub scales
Experimentation: Mean=17.63 Std.Dv.=4.63 Valid N:94 Cronbach alpha: .64 Standardized alpha: .66 Average inter-item corr.: .350
Mean if - deleted Var. if - deleted
StDv. if - deleted Itm-Totl - Correl.
Alpha if - deleted
Q6 14.56 14.59 3.82 0.23 0.72
Q7 12.03 14.39 3.79 0.53 0.52
Q8 12.54 13.55 3.68 0.46 0.55
Q9 13.78 11.00 3.32 0.55 0.47
Affordable loss: Mean=14.5638 Std.Dv.=3.83 Valid N:94 Cronbach alpha: .72 Standardized alpha: .74 Average inter-item corr.: .50 Q7-9 Mean if - deleted Var. if -
deleted StDv. if - deleted Itm-Totl -
Correl. Alpha if - deleted
Q7 9.47 6.97 2.64 0.63 0.52
Q8 10.70 6.85 2.62 0.44 0.80
Q9 8.96 8.36 2.89 0.61 0.58
Affordable loss: Mean=14.93 Std.Dv.=3.84 Valid N:94 Cronbach alpha: .76 Standardized alpha: .75 Average inter-item corr.: .52 Q10-12
Mean if - deleted Var. if - deleted
StDv. if - deleted Itm-Totl - Correl.
Alpha if - deleted
Q10 10.59 6.01 2.45 0.66 0.59
Q11 10.06 6.32 2.51 0.72 0.52
Q12 9.22 9.49 3.08 0.42 0.83
Flexibility: Mean=21.62 Std.Dv.=4.16 Valid N:94 Cronbach alpha: .71 Standardized alpha: .74 Average inter-item corr.: .43 Q13-16
Mean if - deleted Var. if - deleted
StDv. if - deleted Itm-Totl - Correl.
Alpha if - deleted
Q13 15.83 10.82 3.29 0.61 0.60
Q14 16.54 10.21 3.19 0.38 0.75
Q15 15.94 11.10 3.33 0.61 0.60
Q16 16.57 10.07 3.17 0.49 0.66
Pre-commitments: Mean=14.92 Std.Dv.=2.61 Valid N:94 Cronbach alpha: -.10 Standardized alpha: --- Average inter-item corr.: -.003 Q17-19
Mean if - deleted Var. if - deleted
StDv. if - deleted Itm-Totl - Correl.
Alpha if - deleted
Q17 9.79 3.72 1.93 0.11 0.00
Q18 9.78 4.17 2.04 0.12 0.00
Q19 10.29 6.08 2.47 -0.27 0.60
Pre-commitments: Mean=10.29 Std.Dv.=2.48 Valid N:94 Cronbach alpha: .60 Standardized alpha: .60 Average inter-item corr.: .43 Q17-18
Mean if - deleted Var. if - deleted
StDv. if - deleted Itm-Totl - Correl.
Alpha if - deleted
Q17 5.149 1.893 1.376 0.427
Q18 5.138 2.374 1.541 0.427
Page 105
104
Table 20 illustrates the reliability analysis for the effectuation sub-scales:
experimentation, affordable loss, flexibility and partnerships. For the experimentation
scale the inter-item correlation (0.35) exceeds the recommended 0.30 (Hair et al.,
2010). However, the total to item correlation of Q6 is 0.23. Cronbach’s alpha of 0.64 is
also below 0.7. We deleted Q6 resulting in improved item-to-total correlations for Q7,
Q8 and Q9 and a satisfactory Cronbach’s alpha (0.72). Similarly Q19 had a negative
item to total correlations of -0.27 and the pre-commitments subscale a Cronbach’s
alpha of -0.1. Q19 was deleted and the Cronbach’s alpha improved to 0.6, similar to
what Chandler et al. (2011) found in their validation study. The flexibility and affordable
loss sub scales yielded satisfactory results on both these diagnostic measures.
4.3.3 Validity Effectuation
The researcher proceeded to test the first order effectuation sub-constructs for validity.
As illustrated in Table 21 statistically significant Bartlett’s test of sphericity (sign <0.00)
and a satisfactory Kaiser-Meyer-Olkin measure of sampling adequacy (0.647) indicate
we could proceed with factor analysis.
Table 21: KMO and Bartlett's Test Effectuation
Kaiser-Meyer-Olkin Measure of Sampling Adequacy.
.647
Bartlett's Test of Sphericity Approx. Chi-Square
384.731
df 66
Sig. 0.00
Page 106
105
Table 22 illustrates factor loadings and the number of factors extracted. Component
analysis and orthogonal rotation methods were used. Factors with eigenvalues greater
than 1 and factor loadings greater than 0.5, were considered significant. These results
confirm the findings of Chandler et al. (2011) that effectuation is a multi-dimensional
construct with four sub-constructs: experimentation, affordable loss, flexibility and pre-
commitments. The factors loaded cleanly on the four effectuation sub-constructs and
there were no significant cross loadings. As table 23 illustrates, the four factors explain
69% of the variance.
Table 22: Factor Loadings Effectuation
Factor Factor Factor Factor
Q7: 0.14 -0.09 0.89* 0.01
Q8 0.13 0.05 0.88* 0.06
Q9 0.32 0.04 0.51 0.27
Q10 0.17 0.85* -0.06 0.13
Q11 -0.09 0.90* -0.06 0.09
Q12 0.05 0.66* 0.22 0.00
Q13 0.76* -0.02 0.09 0.38
Q14 0.49 0.31 0.09 0.18
Q15 0.78* 0.02 0.37 0.06
Q16 0.81* 0.05 0.08 -0.14
Q17 0.17 0.22 0.04 0.74*
Q18 0.00 0.07 0.06 0.86*
Expl.Var 2.28 2.13 2.05 1.59
Prp.Totl 0.19 0.18 0.17 0.13
Extraction: Principal components (Marked loadings are >.70)
Page 107
106
Table 23: Eigenvalues Effectuation
Eigenvalue % Total - variance
Cumulative Eigenvalue
Cumulative - %
1 4.08 33.98 4.08 33.98
2 1.99 16.61 6.07 50.59
3 1.15 9.57 7.22 60.16
4 1.10 9.18 8.32 69.34
Extraction: Principal components
4.4 Measurement aspects of Performance
4.4.1 Descriptive statistics
Figure 15 illustrates a histogram of performance with the normal distribution
superimposed over it. The middle of the distribution is higher than the superimposed
normal curve whilst both the tails are higher than expected. As indicated in Table 24,
kurtosis is slightly positive and skewness is negative. However, they do not represent a
major departure from normality since they vary slightly from zero. Further, the Shapiro-
Wilks test (p=.12), which calculates the levels of significance for the departure from
normality, also indicates that the actual degree of departure from normality is not
significant.
Page 108
107
Figure 15: Performance normality test
Table 24: Performance descriptive statistics
4.4.2 Psychometric properties Performance
Table 25 illustrates the reliability analysis for performance. For the scale, the inter-item
correlation (0.37) exceeds the recommended 0.30 (Hair et al., 2010). Further, except for
Q40 (0.14), item-to-total correlations of all variables are close to or exceed the
recommended 0.5 (Hair et al., 2010). We deleted item Q40. Secondly, Hair et al. (2010)
suggest researchers should use as a diagnostic measure a reliability coefficient, with
Cronbach’s alpha being the most commonly used. The recommended lower limit for
Valid N
Std.Dev. Skewness Kurtosis
Performance 90.00 0.92 -0.55 0.69
Page 109
108
Cronbach’s alpha is 0.7. Cronbach’s alpha for the performance scale at 0.86 exceeds
this lower limit. Both these diagnostic measures suggest that the EO scale can be
considered reliable.
Table 25: Reliability Performance
Summary for scale: Mean=53.14 Std.Dv.=11.3035 Valid N:90 Cronbach alpha: .86 Standardized alpha: .87 Average inter-item corr.: .37
Mean if - deleted
Var. if - deleted
StDv. if - deleted
Itm-Totl - Correl.
Alpha if - deleted
Q29: Over the past 5 years, our financial performance has exceeded our expectations
49.12 98.08 9.90 0.71 0.83
Q30: Over the past 5 years, our financial performance has exceeded that of our competitors
48.70 104.08 10.20 0.69 0.84
Q31: Over the past 5 years, we have been more profitable than our competitors have
48.70 106.08 10.30 0.67 0.84
Q32: Over the past 5 years, our revenue (sales) growth has exceeded our expectations
49.19 100.04 10.00 0.74 0.83
Q33: Over the past 5 years, our revenue growth rate has exceeded that of our competitors
48.90 105.45 10.27 0.70 0.84
Q34: Over the past 5 years, our customer satisfaction has been outstanding
48.16 109.94 10.49 0.47 0.85
Q35: Over the past 5 years, our customer satisfaction has exceeded that of our competitors
48.20 112.91 10.63 0.46 0.85
Q36: Last year, our market was share much higher than that of our competitors
48.88 109.10 10.44 0.48 0.85
Q37: Our company is better at introducing new products and services to the market than our competitors
48.76 106.18 10.30 0.62 0.84
Q38: Last year, the percentage of our new products in the existing product portfolio exceeded that of our competitors
49.08 108.27 10.41 0.55 0.85
Q39: Over the last year, we have introduced innovations for work processes and methods
47.86 113.60 10.66 0.36 0.86
Q40: We have innovations under intellectual property protection
49.02 116.83 10.81 0.14 0.88
4.4.3 Validity Performance
As illustrated in Table 26 a statistically significant Bartlett’s test of sphericity (sig <0.00)
and a satisfactory Kaiser-Meyer-Olkin measure of sampling adequacy (0.769) indicate
Page 110
109
that sufficient correlations amongst variable exist and the researcher could proceed with
factor analysis.
Table 26: KMO and Bartlett's Test Performance
KMO and Bartlett's Test
Kaiser-Meyer-Olkin Measure of Sampling Adequacy. .769
Bartlett's Test of Sphericity Approx. Chi-Square 542.024
df 66
Sig. .000
Exploratory factor analysis is used to test the validity of the performance scale. Table 27
illustrates factor loadings and the number of factors extracted. Component analysis and
orthogonal rotation methods were used. Factors with eigenvalues greater than 1 and
factor loadings greater than 0.5, were considered significant. These results seem to
confirm Venkataraman and Ramanujam’s (1986) view that performance is a multi-
dimensional construct since the variables did not load on the same factor.
Q29-Q33 loaded on the same factor. This was characterized as financial performance.
The items Q34-Q36 were characterized as market performance (Vankataraman and
Ramanujam, 1986). Q36 did not load as expected, however market share has been
generally deemed to be a component of market performance (Vankataraman and
Ramanujam, 1986) and thus it was included as a component of the market performance
sub-construct. The items Q37-39 all significantly loaded on the same factor and they
were characterized as innovative performance. Table 28 indicates that there were three
factors with eigenvalues greater than 1 and they explained cumulatively 70% of the
variance.
Page 111
110
Table 27: Factor Loadings Performance
Factor Factor Factor
Q29 0.80* 0.29 0.08
Q30 0.86* 0.12 0.20
Q31 0.89* 0.09 0.14
Q32 0.73* 0.32 0.26
Q33 0.76* 0.19 0.32
Q34 0.17 0.16 0.90*
Q35 0.23 0.07 0.88*
Q36 0.26 0.54 0.27
Q37 0.21 0.83* 0.25
Q38 0.30 0.78* -0.02
Q39 0.04 0.60* 0.15
Expl.Var 3.55 2.22 1.99
Prp.Totl 0.32 0.20 0.18
Extraction: Principal components (Marked loadings are >.700000)
Table 28: Eigenvalues Performance
Eigenvalue % Total - variance
Cumulative - Eigenvalue
Cumulative - %
1.00 5.18 47.07 5.18 47.07
2.00 1.33 12.10 6.51 59.17
3.00 1.25 11.36 7.76 70.53
Extraction: Principal components
The MTMM matrices, illustrated in table 29, were also used to assess the convergent
validity of performance. Convergent validity assesses the degree to which measures of
the same construct are correlated. The inter-item correlations between the sub-
constructs of performance are all above 0.3 and significant (p<0.01). This indicates that
the scale is measuring its intended concept.
Page 112
111
Table 29: MTMM Performance
Performance: Financial
Performance: Market Performance: Innovativeness
Performance: Financial 1.00 0.47* 0.44*
Performance: Market 0.47* 1.00 0.38*
Performance: Innovativeness
0.43* 0.38* 1.00
* Correlation is significant at the 0.01 level (2-tailed)
** Correlation is significant at the 0.05 level (2-tailed)
4.5 Measurement aspects of Hostility
4.5.1 Descriptive Statistics
Figure 16 illustrates a histogram of environmental hostility with the normal distribution
superimposed over it. The middle of the distribution is slightly higher than the
superimposed normal curve whilst both the tails are higher than expected. The
ditribution is skewed to the right. As indicated in Table 30, kurtosis and skewness are
slightly negative. They do not represent a major departure from normality though since
they are slightly below zero. Further, the Shapiro- Wilks test (p=.06), which calculates
the levels of significance for the departure from normality, also indicates that the actual
degree of departure from normality is not significant.
Page 113
112
Figure 16: Hostility normality test
Table 30: Hostility descriptive statistics
4.5.2 Psychometric properties Environmental hostility
Table 31 illustrates the reliability analysis for environmental hostility. The inter-item
correlation (0.29) is below the recommended 0.30 (Hair et al., 2010). Further the item-
to-total correlations of Q44 (0.2) is below the recommended 0.5 (Hair et al., 2010). We
deleted item Q44. The resulting item-to-total correlations were satisfactory and the
average inter-item correlation improved to 0.37. Secondly, Hair et al. (2010) suggests
researchers should use as a diagnostic measure a reliability coefficient, with Cronbach’s
alpha being the most commonly used. The recommended lower limit for Cronbach’s
Valid N
Std.Dev. Skewness Kurtosis
Hostility 88.00 1.09 -0.49 -0.03
Page 114
113
alpha is 0.7. Cronbach’s alpha for the environmental hostility scale at 0.73 exceeds this
lower limit. Both these diagnostic measures suggest that the environmental hostility
scale can be considered reliable.
Table 31: Reliabilty Analysis Hostility
Summary for scale: Mean=27.45 Std.Dv.=6.35 Valid N:89 Cronbach alpha: .70 Standardized alpha: .70 Average inter-item corr.: .29
Mean if - deleted
Var. if - deleted
StDv. if - deleted
Item-Tot l - Correl.
Alpha if - deleted
Q41 22.98 29.19 5.40 0.45 0.65
Q42 23.16 29.64 5.44 0.41 0.66
Q43 21.90 30.72 5.54 0.49 0.65
Q44 23.35 33.04 5.75 0.20 0.73
Q45 22.96 27.10 5.21 0.53 0.62
Q46 22.91 26.35 5.13 0.53 0.62
Summary for scale: Mean=23.35 Std.Dv.=5.78 Valid N:89 Cronbach alpha: .73 Standardized alpha: .74 Average inter-item corr.: .37 Mean if -
deleted Var. if - deleted
StDv. if - deleted
Itm-Totl - Correl.
Alpha if - deleted
Q41 18.88 22.29 4.72 0.53 0.67
Q42 19.06 23.22 4.82 0.44 0.70
Q43 17.80 24.18 4.92 0.53 0.68
Q45 18.85 21.16 4.60 0.55 0.66
Q46 18.81 21.97 4.69 0.44 0.71
4.5.3 Validity Hostility
Once again exploratory factor analysis is used to test validity. Table 33 illustrates factor
loadings and the number of factors extracted. Component analysis and orthogonal
rotation methods were used. Factors with eigenvalues greater than 1 and factor
loadings greater than 0.5, were considered significant. Our results seem to suggest that
hostility is a multi-dimensional construct with two sub-constructs. They were
characterized as riskiness and competition. As illustrated in Table 32 a statistically
Page 115
114
significant Bartlett’s test of sphericity (sign <0.00) and a satisfactory Kaiser-Meyer-Olkin
measure of sampling adequacy (0.642) indicate that sufficient correlations amongst
variable exist and the researcher could proceed with factor analysis.
Table 32: KMO and Bartlett's Test Hostility
KMO and Bartlett's Test
Kaiser-Meyer-Olkin Measure of Sampling Adequacy. .642
Bartlett's Test of Sphericity Approx. Chi-Square 93.920
df 10
Sig. .000
Table 33: Factor Loadings Hostility
Factor Loadings (Varimax raw) Extraction: Principal components (Marked loadings are >.700000)
Factor Factor
Q41 0.24 0.84*
Q42 0.08 0.90*
Q43 0.81* 0.17
Q44 0.85* 0.15
Q45 0.67 0.19
Expl.Var 1.90 1.61
Prp.Totl 0.38 0.32
Extraction: Principal components (Marked loadings are >.70)
As Table 33 indicates, there were two factors with eigenvalues greater than 1 and they
explained cumulatively 70.22% of the variance.
Page 116
115
Table 34: Eigenvalues Environmental hostility
Eigenvalue % Total - variance
Cumulative - Eigenvalue
Cumulative - %
1 2.45 48.91 2.45 48.91
2 1.07 21.31 3.51 70.22
Extraction: Principal components
MTMM matrices were also used to assess the convergent validity of hostility.
Convergent validity assesses the degree to which to measures of the same construct
are correlated. The inter-item correlations between the sub-constructs of environmental
hostility are all above 0.3 and significant (p<0.01). This indicates that the scale is
measuring its intended concept.
Table 35: MTMM Environmental Hostility
Hostility: Riskiness Hostility: Competition
Hostility: Riskiness 1.000000 0.332524*
Hostility: Competition 0.332524* 1.000000 * Correlation is significant at the 0.01 level (2-tailed)
** Correlation is significant at the 0.05 level (2-tailed)
4.6 Discriminant validity: EO and effectuation
Exploratory factor analysis provides an empirical basis for judging the structure of the
variables (Hair et al., 2010). Factor analysis provides the tools for analyzing the
structure of the correlations of a large number of variables by extracting factors. If
researchers have a conceptual basis for understanding the relationships between
variables, then the dimensions may have meaning for what they collectively represent
(Hair, 2010).
Page 117
116
Discriminant validity is the degree to which two conceptually similar concepts are
distinct (Hair et al., 2010). The researcher conducted exploratory factor analysis in order
to help determine whether the sub-constructs of effectuation load differently from EO.
As illustrated in Table 36 statistically significant Bartlett’s test of sphericity (sig <0.00)
and a satisfactory Kaiser-Meyer-Olkin measure of sampling adequacy (0.708) indicate
we could proceed with factor analysis.
Table 36: KMO and Bartlett's Test EO and Effectuation
Kaiser-Meyer-Olkin Measure of Sampling Adequacy. .708
Bartlett's Test of Sphericity
Approx. Chi-Square 881.586
df 210
Sig. .000
Component analysis and orthogonal rotation methods were used. Table 37 illustrates
factor loadings and the number of factors extracted. Factors with eigenvalues greater
than 1 and factor loadings greater than 0.5, were considered significant. The results
seem to indicate that effectuation sub-constructs are distinct from EO. As expected and
confirmed by the Scree test in figure 17, seven factors were extracted representing:
experimentation, affordable loss, flexibility, pre-commitments, proactiveness, risk taking
and innovativeness. The factors all had eigenvalues above 1 and collectively explained
more than 71% of the variance. The variables Q7 and Q8, of the experimentation sub-
construct, loaded together whereas Q9 did not. Q9 (“The product/service that my
company now provides is substantially different than we first imagined”) loaded with the
Page 118
117
risk taking (Q23-Q25) sub-construct of EO. Similarly Q29 (“At my company, there have
been considerable changes in our product or service lines”), a variable of the sub-
construct innovativeness, loaded on the risk taking sub-construct of EO. Both Q9 and
Q29 seem to indicate launching new initiatives and thus assuming risk. As a result the
cross loadings were not deemed to be a major concern.
Overall the results indicate that the constructs are distinct since items that are theorized
to load on the same construct actually did, providing evidence of convergence validity
(Chandler et al. 2011). Further, the EO and effectuation items loaded on different
constructs, providing evidence of discriminant validity (Chandler et al. 2011).
Page 119
118
Table 37: Factor loadings EO and Effectuation
Factor Factor Factor Factor Factor Factor Factor
Q7 0.11 -0.11 -0.01 0.13 -0.01 0.83* 0.36
Q8 0.34 0.04 0.12 0.13 0.06 0.82* 0.03
Q9 0.53 0.15 -0.30 0.33 0.06 0.28 0.25
Q10 0.07 0.87* 0.00 0.16 0.09 -0.08 0.05
Q11 0.00 0.92* -0.01 -0.08 0.06 -0.03 -0.06
Q12 -0.34 0.53 0.29 0.09 0.15 0.37 0.02
Q13 0.00 -0.01 0.05 0.74* 0.33 0.02 0.38
Q14 -0.15 0.29 -0.14 0.56 0.14 0.25 -0.09
Q15 0.21 0.00 0.19 0.77* 0.06 0.27 0.09
Q16 0.23 0.08 0.02 0.75* -0.12 0.02 -0.04
Q17 0.15 0.26 0.04 0.15 0.72* -0.04 0.03
Q18 -0.03 0.06 -0.09 0.05 0.85* 0.07 0.09
Q20 0.02 -0.07 0.68 0.31 -0.04 0.17 0.27
Q21 0.03 -0.09 0.51 0.30 -0.17 0.18 0.61
Q22 0.15 0.17 0.75* -0.10 -0.03 -0.04 0.01
Q23 0.73* 0.04 0.17 0.13 0.08 0.10 0.12
Q24 0.65 -0.16 0.29 0.10 0.23 0.34 -0.08
Q25 0.41 -0.13 0.36 0.40 0.33 0.27 0.30
Q26 0.20 -0.18 0.21 0.18 0.06 0.23 0.67
Q27 0.16 0.14 0.00 -0.01 0.21 0.15 0.79*
Q28 0.69 0.08 -0.07 0.12 -0.16 0.28 0.38
Expl.Var 2.36 2.21 1.84 2.64 1.70 2.12 2.14
Prp.Totl 0.11 0.11 0.09 0.13 0.08 0.10 0.10
Extraction: Principal components (Marked loadings are >.70)
Table 38: Eigenvalues EO and Effectuation
Eigenvalues (Data all2 corrected) Extraction: Principal components
Eigenvalue % Total - variance
Cumulative - Eigenvalue
Cumulative - %
1.00 5.78 27.53 5.78 27.53
2.00 2.53 12.04 8.31 39.57
3.00 1.66 7.89 9.97 47.47
4.00 1.50 7.14 11.47 54.61
5.00 1.33 6.34 12.80 60.95
6.00 1.18 5.63 13.98 66.58
7.00 1.04 4.95 15.02 71.53 Extraction: Principal components
Page 120
119
Figure 17: Scree Test EO and Effectuation
4.6.1 Discriminant validity MTMM EO and Effectuation
Table 39: MTMM EO and Effectuation
experimentation
affordable loss flexibility Pre-commitments
Proactiveness 0.26* 0.05 0.27* 0.00
Risk taking 0.54* -0.01 0.38* 0.25*
Innovativeness 0.55* 0.01 0.31* 0.16 * Correlation is significant at the 0.01 level (2-tailed)
** Correlation is significant at the 0.05 level (2-tailed)
The MTMM matrices were also used to assess the discriminant validity between EO
and effectuation. As indicated in table 39 the inter-item correlations between the sub-
constructs flexibility and experimentation and risk taking and innovativeness are all
above 0.3 and significant (p<0.01). This tends to contradict the notion that effectuation
and EO are distinct. However, Chandler (2011) argues that the four sub-constructs of
Page 121
120
effectuation are best represented as four independent factors that provide unique and
important facet of effectuation. Secondly, factor analysis does not indicate double
loading between experimentation, flexibility and EO. Thirdly, the sub-constructs
affordable loss and pre-commitment show very low or negative correlations with the
sub-constructs of EO. Fourthly, there is theoretical and empirical support for the strong
and significant correlation between experimentation and flexibility and EO, as EO is
associated with experimenting, freely associating and entering into new product markets
(Wiklund and Shepherd, 2011). Lastly, effectuation has been associated with
uncertainty by Sarasvathy (2001a, 2001b). Using environmental hostility as a proxy we
find that environmental hostility is positively correlated with effectuation (p=0.030) and
flexibility (p=0.044) whereas there is no significant relation with EO or its sub-constructs.
This provides further evidence of predictive and discriminant validity.
4.7 Discriminant validity: Environmental hostility and effectuation
Exploratory factor analysis was conducted in order to help determine whether the sub-
constructs of effectuation differ from environmental hostility. As illustrated in Table 40
statistically significant Bartlett’s test of sphericity (sig <0.00) and a satisfactory Kaiser-
Meyer-Olkin measure of sampling adequacy (0.640) indicate the researcher could
proceed with factor analysis.
Page 122
121
Table 40: KMO and Bartlett's Test Hostility and Effectuation
Kaiser-Meyer-Olkin Measure of Sampling Adequacy.
.640
Bartlett's Test of Sphericity
Approx. Chi-Square 524.307
df 153
Sig. .000
Component analysis and orthogonal rotation methods were used. Table 41 illustrates
factor loadings and the number of factors extracted. Factors with eigenvalues greater
than 1 and factor loadings greater than 0.5, were considered significant. Our results
seem to indicate that the effectuation sub-constructs are distinct from environmental
hostility. As expected and confirmed by the Scree test in figure 18, five factors were
extracted representing: experimentation, affordable loss, flexibility, pre-commitments,
riskiness and competition. The factors all had eigenvalues above 1 and collectively
explained more than 69% of the variance. The items loaded cleanly on the constructs
they were theorized to load on.
Overall the results indicate that the constructs are distinct since items that are theorized
to load on the same construct actually did, providing evidence of convergence validity
(Chandler et al. 2011). Further, environmental hostility and effectuation items loaded on
different constructs, providing evidence of discriminant validity (Chandler et al. 2011).
Page 123
122
Table 41: Factor loadings Effectuation and Environmental Hostility
Factor Factor Factor Factor Factor Factor
Q7 0.89* -0.05 0.02 -0.03 0.18 -0.02
Q8 0.91* 0.02 0.05 0.08 0.13 0.11
Q9 0.46 0.09 -0.08 0.37 0.32 0.33
Q10 -0.06 0.84* -0.04 0.16 0.17 0.16
Q11 -0.04 0.89* -0.01 0.13 -0.12 0.09
Q12 0.27 0.62* 0.30 -0.37 0.09 -0.04
Q13 0.08 -0.01 0.18 -0.02 0.76* 0.36
Q14 0.07 0.30 0.16 0.19 0.44 0.23
Q15 0.37 0.04 0.07 -0.01 0.78* 0.04
Q16 0.13 0.01 -0.07 0.09 0.81* -0.13
Q17 0.08 0.15 0.05 0.06 0.15 0.76*
Q18 0.06 0.12 0.00 -0.13 0.00 0.83*
Q41 0.10 0.07 0.27 0.79* -0.01 -0.07
Q42 0.01 0.19 0.13 0.78* 0.08 -0.04
Q43 0.16 -0.06 0.74* 0.18 0.15 -0.03
Q45 0.00 -0.03 0.84* 0.14 0.09 0.11
Q46 -0.08 0.22 0.68* 0.10 -0.10 -0.07
Expl.Var 2.12 2.11 1.97 1.70 2.30 1.66
Prp.Totl 0.12 0.12 0.12 0.10 0.14 0.10
Extraction: Principal components (Marked loadings are >.70)
Figure 18: Scree Test Effectuation and Hostility
Page 124
123
Table 42: Eigenvalues Effectuation and Hostility
Eigenvalues (Data all2 corrected) Extraction: Principal components
Eigenvalue % Total - variance
Cumulative - Eigenvalue
Cumulative - %
1 3.89 22.90 3.89 22.90
2 2.27 13.38 6.17 36.28
3 1.96 11.55 8.13 47.83
4 1.33 7.80 9.46 55.63
5 1.27 7.44 10.72 63.08
6 1.13 6.65 11.85 69.73
Extraction: Principal components
4.7.1 Discriminant validity Effectuation and Hostility
Table 43: MTMM Effectuation and Hostility
experimentation
affordable loss flexibility Pre-commitments
Riskiness 0.17 0.16 0.18 0.00
Competition 0.09 0.14 0.17 0.04
The MTMM matrices were also used to assess the discriminant validity between EO
and effectuation. As indicated in Table 43 the inter-item correlations between the sub-
constructs are all below 0.3 and not significant (p>0.1). This provides evidence of that
effectuation and environmental hostility are distinct.
4.8 T-tests: high technology vs medium technology
The researcher used the t-test to assess whether there were significant differences
between high technology and medium technology firms. Low technology firms (N=7)
were disregarded due to the small sample size. The Z and the t-test are used to test for
the differences between two means (Cooper and Schindler, 2011). The t-test is used
when the sample size is small (Cooper and Schindler, 2011). As the results in table 44
Page 125
124
indicate there were no significant differences amongst the dependent variables-
performance and effectuation. However, there was a slight difference on EO (p=0.05)
and innovatiness (p=0.01) though. Contrary to our expectations, this difference did not
translate into performance outcomes, even innovative performance. The researcher
concluded that there were no material differences and grouped all the respondents
when performing regression analysis.
Page 126
125
Table 44: T-tests; Grouping: Level of technological advancement of your firm (Group 1: high tech Group 2: medium tech)
Mean - high tech
Mean - medium tech
t-value
df p Valid N - high tech
Valid N - medium tech
Std.Dev. - high tech
Std.Dev. - medium tech
F-ratio - Variances
p - Variances
d Result
Effectuation 5.20 5.06 0.81 86.00 0.42 34.00 54.00 0.83 0.75 1.24 0.47 0.18 No difference
EO 4.78 4.39 1.97 86.00 0.05** 34.00 54.00 0.84 0.93 1.24 0.51 0.44 Slight difference
Performance 4.59 4.48 0.53 82.00 0.59 32.00 52.00 0.91 0.89 1.04 0.87 0.12 No difference
Hostility 4.79 4.58 0.82 80.00 0.41 31.00 51.00 0.95 1.21 1.62 0.16 0.19 No difference
Experimentation 5.18 4.73 1.67 86.00 0.10 34.00 54.00 1.27 1.17 1.17 0.59 0.37 No difference
Affordable loss 4.86 5.00 -0.49 86.00 0.62 34.00 54.00 1.54 1.09 2.00 0.02 0.11 No difference
Flexibility 5.46 5.37 0.43 86.00 0.67 34.00 54.00 1.00 1.07 1.15 0.68 0.09 No difference
Pre-commitments 5.24 5.06 0.64 86.00 0.52 34.00 54.00 1.26 1.28 1.03 0.94 0.14 No difference
Proactiveness 5.02 4.78 0.99 86.00 0.33 34.00 54.00 1.25 0.97 1.65 0.10 0.22 No difference
Risk taking 4.57 4.33 0.89 86.00 0.38 34.00 54.00 1.31 1.15 1.30 0.39 0.20 No difference
Innovativeness 4.75 4.06 2.83 86.00 0.01* 34.00 54.00 1.02 1.18 1.34 0.37 0.63 Moderate difference
Performance: Financial 4.42 4.23 0.69 82.00 0.49 32.00 52.00 1.18 1.25 1.12 0.74 0.16 No difference
Performance: Market 4.69 4.78 -0.38 82.00 0.71 32.00 52.00 1.22 0.90 1.81 0.06 0.09 No difference
Performance: Innovativeness 4.76 4.59 0.72 82.00 0.47 32.00 52.00 0.92 1.13 1.50 0.23 0.16 No difference
Hostility: Riskiness 4.60 4.20 1.22 80.00 0.23 31.00 51.00 1.21 1.56 1.66 0.14 0.28 No difference
Hostility: Competition 4.92 4.84 0.28 80.00 0.78 31.00 51.00 1.15 1.38 1.45 0.28 0.06 No difference
* P-value is significant at the 0.01 level (2-tailed)
** P-value is significant at the 0.05 level (2-tailed)
Page 127
126
4.8 Structural aspects of the model
4.8.1 Rationale based on correlations
A correlation matrix is computed to assess the relation between variables before
regression analysis was conducted and to assess potential multicollinearity. The
correlation matrix for our sample is displayed in Table 45. The pairwise correlation
coefficients between the independent variables (IVs) seem to indicate multicollinearity is
not an issue (Hair et al., 2010).
Further, based on table 45 we observe that correlation coefficients range from -0.23 to
0.90. The correlations are moderate, although some are statistically significant. Cooper
and Chandler (2001) suggest correlations above 0.4 are moderate to strong and should
be large enough to be statistically significant at p=0.05 or below. In the correlation
matrix displayed in table 45, there are 59 significant correlations at p=0.05. The
correlation matrix seems to confirm that:
• EO is positively correlated to performance (r= 0.42, p<0.01),
• Environmental hostility is negatively correlated to financial performance (r=-0.23,
p<0.05)
• Innovativeness is positively correlated to innovative performance (r= 0.54,
p<0.01)
These results seem to further enhance the reliability and the nomological validity of this
research.
Page 128
127
Table 45: Correlation Matrix
Effectuation EO Performance Hostility experimentation affordable loss)
flexibility Pre-commitments
Proactiveness Risk taking
Innovativeness Financial Perform
Market Perform
Innovative Perform
Riskiness Competition
Effectuation 1.00
EO 0.46* 1.00
Performance 0.17** 0.42* 1.00
Hostility 0.23** 0.07 -0.06 1.00
experimentation 0.67* 0.57* 0.18 0.15 1.00
affordable loss 0.59* 0.02 -0.14 0.18 0.05 1.00
flexibility 0.76* 0.40* 0.33* 0.22** 0.42* 0.20 1.00
Pre-commitments
0.58* 0.18 0.04 0.03 0.21** 0.27* 0.27* 1.00
Proactiveness 0.24** 0.74* 0.29* 0.14 0.26** 0.05 0.27* 0.00 1.00
Risk taking 0.45* 0.82* 0.29* 0.04 0.54* -0.01 0.38* 0.25** 0.39* 1.00
Innovativeness 0.41* 0.83* 0.43* 0.01 0.55* 0.01 0.31* 0.16 0.42* 0.55* 1.00
Financial Perform
0.06 0.30* 0.90* -0.17 0.08 0.19 0.22** 0.01 0.22** 0.14 0.35* 1.00
Market Perform
0.06 0.20** 0.72* 0.02 0.02 -0.13 0.21** 0.04 0.13 0.19 0.16 0.47* 1.00
Innovative Perform
0.38* 0.56* 0.70* 0.11 0.39* 0.05 0.42* 0.07 0.36* 0.45* 0.54* 0.44* 0.38* 1.00
Hostility: Riskiness
0.21** 0.04 -0.09 0.76* 0.17 0.16 0.18 0.00 0.02 0.07 0.00 -0.23** 0.09 0.08 1.00
Hostility: Competition
0.18** 0.08 -0.02 0.87* 0.09 0.14 0.17 0.04 0.18 0.01 0.01 -0.06 -0.04 0.10 0.33* 1.00
* Correlation is significant at the 0.01 level (2-tailed) ** Correlation is significant at the 0.05 level (2-tailed)
Page 129
128
4.8.2 Predictive hypotheses- simple regression
As discussed in chapter 3, ordinary least squares (OLS) regression was used to test the
hypotheses. The objective of regression analysis is to predict a single dependent
variable from the knowledge of one or more independent variables. When the problem
involves a single dependent variable, the technique is called simple regression. In the
simple regression model the intercept and the coefficient are estimated by minimizing
the sum of the least squares. Prediction accuracy was assessed based on the
coefficient of determination (R2), which is the ratio of the sum of squares of regression
to the total sum of squares. The R2 assess the strength of the relationship, i.e. it
indicated the percentage of variance of the dependent variable (DV) that is accounted
for by the independent variable (IV).
In this study the IVs are EO, effectuation and its sub-constructs (experimentation,
affordable loss, flexibility and pre-commitments) and hostility. The DVs are performance
and its sub-constructs financial, market and innovative performance and effectuation
and its sub-constructs.
As previously indicated all the cases were grouped and firm size (small number of
respondents younger than 3) and level of technology (t-test showed no significant
difference) were not used as control variables.
A summary of the regression results is presented in table 46.
Page 130
129
4.8.3 Testing hypothesis H1, H1a and H1b
The hypotheses predict a positive relationship between the IV, EO and the DVs,
effectuation, experimentation and flexibility. The residual histograms for all three
regression models seem to indicate normal, bell-shaped distributions, thus the
assumption of normality is confirmed. Further, the residual scatterplots seem to be fairly
random, as a result it was concluded that the residuals are independent and have
constant variance. In addition, there are no substantial outliers. Consequently, that all
three regression models are deemed satisfactory. The R square for H1 (0.21, sig=0.00)
suggests that EO accounts for 21% of the variation in effectuation. Likewise, the R
square for H1a (0.32, sig=0.00) suggests that EO accounts for 32% of the variation in
experimentation. Similarly, the R square for H1b (0.16, sig=0.00) suggests that EO
accounts for 16% of the variation in flexibility.
4.8.4 Testing hypothesis H2
The hypotheses predict a positive relationship between the IV, environmental hostility
and the DV, effectuation. Normality, independence, the absence of significant outliers
and constant variance are confirmed. Consequently, the regression model is deemed
acceptable. The R square for H2 (0.05, sig=0.05) suggests that environmental hostility
accounts for 5% of the variation in effectuation.
Page 131
130
Table 46: A summary of the regression results
Hypothesis R2 base significance Predictor1 Result
H1: EO positively predicts effectuation 0.21* 0.00 EO Supported
H1a: EO positively predicts experimentation 0.32* 0.00 EO Supported
H1b: EO positively predicts flexibility 0.16* 0.00 EO Supported
H2: Hostility positively predicts effectuation 0.05** 0.03 Hostility
Supported
H3: EO positively predicts performance 0.18* 0.00 EO Supported
H3a: EO positively predicts financial performance 0.09* 0.00 EO Supported
H3b: EO positively predicts market performance 0.04** 0.05 EO Supported
H3c: EO positively predicts innovative performance 0.32** 0.00 EO Supported
H4: Effectuation positively predicts performance 0.03 0.10 Effectuation Not supported
H4a: Effectuation positively predicts financial performance 0.00 0.58 Effectuation Not supported
H4b: Effectuation positively predicts market performance 0.00 0.59 Effectuation Not supported
H4c: Effectuation positively predicts innovative performance 0.15* 0.00 Effectuation Supported
H5: Flexibility positively predicts performance 0.11* 0.00 Flexibility Supported
H5a: Flexibility positively predicts financial performance 0.05** 0.04 Flexibility Supported
H5b: Flexibility positively predicts market performance 0.04** 0.05 Flexibility Supported
H5c: Flexibility positively predicts innovative performance 0.18* 0.00 Flexibility Supported
H6: Experimentation positively predicts performance 0.03 0.10 Experimentation Not supported
H6a: Experimentation positively predicts financial performance 0.01** 0.46 Experimentation Supported
H6b: Experimentation positively predicts market performance 0.00 0.86 Experimentation Not supported
H6c: Experimentation positively predicts innovative performance 0.15* 0.00 Experimentation Supported
H7: Affordable loss positively predicts performance 0.02 0.19 Affordable loss Not supported
H7a: Affordable loss positively predicts financial performance 0.03
0.08
Affordable loss Not supported
H7b: Affordable loss positively predicts market performance 0.02 0.21
Affordable loss Not supported
H7c: Affordable loss positively predicts innovative performance 0.00 0.65 Affordable loss Not supported
H8: Pre- commitments positively predicts performance 0.00
0.70
Pre-commitments
Not supported
H8: Pre-commitments positively predicts financial performance 0.00
0.92
Pre-commitments
Not supported
H8: Pre-commitments positively predicts market performance 0.00
0.72
Pre-commitments
Not supported
H8: Pre-commitments positively predicts innovative performance 0.01 0.49 Pre-commitments
Not supported
* P-value is significant at the 0.01 level (2-tailed) **P-value is significant at the 0.05 level (2-tailed)
Page 132
131
4.8.5 Testing hypothesis H3, H3a, H3b and H3c
The hypotheses predict a positive relationship between the IV, EO and the DVs,
performance, innovative performance, financial performance and market performance.
Normality, independence, the absence of significant outliers and constant variance are
confirmed. Consequently, all four regression models are deemed satisfactory. The R
square for H3 (0.18, sig=0.00) suggests that EO accounts for 18% of the variation in the
aggregated performance construct. Likewise, the R square for H3a (0.09, sig=0.00)
suggests that EO accounts for 9% of the variation in financial performance. Similarly,
the R square for H3b (0.04, sig=0.05) suggests that EO accounts for 4% of the variation
in market performance. Lastly, the strongest relationship seems to be between EO and
innovative performance (R2= 0.32, sig= 0.00) with EO explaining 32% of the variation in
innovative performance.
4.8.6 Testing hypothesis H4, H4a, H4b and H4c
The hypotheses predict a positive relationship between the IV, effectuation and the
DVs, performance, innovative performance, financial performance and market
performance. Normality, independence, the absence of significant outliers and constant
variance are confirmed. Consequently, all four regression models are deemed
satisfactory. The R square for H4 (0.03, sig=0.10) suggests that the null hypothesis that
effectuation has no impact on performance cannot be rejected. Likewise, the R squares
for H4a and H4b suggest the null hypotheses cannot be rejected. However, the R
square for H4c (0.15, sig=0.00) suggests that effectuation accounts for 15% of the
Page 133
132
variation in innovative performance. This relationship is moderately strong and
significant.
4.8.7 Testing hypothesis H5, H5a, H5b and H5c
The hypotheses predict a positive relationship between the IV, flexibility and the DVs,
performance, innovative performance, financial performance and market performance.
Normality, independence, the absence of significant outliers and constant variance are
confirmed. Consequently, that all four regression models are deemed satisfactory. The
R square for H5 (0.11, sig=0.00) suggests that flexibility explains 11% of the variation in
performance. Likewise, the R square for H5a, H5b and H5c suggests that flexibility
accounts for variation ranging from 4% to 15% in the sub-constructs of performance.
These relationships are moderately strong and significant.
4.8.9 Testing hypothesis H6, H6a, H6b and H6c
The hypotheses predict a positive relationship between the IV, experimentation and the
DVs, performance, innovative performance, financial performance and market
performance. Normality, independence, the absence of significant outliers and constant
variance are confirmed. Consequently, all four regression models are deemed
satisfactory. The R square for H6 (0.03, sig=0.10) suggests that the null hypothesis that
experimentation has no impact on performance cannot be rejected. Likewise, H6b. H6a
had a small but significant impact. In contrast, the R square for H6c suggests that
experimentation accounts for 15% of the variation innovative performance. This
relationship is moderately strong and significant.
Page 134
133
4.8.10 Testing hypothesis H7, H7a, H7b and H7c
The hypotheses predict a positive relationship between the IV, affordable loss and the
DVs performance, innovative performance, financial performance and market
performance. The R squares for H7, H7a, H7b and H7c suggests that the null
hypothesis that affordable loss has no impact on performance cannot be rejected.
However, interestingly affordable loss seems to explain 3% of the variation in financial
performance and this is significant at 10% level.
4.8.11 Testing hypothesis H8, H8a, H8b and H8c
The hypotheses predict a positive relationship between the IV, pre-commitments and
the DVs, performance, innovative performance, financial performance and market
performance. The R squares for H8, H8a, H8b and H8c suggests that the null
hypothesis that pre-commitments have no impact on performance cannot be rejected.
To sum up, there are some significant results found between the DVs and the IV’s.
Firstly, EO positively predicts effectuation and its sub-constructs experimentation and
flexibility. Secondly, the EO-performance relationship is confirmed. Thirdly, hostility is
positively linked to effectuation. Further, flexibility is demonstrated to positively predict
performance and all its’ sub-constructs and experimentation is positively linked to
innovative performance. Lastly, the formative construct effectuation is positively linked
to innovative performance.
Page 135
134
4.9 Testing the moderation hypotheses
The hypothesis H9, H9a, H9b, H10, H10a, H10b, H10c and H10d were tested. As we
alluded to in Chapter 3, Hair et al. (2010) suggest we follow a three step process to
determine whether the moderator effect is significant:
• Estimated the original unmoderated equation
• Estimated the moderated relationship
• Assess the change in R2. If the incremental effect is significant then a significant
moderator effect is present.
The researcher also assessed the change in the Beta coefficients (B weight).
Regression coefficients provide a means for assessing the relative importance of the
individual variables in the overall prediction of the dependent variable. However, the
variability across variables and differing response scales makes direct comparisons
problematic (Hair et al., 2010). The Beta coefficient is a standardized regression
coefficient that allows for a direct comparison between coefficients as to their relative
explanatory power (Hair et al., 2010).
Table 47 displays the summary of the moderation results. Only those tests that showed
any significance are reported.
4.9.1 Testing hypothesis H9, H9a and H9b (Hostility as moderator)
The hypothesis predicts a moderated relationship between the IV- effectuation, the
moderator- environmental hostility and the DV- innovative performance. The researcher
Page 136
135
first entered effectuation and hostility into the regression. The interaction item was
included in the second step. Normality, independence, the absence of significant
outliers and constant variance are confirmed. Consequently, that two regression models
are deemed satisfactory. The change in R square from the base model was 0.2%.
Further, the interaction effect, Effectuation*Hostility, was not significant (p=. 0.67).
However, there was a slight change in the slope of effectuation from 0.37 to 0.53. These
results suggest that we cannot reject the null hypothesis that hostility has no impact on
the relationship between effectuation and innovative performance.
Furthermore, H9a which posits that hostility moderates the relationship between
experimentation and innovative performance was tested. The assumptions of
regression were met and the regression models were deemed satisfactory. The change
in R square from the base model was 1, 2%. In addition, the interaction effect,
Experimentation*Hostility, was not significant (p=. 0.27). The beta coefficient of
experimentation actually declined from 0.38 to 0.29. Thus, based on these results, we
cannot reject the null hypothesis that hostility does not moderate the relationship
between experimentation and innovative performance.
Lastly, hostility was also examined as a potential moderator of the relation between
flexibility and innovative performance. As with effectuation and experimentation, we
confirmed normality, independence, the absence of significant outliers and constant
variance. The change in R square from the base model was 0,2%. In addition, the
interaction effect, Flexibility*Hostility, was not significant (p=. 0.27). The beta coefficient
of experimentation slightly increased from 0.42 in the base model to 0.64 in the
moderated regression. These results suggest the null hypothesis, that hostility does not
Page 137
136
moderate the relationship between flexibility and innovative performance, cannot be
rejected.
4.9.2 Testing hypothesis H10, H10a, H10b and H10c (Effectuation as moderator)
The researcher also tested whether effectuation and its sub-constructs moderate the
relationship between EO and performance. In H10 EO was the IV, effectuation the
moderator and innovative performance the DV. We first entered effectuation and EO
into the regression and the regression was significant (R2= 0.34, p=0). The interaction
item was included in the second step and the regression was also significant (R2= 0.41,
p=0). The change in R square from the base model was 7.1%. In addition, the
interaction effect, EO*Effectuation, was significant (p= 0.00). The beta coefficient of EO
increased substantially from 0.49 in the base model to 1.19 in the moderated
regression. The results clearly indicate that effectuation moderates the relation between
EO and innovative performance. The explained variance increases to a notable 40,
66%.
The researcher proceeded to test experimentation as a moderator of the relationship
between EO and innovative performance. In H10a EO was the IV, experimentation the
moderator and innovative performance the DV. Firstly, we entered experimentation and
EO into the regression and the regression was significant (R2= 0.32, p=0). Secondly,
the interaction item was included and the regression was also significant (R2= 0.36,
p=0). The change in R square from the base model was smaller than the comparable
impact of effectuation at 4.2%. In addition the interaction effect, EO*Experimentation,
was significant (p= 0.02). The beta coefficient of EO increased substantially from 0.51 to
Page 138
137
1.14. The results clearly indicate that experimentation moderates the relation between
EO and innovative performance. The explained variance increases to a significant 36,
5%.
Table 47: Summary of Moderation results
H9 Moderation R2 base
ΔR2 Change in b weight Interaction effect sig
Predictor1 Predictor2 Predictor3
0.143 0.002 Effectuation: from 0.37 to 0.53
Effectuation Hostility Effectuation*Hostility
H9a Moderation R2 base
ΔR2 Change in b weight Interaction effect sig
Predictor1 Predictor2 Predictor3
0.16 0.012 Experimentation: from 0.38 to 0.29
Experimentation Hostility Exp*Hostility
H9b Moderation R2 base
ΔR2 Change in b weight Interaction effect sig
Predictor1 Predictor2 Predictor3
0.18 0.006 Flexibility: from 0.42 to 0.64
Flexibility Hostility Flex*Hostility
H10 Moderation R2 base
ΔR2 Change in b weight Interaction effect sig
Predictor1 Predictor2 Predictor3
0.34 0.071 EO : from 0.49 to 1.19
** EO Effectuation EO*Effectuation
H10a Moderation R2 base
ΔR2 Change in b weight Interaction effect sig
Predictor1 Predictor2 Predictor3
0.32 0.042 EO: from 0.51 to 1.14
* EO Experimentation EO*Exp
H10b Moderation R2 base
ΔR2 Change in b weight Interaction effect sig
Predictor1 Predictor2 Predictor3
0.32 0.058 EO from: 0.56 to 1.43
** EO Affordable loss EO*AffLoss
H10c Moderation R2 base
ΔR2 Change in b weight Interaction effect sig
Predictor1 Predictor2 Predictor3
0.36 0.041 EO: from 0.49 to 1.19
* EO Flexibility EO*Flex
H10d Moderation R2 base
ΔR2 Change in b weight Interaction effect sig
Predictor1 Predictor2 Predictor3
0.32 0.005 EO: from 0.59 to 0.29
EO Pre-commitments EO*Part
* Significance at the 0.05 level (2-tailed)
** Significance at the 0.01 level (2-tailed)
Affordable loss was also tested as a moderator of the EO-innovative performance
relationship. Affordable loss has hardly had a significant relation with any of the
Page 139
138
performance constructs. In H10b EO was the IV, affordable loss the moderator and
innovative performance the DV. Firstly, the researcher entered affordable loss and EO
into the regression and the regression was significant (R2= 0.32, p=0). Secondly, the
interaction item was included and the regression was also significant (R2= 0.38, p=0).
The change in R square from the base model was higher than the comparable impact of
experimentation at 5.8%. In addition the interaction effect, EO*Affordable loss, was
significant (p= 0.01). The beta coefficient of EO increased substantially from 0.56 to
1.43. Thus we can surmise that affordable loss moderates the relation between EO and
innovative performance. The explained variance increases to an impressive 37, 68%.
The effectuation sub-construct flexibility has been positively associated with all the
performance constructs. The researcher proceeded to investigate whether it is also a
moderator of the EO-innovative performance relationship. In H10c EO is the IV,
flexibility the moderator and innovative performance the DV. The regression of the main
effects, EO and flexibility was significant (R2= 0.36, p=0). Secondly, the interaction item
was included and the regression was also significant (R2= 0.40, p=0). The change in R
square from the base model was similar to the impact of experimentation at 4.1%. In
addition the interaction effect, EO*Flexibility, was significant (0.00). The beta coefficient
of EO increased substantially from 0.47 to 1.19. The explained variance increases to an
impressive 40.34%, just slightly below that of effectuation as a moderator.
Lastly, the researcher tested the effectuation sub-construct pre-commitments as a
moderator of the EO-innovative performance relationship. In H10d EO is the IV, pre-
commitments the moderator and innovative performance the DV. The regression of the
main effects, EO and pre-commitments, was not significant and the regression with
Page 140
139
interaction item was also not significant. The change in R square from the base model
was 0.5%. In addition the interaction effect, EO*Pre-commitments, was not significant
(p=0.44). The beta coefficient of EO declined substantially from 0.57 to 0.29. These
results suggest the null hypothesis that pre-commitments do not moderate the
relationship between EO and innovative performance cannot be rejected.
Page 141
140
Chapter 5: Discussion of the findings
5.1 introduction
This chapter presents the discussion of the findings of the study. The results from the
quantitative study are integrated with the literature review. Firstly, the demographic
profile of the respondents is discussed, then the results of the hypothesis are reviewed
and finally the implications of the findings are discussed. The chapter concludes with a
summary of the key findings.
5.2 Demographic profile of the respondents
As alluded to in chapter 4, the majority of the respondents (95.7%) were formed before
2008, over 44% of the responding firms employ more than 350 people, 98% of our
respondents were senior executives and seven of the respondents indicated that their
firm was low tech, 54 catergorised their firm as medium tech and 34 reported their firm
as high tech.
The level of technological advancement was meant to be one of the main control
variables. T-tests were conducted to determine where there was a significant difference
in strategy and performance between high tech and meduim tech. However, the results
indicated no such difference on the main dependent variables effectuation and
performance. There was a slight difference on EO and innovatiness though. Contrary to
our expectations, this difference did not translate into performance outcomes, even
innovative performance. This might be due to the cross sectional nature of the study.
Perhaps a longitudinal study might find different results.
Page 142
141
5.3. Discussion of hypothesis
5.3.1 Discussion of hypothesis H1, H1a and H1b
The hypotheses predicted a positive relationship between the EO and effectuation and
its sub-constructs experimentation and flexibility. They were all supported. As expected
all EO dimensions, i.e. risk taking, proactiveness and innovativeness, had a positive
relation with effectuation and its sub-constructs experimentation and flexibility. In the
following paragraphs, we shall discuss how each EO constructs relate to effectuation,
integrating the results with theory.
Firstly, we argued in Chapter 2 that the innovation element of EO relates directly to
effectuation and creation theory. For, as Sarasvathy et al. (2003) questioned, how do
firms recognize or discover innovation? They argued that innovation is influenced by the
judgments and deeds of agents and results in novel goals and new environments from
current realities. Further, Brettel et al. (2012) have also suggested that successful
innovative entrepreneurs maintain flexibility, utilize experimentation and the affordable
loss principle and have a preference for partnerships and leverage contingencies. In
sum, we find support for creation theory due to the strong association between
innovativeness and effectuation.
Secondly, we supported the notion advanced by Wiklund and Shepherd (2011) that the
risk taking element of EO appears to be more closely aligned with the activities of
exploration than exploitation. The effectuation sub-constructs pre-commitments;
flexibility and experimentation were all significantly correlated with risk taking.
Emphasizing flexibility, pre-commitments and experimentation positively influences the
Page 143
142
costs and risks of firm strategies (Witlbank et al., 2006). In an effectual context,
successes and failures are inputs into a process that needs to be managed such that
failures are outlived and successes are accumulated (Sarasvathy, 2001). Thus, rather
than viewing entrepreneurial firms as speculators who discover opportunities, the
effectuation and creation theory perspective might be more apt. As Barney (1991)
suggests, entrepreneurs build sustainable, inimitable enterprises with a competitive
advantage. They do not merely assume risks based on opportunities they discover, but
they also create them through experimenting and by being flexible, whilst using pre-
commitments to manage the risk that venturing entails. In sum, we find support for
Wiklund and Shepherd’s (2011) view that the risk taking element of EO appears to be
more closely aligned with the activities of exploration, rather than exploitation, due to the
strong association between risk taking and effectuation. Further, Sarasvathy’s
effectuation theory seems to provide a plausible explanation of how they manage the
attendant threats.
Thirdly, proactiveness was also strongly correlated with effectuation, experimentation
and flexibility. Miller and Friesen (1978) argued that the proactiveness of a firm's
decisions is determined by whether it shapes the environment by initiating new
products, technologies, administrative techniques or whether it just reacts. By
experimenting and being flexible as they act, entrepreneurial firms introduce new
products and brands ahead of competition and strategically eliminate operations which
are mature (Venkatraman, 1989). Further, Anderson et al. (2009) suggest EO
encourages firms to undertake experimentation and exploration activities leading to new
venture creation. Lastly, new combinative and exploitative knowledge is largely
Page 144
143
developed through proactive behaviors (Li et al., 2009) and the results imply, by being
flexible and experimenting. In sum, proactiveness may be viewed not only as a method
of recognizing opportunities but also as a way of creating them through effectuation.
Finally, empirically, of the effectuation sub-constructs, experimentation had the
strongest association (r=0.57, p=0.00) with EO. Accordingly, Wiklund and Shepherd’s
(2011) proposition of EO-as-experimentation—reflecting the notion that EO is
concomitant with greater outcome variance, which increases the likelihood of both
failure and success-, is supported based on the strong relation between
experimentation and EO.
5.3.2 Discussion hypothesis H2
The hypothesis predicts a positive relationship between environmental hostility and
effectuation. The hypothesis was supported. The R square for H2 (0.05, sig=0.05)
suggests that environmental hostility accounts for 5% of the variation in effectuation.
Further, environmental hostility was positively correlated with flexibility whereas there
was no correlation with experimentation, affordable loss and pre-commitments and EO
or its sub-constructs. The results seem to support Peng’s (2001) view that prospecting,
networking and boundary blurring, which by definition imply flexibility, are strategies
entrepreneurs use in emerging markets to shape the environment. Sirmon et al. (2007)
have also suggested that firms are flexible enough to adapt in hostile environments by
transforming unique resources to create value while considering environmental
contingencies (Sirmon et al., 2007). In sum, in a hostile environment firms are more
likely to deploy effectual strategies to shape the environment.
Page 145
144
5.3.3 Discussion hypothesis H3, H3a, H3b and H3c
The hypotheses predict a positive relationship between EO and performance, innovative
performance, financial performance and market performance. They were all supported.
EO showed positive associations with all the performance dimensions and as Raunch et
al. (2009) have suggested the EO-performance relationship remains vigorous to
modifications in performance dimensions, common method variance and memory decay
or social desirability. Further, Raunch et al. (2009) suggested that based on their meta-
analysis, the “true” correlation between EO and firm performance is .242. In contrast,
Tang and Tang (2010) found a curvilinear, inverse U shaped relationship between EO
and performance amongst Chinese firms. However, we found a correlation 0.42 with the
aggregated performance measure and a linear relationship. The results seem to imply
that there might be greater returns to having a higher EO in South Africa. This may
possibly be due to the country being an emerging market with a Western institutional
framework. Thus there are more opportunities to exploit within a legal frame work
resulting in linear and higher returns to entrepreneurial behaviour.
5.3.4 Discussion hypothesis H4, H4a, H4b and H4c
The hypotheses predict a positive relationship between effectuation and performance,
innovative performance, financial performance and market performance. The
hypotheses for performance, financial performance and market performance were not
supported. However, the R square for innovative performance (0.15, sig=0.00) suggests
that effectuation accounts for 15% of the variation in innovative performance. This
supports the notion that innovativeness is crucial because it can lead to the
Page 146
145
development of new organizational competences through the process of trial-and-error
and creativity (Covin, Green and Slevin, 2006; Lumpkin and Dess, 1996). Moreover,
innovative firms utilize new ideas and products, as well as new technological processes,
to develop new products, processes and/or markets (Covin, Green and Slevin, 2006;
Lumpkin and Dess, 1996). The results also support Dew et al.’s (2008) view that
established firms could use effectuation to address Christensen’s (2000) “Innovators’
dilemma”. In addition, Brettel et al.’s (2012) suggestion that those large companies
which have difficulties in executing highly innovative R&D use an effectual approach
and Venkantaraman and Sarasvathy’s (2001) argument that innovation managers
should use effectuation to improve innovative performance, are both supported. In sum,
an effectual approach supports the commercialisation of new products/services.
However, other scholars have noted that innovative performance might not have
positive short-term financial outcomes, supporting the findings of this study. Eisenhardt
and Martin (2000) have suggested that innovative performance enhances uncertainty.
Further Block and MacMillan (1993) have suggested it might imply short-term losses.
Nevertheless, Schumpeter (1934) contends that over the long-term innovative
performance bestows monopoly rents and spawns enduring entrepreneurial success.
5.3.5 Discussion hypothesis H5, H5a, H5b and H5c
The hypotheses predict a positive relationship between flexibility and performance,
innovative performance, financial performance and market performance. The
hypotheses were all supported. Flexibility implies disregarding predictions about an
uncertain future or at a minimum treating them cautiously. Sarasvathy (2001a, 2001b)
Page 147
146
has emphasized the importance of control and flexibility and rejected the notion that
only prediction can improve performance. Chandler et al. (2011) has suggested that an
effectual entrepreneur maintains flexibility, utilizes experimentation and seeks to exert
control to shape an uncertain future. In addition, Sarasvathy (2001a, 2001b) has
maintained that whereas predictive strategies are ways to influence current realities to
reach preselected goals, effectual strategies spawn novel goals and new environments
from current realities. Further, Venkantaraman and Sarasvathy (2001) argue that firms
should not try to predict technology paths more accurately or strive to build immortal
firms in mortal markets rather they should remain flexible and adaptable enough to
create new markets. These arguments are supported by the results which indicate that
those firms which disregard prediction and are flexible achieve better performance
outcomes across all dimensions of performance.
5.3.6 Discussion hypothesis H6, H6a, H6b and H6c
The hypotheses predict a positive relationship between experimentation and
performance, innovative performance, financial performance and market performance.
H6, H6a and H6b were not supported. In contrast, the R square H6c suggests that
experimentation accounts for 15% of the variation innovative performance. The
researcher has argued that performance is a multidimensional construct and in this
study, he has also adopted Chandler et al.’s (2011) view that effectuation is a multi-
dimensional formative construct. Effectuation sub-constructs do not need to co-vary and
further they each provide a unique dimension to the effectuation construct. Thus, in the
short term experimenting might be costly and lead to a deterioration in financial
performance. However, in the long term, through its impact on innovative performance,
Page 148
147
better financial and market outcomes may result. Richard et al. (2009) caution against
using short- or medium-term measures since they can be heavily biased by random
fluctuations, performance itself does not persist indefinitely and they fail to account for
the variability and stickiness in performance.
5.3.7 Discussion hypothesis H7, H7a, H7b and H7c
The hypotheses predict a positive relationship between affordable loss and
performance, innovative performance, financial performance and market performance.
The hypotheses were not supported at the 5% significance level. However, interestingly
affordable loss seems to explain 3% of the variation in financial performance and this is
significant at 0.1. Similarly, effectuation received support at a similar level. As we have
argued ad nauseam, effectuation is a formative, multidimensional construct. Chandler et
al. (2011) suggest we view it as a composite index. Each sub-construct seems to
explain a unique element of effectuation, and affordable loss seems to relate to financial
performance. Further, a construct like effectuation that seems to emphasize
experimentation and flexibility might immediately impact negatively on short term
financial measures. In addition, a risk mitigation strategy such as affordable loss might
relate more towards ensuring long-term survival rather than optimizing short-term
performance outcomes. A longitudinal study that incorporates both failure and success
as the DVs might be more appropriate for explicating the affordable loss sub-construct’s
performance implications.
Page 149
148
5.3.8 Discussion hypothesis H8, H8a, H8b and H8c
The hypotheses predict a positive relationship between the IV, pre-commitments and
the DVs, performance, innovative performance, financial performance and market
performance. The hypotheses were all not supported. However, these results should
be interpreted with caution. The instrument adapted from Chandler et al. (2011) had
reliability problems on the pre-commitment scale. Similar to Chandler et al. (2011), we
found a Cronbach’s alpha of 0.6. Hair et al. (2010) suggest a minimum of 0.7 for our
sample size. Further, as we have argued, effectuation is a formative construct and the
one significant correlation pre-commitments had was with the EO sub-construct, risk
taking. Perhaps, as conjecture, it could be argued that effectual entrepreneurs do not
use pre-commitments to maximise performance, but rather to manage risk by spreading
it out amongst different partners. Further, the effectiveness of forming partnerships and
strategic alliances might be better illustrated over a longer period and might relate
positively to a different DV, survival. As with the affordable loss construct, a longitudinal
study might better clarify the performance implications of the pre-commitments sub-
construct.
5.3.9 Discussion hypothesis H9, H9a and H9b (Hostility as moderator)
The hypotheses predict a moderated relationship between effectuation and its sub-
constructs flexibility and experimentation, environmental hostility and innovative
performance. Effectuation and flexibility resulted in a small increase in the beta
coefficient whereas experimentation did not. All moderation effects were not significant.
Dew et al. (2008) have argued that entrepreneurial firms transform hostile environments
Page 150
149
in contrast to operating within existing environments. Lau and Bruton (2011) suggest
that entrepreneurs and the firms they establish produce prosperity in locations
conventionally hostile to enterprise. Lau and Bruton (2011) posit that effective strategies
in an emerging market should strengthen the firm's capabilities to produce more
innovative products and processes especially in industries which commonly rely on
differentiation. Peng (2001) suggests that they achieve this feat through prospecting,
networking and boundary blurring. This would suggest that environmental hostility would
moderate the effectuation-performance relation. However, the results suggest
otherwise.
The researcher did not find significant moderation even though he did find significant
correlation between environmental hostility and performance. Similarly, the relation
between environmental hostility and EO has invited considerable debate (Rauch et al.,
2010). Theory suggests that environmental hostility should moderate the effectuation
performance relation and indeed we were able to empirically link environmental hostility
to effectuation. However, the results suggest otherwise. It begs the question: why are
entrepreneurial firms in hostile environments more likely to effectuate if there is no
concomitant improvement in performance? Perhaps effectual strategies might enhance
their chances of survival. We are only speculating and only future research can help
explicate this dilemma.
5.3.10 Discussion hypothesis H10, H10a, H10b and H10c (Effectuation as moderator)
Effectuation and its sub-constructs were tested as moderators of the relationship
between EO and performance. Effectuation, flexibility, experimentation and affordable
Page 151
150
loss were found to be moderators. As discussed in chapter 4, all interaction effects were
found to be significant. Similar to its relation with environmental hostility, effectuation
was found to have the largest moderation effect. This once again seems to confirm the
view that, in certain instances, effectuation seems to be greater than the sum of its
parts. The change in R square from the base model was 7.1%. The explained variance
increased to a notable 40, 66%. Thus EO and the moderator effectuation explain
40.66% of the variance in innovative performance. This seems to lend credence to the
Vankantaraman and Sarasvathy’s (2011) view of effectuation as the entrepreneurial
method.
As previously elucidated in the review of literature, creation theory suggests
opportunities are endogenously created by the actions of entrepreneurs exploring ways
to produce new products or services (Baker and Nelson, 2005; Sarasvathy, 2001).
Sarasvathy et al. (2003) suggest that entrepreneurial opportunities are created. Dew et
al. (2008) postulate that the key difference between entrepreneurial firms and existing
firms is that firms and markets are not assumed as exogenous in entrepreneurship.
Sarasvathy (2001a, 2001b) suggest effectuation facilitates technology
commercialization – i.e. investing in and building new markets. Barney (1991)
emphasizes the importance of information, learning and knowledge generated from the
process of enacting an opportunity. Firms that own resources that are valuable and rare
attain a competitive advantage and enjoy improved performance in the short term. To
sustain these advantages over time the firm’s resources must also be inimitable and
non-substitutable (Barney, 1991). We argue that resources that are inimitable and non-
substitutable can only be attained through innovative performance.
Page 152
151
This line of argument finds support from Porter (1980) who has posited that innovative
entrepreneurial firms differentiate themselves from competitors, enjoy higher customer
loyalty and can secure superior pricing for their products and that through innovative
performance entry barriers for prospective challengers can be erected and the firm’s
position in the industry strengthened leading to continual high profits (Porter, 1980).
Similarly, Kim and Maubourgne (2005) have suggested that firms need to innovate in
order to endure and flourish in global markets. Lastly, Schumpeter (1934) has posited
that innovative performance bestows monopoly rents and spawns enduring
entrepreneurial success.
The central thesis of this study has been that effectuation helps entrepreneurial firms
attain competitive advantage. How? By moderating the relation between entrepreneurial
behaviour (EO) and innovative performance to such an extent that 40, 66% of the
variance in innovative performance, is explained.
5.4 Discussion of significant findings
Effectuation was the main construct of this thesis. We adopted Chandler et al.’s (2011)
characterization of effectuation as a formative multi-dimensional construct with four
associated sub-constructs: experimentation, affordable loss, flexibility and pre-
commitments. This characterization was supported by the results of a MTMM analysis
which indicated low inter-item correlations between some of the effectuation sub-
constructs. Further, exploratory factor analysis was conducted and the factors loaded
cleanly on the four sub-constructs, hence providing support for Chandler et al.’s (2011)
conclusions. However, similar to Chandler et al. (2011), the pre-commitment scale was
Page 153
152
less robust. We would suggest researchers should develop alternative scales to
measure the pre-commitments sub-construct. In addition, effectuation was positively
associated with environmental hostility, which indicated fairly good predictive validity
and the formative construct had a larger moderating impact on the EO-performance
relation than any of its sub-constructs, indicating that it may very well be a composite
index that explains more than the sum of its parts.
We also sought to establish whether, in a hostile environment, firms were more likely to
use effectual principles. Sarasvathy (2001a, 2001b) has argued under conditions of
hostility, casual strategies are impractical since it is impossible to predict the future with
confidence. She has suggested that the entrepreneur utilises flexibility, experiments and
forms strategic alliances to shape the environment. As indicated in the previous
paragraph, through regression analysis, this argument was supported. In fact,
effectuation and its sub-construct flexibility were the only constructs positively
associated with environmental hostility.
Further, the impact of an effectual strategy on performance was assessed. Effectuation
was positively linked with innovative performance. Moreover, effectuation was shown to
moderate the relationship between EO and innovative performance. This impact might
be crucial since innovative performance can lead to the development of new
organizational competences through the process of trial-and-error and creativity (Covin
et al., 2006). In addition, innovative firms utilize new ideas and products, as well as new
technological processes, to develop new products, processes and/or markets (Covin et
al., 2006). As the researcher argued in Chapter 2, it is this very process that leads to a
competitive advantage.
Page 154
153
Lastly, effectuation was also positively linked to EO. EO was viewed as a firm-level trait
that can be deciphered through the display of sustained innovation, risk taking and
action (Covin and Lumpkin, 2011). This is consistent with the arguments of Miller
(1983) and Covin and Slevin (1989). In Chapter 4, the researcher sought to determine
whether EO and effectuation were distinct. Exploratory factor analysis was conducted
and the results showed that effectuation sub-constructs are distinct from EO. Seven
factors were extracted representing: experimentation, affordable loss, flexibility, pre-
commitments, proactiveness, risk taking and innovativeness. With discriminant validity
established, we proceeded to answer the question: do firms effectuate as they innovate,
take risks and act? The results of the regression analysis were affirmative. They do.
5.5 Conclusion
In summary, both the moderation and the predictive hypothesis show significant results.
With the predictive hypothesis it has been shown that:
• EO positively predicts effectuation and its sub-constructs experimentation and
flexibility.
• The EO-performance relationship is confirmed.
• Hostility is positively linked to effectuation.
• Flexibility positively predicts performance and all its sub-constructs.
• Experimentation positively predicts innovative performance
• Effectuation positively predicts innovative performance.
Page 155
154
Further, the moderation results empirically show that effectuation, experimentation,
flexibility and affordable loss all moderate the relation between EO and innovative
performance. Pre-commitment was found not to be a significant moderator.
Environmental hostility could also not be confirmed as a moderator of the effectuation-
innovative performance relation.
Page 156
155
Chapter 6: Conclusions of the study
6.1 Introduction
In this chapter we expand on the conclusions of the study. Further, the theoretical,
managerial and policy contributions of the research are explained. In addition, the
limitations of the research are addressed and future research directions are suggested.
6.2 Conclusions of the study
This thesis examined the impact of strategy pursued and the resultant impact on
performance in a hostile environment. As outlined in Chapter 1, technological innovation
is increasingly important to developing countries such as South Africa. The objective of
the study was to fill a research gap suggested by Rauch et al. (2009) in that there is
limited research addressing the moderating impact on EO of effectuation in firms
operating in a hostile environment and the resultant impact on performance. The study
also addressed a research gap suggested by Perry et al. (2011) in terms of exploring
relationships between effectuation and established entrepreneurship and management
theories such as EO and environmental hostility
In brief, the important findings of this study are that there is no difference between high
technology and medium technology South African firms in performance across all
dimensions and in the use of effectuation. For the sample as a whole, it was found that
firms with a higher EO were more likely to effectuate and be flexible and experiment.
Further, a high EO would result in better performance outcomes across all the
performance dimensions. Likewise, South African firms that are more flexible achieve
Page 157
156
better performance outcomes across all the dimensions of performance. In addition, the
more competitive and hostile the environment was, the more likely were firms to
effectuate. Further, experimentation and effectuation were positively linked to innovative
performance.
However, firms that operated in a hostile environment and used an effectual strategy
were found not to achieve better performance outcomes. In contrast, firms with a high
EO that used effectual principles were shown to achieve better innovative performance.
6.3 Advancement of creation theory and effectuation
As was indicated in Chapter 1, entrepreneurship literature can be divided into two
strands of thought: discovery theory and the creation theory (Alvarez and Barney,
2007). This study makes an important contribution to creation theory. As we have
elucidated in Chapter 2, opportunity is the central construct of entrepreneurship theory
(Venkataraman, 1997). Creation theory assumes that the entrepreneur’s actions are the
essential source of these opportunities. In this model, entrepreneurs do not wait for
exogenous shocks to form opportunities and then provide agency to those
opportunities. They act (Baker and Nelson, 2005; Sarasvathy, 2001). Entrepreneurial
firms use an effectual logic that is transformative without calling for prediction or vision
in creating new markets and new environments. As highlighted by the results, it seems
as if entrepreneurial firms do not only discover opportunities but they also create them
through innovative performance.
Further, we have sought to answer the question in RBV theory of how firms develop a
competitive advantage. Based on the results, it would seem that firms innovate, take
Page 158
157
risks and are proactive whilst deploying effectual principles. As that process evolves
differently for various entrepreneurs, the opportunities that result may be heterogeneous
in “costly-to-copy, and costly-to-reverse” ways (Barney, 1991, p.105). Entrepreneurial
firms explicitly implement such a co-creation process—that is, they act and behave in
ways that generate a competitive advantage (Sarasvathy, 2001a, 2001b). Thus, firms
that effectuate as they innovate, take risks and act are more likely to achieve superior
innovative performance that would lead to resources that are valuable, rare, inimitable
and non-substitutable (Barney, 1991) and secure monopoly rents, spawning enduring
entrepreneurial success (Schumpeter, 1934). Superior innovative performance might be
the only way for firms to survive and thrive in hypercompetitive global markets (Kim and
Maubourgne, 2005).
The study also made an important contribution to effectuation theory by demonstrating a
positive association between established entrepreneurship and management theories
such as EO and environmental hostility. Through factor and MTMM analysis it was
established that effectuation is distinct from EO and environmental hostility. Regression
analysis was used to establish the causal link.
Furthermore, the researcher addressed the performance implications of effectuation
and its sub-constructs. Effectuation was more strongly associated with the innovative
performance dimension of the performance construct. Innovativeness is a critical sub-
construct of entrepreneurial orientation (EO) and EO has been shown in literature to be
positively related to performance (Raunch et al., 2009). We also confirmed Brittle et al.’s
(2011) view that those companies which have difficulty with innovative outcomes could
benefit from an effectual approach. In addition, it was established that for firms with a
Page 159
158
high EO, effectuation, flexibility, affordable loss and experimentation positively moderate
the EO-innovative performance relation.
Finally, Wiklund and Shepherd’s (2011) EO-as-experimentation perspective was
confirmed. Firms with a high EO were more likely to experiment, be flexible, freely
associate and enter into new product markets (Raunch et al., 2009).
6.4 Managerial Contributions
In addition to theoretical advances this research has highlighted key areas that could
improve management practice:
Managers should adopt EO as behaviour to improve financial, market and
innovative performance
Managers should be flexible to improve financial, market and innovative
performance
Managers should experiment and use effectual principles to achieve better
innovative performance, i.e. commercialise new products and services.
These contributions to management practice are practical and relevant for managers
who seek to attain better performance outcomes, in particular commercialising
innovations. The rapid changes in technology and markets make attaining innovation
success an imperative. In sum, the findings of this study suggest that managers should
put an emphasis on EO whilst deploying effectual principles to launch new products and
services and build new markets.
Page 160
159
6.5 Policy Contributions
As discussed in Chapter 1, South Africa is blighted by high levels of unemployment and
poverty. South Africa is ranked 121st out of 177 countries with an HDI score of 0.674
(Venter et al., 2007). Entrepreneurship and particularly technology entrepreneurship has
been seen as a possible solution to generate innovation, grow the economy and create
jobs, thus reducing poverty. The government has launched a wide array of initiatives:
the Technology Innovation Agency (TIA), SEDA Technology Programme (STP), the
National Technology Transfer Centre (NTTC), the Industrial Development Corporations’
(IDC) Venture Capital Fund and the Jobs Fund. The 2007 OECD review of the NSI
indicates that South Africa is a world leader in research in fields such as
environment/ecology, social science, engineering, plant and animal sciences and
clinical medicine (OECD Innovation Review, 2007). However, the country has struggled
to commercialise its research output. Even though many statistics that typically measure
knowledge economy progress have improved from the 1990s, South Africa still trails
other middle-income countries (Lorentz, 2009).
The empirical evidence of this study suggests that policy makers should review how
they allocate funding to technology commercialisation. Rather than focusing on
business plans and financials, they should give technology firms more latitude so that
they can experiment and be flexible in launching new innovations or in building new
markets.
Further, policy makers themselves should use effectual principles to experiment,
maintain flexibility, form partnerships and use the affordable loss principle. The use of
Page 161
160
effectual principles would suggest more technology commercialisation should be
funded, fewer resources be committed per venture and pre-commitments should also
be secured from self-selecting stakeholders. In sum, the empirical evidence from this
thesis suggests that policy makers should encourage risk taking, pro-activeness and
innovativeness by firms who experiment, are flexible and effectuate.
This would imply that accelerated depreciation schedules could be helpful. Further, tax
credits for research and funding through grants could ameliorate some of the costs
incurred whilst launching new products and/or services, or building new markets.
Lastly, policymakers need to address the culture pervasive in a government that fears
failure, since experimenting necessarily entails possibly failing. Some experiments may
work, others may not. Thus without accepting failure as a necessary input in technology
commercialisation, policy makers might not attain the desired success.
In sum, through deploying effectual principles, accepting failure and encouraging,
through the tax code, experimentation and flexibility, policy makers might achieve the
stated objective of encouraging technology commercialisation.
6.6 Limitations of the Study
As mentioned in previous chapters, this study had several limitations. They are as
follows:
We have used a quantitative methodology. As far as the researcher is aware,
this is the first such study to investigate the moderating impact of effectuation. A
mixed methods approach could have been more beneficial in explaining for
Page 162
161
example why firms in a hostile environment are more likely to effectuate without
the attendant improvement in performance.
The study is cross sectional. Thus it only provides insight at that specific
moment in time. As we have argued in chapter 5, only a longitudinal
investigation might be able to make definitive findings on the performance
implications of effectuation.
Memory bias of managers may have negatively affected the responses.
Managers were asked to answer questions related to their firm’s performance
over a five year period. Thus the responses were partly based on the accurate
recollection of managers.
Cognitive biases might have also been shaped by current performance and the
economic context.
The study was only conducted amongst South African firms. South Africa is
relatively isolated from the developed markets of the West and the fast
developing countries in Asia. Thus these results might not be generalizable.
Judgement sampling was used since we sought the opinion of senior executives
who are difficult to locate. Random sampling might generate more robust results.
The study sample (N=94) was relatively small. This is ameliorated by the fact
that as discussed in Chapter 5, 98% of the respondents were senior, board level
executives which enhances the validity of the study.
The list of proposed measures of performance might not cover all performance
dimensions. We have made our conclusions solely with respect to the
performance dimensions addressed.
Page 163
162
We adopted creation theory and the RBV of the firm as the theoretical
frameworks guiding this study. However, other theoretical frameworks might play
a role in the choice of strategy to pursue, predictive or non-predictive.
Further, only surviving firms were included in the sampling frame. This
introduced survivor bias and thus might limit our understanding of the optimal
strategic choices.
Finally, the causation construct was not investigated. A comparison between
firms who use casual strategies with those who use effectual strategies might
enlighten us on which strategic choice is optimal in a hostile environment.
6.7 Suggestions for future research
As discussed in chapter 2, empirical effectuation literature is still in its infancy, thus
there is a broad range of topics scholars could explore. We shall limit our
recommendation only to those that are closely related to this thesis.
Studies could examine whether effectuation moderates the EO-failure relation. Further,
other environmental contexts could be investigated, e.g. environmental dynamism.
Organisational configuration scholars could also enlighten us on which organisational
contexts support effectuation. In addition, as we have argued in chapter 5, a longitudinal
study would help explicate the real performance implications of effectuation especially if,
as Rauch et al. (2009) suggest innovation is an important antecedent to performance.
Likewise, effectuation encourages social action and scholars could investigate whether
effectuation improves the performance of social ventures. Lastly, we have empirically
shown that environmental hostility is positively related to effectuation. However, we
Page 164
163
could not find a moderating relationship between environmental hostility and the
effectuation-performance relation. Scholars could investigate the moderation relation
against other outcome variables, such as failure.
Page 165
164
References
Ahlstrom, D., and Burton, G. D. (2002). An institutional perspective on the role of culture
in shaping strategic actions by technology-focused entrepreneurial firms in China.
Entrepreneurship Theory and Practice, 26(4): 53–69.
Alvarez, S. A. and Barney, J. B. (2007). Discovery and creation: alternative theories of
entrepreneurial action. Strategic Entrepreneurship Journal, 1(1-2): 11–26.
Anderson, B., Covin, J., and Slevin, D. (2009). Understanding the relationship between
entrepreneurial orientation and strategic learning capability: An empirical investigation.
Strategic Entrepreneurship Journal, 3(3): 218–240.
Andersson, S. (2011). International entrepreneurship, born globals and the theory of
effectuation, Journal of Small Business and Enterprise Development, 18(3): 627 – 643.
Arrindel , W.A. and van der Ende, J. (1985). An empirical test of the utility of the
observations to variables ratio in factor and component analysis. Applied psychological
Measurement, 9(2): 165-178.
Baker, T. and Nelson, R. (2005). Creating something from nothing: resource
construction through entrepreneurial bricolage. Administrative Science Quarterly, 50(3):
329–66.
Baker, W.E. and Sinkula, J.M. (1999). Learning Orientation, Market Orientation, and
Innovation: Integrating and Extending Models of Organizational Performance. Journal of
Market Focused Management, 4(4): 295–308.
Page 166
165
Barney, J. B. (1991). Firm resources and sustained competitive advantage. Journal of
Management, 17(1): 99–120.
Berggren, E. and Nacher, T. (2001). Introducing new products can be hazardous to your
company: use the right new-solutions delivery tools. Academy of Management
Executive 15 (3): 92–101.
Blanco, S. (2007), How techno-entrepreneurs build a potentially exciting future? in:
Therin, F., ed, Handbook of Research on Techno-Entrepreneurship, Cheltenham:
Edward Elgarpp, p. 3–25.
Block, Z., MacMillan, I.C., (1985). Milestones for successful venturing planning. Harvard
Business Review 63 (5): 84–90.
Block, Z. and MacMillan, I., (1993). Corporate Venturing. Harvard Business Press,
Cambridge, MA.
Bradley, S. W., Shepherd, D. A. and Wiklund, J. (2011). The Importance of Slack for
New Organizations Facing ‘Tough’ Environments. Journal of Management Studies, 48
(5): 1071–1097.
Brettel, M., Mauer, R., Engelen, A., Küpper, D., (2012). Corporate effectuation:
Entrepreneurial action and its impact on R&D project performance. Journal of Business
Venturing. 27 (2): 167-184.
Page 167
166
Brews, P. J. and. Hunt, M. R. (1999). Learning to plan and planning to learn: Resolving
the planning school/learning school debate. Strategic Management Journal, 20(10):
889-913.
Bryman, A., and Bell, E. (2007). Business research methods. Oxford: Oxford University
Press.
Bruton, G. D., Ahlstrom, D., and Obloj, K. (2008). Entrepreneurship in emerging
economies: Where are we today and where should the research go in the future.
Entrepreneurship Theory and Practice, 32(1): 1–14.
Chandler, N.G., DeTienne, D.R., McKelvie, A. and Mumford, T.V. (2011). Causation and
effectuation processes: A validation study. Journal of Business Venturing, 26(3): 375-
390.
Chow, I. H. (2006). The relationship between entrepreneurial orientation and firm
performance in China. SAM Advanced Management Journal 71(3): 11-20.
Christensen, C., M., (2000). The Innovator’s Dilemma. When new technologies cause
great firms to fail. Boston, MA: Harvard Business School Press.
Cooper, D. R., and Schindler, P. S. (2011). Business Research Methods (11th ed.).
New York: McGraw-Hill/Irwin.
Covin, J. G., and Slevin, D. P. (1991). A Conceptual Model of Entrepreneurship as Firm
Behavior. Entrepreneurship Theory and Practice, 16(1): 7–25.
Page 168
167
Covin, J.G., Green, K.M., and Slevin, D.P. (2006). Strategic process effects on the
entrepreneurial orientation—Sales growth rate relationships. Entrepreneurship Theory
and Practice, 30(1): 57–81.
Covin, J.G., Slevin, D.P., and Schultz, R.L. (1997). Top management decision sharing
and adherence to plans. Journal of Business Research, 40(1): 21–36.
Covin, J.G. and Slevin, D.P. (1988). The influence of organization structure on the utility
of an entrepreneurial top management style. Journal of Management Studies, 25(3):
217–234.
Covin, J.G., and Slevin, D.P. (1989). Strategic management of small firms in hostile and
benign environments. Strategic Management Journal 10(1):75–87.
Covin, J. G. and Lumpkin, G. (2011). Entrepreneurial Orientation Theory and Research:
Reflections on a Needed Construct. Entrepreneurship Theory and Practice, 35(5): 855–
872.
Davidsonn, P. (2004). Researching entrepreneurship, International Studies in
Entrepreneurship. New York: Springer.
Danielson, M., and Press, E. (2003). Accounting returns revisited: Evidence of their
usefulness in estimating economic returns. Review of Accounting Studies, 8(4): 493-
530.
Denrell, J., Fang, C. and Winter, S. G. (2003). The economics of strategic opportunity.
Strategic Management Journal. 24(10): 977–90.
Page 169
168
Dew, N., (2003). Lipsticks and razorblades: how the auto ID center used pre-
commitments to build the Internet of things. Unpublished Dissertation Charlottesville,
VA.: University of Virginia.
Dew, N., Read, S., Sarasvathy, S.D., and Wiltbank, R. (2008). Outlines of a behavioral
theory of the entrepreneurial firm. Journal of Economic Behavior and Organization,
66(1): 37–59.
Dew, N., Read, S., Sarasvathy, S.D., and Wiltbank, R. (2009). Effectual versus
predictive logics in entrepreneurial decision-making: Differences between experts and
novices. Journal of Business Venturing, 24(4): 287–309.
Dew, N., Sarasvathy, S.D., Read, S., and Wiltbank, R. (2009). Affordable loss:
Behavioral economic aspects of the plunge decision. Strategic Entrepreneurship
Journal, 3(2): 105–126.
Dew, N. and Sarasvathy, S.D. (2002). What effectuation is not: Further development of
an alternative to rational choice. Paper presented at the Annual Meeting of the
Academy of Management, Denver, CO.
Dew, N., Sarasvathy, S.D., Read, S., and Wiltbank, R. (2008). Immortal firms in mortal
markets? An entrepreneurial perspective on the “innovator’s dilemma.” European
Journal of Innovation Management, 11(3): 313–329.
Drucker, P. (1979). The practice of management. London: Pan Books.
Page 170
169
Eisenhardt, K.M. and Martin, J.A., 2000. Dynamic capabilities: what are they? Strategic
Management Journal. 21(10/11): 1105–1121.
Freeman, J., Carroll, G. R. and M. T. Hannan (1983). The Liability of Newness: Age
Dependence in Organizational Death Rates. American Sociological Review 48 (5): 692–
710.
Gartner, W.B. (1988). “Who is an entrepreneur?” is the wrong question. American
Journal of Small Business, 12(4), 11–32.
Government of the Republic of South Africa (2002). South Africa’s National Research
and Development Strategy. Pretoria: Government of the Republic of South Africa.
Guthrie, J. (2001). High-involvement work practices, turnover, and productivity:
Evidence from New Zealand. Academy of Management Journal. 44 (1): 180–190.
Hagedoorn, J. and Cloodt, M. (2003). Measuring innovative performance: is there an
advantage in using multiple indicators? Research Policy, 32(8): 1365–1379.
Hair, J.F., Anderson, R.E., Babin, B. J., and Black, W. (2010). Multivariate data analysis
(5th ed.). Upper Saddle River, NJ: Prentice Hall.
Hayes, R.H. (1985). Strategic planning: forward in reverse? Harvard Business Review,
63(6): 111–119.
Harms, R., Reschke, C.H., Kraus, S. and Fink, M. (2010). Antecedents of innovation
and growth: analysing the impact of entrepreneurial orientation and goal-oriented
management. International. Journal of Technology Management, 52(1/2): 135–152.
Page 171
170
Hart, S.L. (1992). An integrative framework for strategy-making processes. Academy of
Management Review. 17(2): 327–351.
He, Z.L. and Wong, P.K. (2004). Exploration vs. exploitation: An empirical test of the
ambidexterity hypothesis. Organization Science, 15(4): 481–494.
Hitt, M., Dacin, M., Levitas, E., Arregle, J., and Borza, A. (2000). Partner selection in
emerging and developed market contexts: Resource-based and organizational learning
perspectives. Academy of Management Journal, 43(3): 449-467.
Holmqvist, M. (2004). Experiential learning processes of exploitation and exploration
within and between organizations: An empirical study of product development.
Organization Science. 15(1): 70–8
Jantunen, A., Puumalainen, K., Saarenketo, S., and Kyläheiko, K. (2005).
Entrepreneurial orientation, dynamic capabilities and international performance. Journal
of International Entrepreneurship. 3(3): 223–243.
Johns, G. (2006). The essential impact of context on organizational behaviour.
Academy of Management Review. 31(2): 386–408.
Katsikeas, C. S., Leonidou, L. C., and Morgan, N. A. (2000). Firm-level export
performance assessment: Review, evaluation, and development. Journal of the
Academy of Marketing Science. 28(4): 493-511.
Page 172
171
Kile, C.O., and Phillips, M.E., (2009). Using industry classification codes to sample high
technology firms: analysis and recommendations. Journal of Accounting, Auditing, and
Finance, 24(1): 35-58.
Kim W.C., and Mauborgne R. (1997). Value innovation: the strategic logic of high
growth. Harvard Business Review, 75(1): 103–112.
Kim, W.C. and Maubourgne, R., 2005. Blue ocean strategy. Harvard Business School
Press, Boston, MA.
Knight, F.H. (1921). Risk, Uncertainty and Profit. Houghton Mifflin: New York.
Kreiser, P. M. (2011). Entrepreneurial Orientation and Organizational Learning: The
Impact of Network Range and Network Closure. Entrepreneurship Theory and Practice,
35(5): 1025–1050.
Lau, C., Yiu, D.W., Yeung, P. and Lu, Y. (2008). Strategic orientation of high-technology
firms in a transitional economy. Journal of Business Research, 61(7): 765–777.
Lau C.M., and Bruton G.D. (2011). Strategic orientations and strategies of high
technology ventures in two transition economies. Journal of World Business, 46(3):
371–380.
Lee, C., Lee, K., and Pennings, J.M. (2001). Internal capabilities, external networks, and
performance: A study of technology bases ventures. Strategic Management Journal,
22(6-7): 615–640.
Page 173
172
Li, Y.-H., Huang, J.-W., and Tsai, M.-T. (2009). Entrepreneurial orientation and firm
performance: The role of knowledge creation process. Industrial Marketing
Management, 38(4): 440–449.
Li, H., and Li, J. (2009). Top management team conflict and entrepreneurial strategy
making in China. Asia Pacific Journal of Management. 26(2): 263–283.
Lorentzen, J. (2009). Learning by firms: the black box of South Africa’s innovation
systems. Science and Public Policy, 36(1):33-45.
Lumpkin G.T., and Dess G.G. (1996). Clarifying the entrepreneurial orientation
construct and linking it to performance. Academy of Management Review, 21(1):135–
172.
Lumpkin G. T., and Dess G.G. (2001) Linking two dimensions of entrepreneurial
orientation construct to firm performance: the moderating role of environment and
industry life cycle. Journal of Business Venturing, 16(5): 429–45.
March, J. G., (1978). Bounded rationality, ambiguity, and the engineering of choice.
Bell Journal of Economics, 9(2): 587–604.
March, J. G. (1982). The technology of foolishness. In J. G. a. J. P. O. March (Ed.),
Ambiguity and choice in organizations: 69-81. Bergen, Norway: Universitetsforlagetch
McGrath, R. and MacMillan, I.C. (1995). Discovery-driven planning. Harvard Business
Review, 73(4): 44–54.
Page 174
173
Messeghem, K. (2003). Strategic Entrepreneurship and Managerial Activities in SMEs.
International Small Business Journal, 21(2): 197–212.
Miles M.P., and Arnold D.R. (1991). The relationship between marketing orientation and
entrepreneurial orientation. Entrepreneurship Theory and Practice, 15(4): 49–66.
Miles, R. E., and Snow, C. C. (1978). Organizational strategy, structure, and process.
New York: McGraw Hill.
Miller, D. and Friesen, P. (1978). Archetypes of strategy formulation. Management
Science, 24(9): 921-933.
Miller, D. and Friesen, P.H. (1982). Innovation in conservative and entrepreneurial firms:
Two models of strategic momentum. Strategic Management Journal, 3(1): 1–25.
Miller D. and Friesen P.H. (1983). Strategy-making and environment: the third link.
Strategic Management Journal 4(3): 221–235.
Miller D. (1983). The correlates of entrepreneurship in three types of firms. Management
Science. 29(7): 770–791.
Miller, D., Droge, C., and Toulous, J. (1988). Strategic process and content as
mediators between organizational context and structure. Academy of Management
Journal, 31(3): 544-569.
Miller, D. (2011). Miller (1983) Revisited: A Reflection on EO Research and Some
Suggestions for the Future. Entrepreneurship Theory and Practice, 35(5): 873–894.
Page 175
174
Mintzberg H., and Waters J.A. (1985). Of strategies, deliberate and emergent. Strategic
Management Journal 6(3): 257–272.
Mintzberg, H. (1973). Strategy-making in three modes. California Management Review,
16(2): 44–53.
Mintzberg, H., Raisinghani, D., and Theoret, A. (1976). The structure of “unstructured”
decision processes. Administrative Science Quarterly, 21(2): 246–275.
Mukhopadhyay, T., Vicinanza, S.S. and Prietula, M.J. (1992). Examining the Feasibility
of a Case-Based Reasoning Model for Software Effort Estimation. MIS Quarterly, 16(2):
155-171
Naman, J. L. and Slevin, D.P. (1993). Entrepreneurship and the concept of fit: A model
and empirical tests. Strategic Management Journal, 14(2): 137–153.
Neuman W. L. (2003). Social Research Methods: Qualitative and Quantitative
Approaches. Boston: Allyn and Bacon.
OECD (2007). Review of South Africa’s Innovation Policy. 26–27 March. Paris: OECD.
Onwuegbuzie, A. J., and Leech, N. L. (2005). Taking the “Q” out of research: Teaching
research methodology courses without the divide between quantitative and qualitative
paradigms. Quality and Quantity: International Journal of Methodology, 39(3): 267-295.
Pearce, J.A. II., Fritz, P., and Davis, P.S. (2010). Entrepreneurial orientation and the
performance of religious congregations as predicted by rational choice theory.
Entrepreneurship Theory and Practice, 34(1): 219–248.
Page 176
175
Penrose, E. (1959). The theory of the growth of the firm. London: Basil Blackwell.
Peng, M. W. (2000). Business strategies in transition economies. Thousand Oaks:
Sage.
Peng, M. W. (2001). How entrepreneurs create wealth in transition economies.
Academy of Management Executive, 15(1): 95–110.
Peng, M. 2002. Towards an institution-based view of business strategy. Asia Pacific
Journal of Management, 19(2–3): 251–267.
Perry, J. T., Chandler, G. N. and Markova, G. (2011). Entrepreneurial Effectuation: A
Review and Suggestions for Future Research. Entrepreneurship Theory and Practice.
Early View (Online Version of Record published before inclusion in an issue).
Porter, M.E. 1980. Competitive Strategy: Techniques for Analyzing Industries and
Competitors. Free Press, New York.
Powell, T. (2003). Varieties of competitive parity. Strategic Management Journal, 24(1):
61-86.
Powell, T. (1995). Total quality management as competitive advantage: A review and
empirical study. Strategic Management Journal, 16(1): 15-37.
Rauch, A., Wiklund, J., Lumpkin, G.T., and Frese, M. (2009). Entrepreneurial orientation
and business performance: Cumulative empirical evidence. Entrepreneurship Theory
and Practice, 33(3): 761–788.
Page 177
176
Read, S., Dew, N., Sarasvathy, S.D., Song, M., and Wiltbank, R. (2009). Marketing
under uncertainty: The logic of an effectual approach. Journal of Marketing, 73(3): 1-18.
Read, S., Song, M., and Smit, W. (2009). A meta-analytic review of effectuation and
venture performance. Journal of Business Venturing, 24(6): 573–587.
Richard, P.J., Devinney, T.M., Yip, G.S., and Johnson, G. (2009). Measuring
organisational performance: towards methodological best practice. Journal of
Management, 35 (3): 718-804.
Rodrigues, R. G. and Raposo, M. (2011). Entrepreneurial Orientation, Human
Resources Information Management, and Firm Performance in SMEs. Canadian
Journal of Administrative Sciences, 28(2): 143–153.
Rosenbusch, N., Rauch, A. and Bausch, A. (2011). The Mediating Role of
Entrepreneurial Orientation in the Task Environment–Performance Relationship: A
Meta-Analysis. Journal of Management, 38(2): 1-27.
Sarasvathy, S. D. (2001a). Causation and effectuation: Toward a theoretical shift from
economic inevitability to entrepreneurial contingency. The Academy of Management
Review, 26(2): 243-263.
Sarasvathy, S. D. (2001b). Sarasvathy, S. D. 2001. Effectual reasoning in
entrepreneurial decision making: Existence and bounds. Paper presented at the
Academy of Management meeting, Washington, DC.
Page 178
177
Sarasvathy, S. D. (2002). Entrepreneurship as a Science of the Artificial. Journal of
Economic Psychology, 24(2): 203-220.
Sarasvathy, S. D. and Dew, N. (2005). Entrepreneurial logics for a technology of
foolishness, Scandinavian Journal of Management, 21(4): 385 - 406.
Sarasvathy, S.D., Dew, N., Velamuri, R.S., and Venkataraman, S. (2003). Three views
of entrepreneurial opportunity. In Z. Acs and D. Audretsch (Eds.), Handbook of
entrepreneurial research (pp. 141–160). Dordrecht: Kluwer.
Sarasvathy, S. D. and Venkataraman, S. (2011). Entrepreneurship as Method: Open
Questions for an Entrepreneurial Future. Entrepreneurship Theory and Practice,
35(1): 113–135.
Schneider, K.C., and Johnson, J.C. (1995). Stimulating response to market surveys of
business professionals. Industrial Marketing Management, 24(4): 265–276.
Schumpeter, A. (1934). The Theory of Economic Development. Harvard University
Press, Cambridge, MA.
Shane S. (2003). A General Theory of Entrepreneurship: The Individual-opportunity
Nexus. Edward Elgar: Northampton, MA.
Simon H.A. (1996). Sciences of the Artificial (3rd ed). Cambridge, MA: MIT Press.
Sirmon, D. G., Hitt, M. A. and Ireland, R. D. (2007). Managing firm resources in dynamic
environments to create value: looking inside the black box. Academy of Management
Review, 32(1): 273–92.
Page 179
178
Slevin, D. P. and Terjesen, S. A. (2011). Entrepreneurial Orientation: Reviewing Three
Papers and Implications for Further Theoretical and Methodological Development.
Entrepreneurship Theory and Practice, 35(5): 973–987.
Statistics South Africa. (2011). Quarterly Labour Force Surveys. Pretoria: Statistics
South Africa.
Su, Z., Xie, E. and Li, Y. (2011). Entrepreneurial Orientation and Firm Performance in
New Ventures and Established Firms. Journal of Small Business Management,
49(4): 558–577.
Tang, Z., and Tang, J. (2010). Tang Z, Tang J (2010). Entrepreneurial orientation and
SME performance in China’s changing environment: The moderating effects of
strategies. Asia Pacific Journal of Management, pp. 1-23.
Tang, J., Tang, Z., Marino, L. D., Zhang, Y. and Li, Q. (2008). Exploring an Inverted U-
Shape Relationship between Entrepreneurial Orientation and Performance in Chinese
Ventures. Entrepreneurship Theory and Practice, 32(1): 219–239.
Urban, B. and Barreira, J. (2010). Empirical investigations into firm technology
orientation and entrepreneurial orientation. In: Urban, B. and Myers (eds)
Entrepreneurship Research in Africa. Johannesburg: Pearson Education South Africa.
Van de Ven, A.H., 1986. Central problems in the management of innovation.
Management Science 32(5), 590–607.
Page 180
179
Venkatraman, N. (1989). Strategic orientation of business enterprises: The construct,
dimensionality, and measurement. Management Science, 15(8): 942-962.
Venkataraman, S. (1997). The distinctive domain of entrepreneurship research: An
editor’s perspective. In J. Katz and R. Brockhaus (Eds.), Advances in entrepreneurship,
firm emergence and growth: Vol. 3, 119–138. Greenwich, CT: JAI Press.
Venkatraman, N., and Ramanujam, V. (1986). Measurement of business performance
in strategy research: A comparison of approaches. Academy of Management Review,
11(4), 801-814.
Venkataraman, S. and Sarasvathy, S.D. (2001). Strategy and entrepreneurship. In: M.A.
Hitt, R.E. Freeman, and J.R. Harrison (eds.), Handbook of strategic management, 650–
668. Oxford, U.K.: Blackwell Publishin
Verreynne, M.-L. (2006). ‘Strategy-making process and firm performance in small firms’.
Journal of Management and Organization, 12(3): 209–222.
Venter, R., Urban, B. and Rwigema, H. (2007). Entrepreneurship: Theory in Practice.
2nd edition. South Africa: Oxford University Press.
Wall, T., Michie, J., Patterson, M., Wood, S., Sheehan, M., Clegg, C., and West, M.
(2004). On the validity of subjective measures of company performance. Personnel
Psychology, 57(1): 95–118.
Wernerfelt, B. (1984). A resource-based view of the firm. Strategic Management
Journal, 5(2): 171-180.
Page 181
180
Wiklund, J. (1999). The sustainability of the entrepreneurial orientation—Performance
relationship. Entrepreneurship Theory and Practice, 24(1): 37–48.
Wiklund, J. and Shepherd, D. (2011). Where to from here: EO as experimentation,
failure, and distribution of outcomes. Entrepreneurship Theory and Practice, 35(5): 925–
946.
Wiklund, J. and Shepherd, D. (2003). Knowledge-based resources, entrepreneurial
orientation, and the performance of small and medium sized businesses. Strategic
Management Journal, 24(13): 1307–1314.
Wiltbank, R., Dew, N., Read, S., and Sarasvathy, S. D. (2006). What to do next? The
case for nonpredictive strategy. Strategic Management Journal, 27(10): 981-998.
Wiltbank, R., Read, S., Dew, N., and Sarasvathy, S. D. (2009). Prediction and control
under uncertainty: Outcomes in angel investing. Journal of Business Venturing,
24(2):116-133.
Yusuf, A. (2002). Environmental uncertainty, the entrepreneurial orientation of business
ventures and performance. International Journal of Commerce and Management, 12(3-
4), 83–103.
Zahra, S.A. (1991). Predictors and financial outcomes of corporate entrepreneurship:
An exploratory study. Journal of Business Venturing, 6(4): 259–285.
Zahra, S. A. (1993). A conceptual model of entrepreneurship as firm behavior: A critique
and extension. Entrepreneurship Theory and Practice, 18(1): 5-21.
Page 182
181
Zahra, S.A. and Covin, J.G. (1995). Contextual influences on the corporate
entrepreneurship performance relationship: A longitudinal analysis. Journal of Business
Venturing, 10(3): 43–58.
Zahra, S., A., and Bogner W., C. (1999). Contextual influences on the corporate
entrepreneurship-performance relationship: a longitudinal analysis. Journal of Business
Venturing, 10(1): 43-58.
Page 183
182
Appendix A- letter to respondents
Dear respondent,
I am completing a Masters in Management (ENVC) at The University of Witwatersrand,
Johannesburg (Wits). My thesis is on the impact of strategy pursued on performance in
high technology companies. Towards gathering data on this subject, I would be grateful
if you could take your time to complete this questionnaire. It should not take longer than
15 minutes. I understand you are extremely busy your agreement to contribute to my
research is greatly appreciated.
The questionnaire does not involve questions on your strategic plans for the future,
focussing more on the general manner in which strategy is formed in the company. Your
answers will be treated confidentially by Wits and the final report will be for academic
purposes only.
Thank you for your kind assistance.
Page 184
183
Appendix B- Questionnaire
Page 185
184
Appendix C- Results
Moderation results
Table 48: Hostility as a moderator of the effectuation-innovative performance relation
LEVEL 1 Base model Including moderator
Innovative Performance
B p B p
Intercept 1.94546 0.01
Effectuation 0.37181 0 0.5272 0.162276
Hostility 0.02503 0.81 0.25602 0.639163
Effectuation*Hostility
-0.30995 0.666485
R
2 base 0.14319 0.1451 0.004135
ΔR2 0.0019
F(2,85) base 7.10276
F(3,84) with moderator
4.75224
Table 49: Hostility as a moderator of the experimentation-innovative performance relation
LEVEL 1 Base model Including moderator
Innovative Performance
B p B p
Intercept 2.86022 0
Experimentation 0.38429 0 0.28463 0.038213
Hostility 0.05299 0.6 -0.18242 0.441091
Exp*Hostility 0.29077 0.272471
R2 base 0.15667 0 0.16875 0.00136
ΔR2 0.01208
F(2,85) base 7.89554
F(3,84) with moderator
5.68407
Page 186
185
Table 50: Hostility as a moderator of the flexibility-innovative performance relation
LEVEL 1 Base model Including moderator
Innovative Performance
B p B p
Intercept 2.16318 0
Flexibility 0.41869 0 0.64069 0.036256
Hostility 0.0213 0.83 0.31015 0.419883
Flex*Hostility -0.40771 0.436066
R
2 base 0.17959 0 0.18553 0.000602
ΔR2 0.00594
F(2,85) base 9.30336
F(3,84) with moderator
6.37812
Table 51: Effectuation as a moderator of the EO-innovative performance relation
LEVEL 1 Base model Including moderator
Innovative Performance
B p B p
Intercept 1.08268 0.09
EO 0.4926 0 1.18481 0.00067
Effectuation 0.15194 0.13 1.80701 0.000046
EO*Effectuation -2.03315 0.001893
R
2 base 0.33566 0 0.40657 0
ΔR2 0.0709
F(2,87) base 21.9788
F(3,86) with moderator
19.6397
Page 187
186
Table 52: Experimentation as a moderator of the EO-innovative performance relation
LEVEL 1 Base model Including moderator
Innovative Performance
B p B p
Intercept 1.67014 0
EO 0.51128 0 1.14315 0.000135
Experimentation
0.09058 0.4 0.86745 0.013385
EO*Exp -1.26935 0.019716
R2 base 0.32309 0 0.36479 0
ΔR2 0.0417
F(2,87) base 20.7621
F(3,86) with moderator
16.4626
Table 53: Affordable loss as a moderator of the EO-innovative performance relation
LEVEL 1 Base model Including moderator
Innovative Performance
B p B p
Intercept 1.5935 0.01
EO 0.56296 0.81 1.42831 0.000023
Affordable loss 0.03994 0 1.08426 0.005443
EO*AffLoss -1.38729 0.00599
R2 base 0.31921 0 0.37677 0
ΔR2 0.05756
F(2,87) base 20.3963
F(3,86) with moderator
17.3302
Page 188
187
Table 54: Flexibility as a moderator of the EO-innovative performance relation
LEVEL 1 Base model Including moderator
Innovative Performance
B p B p
Intercept 0.97751 0.08
EO 0.46839 0 1.18659 0.000245
Flexibility 0.23259 0.02 0.92254 0.002726
EO*Flex -1.19923 0.017444
R
2 base 0.36266 0 0.40342 0
ΔR2 0.040761
F(2,87) base 24.7519
F(3,86) with moderator
19.3847
Table 55: Pre-commitments as a moderator of the EO-innovative performance relation
LEVEL 1 Base model Including moderator
Innovative Performance
B p B p
Intercept 1.85918 0
EO 0.56829 0 0.29307 0.426668
Pre-commitments
-0.02685 0.77 -0.34811 0.414873
EO*Pre-commit 0.46339 0.441216
R
2 base 0.31831 0 0.32303 0
ΔR2 0.004712
F(2,87) base 24.7519
F(3,86) with moderator
13.6786
Page 189
188
Figure 19: Scatterplot of Effectuation against EO
Figure 20: Scatterplot of Effectuation against Hostility
Figure 21: Scatterplot of Innovative performance against Effectuation
Page 190
189
Figure 22: Scatterplot of Innovative performance against experimentation
Figure 23: Scatterplot of Innovative performance against Affordable loss
Page 191
190
Figure 24: Scatterplot of Innovative performance against Flexibility
Figure 25: Scatterplot of Innovative performance against Pre-commitments/Partnerships
Page 192
191
Figure 26: Scatterplot of Performance against EO
Page 193
192
Regression Results
Table 56: Regression results: IV EO and DV Effectuation
Univariate Tests of Significance, Effect Sizes, and Powers for Effectuation
SS Degr. of - Freedom
MS F p Partial eta-squared
Non-centrality Observed power (alpha=0.05)
Intercept 42.76329 1 42.76329 86.94965 0 0.485889 86.94965 1
EO 12.31411 1 12.31411 25.038 0.000003 0.213931 25.038 0.99861
Error 45.24714 92 0.49182
Parameter Estimates
Effectuation - Param.
Effectuation - Std.Err
Effectuation - t
Effectuation - p
-95.00% - Cnf.Lmt
+95.00% - Cnf.Lmt
Effectuation - Beta (ß)
Effectuation - St.Err.ß
-95.00% - Cnf.Lmt
+95.00% - Cnf.Lmt
Intercept 3.354554 0.35975 9.32468 0 2.640059 4.069048
EO 0.390319 0.078004 5.003798 0.000003 0.235395 0.545242 0.462526 0.092435 0.278942 0.64611
Test of SS Whole Model vs. SS Residual (Data all2 corrected)
Multiple - R Multiple - R² Adjusted - R² SS - Model df - Model MS - Model
SS - Residual df - Residual MS - Residual
F
Effectuation 0.462526 0.213931 0.205386 12.31411 1 12.31411 45.24714 92 0.491817 25.038
Page 194
193
Table 57: Regression results: IV Environmental Hostility and DV Effectuation
Univariate Tests of Significance, Effect Sizes, and Powers for Effectuation
SS Degr. of - Freedom
MS F p Partial eta-squared
Non-centrality
Observed power (alpha=0.05)
Intercept 84.08337 1 84.08337 137.0437 0 0.614425 137.0437 1
Hostility 3.00468 1 3.00468 4.8972 0.029549 0.053876 4.8972 0.590286
Error 52.76544 86 0.61355
Parameter Estimates
Effectuation - Param.
Effectuation - Std.Err
Effectuation - t
Effectuation - p
-95.00% - Cnf.Lmt
+95.00% - Cnf.Lmt
Effectuation - Beta (ß)
Effectuation - St.Err.ß
-95.00% - Cnf.Lmt
+95.00% - Cnf.Lmt
Intercept 4.347821 0.3714 11.70656 0 3.609502 5.086141
Hostility 0.169983 0.076813 2.21296 0.029549 0.017285 0.322682 0.232112 0.104888 0.023602 0.440622
Test of SS Whole Model vs. SS Residual
Multiple - R Multiple - R² Adjusted - R² SS - Model df - Model MS - Model
SS - Residual df - Residual MS - Residual
F
Effectuation 0.232112 0.053876 0.042875 3.004679 1 3.004679 52.76544 86 0.613552 4.89719
Page 195
194
Table 58: Regression results: IV effectuation and DV Innovative performance
Univariate Tests of Significance, Effect Sizes, and Powers for Performance: Innovativeness
SS Degr. of - Freedom
MS F p Partial eta-squared
Non-centrality
Observed power (alpha=0.05)
Intercept 8.3633 1 8.3633 8.54983 0.004393
0.088554
8.54983 0.82433
Effectuation 14.71117 1 14.71117 15.03927 0.000203
0.145957
15.03927 0.969633
Error 86.08019 88 0.97818
Parameter Estimates
Performance: Innovativeness - Param.
Performance: Innovativeness - Std.Err
Performance: Innovativeness - t
Performance: Innovativeness - p
-95.00% - Cnf.Lmt
+95.00% - Cnf.Lmt
Performance: Innovativeness - Beta (ß)
Performance: Innovativeness - St.Err.ß
-95.00% - Cnf.Lmt
+95.00% - Cnf.Lmt
Intercept 1.998699 0.683548 2.924009 0.004393 0.640292
3.357107
Effectuation 0.51017 0.131553 3.878049 0.000203 0.248736
0.771605
0.382043 0.098514 0.186267
0.577819
Test of SS Whole Model vs. SS Residual
Multiple - R Multiple - R² Adjusted - R² SS - Model df - Model
MS - Model
SS - Residual df - Residual MS - Residual
F p
Performance: Innovativeness
0.382043 0.145957 0.136252 14.71117 1 14.71117
86.08019 88 0.978184
15.03927
0.000203
Page 196
195
Table 59: Regression results: IV Experimentation and DV Innovative performance
Univariate Tests of Significance, Effect Sizes, and Powers for Performance: Innovativeness
SS Degr. of - Freedom
MS F p Partial eta-squared
Non-centrality
Observed power (alpha=0.05)
Intercept 56.78306 1 56.78306 58.24273 0 0.398261
58.24273 1
Experiment-ation
14.9968 1 14.9968 15.3823 0.000174
0.14879 15.3823 0.972502
Error 85.79456 88 0.97494
Parameter Estimate
Performance: Innovativeness - Param.
Performance: Innovativeness - Std.Err
Performance: Innovativeness - t
Performance: Innovativeness - p
-95.00% - Cnf.Lmt
+95.00% - Cnf.Lmt
Performance: Innovativeness - Beta (ß)
Performance: Innovativeness - St.Err.ß
-95.00% - Cnf.Lmt
+95.00% - Cnf.Lmt
Intercept 3.086011 0.404368 7.631693 0 2.282415
3.889607
Experimentation
0.317314 0.080906 3.922028 0.000174 0.156531
0.478096
0.385734 0.098351 0.190283
0.581185
Test of SS Whole Model vs. SS Residual
Multiple - R Multiple - R² Adjusted - R² SS - Model df - Model
MS - Model
SS - Residual df - Residual MS - Residual
F p
Performance: Innovativeness
0.385734 0.14879 0.139118 14.9968 1 14.9968 85.79456 88 0.974938
15.3823 0.000174
Page 197
196
Table 60: Regression results: IV EO and DV Experimentation
Parameter Estimates
Experimentation - Param.
Experimentation - Std.Err
Experimentation - t
Experimentation - p
-95.00% - Cnf.Lmt
+95.00% - Cnf.Lmt
Experimentation - Beta (ß)
Experimentation - St.Err.ß
-95.00% - Cnf.Lmt
+95.00% - Cnf.Lmt
Intercept 1.322924 0.54265 2.437895 0.016695 0.245174
2.400675
EO 0.781739 0.117663 6.643898 0 0.548051
1.015427
0.569414 0.085705 0.399197
0.739631
Test of SS Whole Model vs. SS Residual
Multiple - R Multiple - R² Adjusted - R² SS - Model df - Model
MS - Model
SS - Residual df - Residual MS - Residual
F p
Experimentation
0.569414 0.324232 0.316887 49.39555 1 49.39555
102.9508 92 1.11903 44.14139
0
Table 61: Regression results: IV Flexibility and DV Innovative performance
Univariate Tests of Significance, Effect Sizes, and Powers for Performance: Financial
SS Degr. of - Freedom
MS F p Partial eta-squared
Non-centrality Observed power (alpha=0.05)
Intercept 26.6276 1 26.62759 17.52411 0.000067 0.166067 17.52411 0.985376
Flexibility 6.6077 1 6.60769 4.34864 0.039935 0.047089 4.34864 0.540883
Error 133.7145 88 1.51948
Parameter Estimates
Performance: Financial - Param.
Performance: Financial - Std.Err
Performance: Financial - t
Performance: Financial - p
-95.00% - Cnf.Lmt
+95.00% - Cnf.Lmt
Performance: Financial - Beta (ß)
Performance: Financial - St.Err.ß
-95.00% - Cnf.Lmt
+95.00% - Cnf.Lmt
Intercept 2.857913 0.682702 4.18618 0.000067 1.501187 4.21464
Flexibility 0.257498 0.12348 2.085339 0.039935 0.012107 0.502889 0.217001 0.10406 0.010203 0.423799
Test of SS Whole Model vs. SS Residual
Multiple - R Multiple - R² Adjusted - R² SS - Model df - Model MS - Model
SS - Residual df - Residual MS - Residual
F p
Performance: Financial
0.217001 0.047089 0.036261 6.607686 1 6.607686 133.7145 88 1.519483 4.34864 0.039935
Page 198
197
Table 62: Regression results: IVs Effectuation and EO, and DV Innovative performance
Parameter Estimates
Performance: Innovativeness - Param.
Performance: Innovativeness - Std.Err
Performance: Innovativeness - t
Performance: Innovativeness - p
-95.00% - Cnf.Lmt
+95.00% - Cnf.Lmt
Performance: Innovativeness - Beta (ß)
Performance: Innovativeness - St.Err.ß
-95.00% - Cnf.Lmt
+95.00% - Cnf.Lmt
Intercept 1.765278 0.455458 3.875829 0.000204 0.86015 2.670405
EO 0.632319 0.098801 6.399946 0 0.435973
0.828664
0.563573 0.088059 0.388574
0.738571
Test of SS Whole Model vs. SS Residual
Multiple - R Multiple - R² Adjusted - R² SS - Model df - Model
MS - Model
SS - Residual df - Residual MS - Residual
F p
Performance: Innovativeness 0.563573 0.317614 0.30986 32.01277 1 32.01277
68.77859 88 0.781575
40.95931
0
Parameter Estimates
Performance: Innovativeness - Param.
Performance: Innovativeness - Std.Err
Performance: Innovativeness - t
Performance: Innovativeness - p
-95.00% - Cnf.Lmt
+95.00% - Cnf.Lmt
Performance: Innovativeness - Beta (ß)
Performance: Innovativeness - St.Err.ß
-95.00% - Cnf.Lmt
+95.00% - Cnf.Lmt
Intercept 1.998699 0.683548 2.924009 0.004393 0.640292
3.357107
Effectuation 0.51017 0.131553 3.878049 0.000203 0.248736
0.771605
0.382043 0.098514 0.186267
0.577819
Test of SS Whole Model vs. SS Residual
Multiple - R Multiple - R² Adjusted - R² SS - Model df - Model
MS - Model
SS - Residual df - Residual MS - Residual
F p
Performance: Innovativeness 0.382043 0.145957 0.136252 14.71117 1 14.71117
86.08019 88 0.978184
15.03927
0.000203
Page 199
198
Table 63: Regression results: IV experimentation and DV Innovative performance
Parameter Estimates
Performance: Innovativeness - Param.
Performance: Innovativeness - Std.Err
Performance: Innovativeness - t
Performance: Innovativeness - p
-95.00% - Cnf.Lmt
+95.00% - Cnf.Lmt
Performance: Innovativeness - Beta (ß)
Performance: Innovativeness - St.Err.ß
-95.00% - Cnf.Lmt
+95.00% - Cnf.Lmt
Intercept 3.086011 0.404368 7.631693 0 2.282415
3.889607
Experimentation 0.317314 0.080906 3.922028 0.000174 0.156531
0.478096
0.385734 0.098351 0.190283 0.581185
Test of SS Whole Model vs. SS Residual
Multiple - R Multiple - R² Adjusted - R²
SS - Model df - Model
MS - Model
SS - Residual df - Residual MS - Residual
F p
Performance: Innovativeness 0.385734 0.14879 0.139118 14.9968 1 14.9968 85.79456 88 0.974938 15.3823
0.000174
Table 64: Regression results: IV Affordable loss and DV Innovative performance
Parameter Estimates
Performance: Innovativeness - Param.
Performance: Innovativeness - Std.Err
Performance: Innovativeness - t
Performance: Innovativeness - p
-95.00% - Cnf.Lmt
+95.00% - Cnf.Lmt
Performance: Innovativeness - Beta (ß)
Performance: Innovativeness - St.Err.ß
-95.00% - Cnf.Lmt
+95.00% - Cnf.Lmt
Intercept 4.40603 0.479556 9.187733 0 3.453014
5.359046
Affordable loss 0.042123 0.092405 0.455857 0.649616 -0.14151
0.225758
0.048537 0.106475 -0.16306 0.260133
Test of SS Whole Model vs. SS Residual
Multiple - R Multiple - R² Adjusted - R²
SS - Model df - Model
MS - Model
SS - Residual df - Residual MS - Residual
F p
Performance: Innovativeness 0.048537 0.002356 -0.00898 0.237451 1 0.237451
100.5539 88 1.142658 0.207806
0.649616
Page 200
199
Table 65: Regression results: IV Flexibility and DV Innovative performance
Parameter Estimates
Performance: Innovativeness - Param.
Performance: Innovativeness - Std.Err
Performance: Innovativeness - t
Performance: Innovativeness - p
-95.00% - Cnf.Lmt
+95.00% - Cnf.Lmt
Performance: Innovativeness - Beta (ß)
Performance: Innovativeness - St.Err.ß
-95.00% - Cnf.Lmt
+95.00% - Cnf.Lmt
Intercept 2.30263 0.536736 4.290061 0.000046 1.23598
3.36928
Flexibility 0.426673 0.097079 4.395099 0.000031 0.233749
0.619598
0.424262 0.096531 0.232428
0.616097
Test of SS Whole Model vs. SS Residual (Data all2 corrected)
Multiple - R Multiple - R²
Adjusted - R²
SS - Model df - Model
MS - Model
SS - Residual
df - Residual
MS - Residual
F p
Performance: Innovativeness 0.424262 0.179999 0.17068 18.14231 1 18.14231
82.64905 88 0.939194
19.3169
0.000031
Table 66: Regression results: IV Pre-commitments and DV Innovative performance
Parameter Estimates
Performance: Innovativeness - Param.
Performance: Innovativeness - Std.Err
Performance: Innovativeness - t
Performance: Innovativeness - p
-95.00% - Cnf.Lmt
+95.00% - Cnf.Lmt
Performance: Innovativeness - Beta (ß)
Performance: Innovativeness - St.Err.ß
-95.00% - Cnf.Lmt
+95.00% - Cnf.Lmt
Intercept 4.2984 0.479752 8.959635 0 3.344994
5.251805
Pre-commitments 0.062226 0.090656 0.686402 0.494264 -0.11793
0.242385
0.072976 0.106316 -0.13831
0.284257
Test of SS Whole Model vs. SS Residual
Multiple - R Multiple - R² Adjusted - R² SS - Model df - Model
MS - Model
SS - Residual df - Residual MS - Residual
F p
Performance: Innovativeness 0.072976 0.005325 -0.00598 0.536758 1 0.536758
100.2546 88 1.139257
0.471148
0.494264
Page 201
200
Table 67: Regression results: IV EO and DV Performance
Univariate Tests of Significance, Effect Sizes, and Powers for Performance
SS Degr. of - Freedom
MS F p Partial eta-squared
Non-centrality
Observed power (alpha=0.05)
Intercept 26.14531 1 26.14531 37.00632 0 0.296036
37.00632 0.999975
EO 13.61414 1 13.61414 19.26959 0.000031
0.179637
19.26959 0.991376
Error 62.17282 88 0.70651
Parameter Estimates
Performance - Param.
Performance - Std.Err
Performance - t
Performance - p
-95.00% - Cnf.Lmt
+95.00% - Cnf.Lmt
Performance - Beta (ß)
Performance - St.Err.ß
-95.00% - Cnf.Lmt
+95.00% - Cnf.Lmt
Intercept 2.634268 0.433034 6.083282 0 1.773704
3.494832
EO 0.412353 0.093936 4.389714 0.000031 0.225675
0.599032
0.423836 0.096552 0.231959
0.615713
Test of SS Whole Model vs. SS Residual
Multiple - R Multiple - R² Adjusted - R²
SS - Model df - Model
MS - Model
SS - Residual df - Residual MS - Residual
F p
Performance
0.423836 0.179637 0.170315 13.61414 1 13.61414
62.17282 88 0.706509
19.26959
0.000031
Page 202
201
Descriptive Statistics
Table 68: Descriptive statistics (all data)
Descriptive Statistics
Valid N Mean Confidence - -95.000% Confidence - 95.000% Median Minimum Std.Dev. Skewness Kurtosis
Effectuation 94.00 5.12 4.96 5.28 5.17 2.92 0.79 -0.21 0.56
EO 94.00 4.52 4.33 4.71 4.61 2.11 0.93 -0.29 -0.07
Performance 90.00 4.49 4.30 4.69 4.50 1.55 0.92 -0.55 0.69
Hostility 88.00 4.71 4.48 4.94 4.80 1.60 1.09 -0.49 -0.03
Experimentation 94.00 4.85 4.59 5.12 5.00 1.33 1.28 -0.49 0.07
Affordable loss 94.00 4.98 4.72 5.24 5.00 1.00 1.28 -0.72 0.28
Flexibility 94.00 5.41 5.19 5.62 5.50 1.75 1.04 -1.19 2.23
Pre-commitments 94.00 5.14 4.89 5.40 5.50 1.00 1.24 -1.14 1.54
Proactiveness 94.00 4.87 4.64 5.09 5.00 1.00 1.10 -0.60 0.67
Risk taking 94.00 4.41 4.17 4.66 4.33 1.00 1.20 -0.25 -0.03
Innovativeness 94.00 4.28 4.03 4.52 4.33 1.00 1.20 -0.52 -0.23
Performance: Financial 90.00 4.26 3.99 4.52 4.40 1.00 1.26 -0.47 -0.01
Performance: Market 90.00 4.77 4.55 4.99 4.67 1.00 1.04 -0.54 1.25
Performance: Innovativeness 90.00 4.62 4.40 4.84 4.67 1.00 1.06 -0.57 1.20
Hostility: Riskiness 88.00 4.42 4.12 4.72 4.50 1.00 1.43 -0.40 -0.48
Hostility: Competition 88.00 4.91 4.64 5.17 5.17 1.33 1.27 -0.42 -0.20
Q6: The product/service that my company now provides is essentially the same as originally conceptualised
94.00 3.07 2.69 3.46 2.00 1.00 1.86 0.82 -0.64
Q7: My company has experimented with different products and/or business models
94.00 5.61 5.34 5.87 6.00 2.00 1.30 -1.40 1.83
Q8: When launching a new product or service, my company tries a number of different approaches
94.00 5.10 4.77 5.42 6.00 1.00 1.57 -0.94 0.07
Q9: The product/service that my company now provides is substantially different than we first imagined
94.00 3.86 3.48 4.25 4.00 1.00 1.88 0.05 -1.40
Page 203
202
Q10: When launching a new product/service, my company is careful to invest only the resources we can afford to lose.
94.00 4.35 3.99 4.71 5.00 1.00 1.74 -0.23 -1.30
Q11: When launching a new product/service, my company is careful not to risk more money than we are willing to loose.
94.00 4.87 4.54 5.20 5.00 1.00 1.60 -0.77 -0.32
Q12: When launching a new product/service, we are careful to invest only so much money that the company will survive
94.00 5.71 5.44 5.98 6.00 1.00 1.31 -1.68 3.02
Q13: My company allows the business to evolve as opportunities emerge.
94.00 5.80 5.55 6.05 6.00 1.00 1.21 -1.92 4.29
Q14: My company has adapted what we are doing to the resources we have
94.00 5.09 4.74 5.43 6.00 1.00 1.70 -0.80 -0.48
Q15: My company is flexible and takes advantage of opportunities as they arise.
94.00 5.69 5.45 5.93 6.00 2.00 1.15 -1.46 2.39
Q16: My company has avoided courses of action that restrict our flexibility and adaptability.
94.00 5.05 4.74 5.37 6.00 1.00 1.53 -0.96 -0.05
Q17: My company has a substantial number of agreements with customers, suppliers and other organisations.
94.00 5.14 4.82 5.46 6.00 1.00 1.55 -1.10 0.55
Q18: My company uses pre-commitments from customers and suppliers as often as possible.
94.00 5.15 4.87 5.43 5.00 1.00 1.38 -1.32 1.74
Q19: At my company, we talk with people we know to enlist their support in developing the business.
94.00 4.64 4.28 4.99 5.00 1.00 1.73 -0.86 -0.26
Q20: My company typically initiates actions that competitors respond to.
94.00 5.10 4.83 5.36 5.00 1.00 1.30 -0.97 1.22
Q21: My company is very often the first business to introduce new products/services, administrative techniques etc
94.00 4.79 4.49 5.08 5.00 1.00 1.45 -0.70 0.15
Q22: My company typically adopts a very competitive, aggressive stance against competitors
94.00 4.71 4.42 5.01 5.00 1.00 1.45 -0.33 -0.50
Q23: My company has a strong inclination for high-risk projects with chances of very high returns
94.00 3.54 3.22 3.86 3.00 1.00 1.57 0.25 -0.97
Q24: Owing to the nature of the environment, bold initiatives are necessary to achieve my company's objectives
94.00 5.03 4.74 5.33 5.00 1.00 1.44 -0.81 0.24
Page 204
203
Q25: My company typically adopts a bold, aggressive posture in order to maximise the probability of explo
94.00 4.66 4.37 4.95 5.00 1.00 1.41 -0.64 -0.15
Q26: My company has a strong emphasis on research and development, technological leadership…
94.00 4.89 4.52 5.27 5.00 1.00 1.82 -0.69 -0.58
Q27: My company has many lines of products or services
94.00 4.73 4.39 5.08 5.00 1.00 1.69 -0.55 -0.99
Q28: At my company, there have been considerable changes in our product or service lines
94.00 3.20 2.98 3.42 3.00 1.00 1.06 -0.14 -1.06
Q29: Over the past 5 years, our financial performance has exceeded our expectations
90.00 4.06 3.68 4.43 4.00 1.00 1.78 -0.23 -1.12
Q30: Over the past 5 years, our financial performance has exceeded that of our competitors
90.00 4.48 4.18 4.77 4.00 1.00 1.40 -0.48 -0.35
Q31: Over the past 5 years, we have been more profitable than our competitors have
90.00 4.48 4.20 4.75 4.00 1.00 1.31 -0.52 0.28
Q32: Over the past 5 years, our revenue (sales) growth has exceeded our expectations
90.00 3.99 3.65 4.32 4.00 1.00 1.60 -0.20 -0.98
Q33: Over the past 5 years, our revenue growth rate has exceeded that of our competitors
90.00 4.28 4.00 4.55 4.00 1.00 1.31 -0.63 0.53
Q34: Over the past 5 years, our customer satisfaction has been outstanding
90.00 5.02 4.73 5.32 5.00 1.00 1.40 -0.87 0.56
Q35: Over the past 5 years, our customer satisfaction has exceeded that of our competitors
90.00 4.99 4.75 5.23 5.00 1.00 1.16 -0.42 0.75
Q36: Last year, our market was share much higher than that of our competitors
90.00 4.30 3.99 4.61 4.00 1.00 1.46 -0.17 -0.17
Q37: Our company is better at introducing new products and services to the market than our competitors
90.00 4.42 4.13 4.72 4.00 1.00 1.40 -0.34 -0.18
Q38: Last year, the percentage of our new products in the existing product portfolio exceeded that of our competitors
90.00 4.10 3.81 4.39 4.00 1.00 1.39 -0.16 0.05
Q39: Over the last year, we have introduced innovations for work processes and methods
90.00 5.33 5.05 5.61 6.00 1.00 1.34 -1.35 2.06
Page 205
204
Q40: We have innovations under intellectual property protection
90.00 4.16 3.75 4.56 4.00 1.00 1.92 -0.21 -1.23
Q41: The failure rate of firms in my industry is high
88.00 4.51 4.17 4.85 5.00 1.00 1.60 -0.54 -0.40
Q42: My industry is very risky; one bad decision could threaten its viability
88.00 4.33 3.98 4.68 5.00 1.00 1.65 -0.28 -1.13
Q43: Competition in my industry is high 88.00 5.60 5.33 5.87 6.00 1.00 1.27 -1.40 2.12
Q44: Customer loyalty in my industry is low 88.00 4.14 3.78 4.50 5.00 1.00 1.70 -0.06 -1.16
Q45: Severe price wars are characteristic of my industry
88.00 4.53 4.17 4.90 5.00 1.00 1.73 -0.67 -0.57
Q46: Low profit margins are characteristic of my industry
88.00 4.58 4.19 4.97 5.00 1.00 1.83 -0.38 -1.04
Page 206
205
Residual Analysis
Figure 27: Histogram Residuals EO vs Effectuation
Figure 28: Normal probability plot: EO vs Effectuation
Page 207
206
Figure 29: Histogram Residuals Environmental Hostility vs Effectuation
Figure 30: Normal probability plot: Environmental Hostility vs Effectuation
Page 208
207
Figure 31: Histogram Residuals EO vs Experimentation
Figure 32: Normal probability plot: EO vs Experimentati
Page 209
208
Figure 33: Histogram Residuals EO vs Flexibility
Figure 34: Normal probability plot: EO vs Flexibility
Page 210
209
Figure 36: Normal probability plot: Effectuation vs Innovative performance
Figure 35: Normal probability plot: Effectuation vs Innovative Performance
Page 211
210
Figure 37: Histogram Residuals Flexibility vs Innovative Performance
Figure 38: Normal probability plot: Flexibility vs Innovative Performance
Page 212
211
Figure 39: Histogram Residuals Experimentation vs Innovative Performance
Figure 40: Normal probability plot: Experimentation vs Innovative Performance
Page 213
212
Figure 41: Histogram Residuals Effectuation as moderator
Figure 42: Normal probability plot: Effectuation as moderator
Page 214
213
Figure 43: Histogram Residuals: Hostility as moderator
Figure 44: Normal probability plot: Hostility as moderator