The impact of gender and business training for female microfinance clients in Vietnam Nhung Thi Hong Vu, Cantho University, Vietnam Rosine van Velzen, University of Groningen, The Netherlands Robert Lensink, University of Groningen, The Netherlands Erwin Bulte, Wageningen University, The Netherlands Grantee Final Report Accepted by 3ie: June 2015
Transcript
The impact of gender and business training for female
microfinance clients in Vietnam
Nhung Thi Hong Vu, Cantho University, Vietnam
Rosine van Velzen, University of Groningen, The Netherlands
Robert Lensink, University of Groningen, The Netherlands
Erwin Bulte, Wageningen University, The Netherlands
Grantee Final Report
Accepted by 3ie: June 2015
i
Note to readers
This impact evaluation has been submitted in partial fulfilment of the requirements of
grant OW3.1132 issued under Open Window 3. 3ie is making it available to the public
in this final report version. All content is the sole responsibility of the authors and does
not represent the opinions of 3ie, its donors or its board of commissioners. Any errors
and omissions are the sole responsibility of the authors. All affiliations of the authors
listed in the title page are those that were in effect at the time the report was accepted.
Any comments or queries should be directed to the corresponding author, Robert
provides local average treatment estimates to measure the effect of actual training
participation. Thus, we report five different effects: training effect in midline (1), training
effect endline (2), the additional impact of the endline (3), additional impact of inviting
husbands (4), and treatment-on-the-treated effects (5).
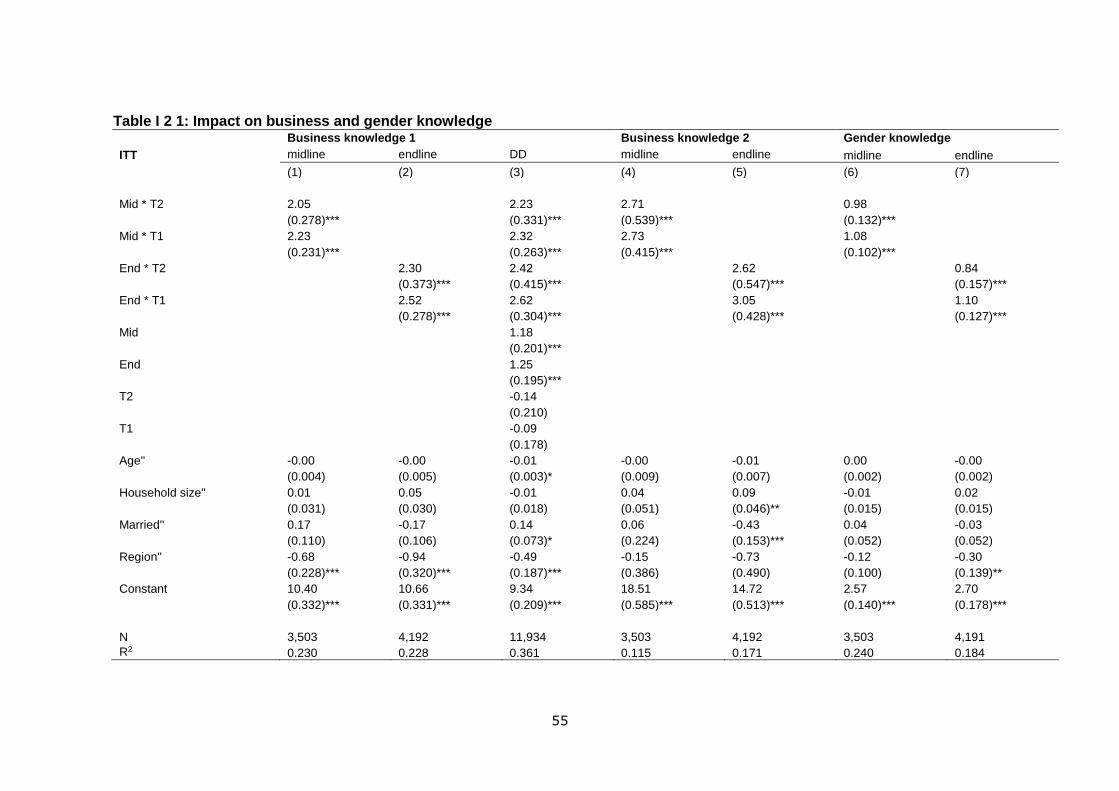
7.3.1 Effects of the G&B training on business and gender knowledge
Table I.2.1 demonstrates that the G&B training has a large impact on our measures of
business knowledge and gender knowledge. For all our knowledge indices we find
that, across estimators, participating in the training increased performance. All results
are statistically significant at the 1% level. Table I.3 reveals that inviting husbands
does not matter for knowledge accumulation: the coefficients of the T1 treatment arm
are statistically indistinguishable from the coefficients of the T2 treatment arm.
Moreover, extending the impact period from 6 to 12 months also does not have a
significant effect on the depreciation or accumulation of knowledge. As expected, the
impact of the G&B training on the measures of knowledge for the sub-sample of
females who were enticed to actually participate in the training after receiving the
invitation is even somewhat larger, as is shown in table I.4.
The impacts on the knowledge variables are also economically significant, as can e.g.
be seen by considering the post-treatment estimates for “End*.T2” with the constant.
The constant reflects the mean value for the control group at the endline, whereas
“End*T2” reflects the “additional impact on the treatment arm T2 at the endline. A
simple calculation than shows that”, compared to endline values for the control group,
the increases in the knowledge indices correspond to approximately 22% (2.30/10.66)
for the first knowledge index; to approximately 18 % (2.60/14.72) for the second
knowledge index and to approximately 31% (0.84/2.70) for the gender index. The
increase in the first knowledge index also corresponds with more than one standard
deviation of this variable at baseline.
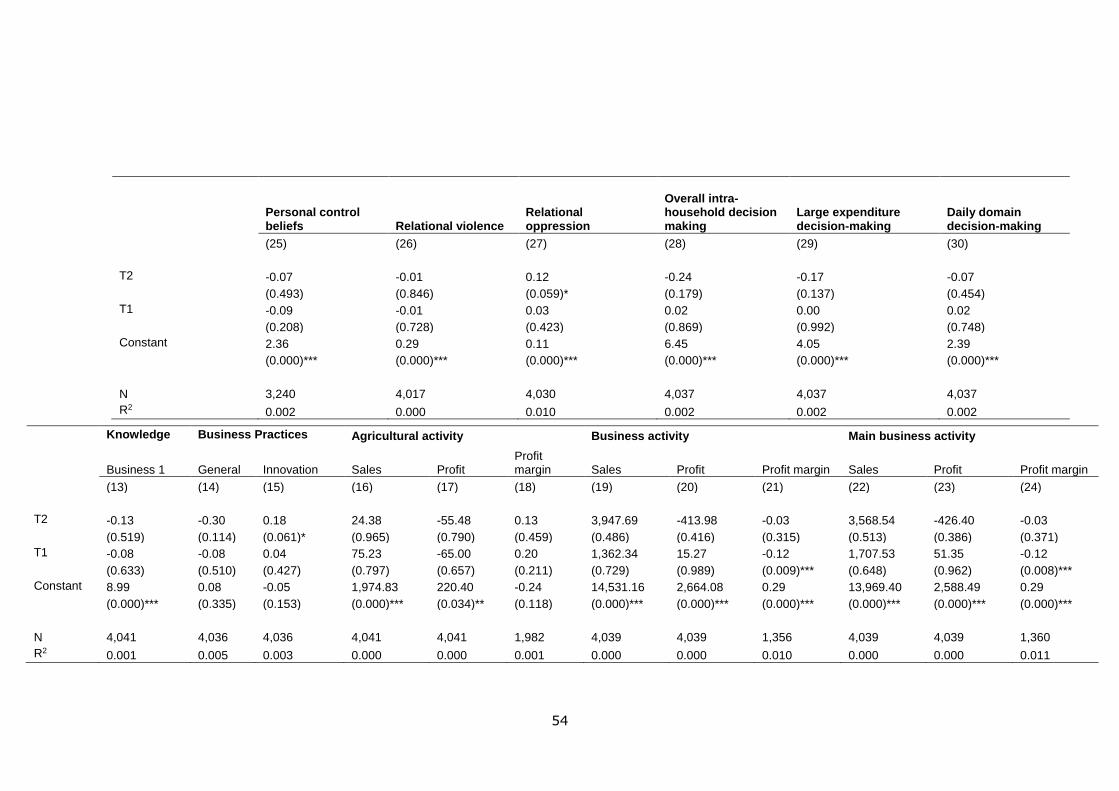
7.3.2 Effects of the G&B training on business practices
Table I.2.2 summarizes our impact estimates for the adoption of key business
practices: record-keeping, marketing efforts, innovation behavior, and general business
practices. We again find economically meaningful and statistically significant effects
across our estimators. Moreover, these positive results emerge for both our midline
23
and endline datasets. All estimated coefficients are significant at the 1% level, and
impacts exceed one standard deviation of the dependent variable of interest (at the
baseline).
Unlike the results for the knowledge indices, we now find an apparent additional effect
of extending the impact analysis from six to twelve months. Our endline estimates of
impact on business practices are significantly greater than our estimates of impact on
business practices at the midline (p<0.05 for all measures), which reflects that adopting
new practices takes time. For example, consider our general practices measure. An
additional six months delay in impact measurement results in an increase in the index
score of approximately 0.8, or almost 60% of a standard deviation (when measured at
the baseline). The impact on innovation is even much larger. Hence, these results
suggest that limiting the analysis to short-term data, collected within 6 months of the
training, would hugely underestimate the true effect of the training. From Table I. 3 it is
clear that inviting husbands does not significantly change the effect of training on
business practices. Table I.4 shows that the impact on business practices on the sub-
sample of women who were enticed to actually participate in the training is again, as
expected, somewhat larger than suggested by the ITT estimates.
7.3.3 Effects of the G&B training on farming results
While the training does not contain a module concentrating on farming activities, we
expect that some of the business lessons “spill over” to the domain of agriculture. The
training may also improve the efficiency of other activities, increasing time available for
farming (or draw effort away from farming if it encourages a shift to business activities).
We lack details to test via which channels the training affects farming outcomes, but do
observe (see Table I.2.3) that the training has a positive impact on both farming sales
and profits at the endline. Moreover, this effect is in several cases significantly larger if
husbands were invited (p<0.05). The biggest impacts are measured at the endline,
when husbands were also invited. In these cases, the increase in profits and sales
corresponds to approximately 0.20 standard deviation of the dependent variable of
interest (at the baseline).
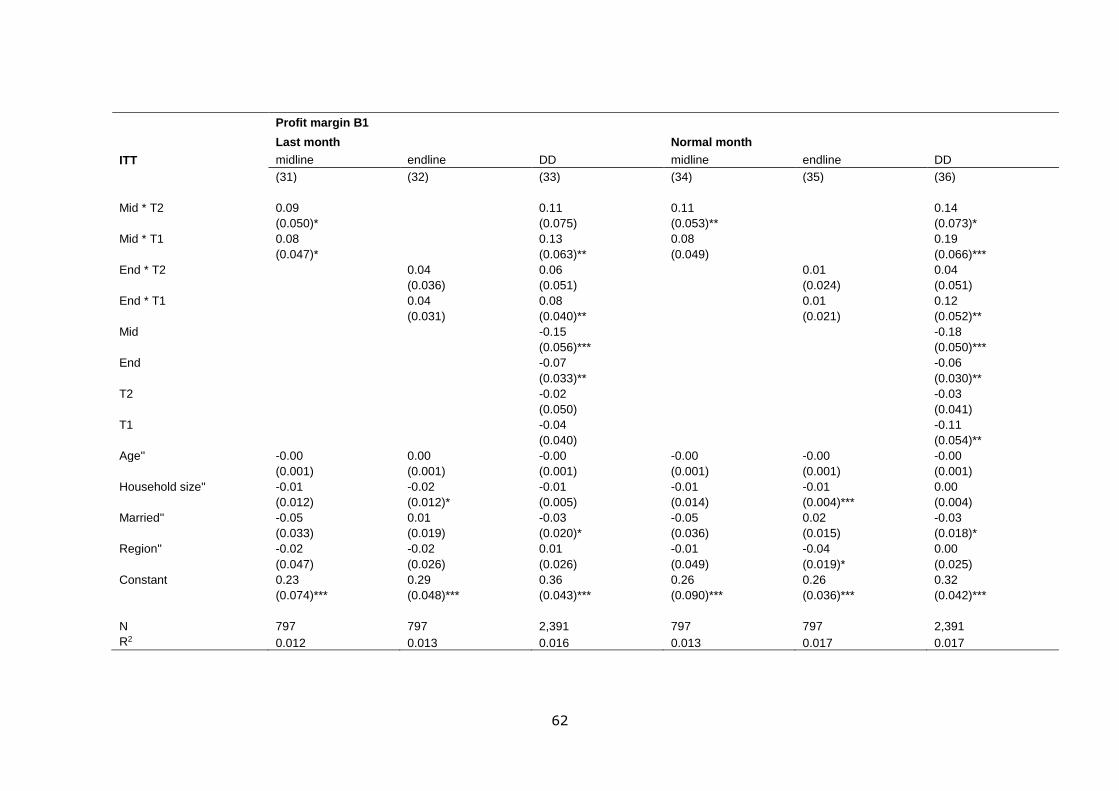
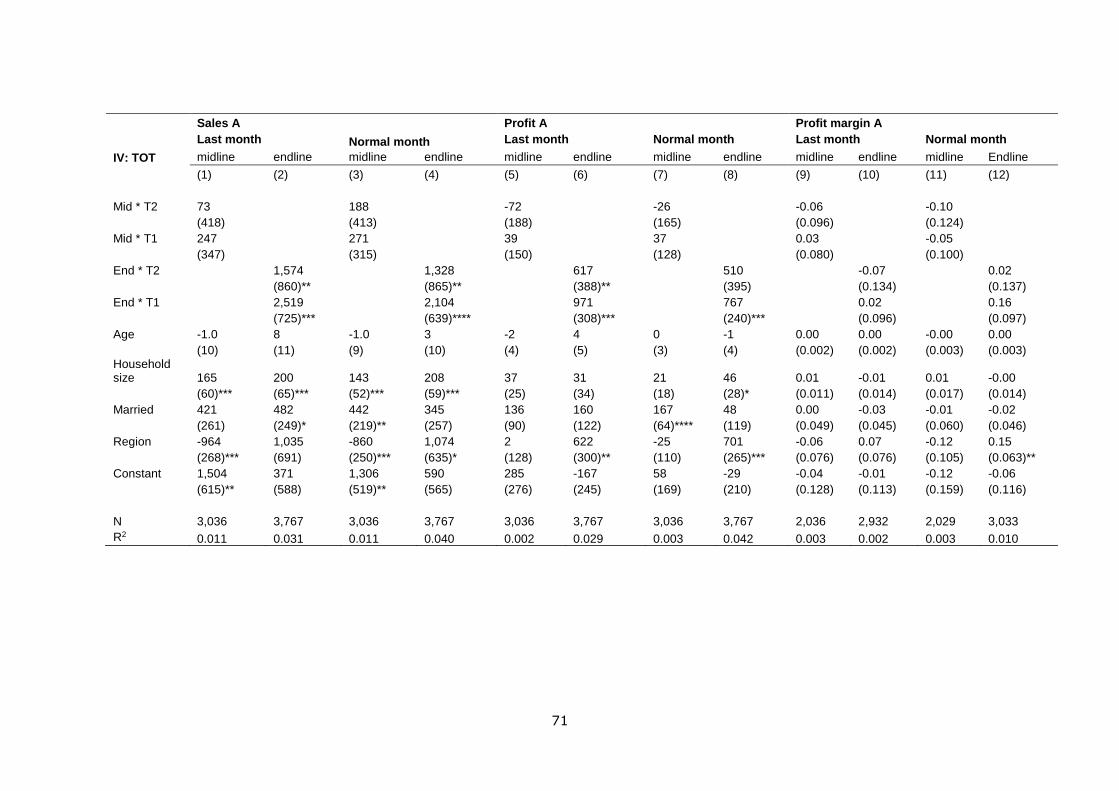
7.3.4 Effects of the G&B training on business results
The impact of a gender and business training on sales, profit and profit margin of
business activities is shown in Table I.2.4. First, sales, profit and profit margin are
aggregated for all business activities together (business). Secondly, sales, profit and
profit margin for women’s main business activity (B1) is reported if the business activity
is present during all three surveys. Because the first measure aggregates all reported
activities, the results are driven by both changes in the amount of business activities
and changes per activity . The second measure determines whether a woman’s main
activity expand and/or becomes more profitable.
24
Not surprisingly, these “downstream” results are a lot more variable than the earlier
ones. Nevertheless, while more tentatively, we believe the findings tell a compelling
story. First of all, in terms of extra sales, the training does not seem to have a (robust)
significant effect. In several cases, the coefficients for sales are significant and
negative, perhaps suggesting that participating in the training and following-up on the
lessons learned during the sessions was at the expense of day-to-day running of the
business. But this result is not robust. Likewise, we do not detect a robust difference
the two treatment arms – inviting husbands does not significantly affect sales.
The results for profits are somewhat more encouraging—even if not fully robust either.
Specifically, while we fail to document any significant impact based on the midline data,
we now document a number of positive and significant coefficients based on the
endline estimates. The ITT estimates are only significant for T1 where husbands were
invited to participate, but these coefficients are not significantly different for those of the
T2 treatment (p>0.10). The difference-in-differences estimator also suggests a
significant impact on profits and again we cannot reject the hypotheses that the
estimated coefficients are the same across models. The magnitude of the effect on
profits is relatively small and perhaps only detectable because our sample is rather
large. For the diff-in-diff models, we find an average effect of 0.15 standard deviations
of last month’s profits (measured at the baseline). The effect on profits in a normal
month is 0.10 standard deviations. The combination of an insignificant sales effect and
a positive profit effect suggests the training reduces costs. This suggestion is confirmed
by the positive and significant impacts on profit margin in several cases. Yet, in line with
the othe rrsults, imapcts on profit margin are not robust.
When we consider the LATE, we again find evidence of a significant effect only at the
endline. Moreover, as for the ITT estimates, this significant effect only materializes in
the treatment arm with husbands. However, a simple t-test (again) reveals we cannot
distinguish between the coefficients of the T1 and T2 treatment, so the additional effect
on profitability of including husbands is too small to be picked up by our sample.
Interestingly, the positive outcomes in terms of enhanced profits is not necessarily
explained by improved performance in the main economic activity of the respondents.
While we consistently document positive coefficients across our range of estimators,
we observe that only a few are statistically significant. For example, the training
significantly affects profits of the main economic activity for women in the group with
invited men.
The relatively small impact of the training on profits is in line with the existing literature,
surveyed by McKenzie and Woodruff (2014). Only few studies find significant positive
effects of trainings on profits, partly because of low power of most studies. Interestingly,
while we find that the impact of the training on profits increases over time, other studies
suggested these gains tend to dissipate over time (e.g. Berge et al. 2012 and De Mel et
al. 2014).
25
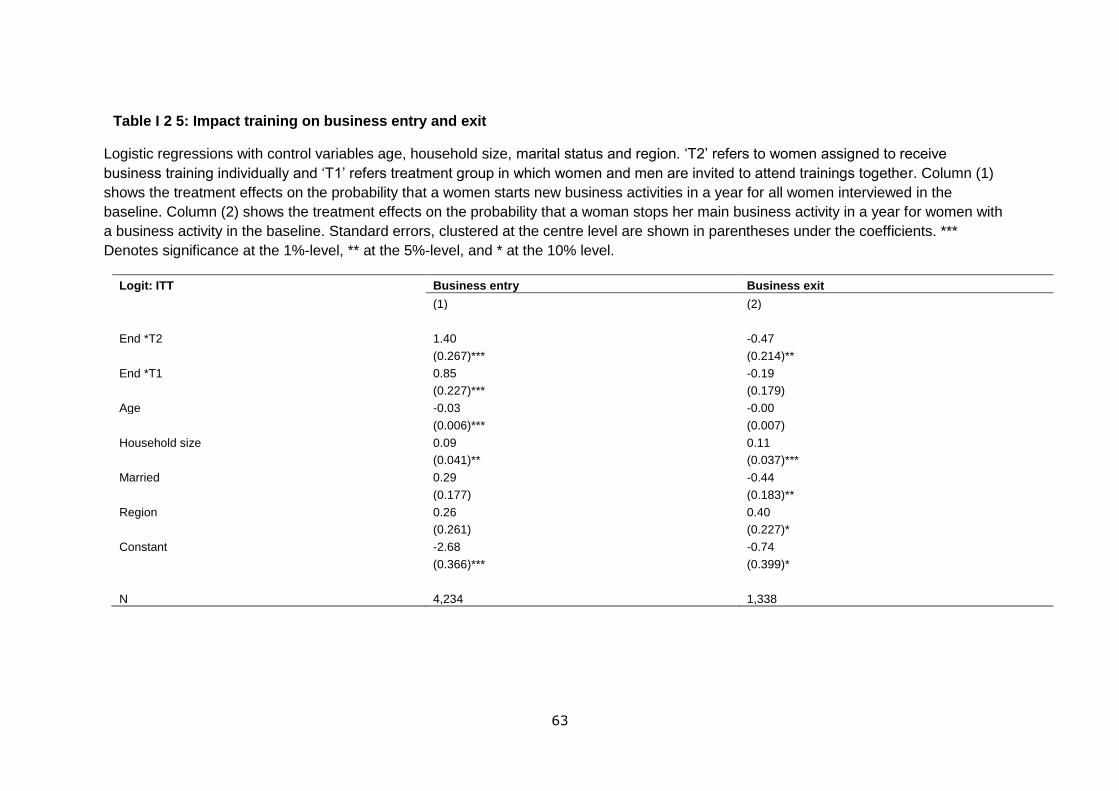
7.3.5 Effects of the G&B training on business entry and survival
Does the training affect business activity at the extensive margin, by speeding up or
delaying the start-up of new economic activities, and the exit of existing ones?
Vietnam’s business community is dynamic, as illustrated by the simple fact that no less
than 194 women in our sample reported to start new business activities at the midline
(and no less than an additional 170 activities have been started between mid- and
endline). Most of these activities involved retail trading. Table I.2.5 shows that trained
women were more likely to start new activities (significant at the 1% level). This finding
is not unexpected, given that modules 3 and 4 of the training focused on self-
development, business mapping and business opportunities. Moreover, we find that
the effect is larger for the treatment arm where husbands were not invited to participate
in the training (p<0.05). This would be consistent with a story emphasizing that
husbands prefer their women around the house, working on chores, rather than starting
up new businesses. If so, it appears as if the aim to promote gender equality by inviting
husbands may have backfired. But this interpretation is presumably too negative, as
additional data we have collected on female empowerment—including proxies for
personal control beliefs and relations oppression – do not suggest that participating in
the trainings made men more oppressive. Nevertheless, additional research into the
intra-household implications of participating in gender trainings seems worthwhile (see
also Allen et al. 2010).
Exit of business activities is defined as business activities reported at the baseline
which were subsequently abandoned at the midline or endline. Some 1338 women
reported to undertake one or more business activities at the baseline. Of these women,
281 stopped one or more economic activities at the midline, and an additional 252
women stopped an activity between the mid- and endline. Variation in the probability of
stopping with an economic activity is correlated with participating in the training, but
only significantly so for treatments where husbands were not invited. Training may
promote exit if the abandoned activities generated net losses for the household (see
also Valdivia 2013), but we find the opposite effect – participating in the training
reduced exit. This would be consistent with the interpretation that the incidence of loss-
generating activities is reduced by the training. Unfortunately, we lack information about
the profitability of the activities that were abandoned, so cannot assess this issue
further.
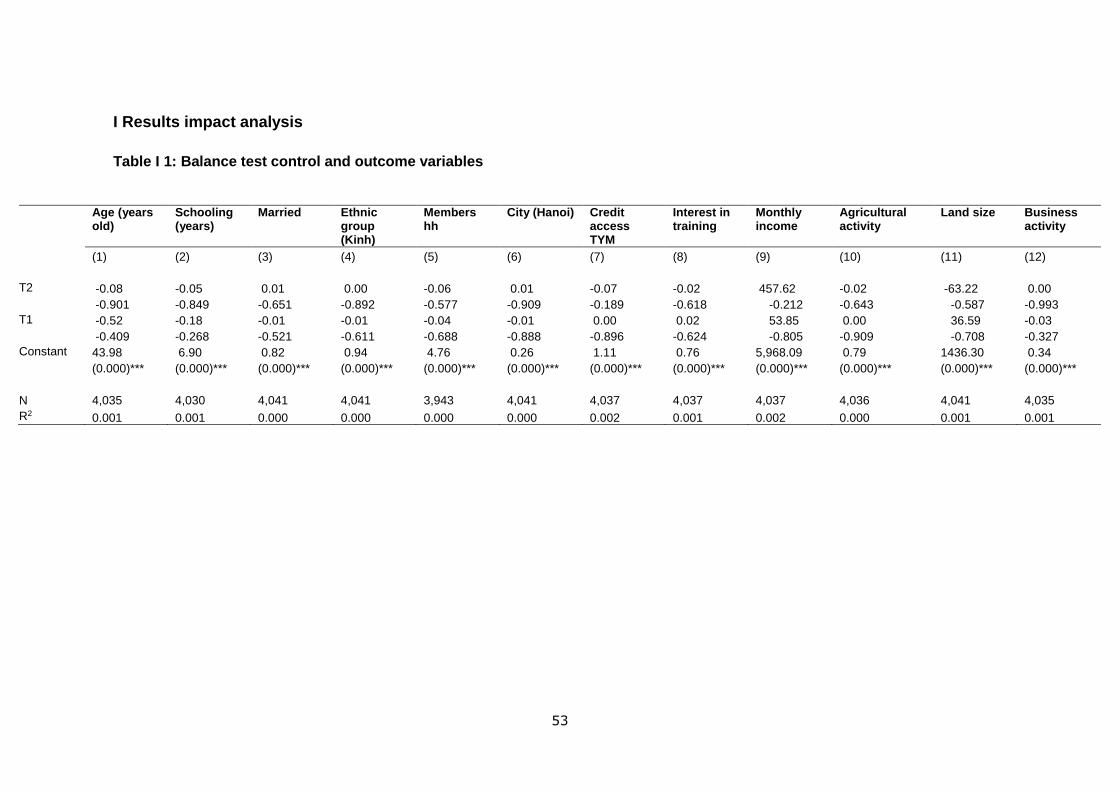
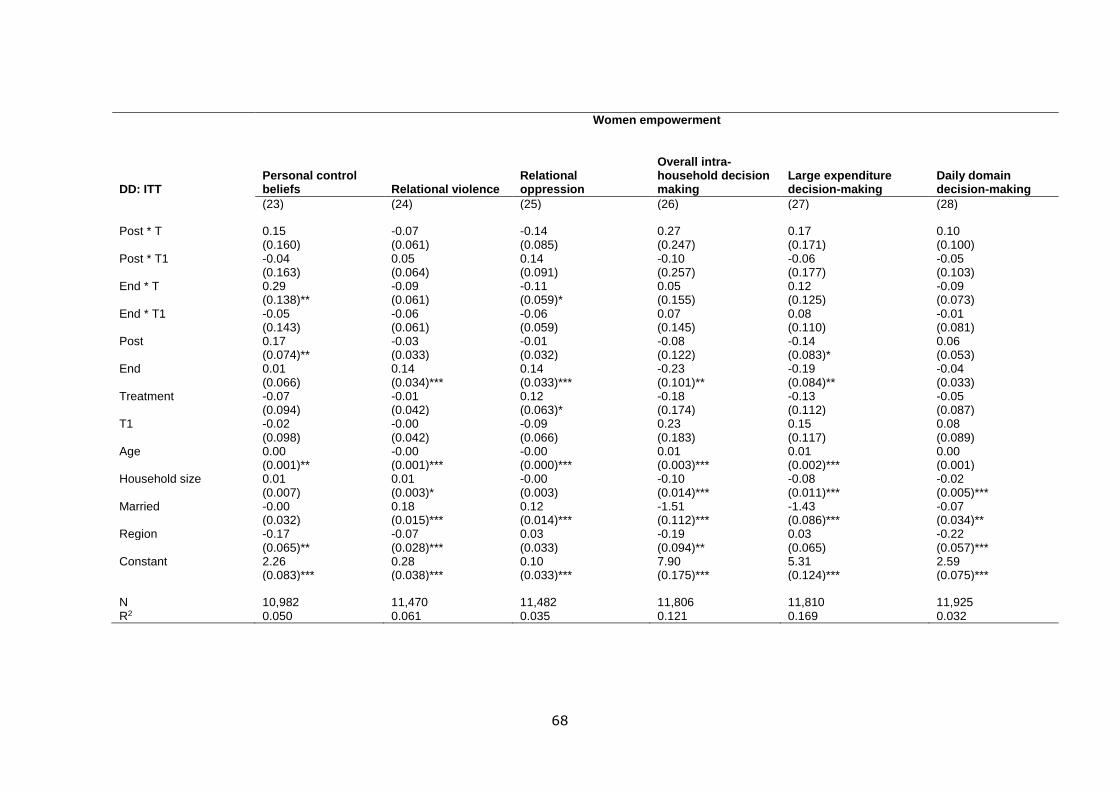
7.4 Impact on women empowerment
7.4.1 Effects of the G&B training on personal control beliefs
The variable personal control beliefs measures the extent to which women believe they
can control their lives (internal control) or whether their live is controlled by the
environment (external control). The scale is based on the Rotter Internal-External
Locus of Control Scale (Rotter, 1966) and a higher score is related to more personal
(internal) control.
26
We expected that female borrowers who received access to gender-focused and
business training would develop more internal control beliefs; Table I.2.6 partly
confirms this expectation. The post-treatment regressions indicated that training
increased internal control beliefs at the endline but not at the midline for female
borrowers with access to training without their husbands. The double difference
regressions provided similar results. The results clearly suggest that it may take some
time before training changes women’s personal control beliefs; the endline effects are
consistently stronger than the midline effects. For the post treatment model at the end
line, we find an average effect of approximately 0.10 standard deviations of control
beliefs (measured at the baseline). Compared to the mean value of the control group at
the endine, the training seems to increase control beliefs at the endline by
approximately 30%. Table I.4 shows that the LATE estimates provide similar results.
Yet, these estimates suggest that the impact of the training on internal control beliefs at
the endline is larger if husbands do not come to the training. Hence, to increase control
beliefs, it may be better for women to come to the training alone.
7.4.2 Effects of the G&B training on domestic violence
Domestic violence is measured by relational violence and relational oppression.
Columns (4) – (9) in Table I.2.6 shows that the effect of gender and business training
on both variables is quite similar. Table I.2.6 shows that training reduces relational
violence at the endline but not at the midline, across both estimation methods. We also
did not find any difference for individual or joint training. The effects were similar for
relational oppression. Again, it may take time before the training starts to exert an
impact. We did not find different impacts if husbands participated. For the post
treatment model at the end line, we find average effects ranging between 0.3 and 0.4
standard deviations of relational oppression and relational violence (measured at the
baseline). The LATE estimates provide similar results.
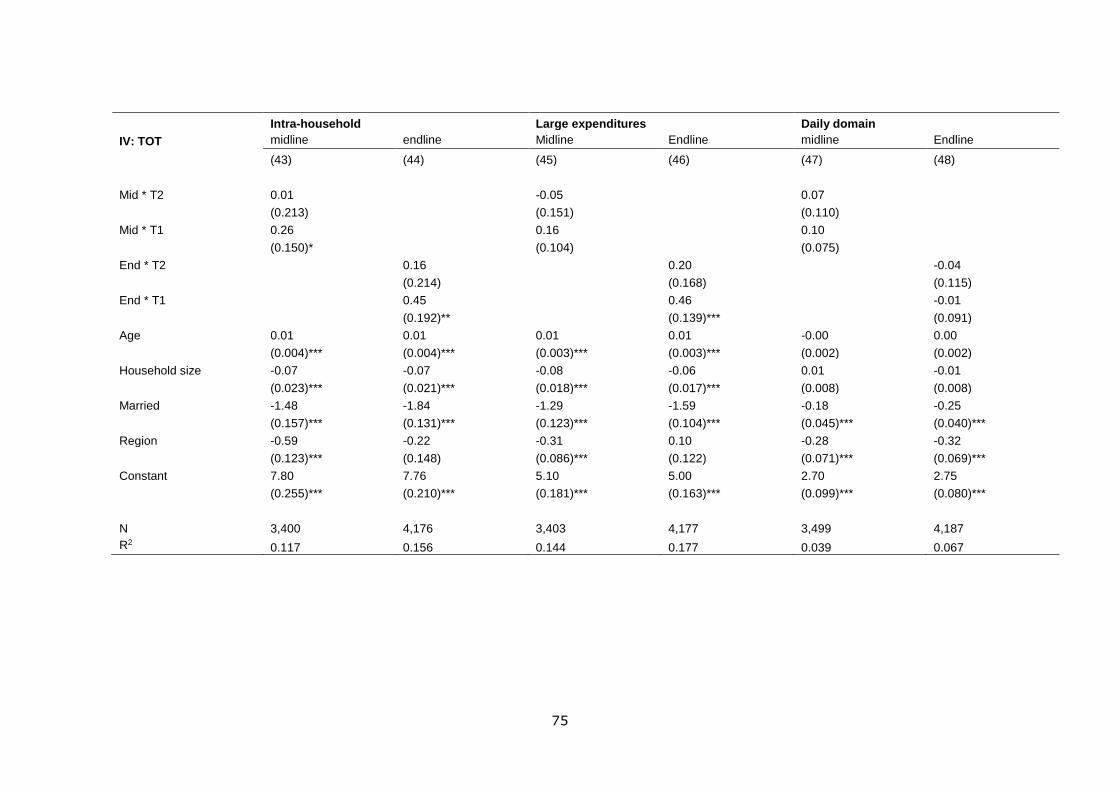
7.4.3 Effects of the G&B training on bargaining power
Bargaining power is measured in three different ways: general intra-household
decisions, large expenditures decision-making and daily domain decisions. Table I.2.7
shows that training does not change women’s bargaining power after six months.
Hence, for decision making dynamics, it again appears to take time before the training
has an effect. Moreover, the training seems to have more positive effects on bargaining
power if the husbands were also invited. However, positive effects predominantly seem
to materialize for large expenditures (important purchases). For the post treatment
model at the end line, we find an average effect of 0.22 standard deviations of large
expenditures(measured at the baseline) for the treatment arm where hsubands were
also invited. Although we predicted that training would improve women’s positions
regarding daily decision making, we found no evidence in support of this assertion.
27
7.5 Probing the theory of change
In a final bit of analysis we probe the theory of change, and try to establish whether the
effects on the adoption of new business practices and profits is indeed caused by
augmented knowledge levels. Representative results, based on Business knowledge 1,
are summarized in Tables I.5.1 and I.5.2. Table I.5.1 contains the effect of (predicted)
business knowledge on the adoption of practices measured at the midline. The
estimated coefficients are consistently greater than zero (p<0.01) so that we indeed
observe that enhanced knowledge is one channel via which adoption is encouraged.
<< Insert Table I.5.1 and I.5.2 about here >>
In Table I.5.1 we consider the downstream effects on profits, distinguishing between
overall profits (last month and in a normal month) and profits from the main economic
activity, also evaluated last month as well as in a normal month. All these profit
measures were collected at the endline. We now find mixed support for the thesis that
enhanced knowledge boosts profits – while all coefficients have the “right sign” we only
document significant effects in two out of four regression models. Specifically,
knowledge has positively affected overall profits as well as profits from the main
economic activity in the last month.
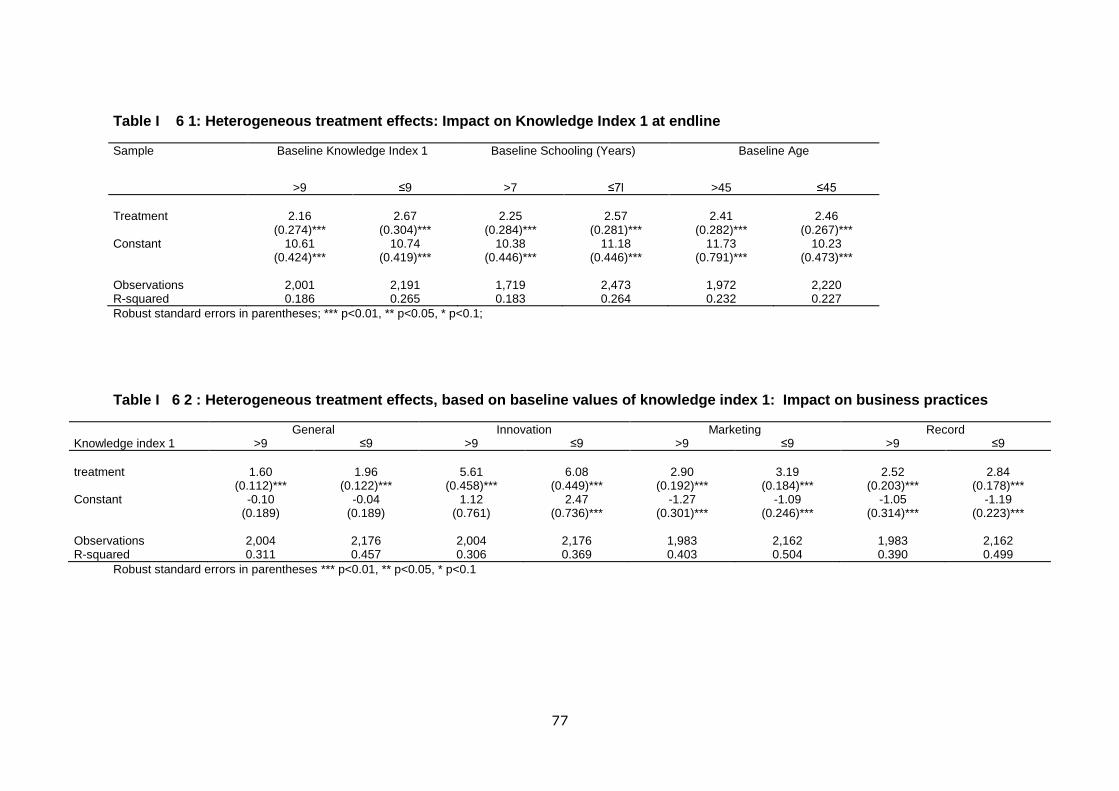
7.6 Heterogeneous treatment effects
The testing of the theory of change suggests that the training mainly affects outcomes
via enhanced knowledge. It is therefore interesting to analyze whether there are
heterogeneous treatment effects in terms of knowledge adoption. That is, the impact of
the training on knowledge enhancement may differ depending on the characteristics of
the participants of the training. We gauged whether there are differential treatment
effects depending on baseline values for business knowledge (knowledge index 1),
years of schooling and age. More in particular, we probed whether the change in
business knowledge (knowledge index 1) differs for TYM members that have above or
below baseline medium values for these characteristics. In order to not sacrifice too
much “power” we do not differentiate between the two treatment arms, but only
consider impacts of being invited to the training as such. Table I.6. 1 presents the
results. The table shows that impact of the training on business knowledge is higher for
women with below than baseline median values of business knowledge, schooling
years and age. However, for schooling years and for age, the difference in impact is
not significant. This result suggests that the impact of the training is higher for women
with low business skills than for women who already possess business skills to a
reasonable level. We next tested whether the impact of the training for women with
below median business skills also translates into bigger impacts on business practices.
Table I.6.2 suggests that this is indeed the case: the improvement in business
practices is higher for women with below median baseline business knowledge.
Heterogeneous downstream effects on profits, sales and profit margins (not
presented) again do not show a consistent picture. Yet, overall the heterogeneous
treatment effect analyses suggests that the training, in terms of changing business
practices, is most successful for women with low levels of business knowledge.
28
7.7 Impact analysis administrative data
We conducted some analysis with administrative data. More specifically we considered
impacts of the training on repayment rates, loan take up and savings. These analyses
suggest that the training only had a minor impact on loan repayments and loan sizes
for impacts are insignificant. Concerning savings, we do find a small positive effect of
the trainings on endline savings with TYM.
7.8 Impact analysis behavioral games
We added several experimental games to test the relevance of training offered to
women-only versus mixed groups. Specifically, we conducted post-treatment
experiments with sub-samples of husbands and their wives. These experiments,
conducted shortly after the training, included a total sample of around 600 individuals.
The games explicitly focus on the impact of time and risk preferences and hiding
behavior, including intra household bargaining.
7.8.1 Hiding and bargaining game
We conducted an experimental hiding and bargaining game to probe the determinants
of intra-household decision-making. Consistent with several recent studies we find
evidence of non-cooperative decision making within the household, and document a
positive willingness to pay for income hiding.
More specifically, we use the games to examine whether participation in the business
and entrepreneurship training affects income hiding. Our main results are that (i)
participating in the training on average increases income hiding by women, but (ii) only
robustly when husbands also participated in the training. We find no support for the
hypotheses that this effect is due to income shocks or changes in the intra-household
bargaining position of women. While the stated objectives of the intervention are to
raise female income and empower women, we were unable to detect significant effects
of the training on income or bargaining power. This results partly differs from the results
of the RCT, probably due to the fact that we conducted the game, and measured our
outcome variables one month after completion of the training. Especially for the
business-related variables, this may be too shortly after the training.
The reduction in asymmetric information about the profitability of the wife’s business is
a natural explanation for the finding that participating in the training causes income
hiding. If husbands learn about the profitability of their wife’s enterprise, women have to
contribute more to the common pot, distorting the balance between consuming private
and household goods. Moreover, our theory suggests husbands should raise the
compulsory contribution (reflecting that the consumption of household goods for them
becomes cheaper). This, in turn, invites “tax evasion” through income hiding by their
wives in domains where their income is (relatively) difficult to observe. While our
empirical results thus provide some support for hybrid models of household decision-
29
making, we believe additional research is necessary to establish the merits of such
models and examine the various channels via which income hiding can be affected.
This requires studying income hiding in contexts with sufficient exogenous variation in
bargaining power and income. Our intervention was not sufficiently strong to achieve
this.
Overall the findings of our experimental hiding and bargaining games represent a
mixed message for NGOs seeking to advance the livelihoods of rural women via
training interventions. Our evaluation results suggests it may be difficult to “empower”
women or enhance female earning capacity via information and training campaigns.
Moreover, while inviting husbands to trainings may attenuate concerns about intra-
household frictions, this innovation may simultaneously generate intra-household flows
of information that could invite women to hide a greater share of their (remaining)
unobserved income. The overall welfare effects of a transition towards non-cooperative
modes of decision-making in the household, even in the presence of potential direct
beneficial effects of interventions, are potentially ambiguous. Understanding how the
participation of husbands in training interventions for women affects both the efficiency
and equity outcomes of these interventions appears an important topic of future
research.
7.8.2 Intertemporal preferences game
We conducted an intertemporal preference game to examine whether the business
training affect intertemporal consumption behavior. To obtain measures of time
preferences and consumption smoothing, we use the Convex Time Budget experiment
(CTB).
The results of the game demonstrate evidence of inefficient consumption smoothing
among our sample of Vietnamese microfinance clients. Specifically, and somewhat in
contrast to “conventional wisdom” in the literature on underdevelopment, we find these
women tend to save too much at the expense of short-term consumption (relative to
their own preferences). Our second result is that attending business trainings helps to
reduce such inefficiencies. Trained women behave more “rational” than untrained
ones, and we present tentative evidence that this is (partly) due to the transfer of
knowledge. Our third result is that trainings in which husbands participate appear more
effective in reducing inefficiencies than (standard) treatments from which men are
banned (even if this difference is not significant across regression specifications).
Hence, our results not only support recent attempts to create human capital among
microfinance clients, they also provide a natural suggestion to improve the impact of
such trainings. Finally, we find no evidence that attending business trainings is
“transformative” in the sense that the level of impatience of our respondents is affected.
We also find that the curvature of the utility function is unaffected by the trainings.
30
7.9 Focus group discussion and in-depth interviews
We conducted 6 focus group discussion groups to evaluate the training, including 3
groups of women of T1 (men were invited to the training) and 3 groups of women of
treatment arm T2 (without men). The FGDs lasted from around 1.5 hours. The
discussions were done by Nhung Vu and one assistant. Loan officers and other TYM’s
headquarter members were not allowed to join these FGDs. The following issues were
discussed: Did you attend the training? How often? How many training modules did
you attend? Which training modules did you attend? Which training modules did you
like? Why? Which training modules did you not like? Why? How do you evaluate the
training quality including: content, teaching method, teaching time, teachers? Are you
satisfied with the training? What did you change in your business due to the trainings?
Are you willing to pay for a similar training? And for treatment arm T1 we also
discussed the following issues: Did you like to invite husbands to join the training? Do
you think your husband changes his behavior on gender issue due to the training? Do
you feel it is easier to change your business practices due to the fact that your husband
attended the training? Did the class discussions change due to the presence of
husbands? Beside we had in depth interviews with 2 women in 2 treatment groups.
The women we interviewed were satisfied with the content and design of the training.
In addition, as we have mentioned above, in the questionnaire for the midline and
endline surveys, we had blocks of questions asking women to provide feedback on
the trainings.
Moreover, after the final workshop in December 2014, we organized some additional
in-depth interviews. These in-depth interviews with beneficiaries and employees of
TYM were conducted as an additional qualitative component of the larger research
project. We aimed to complement and compare findings of the survey data on the
opinion of beneficiaries and staff on the benefits of access to the GET-Ahead training
using face-to-face interviews with structured questionnaires. We interviewed
participants from each of the three treatment groups. Two microfinance borrowers with
access to the GET-Ahead training for which their husbands were invited (T1); three
microfinance borrowers with access to the GET-Ahead training individually (T2); and
two microfinance borrowers without access to the GET-Ahead training (C). To
complement the opinions of the microfinance borrowers we interviewed three
employees of TYM, one technical staff member who is in charge of the center meetings
and training; one branch director; and the deputy head of department of department of
research and communication.
The FGDs suggested that female microfinance borrowers without access to the GET-
Ahead training that they would be very interested in business skill, vocational, and life
skill training. They would be in favour of inviting their husbands to this training but
preferred to only invite their husbands to one yearly training while monthly training
should be offered to the women. Female borrowers from the two training conditions
made a similar suggestion to improve the husbands’ attendance rate at the training.
In general, female microfinance borrowers with access to the GET-Ahead training or
with access to the GET-Ahead training for which their husbands were invited were very
31
appreciative of the offered training. All women with access to training indicated that
participation in the training strongly increased their business skills as they learned how
to manage their existing business but also how to adapt their business to the demands
in their neighbourhood.
Additionally, these women indicated that training participation influenced their position
within the household. Some of the female borrowers with access to the training
individually believed that this resulted from the fact that their husband saw that they
managed their businesses well. Female borrowers whose husbands were invited to the
training believed that this change resulted from the fact that they and their husband
learned to work together as a family in the business but also in the household. Further
it was suggested that this change resulted from the fact that the couple could spend
more time on discussing and applying the content of the training, which reduced the
time spend quarrelling. Lastly, with regard to the gender-focused modules, women in
both training conditions strongly appreciated the content of these modules as it taught
them that the gender-division in the workforce can be less strict and that men and
women can work together. However, women in both training conditions indicated that
without the participation of their husbands the relational dynamics would not change.
Similar ideas were expressed by the TYM staff who appreciated the training in general
but also underscored the importance of involving the husbands in the offered training to
encourage active participation in the training sessions, the application of the taught
knowledge and skills, and gender equality.
8. Discussion
8.1 Attrition
Compared to other studies, attrition rates in our study are relatively low: for example,
attrition rates are up to 24 percent in Karlan and Valdivia (2011), 26 percent in
Calderon et al. (2012) and 28 percent in Klinger and Schündeln (2011).
Table 2: Attrition rate
C T2 T1
Midline 13% 16.0% 13.0%
Endline 0.1% 0.2% 0.0%
Most of the clients who dropped-out are followed and were asked for the reason to quit in the endline survey. Data of these women is included in this study, because they dropped out after the treatment. We use a logistic regression to study differences in attrition across groups. A dummy for attrition is equal to one if households are not interviewed in at least one of the two follow-up surveys. Since attrition between mid to endline was almost zero, the attrition analyses predominantly refer to attrition between baseline and midline. Table 3, column 1 reveals that attrition is not significantly different between the treatment and control groups (treatment dummy is not significantly different from zero). In terms of observables, however, we find that younger people and people living in Hanoi are more likely to drop out of the study (p < 0.10). The Wald test,
32
testing the joint significance of parameters, suggests the parameters estimated in column 1 are jointly insignificant. In the 2nd column of the table we test whether there is a difference in attrition between T1 and T2. Women in treatment group T1 are more likely to drop out of the study (p<0.10) then women from group T2. We now also find that the estimated parameters are jointly significant at the 1% level. Table 3: Test for random attrition
1 2 Treatment -0.04 (0.147) 0.239 (0.215)
T1 -0.422 (0.220)*
Business knowledge 1 0.022 (0.033) 0.0221 (0.033)
Age -0.0098 (0.006)* -0.0101 (0.006)*
Household size -0.0612 (0.039) -0.060 (0.039)
Married -0.111 (0.148) -0.122 (0.147)
Region (Hanoi) -0.398 (0.236)* -0.405 (0.232)*
Constant Yes Yes
N 3941 3941
Wald (Prob>Chi2) 9.13 (0.17) 18.62 (0.01)*** Note: robust clustered standard errors between parentheses. *** denotes significance at the 1% level; **
at the 5% level and * at the 10% level
9. Summary results and policy recommendations
9.1 Summary results
In this project, we test the impact of providing a gender and business training to female
microfinance clients in Vietnam, and test whether the impact of providing the gender
and business training is conditional on the presence of husbands. Our findings suggest
that combining a gender and business training leads to significant improvements in
gender and business knowledge of attending women. Furthermore, the trainings seem
to have improved business practices. Our results are in line with previous studies,
which show that business trainings have positive effects on business knowledge and
business practices (Karlan and Valdivia, 2011; Valdivia, 2013; De Mel et al., 2014,
Drexler et al., 2014; Bruhn and Zia, 2013; Giné and Mansuri, 2011; Berge et al., 2011).
Most of these studies, excepting Bruhn and Zia (2013), provide further evidence that
the increased business knowledge and adoption of better business practices did not
lead to an improvement of business performance in terms of profits or sales of female
entrepreneurs. In contrast to the existing literature, we, however, find that the gender
and business training has a positive impact on business performances of female-run
businesses. We provide evidence that offering a gender and business training leads to
improvements of business profits and profit margin among surviving businesses.
Moreover, we provide some new evidence that the gender and business training
improves personal control belief of treated women. In addition, the training increases
women household decision-making power on large purchase investment decisions and
reduces the levels of physical domestic violence within families.
While the midline survey took place only six months after the completion of the entire
training, we still find promising short-term impacts of the training on gender and
business knowledge, business practices and business outcomes. The impact of
33
training after twelve months differ with respect to business practices, farming outcomes
and gender empowerment. There are significantly more business practices
implemented in twelve months compared to six months. Our findings confirm the
importance of tracing out the trajectory of the impact of the intervention (De Mel et al.,
2014).
Furthermore, after twelve months bargaining power is only significantly affected for
women following training together with their husbands. Even though the additional
impact of inviting husbands is not significant, these results suggest that the
involvement of men might improve the impact of the training in the longer run,
especially regarding gender issues. However, while we do find some evidence of
positive effects of inviting husbands, more research seems to be needed for our
behavioral experiments suggests it may be difficult to “empower” women or enhance
female earning capacity via information and training campaigns. Moreover, the
experiments suggest that while inviting husbands to trainings may attenuate concerns
about intra-household frictions, this innovation may simultaneously generate intra-
household flows of information that could invite women to hide a greater share of their
(remaining) unobserved income. The overall welfare effects of a transition towards non-
cooperative modes of decision-making in the household, even in the presence of
potential direct beneficial effects of interventions, are potentially ambiguous. In some
way, our results are in line with Allen et al. (2010), who also did not find evidence that
the inclusions of husbands in microfinance solidarity groups helped to improve women
bargaining power. However, at the same time, the qualitative evaluation suggests that
most women appreciated the involvement of husbands in the trainings very much. In
order to scale-up the intervention later, women in the treated group recommended that
men should follow only the gender training module. This training module is considered
as the most valuable one for them. While the regression results show positive effects of
inviting husbands on several outcome variables, the additional effects are not
statistically significant, possibly due to a low power of the estimates, in combination
with small effect sizes on account of the short time period under consideration.
9.2 Policy recommendations
Provide business training in addition to microfinance.
The study clearly suggests that providing business training to microfinance clients
is beneficial for clients, especially for clients with low levels of business knowledge.
Add a gender component to the business training.
The study suggests that adding a gender component to the trainings is relevant.
9.3 Dissemination
We aim to disseminate results of our study via policy and academic channels. We are
working directly with the management board of TYM fund to modify and implement the
training program. We also work with the Vietnam Women Union at the national level
and disseminate the results to other microfinance organization in Vietnam via the
34
Microfinance Working Group. We also plan to disseminate the main results via the ILO.
The ILO will add our main results to their yearly report. More specifically, their report
includes a chapter on SME and its role in productive employment creation. This is a
chapter to be discussed during next years International Labour Conference and should
shed some more light on what the ILO should do in SME promotion. In this chapter a
review of credible (RCT or quasi experimental) evidence on business trainings is
added, including ours. The results of the study will be presented by Robert Lensink at a
workshop organized by the ILO in Geneva: “What in entrepreneurship development
helps women entrepreneurs to succeed? - What the evidence is telling us – “ ILO –
Geneva, Switzerland (September 18, 2015).
In terms of academic channels, the three co-principal investigators have presented the
results at a variety of conferences around the world. Details of these presentations can
be found in the bi-annual progress reports submitted to 3ie. We also organized
workshops on gender and business trainings and microfinance for TYM, and other
interested MFIs in Vietnam. We will integrate results of our study in international
courses on development economics and microfinance at the University of Groningen
and Wageningen University. We will also include results of the study in courses at the
School of Economics and Business Administration, Can Tho University, Vietnam. We
will submit working papers from this project to international journals. Additionally, the
results of the midline evaluation will also be published as part of the PhD thesis of
Nhung Thi Hong Vu. The endline evaluation on gender empowerment will be published
as part of the MSc thesis of Marloes Huis. She will also write a chapter for her PhD
thesis based on the impact of the training on female empowerment. The endline
evaluation on business outcomes will be published as part of the MSc thesis of Rosine
van Velzen.
35
Appendices
A. Field notes
A.1 New idea from the gender and business training course
Written by staff TYM
Ms. Nguyen Thi Anh, born in 1980, is a member of
Center No. 21, Dao Duc ward, Binh Xuyen district,
Vinh Phuc province.
Joining TYM since early 2012 when her family is
learning the carpentry, she has been wondering how
to develop her family’s carpentry business. Right at
that time, she participated in the course “Gender and
Business” of 9 training organized by the Transaction
Office No. 01 Binh Xuyen, Phuc Yen branch organized
within the framework of 3ie Project.
The training course helped her to realize new opportunity for her family’s business. She
shared with us: “After the first training session about ‘Gender and Business’, I
discussed with my husband, ‘Women and men should have equal opportunities; so you
should allow me to contribute opinions on what items to sell’. My husband smiled and
agreed with me.”
During all training sessions, she actively participated with other members in the Center
while discussing with technical officers her questions and concerns. At the end of the
sessions on ‘How to pick up business ideas?”, she discussed with her husband to open
new business of selling wooden family furniture. Since then, she has been actively
exploring and learning about local people’s demands while expanding her business into
sale of pillows, blankets and bed sheets. She told us at the Center: “After attending the
training, I changed my thoughts about business. Thanks to the knowledge gained after
9 sessions along with my personal skills, now my family has a fairly good business,
which brought us decent money.
Her business progressed well and she participated more actively in the Center’s
activities. At the end of 2013 she was elected as deputy head of ward women unit and
the Center’s leader.
Figure A.1: Ms. Nguyen Thi
Anh
36
A.2 Story of a member graduated from gender and business programme
Written by: staff of TYM branch in Me Linh
Ms. Nguyen Thi Tam, member of Center No. 29, Van Yen ward, Me Linh district, is a
very active member of TYM. Being a member of TYM since 2007, she and her family
has availed loans from TYM, deposited savings, benefited from Family Assistance
Fund, and her family’s economic situation has improved a lot.
In 2012, she and her husband, Mr. Nguyen Van Linh, were invited by TYM to
participate in ‘Gender and Business’ training course of 9 sessions, co-organized by
Groningen University, Netherlands and 3ie organization. During the training course,
they both actively participated in training activities on different topics: Introduction about
gender and business; Gender prejudices and gender role; business environment; pick
up business ideas; book keeping; marketing and promotion; etc. After the course, their
awareness was greatly improved. Mr. Linh has helped Ms. Tam so that she could have
time to run her tofu selling business while he focused on their pig raising business and
other housework like making tofu, cultivating and harvesting rice; all cost and expense
calculating were shared between them to reach consent. He visited families of same
business activities to learn best practices in raising pigs; she visited neighboring
households and restaurants to introduce her tofu thus increasing her sale. As of now,
their family’s economic status has improved significantly; every year they sell 3 packs
of pig, each of 16-20 pigs, while she sells 50kg of tofu a day. Besides, they have
enough rice for eating and husbandry without having to buy additional supplies. To
achieve today’s economic status, they must build on their awareness change, learn
how to apply appropriate lessons on their family situation, and with their hard working
and strong will to strive to overcome poverty. When we visited her family, they express
gratitude towards TYM and the project for bringing new knowledge to members, to give
them opportunity to learn and to develop for a better today.
Figure A.2 1: Pictures of Ms. Nguyen Thi Tam’s family
37
B. Sample design
We conducted this project in three selected branches in Vinh Phuc and one in Ha Noi.
There are 187 credit centers in total. The randomization was stratified by lending
branch; each branch experienced the same proportion of two treatments and one
control group. Initially, we planned to select 50 centers for each treatment group and
left the rest of the 87 centers in the control groups. However, concerns about the
expected take-up rate among husbands, the potential effect on power calculations, and
the question of how to deal with households with no men led us to adjust our sample
size. Approximately 18 percent of the female clients in our sample were not living with
male partners, because they were single, widowed, divorced, or separated. In addition,
the take-up of husbands may be low despite the compensation they would receive for
participating. Because the statistical power of the intervention depends on the actual
participation of husbands, we decided to oversample the treatment groups in which
husbands were invited. We expected that by doing so we should have enough power to
analyze the impact of intra-household relations and mixed group trainings. The sample
therefore was randomly assigned to three groups. Treatment group T1 included 70
credit centers in which male partners were invited to join the G&B training with female
clients. Treatment group T2 consisted of 31 credit centers in which only female clients
were invited to join the training, male partners were not allowed to join the training. The
rest is control groups C including 86 credit centers that received no additional services,
beyond credit and savings.
To select a sample for the baseline survey, we excluded female clients who are
workers since they had received permission from TYM not to attend the monthly,
compulsory center meetings that took place during working hours. Because these
clients lacked time to participate in the meeting, they had not received any benefits
from the G&B training, which they did not attend. Therefore, we excluded clients who
worked for other firms from the baseline interview survey. Next, we randomly selected
only 23 members per center for the interviews and not interviewed all of members of
centers. A few centers had fewer than 23 clients, in which cases we interviewed all
borrowers. With a certain amount of budget, we may choose between two options to
select sample size. The first option is to reduce the number of centers and interview all
clients per center. The second one is to keep all centers and interview fewer clients per
center. Snijders (2005) mentioned that “power of statistical tests generally depends on
sample size and other design aspects; on effect size or, more generally, parameter
values; and on the level of significance. In multilevel models, however, there is a
sample size for each level, defined as the total number of units observed for this level”.
The author also emphasized that the sample size at the highest level is the main
limiting characteristic of the design. We follow his suggestions select the second
option, i.e. we decided to interview less clients per center, but stick to the original
number of credit centers. Our list of interviewees of the baseline included 4,042
borrowers.
38
C. Survey instruments
We collect data in this project via the following sources: baseline, midline and endline
surveys using direct interviewing, focus group discussions, behavioral games, and
administrative data at TYM fund about loans and savings.
For all three round surveys, the process of interviewing was organized over 2 - 2.5
months with a team of around 23 experienced surveyors. We employed double data
entry to reduce mistakes. The questionnaire included questions about members and
member’s households. In addition to the usual set of demographic variables, such as
age, education, and marital status, we collected individual characteristics, such as
measures of business knowledge, business practices, cognitive and non-cognitive
skills, time preferences, decision-making autonomy across various household
outcomes, outstanding loans, physical and psychological partner violence, health,
social network, and social trust. Household characteristics included information about
wealth, past and current saving, and insurance held by household members. Business
and farming activity characteristics included age, location, and types of business
activities; hired workers; and monthly sales, costs, and profits. The survey also
contained information on lending center cohesion, such as the number of center
members living nearly, borrowing and lending among members in a center, and helping
among members in a center. We also included one section on how participants
evaluate the quality of the G&B training. Beside direct interviewing female clients, we
conducted a small survey of invited husbands after the training finished to know more
information about those men.
39
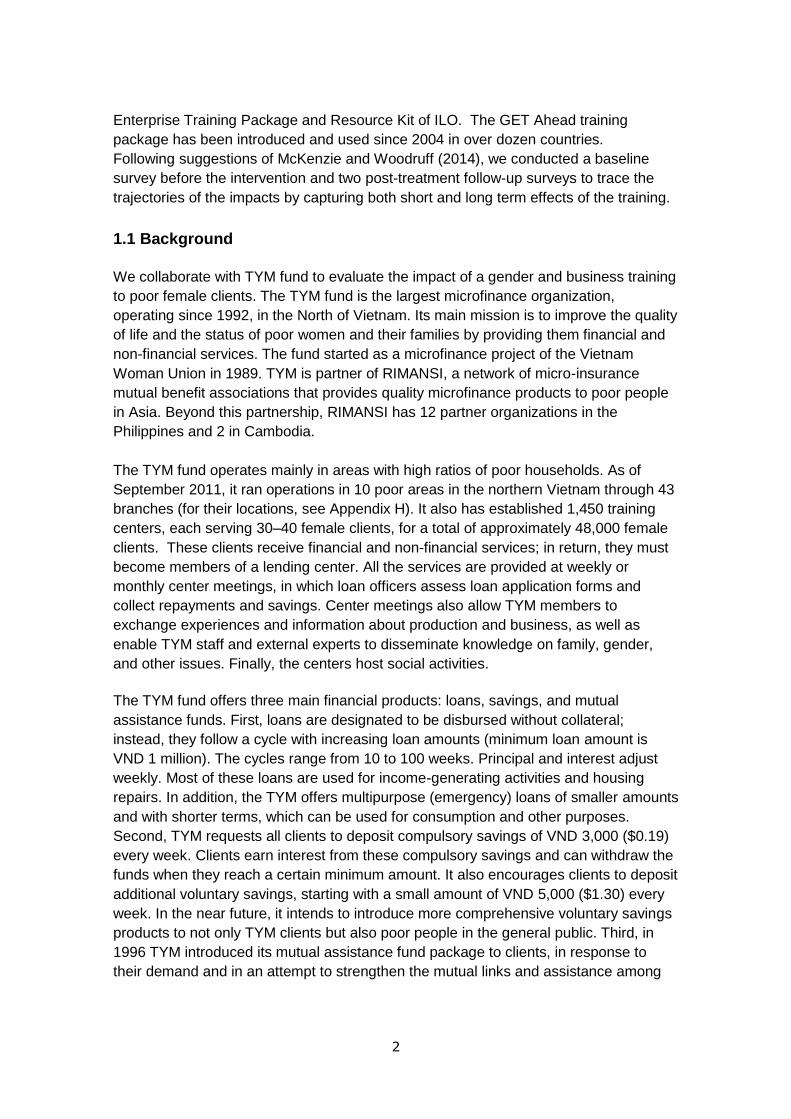
D. Map of operating areas TYM
Figure D. 1: Map of operating areas TYM
E. Sample size and power calculations
Before starting the study we conducted some power calculations, using the “Optimal
Design” software. The variety of output variables we analyze makes it impossible to
provide very detailed calculations per output variable. Rather, we made some rough
estimates, based on common assumptions. We utilized the two-level cluster
randomized trials design option since we randomized at the center level.
In all calculations we use alpha = 0.10, power of 80%, and n = 23 (equal to the amount
of clients per center that we interviewed). We calculated the (standardized) minimum
effect size (MDE) for intra-class correlations (rho) between 0.05 and 0.20. We did this
for a total amount of clusters of 187 (the amount of centers we have). The calculation
with 187 clusters provided some information about the power of our estimates if we
wanted to compare treatments, without differentiating between the two types of
treatments, and the control groups without the trainings. The calculations with 100
clusters provided some information about the power if we wanted to compare the two
treatment groups with each other.
40
Table E 1: Power calculations
rho MDE Clusters
0.05 0.11 187
0.10 0.14 187
0.15 0.16 187
0.20 0.18 197
0.05 0.15 100
0.10 0.19 100
0.15 0.21 100
0.20 0.24 100
In particular, we randomly assigned 187 centers to three groups. Group 1 contained 70
centers. In group 1, we invited husbands to participate in the training. Group 2
contained 31 centers. Also in group 2 the members received training, but we did not
invite husbands to take part in the G&B training. Group 3 included 86 centers.
Members from group 3 did not receive the training. As we discussed in the previous
sections, concerns about the expected take-up rate among husbands, the potential
effect on power calculations, and the question of how to deal with households with no
men led us to oversample the treatment groups in which husbands were invited
compared to treatment groups without husbands.
Since our power calculation is based on our assumption of intra-class correlations
(rho), using information from our baseline survey, we were able to estimate intra-class
correlations (rho) for different key variables in our study and check whether our
assumptions of intra-class correlations (rho) are reasonable, see Table E.2 below.
Overall, the estimated of intra-class correlations (rho) are in the range of our
assumption (0.05 to 0.2).
Table E 2: Results of intra-class correlations
Rho Standard errors Confidence interval (95%)
Average household income 0.14 0.02 0.11 0.17
Business knowledge index 0.19 0.02 0.16 0.23
Business at baseline 0.19 0.02 0.15 0.23
Number of business activities 0.20 0.02 0.16 0.23
41
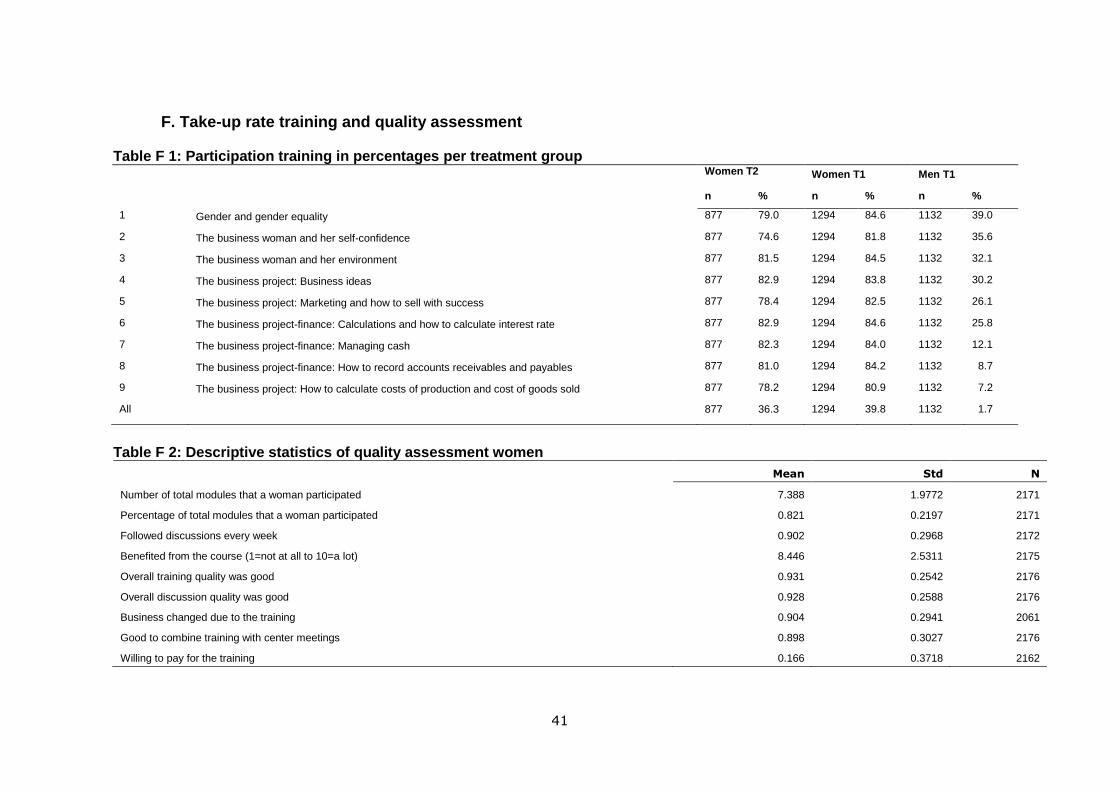
F. Take-up rate training and quality assessment Table F 1: Participation training in percentages per treatment group Women T2 Women T1 Men T1
Note: Columns (1) to (10): Percentage of women in the treated groups evaluated a specific training module as the first to ninth rank. We assign points to the rank of each
item: item ranks highest receives 9 points, the item ranks lowest receiving 1 point. Points of each item at each rank = assigned points * percentage of women evaluated
each item at each rank. Column (10) the aggregated points of each module; Column (11) rank of each module is based on the total points.
43
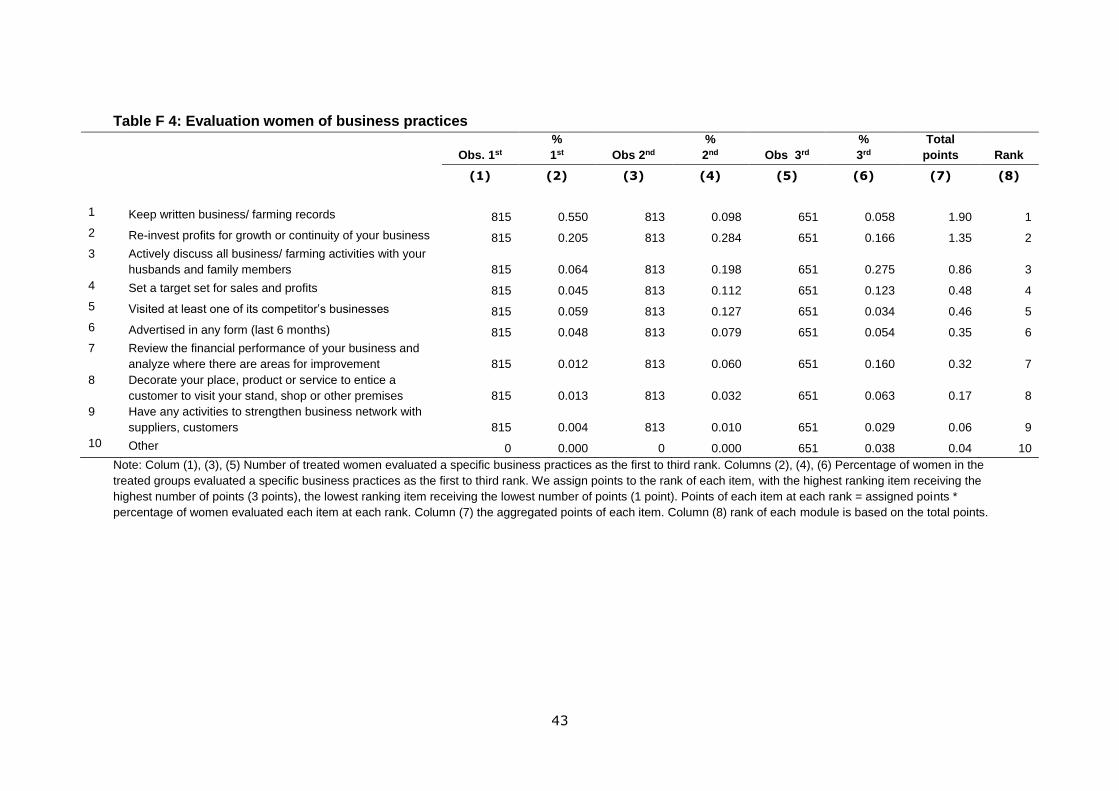
Table F 4: Evaluation women of business practices
Obs. 1st
%
1st Obs 2nd
%
2nd Obs 3rd
%
3rd
Total
points Rank
(1) (2) (3) (4) (5) (6) (7) (8)
1 Keep written business/ farming records 815 0.550 813 0.098 651 0.058 1.90 1
2 Re-invest profits for growth or continuity of your business 815 0.205 813 0.284 651 0.166 1.35 2
3 Actively discuss all business/ farming activities with your
husbands and family members 815 0.064 813 0.198 651 0.275 0.86 3
4 Set a target set for sales and profits 815 0.045 813 0.112 651 0.123 0.48 4
5 Visited at least one of its competitor’s businesses 815 0.059 813 0.127 651 0.034 0.46 5
6 Advertised in any form (last 6 months) 815 0.048 813 0.079 651 0.054 0.35 6
7 Review the financial performance of your business and
analyze where there are areas for improvement 815 0.012 813 0.060 651 0.160 0.32 7
8 Decorate your place, product or service to entice a
customer to visit your stand, shop or other premises 815 0.013 813 0.032 651 0.063 0.17 8
9 Have any activities to strengthen business network with
Note: Colum (1), (3), (5) Number of treated women evaluated a specific business practices as the first to third rank. Columns (2), (4), (6) Percentage of women in the
treated groups evaluated a specific business practices as the first to third rank. We assign points to the rank of each item, with the highest ranking item receiving the
highest number of points (3 points), the lowest ranking item receiving the lowest number of points (1 point). Points of each item at each rank = assigned points *
percentage of women evaluated each item at each rank. Column (7) the aggregated points of each item. Column (8) rank of each module is based on the total points.
44
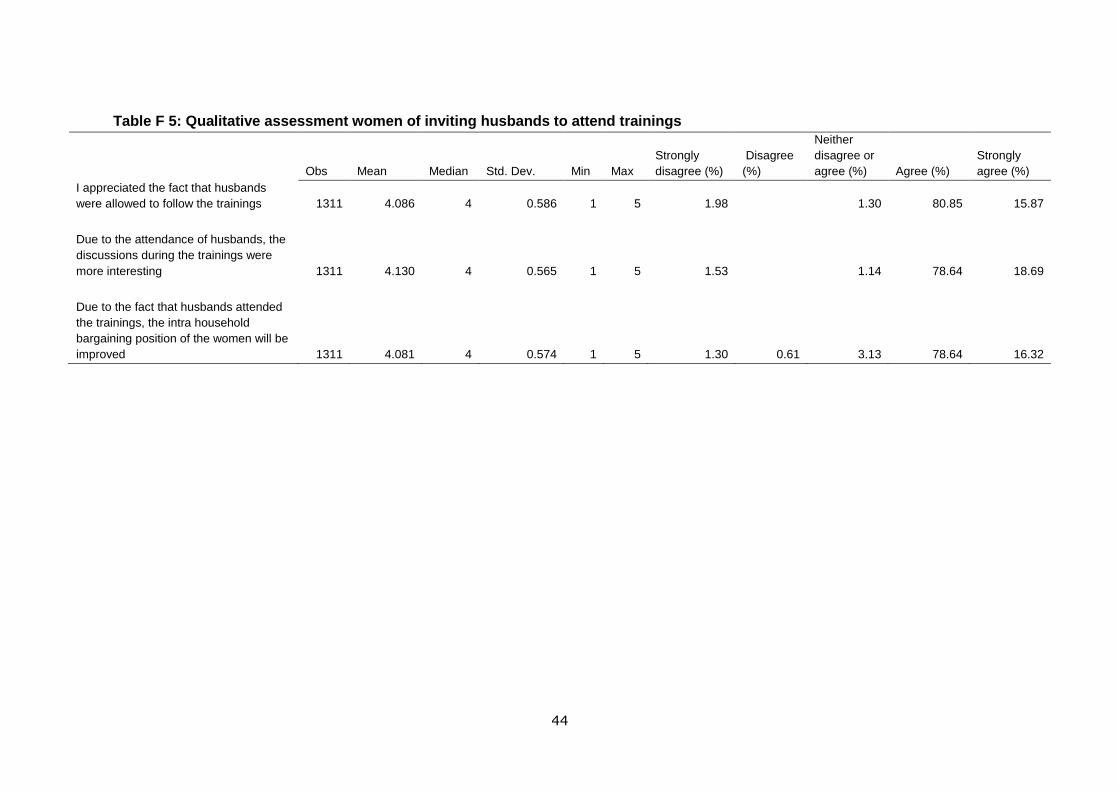
Table F 5: Qualitative assessment women of inviting husbands to attend trainings
Obs Mean Median Std. Dev. Min Max
Strongly
disagree (%)
Disagree
(%)
Neither
disagree or
agree (%) Agree (%)
Strongly
agree (%)
I appreciated the fact that husbands
were allowed to follow the trainings 1311 4.086 4 0.586 1 5 1.98
Table G 1: Construction business knowledge indices
Index 1 Index 2
Bus.1 You should improve or expand your business to smooth sales over time 1
Bus.2 Only price determines sales 1
Bus.3 Sales records are needed for product mix evaluation 1
Bus.4 It is better to produce what you are good, than what your customers demand 1
Bus.5 When a new competitor starts selling at a lower price, you should decrease prices as well 1
Bus.6 If you charge more than competitors, customers will not buy from you 1
Bus.7 Advertisements are not necessary for villagers with small businesses 1
Bus.8 Word-of-mouth does not affect the sales of business 1
Bus.9 Many businesses lose part of their products because of poor storage facilities 1
Bus.10 It is not necessary to separate money used for business and money used for household 1
Fin.1 What is 400 plus 300? 1
Fin.2 What is one tenth of 100? 1
Fin.3 In a sale, a shop is selling all items at half price. Before the sale a TV costs 4,000,000 VND. How much will it cost in the sale? 4,000,000 / 3,000,000 / 2,000,000 VND
1
Fin.4 If you sold two items for 8,000 VND each and your customer gave you 20,000 VND, how much balance do you owe the customer? 12,000 / 4,000 / 8,000 VND
1
Fin.5 Imagine that five brothers are given a gift of 1,000,000VND. If the brothers have to share the money equally how much does each one get? 1,000,000 / 500,000 / 200,000 / 100,000 VND
1
Fin.6 Now imagine that you get a gift of 1,000,000VND, and you put it in the drawer at home for 12 months. After one year you can buy with this more/ same/ less/ depends on inflation
1
Fin.7 You lend 1,000,000VND to a friend one evening and he gives you exact 1,000,000VND back the next day. How much interest has he paid on this loan? More/ Equal/ Less than 0%
1
Fin.8 Suppose you had 1,000,000 VND in a savings account with an interest rate of 2% per year. What is the account balance after one year (incl. interest payment, but no other payments or withdrawal)? More/ Exactly/ Less than 1,020,000 VND
1
Fin.9 Assume again: 1,000,000 VND with 2% interest rate. What is the account balance after five years (incl. interest payments, but no other payments or withdrawal)? More/ Exactly/ Less than 1,100,000 VND
1
48
Note: The indices are constructed by taking the sum of correct answers
Fin.10 With an interest rate of 1% per year and 2% inflation per year. How much can you buy after one year? More/ Same/ Less than today
1
Fin.11 ‘An investment with a high return is likely to be risky.’ True/ False 1
Fin.12 ‘High inflation means that the costs of living increase rapidly?’ True/ False 1
Fin.13 It is less likely that you will lose all of your money if you invest it in more than one project.’ True/ False 1
Mar.1 Good methods to attract more customers are: posters, home visits, loudspeakers, radio, handbills, clear signs, and interesting ‘look’ of your place of business. Product/ Price/ Place/ Promotion (4P)
1
Mar.2 It is important to review the price of your product or service on a regular basis. (4P) 1
Mar.3 Your product or service must meet customers’ needs. (4P) 1
Mar.4 Things to think about when you set your price: your costs, your production level, your competition, and your customers. (4P)
1
Mar.5 Your place of sales should be near your customers. (4P) 1
Acc.1 Cost of pork meat 1
Acc.2 Money taken to pay school fees for Ms. Hoa’s son 1
Acc.3 Payments for hiring an assistant to transport pork meat from suppliers to the market 1
Acc.4 Money taken to buy food for her family 1
Acc.5 Payment for hiring the kiosk in the market 1
Acc.6 A loan given to her friend to assist her wedding party 1
Acc.7 Telephone calls to friends to check on their health 1
Acc.8 Salary to assistant cleaning the kiosk at the end of the day 1
Prod.1 Total costs per product 1
Prod.2 Percentage of profit you expect 1
Prod.3 Education fee for your children 1
Prod.4 Competitor’s price of similar products 1
Prod.5 Price client is willing to pay 1
49
Table G 2: Weights per statement for business practices by principle component analysis
Note: Abs (loading)<0.300 are expressed as blanks. The weights per statement in two indices are constructed with a PCA on 7 business practices questioned at the baseline and two indices constructed with a PCA on 13 practices statement questioned in the midline.
General Innovation Marketing Record & Planning
1 Records sales, withdrawals or payments to workers 0.397 2 Discuss with anyone about how to improve activity 0.413 3 Diversify and improves quality in last 6 months 0.419
4 Makes sales on credit 0.495 5 Has an idea for innovation in business
0.685
6 Use an activity to increase customers or products in last 6 months
0.701
7 Reinvests profits for growth or continuity business 0.502
8 Use records for cash
0.422
9 Use records for debt
0.322
10 Use records to know profit per unit
0.414
11 Visits competitor to compare products and prices
0.421 12 Asks customers which other products need to sell or produce
0.415
13 Asks former customers why they stopped buying
0.389
14 Advertises in last 6 months
0.368 15 Cooperates with other people to sell or distribute together
0.411
16 Decorates place to entice customer to her shop
0.347
17 Actively discuss business with husband and family members 18 Has a business target for sales in next year
0.455
19 Has a business budget for costs in next year
0.445
20 Reviews financial performances and analyzes areas for improvement
0.366
50
Table G 3: Construction of gender knowledge index
Note: The indices are constructed by taking the sum of correct answers
Table G 4: Construction of personal control belief
Internal locus of control (1 point) External locus of control (0 point)
1 What happens to me is my own doing Sometimes I feel that I don’t have enough control over the direction my life is taking
2 When I make plans, I am almost certain that I can make them work When I make plans, it is not always wise to plan too far ahead, because many things turn out to be a matter of good or bad fortune anyhow
3 Getting what I want has little or nothing to do with luck Many times I might just as well decide what to do by flipping a coin
4 It is impossible for me to believe that chance or luck plays an important role in my life
Many times I feel that I have little influence over the things that happen to me
Note: The index is constructed by taking the sum of points gathered per statement
Table G 5: Construction of intimate partner violence indices
Relational violence Relational oppression
Verbal aggression 1
Physical assault 1
Insisted on knowing where you are at all times 1 Wanted you to ask permission before doing anything 1
Note: The index is constructed by taking the average of points for the relevant statements
Gender knowledge
Gen.1 Men and women should have equal opportunities in enterprise development 1
Gen.2 Only men can launch a new business 1
Gen.3 Only women are responsible for the housework and children 1
Gen.4 Boys should have more chances to access to education and training than girls 1
51
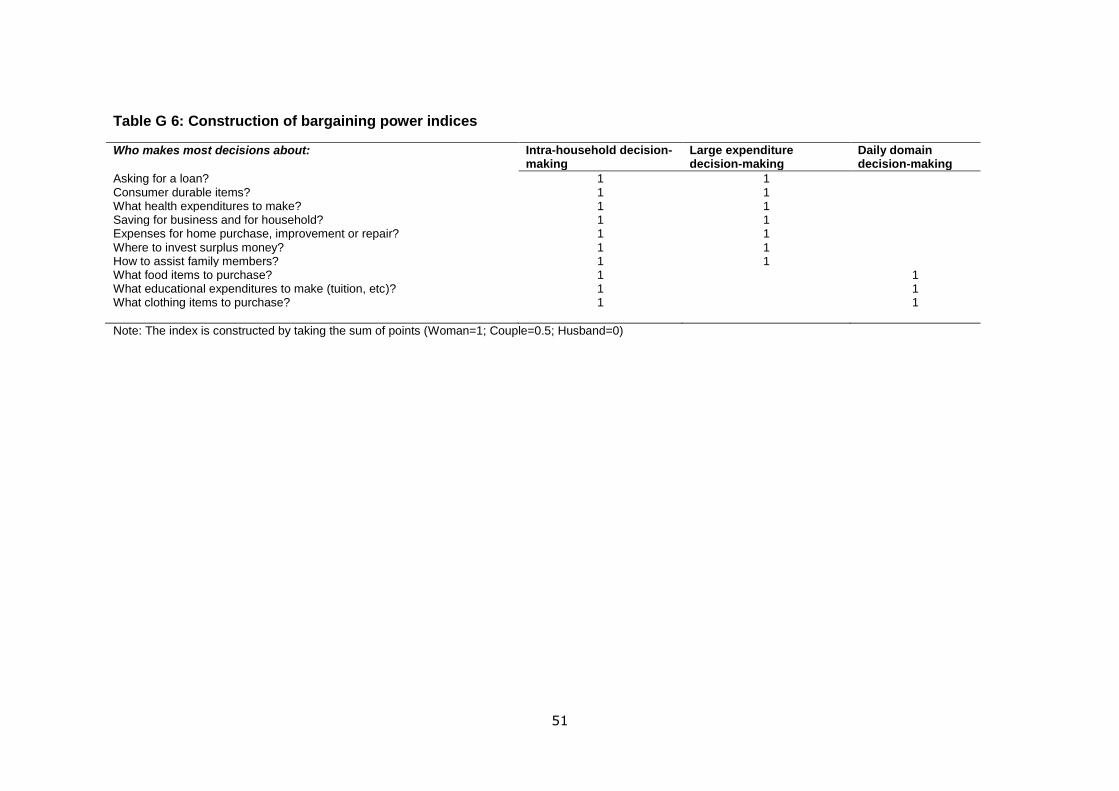
Table G 6: Construction of bargaining power indices
Who makes most decisions about: Intra-household decision-making
Large expenditure decision-making
Daily domain decision-making
Asking for a loan? 1 1
Consumer durable items? 1 1
What health expenditures to make? 1 1
Saving for business and for household? 1 1
Expenses for home purchase, improvement or repair? 1 1
Where to invest surplus money? 1 1
How to assist family members? 1 1
What food items to purchase? 1 1 What educational expenditures to make (tuition, etc)? 1 1 What clothing items to purchase? 1 1
Note: The index is constructed by taking the sum of points (Woman=1; Couple=0.5; Husband=0)
52
H. Descriptive statistics
Table H 1: Descriptive statistics outcome variables
N Mean St.dev Min Max
Age (years old) 4035 43.77 10.33 19.00 72.00
Schooling (years) 4030 6.82 2.91 0.00 18.00
Married 4041 0.82 0.39 0.00 1.00
Ethnic group (Kinh) 4041 0.94 0.23 0.00 1.00
Household size 3943 4.74 1.56 1.00 15.00
City (Hanoi) 4041 0.26 0.44 0.00 1.00
Credit access TYM 4037 1.10 0.70 0.00 2.00
Interest in training 4037 0.76 0.43 0.00 1.00
Monthly income 4037 6,064.50 3,418.23 0.00 50,000.00
Robust standard errors in parentheses *** p<0.01, ** p<0.05, * p<0.1
78
References
Allen, T., Armendáriz, B., Karlan, D. and Mullainathan, S. (2010). Inviting husbands in
women-only solidarity groups: Evidence from Southern Mexico, Working Paper.
Angelucci, M., Karlan, D., & Zinman, J. (2015). Microcredit impacts: Evidence from a randomized microcredit program placement experiment by Compartamos Banco. American Economic Journal: Applied Economics, 7(1), 151-82
Armendariz, B. and Roome, N. (2008). Gender empowerment in microfinance. Munich
Personal RePEc Archive. Working paper.
Armendáriz de Aghion, B., and Morduch, J. (2010) The economics of microfinance, 2nd
edition, Cambridge: MIT Press.
Bamberger, J. (1974). The Myth of Matriarchy: Why Men Rule in Primitive Society, in