THE IMPACT OF HEADQUARTER AND SUBSIDIARY LOCATIONS ON MULTINATIONALS’EFFECTIVE TAX RATES
Kevin S. MarkleDouglas A. Shackelford
Working Paper 19621http://www.nber.org/papers/w19621
NATIONAL BUREAU OF ECONOMIC RESEARCH1050 Massachusetts Avenue
Cambridge, MA 02138November 2013
We thank Jeffrey Brown (editor), William Randolph, and attendees at the Tax Policy and the Economyconference for their helpful comments. The views expressed herein are those of the authors and donot necessarily reflect the views of the National Bureau of Economic Research.
NBER working papers are circulated for discussion and comment purposes. They have not been peer-reviewed or been subject to the review by the NBER Board of Directors that accompanies officialNBER publications.
The Impact of Headquarter and Subsidiary Locations on Multinationals’ Effective Tax RatesKevin S. Markle and Douglas A. ShackelfordNBER Working Paper No. 19621November 2013JEL No. F23,H25,H26
ABSTRACT
We examine effective tax rates (ETRs) for 9,022 multinationals from 87 countries from 2006 to 2011. We find that, despite extensive investments in international tax avoidance, multinationals headquarteredin Japan, the U.S., and some high-tax European countries continue to face substantially higher worldwidetaxes than their counterparts in havens and other less heavily taxed locations. Other findings include:(a) Effective tax rates remained steady over the investigation period; (b) Entering a tax haven countryfor the first time results in a slight reduction in the firm’s ETR; (c) ETR changes vary depending onwhether the subsidiary is a financial conduit or an operating subsidiary. These results should aid ongoinginternational tax policy debates and expand scholars’ understanding about the taxation of multinationals.
Douglas A. ShackelfordUniversity of North Carolina at Chapel HillKenan-Flagler Business SchoolCampus Box 3490, McColl BuildingChapel Hill, NC 27599-3490and [email protected]
Senate Finance Committee, March 11, 1999
Bob Perlman, Vice President of Taxes for Intel Corporation: “…if I had known at Intel's
founding (over thirty years ago) what I know today about the international tax rules, I
would have advised that the parent company be established outside the U.S. This reflects
the reality that our Tax Code competitively disadvantages multinationals simply because
the parent is a U.S. corporation...”
New York Senator Daniel Patrick Moynihan: "So, you would have left the United States
for the tax shelters of the Cayman Islands. Do you think that the Marines are still down
there if you need them?
1. Introduction
This paper provides the most comprehensive analysis to date of the impact of a
multinational’s locations on its global tax liability. We use Orbis ownership data and Compustat
financial information for 9,022 multinationals headquartered in 87 countries to calibrate the
impact that each country has on the typical firm’s worldwide effective tax rate. We also quantify
the immediate ETR impact of moving into a new country via a foreign subsidiary. The resulting
statistics about various tax systems enhance our understanding of how differences across
countries in corporate taxes affect multinationals. They also provide additional empirical
underpinnings for the continuing international tax policy debates in the United States, the United
Kingdom, and other countries as all nations compete in the market for corporate tax domicile.1
Markle and Shackelford (2012) compare ETRs for companies around the world using
2009 financial statements. We extend those comparisons through 2011. In addition, the data in
this paper are more extensive, enabling us to conduct two new tests. First, we can (mostly)
reconstruct each multinational’s set of foreign and domestic subsidiaries from 2006-2011.2 This
1 Tax domicile is the location of the firm for tax purposes. Countries differ in their definitions of domicile, e.g., U.S.
domicile is the country of incorporation; UK domicile is the location of operational headquarters. Throughout the
paper, we observe countries of incorporation and operations and assume that domicile follows. To the extent these
assumptions are wrong, our measures are erroneous. 2 Orbis lists the subsidiaries ultimately controlled by the multinationals in our sample as of 2011. To determine
when that subsidiary came under the control of the multinational, we use the presence of data in the shareholder
2
allows us to observe changes in ETRs as firms move into a new country. Second, the new data
disclose the ownership of the subsidiaries (i.e., who owns whom throughout the tiers of the
ownership structure). This permits us to test whether the ETR impact of entering a country
depends on the subsidiary being an active operating company or a financial conduit that holds
stock in other companies.
The updated comparisons and the results from the new tests should aid policymakers as
they continue to adjudicate two competing views about multinationals and taxes (see discussion
in Toder, 2012). One perspective, widely accepted among American corporate managers, is that
establishing headquarters in the U.S. results in higher total worldwide taxes, that new companies
anticipating substantial foreign operations should not incorporate in the U.S., that U.S. tax law
results in inefficient build-up of cash abroad (e.g., Summers, 2013) and that companies located
outside the U.S. have a tax advantage in the market for corporate control (Nakabayashi and
Carter, 2013, Carroll, 2010, Huizinga and Voget, 2009, and Samuels, 2009, among others).
Reasons include the U.S.’s atypical worldwide tax system, limits on the deductibility of some
expenses, a relatively restrictive controlled foreign corporation (CFC) regime, and aggressive
federal and state tax administration.3 As one example that other countries dominate the U.S. as a
domicile for multinationals and that companies currently domiciled in the U.S. would leave if the
tax costs of exiting were not prohibitive, critics of the current U.S. system point to the strong
legislation and political pressure that were needed to stem the exodus of U.S. companies through
inversions (reincorporations in low-tax countries with no operational impact), following Stanley
information variables in previous years as an indicator that the subsidiary was controlled by the parent in that year.
Unfortunately, we are not able to distinguish whether the first instance of data captures the acquisition of the
subsidiary or the beginning of coverage of the subsidiary by Orbis. Furthermore, because we begin with the set of
subsidiaries controlled by the multinational in 2011, we are unable to identify subsidiaries that were divested in our
sample period. 3 In overly simplistic terms, countries with territorial systems only tax the domestic income of companies domiciled
in their country. In contrast, countries with worldwide systems tax all income (domestic and foreign) of their home
companies and provide foreign tax credits to prevent double taxation of foreign profits.
3
Works’ highly controversial aborted move to Bermuda in 2002 (see discussion in Desai and
Hines, 2002). Furthermore, concerns about domicile competitiveness are not limited to the U.S.
In his study of 278 changes in multinational headquarters involving 19 countries from 1997 to
2007, Voget (2011) shows that relocating to reduce global taxes is a widespread phenomenon.4
In fact, a perceived inability to compete in the market for domicile reportedly contributed to the
UK’s 2009 adoption of a territorial system of taxing the foreign profits of British multinationals.5
Another perspective is less sympathetic to multinationals and the challenges they face in
international taxation. From exposés of Dutch-Irish Sandwiches and other colorfully named tax
plans, to claims of “stateless” income (Kleinbard, 2011a, 2011b), to Congressional and
Parliamentary attacks on high-profile companies, such as Apple, Google, Starbucks, and
Amazon, to OECD reports and plans,6 many believe that multinational firms can easily erase any
disadvantages arising from operating in high-tax domiciles. Scholars too have documented that
multinationals can arrange their affairs to undo differences in taxation across countries.7 By
shifting income from high-tax to low-tax countries through transfer pricing, using hybrid entities
that are treated as corporations in some countries and flow-through entities in others, stripping
profits from high-tax countries through intracompany financing, repatriating under favorable tax
conditions, and other tax avoidance mechanisms, multinationals mitigate, if not fully erode, the
deleterious implications of doing business in a high-tax country.
4 From a policy perspective, it is important to remember that relocation is a zero-sum game; every relocation is a
loss for one country but a gain for another. Thus, focusing solely on the companies that are leaving a country might
lead to erroneous inferences. For example, in the Voget (2011) sample, more companies (37) left the UK than any
other country. However, the same number relocated to the UK. 5 For example, at one point, the Financial Times (September 21, 2008) quoted an anonymous source saying, “As we
understand it, half the FTSE 100 is looking at this [redomiciling outside the UK.].” (Braithwaite, 2008). 6 For example, see Addressing Base Erosion and Profit Shifting, released on February 13, 2013 and its action plan,
which followed on July 19, 2013. 7 See Blouin (2012) for a review of the international tax literature. For a smattering of studies over the last two
decades, see Gravelle (2013), the United States Government Accountability Office (2013), Dharmapala et al. (2011),
Dyreng and Lindsey (2009), Huizinga et al. (2008), Desai et al. (2006), Gordon and Hines (2002), Collins and
Shackelford (1997), and Hines and Rice (1994), among many others.
4
Thus, how domicile affects a multinational’s total worldwide taxes is an empirical
question. To address these two perspectives, we analyze firm-level financial statement
information. In particular, we regress firm-level ETRs (i.e., total income tax expense as a
percentage of pre-tax income) on categorical variables for the countries in which the
multinational is located—both at the parent and subsidiary levels. The regression coefficients on
the categorical variables estimate the incremental impact of locating the headquarters of the
multinational in a specific country or entering a new country through a subsidiary.
Our primary finding is that, despite decades of international tax planning and continuing
reports of elaborate innovative schemes to avoid taxes, the effective tax rates of multinationals
vary considerably depending on the sites of the company. We find dramatic differences in
effective tax rates based on the headquarters of the multinational. Japanese-headquartered
multinationals face the highest ETRs, by far. After controlling for industry and size, their ETRs
average 8.5 percentage points higher than their runner-up counterparts from the U.S. The ETRs
of American multinationals are slightly ahead of those from two major trading partners, France
and Germany. On the other end of the distribution, multinationals from the Middle East (Tax
Havens) enjoy ETRs that average 12.5 (10.8) percentage points lower than American firms. In
short, we find that differences continue to persist in ETRs between high-tax and low-tax
countries despite vast investment in international tax avoidance.
Other findings include the following: (1) Prior work had shown that worldwide ETRs
fell in recent decades. We find stable ETRs from 2006 to 2011. (2) Industries are taxed
similarly around the world, albeit with construction taxed a bit lightly and information a bit more
heavily. Compared with the rest of the world, the U.S. taxes the financial services more heavily
and information more lightly. (3) When a company first enters a tax haven, ETRs fall but only
5
by a small amount. (4) Whether a subsidiary is an equity holding company or a terminal
operating subsidiary alters its ETR effect.
The remainder of the paper is organized as follows: Section 2 outlines the research
design. Section 3 presents the empirical findings. Closing remarks follow.
2. Research Design
2.1. Regression Equation
It is difficult to undertake statistical analyses of cross-country variation, such as the
impact of headquarter domicile on multinational ETRs, because country-level unobservables
undermine identification. Ideally, we would address this limitation by randomly assigning
headquarter countries to multinationals. Alternatively, if companies regularly moved their
headquarters, then remedies, such as fixed effects, difference-in-differences, or instrumental
variables, could provide reliable causal links. Unfortunately, too few companies move their
headquarters across borders to provide sufficient power. Thus, in these initial tests of the impact
of headquarters on firm ETRs, we mostly avoid statistical comparisons.
In light of these econometric challenges, we take the actual firm-level ETRs, control for
as many observable factors as possible, and report the remaining variation in ETRs by country.
For example, we control for industry because if the mining sector faces relatively low taxes
throughout the world because of tax incentives for natural resources, then countries with
disproportionately large numbers of miners might appear to enjoy lower levels of taxation than
other countries do, even though the difference actually arises because of the industry mix.
However, it is important to recognize that including control variables in a regression does not
provide assurance that the country-level observables that plague cross-country tests have been
6
fully accounted for. Thus, the average tax rates that we compute should be viewed as statistics
about tax systems, rather than measures of economic incentives.
With that caveat, we use the pooled, cross-sectional regression equation developed in
Markle and Shackelford (2012) with the sole modification that we drop all variables involving
indicators for multinational firms because all companies in this study are multinationals. By
suppressing the intercept, the coefficients on the COUNTRY variables can be interpreted as the
marginal cost of domiciling in a country, conditional on the control variables.
where: total worldwide income tax expense divided by net income before
income taxes for firm i in year t.
an indicator variable equal to 1 if firm i is domiciled in country j in year
t, equal to 0 otherwise.
an indicator variable equal to 1 if firm i is identified as being in
industry k (by two-digit NAICS) in year t, equal to 0 otherwise.
an indicator variable equal to 1 for firm-years for which t = m, equal to
0 otherwise.
the percentile rank of the size of variable q for firm i in year t.
n={Assets, Revenue, Owners’ Equity}.
For the dependent variable, we opt for total income tax expense in the numerator, as
opposed to current income tax expense or cash taxes paid. The reason is that many non-U.S.
companies only report the total income tax figure; thus, using the total provision maximizes the
sample size. We recognize that the total income tax expense is an imperfect measure of the
7
firm’s actual taxes paid in part because it fails to capture the impact of transactions for which
taxable income is recognized after book income. 8
However, we take comfort from Markle and
Shackelford’s (2012) finding that the Pearson correlation coefficient between total and current
income tax expense is 95%, suggesting that the increase in sample size may justify any loss of
information about cross-firm differences in deferral tax avoidance. Finally, to mitigate the
impact of outliers and errors in the data, we limit the sample to observations with non-negative
ETRs less than or equal to 70%.
2.2. Sample
We conduct our tests using the most recent ownership information in Orbis (usually 2011
financial statement data). Orbis, a database maintained by Bureau van Dijk, dominates other
databases because it enables us to observe the country locations for both headquarters and the
foreign subsidiaries of many multinationals and to determine the ownership structure for the
subsidiaries. We then match these firms to financial statement data in Compustat’s Global and
North America databases. The sample selection process yields 42,738 multinational-years from
2006 through 2011 spanning 87 countries, ranging from only five firm-years in two countries
(Bahrain and Kazakhstan) to 13,234 observations in the United States. We combine countries
with fewer than 400 observations into six categories: Africa, Asia, Europe, Latin America,
Middle East, and Tax Havens. The remaining fifteen countries are included on their own and our
8 See Graham et al. (2012) for a detailed discussion of the different tax figures found in the financial statements and
the imperfections of each for tests such as these. In simplest terms, total income tax expense is the product of the
tax rate and pre-tax book income adjusted for any items that are never subject to tax. Current income tax expense is
the portion of total income tax expense that relates to the current year’s taxable income. Cash taxes paid are the
actual taxes paid to all governments in a particular year related to tax returns from the current and past years, net of
any refunds.
8
main tests are conducted and results are reported using these 21 countries and groups (hereafter
referred to simply as “countries”).
For the 21 countries, Table 1 reports the firm-year means of Sales, Assets, Equity, Pretax
income, ETR, and statutory tax rates.9 31% of the sample are companies whose headquarters are
domiciled in the U.S. The mean American company has sales of $4.4 billion, assets of $10.9
billion, equity of $2.3 billion, pretax income of $0.4 billion, and an ETR of 28%.
3. Findings
3.1. Does the Location of the Multinational’s Headquarters Matter?
Table 2 presents all regression coefficients from estimating equation (1). The COUNTRY
coefficients are of primary interest because they denote the incremental ETR impact to a
multinational of having its headquarters in a specific country. The wide range of COUNTRY
coefficients is striking with the maximum value (30.4% for Japan) more than triple the smallest
(9.4% for the Middle East, which relies on non-income tax levies on its natural resources). The
U.S. has the second largest coefficient at 21.9%. The next four smallest coefficients all hail from
locations associated with international tax avoidance: Tax Havens (11.1%), Singapore (13%),
Switzerland (13.1%), and Taiwan (14.6%).
The results are not surprising in that they confirm widely-held views about which
countries have the highest income taxes and which ones have the lowest income taxes.
Nonetheless, it remains remarkable that with increasingly integrated global capital markets,
domicile remains such an important factor in determining a multinational’s total income tax
burden. Apparently the tax and non-tax frictions of moving to a less heavily taxed domicile are
9 The combined corporate statutory tax rate for the 30 OECD countries is available at www.oecd.org. Kevin Hassett
kindly provided the maximum rate for non-OECD countries.
9
non-trivial. Otherwise, it is hard to explain the persistence of Japanese companies with
COUNTRY coefficients exceeding 30.4% while Singaporean companies enjoy coefficients of just
13.0%.10
These coefficient differences imply that the typical Singaporean company has an
enormous advantage over its Japanese competitor, pocketing 17.4 cents more for every dollar of
pre-tax profit. Restated, these estimates imply that a Japanese company that relocated its tax
domicile to Singapore without affecting any other aspects of its business would increase its
bottom line by 25% [(1-.13)/(1-.304)]. Other sizeable imbalances involving companies from
similar markets include French companies at 21.7% when British companies are at 16.2%;
American companies at 21.9% while Canadian companies are at 17.5%, and German companies
at 20.6% when Swiss companies are at 13.1%.
The magnitude of the COUNTRY coefficients should not be taken as estimates of the
actual ETRs from the financial statements, because the coefficients are the actual ETRs,
conditional on industry, year, and size. Instead, the coefficients should be compared with each
other. To aid in that comparison, Table 3 presents the results of F-tests comparing the
COUNTRY coefficients for each country generated by estimating equation (1). It confirms the
widespread differences among the equation (1) coefficients. A star in a cell of Table 3 indicates
that the COUNTRY coefficient for the row country is statistically significantly different from the
10
One potential explanation for the persistence of these large differentials is that income generated in Japan is taxed
heavily and income generated in Singapore is taxed lightly. Then, if Japanese companies operate mostly in high-tax
Japan and Singaporean companies operate mostly in low-tax Singapore, we might erroneously infer that
headquarters matters when actually the location of operations determines the difference between Japanese and
Singaporean companies’ tax rates. Unfortunately, firms do not segregate their profits into domestic and foreign
portions in their financial statements; so, we are unable to assess the extent to which differences in domestic taxation
drives our inferences about headquarter effects.
10
COUNTRY coefficient of the column country.11
The American COUNTRY coefficient differs
significantly from every other country’s coefficient, except the ones for France and South Africa.
In summary, these findings are consistent with the location of a firm’s headquarters
continuing to affect its global tax burden. We infer that, contrary to the assertions of some and
despite many successful strategies for shifting profits from high-tax countries to low-tax
countries, companies domiciled in high-tax countries still appear to pay much higher global
taxes.
3.2. Variation in Headquarter ETR Effects Over Time and Industry
Tables 2 and 3 present results from tests that combine all firm-years from 2006-2011.
Next, we estimate COUNTRY coefficients separately for each year to test whether ETRs have
been trending over the six years under investigation. Instead, we find that ETRs have been
generally steady over the period.
Table 4 shows that the distribution of countries from high-tax to low-tax remains
consistent throughout the six years. Every year Japan has the largest COUNTRY coefficient, and
the Middle East, the Tax Havens, Singapore and Switzerland are among the five locations with
the lowest coefficients. The U.S. has the penultimate COUNTRY coefficient every year except
2011, when it comes in fourth. Moreover, the coefficients do not appear to be uniformly rising
or falling over time. However, they are generally larger in 2009 and smaller in 2011. Thirteen
of the 21 locations have their largest coefficient in 2009, while none has its lowest that year. In
contrast, 14 of the 21 locations have their lowest ETR estimate in 2011, while none has its
highest coefficient in that year.
11
For example, the star in the upper left-hand corner indicates that the COUNTRY coefficients for Australia and
China are significantly different at the 5% level; the lack of a star for Australia and Canada shows that their
COUNTRY coefficients are not statistically different.
11
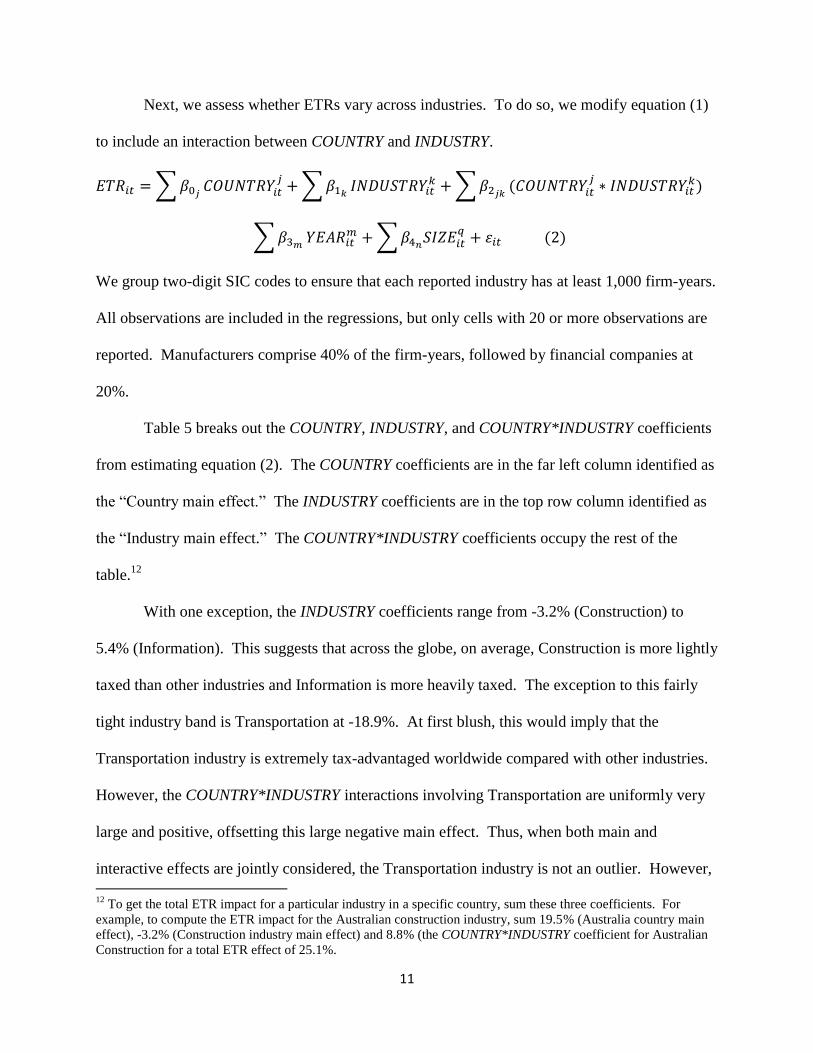
Next, we assess whether ETRs vary across industries. To do so, we modify equation (1)
to include an interaction between COUNTRY and INDUSTRY.
We group two-digit SIC codes to ensure that each reported industry has at least 1,000 firm-years.
All observations are included in the regressions, but only cells with 20 or more observations are
reported. Manufacturers comprise 40% of the firm-years, followed by financial companies at
20%.
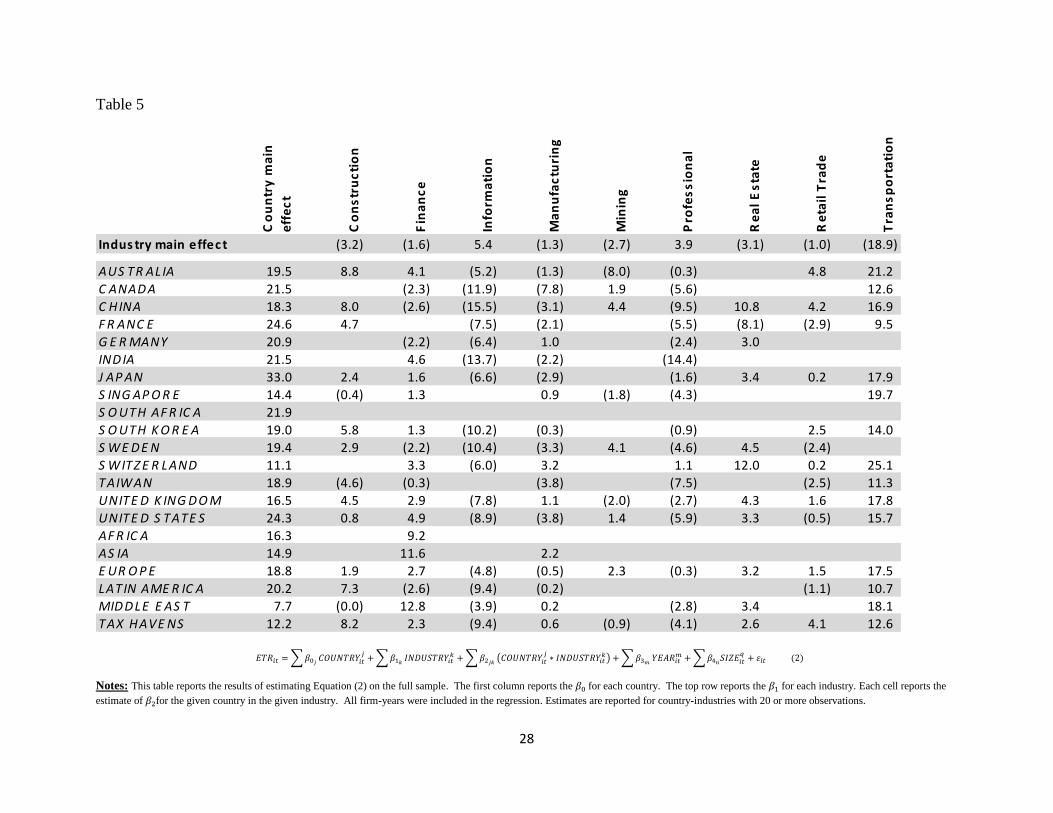
Table 5 breaks out the COUNTRY, INDUSTRY, and COUNTRY*INDUSTRY coefficients
from estimating equation (2). The COUNTRY coefficients are in the far left column identified as
the “Country main effect.” The INDUSTRY coefficients are in the top row column identified as
the “Industry main effect.” The COUNTRY*INDUSTRY coefficients occupy the rest of the
table.12
With one exception, the INDUSTRY coefficients range from -3.2% (Construction) to
5.4% (Information). This suggests that across the globe, on average, Construction is more lightly
taxed than other industries and Information is more heavily taxed. The exception to this fairly
tight industry band is Transportation at -18.9%. At first blush, this would imply that the
Transportation industry is extremely tax-advantaged worldwide compared with other industries.
However, the COUNTRY*INDUSTRY interactions involving Transportation are uniformly very
large and positive, offsetting this large negative main effect. Thus, when both main and
interactive effects are jointly considered, the Transportation industry is not an outlier. However,
12
To get the total ETR impact for a particular industry in a specific country, sum these three coefficients. For
example, to compute the ETR impact for the Australian construction industry, sum 19.5% (Australia country main
effect), -3.2% (Construction industry main effect) and 8.8% (the COUNTRY*INDUSTRY coefficient for Australian
Construction for a total ETR effect of 25.1%.
12
because of the unusual coefficients for the Transportation industry, we ignore it in the remainder
of our discussion of Table 5.
The interaction coefficients enable us to see how specific countries vary their taxes across
industries, after accounting for the normal worldwide variation captured in the Industry main
effect, discussed above. For example, compared with other countries (and ignoring
Transportation), the U.S. taxes Information relatively lightly, as shown by a -8.9% interaction
term, and taxes Finance relatively heavily, as demonstrated by a 4.9% interaction term. We find
striking similarities across countries in the interaction terms. Specifically, we compute the
Pearson coefficient correlation using the interaction terms for the six countries with enough firm-
years to report coefficients for all industries (i.e., China, Sweden, UK, U.S., Europe and Tax
Havens). Despite marked tax and non-tax differences across these six countries, the smallest
correlation among the 15 pairs formed by them is 72%, indicating that the interaction terms rise
and fall together across industries for these six countries. The U.S. correlations range from 79%
(Sweden) to 93% (Europe).
3.3. How Does Expansion into a New Country affect a Multinational’s Worldwide ETR?
So far, the paper has looked at the ETR effect of the country in which the multinational
establishes its headquarters. We now shift to quantifying the immediate impact on effective tax
rates of expanding into a new country through a foreign subsidiary. To assess the immediate
impact of the country location of a foreign subsidiary on a multinational’s ETR, we regress ETR
on categorical variables that identify the countries in which a firm has subsidiaries. Using a firm
fixed effects model and a control for year, the regression equation is:
13
where: an indicator variable equal to 1 if firm i reports a subsidiary in country
k, equal to 0 otherwise;
Because we adopt a firm fixed effects model, maintain the year dummy, and have a sample
where the foreign subsidiary locations only change when the multinational expands, the SUB
coefficient captures the impact on effective tax rates of entering a new country. Therefore, each
SUB coefficient is the estimated ETR impact in the first year arising from establishing a
subsidiary in a particular foreign country.
We use the same sample of 42,738 firm-years from 2006-2011. For these firm-years,
there are 224,090 SUB variables with a value of one, led by 23,807 subsidiaries in the United
States, 16,957 in the United Kingdom, and 10,098 in Germany.
The first column of Table 6 shows the SUB regression coefficient estimates for the 48
countries with at least 1000 firm-years where SUB has a value of one. Coefficients range from
-1.3 for Belgium (implying that multinationals from all countries lower their ETRs by 1.3
percentage points on average when they enter Belgium) to 1.9 for the British Virgin Islands
(implying that multinationals increase their ETRs by 1.9 percentage points on average when they
enter the British Virgin Islands). Both of these coefficients are significantly different from zero.
However, they are the exceptions. Only two other coefficients are significant at the 10% level—
Poland at -0.9 and the United States at 0.7, the latter estimate consistent with assertions that the
U.S. is a high-tax country. The shortage of statistically significant coefficients is not surprising
because the immediate influence of any single subsidiary on a multinational’s worldwide tax
liability should be small. The net effect of many companies from many countries (plus the
normal measurement error that plagues all empirical work) would not be expected to result in
14
huge percentage point changes in effective tax rates. Nonetheless, we do find the sign and
magnitude of the coefficients interesting.
Other countries with particularly large positive coefficients are Portugal (0.9), Sweden
(0.9), Romania (0.7), Argentina (0.7) and the UK (0.7). Other locations where foreign
subsidiaries appear to substantially lower ETRs are Slovakia (-0.9), Denmark (-0.8), and the
Cayman Islands (-0.7), a well-known tax haven. Consistent with establishing a subsidiary in a
tax haven leading to a reduction in effective tax rates, the mean (median) coefficient for the
countries most commonly identified as tax havens (Bermuda, Cayman Islands, Hong Kong,
Ireland, Luxembourg, the Netherlands, Singapore, Switzerland, Taiwan and Other Tax Havens)
is slightly negative at -0.2 (-0.1). Surprisingly, however, the SUB coefficients are not correlated
with the statutory tax rates for these countries, implying that the immediate effect of a foreign
subsidiary’s statutory tax rate is undone or masked when it is included as part of a
multinational’s portfolio of locations around the world.
The remainder of Table 6 shows the SUB coefficients when the regression is run for
subsets based on the headquarters of the multinational.13
For example, the U.S. column shows
the results from equation (3) when the only observations are firm-years for American
multinationals. Coefficients vary widely by the domicile of the multinational’s parent. By
comparing the coefficients across countries, we can see the extent to which ETR impact of a
foreign subsidiary fluctuates across countries. For example, the impact appears similar for
American, British and German multinationals with positive Pearson correlation coefficients for
these three columns of regression estimates. In contrast, both the U.S. and UK columns of
coefficients are negatively correlated with the Japanese column of coefficients, implying that
establishing a subsidiary for a Japanese company in a particular country has a very different
13
Coefficients are reported if there are at least 100 firm-years.
15
immediate impact on effective tax rates than it does for an American or British company.
Reviewing a few key tax havens demonstrates the divergence between U.S. and Japanese
coefficients: The Hong Kong coefficient for American (Japanese) multinationals is -0.7 (1.8).
The Irish coefficient for American (Japanese) multinationals is -0.3 (-3.1). The Singaporean
coefficient for American (Japanese) multinationals is zero (-1.7).
3.4. Comparisons of Operating Subsidiaries and Holding Companies
Dyreng et al. (2013) stress that not all subsidiaries are the same. Some house operations;
others are financial conduits transporting capital from headquarters to those operating
subsidiaries. The remaining tests in the paper distinguish between operating subsidiaries and
their corporate shareholders, which may conduct production, marketing, and other nonfinancial
activities of the firm, but (principally) serve as financial links between headquarters and the
operating subsidiaries. The purpose of these tests is to see if the type of subsidiary affects its
impact on effective tax rates.
We anticipate that taxes play a secondary role, if any, in the location of operating
subsidiaries. For example, if operating subsidiaries are principally concerned with sales, then
demand for the company’s products likely drives the site. If the operating subsidiaries are
principally for manufacturing, then efficiencies associated with the factors of production likely
drive the location. On the other hand, the fungibility of money provides some flexibility in site
decisions for holding companies, which merely serve to pass funds from headquarters to
operating subsidiaries. Thus, we expect to see the location decisions for at least some financial
conduits to be tax-motivated with likely destinations being tax havens and larger countries noted
for facilitating tax avoidance, such as the Netherlands.
16
To compare operating and financial subsidiaries, we use the Dyreng et al. (2013) sample
of terminal operating subsidiaries and their immediate corporate shareholders. Unfortunately,
their data are limited to American, British, Canadian, French, German, Italian, and Japanese-
headquartered multinationals, which nearly halves our sample to 23,004 firm-years. Untabulated
sensitivity tests, however, provide some confidence that this smaller sample is representative of
the larger sample that we have used to date in this paper.14
Table 7 enables us to compare regression coefficient estimates for terminal operating
subsidiaries (Panel A) and equity holding companies (Panel B). Specifically, Panel A presents
findings from reestimating a modified equation (3), where we assign one to SUB only if the firm
has a subsidiary in the country that is a terminal subsidiary, i.e., owns stock in no other company.
Following Dyreng et al., 2013, we infer that terminal subsidiaries are solely operating
subsidiaries because, by definition, they own no other companies. Panel B depicts statistics from
reestimating a different modification of equation (3), assigning one to SUB only if the firm has a
subsidiary in the country that owns a terminal subsidiary. We report countries with at least 500
subsidiaries and coefficients with at least 100 firm-years.
When observing Table 7, we first notice that Panel A reports results for 117,062 terminal
operating subsidiaries spread across 48 countries. In contrast, Panel B presents findings for only
37,517 equity holding companies in 18 countries. Furthermore, 14% of the operating
subsidiaries are located in tax havens and larger countries associated with international tax
planning (specifically, Hong Kong, Ireland, Netherlands, Singapore or Switzerland),
significantly less than the 18% of the financial conduits found in those countries. This is
14
To assess the impact of the smaller sample on our analyses, we reestimate equation (3) using the reduced sample.
When we compare results using the complete sample of 42,738 observations from Table 6 with results using the
sample of only 23,004 firm-years, we find the two columns of regression coefficients for American multinationals is
correlated at the 97% level, suggesting inferences are largely the same using the smaller sample.
17
consistent with real operations occurring throughout the world wherever business opportunities
arise with less concern for taxes, while financial conduits are more likely to be concentrated in
countries that can facilitate tax-efficient cash transfer along the company’s equity supply chain
(see discussion in Dyreng et al., 2013). For example, a multinational might set up an equity
holding company in the Netherlands for all of its European operating subsidiaries because Dutch
holding companies enjoy certain advantages in global cash management. In our data, the Dutch
holding company would appear as a single observation in Panel B, while each of the operating
companies in the different European countries would show up as separate observations in Panel
A.
Recognizing the financial conduit specialization in certain countries, we now turn to the
more relevant question for this inquiry, namely, do coefficients vary depending on whether the
subsidiary is an operating company or a holding company? To test this question, we compute
the Pearson correlation coefficient for the columns of coefficients in Panel A and Panel B. Using
all firm-years, the correlation coefficient is -0.01, implying that the immediate ETR impact of an
operating subsidiary in a country is unrelated to the immediate impact of a financial conduit in
the same country.
When we restrict the correlation test to multinationals headquartered in specific countries,
we find conflicting results. For American multinationals, the Pearson correlation coefficient is
negative (-0.21), suggesting that operating and financial subsidiaries immediately affect ETRs in
opposite directions. For example, establishing an operating company in Luxembourg for an
American multinational results in an immediate 0.7 percentage point ETR boost, on average;
whereas, a financial intermediary in Luxembourg immediately drives down ETRs by 2.1
percentage points. We also find negative correlations for France (-0.18) and Germany (-0.75).
18
However, the sign is positive for Japan (0.27) and the UK (0.59), suggesting that operating and
financial subsidiaries affect ETR similarly in the first year in those countries. We infer from
these results that in at least some countries the immediate tax effects of locating a subsidiary in a
country vary substantially depending on whether the subsidiary is an operating company or a
financial conduit. The takeaway is that focusing simply on where a multinational has its
subsidiaries may be insufficient to understand the immediate ETR impact of a country; rather, it
may be necessary to know the type of subsidiary that is being deployed.
Next, we estimate the following regression to identify individual countries where
subsidiary type matters:
where HOLD is one if the firm has an equity holding subsidiary. Significant HOLD coefficients
will indicate that the immediate ETR impact for a subsidiary varies whether the subsidiary is a
financial conduit or a terminal holding company. In untabulated results, we find that the HOLD
coefficient is significantly greater than zero for three countries (Brazil, Spain, and the United
States) and significantly less than zero for five countries (Australia, Cayman Islands, Finland,
Luxembourg, and Poland). Note that two of the countries with negative HOLD coefficients, the
Cayman Islands and Luxembourg, are tax havens, suggesting that these countries are effective
locations for establishing financial conduits that can lead to immediate effective tax rate
reductions.
The final set of tests introduces an interaction between types of subsidiaries that enables
us to examine each of the subsidiary components by estimating the following equation:
19
OPERATE is one if the firm has a terminal subsidiary, and its coefficients capture the main effect
for operating companies, i.e., the impact in the first year of establishing a holding company in the
country. The HOLD coefficients capture the main effect for financial conduits, i.e., the impact in
the first year of establishing a holding company in the country. The interaction’s coefficients
capture the joint effect on ETRs in the first year of having both the operating and the holding
company.15
Although Table 8 only reports interactions if there are at least 500 firm-years, there
remain far too many to detail here. For brevity, we leave them for the reader to peruse. We
close by noting that the most negative HOLD coefficients are for tax havens: Other Tax Havens
(-5.5), the Netherlands (-3.1), and Luxembourg (-2.5).16
This is consistent with tax havens being
a highly desirable location for equity holding companies. Of course, using this same logic, we
might have expected Ireland and Switzerland to have had negative HOLD coefficients, but
neither does. The U.S. has a positive coefficient (2.8), consistent with its reputation as a lousy
base for global expansion because of its worldwide tax system. Nonetheless, many companies
have American holding companies. As with much of the documentation in this paper, the
findings raise as many questions as they answer. We look forward to future work, both
theoretical and empirical, that furthers our understanding of how multinationals undertake
efficient international tax planning.
15
Note that the interaction is one even if the conduit does not hold stock in that particular operating company. For
example, suppose a firm has a holding company in the Netherlands and an operating company in China. The
interaction of China and the Netherlands is one even if the Dutch holding company does not own the stock of the
Chinese operations. 16
These coefficients can be interpreted as: ETRs average 5.5 (3.1) [2.5] percentage points less for companies that
have an equity holding company located in one of the small tax havens not specifically identified (Netherlands)
[Luxembourg].
20
4. Closing Remarks
This paper extends our understanding of the impact of country location on effective tax
rates. It updates prior work with more recent financial statement information, provides the first
estimates of the immediate ETR impact of entering a new country, and explores differences in
the tax impact of financial and operating subsidiaries. The empirical documentation should
benefit policymakers, practitioners, and researchers who wrestle with the complex issues
surrounding international tax policy.
Our principal findings include:
Despite enormous investments in tax planning designed to flatten the differences in taxes
across countries, the tax domicile of a company appears to be a major determinant of a
firm’s worldwide effective tax rate. Major differences persist in the ETRs of
multinationals simply because their parents reside in different countries. For example,
establishing headquarters in Japan, rather than Singapore, results in a 17 percentage point
increase in a firm’s ETR. Yet, Japanese companies continue to compete favorably
against Singaporean and other companies located in much more tax-favorable domiciles.
The same is true for American multinationals (whose ETRs are second only to Japan’s).
This persistence of widely divergent ETRs deserves further investigation.
Effective tax rates were stable from 2006-2011. This stands in contrast to studies of
earlier periods that had documented a steady worldwide decline in ETRs.
Compared with the rest of the world, the U.S. taxes financial firms more heavily and the
information sector more lightly.
When a multinational enters a tax haven for the first time, its ETR usually declines
slightly.
21
The tax impact of entering a new country through a subsidiary differs depending on
whether the subsidiary is an equity holding company or an operating company.
We close by repeating two caveats. This paper relies on the tax information in the
financial statements, not actual tax return data. To the extent the accounting data poorly capture
a firm’s actual tax activities, we measure with error. The same criticisms can be made about our
reliance on accounting disclosures for determining the tax domicile of the firm and its portfolio
of subsidiaries. If the financial statements are a poor lens through which to observe these aspects
of the company, our inferences could be misleading. On the positive side, the extensive
aggregation in this paper should mitigate any firm-level measurement error. Nonetheless,
readers should interpret these findings with caution.
Second, as discussed above, our statistical tests of the effect of headquarters on ETRs are
potentially flawed because of identification problems that plague cross-country comparisons.
Although some companies have changed the headquarters country and in fact inversions and
similar locations are a partial motivation of this paper, too few have done so to provide us with
enough power to conduct tests that would better specify causal links. Thus, once again, readers
should be cautious. These problems should not affect our analyses of foreign subsidiaries
because companies often change the location of their foreign subsidiaries and in fact the
movement into new countries is the source of variation that we exploit in our tests of foreign
subsidiaries.
22
References
Blouin, Jennifer, 2012. Taxation of Multinational Corporations, Foundations and Trends in
Markle, Kevin S. and Douglas A. Shackelford, 2012. “Cross-Country Comparisons of Corporate
Income Taxes,” National Tax Journal 65 (3), 493-528.
Nakabayashi, Mieko and James Carter, 2013. “America Goes It Alone on High Corporate
Taxes,” The Wall Street Journal, July 18.
Samuels, John M., 2009. “American Tax Isolationism,” Tax Notes (June 29): 1593-1599.
Summers, Lawrence, 2013. “Help American businesses—tax their profits abroad,” Financial
Times, July 7.
Toder, Eric, 2012. “International Competitiveness Who Competes against Whom and for What?”
Tax Policy Center, Urban Institute and Brookings Institution, Washington, D.C.
United States Government Accountability Office, 2013. Corporate Income Tax: Effective Tax
Rates Can Differ Significantly from the Statutory Rate. May.
Voget, Johannes, 2011. “Relocation of Headquarters and International Taxation,” Journal of
Public Economics 95, 1067-1081.
24
Table 1
Notes: This table presents the means of the variables by country/group. All figures are in millions of U.S. dollars. ETR = total tax expense/pretax income. Statutory rate is the weighted average
maximum corporate rate for the group, weighted by number of observations.
C ountry/G roup N R ev enue As s ets E quity
P retax
Income E T R
S tatutory
rate
F ULL S AMP LE 42,738 3,701 12,222 1,994 371 25% 36%
AUS TR AL IA 1,562 2,123 10,765 1,422 324 22% 30%
C ANAD A 617 3,216 17,766 3,069 599 23% 32%
C HINA 2,523 1,114 7,072 743 150 21% 27%
F R ANC E 1,072 6,873 10,179 3,461 662 28% 33%
G E R MANY 1,210 6,564 30,978 2,857 458 26% 33%
IND IA 592 1,162 3,874 745 177 22% 34%
J AP AN 3,704 6,516 18,830 3,020 361 38% 41%
S ING AP O R E 519 992 6,837 1,055 173 17% 18%
S O UTH AF R IC A 484 2,255 6,930 1,194 317 28% 35%
S O UTH K O R E A 1,215 4,702 8,389 1,757 320 24% 25%
S WE D E N 1,073 1,787 10,450 1,162 202 21% 27%
S WITZ E R LAND 677 5,200 30,658 3,379 551 19% 21%
TAIWAN 1,486 1,577 4,212 804 116 19% 22%
UNITE D K ING D O M 4,309 3,087 13,891 1,626 352 20% 29%
UNITE D S TATE S 13,234 4,486 10,948 2,338 459 28% 39%
AF R IC A 92 6,617 4,533 717 3,925 25% 30%
AS IA 427 795 5,355 784 152 24% 31%
E UR O P E 4,346 3,671 17,739 2,292 395 24% 27%
LATIN AME R IC A 585 2,334 5,320 1,444 368 24% 29%
MID D LE E AS T 753 815 5,567 895 138 14% 27%
TAX HAVE NS 2,258 1,447 4,040 1,150 196 16% 10%
25
Table 2
Notes: This table reports the results of estimating Equation (1) on the full sample. Asset rank (Sales rank) [Equity rank] is the percentile rank of the amount of total assets (operating revenue) [shareholders’ equity] reported by the multinational in the year. The excluded industry is NAICS
industry is 72 (Accommodation and Food Service). The excluded year is 2008. These were selected to be excluded because they had the median
mean ETR by respective grouping.
N E s timate
AdjR 2 0.80
N 42,738
AUS T R AL IA 1,562 17.8
C ANAD A 617 17.5
C HINA 2,523 16.3
F R ANC E 1,072 21.7
G E R MANY 1,210 20.6
IND IA 592 17.1
J AP AN 3,704 30.4
S ING AP O R E 519 13.0
S O UT H AF R IC A 484 20.6
S O UT H K O R E A 1,215 18.2
S W E D E N 1,073 16.6
S W IT Z E R L AND 677 13.1
T AIWAN 1,486 14.6
UNIT E D K ING D O M 4,309 16.2
UNIT E D S T AT E S 13,234 21.9
AF R IC A 92 19.3
AS IA 427 18.5
E UR O P E 4,346 17.9
L AT IN AME R IC A 585 17.1
MID D L E E AS T 753 9.4
T AX HAVE NS 2,258 11.1
As s et rank (0.1)
E quity rank 0.0
S ales rank 0.2
NAIC S 11 (1.7)
NAIC S 21 (3.1)
NAIC S 22 1.3
NAIC S 23 0.7
NAIC S 31 0.2
NAIC S 32 (3.4)
NAIC S 33 (2.7)
NAIC S 42 0.6
NAIC S 44 0.9
NAIC S 45 0.7
NAIC S 48 (2.9)
NAIC S 49 1.3
NAIC S 51 (1.8)
NAIC S 52 1.8
NAIC S 53 0.5
NAIC S 54 0.6
NAIC S 56 1.1
NAIC S 61 5.0
NAIC S 62 2.5
NAIC S 71 (1.7)
NAIC S 81 6.7
NAIC S 99 (2.1)
2006 0.5
2007 0.3
2009 (0.3)
2010 (0.8)
2011 (0.6)
26
Table 3
C
AN
AD
A
CH
INA
FRA
NC
E
GER
MA
NY
IND
IA
JAP
AN
SIN
GA
PO
RE
SOU
TH A
FRIC
A
SOU
TH K
OR
EA
SWED
EN
SWIT
ZER
LAN
D
TAIW
AN
UN
ITED
KIN
GD
OM
UN
ITED
STA
TES
AFR
ICA
ASI
A
EUR
OP
E
LATI
N A
MER
ICA
MID
DLE
EA
ST
TAX
HA
VEN
S
AUSTRALIA
* * *
* * *
* * * *
* *
CANADA
* *
* * *
* *
*
* *
CHINA
* *
* * * *
* *
* *
*
* *
FRANCE
* * *
* * * * *
* * * * *
GERMANY
* * *
* * * * * *
* * * *
INDIA
* * *
* *
*
* *
JAPAN
* * * * * * * * * * * * * *
SINGAPORE
* * *
* * * * * * * *
SOUTH AFRICA
* * * * *
* * * *
SOUTH KOREA
* * * *
* *
SWEDEN
* *
*
* *
SWITZERLAND
* * * * * * * * *
TAIWAN
* * * * * * * *
UNITED KINGDOM
* *
*
* *
UNITED STATES
* * * * * *
AFRICA
* *
ASIA
* *
EUROPE
* *
LATIN AMERICA
* *
MIDDLE EAST
Notes: This table presents the results of F-tests comparing the estimates of the s generated by estimating Equation (1) on the full sample.
* in a cell indicates that the row and the column are statistically different at the 5% significance level.
27
Table 4
Notes: This table presents the results of estimating Equation (1) on separate samples for each year. Each cell reports the estimate of for each country/group.
AdjR 2 0.82 0.82 0.79 0.78 0.80 0.80
N 7,268 7,419 6,880 7,044 7,190 6,937
AUS TR AL IA 19 21 19 21 21 17
C ANAD A 20 20 19 21 20 17
C HINA 20 21 18 20 18 15
F R ANC E 23 25 23 26 25 22
G E R MANY 23 25 21 23 23 20
IND IA 17 20 18 22 20 19
J AP AN 33 36 31 33 32 31
S ING AP O R E 14 17 16 16 15 12
S O UTH AF R IC A 21 23 21 25 25 21
S O UTH K O R E A 19 23 21 21 20 18
S WE D E N 18 19 18 19 20 17
S WITZ E R LAND 15 17 15 15 17 14
TAIWAN 14 17 18 20 17 15
UNITE D K ING D O M 17 19 18 20 19 14
UNITE D S TATE S 24 26 23 26 25 21
AF R IC A 22 18 18 26 25 22
AS IA 18 22 22 23 22 18
E UR O P E 20 21 20 22 21 17
LATIN AME R IC A 17 19 19 24 21 18
MID D LE E AS T 11 10 10 15 15 11
TAX HAVE NS 11 13 13 16 14 13
20112006 2007 2008 2009 2010
28
Table 5
Notes: This table reports the results of estimating Equation (2) on the full sample. The first column reports the for each country. The top row reports the for each industry. Each cell reports the
estimate of for the given country in the given industry. All firm-years were included in the regression. Estimates are reported for country-industries with 20 or more observations.
Notes: This table reports the results of estimating Equation (3) on the sample of multinationals described in the column heading. Each cell reports the for each country.
All Aus tralia F ranc e G ermany J apan S ing a pore
J AP AN (0.9) (0.9) (0.8) 1.2 1.6 1.5 (0.8) 0.0 1.7 (0.2) 0.7 (3.4)
LUXE MB O UR G (0.7) 2.1 (1.0) (3.3) 0.3 3.2
MALAYS IA (1.5) (1.7) (3.2) 0.5 4.2 0.1 (1.5)
ME XIC O (2.3) 2.3 2.5 (0.0) 0.3 (0.4) 2.6 2.6 0.4 1.3 (0.5) 1.9 (2.6)
NE THE R LAND S (0.1) (3.6) 1.4 1.0 (1.7) 2.0 0.6 0.5 (0.5) 0.0 (0.7) (3.3) (1.3) 2.9 0.5 0.2 (1.7)
NE W ZE ALAND 0.1 3.2 (1.2) (4.8) 3.0
NO R WAY 1.5 (0.5) (2.7) 2.1 (1.1) 0.1
P E R U 6.2 (4.8)
P HIL IP P INE S (3.7) (4.1) 1.2 7.3 (2.6)
P O LAND (1.0) 1.0 (0.1) (0.2) (0.8) (1.3) 3.8 1.8 0.5 0.6 (0.4) (0.9)
P O R TUGAL 5.3 (0.2) 2.4 (1.2) 2.0 (1.0) (4.6)
R O MANIA (2.0) (0.3) 7.1 (0.9) 1.3 (0.9)
R US S IAN F E D E R ATIO N 1.5 (2.9) (0.4) (0.3) (0.5) (1.4) (0.1)
S INGAP O R E 1.6 (0.2) 0.7 (2.3) 0.6 (1.8) 0.2 2.7 0.8 1.7 (0.7) (2.5) (1.2) 0.4
S LO VAK IA (5.7) 2.0 2.0 (1.2) 4.5
S O UTH AF R IC A 2.5 2.0 0.1 (5.8) 0.3 (1.5) 1.6
S O UTH K O R E A 1.7 0.5 1.1 3.9 (1.7) (0.5)
S P AIN (2.0) 0.3 (0.4) (1.9) 1.3 0.8 (2.5) (2.6) 3.6 1.9 (1.7) (0.4) (0.1) 0.5 0.7 (1.8)
S WE D E N 0.5 1.5 1.7 0.8 (3.0) (0.7) (0.1)
S WITZE R LAND 2.2 (4.5) (1.5) (0.4) 1.7 0.7 (2.8)
TAIWAN (1.8) (1.8) (1.4) 5.1 1.9
THAILAND (0.4) 5.0 3.4 0.8 0.1 (2.8) (2.2)
TUR K E Y (3.5) (0.7) 3.2 0.3 2.5 4.3
UNITE D K INGD O M 0.6 0.5 (0.2) (2.8) 0.7 (1.3) 0.4 (2.2) (1.8) (2.0) 1.1 (2.0) (2.7) (2.7) (0.6) (0.7) 4.8
UNITE D S TATE S 0.1 0.7 (2.0) (1.7) 0.6 0.8 (2.2) (4.3) 1.9 1.8 1.1 (3.8) 4.5 (5.6) (0.5) (0.8) 4.0
VE NE ZUE LA (2.0) (3.1) 4.5
O THE R TAX HAVE NS 2.5 2.3 2.9 (1.6) 1.0 (3.6) (1.5) (1.4) 0.0
33
Notes: This table reports the results of estimating Equation (4) on the sample of multinationals domiciled in Canada, France, Germany, Italy, Japan, The UK, and The U.S. The first column reports the
for each country. The top row reports the for each country. Each cell reports the estimate of for the column-row pair of countries. All firm-years were included in the regression. Estimates are
reported for country pairs with 500 or more observations.