THE IMPACT OF HIGHER EDUCATIONINSTITUTION–FIRM KNOWLEDGE LINKS ONESTABLISHMENT-LEVEL PRODUCTIVITY IN
BRITISH REGIONS*manc_2276 1..20
byRICHARD HARRISUniversity of Glasgow
QIAN CHER LIImperial College London
andJOHN MOFFAT†
University of Swansea
In this paper we estimate whether sourcing knowledge from and/orcooperating on innovation with higher education institutions impactson establishment-level total factor productivity and whether this impactdiffers across domestically owned and foreign-owned establishmentsand across the regions of Great Britain. Using propensity score match-ing, the results show overall a positive and statistically significantimpact although there are differences in the strength of this impactacross production and non-production industries, across domesticallyowned and foreign-owned firms, and across regions. These results high-light the importance of absorptive capacity in determining the extent towhich establishments can benefit from linkages with higher educationinstitutions.
1 Introduction
According to the 2001 UK Government White Paper on enterprise, skills andinnovation, universities are ‘the seedbed for new industries, products andservices and are at the hub of business networks and industrial clusters of theknowledge economy’ (DTI, 2001). In line with the Lambert (2003) review ofbusiness–university collaboration, the 2003 White Paper (leading to the 2004Education Act) was more specific, stating:
* Manuscript received 16.9.10; final version received 18.3.11.† This work contains statistical data from the Office for National Statistics (ONS) which is
Crown copyright and reproduced with the permission of the controller of Her Majesty’sStationery Office and Queen’s Printer for Scotland. The use of the ONS statistical data inthis work does not imply the endorsement of the ONS in relation to the interpretation oranalysis of the statistical data. This work uses research data sets which may not exactlyreproduce National Statistics aggregates. Funding from Economic and Social ResearchCouncil, the Scottish Funding Council (SFC), the Department for Education and Learning(DEL) in Northern Ireland, the Higher Education Funding Council for England (HEFCE)and the Higher Education Funding Council for Wales (HEFCW) (Grant No. RES-171-25-0032) is gratefully acknowledged.
The Manchester School Vol •• No. •• ••–•• •• 2012doi: 10.1111/j.1467-9957.2011.02276.x
. . . knowledge and skill transfer between business and higher education is ofgreat importance in England’s regional economies. Universities have a role infostering the establishment and growth of new companies; in working withexisting companies both on the application of the latest technology and on thesuccessful application of more tried and tested technologies; and in working withbusiness to develop the skills of the workforce at technical and professionallevels. At their best, these links should be highly interactive, with each partnerwell aware of what the other can offer, and of what their needs are. (BERR, 2003,par. 3.1)
To help achieve this outcome, universities in the UK have in recent years beenable to access £651 million of funding from the Higher Education InnovationFund (HEIF) to promote knowledge transfer and innovation.1
This implies that the UK government (like many other global govern-ments2) regards the generation of knowledge spillovers between universitiesand firms as one of the main purposes of universities. Although some ques-tion whether universities should become too geared towards this type ofactivity (see, for example, Bowie, 1994) on the grounds that the costs tosociety of compromising the university’s role as an independent third partyand free disseminator of information outweigh the benefits from close con-nection between universities and industry, others perceive there is a lack ofsuch connections that must be remedied (Fortier, 1999). Rather than tacklethe issue of the correct direction for university research, this paper questionsthe presupposition implicit in this debate that linkages between universitiesand firms are directly beneficial to industry.
Specifically, this paper estimates whether both sourcing knowledge fromand/or cooperating on innovation with higher education institutions (hence-forth HEIs)3 impact on establishment-level total factor productivity (TFP)using a data set created by merging the UK government’s Community Inno-vation Survey (CIS) with the Annual Respondents Database (ARD). It alsoconsiders whether this impact differs across domestically owned and foreign-owned establishments and across the regions of Britain. We also providesome evidence on whether higher graduate employment (as a measure ofhuman capital) impacts positively on TFP at the establishment level.
1The HEIF was originally operated in three phases between 2001 and 2009; it has recently been(permanently) extended with funding to be increased to £150 million by 2010/11. Othergovernment schemes have also been available to encourage university–businessinnovation—e.g. the LINK scheme (which started in 1986); the University Challenge SeedFund (early 1990s); and Knowledge Transfer Partnerships (originally established as Teach-ing Company Schemes in 1975), of which there were over 1000 in place in 2008.
2For information at the OECD level, see their programme on higher education in city andregional development (http://www.oecd.org/edu/imhe/regionaldevelopment) which coverssupport and outcomes across a large number of countries.
3The actual questions used to define HEI collaboration are Q.16 and Q.18 (see http://www.bis.gov.uk/policies/science/science-innovation-analysis/cis/cis4_questionnaire fordetails).
There are two main channels through which collaborating with HEIsmay have an impact on TFP. The first is indirectly through innovation. Animpact will arise through this channel if collaboration with HEIs leads toprocess innovations which improve efficiency or product innovations wherethe new products are produced with greater efficiency or with better techno-logy. There will also be a direct impact on TFP which will arise if collabo-ration with HEIs gives rise to knowledge spillovers from the HEI to theestablishment.
Whether there is any impact of collaborating with HEIs on TFP willdepend in large part on establishment absorptive capacity levels. Regionaldifferentials in the size of this impact will therefore reflect regional differ-ences in levels of absorptive capacity. The results will therefore be of con-siderable interest to policy makers as they will suggest whether encouraginggreater collaboration between HEIs and establishments will be beneficial orwhether absorptive capacity levels needs to be raised in the region beforeestablishments can benefit from such collaborations (see Charles (2006) fora general discussion of the roles of universities in regional innovationsystems).
The next section provides a brief review of the literature; the thirdsection discusses the data set that will be used in the empirical analysis andgives some basic characteristics of the group of establishments that collabor-ate with HEIs; the fourth section sets out the econometric model to beestimated and describes the estimation strategy; the fifth section provides ourstatistical results; and the final section concludes.
2 Literature Review
Many studies have investigated the relationship between university–firmknowledge links and innovation. One of the earliest papers in this literaturewas by Mansfield (1991) who showed that, in a random sample of 76 largeAmerican firms in seven manufacturing industries, about 10 per cent of theproduct and process innovations could not have been developed withoutrecent academic research. The more recent literature in this area has tended toemploy econometric methods in an attempt to estimate causal relationshipsbetween university–firm knowledge links and innovation.4 For example,Becker (2003), using German data, finds that the use of knowledge resourcesfrom universities and research institutions increases the probability of processinnovations but has no impact on the probability of product innovations,while joint R&D with universities has a positive impact on the probability of
4A different approach has been taken by Abramovsky and Simpson (2011) who looked atwhether firms co-locate near universities and whether those that do are more likely tocooperate with, or source knowledge from them. It does not however look at the produc-tivity outcome of any such cooperation.
University–Firm Knowledge Links and Productivity 3
both product and process innovations. Thorn et al. (2007), using a data set ofChilean and Columbian firms, find that collaboration between firms anduniversities increases the probability of introducing a new product.
In contrast, there have been very few studies that analyse the impact ofuniversity–firm knowledge links on productivity rather than innovation.Belderbos et al. (2004), using the Dutch CIS, estimate the impact of varioustypes of R&D cooperation on the growth of labour productivity, and thegrowth of sales per employee of products that are new to the market. Theirresults show that cooperation with universities had no statistically significantimpact on the former measure but a positive and significant impact on thelatter. One criticism of their model is that no effort is made to control forthe consequences of self-selection into the group of firms that entered intocooperative agreements.
As part of a study seeking to understand the causes of the growth ofinnovative activity in the USA in the 1990s, Branstetter and Ogura (2005)estimate the impact on TFP of the intensity with which firms cite academicscientific research in their patent applications. This can be regarded as ameasure of firm–university knowledge linkages. Using fixed effects estima-tion, they find a positive and statistically significant impact of the scienceresearch citation measure on TFP. Medda et al. (2005), using a selectionmodel, investigate the impact of collaborative research with different partnerson the growth of TFP using a data set of Italian manufacturing firms. Theyfind no statistically significant effect of collaborative research undertakenwith universities but a positive impact of collaborative research with researchcentres and other firms. The authors suggest this is the result of firms col-laborating with universities on basic research, the effects of which will takelonger to show than the data set allows for.
Arvanitis et al. (2008) estimate the impact of university–firm know-ledge and technology transfer on both innovation and labour productivityusing Swiss data. Recognizing the endogeneity of both knowledge andtechnology transfer, they use instrumental variables. Their first equationshows that knowledge and technology transfer between firms and univer-sities has a positive impact on the probability of innovating; the secondshows that knowledge and technology transfer activities has a positivedirect impact on labour productivity. However, also included in the secondequation is an innovation variable. As the coefficient on this variable ispositive and statistically significant, there is also an indirect impact onlabour productivity.
In sum, there is as yet no clear consensus as to the impact of university–firm knowledge links on productivity. This is unsurprising given the relativelyfew studies in this area. It should also be noted that it is difficult to draw apriori expectations for the empirical analysis below, because of the differenteconometric methodologies and measures of university–firm knowledge linksused in these studies.
The data set we use has been created by merging the results from the 2007 CIS(the fifth such survey conducted in the UK and covering the period 2004–6)with the ARD for 2006. The former gives information on the innovativeactivities of some 14,872 UK establishments or reporting units. Crucially forthis paper, it provides information on the sources of information used byestablishments and the types of organization with which they cooperate. TheCIS is collected using a stratified sampling frame that is skewed towardslarger establishments.
The ARD contains financial data on a stratified sample of reportingunits from the Annual Business Inquiry which is undertaken by the Office forNational Statistics each year, with the sampling frame again skewed towardslarger establishments. This includes data on investment, employment andintermediate inputs which facilitates the TFP analysis below. The ARD alsocontains less detailed information on the population of establishments fromthe inter-departmental business register. Among the variables collected in theinter-departmental business register is employment and turnover.
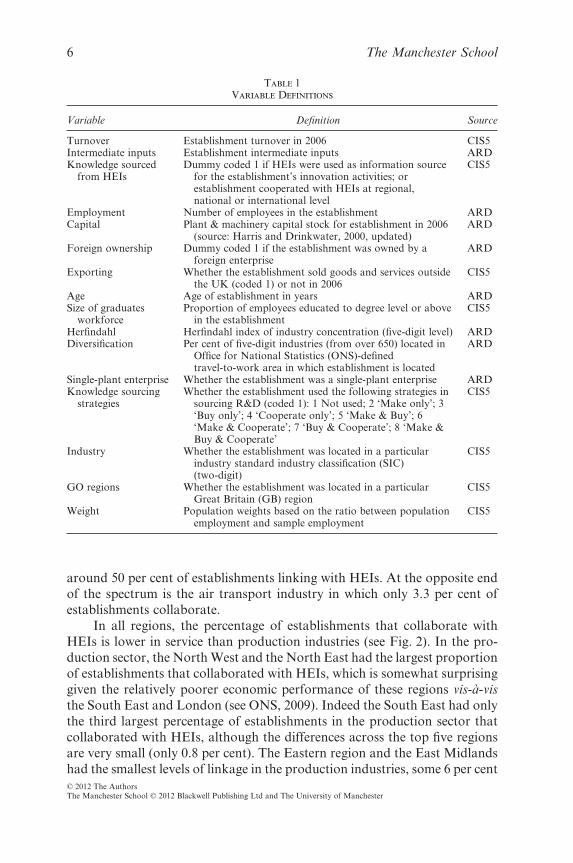
Reporting units are the smallest units of a firm which can provide thefull range of information required for completion of the Annual BusinessInquiry survey (see Robjohns (2006) for more discussion of the ARD). Asthere are reporting unit codes common to both the CIS and the ARD, it ispossible to merge the CIS with the ARD. As a result, all the CIS estab-lishments were successfully linked to the ARD.5 This left a sample size of13,970. Table 1 lists the variables in the data set that will be used in theempirical analysis below.
Due to the stratified nature of the CIS and the ARD, our merged data setis not representative of the population of establishments. As a result, the dataneed to be weighted. This was done using employment weights which can becalculated using the employment data which is available on the population ofestablishments in the ARD.
As an overview of the data set available, Fig. 1 shows the percentage ofestablishments that collaborate with HEIs by industry. Overall, 22.8 per centof British establishments collaborated; however, there is considerable vari-ation across industries. Over 60 per cent of establishments in the coke andpetroleum products, extraction and R&D industries collaborate with HEIson innovation-related activities; with a second tier consisting of the electri-city, gas and hot water, precision instruments and chemicals industries with
5Some industrial sectors are omitted from the ARD—such as agriculture (which is also omittedfrom CIS) and much of financial services. Northern Ireland is also omitted, as the ARDdoes not include this region (Northern Ireland has a separate ARD which is not availableto users in Great Britain). These differences explain almost all the differences between beingable to use the full CIS data set and that which was actually available.
University–Firm Knowledge Links and Productivity 5
around 50 per cent of establishments linking with HEIs. At the opposite endof the spectrum is the air transport industry in which only 3.3 per cent ofestablishments collaborate.
In all regions, the percentage of establishments that collaborate withHEIs is lower in service than production industries (see Fig. 2). In the pro-duction sector, the North West and the North East had the largest proportionof establishments that collaborated with HEIs, which is somewhat surprisinggiven the relatively poorer economic performance of these regions vis-à-visthe South East and London (see ONS, 2009). Indeed the South East had onlythe third largest percentage of establishments in the production sector thatcollaborated with HEIs, although the differences across the top five regionsare very small (only 0.8 per cent). The Eastern region and the East Midlandshad the smallest levels of linkage in the production industries, some 6 per cent
from HEIsDummy coded 1 if HEIs were used as information source
for the establishment’s innovation activities; orestablishment cooperated with HEIs at regional,national or international level
CIS5
Employment Number of employees in the establishment ARDCapital Plant & machinery capital stock for establishment in 2006
(source: Harris and Drinkwater, 2000, updated)ARD
Foreign ownership Dummy coded 1 if the establishment was owned by aforeign enterprise
ARD
Exporting Whether the establishment sold goods and services outsidethe UK (coded 1) or not in 2006
CIS5
Age Age of establishment in years ARDSize of graduates
workforceProportion of employees educated to degree level or above
in the establishmentCIS5
Herfindahl Herfindahl index of industry concentration (five-digit level) ARDDiversification Per cent of five-digit industries (from over 650) located in
Office for National Statistics (ONS)-definedtravel-to-work area in which establishment is located
ARD
Single-plant enterprise Whether the establishment was a single-plant enterprise ARDKnowledge sourcing
strategiesWhether the establishment used the following strategies in
below the North West. Turning to the service sector, Scotland had the highestpercentage of establishments that collaborated with HEIs, at almost 25 percent. In comparison, the South West of England had the lowest level at lessthan 20 per cent.
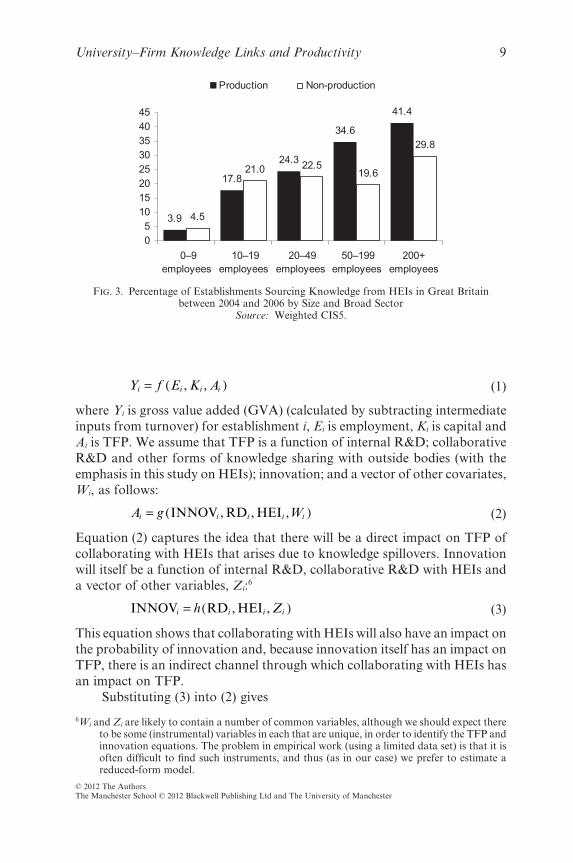
Sourcing information from HEIs and/or cooperating on innovationactivities depends on the size of the establishment (Fig. 3). In the productionsector, there is a very clear trend towards greater collaboration by largerestablishments; in non-production industries, the trend is not as clear withestablishments employing between 50 and 199 employees collaborating lessthan establishments with between 10 and 49 employees. However overall innon-production industries it is apparent that the trend remains for largerestablishments to have a greater propensity to collaborate with HEIs.
4 Econometric Model
Consider the following production function:
20.6
22.5
19.5
22.2
22.5
21.4
21.9
24.9
22.5
23.2
21.9
22.7
22.8
23.8
25.6
26.6
26.7
27.1
27.1
27.4
27.821.7
16 18 20 22 24 26 28 30
EAST
EM
SW
WM
YH
LON
WAL
SCO
SE
NE
NW
Production Non-production
Fig. 2. Percentage of Enterprises Sourcing Knowledge from HEIs in Great Britain between2004 and 2006 by Government Office Region and Broad Sector
Notes: NW, North West; NE, North East; SE, South East; SCO, Scotland; WAL, Wales; LON,London; YH, Yorkshire and Humberside; WM, West Midlands; SW, South West; EM, East
where Yi is gross value added (GVA) (calculated by subtracting intermediateinputs from turnover) for establishment i, Ei is employment, Ki is capital andAi is TFP. We assume that TFP is a function of internal R&D; collaborativeR&D and other forms of knowledge sharing with outside bodies (with theemphasis in this study on HEIs); innovation; and a vector of other covariates,Wi, as follows:
A g Wi i i i i= ( )INNOV RD HEI, , , (2)
Equation (2) captures the idea that there will be a direct impact on TFP ofcollaborating with HEIs that arises due to knowledge spillovers. Innovationwill itself be a function of internal R&D, collaborative R&D with HEIs anda vector of other variables, Zi:6
INNOV RD HEIi i i ih Z= ( ), , (3)
This equation shows that collaborating with HEIs will also have an impact onthe probability of innovation and, because innovation itself has an impact onTFP, there is an indirect channel through which collaborating with HEIs hasan impact on TFP.
Substituting (3) into (2) gives
6Wi and Zi are likely to contain a number of common variables, although we should expect thereto be some (instrumental) variables in each that are unique, in order to identify the TFP andinnovation equations. The problem in empirical work (using a limited data set) is that it isoften difficult to find such instruments, and thus (as in our case) we prefer to estimate areduced-form model.
4.5
21.0 22.519.6
29.8
3.9
17.8
24.3
34.6
41.4
0
5
10
15
20
25
30
35
40
45
0–9
employees
10–19
employees
20–49
employees
50–199
employees
200+
employees
Production Non-production
Fig. 3. Percentage of Establishments Sourcing Knowledge from HEIs in Great Britainbetween 2004 and 2006 by Size and Broad Sector
Source: Weighted CIS5.
University–Firm Knowledge Links and Productivity 9
Our model is therefore a reduced form of the model employed by Arvanitiset al. (2008) which is itself based upon the standard Crepon–Duguet–Mairesse model (Crepon et al., 1998).
The advantage of our approach is that it avoids the need to estimate bothproductivity and innovation equations using a simultaneous model (involv-ing either an instrumental variable or systems approach).
Taking the natural logarithm of each variable and assuming a log-linearfunctional form gives
y e k xi E i K i x i i i= + + + + +α β β β β εHEIHEI (6)
where the lower case is used to denote the natural logarithm of a variables. xi
contains the natural logarithm of Wi and Zi together with variables capturingwhether the establishment was involved in R&D activities. The xi variablesconsist of most of the other variables listed in Table 1.
In order to test whether the impact of collaborating with HEIs differsacross domestically owned and foreign-owned firms, the following model isestimated:
y e k xi E i K i x i i i i= + + + + + ∗ +∗α β β β β β εHEI HEI FOHEI HEI FO (7)
in our empirical analysis below, HEIi is a dummy variable that equals 1 if theestablishment collaborates with HEIs and HEI � FOi is an interaction vari-able between HEIi and the foreign ownership dummy, FOi.
To test for differences in the impact of collaborating with HEIs acrossthe regions of Britain, a second equation is estimated in which the variablesin (7) are interacted with 10 region dummies constructed using the Govern-ment Office Regions variable. The excluded benchmark region is the NorthEast of England. A general-to-specific methodology is adopted so thatregional interactions that are not significant at the 10 per cent level aredropped. To aid in interpretation, it should be noted that in the CIS data setestablishments may collaborate with HEIs in their own region, in otherregions and internationally. The results cannot therefore be regarded asevidence on the relative performance of universities across the regions ofBritain.
Because establishments that collaborate with HEIs are potentially aself-selected group of the population of establishments, they are likely to havedifferent characteristics from establishments that do not collaborate withHEIs. This makes causal inference difficult as these differences in character-istics will likely lead to differences in productivity performance that areunrelated to whether collaborating with HEIs have any impact on TFP (see,
for example, Blundell and Dias, 2009, for a more detailed exposition ofself-selected bias).
Assuming that all relevant characteristics are observed, differences incharacteristics across treated and untreated groups can be controlled forusing a correctly specified regression. However, in practice, finding thecorrect specification is difficult. This is a serious problem as estimating anincorrectly specified equation will generate biased estimates of the treatmenteffect (see, for example, Blundell et al., 2005). This sensitivity to specificationarises because the estimate of the dependent variable for treated firms, in theevent that they did not receive treatment, is entirely dependent on the speci-fication of the model for values of the covariates for which only firms thatreceived treatment are observed.
One solution to this problem is to create a matched sample in whichtreated and untreated establishments are observed for all values of the co-variates. This was done here using propensity score matching (see Dehejiaand Wahba, 2002), which involved estimating probit models of treatmentstatus including all variables that determine both output and whether anestablishment collaborates with HEIs, and then matching on the estimatedpredicted values.7 The advantage of propensity score matching over otherforms of matching is that it overcomes the difficulties of matching on a largenumber of variables (Zhao, 2004).
It is important to note that matching only avoids bias due to differencesin the observable covariates across treated and untreated groups. If there aredifferences in the distribution of unobservable covariates across treated anduntreated groups, estimates obtained using this strategy are biased and aninstrumental variables approach is preferable. Unfortunately, it has not beenpossible to find good instruments using the data set at hand. Instrumentsmust be strong predictors of treatment status because estimates obtainedusing instruments that are only weakly correlated with treatment status tendto be centred on the biased ordinary least squares (OLS) estimates (Boundet al., 1995). In addition, variables must not have predictive power in deter-mining output if they are to be valid instruments. For instance, Arvanitiset al. (2008) use age as an instrument, but in our sample this was found to bea strong predictor of output and hence an invalid instrument. All the vari-ables in the CIS-ARD data set that we tried as potential instruments werefound to be wanting on one of both of these accounts, and thus our prefer-ence for the matching approach. The validity of the estimates are thereforebased on the conditional independence assumption (see, for example, Imbens
7The results from the (weighted) probit model estimated—which fed into the matching approachusing PSMATCH2 in STATA—to create the matched sample for equation (6) are availablein the Appendix (Table A1). Different models were estimated for each specification andsector (the full range of results are available on request).
University–Firm Knowledge Links and Productivity 11
and Wooldridge, 2009, for more details) which states that, having controlledfor the observable covariates, any differences in the distribution of produc-tivity is the result of having sourced knowledge from HEIs.
5 Results
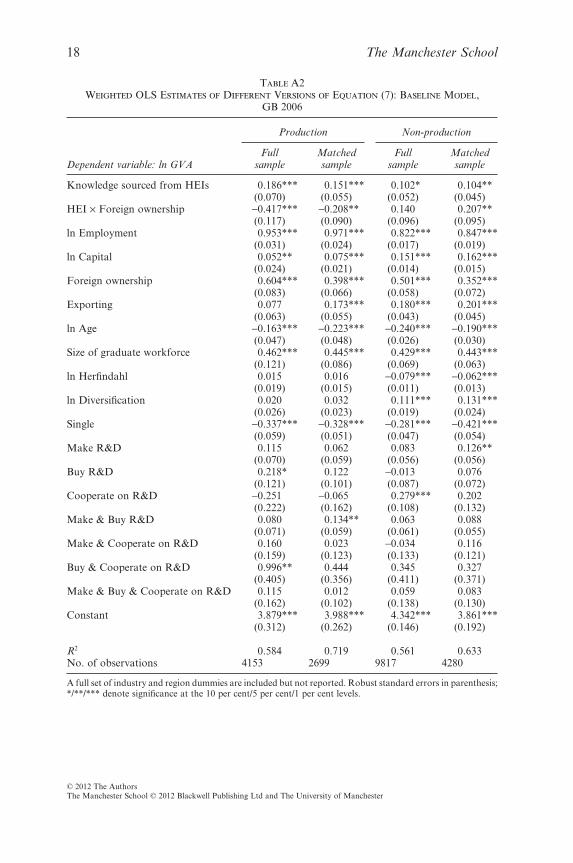
Table 2 gives the results for production industries from estimating equa-tion (7) (i.e. the baseline model—column (1)) and a second model (cf. column(2)) in which all variables are interacted with region dummies (with those withthe highest p values greater than 0.1 removed sequentially8). Note, the estim-ated coefficients for other variables for the baseline model are provided inTable A2 in the Appendix.
Looking at the baseline model first (column (1)), for production indus-tries the coefficient on the HEI variable is positive and statistically significantwhich implies that collaborating with HEIs increased TFP by around 16.3 per
8Note, the second model was tested against the initial model to ensure that the hypothesis isaccepted that all the omitted variables are jointly zero.
Table 2Weighted OLS Estimates of Equation (7) Using a Matched Sample of Establishments
from Production Industries, GB 2006
Dependent variable: ln GVA (1) (2)
HEI Linked 0.151*** 0.151***(0.055) (0.054)
HEI Linked ¥ Scotland — -0.285*(0.150)
HEI Linked ¥ Foreign ownership -0.208** -0.282***(0.090) (0.098)
HEI Linked ¥ Foreign ownership ¥ Yorkshire/Humberside — 0.470***(0.177)
HEI Linked ¥ Foreign ownership ¥ East Midlands — 0.360**(0.176)
HEI Linked ¥ Foreign ownership ¥ Scotland — 0.402**(0.201)
Graduates 0.445*** 0.286***(0.086) (0.095)
Graduates ¥ North West — 0.484*(0.269)
Graduates ¥ South East — 0.599**(0.294)
Graduates ¥ London — 0.618**(0.290)
R2 0.719 0.717No. of observations 2699 2685
Robust standard errors in parenthesis; */**/*** denote significance at the 10 per cent/5 per cent/1 per centlevels.
cent,9 while the coefficient on the interaction variable between collaboratingwith HEIs and foreign ownership is negative and statistically significant. Thislarge difference in the impact of collaborating with HEIs suggests thatforeign-owned firms operating in the UK production sector that collaboratedwith HEIs were on average technology-seeking enterprises and did not (asexpected) exploit any ex ante technological superiority (see Fosfuri andMotta, 1999; Love, 2003; Cantwell et al., 2004; Driffield and Love, 2007).The positive and statistically significant coefficient on the variables measur-ing the proportion of graduates in the establishment labour force providesevidence that, in accordance with expectations, employing more graduatesleads to higher TFP.10
Column (2) of Table 2 gives the results from the regional model. Thecoefficient on the HEI variable does not change, and the only regional inter-action that is significant relates to Scotland. This suggests that indigenousenterprises in Scotland that source knowledge from HEIs actually have lowerTFP (of around 12.5 per cent); while foreign-owned subsidiaries benefit (theirTFP was nearly 31 per cent higher).11 This result is in line with evidence on theScottish innovation system provided by Roper et al. (2006, Fig. 4.3); theyfound that knowledge links between HEIs and indigenous Scottish firms werevery weak, while links with foreign-owned subsidiaries were strong.
The coefficient on the interaction between the HEI and foreign owner-ship variable is more negative in the regional model than in the baselinemodel. This is the result of the large positive coefficients on the interactionbetween HEI linkage and foreign ownership for Yorkshire-Humberside, EastMidlands and Scotland. This shows that the finding that foreign-ownedestablishments in the production sector do not benefit from collaboratingwith HEIs does not apply to all regions. There also appears to be someheterogeneity in the impact of employing graduates on TFP across regions.The coefficients for the North West, the South East and London compositevariables are all positive and statistically significant indicating that employingmore graduates in these regions leads to a much larger increase in TFP thanin other regions (possibly indicating at least in part a headquarters effect,given that a large proportion of foreign-owned firms will have their UKheadquarters in these regions).
Table 3 gives results from estimating the same models for the non-production sector. Column (1) covers the baseline model and shows thatthere is also a positive and statistically significant impact of linking withHEIs; the latter leads to an increase in TFP overall of some 11 per cent.
9The dependent variable is logged, and therefore the coefficient on the treatment variable has tobe transformed using the formula: exp 1β̂( ) − .
10The elasticity is given by β̂ × X (here 0.445 ¥ 0.191), i.e. 0.085. This indicates that doubling theproportion of graduates (e.g. to around 48 per cent for the average of production estab-lishments in the matched sample) would increase TFP by 8.5 per cent.
11That is, exp(0.151 - 0.285 + 0.402) - 1.
University–Firm Knowledge Links and Productivity 13
However, there is a major difference between production and non-productionindustries when foreign ownership is interacted with HEI collaboration; thecoefficient on this composite variable is positive and statistically significant inthe non-production sector (overall foreign-owned firms with an HEI linkwere some 36.5 per cent more productive). This suggests foreign-owned firmsare exploiting their prior technological advantages with the assistance ofknowledge gained from HEIs. As for production industries, employing moregraduates has a positive and significant impact on TFP (the elasticity asso-ciated with the parameter estimate obtained is 0.14, indicating that doublingthe proportion of graduates would increase TFP by 14 per cent).
In terms of different regional impacts, non-production HEI linked enter-prises in the West Midlands, Eastern England, London and Scotland did notbenefit from such interactions (cf. column (2) of Table 3); the overall impactis close to zero (except for the West Midlands where TFP was 23.3 per centlower). For foreign-owned enterprises that collaborated with HEIs, whenregional interactions are taken into account we find that overall there is nostatistical difference in TFP for foreign-owned firms, except in the WestMidlands and Eastern England (where TFP was between 32 and 69 per centhigher).
Table 3Weighted OLS Estimates of Equation (7) Using a Matched Sample of Establishments
from Non-production Industries, GB 2006
Dependent variable: ln GVA (1) (2)
HEI Linked 0.104** 0.263***(0.045) (0.053)
HEI Linked ¥ West Midlands — -0.528***(0.159)
HEI Linked ¥ East — -0.302*(0.157)
HEI Linked ¥ London — -0.299**(0.134)
HEI Linked ¥ Scotland — -0.293**(0.130)
HEI Linked ¥ Foreign ownership 0.207** -0.066(0.095) (0.099)
HEI Linked ¥ Foreign ownership ¥ West Midlands — 0.611**(0.310)
HEI Linked ¥ Foreign ownership ¥ East — 0.628***(0.222)
Graduates 0.443*** 0.466***(0.063) (0.064)
Graduates ¥ West Midlands — 0.386**(0.188)
R2 0.633 0.648
No. of observations 4280 4281
Robust standard errors in parenthesis; */**/*** denote significance at the 10 per cent/5 per cent/1 per centlevels.
Lastly, the impact of graduates in the workforce on TFP barely changesbetween columns (1) and (2); only the interaction involving the West Mid-lands is significant in the non-production sector.
6 Conclusion
This paper has sought to estimate the impact of collaborating with HEIs onTFP using a data set created by merging the CIS with the ARD. Using amatched sample created by propensity score matching, the results show thatcollaborating with HEIs had, on average across all regions, a positive andstatistically significant impact on TFP, although there are differences in thestrength of this effect across production and non-production industries anddomestically owned and foreign-owned firms.
There are also large differences in the estimated impact across regions. Inboth production and non-production industries, domestically owned estab-lishments in Scotland do not benefit from collaboration with HEIs to thesame extent as domestically owned establishments in the rest of Britain. Thisis also true of establishments in Eastern England, the West Midlands andLondon in non-production industries. Foreign-owned establishments in theproduction sector in Yorkshire-Humberside, the East Midlands and Scotlandreceived a larger productivity boost from collaborating with HEIs thanforeign-owned establishments in other regions of Britain. In non-productionindustries, foreign-owned establishments in the West Midlands and EasternEngland received a larger TFP benefit than establishments in the rest ofBritain.
As stated above, the results that relate to Scotland support the assess-ment of the Scottish innovation system provided by Roper et al. (2006). Thelatter point to the lack of absorptive capacity in domestically owned Scottishestablishments as the primary cause of the weak linkages between such estab-lishments and HEIs, and this is also likely to be the major determinant in thevariation in the size of the TFP benefit received from collaborating with HEIsacross other regions. That is, unless these firms can internalize the benefitsfrom accessing outside knowledge (from HEIs), then the potentially largeimpact of HEI–firm linkages will continue to be truncated. This suggests thatgovernment should prioritize improving levels of absorptive capacity beforeseeking to increase links with HEIs in some regions. Otherwise, resources willbe wasted, creating links that give rise to little benefit. Clearly more (possiblycase-study) research is needed that examines the link between absorptivecapacity and university–business linkages, and the extent to which this canexplain the results obtained in this paper.
Despite these differences in the strength of the impact of HEI–firmlinkages across some regions, the overall result is that firms that sourceknowledge from and/or cooperate on innovation with HEIs overall achievesizeable gains through higher TFP; in addition we provide evidence that
University–Firm Knowledge Links and Productivity 15
higher graduate employment boosts TFP even more. This evidence has beenindependently obtained through an econometric assessment of firm-level per-formance, rather than the more indirect evidence available from HEIs them-selves (or through case study work). Thus it might be argued that there is nowan even stronger case for new and/or better policies that foster greater link-ages (and the employment of more graduates), assuming that a case formarket failure can be established. Following the Sainsbury Review of scienceand innovation policies in the UK (Sainsbury, 2007), and the recent extensionof the HEIF to a slightly higher level of spending (and with a commitment tooperating the scheme every year), past and present UK governments andagencies have shown that they recognize the importance of the HEI sector infostering productivity. And the UK university sector appears to be doingtheir part to foster more HEI–firm collaboration; according to recent stat-istics collected using the HE-BCI (Higher Education—Business and Com-munity Interaction) Survey (HEFCE, 2010), expenditure on overall knowl-edge exchange activities increased by around 5.5 per cent in the 2008–9academic year (to £2,966 million), even amid the recent financial crisis. Thisincludes around 5 per cent income growth from collaborative research (from£700 million to £732 million) and 12 per cent growth from contract research(from £835 million to £937 million). Mostly notably, spin-off companiespartly owned by universities generated £548 million revenue in the 2008–9period, and the universities’ income derived from the sale of (shares in)spin-off companies nearly doubled compared with the previous year, up from£66 million to £124 million.
However, given that expenditure on the HEIF is to be kept at £150million per annum, it is questionable whether sufficient government resourcesare being devoted to this policy, especially in light of the large productivitybenefits revealed by the analysis above; although spending excessive amountson this type of policy could create an artificially high level of collaborationin which firms do not benefit to the extent shown in the results above.For instance, in some industries (such as those with low levels ofcollaboration—cf. Fig. 1) the benefits from collaboration with HEIs may belimited due to a mismatch between the nature of their activities and the typeof research undertaken at HEIs. But unless the marginal effect of collabora-tion falls significantly below the average effect, and there is as yet no evidenceto suggest this is the case, there would seem to be good reasons for encour-aging higher levels of collaboration between HEIs and firms.
Dependent variable: HEI linked Production Non-production
ln Employment -0.052 0.004(0.032) (0.016)
ln Capital 0.071*** 0.001(0.023) (0.013)
Foreign ownership 0.302*** 0.005(0.067) (0.048)
Exporting 0.361*** 0.259***(0.058) (0.042)
ln Age -0.082* 0.039(0.046) (0.024)
Graduates 0.748*** 0.574***(0.107) (0.054)
ln Herfindahl -0.029 -0.030***(0.018) (0.011)
ln Diversification 0.016 0.003(0.024) (0.018)
Single -0.056 -0.143***(0.058) (0.041)
Make R&D 0.632*** 0.687***(0.066) (0.050)
Buy R&D 0.727*** 0.891***(0.121) (0.066)
Cooperate on R&D 0.621** 0.667***(0.262) (0.132)
Make & Buy R&D 1.064*** 1.031***(0.074) (0.049)
Make & Cooperate on R&D 0.561*** 1.335***(0.153) (0.127)
Buy & Cooperate on R&D 0.442 0.526**(0.466) (0.222)
Make & Buy & Cooperate on R&D 1.259*** 0.953***(0.138) (0.113)
Constant -0.765*** -1.401***(0.283) (0.145)
Pseudo-R2 0.193 0.159Observations 4153 9817
A full set of industry and region dummies are included but not reported for both specifications. */**/*** denotesignificance at the 10 per cent/5 per cent/1 per cent levels.
University–Firm Knowledge Links and Productivity 17
A full set of industry and region dummies are included but not reported. Robust standard errors in parenthesis;*/**/*** denote significance at the 10 per cent/5 per cent/1 per cent levels.
Abramovsky, L. and Simpson, H. (2011). ‘Geographic Proximity and Firm–University Innovation Linkages: Evidence from Great Britain’, Journal of Eco-nomic Geography, doi: 10.1093/jeg/lbq052.
Arvanitis, S., Sydow, N. and Woerter, M. (2008). ‘Is There Any Impact of University-Industry Knowledge Transfer on Innovation and Productivity? An EmpiricalAnalysis Based on Swiss Firm Data’, Review of Industrial Organization, Vol. 32,No. 2, pp. 77–94.
Becker, W. (2003). ‘Evaluation of the Role of Universities in the Innovation Process’,Economics Discussion Paper Series 241, Universitaet Augsburg Institute for Eco-nomics, Augsburg.
Belderbos, R., Carree, M. and Lokshin, B. (2004). ‘Cooperative R&D and FirmPerformance’, Research Policy, Vol. 33, No. 10, pp. 1477–1492.
BERR (2003). The Future of Higher Education, Norwich, HMSO.Blundell, R. and Dias, M. C. (2009). ‘Alternative Approaches to Evaluation in
Empirical Microeconomics’, Journal of Human Resources, Vol. 44, No. 3, pp.565–640.
Blundell, R., Dearden, L. and Sianesi, B. (2005). ‘Evaluating the Effect of Educationon Earnings: Models, Methods and Results from the National Child Develop-ment Survey’, Journal of the Royal Statistical Society: Series A (Statistics inSociety), Vol. 168, No. 3, pp. 473–512.
Bound, J., Jaeger, D. A. and Baker, R. M. (1995). ‘Problems with InstrumentalVariables Estimation When the Correlation between the Instruments and theEndogeneous Explanatory Variable is Weak’, Journal of the American StatisticalAssociation, Vol. 90, No. 430, pp. 443–450.
Bowie, N. E. (1994). University–Business Partnerships: an Assessment, Lanham, MD;London, Rowman & Littlefield.
Branstetter, L. and Ogura, Y. (2005). ‘Is Academic Science Driving a Surge in Indus-trial Innovation? Evidence from Patent Citations’, National Bureau of EconomicResearch Working Paper Series 11561, National Bureau of Economic Research,Cambridge, MA.
Cantwell, J. A., Dunning, J. H. and Janne, O. E. M. (2004). ‘Towards a Technology-seeking Explanation of U.S. Direct Investment in the United Kingdom’, Journalof International Management, Vol. 10, No. 1, pp. 5–20.
Charles, D. (2006). ‘Universities as Key Knowledge Infrastructures in Regional In-novation Systems’, Innovation: The European Journal of Social Science Research,Vol. 19, No. 1, pp. 117–130.
Crepon, B., Duguet, E. and Mairesse, J. (1998). ‘Research, Innovation and Produc-tivity: an Econometric Analysis at the Firm Level’, Economics of Innovation andNew Technology, Vol. 7, No. 2, pp. 115–158.
Dehejia, R. H. and Wahba, S. (2002). ‘Propensity Score-matching Methods for Non-experimental Causal Studies’, Review of Economics and Statistics, Vol. 84, No. 1,pp. 151–161.
Driffield, N. and Love, J. H. (2007). ‘Linking FDI Motivation and Host EconomyProductivity Effects: Conceptual and Empirical Analysis’, Journal of Interna-tional Business Studies, Vol. 38, No. 3, pp. 460–473.
DTI (2001). Opportunity for All in a World of Change: a White Paper on Enterprise,Skills and Innovation, Norwich, HMSO.
Fortier, P. (1999). Public Investments in University Research: Reaping the Benefits,Ottawa, Industry Canada.
Fosfuri, A. and Motta, M. (1999). ‘Multinationals without Advantages’, ScandinavianJournal of Economics, Vol. 101, No. 4, pp. 617–630.
University–Firm Knowledge Links and Productivity 19
Harris, R. and Drinkwater, S. (2000). ‘UK Plant and Machinery Capital Stocks andPlant Closures’, Oxford Bulletin of Economics and Statistics, Vol. 62, No. 2,pp. 243–265.
HEFCE (2010). ‘Higher Education—Business and Community Interaction Survey2008–09’, Report available at http://www.hefce.ac.uk/pubs/hefce/2010/10_14.
Imbens, G. W. and Wooldridge, J. M. (2009). ‘Recent Developments in the Econo-metrics of Program Evaluation’, Journal of Economic Literature, Vol. 47, No. 1,pp. 5–86.
Lambert, R. (2003). Lambert Review of Business–University Collaboration: FinalReport, Norwich, HMSO.
Love, J. H. (2003). ‘Technology Sourcing Versus Technology Exploitation: an Ana-lysis of US Foreign Direct Investment Flows’, Applied Economics, Vol. 35, No.15, pp. 1667–1678.
Mansfield, E. (1991). ‘Academic Research and Industrial Innovation’, ResearchPolicy, Vol. 20, No. 1, pp. 1–12.
Medda, G., Piga, C. and Siegel, D. S. (2005). ‘University R&D and Firm Productivity:Evidence from Italy’, Journal of Technology Transfer, Vol. 30, Nos 1–2, pp.199–205.
ONS (2009). ‘Regional, Sub-regional and Local Gross Value Added 2009’, StatisticsBulletin, www.ons.gov.uk/ons/rel/regional-accounts/regional-economic-activity-gva/december-2010/regional--sub-regional-and-local-gross-value-added.pdf/.
Robjohns, J. (2006). ‘ARD2: The New Annual Respondents Database’, EconomicTrends, Vol. 630, May, pp. 43–51.
Roper, S., Love, J. H., Cooke, P. and Clifton, N. (2006). ‘The Scottish InnovationSystem: Actors, Roles and Actions’, Report to the Scottish Government, http://www.scotland.gov.uk/Resource/Doc/89713/0021562.pdf.
Sainsbury (2007). ‘The Race to the Top: a Review of Government’s Scienceand Innovation Policies’, http://www.rsc.org/images/sainsbury_review051007_tcm18-103116.pdf.
Thorn, K., Blom, A., Mark, M. and Marotta, D. (2007). ‘Human Capital andUniversity–Industry Linkages’ Role in Fostering Firm Innovation: an EmpiricalStudy of Chile and Colombia’, Policy Research Working Paper Series 4443, TheWorld Bank, Washington DC.
Zhao, Z. (2004). ‘Using Matching to Estimate Treatment Effects: Data Requirements,Matching Metrics, and Monte Carlo Evidence’, Review of Economics and Stat-istics, Vol. 86, No. 1, pp. 91–107.