Page 1
1
The Impact of Housing Vouchers on Crime in U.S. Cities and Suburbs
Corresponding Author:
Michael C. Lens
Assistant Professor
Department of Urban Planning
UCLA Luskin School of Public Affairs
3250 Public Affairs Building
Box 951656
Los Angeles, CA 90095
[email protected]
310-825-1005
Page 2
2
Abstract
This paper tests the common belief that subsidized housing contributes to higher
crime rates. To do this, I use panel data on over 200 U.S. cities and estimate fixed
effects models to control for unobserved differences between cities that may
affect both voucher use and crime. Additionally, I estimate models that focus on
the suburbs, to see if the steady increase in vouchers there has had any effect on
crime.
In cities, I find that vouchers have a weak, negative relationship with violent
crime rates, although these estimates are not particularly robust. In suburban
areas, there is no observed relationship between vouchers and crime, suggesting
that controversies in those communities blaming voucher households for elevated
crime rates are misguided.
Keywords: Crime, Public housing, Vouchers, Low-income housing
Page 3
3
Introduction
Over the past two decades, there has been a shift by federal and local
housing policymakers away from large, centralized public housing developments
via a number of programs, including the Housing Choice Voucher (voucher),
Low-Income Housing Tax Credit (LIHTC), and HOPE VI programs. Two goals
of the voucher program in particular are to increase access to less distressed
neighborhoods and to break-up clusters of poverty and the co-occurring social
problems that accompany concentrated poverty, including crime.
However, attempts to disperse voucher households to neighborhoods and
localities with higher opportunity are often met with resistance, explicitly on the
grounds that incoming voucher households will bring with them increased crime.
In exurban Los Angeles, the cities of Lancaster and Palmdale have been sued by
civil rights groups for engaging in harassment and surveillance of Latino and
black voucher recipients (Medina 2011). The mayor of Lancaster defends these
efforts as vital for crime control due to the growing voucher population in his city.
In Memphis, journalist Hanna Rosin presented correlational evidence that
diffusing subsidized housing via HOPE VI and vouchers in Memphis not only
changed the spatial location of crime, but led to crime increases citywide –
perhaps due to the police’s reduced inability to target crime hotspots, the
difficulty of providing social services to a dispersed impoverished population, and
Page 4
4
disrupted social networks. She suggests that this is a growing concern among
police chiefs and criminologists nationwide.
This paper attempts to identify whether crime rates in cities and suburbs
are related to subsidized housing policies, focusing primarily on the Housing
Choice Voucher Program. Using city and county-level crime data from the FBI’s
Uniform Crime Reports and voucher, HOPE VI, and public housing data from the
U.S. Department of Housing and Urban Development (HUD), I estimate the
extent to which the prevalence of voucher households affects crime in U.S. cities.
My data set contains covers 215 cities from 1997 to 2008, allowing me to
estimate fixed effects models that control for unobservable differences between
cities. Additionally, I use lagged specifications to further identify causal linkages
between vouchers and crime, and estimate models on a sample of suburban areas
to identify whether the growth in voucher populations in the suburbs has affected
crime rates in those jurisdictions.
My findings suggest that there is virtually no relationship between voucher
household prevalence and crime rates at the city level. Although cities and
suburban areas with more vouchers per capita also have higher crime rates, this
relationship disappears when controls are added. These findings suggest that
controversies surrounding vouchers in city and suburban jurisdictions are being
fueled by misinformation. Although communities with a higher prevalence of
Page 5
5
voucher households appear to be higher in crime, there is no evidence that this is
due to voucher households increasing crime.
Recent Trends in Crime and Rental Housing Subsidies
U.S. cities have seen a wealth of change in the past 25 years in crime and
rental housing subsidies. In the mid-1990s, as crime rates were leveling off and
dropping across the country, U.S. cities also underwent a substantial shift in how
they invest in subsidized housing. These shifts were led by HUD and feature a
number of programs to encourage the spatial diffusion of households receiving
housing subsidies, including HOPE VI, the LIHTC, and vouchers. On the supply
side, HOPE VI has been responsible for demolishing and revitalizing tens of
thousands of public housing units, and the LIHTC is now the primary funding
vehicle through which affordable rental housing is constructed in the United
States. On the demand side, the voucher program is the largest rental housing
subsidy in the country, supporting over two million households nationwide.
Whereas public housing was virtually the only housing subsidy through the early
1970s, by 2004 the LIHTC and voucher programs had a role in nearly 60 percent
of the nearly 7 million subsidized units for low-income households (Schwartz
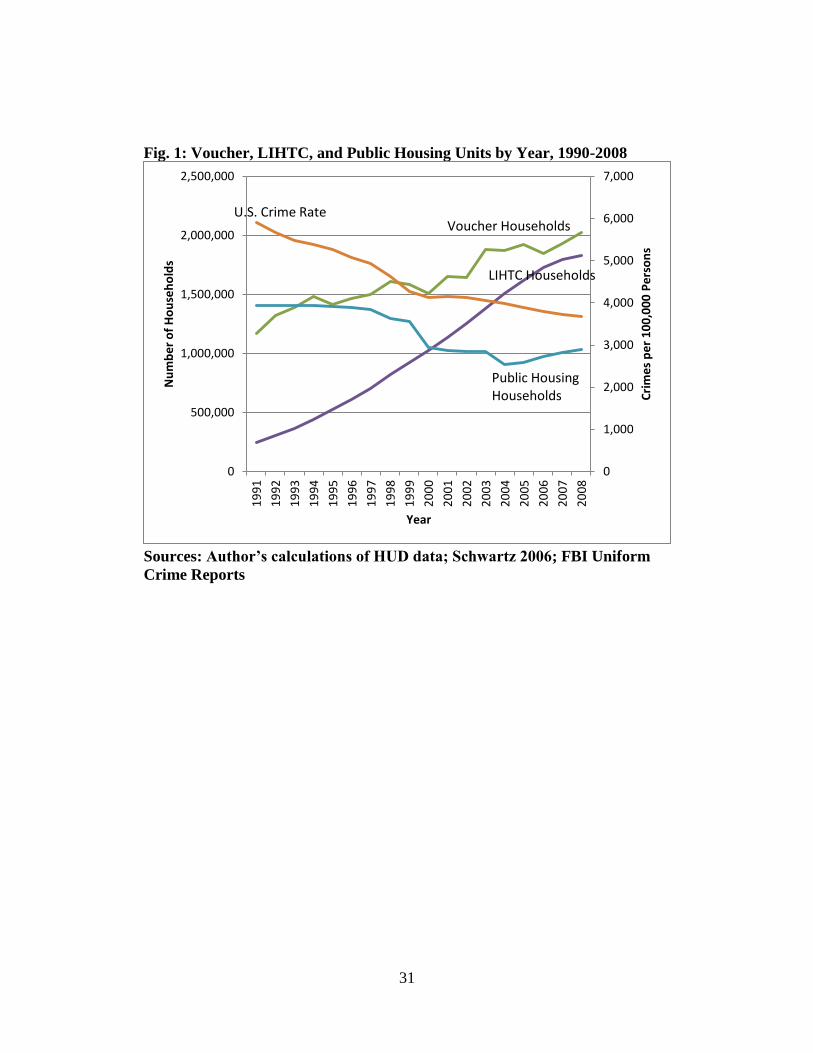
2006). Fig. 1 displays the substantial growth in the voucher and LIHTC programs
and the slow but steady decline in the number of public housing units nationwide
Page 6
6
during the data period (1997 to 2008), alongside the trend in crime, which has
continued to decline since 1997.
[Insert fig. 1 about here]
These concurrent trends in crime and housing subsidy policies suggest that
we should be skeptical when people blame voucher households for elevated crime
rates in their communities. On the contrary, as vouchers have eclipsed public
housing units as the primary way to provide housing subsidies, crime has
decreased. Researchers and policymakers have examined several reasons for the
crime decline, focusing most commonly on economic and demographic factors, in
addition to policing and incarceration (Barker 2010). It is likely that many of
these factors heavily outweigh the role of vouchers and other housing policies in
the crime decline. However, these strong trends contradict the conventional
wisdom represented by Rosin (2008), who suggests if not for the deconcentration
of subsidized housing through the voucher program, crime would have decreased
even more. Furthermore, given the increased presence of voucher households in
suburban communities, it is time we examine how such mobility patterns are
affecting crime in those areas.
Theory and Empirical Evidence
There are a number of reasons why subsidized housing may affect crime
in cities. First, the poor are disproportionately victims and perpetrators of crime,
Page 7
7
and occupy subsidized housing by definition. Subsidized households are also
disproportionately members of minority groups, as are victims and perpetrators of
crime. However, those receiving housing subsidies are also more likely to be
females and their children, and the elderly are also overrepresented. These are
populations that are less likely to be involved in crime, rendering population-
based assumptions less conclusive. Crime may also be linked to subsidized
housing if the presence of this housing leads to urban decline. Additionally, the
physical design and environment of high-rise public housing has been shown to
contribute to crime (National Commission on Severely Distressed Housing 1992;
Popkin et al 2000, Schneider and Kitchen 2002).
On the other hand, it is important to note that housing subsidies are a form
of public investment. Vouchers provide additional purchasing power for
households, not just on housing but potentially on all other goods. Ellen and Horn
(2012) estimate that the median voucher household with children earns $13,000
annually, pays $1,000 per month in rent, and the post-tax benefit of the voucher is
equivalent to $8,000 per year – a 60 percent increase in income. At the household
level, these subsidies may make it less necessary to engage in criminal activity for
financial benefit. For cities and neighborhoods, housing vouchers are a substantial
investment that can have important positive impacts on a number of social
outcomes, potentially including reduced crime.
Page 8
8
It is important to discuss what drives the growth in the number of voucher
households because this is the intervention and change that I am testing in this
paper. First, voucher numbers may increase due to HOPE VI and other public
housing demolitions, given many jurisdictions replace some of these demolished
units with vouchers to displaced households. However, according to HUD’s data,
a city’s voucher population has a strong, positive relationship with the number of
public housing households in a city (controlling for population), so it does not
appear to be the case that vouchers are merely replacing public housing units. On
the other hand, voucher growth does appear to be strongly related to HOPE VI
spending – those cities that have been receiving larger funds from HUD to
demolish public housing also have higher voucher numbers (again, controlling for
population).
Second, since the late 1990s, all vouchers are portable, meaning voucher
holders are largely free to move across jurisdictions and use their vouchers in
cities and suburbs other than those that issued the voucher. Thus, the voucher
population (in either cities or suburbs) can grow because people used their
vouchers to move across jurisdictional borders. Examining data on vouchers in
suburban and city jurisdictions, I find that the voucher population has grown
considerably faster in the suburbs. In the empirical analysis, I test whether
suburban voucher population growth affects crime in those areas.
Page 9
9
It is also possible that voucher numbers grow through increases in the
utilization rate. There are a number of ways in which utilization can increase –
perhaps due to better targeting of the subsidies to populations that are more likely
to use them, the implementation of Source of Income (SOI) laws that prohibit
discrimination by landlords against using vouchers to pay for housing, a better job
by local housing authorities of connecting voucher holders to housing, or more
accessible rental markets. Voucher use can also increase and be captured in the
data if local housing authorities project greater need (due to higher poverty rates
or population growth) and are successful in obtaining additional funds from HUD.
Empirically, SOI laws are strongly correlated with voucher growth (Freeman
2012), and the strongest growth occurred in larger cities on the coast, suggesting
that more liberal and active housing authorities have been more proactive in
recent years in bringing in additional voucher funding and/or connecting voucher
households to housing opportunities. It is unlikely, however, that housing
authorities are able to issue substantial vouchers in a timely fashion as economic
conditions decline in a city. Thus, a limitation of this study is that changes in the
voucher population may occur at different time lags relative to important
dynamics (e.g. poverty, unemployment, rents) that may affect crime.
Empirical Evidence
Page 10
10
Much of what we know empirically about the relationship between crime
and subsidized housing focuses on traditional public housing. There is mixed
evidence on the effect that public housing has on neighborhood crime rates
(Farley 1982; McNulty and Holloway 2000; Roncek et al 1981). More conclusive
are the handful of case studies of public housing developments that paint a picture
of particularly dangerous places to live (Kotlowitz 1991; Popkin et al 2000).
Looking at scattered-site public housing, Goetz et al (1996) found in Minneapolis
that police calls from areas surrounding scattered-site developments decrease after
these developments were built. However, there was evidence that as the
developments age, crime increases over time. Galster et al (2003) found no
impacts from dispersed public housing or supportive housing on crime rates in
Denver.
Looking at vouchers, Suresh and Vito (2009) examine the spatial
concentration of homicides before and after efforts in Louisville, KY to
deconcentrate public housing, primarily through HOPE VI and vouchers. They
find that homicides moved to the parts of the city where public housing and
voucher tenants moved, although their analyses are purely cross-sectional and
descriptive.
Van Zandt and Mhatre (2009) look at the relationship between clusters of
housing voucher households and crime in Dallas, TX. They consider a cluster to
be 10 or more voucher households during any month between October 2003 and
Page 11
11
July 2006, and examine crime data within a quarter mile radius of the apartment
complexes containing these voucher clusters. Unfortunately, the police only
collected crime data in those areas if the number of voucher households was 10 or
more, due to a consent decree resulting from a desegregation case. This not only
led to gaps in coverage and limited the number and type of neighborhoods
examined, but the police may have deliberately focused crime control efforts on
these areas, reducing the reliability of the data. Given those limitations, the
authors find that clusters of voucher households are associated with higher rates
of crime. However, they find no relationship between changes in crime and
changes in the number of voucher households, suggesting that while voucher
households tend to live in high-crime areas, they are not necessarily the cause of
higher crime rates. Thus, efforts to estimate the effect of vouchers on crime must
account for the fact that voucher households disproportionately live in high crime
neighborhoods and cities.
Ellen et al (2012) and Popkin et al (2012) also examine the relationship
between vouchers and crime in neighborhoods. Ellen et al use longitudinal crime
and voucher data from 10 U.S. cities between 1997 and 2008. The authors find
that crime is higher in neighborhoods with housing vouchers, but their models
suggest that reverse causality is the reason – voucher households move to higher
crime neighborhoods and do not necessarily cause the higher crime rates in those
neighborhoods.
Page 12
12
Popkin et al are specifically examining public housing transformation and
what happens to crime in the neighborhoods where former public housing
residents move in Atlanta and Chicago. They find that crime declined
substantially in the areas where public housing was demolished. However, in
neighborhoods in both cities where a relatively high concentration of residents
relocated (often using vouchers), they observed significant increases in crime. In
Chicago, the authors conclude, the increased property crime in destination
neighborhoods outweighed the decreased crime in origin neighborhoods. The
authors suggest that relocation should be targeted to avoid significant clustering
of the relocated population.
All of the studies mentioned thus far look at these relationships at the
neighborhood level. Freedman and Owens (2011) is the only study that zooms out
at larger level of geography – the authors examine the effect that the LIHTC has
on crime in counties. Using an instrumental variables strategy that exploits a
discontinuity resulting from the designation of qualified census tracts (QCTs)
where developers have added tax credit incentives for locating in such tracts, the
authors find that LIHTC development in the poorest neighborhoods results in
lower violent crime at the county level.
Although there is a growing body of evidence on the relationship between
subsidized housing and crime, there is still a limited understanding of how the
voucher program may affect crime and almost no knowledge on the aggregate
Page 13
13
impacts across cities. Although neighborhood-level models may be identified with
more precision, there are a number of reasons why a city-level analysis of these
effects is essential. First, police budgets are commonly determined at the city
level, as are major housing and land use decisions. Second, crime statistics are
widely available at the city level, whereas tract-level crime rates are only
available in select cities and years. Third neighborhood-level analyses are not able
to capture crime spillovers to adjacent neighborhoods. Criminals do not always
commit crimes in their residential neighborhoods, meaning city-level analyses are
more likely to capture crime effects in the aggregate. Relatedly, there may be
nonlinear relationships between subsidized housing and crime at the
neighborhood level that make aggregate crime effects unclear. Rosin (2008)
suggested a number of reasons why the dispersion of subsidized households may
affect crime: the increased challenge of policing multiple crime fronts, the
difficulties in linking dispersed low-income populations to social services, and the
loss in social networks that had thrived in concentrated housing projects. Galster
(2005) suggests another – that decreases in the amount of high poverty tracts
(which the voucher program may contribute to through subsidized housing
dispersion) is likely concurrent with increases in the proportion of the population
living in mid-poverty census tracts. Those increases can have negative aggregate,
citywide effects along a number of social indicators, including crime.
Page 14
14
Data and Methods
To estimate the extent that housing vouchers affect crime in U.S. cities, I
use data from 1997 to 2008 on vouchers, LIHTCs, public housing, and HOPE VI
from HUD, Uniform Crime Report data from the FBI, and socioeconomic
characteristics from the U.S. Census on the 215 U.S. cities with population greater
than 100,000 as of the 2000 Census.i These data include annual counts of housing
subsidies (LIHTC, public housing, vouchers, and HOPE VI), violent and property
crimes from the FBI Uniform Crime Report system, and race, poverty, and
income data that are linearly interpolated between census years using data from
the 1990 and 2000 U.S. Censuses and the 2005-09 American Community Survey.
I also include MSA-level unemployment rates from the U.S. Bureau of Labor
Statistics, and state-level incarceration rates from the U.S. Department of Justice,
Bureau of Justice Statistics.
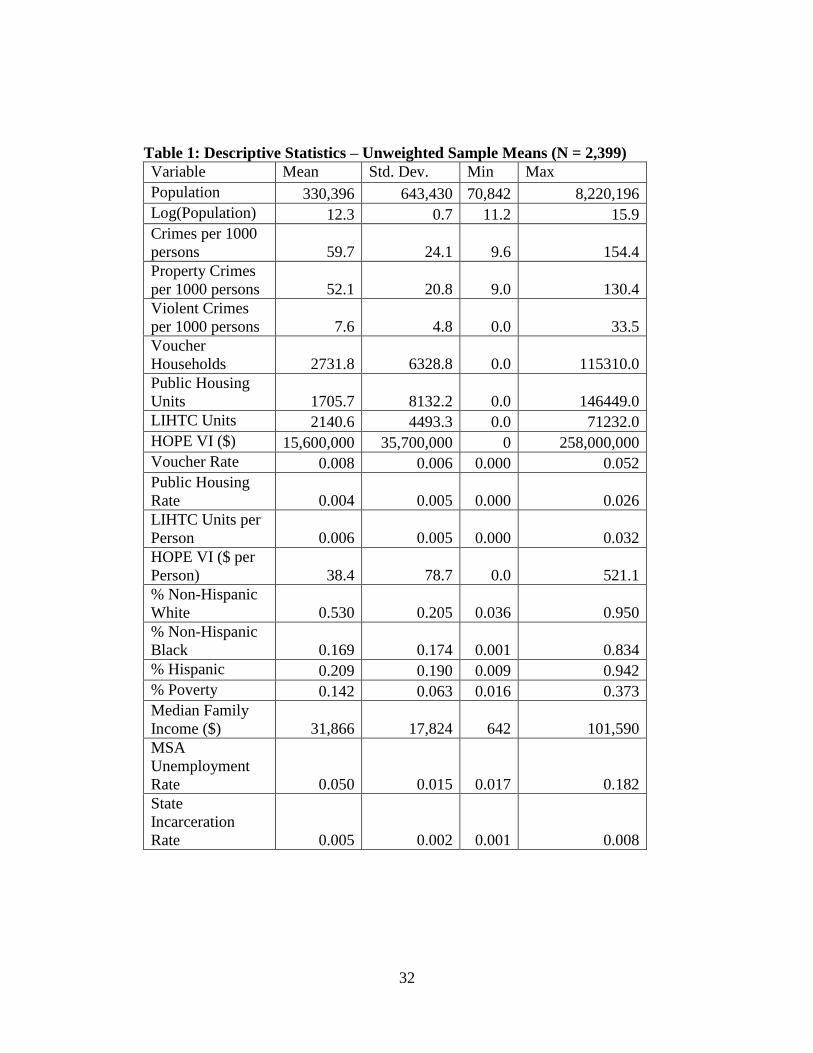
Descriptive statistics for the sample are provided in Table 1. The average
city in the sample has just over 330,000 people, although the median city is much
smaller, closer to 175,000. There are nearly 60 total (property plus violent) crimes
per 1000 people over the entire data period – 52 of those are property crimes.
However, that masks considerable decreases over time. In 1997, that number was
68.7, and by 2008 the average crime rate had declined to 51.5 crimes per 1,000
persons. The voucher program is the most prevalent of the three major housing
subsidy programs – there were an average of 2,732 vouchers issued per city per
Page 15
15
year, compared to 2,141 LIHTC units and 1,706 public housing units. Housing
subsidies also changed substantially over time – the number of vouchers per year
more than doubled from 1997 to 2008, the number of LIHTC units nearly tripled,
and the number of public housing units has barely changed.
[Insert table 1 about here]
Using these data, I estimate a set of fixed effects regression models to
control for unobserved characteristics of cities that do not vary over time that may
affect crime rates and voucher prevalence. Additionally, I use lagged and lead
specifications – voucher variables lagged one year and one year into the future –to
better isolate the causal relationship between vouchers and crime. This strategy
controls for the fact that voucher households may move to cities with higher
crime rates, due in part to the fact that rents are likely to be lower. This results in a
two-way relationship between voucher household prevalence and crime.
Similarly, they may be less likely to move to the suburbs if suburban crime rates
are lower relative to the central city (and rents are relatively higher). As noted,
Ellen et al (2012) find that voucher households are frequently found in
neighborhoods where crime rates are rising. If that is the case in cities – voucher
holders are less likely to migrate to lower crime suburbs and/or are more likely to
move into higher crime central cities (or high-crime suburbs) – the observed
relationship between voucher holders and crime would be biased upward by this
Page 16
16
association. Thus, the lag and lead specifications are designed to isolate the causal
direction.
The baseline specification begins with the city-level crime rate on the left-
hand side of the equation, and vouchers per capita on the right-hand side, along
with per capita rates of LIHTCs, public housing units, HOPE VI revitalization
grant dollars awarded, MSA unemployment rates, state-level incarceration rates,
and a set of control variables reported by the U.S. Census in 1990, 2000, and the
2005-09 American Community Survey, interpolated linearly (percent in poverty,
median family income, percent Hispanic, and percent non-Hispanic Black). All of
the crime and housing variables are expressed as per capita rates in order to
control for changes in population. The equation can be expressed as:
( )
where CrimeRateirt is the crime rate in city i region r, and year t, Voucherirt,
LIHTCirt, PHirt, and HOPEirt denote the per capita voucher, LIHTC, public
housing, and HOPE VI totals in city i, region r, and year t, respectively. X’irt is the
set of covariates described above. Again, in some models the voucher variables
are lagged to limit endogeneity. Cityi and Tt * Rr are city and year*region fixed
effects, respectively. In all models, LIHTC units and HOPE VI dollars are
measured as accumulating up through that year – the number of LIHTC units in
Page 17
17
2000 (or HOPE VI dollars awarded) includes units that were built (or dollars
awarded) from 1997-2000. The region-year interaction term uses the nine regions
determined by the U.S. Census as an interaction term with the time trend. This
modified time effect allows for the slope of the time trend to be conditional on the
region of the country where a given city is located, because the nationwide crime
trend is much less relevant than the crime trend of cities in the sample that are in
the nearby census region. Given I am looking at variation across cities (over time)
I cluster the standard errors at the city level.
Additionally, households (with or without vouchers) may be aware of
crime trends in their city (or potential destination cities), and use that information
to help determine whether they should move in the near future. It may even be the
case that they use these trends to predict future crime rates and use that
information in moving decisions. To control for this, I estimate models with a
linear city-specific time trend on the right-hand side of the equation, as a
robustness check.
A key mechanism through which voucher numbers can change in a city is
through mobility across place boundaries within an MSA. As voucher mobility
has become a higher priority for HUD and local housing authorities, suburban
voucher populations have grown faster than city ones. Covington, Freeman, and
Stoll (2011) report that in 2008 nearly half of all housing voucher recipients lived
in the suburbs, with steady growth in the proportion of vouchers in the suburbs
Page 18
18
occurring from 2000 to 2008. Using the data for this paper, I calculate that the
suburban per capita voucher populations grew about 75 percent faster than the
city per capita voucher population from 2000-2006. Further, the controversies in
suburban Los Angeles suggest that the most vocal opposition to voucher mobility
exists in these areas.
To assess whether the growth of the suburban voucher population has
affected crime in those areas, I estimate a set of models that focuses on the
suburban portions of the MSAs that contain cities in the baseline sample. For
these models, the estimation is the same, but the sample is restricted to suburban
areas instead of cities greater than 100,000. I created this sample by gathering
data for the 114 MSAs that contain cities in the original sample, and then
subtracted central city housing subsidy, crime, population, and demographic
numbers from the MSA totals, leaving the suburban portions of the MSAs. In
some cases, large cities from the original sample are more suburban (such as
Overland Park, KS and Plano, TX). In those cases, they are counted as suburbs for
the suburban analysis. With the exception of the MSA unemployment and state-
level incarceration rates, all of the variables in the model (including the
population denominator), are identified at the suburb level.
Results
Page 19
19
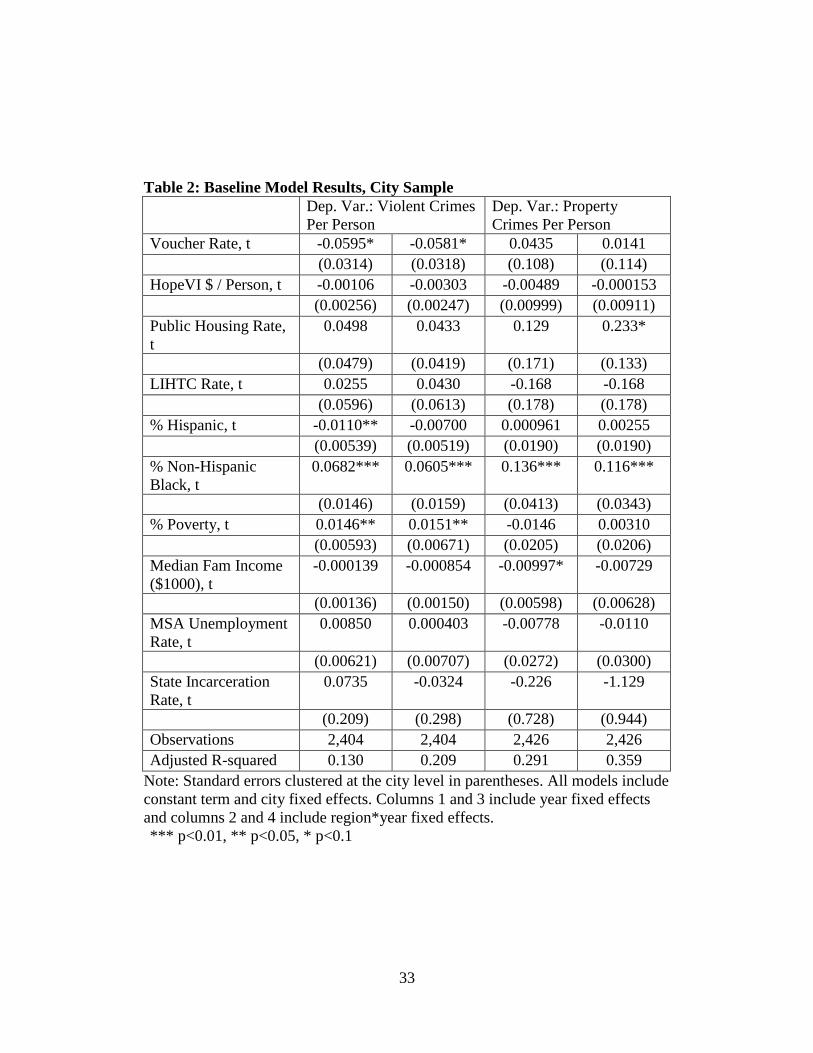
Table 2 displays the OLS results. The first two models present violent
crimes per person as the dependent variable, and the next two models use property
crimes per person. The first and third results columns present models that control
for the time trend using year fixed effects, and the second and fourth models
control for the time trend using the more stringent region*year fixed effects. It is
clear from these four models that there is not a strong relationship between crime
and vouchers, or any of the subsidized housing variables. There is a small,
negative association between vouchers and violent crime (10% significance
level). The magnitude of this relationship is also quite small – the coefficient of
0.058 suggests that a one standard deviation rise in the voucher rate is associated
with 0.0003 fewer crimes per capita, which is quite small relative to the mean of
0.0075 crimes per capita (in other words, a 75 percent increase in the voucher rate
would lead to a 4 percent decrease in the violent crime rate). There is no
relationship at all, judging from these models, between vouchers per capita and
property crime rates. There is a small positive association between public
housing and property crime. LIHTC units and HOPE VI spending do not appear
to have any relationship with crime. The demographic variables move in the
hypothesized directions – the cities with higher percent of non-Hispanic Blacks
and households below the poverty line have higher crime rates. Unemployment
and incarceration rates do not have strong effects on the crime rate, perhaps due to
these variables being measured at the MSA and state levels, respectively.
Page 20
20
[Insert table 2 about here]
In Table 2, where vouchers and crimes were measured in the same year, it
is possible that greater crime levels could be causing fewer vouchers to be used in
the cities in the sample, rather than the other way around. To address reverse
causality, I estimate models with lagged and future vouchers on the right-hand
side. If lagged vouchers are highly correlated with crimes, then we can assume
that vouchers are causing decreased crime and not vice versa, given crime in the
future cannot cause voucher numbers observed in the past. If future vouchers are
related to crime in the past then we can assume that vouchers are moving to
higher crime cities rather than causing the crime.
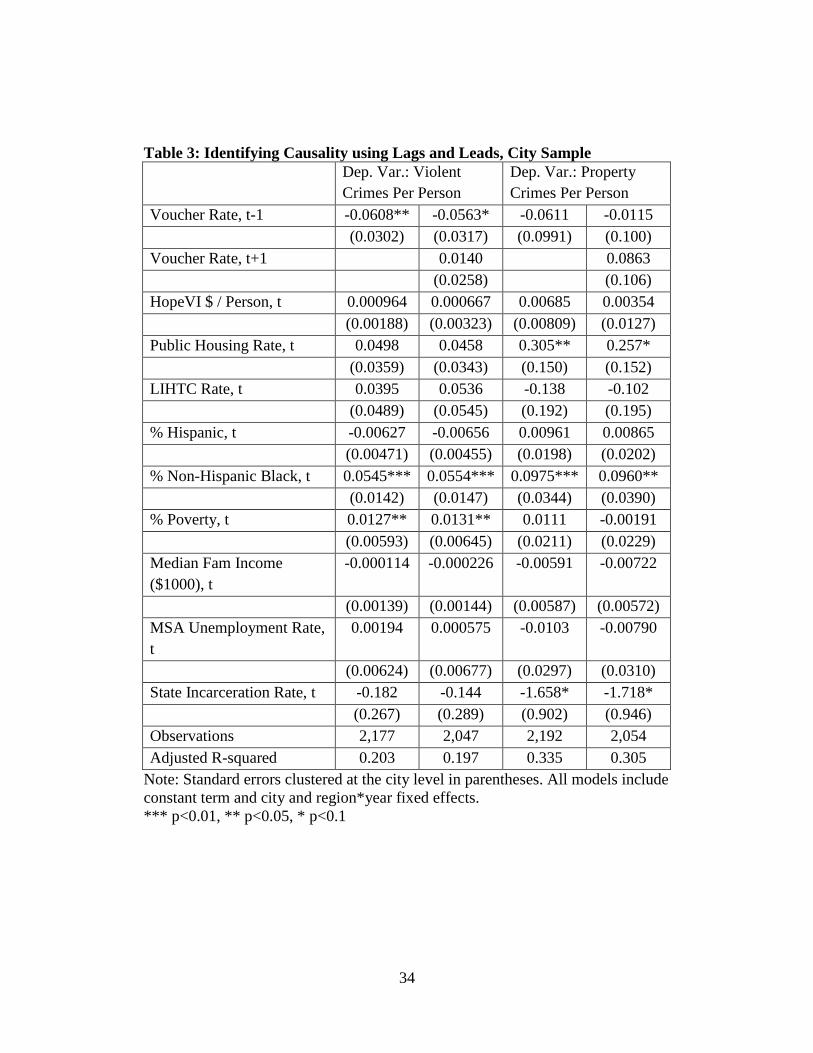
Table 3 displays the results from four models – in the first, the
independent variable is lagged vouchers (t-1), the second includes lagged and
future vouchers (t+1) in the same model. All models displayed include
region*year fixed effects. We see here that the violent crime models (first two
columns) suggest a slightly stronger relationship between lagged vouchers per
capita and violent crime rates. The coefficient on lagged vouchers is nearly
identical to the coefficient on vouchers in the current year, but the standard error
is slightly smaller, making it significant at the 5 percent level in the first model.
Once I control for the future voucher rate, the coefficient is again only significant
at the 10 percent level. In the property crime models, the voucher-crime
relationship remains nonexistent. In all of the models, future vouchers do not
Page 21
21
relate to crime rates. Non-significant coefficients on the future voucher variables
suggest that it is relatively unlikely that voucher households are
disproportionately moving to high crime cities. The weakly significant and
negative coefficients on lagged vouchers suggest that while it is unlikely that
increased voucher presence leads to lower crime rates, there is absolutely no
evidence that vouchers increase crime. Additionally, I estimated models using
lagged versions of the public housing, HOPE VI, and LIHTC variables, and none
of those coefficients were significant in any models.
[Insert table 3 about here]
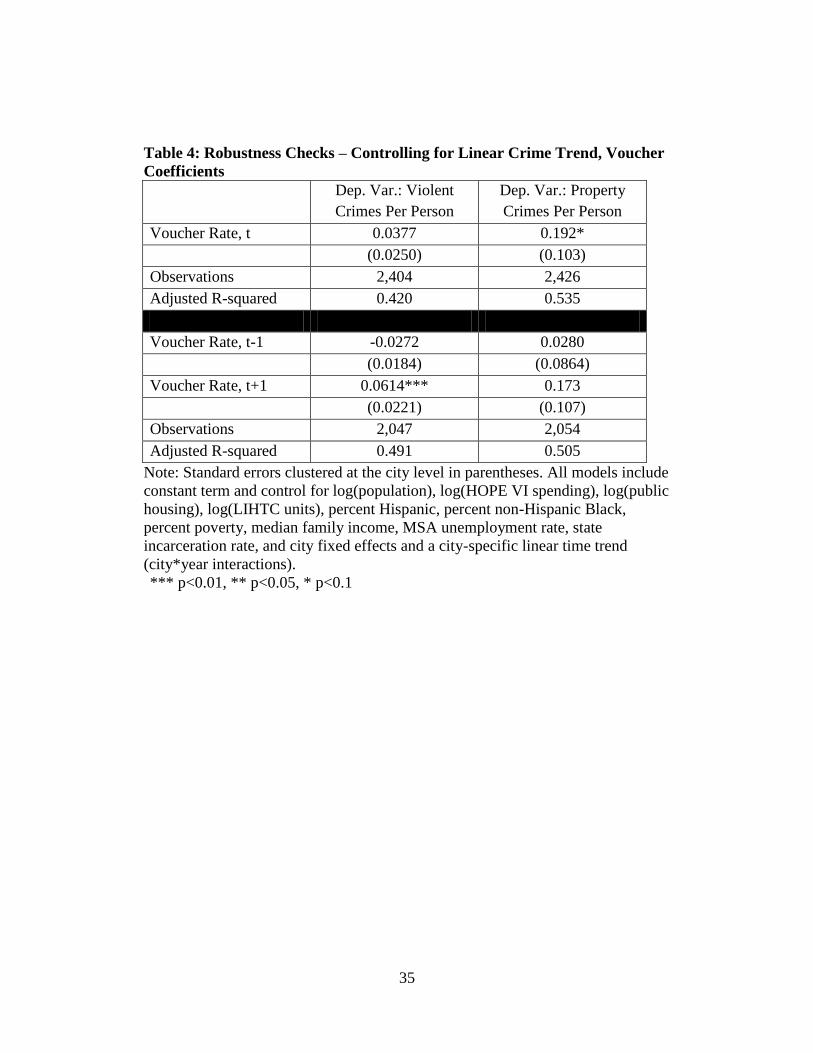
As noted, the lagged specifications may not be perfectly isolating the
causal relationship between vouchers and crime. Households may identify trends
in crime rates and use this information to predict future crime and use these
predictions in their residential location decisions. Although the region*year fixed
effects control for these trends to some extent, those controls are at a larger level
of geography. As a robustness check, I add a linear city-specific time trend in a
set of models displayed in Table 4. At the top of the table, voucher and crime
rates are measured in the same year, and in the bottom section, the lag/lead
specifications are displayed as in Table 3. In these models, the region-year
interaction term and city fixed effects are replaced with city-year interactions on
the right-hand side of the equation. The results are relatively consistent with the
other baseline results. The biggest change is that the coefficient on the voucher
Page 22
22
rate in time t is significant at the 10 percent level. However, that coefficient is no
longer significant if the voucher rate is lagged. In fact, the coefficient on voucher
rates in the following year (voucher rate, t+1) is very similar to the coefficient in
time t, and the standard error is larger than the coefficient on the lagged term.
This suggests that any positive relationship between vouchers and crime more
likely reflects the fact that voucher households move to higher crime cities than
voucher households cause higher crime rates in cities.
[Insert table 4 about here]
In the next analysis, I test whether the nature of this relationship differs in
suburban areas. In the results discussed thus far, the sample has included about 90
cities that would be considered suburbs (such as Plano, TX, several non-central
cities in southern California, Stamford, CT), but many of these suburbs are quite
urban. As discussed above, the voucher population has also suburbanized
considerably over the years. There is reason to believe that these trends could
potentially affect crime in those areas. Less urban, more affluent areas may be ill-
equipped to serve and police an influx of lower-income households, and crime
rates may spike as a result.
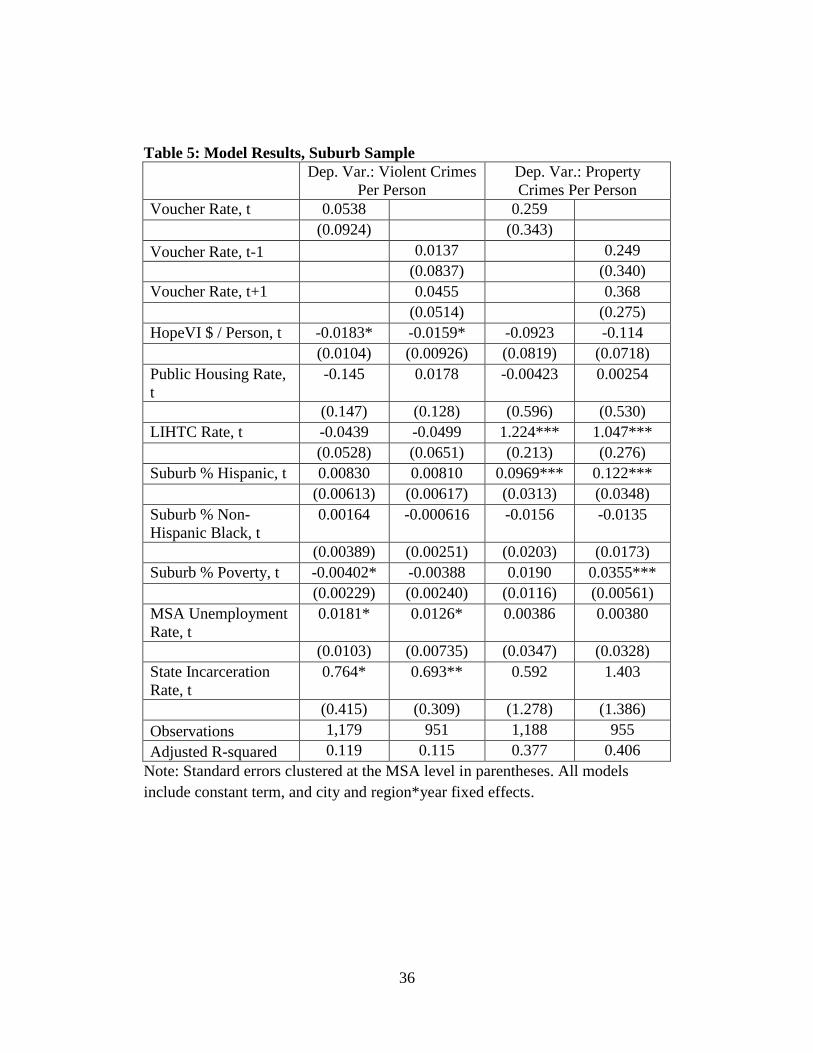
To test this theory, I take the 114 MSAs that contain the cities in the
previously analyzed sample of cities, and run these models using variables
constructed only from the non-central city portions of these MSAs. Table 5
presents the results of models using the same specification outlined in Equation 1
Page 23
23
on the suburban sample. The results here are very consistent with those in the city
sample. The weakly significant coefficients found in the violent crime models in
the city sample are not significant in the suburban sample, but this is perhaps due
to the smaller sample size. The magnitude of the (insignificant) voucher
coefficients is very similar across the two samples
Looking at the other housing subsidy variables, HOPE VI spending has a
weakly negative relationship with violent crime. LIHTC units per capita have a
strong, positive relationship with property crime. I also estimated models with
lagged versions of these variables in models not shown here. Lagged HOPE VI
spending had a stronger, negative relationship with both types of crime,
suggesting a lag between HOPE VI spending and demolition effects. Public
housing continued to have no relationship, and the LIHTC’s relationship with
property crime disappeared (although there was a weakly significant and positive
coefficient in the violent crime models.
[Insert table 5 about here]
The conclusion from these models is that there does not appear to be a
relationship between vouchers and crime in U.S. cities and suburbs. There are
some weakly significant findings that suggest a negative relationship, but these
results are not very robust. However, it is important to note that regression models
using rates have disadvantages. Some argue that using population as the
denominator for both the dependent variable and key independent can amplify
Page 24
24
bias resulting from inaccurate population measurement, particularly in fixed
effects models (Ellen and O’Regan 2010; Griliches and Hausman 1986; Levitt
1998). In the data in this paper, annual population estimates are provided by the
FBI for the Uniform Crime Report system, and are not likely to be as accurate as
decennial Census counts. Thus, I ran a set of models using counts of the key
variables – crimes, vouchers, LIHTC and public housing units, HOPE VI dollars
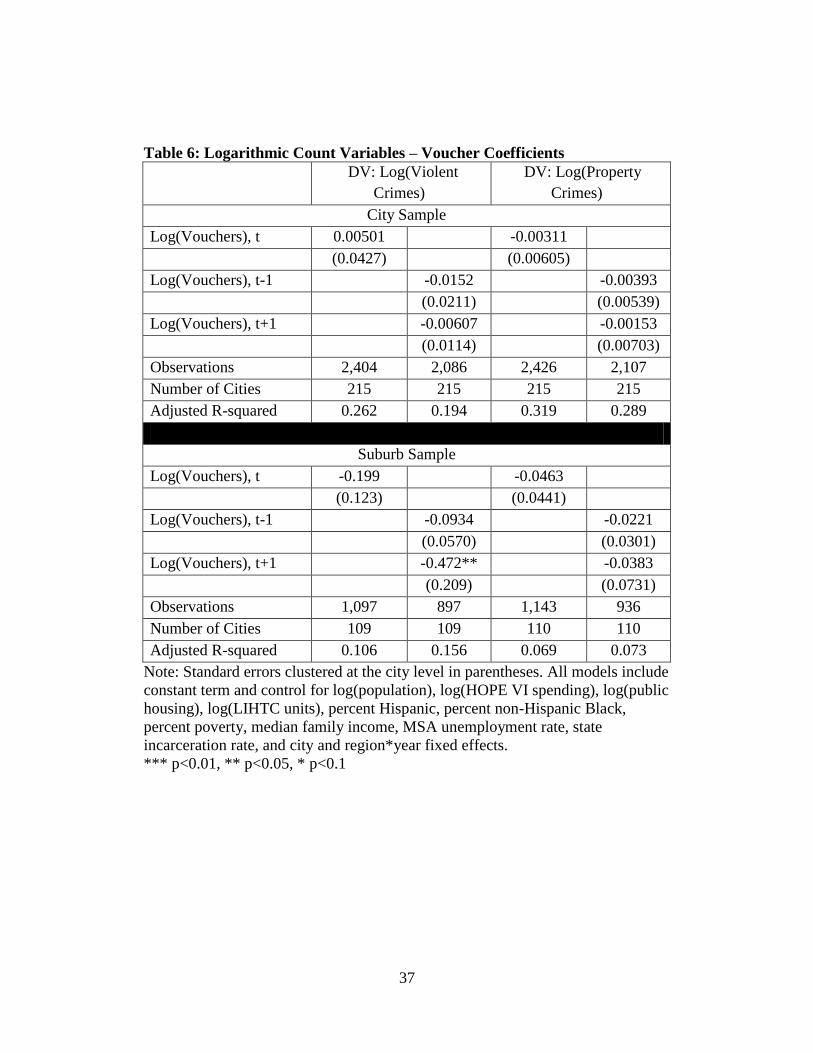
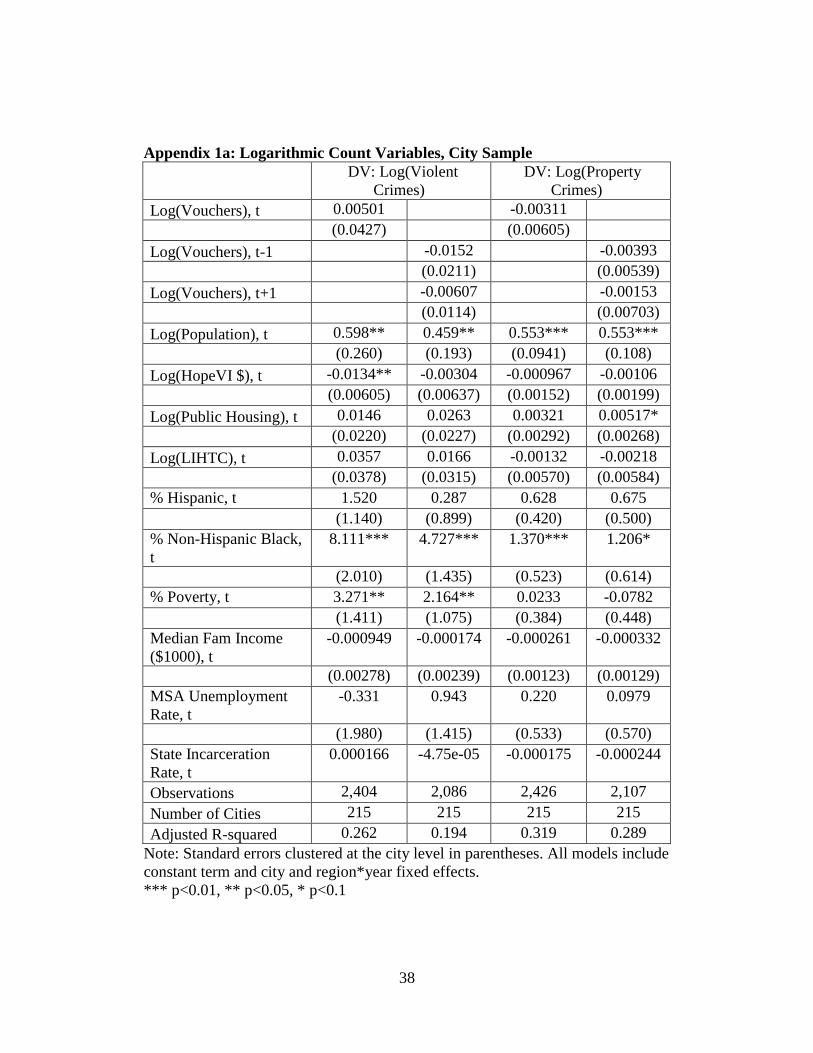
– rather than per capita rates, presented in Table 6. The counts are logarithmically
transformed to reduce the impact of outliers. These models also include the
natural log of population on the right-hand side to control for population
differences between cities and years.
The top of the table shows the city-level results, which are largely
consistent with the findings using rates. We see here that even the weak
relationships between vouchers and violent crime observed in the previous models
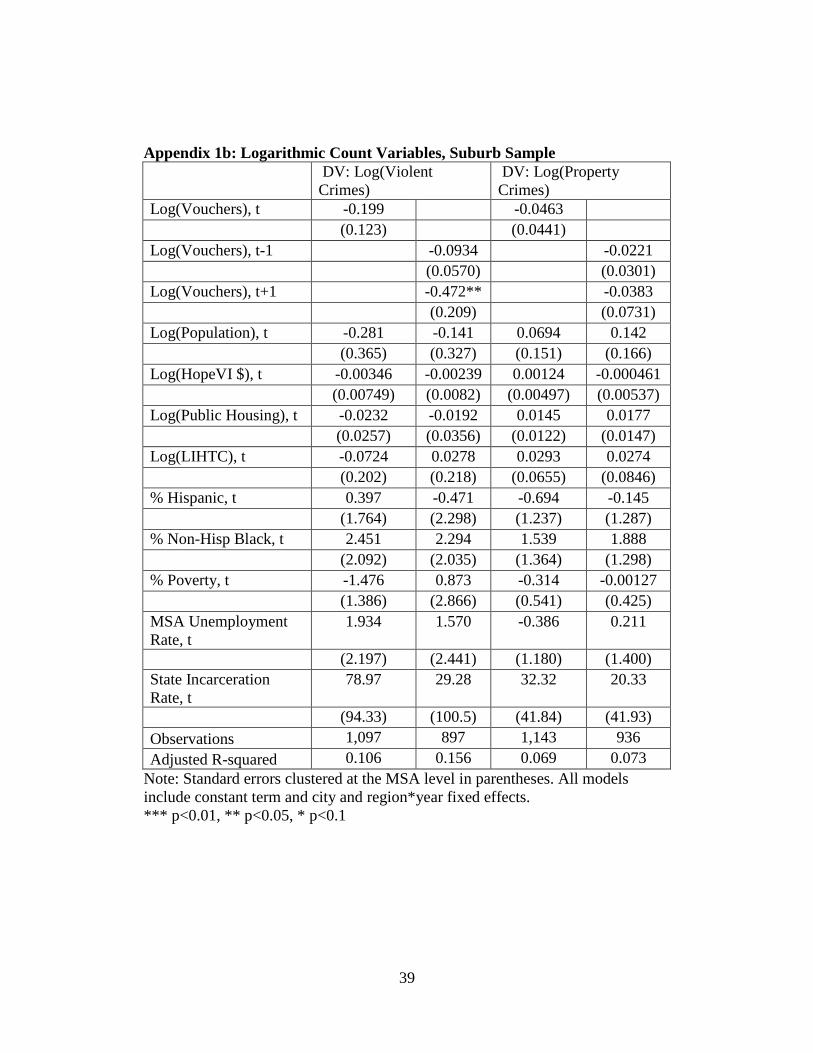
no longer hold. Once more, I ran these models using the natural log of vouchers
on the suburban sample, shown in the bottom half of the table. Current year,
lagged, and future vouchers all have an insignificant and negative relationship
with crime in the suburbs, controlling for population, and there is no relationship
with property crime. These results provide further evidence that the relationship
expressed using rates is consistently weak.
Discussion
Page 25
25
There is a growing body of work that examines the relationships between
subsidized housing and crime, largely focusing on these relationships at the
neighborhood level. This paper attempts to identify whether there are aggregate
effects across cities. The results suggest that recent controversies over increased
voucher presence in suburban communities are fueled by misinformation – there
is no observable relationship between city or suburban crime rates and the
proportions in those communities. If there is a relationship at all, these data
suggest that there is a weak, negative relationship between vouchers and crime in
large cities, and there is no relationship at all between vouchers and crime in
suburban areas.
A sensible explanation for this lack of a relationship is simply that voucher
households do not alter the crime landscape in metropolitan areas, and if they do,
they do not do so to the extent that is detectable at such a large level of
geography. However, these findings are consistent with much of the growing
body of work at the neighborhood level, summarized above.
Recent events and trends suggest that we pay particular attention to how
these relationships play out in suburban communities. The mayor of suburban
Lancaster, CA is being sued for harassing voucher households, acts he justifies by
asserting that these households are responsible for elevated crime rates in his city.
Further, Lancaster is part of a greater trend of robust growth in suburban voucher
populations. Allard and Roth (2010) document that suburban social service
Page 26
26
agencies are less numerous, handle larger service areas, and are less equipped to
handle increased demand in the face of the suburbanization of poverty. Given this
context, it is likely that the suburbs that house a growing number of voucher
households are often relatively distressed and lacking in the kind of social service
safety net that is more common in central cities. This could have impacts on a
number of social problems, including crime. According to the evidence compiled
in this paper, that has not been the case in recent years.
The goal of the voucher program to increase access to higher opportunity
neighborhoods is a laudable one. And the evidence here suggests that these efforts
are unlikely to increase crime in suburban communities, where many such
neighborhoods exist. It may not be sensible, however, to rapidly accelerate and
incentivize mobility to suburban jurisdictions, particularly without attending to
the weaker social safety net that Allard and Roth (2010) describe. Rather, it is
more logical to engage in what Popkin et al (2012) term “responsible relocation.”
Popkin and colleagues suggest several aspects of housing policy that could
constitute responsible relocation, including relocation counseling and follow-up,
supportive services, while expanding incentives to voucher households for
locating in better neighborhoods.
Page 27
27
References
Allard, S.W. and Roth, B. (2010) Strained Suburbs: The Social Service
Challenges of Rising Suburban Poverty. Washington, DC: The Brookings
Institution.
Barker, V. 2010. Explaining the Great American Crime Decline: A Review of
Blumstein and Wallman, Goldberger and Rosenfeld, and Zimring, Law &
Social Inquiry, 35(2), pp. 489–516.
Bursik, Jr., R.J. and Grasmick, H.G. (1993) Economic Deprivation and
Neighborhood Crime Rates, 1960-1980, Law & Society Review, 27(2), pp.
263-283.
Covington, K., L. Freeman, and M.A. Stoll (2011) The Suburbanization of
Housing Choice Voucher Recipients. Washington, DC: The Brookings
Institution.
Ellen, I.G. and Horn, K.M. (2012) Do Federally Assisted Households Have
Access to High Performing Schools? Washington, DC: Poverty and Race
Research Action Council.
Ellen, I. G., M. C. Lens, and K. M. O’Regan (2012) American Murder Mystery
Revisited: Do Housing Voucher Households Cause Crime? Housing Policy
Debate, 22(4): 551-572.
Ellen, I.G. and O’Regan, K.M. (2010) Crime and Urban Flight Revisited: The
Effect of the 1990s Drop in Crime on Cities, Journal of Urban Economics,
68(3), pp. 247-259.
Farley, J.E. (1982) Has Public Housing Gotten a Bum Rap?: The Incidence of
Crime in St. Louis Public Housing Developments, Environment and
Behavior, 14(4), pp. 443-477.
Finkel, M. and Buron, L. (2003) Study on Section 8 Voucher Success Rates:
Volume I Quantitative Study of Success Rates in Metropolitan Areas.
Washington, DC: Abt Associates.
Federal Bureau of Investigation (2008) Uniform Crime Reports. Washington, DC
Freedman, M. and Owens, E.G. (2011) Low-Income Housing Development and
Crime, Journal of Urban Economics, 70(2-3), pp. 115-131.
Page 28
28
Freeman, L. (2012) The Impact of Source of Income Laws on Voucher Utilization
Rates, Housing Policy Debate, 22(2), pp. 297-318.
Galster, G.C. (2005) Consequences from the Redistribution of Urban Poverty
during the 1990s: A Cautionary Tale, Economic Development Quarterly,
19(2), pp. 119-125.
Galster, G.C. , P.A. Tatian, A.M. Santiago, K.L.S. Pettit, and R.E. Smith (2003)
Why Not in My Backyard?: Neighborhood Impacts of Deconcentrating
Assisted Housing. New Brunswick, N.J.: Center for Urban Policy Research.
Galvez, M. (2010) What Do We Know about Housing Choice Voucher Program
Location Outcomes? What Works Collaborative Working Paper, The Urban
Institute.
Goetz, E.G., H.K. Lam, and A. Heitlinger (1996) There Goes the Neighborhood?
: The Impact of Subsidized Multi-Family Housing on Urban Neighborhoods.
Minneapolis, MN: University of Minnesota Center for Urban and Regional
Affairs.
Greene, W.H. (2008) Econometric Methods. New Jersey: Pearson Prentice Hall.
Griliches, Z. and Hausman, J.A. (1986) Errors in Variables in Panel Data, Journal
of Econometrics, 31(1), pp. 93-118.
Hagan, J. and Peterson, R.D. (Eds) (1995) Crime and Inequality. Palo Alto, CA:
Stanford University Press.
Kennedy, S.D. and Finkel M. (1994) Section 8 Rental Voucher and Rental
Certificate Utilization Study: Final Report. Cambridge, MA: Abt Associates.
Kotlowitz, A. 1991. There Are No Children Here: The Story of Two Boys
Growing Up in The Other America. New York: Anchor Books.
Krivo, L. and Peterson, R.D. (1996) Extremely Disadvantaged Neighborhoods
and Urban Crime, Social Forces, 75(2), pp. 619-648.
Levitt, S.D. (1998) Why do Increased Arrest Rates Appear to Reduce Crime:
Deterrence, Incapacitation, or Measurement Error? Economic Inquiry, 36(3),
pp. 353-372.
Page 29
29
Levitt, S.D. (2004) Understanding Why Crime Fell in the 1990s: Four Factors that
Explain the Decline and Six that Do Not, The Journal of Economic
Perspectives, 18(1), pp. 163-190.
McClure, K. (2006) The Low-Income Housing Tax Credit Program Goes
Mainstream and Moves to the Suburbs, Housing Policy Debate, 17(3), pp.
419-446.
McNulty, T.L. and Holloway, S.R. (2000) Race, Crime, and Public Housing in
Atlanta: Testing a Conditional Effect Hypothesis, Social Forces, 79(2), pp.
707-729.
Medina, Jennifer. 2011. “Subsidies and Suspicion.” The New York Times, August
10, 2011.
http://www.nytimes.com/2011/08/11/us/11housing.html?_r=2&pagewanted=
all.
Morenoff, J.D. and Sampson, R.J. (1997) Violent Crime and the Spatial
Dynamics of Neighborhood Transition: Chicago, 1970-1990, Social Forces,
76(1), pp. 31-64.
National Commission on Severely Distressed Public Housing (1992) Final Report
to Congress and the Secretary of Housing and Urban Development.
Washington, DC: National Commission on Severely Distressed Public
Housing.
Popkin, S.J., M.J. Rich, L. Hendey, C. Hayes, and J. Parilla (2012) Public
Housing Transformation and Crime: Making the Case for Responsible
Relocation. Washington, DC: The Urban Institute.
Popkin, S.J., V.E. Gwiasda, L.M. Olson, D.P. Rosenbaum, and L. Buron (2000)
The Hidden War: Crime and the Tragedy of Public Housing in Chicago.
New Brunswick, NJ: Rutgers University Press.
Roncek, D.W., R. Bell, and J.M.A. Francik (1981) Housing Projects and Crime:
Testing a Proximity Hypothesis, Social Problems, 29(2), pp. 151-166.
Rosin, H. (2008) American Murder Mystery, The Atlantic Monthly, 302(1), pp.
40-54.
Page 30
30
Sabol, W.J., H.C. West, and M. Cooper (2008) Prisoners in the United States.
Washington, DC: U.S. Department of Justice, Office of Justice Programs,
Bureau of Justice Statistics.
Santiago, A.M., G.C. Galster, and K.L.S. Pettit (2003) Neighbourhood Crime and
Scattered-Site Public Housing, Urban Studies, 40(11), pp. 2147-2163.
Schneider, R.H. and Kitchen, T. (2002) Planning for Crime Prevention: A
TransAtlantic Perspective. New York: Routledge.
Schwartz, A.F. (2006) Housing Policy in the United States: An Introduction. New
York: Routledge.
Skogan, W. (1986) Fear of Crime and Neighborhood Change, Crime and Justice,
8, pp. 203-229.
Suresh, G. and Vito, G. (2009) Homicide Patterns and Public Housing: The Case
of Louisville, KY (1989-2007) , Homicide Studies, 13(4), pp. 411-433.
Taub, R.P., D.G. Taylor, and J.D. Dunham (1984) Paths of Neighborhood
Change: Race and Crime in Urban America. Chicago: University of Chicago
Press.
Taylor, R.B. (1995) The Impact of Crime on Communities. Annals of the
American Academy of Political and Social Science, 539, pp. 28-45.
U.S. Department of Justice. Federal Bureau of Investigation (2008) Uniform
Crime Reporting Program Data: Offenses Known and Clearances by Arrest.
Ann Arbor, MI: Inter-university Consortium for Political and Social
Research.
Van Zandt, S. and Mhatre, P. (2009) The Effect of Housing Choice Voucher
Households on Neighborhood Crime: Longitudinal Evidence from Dallas.
Working Paper 09-01, Sustainable Housing Research Unit (SHRU), College
of Architecture, Texas A&M University.
Wooldridge, J.M. (2000) Introductory Econometrics. New York: South-Western
College Publishing.
Page 31
31
Fig. 1: Voucher, LIHTC, and Public Housing Units by Year, 1990-2008
Sources: Author’s calculations of HUD data; Schwartz 2006; FBI Uniform
Crime Reports
0
1,000
2,000
3,000
4,000
5,000
6,000
7,000
0
500,000
1,000,000
1,500,000
2,000,000
2,500,000
19
91
19
92
19
93
19
94
19
95
19
96
19
97
19
98
19
99
20
00
20
01
20
02
20
03
20
04
20
05
20
06
20
07
20
08
Cri
me
s p
er
10
0,0
00
Pe
rso
ns
Nu
mb
er
of
Ho
use
ho
lds
Year
U.S. Crime Rate Voucher Households
Public Housing Households
LIHTC Households
Page 32
32
Table 1: Descriptive Statistics – Unweighted Sample Means (N = 2,399)
Variable Mean Std. Dev. Min Max
Population 330,396 643,430 70,842 8,220,196
Log(Population) 12.3 0.7 11.2 15.9
Crimes per 1000
persons 59.7 24.1 9.6 154.4
Property Crimes
per 1000 persons 52.1 20.8 9.0 130.4
Violent Crimes
per 1000 persons 7.6 4.8 0.0 33.5
Voucher
Households 2731.8 6328.8 0.0 115310.0
Public Housing
Units 1705.7 8132.2 0.0 146449.0
LIHTC Units 2140.6 4493.3 0.0 71232.0
HOPE VI ($) 15,600,000 35,700,000 0 258,000,000
Voucher Rate 0.008 0.006 0.000 0.052
Public Housing
Rate 0.004 0.005 0.000 0.026
LIHTC Units per
Person 0.006 0.005 0.000 0.032
HOPE VI ($ per
Person) 38.4 78.7 0.0 521.1
% Non-Hispanic
White 0.530 0.205 0.036 0.950
% Non-Hispanic
Black 0.169 0.174 0.001 0.834
% Hispanic 0.209 0.190 0.009 0.942
% Poverty 0.142 0.063 0.016 0.373
Median Family
Income ($) 31,866 17,824 642 101,590
MSA
Unemployment
Rate 0.050 0.015 0.017 0.182
State
Incarceration
Rate 0.005 0.002 0.001 0.008
Page 33
33
Table 2: Baseline Model Results, City Sample
Dep. Var.: Violent Crimes
Per Person
Dep. Var.: Property
Crimes Per Person
Voucher Rate, t -0.0595* -0.0581* 0.0435 0.0141
(0.0314) (0.0318) (0.108) (0.114)
HopeVI $ / Person, t -0.00106 -0.00303 -0.00489 -0.000153
(0.00256) (0.00247) (0.00999) (0.00911)
Public Housing Rate,
t
0.0498 0.0433 0.129 0.233*
(0.0479) (0.0419) (0.171) (0.133)
LIHTC Rate, t 0.0255 0.0430 -0.168 -0.168
(0.0596) (0.0613) (0.178) (0.178)
% Hispanic, t -0.0110** -0.00700 0.000961 0.00255
(0.00539) (0.00519) (0.0190) (0.0190)
% Non-Hispanic
Black, t
0.0682*** 0.0605*** 0.136*** 0.116***
(0.0146) (0.0159) (0.0413) (0.0343)
% Poverty, t 0.0146** 0.0151** -0.0146 0.00310
(0.00593) (0.00671) (0.0205) (0.0206)
Median Fam Income
($1000), t
-0.000139 -0.000854 -0.00997* -0.00729
(0.00136) (0.00150) (0.00598) (0.00628)
MSA Unemployment
Rate, t
0.00850 0.000403 -0.00778 -0.0110
(0.00621) (0.00707) (0.0272) (0.0300)
State Incarceration
Rate, t
0.0735 -0.0324 -0.226 -1.129
(0.209) (0.298) (0.728) (0.944)
Observations 2,404 2,404 2,426 2,426
Adjusted R-squared 0.130 0.209 0.291 0.359
Note: Standard errors clustered at the city level in parentheses. All models include
constant term and city fixed effects. Columns 1 and 3 include year fixed effects
and columns 2 and 4 include region*year fixed effects.
*** p<0.01, ** p<0.05, * p<0.1
Page 34
34
Table 3: Identifying Causality using Lags and Leads, City Sample
Dep. Var.: Violent
Crimes Per Person
Dep. Var.: Property
Crimes Per Person
Voucher Rate, t-1 -0.0608** -0.0563* -0.0611 -0.0115
(0.0302) (0.0317) (0.0991) (0.100)
Voucher Rate, t+1 0.0140 0.0863
(0.0258) (0.106)
HopeVI $ / Person, t 0.000964 0.000667 0.00685 0.00354
(0.00188) (0.00323) (0.00809) (0.0127)
Public Housing Rate, t 0.0498 0.0458 0.305** 0.257*
(0.0359) (0.0343) (0.150) (0.152)
LIHTC Rate, t 0.0395 0.0536 -0.138 -0.102
(0.0489) (0.0545) (0.192) (0.195)
% Hispanic, t -0.00627 -0.00656 0.00961 0.00865
(0.00471) (0.00455) (0.0198) (0.0202)
% Non-Hispanic Black, t 0.0545*** 0.0554*** 0.0975*** 0.0960**
(0.0142) (0.0147) (0.0344) (0.0390)
% Poverty, t 0.0127** 0.0131** 0.0111 -0.00191
(0.00593) (0.00645) (0.0211) (0.0229)
Median Fam Income
($1000), t
-0.000114 -0.000226 -0.00591 -0.00722
(0.00139) (0.00144) (0.00587) (0.00572)
MSA Unemployment Rate,
t
0.00194 0.000575 -0.0103 -0.00790
(0.00624) (0.00677) (0.0297) (0.0310)
State Incarceration Rate, t -0.182 -0.144 -1.658* -1.718*
(0.267) (0.289) (0.902) (0.946)
Observations 2,177 2,047 2,192 2,054
Adjusted R-squared 0.203 0.197 0.335 0.305
Note: Standard errors clustered at the city level in parentheses. All models include
constant term and city and region*year fixed effects.
*** p<0.01, ** p<0.05, * p<0.1
Page 35
35
Table 4: Robustness Checks – Controlling for Linear Crime Trend, Voucher
Coefficients
Dep. Var.: Violent
Crimes Per Person
Dep. Var.: Property
Crimes Per Person
Voucher Rate, t 0.0377 0.192*
(0.0250) (0.103)
Observations 2,404 2,426
Adjusted R-squared 0.420 0.535
Voucher Rate, t-1 -0.0272 0.0280
(0.0184) (0.0864)
Voucher Rate, t+1 0.0614*** 0.173
(0.0221) (0.107)
Observations 2,047 2,054
Adjusted R-squared 0.491 0.505
Note: Standard errors clustered at the city level in parentheses. All models include
constant term and control for log(population), log(HOPE VI spending), log(public
housing), log(LIHTC units), percent Hispanic, percent non-Hispanic Black,
percent poverty, median family income, MSA unemployment rate, state
incarceration rate, and city fixed effects and a city-specific linear time trend
(city*year interactions).
*** p<0.01, ** p<0.05, * p<0.1
Page 36
36
Table 5: Model Results, Suburb Sample
Dep. Var.: Violent Crimes
Per Person
Dep. Var.: Property
Crimes Per Person
Voucher Rate, t 0.0538 0.259
(0.0924) (0.343)
Voucher Rate, t-1 0.0137 0.249
(0.0837) (0.340)
Voucher Rate, t+1 0.0455 0.368
(0.0514) (0.275)
HopeVI $ / Person, t -0.0183* -0.0159* -0.0923 -0.114
(0.0104) (0.00926) (0.0819) (0.0718)
Public Housing Rate,
t
-0.145 0.0178 -0.00423 0.00254
(0.147) (0.128) (0.596) (0.530)
LIHTC Rate, t -0.0439 -0.0499 1.224*** 1.047***
(0.0528) (0.0651) (0.213) (0.276)
Suburb % Hispanic, t 0.00830 0.00810 0.0969*** 0.122***
(0.00613) (0.00617) (0.0313) (0.0348)
Suburb % Non-
Hispanic Black, t
0.00164 -0.000616 -0.0156 -0.0135
(0.00389) (0.00251) (0.0203) (0.0173)
Suburb % Poverty, t -0.00402* -0.00388 0.0190 0.0355***
(0.00229) (0.00240) (0.0116) (0.00561)
MSA Unemployment
Rate, t
0.0181* 0.0126* 0.00386 0.00380
(0.0103) (0.00735) (0.0347) (0.0328)
State Incarceration
Rate, t
0.764* 0.693** 0.592 1.403
(0.415) (0.309) (1.278) (1.386)
Observations 1,179 951 1,188 955
Adjusted R-squared 0.119 0.115 0.377 0.406
Note: Standard errors clustered at the MSA level in parentheses. All models
include constant term, and city and region*year fixed effects.
Page 37
37
Table 6: Logarithmic Count Variables – Voucher Coefficients
DV: Log(Violent
Crimes)
DV: Log(Property
Crimes)
City Sample
Log(Vouchers), t 0.00501 -0.00311
(0.0427) (0.00605)
Log(Vouchers), t-1 -0.0152 -0.00393
(0.0211) (0.00539)
Log(Vouchers), t+1 -0.00607 -0.00153
(0.0114) (0.00703)
Observations 2,404 2,086 2,426 2,107
Number of Cities 215 215 215 215
Adjusted R-squared 0.262 0.194 0.319 0.289
Suburb Sample
Log(Vouchers), t -0.199 -0.0463
(0.123) (0.0441)
Log(Vouchers), t-1 -0.0934 -0.0221
(0.0570) (0.0301)
Log(Vouchers), t+1 -0.472** -0.0383
(0.209) (0.0731)
Observations 1,097 897 1,143 936
Number of Cities 109 109 110 110
Adjusted R-squared 0.106 0.156 0.069 0.073
Note: Standard errors clustered at the city level in parentheses. All models include
constant term and control for log(population), log(HOPE VI spending), log(public
housing), log(LIHTC units), percent Hispanic, percent non-Hispanic Black,
percent poverty, median family income, MSA unemployment rate, state
incarceration rate, and city and region*year fixed effects.
*** p<0.01, ** p<0.05, * p<0.1
Page 38
38
Appendix 1a: Logarithmic Count Variables, City Sample
DV: Log(Violent
Crimes)
DV: Log(Property
Crimes)
Log(Vouchers), t 0.00501 -0.00311
(0.0427) (0.00605)
Log(Vouchers), t-1 -0.0152 -0.00393
(0.0211) (0.00539)
Log(Vouchers), t+1 -0.00607 -0.00153
(0.0114) (0.00703)
Log(Population), t 0.598** 0.459** 0.553*** 0.553***
(0.260) (0.193) (0.0941) (0.108)
Log(HopeVI $), t -0.0134** -0.00304 -0.000967 -0.00106
(0.00605) (0.00637) (0.00152) (0.00199)
Log(Public Housing), t 0.0146 0.0263 0.00321 0.00517*
(0.0220) (0.0227) (0.00292) (0.00268)
Log(LIHTC), t 0.0357 0.0166 -0.00132 -0.00218
(0.0378) (0.0315) (0.00570) (0.00584)
% Hispanic, t 1.520 0.287 0.628 0.675
(1.140) (0.899) (0.420) (0.500)
% Non-Hispanic Black,
t
8.111*** 4.727*** 1.370*** 1.206*
(2.010) (1.435) (0.523) (0.614)
% Poverty, t 3.271** 2.164** 0.0233 -0.0782
(1.411) (1.075) (0.384) (0.448)
Median Fam Income
($1000), t
-0.000949 -0.000174 -0.000261 -0.000332
(0.00278) (0.00239) (0.00123) (0.00129)
MSA Unemployment
Rate, t
-0.331 0.943 0.220 0.0979
(1.980) (1.415) (0.533) (0.570)
State Incarceration
Rate, t
0.000166 -4.75e-05 -0.000175 -0.000244
Observations 2,404 2,086 2,426 2,107
Number of Cities 215 215 215 215
Adjusted R-squared 0.262 0.194 0.319 0.289
Note: Standard errors clustered at the city level in parentheses. All models include
constant term and city and region*year fixed effects.
*** p<0.01, ** p<0.05, * p<0.1
Page 39
39
Appendix 1b: Logarithmic Count Variables, Suburb Sample
DV: Log(Violent
Crimes)
DV: Log(Property
Crimes)
Log(Vouchers), t -0.199 -0.0463
(0.123) (0.0441)
Log(Vouchers), t-1 -0.0934 -0.0221
(0.0570) (0.0301)
Log(Vouchers), t+1 -0.472** -0.0383
(0.209) (0.0731)
Log(Population), t -0.281 -0.141 0.0694 0.142
(0.365) (0.327) (0.151) (0.166)
Log(HopeVI $), t -0.00346 -0.00239 0.00124 -0.000461
(0.00749) (0.0082) (0.00497) (0.00537)
Log(Public Housing), t -0.0232 -0.0192 0.0145 0.0177
(0.0257) (0.0356) (0.0122) (0.0147)
Log(LIHTC), t -0.0724 0.0278 0.0293 0.0274
(0.202) (0.218) (0.0655) (0.0846)
% Hispanic, t 0.397 -0.471 -0.694 -0.145
(1.764) (2.298) (1.237) (1.287)
% Non-Hisp Black, t 2.451 2.294 1.539 1.888
(2.092) (2.035) (1.364) (1.298)
% Poverty, t -1.476 0.873 -0.314 -0.00127
(1.386) (2.866) (0.541) (0.425)
MSA Unemployment
Rate, t
1.934 1.570 -0.386 0.211
(2.197) (2.441) (1.180) (1.400)
State Incarceration
Rate, t
78.97 29.28 32.32 20.33
(94.33) (100.5) (41.84) (41.93)
Observations 1,097 897 1,143 936
Adjusted R-squared 0.106 0.156 0.069 0.073
Note: Standard errors clustered at the MSA level in parentheses. All models
include constant term and city and region*year fixed effects.
*** p<0.01, ** p<0.05, * p<0.1
Page 40
40
Endnotes
i There are actually 238 such cities, 23 of them did not have usable crime data for most of the
relevant years. I also removed Honolulu from the sample, because the city and MSA are one in the
same, a fact that skewed the results in some models.