Full Terms & Conditions of access and use can be found at http://www.tandfonline.com/action/journalInformation?journalCode=raec20 Download by: [University of Newcastle, Australia] Date: 20 March 2017, At: 06:07 Applied Economics ISSN: 0003-6846 (Print) 1466-4283 (Online) Journal homepage: http://www.tandfonline.com/loi/raec20 The impact of labour unions on external auditor selection and audit scope: evidence from the Korean market Ju Ryum Chung, Eun Jung Cho, Ho-Young Lee & Myungsoo Son To cite this article: Ju Ryum Chung, Eun Jung Cho, Ho-Young Lee & Myungsoo Son (2017): The impact of labour unions on external auditor selection and audit scope: evidence from the Korean market, Applied Economics, DOI: 10.1080/00036846.2017.1296546 To link to this article: http://dx.doi.org/10.1080/00036846.2017.1296546 Published online: 07 Mar 2017. Submit your article to this journal Article views: 6 View related articles View Crossmark data
Transcript
Full Terms & Conditions of access and use can be found athttp://www.tandfonline.com/action/journalInformation?journalCode=raec20
Download by: [University of Newcastle, Australia] Date: 20 March 2017, At: 06:07
The impact of labour unions on external auditorselection and audit scope: evidence from theKorean market
Ju Ryum Chung, Eun Jung Cho, Ho-Young Lee & Myungsoo Son
To cite this article: Ju Ryum Chung, Eun Jung Cho, Ho-Young Lee & Myungsoo Son (2017): Theimpact of labour unions on external auditor selection and audit scope: evidence from the Koreanmarket, Applied Economics, DOI: 10.1080/00036846.2017.1296546
To link to this article: http://dx.doi.org/10.1080/00036846.2017.1296546
The impact of labour unions on external auditor selection and audit scope:evidence from the Korean marketJu Ryum Chunga, Eun Jung Choa, Ho-Young Leea and Myungsoo Sonb
aSchool of Business, Yonsei University, Seoul, South Korea; bCollege of Business and Economics, California State University, Fullerton, CA,USA
ABSTRACTWe examine whether labour unions influence external auditor selection and audit scope. As amajor user group of financial information, labour unions likely demand financial information ofhigh quality and thus high-quality audits. As a union’s request for wage increases is likely strongwhen a firm is performing well, management facing wage negotiations with the labour union hasincentives to manipulate earnings downward and may therefore prefer auditors who allow morediscretion. Using union data unique to Korea during 2005–2008, we find that firms with astronger labour union tend to choose higher-quality auditors (i.e. Big N or industry specialistauditors). We also find that unionization is negatively (positively) associated with positive (nega-tive) abnormal audit fees and audit hours, and the effects are more pronounced when the unionis stronger and more active. Given that departures from normal audit fees and audit hours ineither direction arguably impair audit quality, this finding is consistent with our prediction ofunions’ demand for high-quality audits. Overall, our findings suggest that labour unions play animportant role in determining audit quality.
KEYWORDSLabour union; externalauditor selection; auditscope; South Korea
JEL CLASSIFICATIONJ53; M42; N35
I. Introduction
Agency costs occur where there is a separationbetween managers and owners (Jensen andMeckling 1976). One of the ways to reduce theagency costs is to hire a high-quality auditor whoprovides quality assurance service for financial state-ments prepared by management. We argue thatlabour unions may play a role that pressures man-agement into selecting high-quality auditors andproviding quality assurance service. In this regard,labour unions play a monitoring role by reducingagency costs, which is a positive role of unions.
However, there has been little empirical evidence tosupport this argument. Prior studies heavily rely on adark side of labour unions, where unions are regardedas a rent-seeker and thereby decrease the firm’s value(Ruback and Zimmerman 1984; Connolly, Hirsch, andHirschey 1986; Hirsch 1991). The purpose of this studyis to fill in the void in the literature by providingempirical evidence that unions represent a monitoringmechanism. Specifically, we test whether labourunions demand high-quality audits.
A main function of unions is to protect employeerights and demand the improvement of employeewelfare. Negotiating wages with management is oneof its most important tasks. Unions rely on financialinformation in meetings with management overnegotiating wage increases. For that purpose, unionsmake every effort to acquire highly accurate andtransparent financial information representing thereality of the business (Kleiner and Bouillon 1988;Appelbaum and Hunter 2007; Leung, Li, and Rui2009). In addition, unions demand high-qualityfinancial reporting in order to be able to monitormanagement effectively and secure their jobs againstbankruptcies resulting from deteriorating financialconditions.
Contrariwise, management has incentives to hideinside information on resources available to the firmor ‘true’ operating income from unions (Bova 2013).This is because better informed unions will have abetter position in wage negotiations. Managementtends to consider unions rent-seekers instead ofvalue creators (Ruback and Zimmerman 1984;
CONTACT Ho-Young Lee [email protected] School of Business, Yonsei University, Seoul, South KoreaPresent affiliation for Ju Ryum Chung is School of Business, Administration, University of Seoul, Seoul, South KoreaData Availability: Data are publicly available from sources identified in the article.
Connolly, Hirsch, and Hirschey 1986; Hirsch 1991).Thus, if the firm performs well and consequentlyunions’ demand for wage increases is expected to behigh, the managers of unionized firms have incentivesto manipulate earnings downward since managementcan use (manipulated) poor performance as an excusefor turning down wage increases as long as the down-ward does not impair long-term firm value (Libertyand Zimmerman 1986). Hiding information on avail-able resources could allow managers to achieve amore desirable outcome from wage negotiations orto pursue their own benefits (Hilary 2006; Matsa2010; Klasa, Maxwell, and Ortiz-Molina 2009;Farber et al. 2012). Managers who face wage negotia-tions and thus pursue downward earnings manage-ment may prefer lower-quality external auditors.
Using Korean data during 2005–2008, we first exam-ine whether the presence of unions increases the like-lihood of high-quality auditors being selected.1 For therole of unions on quality or scope of external audits, wethen test an association between unionization andabnormal audit fees and audit hours. We also predictthat this effect of unions, if it exists, is more pronouncedin firms with stronger unions than firms with weakerunions. Strength of each company’s union is measuredby its membership to the following affiliations: (1) amember of Minju Confederation of Trade Unions(Minju), (2) a member of Hanguk Federation of TradeUnions (Hanguk) and (3) non affiliated unions, whereMinju is considered the most aggressive and nonaffi-liated unions the least. More detailed descriptions ofunions in Korea are included in the following section.
We empirically document that the Minju (thestrongest union) significantly increases the likelihoodof Big 4 or industry specialist auditors being chosen,while Nonaffiliated (the weakest) unions reduce thelikelihood of higher-quality auditors being engaged.We further find that both Minju and Hanguk reduceabnormally positive abnormal audit fees and audithours, and increase abnormally negative abnormal
audit fees and audit hours. These suggest that bothMinju and Hanguk unions increase audit quality byreducing two extremes (i.e. too high and too low) ofabnormal audit fees and audit hours. On the otherhand, Nonaffiliated unions have virtually no impacton abnormal audit fees and audit hours.
This study provides several contributions to theboth extant literature on unions and external audits.2
First, to our best knowledge, this is the first study touse large public data to empirically explore the asso-ciation between labour unions and external audits.We provide evidence that unions, who are importantusers of financial statements and have been relativelyignored by the literature, affect audit-related deci-sions such as auditor selection and audit scope.
Second, by using the unique Korean data (i.e. indi-vidual firm-level union measure), we can investigatehow the different characteristics of labour unions affectaudit selection and resource allocations to/by auditors.Korean regulators required publicly traded firms todisclose whether they had a union, their unions’ affilia-tion, the number of employees who join the union andthe number of full-time union administrators. Thesedata appear to be publicly available only in Koreaduring specific time period (i.e. during 1998–2008).Several U.S. studies use estimated unionization orlabour intensity data at the industry level, since theywere unable to use actual firm-level union data, whichmakes our study unique (e.g. Hilary 2006; Matsa 2010;Farber et al. 2013; Chen, Kacperczyk, and Ortiz-Molina 2011; Chyz et al. 2013).
Third, this study shows that labour unions,through the influence over decisions of auditorselection and scope, play a monitoring role andtherefore reduce agency costs between owners andmanagement (Jensen and Meckling 1976). The lit-erature has shown that there have been third-partygroups that require high-quality information,thereby reducing agency costs. For example, institu-tional shareholders, as an important user of financial
1There is anecdotal evidence in Korea that unions were involved in auditor selection processes. On 24 December 2002, Yonhap News reported that theemployees of Hyundai Moto Co. demanded a change of an external auditor because the auditor has been in position for a long period and provided non-audit services which may damage their independence as an external auditor. Yonhap News also reported that ‘the union of Hyundai Motor Co. has theright to demand that the firm change its external auditor.’ Korea Joongang Daily (25 October 2006) reported that labour union at Korean Exchange hasinterrupted internal auditor selection process in order to select an independent and high-quality auditor (available at: http://mengnews.joins.com/view.aspx?aId=2833197). Prime Economy (4 July 2008) also reported that IBK union staged a strike to oppose a candidacy of new auditor (available at: http://www.newsprime.co.kr/news/article.html?no=57437).
2To get practitioners’ opinions, we conducted a brief survey and a follow-up interview. From this extra procedure, we learned the following. First,management of firms with Minju, compared to its counterpart of firms with Hanguk, is more favourable on union’s participation in the auditor selectionprocess. Second, both labour unions used audited financial statements in their wage negotiation deals with management. In summary, the practitioners’opinions are generally consistent with our findings in this study.
information, play a monitoring role. Our study alsoadds to this line of studies providing evidence thatlabour unions make contribution to lead firms todisclose high-quality financial information.
The rest of this article is organized as follows.Section II presents the literature review and hypoth-esis development. Section III describes the researchdesign and sample, and provides descriptive statis-tics. Section IV reports the empirical results. Finally,Section V concludes the study.
II. Literature review and hypotheses
Unions in Korea
Most unions in Korea belong to the Hanguk orMinjufederations. According to a 2008 Labor White Paper,3
of 5889 unionized firms (1,559,172 members),3429 belonged to Hanguk (755,234 members) and1143 belonged to Minju (627,274 members). Theremaining 1317 firms (176,671 members) were non-unions have been increasing in affiliated. Thus,about 89% of unionized employees belonged to oneof the two major associations, and Hanguk had moremembership firms. Hanguk and Minju have verydifferent founding histories, ideologies and propen-sities. Not surprisingly, these two associations haveexhibited very different strategies and approaches indealing with wage negotiations and governmentlabour policies (Yoon and Lee 2008).
Minju tends to take an aggressive position and isnot reluctant to go on strike if its demands are notsatisfied, while Hanguk are more moderate and com-promise with management as much as it can.Nonaffiliated unions have been increasing in mem-bers and are considered least aggressive and active. Apanel study of the Korea Labor Institute (2008)provides a good example of comparisons betweenthese groups of unions. To illustrate, the averagenumber of collective bargaining sessions differsacross union confederations (7.94 times for Minju,6.12 for Hanguk and 5.03 for Nonaffiliated unions).Minju also shows the greatest difference betweenwage increase demanded by a union and the ratesuggested by management during collective bargain-ing (with Minju at 5.0%, Hanguk at 4.6% andNonaffiliated at 2.7%). These statistics are consistent
with our argument that the most aggressive union isMinju, followed by Hanguk and Nonaffiliatedunions.
Related literature and hypothesis development
Unions need information in preparing for wage nego-tiations, but managers tend to hide inside informationfor their own benefit (Hilary 2006). Having moreinformation enables unions to function better duringwage negotiations and gain more resources (Kleinerand Bouillon 1988). Providing more information tounions may eliminate managers’ grounds for refusingwage increases. Results from experimental studies(e.g. Croson 1996) also suggest that managers arebetter off negotiating with uninformed unions.Therefore, the best option for managers facing wagenegotiations is not to share information with unions.
Using Canadian data, Scott (1994) empiricallyfinds that firms facing a higher likelihood of a strikeor operating in an industry with high average sal-aries tend to reduce the amount of information onpension issues. Furthermore, as unions’ demands forwage increases are likely intensified when the unionis stronger, managers are much less likely to makeinformation available when facing stronger unions(Klasa, Maxwell, and Ortiz-Molina 2009; Matsa2010). If this is the case, information asymmetryincreases with union strength (Hilary 2006).
Management generally considers labour unions asrent-seekers (Grout 1984; Connolly, Hirsch, andHirschey 1986; Hirsch 1992; Klasa, Maxwell, andOrtiz-Molina 2009; Matsa 2010). Unions have incen-tives to extract as much quasi-rent as possiblethrough collective bargaining and strike threats(Grout 1984). Moreover, unions tend to demandwage increases when their firms are performingwell than when their firms’ performance is poor(Reynolds 1978; Blanchflower, Oswald, and Sanfey1996). Management thus responses to this predictedactions by unions by manipulating earnings down-ward in order to minimize rent-seeking by unions(Liberty and Zimmerman 1986; Farber et al. 2013).
However, empirical results are mixed for thisprediction. For example, Liberty and Zimmerman(1986) find no evidence of earnings manipulation
3The Labor White Paper is published every year by the Korean Ministry of Employment and Labor to present and evaluate labour policies. The documentincludes various statistics on labour markets such as employment, education, work environment and labour relations.
APPLIED ECONOMICS 3
prior to wage negotiations. Subsequent studies (e.g.Mautz and Richardson 1992; Cullinan and Knoblett1994) also fail to provide evidence that managersexercise discretion on earnings through accountingchoices prior to wage negotiations.
In contrast, DeAngelo and DeAngelo (1991) suc-cessfully document evidence of earnings manage-ment in the year of wage negotiations. Specifically,they find that firms report unusually large amountsof losses in years when wage negotiations occur.D’Souza, Jacob, and Ramesh (2001) also find evi-dence consistent with the earnings managementargument that management reduces labour negotia-tion costs through a discretionary selection ofaccounting choices. They document that unionizedfirms tend to select the immediate recognitionmethod in the year of SFAS 106 adoption, resultingin lower earnings in that year. Similarly, Bova (2013)offers evidence supporting the management inunionized firms has incentives to provide a negativeoutlook. He documents that unionized firms aremore likely to just miss analysts’ forecasts throughboth expectation and earnings managementsalthough this tendency is not restricted to wagenegotiation periods.
When unions prepare for wage negotiations withmanagement, they need high-quality financial infor-mation for successful negotiations (Appelbaum andHunter 2007; DeAngelo and DeAngelo 1991; Leung,Li, and Rui 2009). The high-quality information thatunions demand should be the one that faithfullyrepresents the real status of the companies’ business.If earnings are manipulated by management foropportunistic purposes, the union may not reapsufficient benefits.
Similarly, Faleye, Mehrotra, and Morck (2006)argue that unions prefer conservative earnings.This is because unions act like bondholders inthat they claim fixed amounts from companies inthe form of fixed wages and benefits. To securethese fixed claims, unions tend to demand conser-vative accounting. If firms with inflated earningsmay pay dividends to shareholders based on themanipulated performance, it will increase the riskthat unions, as fixed claimers, lose guaranteedwages and benefits.
Therefore, unions have strong incentives to deteraccounting manipulation (Liberty and Zimmerman1986). However, unions may not be able to monitoror evaluate the appropriateness of the financial infor-mation management provides because they usuallylack financial expertise. Using high-quality and inde-pendent auditors would assure unions that the infor-mation offered is representative of business reality.Unions in Korea are frequently involved in the pro-cess of hiring internal and/or external auditors. Thissuggests that unions hold a channel to have theirvoice heard in the auditor selection process.
We use Big 4 and industry specialist auditors asproxies for high-quality auditors, following the lit-erature suggesting that they offer better assurance onthe quality of their financial information than donon-Big 4 and non-industry specialist auditors(DeAngelo 1981; Teoh and Wong 1993; Balsam,Krishnan, and Yang 2003; Khurana and Raman2004; Behn, Choi, and Kang 2008). Big 4 auditorsalso provide higher insurance coverage to partiesthat suffer losses through audit failures (Dye 1993;Lennox 1999; Fortin and Pittman 2007), makingthem more attractive to unions.
Prior studies generally suggest that unions are agroup of important stakeholders with the ability andincentive to influence firms’ accounting choices andcorporate financial decisions. For example, unionscan have effects on various business decisionsincluding earnings management (DeAngelo andDeAngelo 1991; Bova 2013), investments inResearch & Development (Connolly, Hirsch, andHirschey 1986), cash holdings (Klasa, Maxwell, andOrtiz-Molina 2009), leverage (Matsa 2010), account-ing conservatism (Farber et al. 2012), CEO compen-sation (Banning and Chiles 2007), cost of equity(Chen, Kacperczyk, and Ortiz-Molina 2011) andcost of debt (Chen, Kacperczyk, and Ortiz-Molina2012). In addition to these business issues priorstudies document, we predict that unions are ableto influence audit issues as well. We hypothesize thatunions demand high-quality audits and requestmanagers to hire Big 4 or industry specialists, ceterisparibus,4 because unions equipped with high-qualityfinancial information are in a better position in wagenegotiations with management.
4Faleye, Mehrotra, and Morck (2006) note that unions can influence firms’ investment activities directly or indirectly through at least three avenues: (1)unionized employee activism, (2) introduction of cooperation agreements between unions and management and (3) shareholder activism. We believe thatunions can also utilize these three avenues to influence audit issues. For an anecdotal evidence of the union activism, see footnote 1.
4 J. R. CHUNG ET AL.
H1a: Firms with unions are more likely than firmswithout unions to have Big 4 or industryspecialist auditors, ceteris paribus.
We now turn to the second research question ofwhether union type (i.e. strong versus mild) has adifferential effect on audit-related issues. We believethat the union’s request to hire Big 4 or specialistauditors should be more influential when unions arestronger and/or more active. Strong unions possessgreater bargaining power through the threat of strikeand, therefore, have greater influence on manage-ment decisions (Farber et al. 2013; Chung et al. 2016;Choi, Sohn, and Seo 2016). Managers could also beproactive in selecting high-quality auditors to satisfythe demand from strong unions if their best interestis to minimize unnecessary uneasiness and uncer-tainty caused by strikes and other harmful actions.
As mentioned earlier, Minju is considered themore aggressive and active association because ofits frequent and aggressive strikes. Thus, we expectthat unions affiliated with Minju possess more bar-gaining power than other unions, and thus havegreater influence on management when demandinghigh-quality audits. Moreover, management facingstrong unions may also have greater incentives tohire high-quality auditors in the hope of avoidingunnecessary disputes with unions by signalling thatthey are trying to provide high-quality informationand have no intention of hiding anything. We there-fore posit that Minju unions are more likely to hireBig 4 or industry specialist auditors.
H1b: Firms whose unions are affiliated with Minju(stronger union) are more likely to have Big 4or industry specialist auditors.
Next, we examine whether unionization is asso-ciated with abnormal audit fees and audit hours. Weconduct these tests separately according to the signof the abnormal audit fees. As positive and negativeabnormal audit fees have different implications, testsusing both samples together may produce spuriousresults (Picconi and Reynolds 2013).
Abnormally high audit fees create auditor incentivesto compromise independence, which impairs audit
quality (Choi, Kim, and Zang 2010; Asthana andBoone 2012; Dye 1991). The normal audit fee level isdetermined by factors suggested by prior studies, suchas firm characteristics, complexity or risk. Abnormalfees are residuals that cannot be explained by thosefactors. Choi, Kim, and Zang (2010) suggest that posi-tive abnormal fees imply that the auditor has bondedeconomically to the client. In addition, abnormally highaudit hours indicate the unnecessary allocation of auditresources (Caramanis and Lennox 2008), signalling atype of audit inefficiency. An unnecessarily high audittime could help build inappropriate personal relation-ships between auditors and management, increasingdoubts about auditor independence (Tackett, Wolf,and Claypool 2004). Moreover, extra high audit fees(and hours) could be bribes delivered by managementto auditors in exchange for weak monitoring (Kinneyand Libby 2002). These discussions lead us to predictthat, if labour unions successfully monitor audit quality,unionized firms should have less positive abnormalaudit fees and audit hours.
However, positive abnormal fees and audithours can also be interpreted as extra effort(Eshleman and Guo 2014; Blankley, Hurtt, andMacGregor 2012; Hribar, Kravet, and Wilson2014).5 Auditors likely exert extra efforts whenassessing high audit risk in clients. To maintain acertain level of audit risk, auditors expand theiraudit scope by increasing substantive tests.According to this line of studies, positive abnor-mal audit fees (or hours) reflect extra effortsbeyond the controlled risk factors that areincluded in the audit fee (or audit hour) model.These extra efforts may lead to high audit quality.Auditors also exert extra efforts when firms withhigh-quality governance request more thoroughaudits to minimize litigation risks (Carcello et al.2002; Abbott et al. 2003). In these cases, positiveabnormal audit fees and hours are considereddesirable and aligned with labour unions’ interests.The above arguments may lead to a predictionthat unions encourage extra audit effort, suggest-ing a positive association between unionizationand positive abnormal audit fees and hours. Dueto these opposing predictions, we state two com-peting hypothesis as follows.
5Still others (e.g. Picconi and Reynolds 2013) argue that abnormally high audit fees represent a risk premium charged by auditors for firms with high auditrisk. See DeFond and Zhang (2014) for a review of audit fees as a proxy of audit quality.
APPLIED ECONOMICS 5
H2a-1a: Unionization positively affects positiveabnormal audit fees and audit hours.
H2a-1b: Unionization negatively affects positiveabnormal audit fees and audit hours.
Regarding negative abnormal audit fees and hours,we predict a positive association with unions. Given thatcertain level of audit fee and hour levels (normal level)should be secured to ensure audit quality, negativeabnormal audit fees and audit hours are interpreted asan underutilization of audit services (Picconi andReynolds 2013) or something that confers greater bar-gaining power onto audit clients (Asthana and Boone2012), both of which lead to lower-quality audits.Higher-quality auditors can charge clients higher auditfees (e.g. the Big N premium), which suggests higheraudit quality (Simunic 1980; Francis, Philbrick, andSchipper 1994). Audit fees lower than the norm maytherefore be related to low audit quality. Unions thatprefer higher-quality audits will make the effort to deterthis insufficient audit services (i.e. lower-quality audits).This is consistent with prior studies reporting that high-quality governance firms demand more rigorous audits,which reduces a possibility of insufficient audits.Consequently, our hypothesis is stated as follows:
H2a-2: Unionized firms tend to have less negativeabnormal audit fees and audit hours.
Consistent with the rationale for H1b, we argue thatstrong unions have greater influence on company deci-sions and that their demand for higher audit qualityshould be more powerful. This leads us to predict thatunions’ effects on abnormal audit fees and audit hoursare more pronounced in stronger unions (i.e. Minju):
H2b. The effects of unionization on abnormalaudit fees and audit hours, if they exist, aremore pronounced in unions affiliated withMinju (stronger union).
III. Research design and sample selection
Research design
To investigate whether unionization is associatedwith auditor choice, we estimate logistic regressionsin Equations (1) and (2) as baseline models.
BIGit ISPEitð Þ ¼ αþ β1Unionit þ β2Sizeit
þ β3Exportit þ β4Invrecit
þ β5Levit þ β6Lossit þ β7ROAit
þ β8Consolit þ Industry andYear dummiesþ εit
(1)
BIGit ISPEitð Þ ¼ αþ β1Minjuit þ β2Hangukit
þ β3Nonaffiliatedit þ β4Sizeit
þ β5Exportit þ β6Invrecit þ β7Levit
þ β8Lossit þ β9ROAit þ β10Consolit
þ Industry and Year dummiesþ εit
(2)
where
BIG: 1 if the firm is audited by a Big 4 auditor, and 0otherwise;
ISPE: 1 if the firm is audited by an industry specialist,and 0 otherwise;
Union: 1 if the firm has unionized labour, and 0otherwise;
Minju: 1 if the union of the firm is affiliated withMinju, and 0 otherwise;
Hanguk: 1 if the union of the firm is affiliated withHanguk, and 0 otherwise;
Nonaffiliated: 1 if the union of the firm is not affiliatedwith any federation, and 0 otherwise;
Size: Natural logarithm of total assets;Export: Ratio of export sales to total sales;Invrec: Sum of inventory and accounts receivables
divided by total assets;Lev: Total debt divided by total equity;Loss: 1 if the net income is negative, and 0 otherwise;ROA: Net income divided by total assets andConsol: 1 if the firm reports consolidated financial
statements, and 0 otherwise.
The dependent variables in Equations (1) and (2) areBIG (Big 4) and ISPE (industry specialist). Following theprior studies, we assess ISPE using two measures: auditfee and number of client (Craswell and Taylor 1991;DeFond, Francis, andWong 2010; Ferguson and Stokes2002; Craswell, Francis, and Taylor 1995). ISPE mea-sures are often criticized to be not clear whether themeasurements of industry specialist capture ‘auditing afew large clients’ or ‘auditing a large number of smallclient’ (Gramling and Stone 2001; Balsam, Krishnan,and Yang 2003). By including both size-weighted mea-sure (fee) and non-size-weighted measure (number ofclient) in ISPE assessment, we can mitigate this contro-versial issue (Ferguson and Stokes 2002). When deter-mining industry specialists, we eliminate industries with
6 J. R. CHUNG ET AL.
10 or fewer observations, consistent with Mayhew andWilkins (2003).
In model (1), the variable of interest is Union. If theexistence of union affects the choice of a Big 4 audit firm(BIG) or an industry specialist (ISPE), the coefficient β1will be significantly positive. Next, we classify the unionasMinju, Hanguk orNonaffiliated in model (2) and testthe impact of each union type on the auditor choice. Ifthe type of union (i.e. its aggressiveness) has a differen-tial effect on auditor choice compared to firms withoutunions, we predict significantly positive coefficients ofunion type (β1, β2 and β3) and further expect the mag-nitude of the coefficients to be β1 > β2 > β3.
In line with prior studies, we control for the firm-specific characteristics likely to affect auditor choice(Choi and Wong 2007; Simunic and Stein 1987; St.Pierre and Anderson 1984; Hope et al. 2007). First, wecontrol for firm scale and complexity using the follow-ing variables: firm size (Size), ratio of export sales to totalsales (Export), inventory and accounts receivables scaledby total asset (Invrec), and a dummy variable for report-ing consolidated financial statements (Consol). Thesefour variables capture the level of effort the auditorshould devote to ensure a desired level of audit assur-ance (Simunic and Stein 1987). We therefore expect thechoice of Big 4 and industry specialist auditors to bepositively associated with these control variables.
Next, we control for the possible impact of finan-cial distress on auditor’s litigation risk and eventualauditor choices (Choi and Wong 2007) using debt toequity ratio (Lev) and loss (Loss). Following priorstudies showing the risk avoidance strategy of largeauditors (Johnstone and Bedard 2004), we expect thetwo variables measuring financial distress to benegatively associated with the choice of Big 4 orindustry specialist auditors.
We then turn to the test of whether the union hasan impact on abnormal audit fees or audit hours.First, we estimate the normal audit fee and hourusing the model below:
AFEEit AHOURitð Þ ¼ αþ β1Sizeit þ β2Exportit
þ β3Levit þ β4Foreignit þ β5Consolit
þ β6Invrecit þ β7ROAit þ β8Lossit
þ β9Sgrowthit þ β10Issueit þ β11BIGit
þ Industry and Year dummyþ εit
(3)
whereAFEE: Natural logarithm of audit fees;AHOUR: Natural logarithm of audit hours;Size: Natural logarithm of total assets;Export: Ratio of export sales to total sales;Lev: Total debt divided by total equity;Foreign: 1 if foreign exchange profit or loss is more
than 0, and 0 otherwise;Consol: 1 if the firm reports consolidated financial
statements, and 0 otherwise;Invrec: Sum of inventory and accounts receivables
divided by total assets;ROA: Net income divided by total assets;Loss: 1 if the net income is negative, and 0 otherwise;Sgrowth: sales growth;Issue: 1 if the sum of debt or equity issued for the last
3 years is more than 5% of total assets, and 0otherwise and
BIG: 1 if the firm is audited by a Big 4 auditor, and 0otherwise.
Audit fees are a function of client size, clientcomplexity, client and auditor risk, and audit quality(e.g. Craswell and Francis 1999). We include Size toproxy for client size since the audit fee increases asthe client gets bigger (Palmrose 1986). Firm com-plexity (Export, Foreign, Consol and Invrec) is likelyto increase audit fees and audit hours. We theninclude ROA, Lev and Loss to proxy for firm risk,which will increase audit fees. A high growth firm(Sgrowth and Issue) has a greater demand for auditservices, thereby increasing audit fees (Choi andWong 2007; Choi, Kim, and Zang 2010). Finally, tocontrol for the impact of auditor characteristics, weinclude a Big 4 dummy variable (BIG).
Using this Equation (3), we estimate the predictedvalue ofAFEE (AHOUR), the normal audit fee (hour).We then calculate abnormal audit fees (ABFEE) bytaking the difference between actual audit fees (AFEE)and normal audit fees. Abnormal audit hours(ABHOUR) are obtained in a similar way.
We next regress the abnormal audit fees and audithours on the union variables and other control vari-ables to investigate unions’ effect on audit scope (oreffort), using Equations (4) and (5):
ABFEEit ABHOURitð Þ ¼ αþ β1Unionit þ β2Sizeit
þ β3Exportit þ β4Invrecit þ β5Levit
þ β6Lossit þ β7ROAit þ β8Iniit þ β9Consolit
þ β10BIGit þ Industry and Year dummyþ εit
(4)
APPLIED ECONOMICS 7
ABFEEit ABHOURitð Þ ¼ αþ β1Minjuit þ β2Hangukit
þ β3Nonaffiliatedit þ β4Sizeit þ β5Exportit
þ β6Invrecit þ β7Levit þ β8Lossit
þ β9ROAit þ β10Iniit þ β11Consolit
þ β12BIGit þ Industry and Year dummyþ εit
(5)
where
ABFEE: actual audit fees minus the normal level ofaudit fees;
ABHOUR: actual audit hours minus the normal levelof audit hours;
Ini: 1 for the first year of audit, and 0 otherwise andSee Equations (1) and (2) for the definitions ofother variables.
The variables of interest are Union in model (4)and Minju, Hanguk and Nonaffiliated in model (5).As mentioned, we estimate models (4) and (5) sepa-rately according to the sign of the abnormal auditfees and hours. If unionization increases (reduces),the abnormal audit fees or audit hours, the coeffi-cient β1 will be significantly positive (negative) inmodel (4). Furthermore, we investigate the impact ofunion types in model (5). In models (4) and (5), weinclude the same control variables used in models(1) and (2), and add two more indicator variables:one for the first year of audit (Ini) to control for thepossibility of lowballing (Simon and Francis 1988)and one for Big 4 (BIG) to control for the feedifference between Big 4 and non-Big 4 auditors(Craswell, Francis, and Taylor 1995). The definitionsof the variables are summarized in Table 1.
Sample selection
The initial sample comprises 6594 non-financialfirms listed on the Korean stock markets between2005 and 2008. We impose 2008 as the limit becauseunion data were no longer mandated in companies’annual reports starting 2009. Union data such asmembership and federation status are hand collectedfrom the companies’ annual reports.6 We retain onlyfirms having December fiscal year-ends to controlfor potential effects resulting from the difference in
fiscal year-ends. We also exclude firms whose finan-cial data are not available from the KIS-Value IIIdatabase, equivalent to Compustat in the U.S.Finally, we drop firms affiliated with both Minjuand Hanguk because they possess characteristics ofboth associations. This process yields a final sampleof 4568 companies, the union sample of which is1751 (38%) and the non-union sample 2817 (62%).Of the union sample, Minju and Hanguk firmsaccount for 457 (26%) and 1150 (66%), respectively,and the remaining 144 firms (8%) are not affiliatedwith Minju or Hanguk.7 The sample selection pro-cess is summarized in Table 2.
IV. Empirical results
Descriptive statistics
Table 3 summarizes the basic statistics for all vari-ables used in this study. Table 3 Panel A presents themean and median for the full sample as well as theunion sample and the non-Union sample. We focuson mean values in this discussion, as a discussion onmedian values would be virtually identical (with theexception of Invrec). The statistical significance ofthe mean differences between the Union and non-Union samples is reported in the Union column.Union firms are more likely to engage Big 4 auditfirms (BIG) than non-Union firms (65.3%versus49.4%). The auditor specialist variable (ISPE_Clientand ISPE_Fee) is significantly higher in the Unionsample. These results are consistent with the predic-tion that unionized firms tend to engage high-qual-ity auditors.
Abnormal audit fees (ABFEE) and audit hours(ABHOUR) are significantly higher in the non-Union group. The Union sample has a higher meanvalue of firm size (Size), ratio of export sales to totalsales (Export), audit complexity (Invrev), leverageratio (Lev), return on asset (ROA) and consolidatedfinancial statements (Consol), while it has a lowermean value for loss (Loss). These results suggest thatunionized firms are, on average, bigger, highly lever-aged, more complex and more profitable.
6We also collect data on the number of unionized employees and full-time union staff members, and test whether our results differ by including thesevariables. The untabulated results indicate that these variables are not statistically significant, while the variables of interest remain unchanged. This resultsuggests that in Korea, the affiliation with Minju or Hanguk better captures the union’s strength or negotiation power than the unionized ratio or numberof full-time union members.
7During the sample period, 49 firms established new unions, and 25 changed their associations; these account for about 1.6%of the total sample. Thesesuggest that firms rarely change their associations.
8 J. R. CHUNG ET AL.
In Table 3 Panel B, we use only unionized firms tocompare the mean and median of the variablesamong union groups (Minju, Hanguk andNonaffiliated). The Hanguk column contains thestatistical significance of differences in the meanand median between the Minju and Hanguk sam-ples. Similarly, the Nonaffiliated column includes thecomparisons between the Minju and Nonaffiliatedsamples. We find that 73.3%of the Minju sample isaudited by a Big 4 audit firm (BIG), while 63.1%ofthe Hanguk and 57.6%of the Nonaffiliated areaudited by a Big 4 auditor. Minju firms are alsomore likely to engage an industry specialist auditor(ISPE_Client) than Hanguk and Nonaffiliated firms.The Minju firms have, on average, greater abnormal
audit fees (ABFEE), audit hours (ABHOUR), firmsize (Size), leverage (Lev) and complexity (Invrev,Consol) than the other groups.
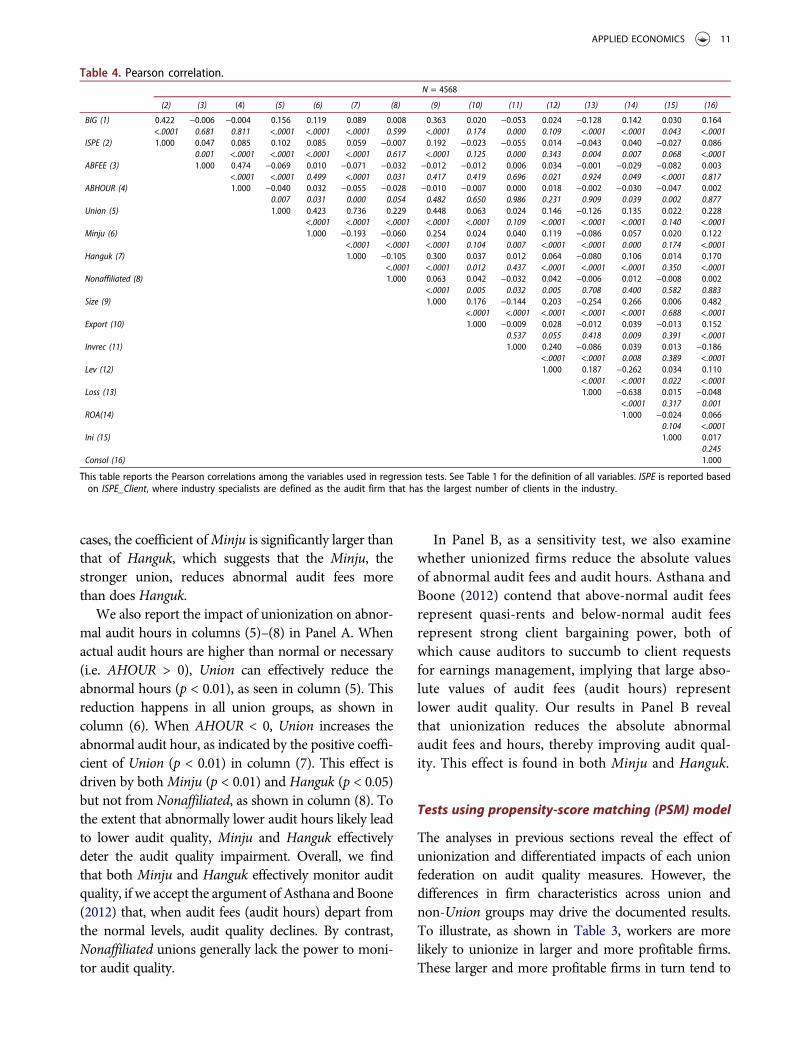
Table 4 reports Pearson correlations for the vari-ables used in our regression analyses. We find thatall union variables except for Nonaffiliated have sig-nificant and positive correlations with higher-qualityauditors (BIG, ISPE). These results provide anotherpiece of evidence that firms with affiliated unions aremore likely to hire a Big 4 or an industry specialistauditor. In addition, the abnormal audit fees andaudit hours are negatively correlated with theunion variables (Union, Hanguk and Nonaffiliated).
Regression results
Table 5 presents results of the tests where the auditfirm choice is regressed on union variables and otherdeterminants. Columns (1) and (2) report the unionimpact on the choice of a Big 4 auditor (BIG). Thecoefficient on Union in column (1) is positive butnot significant. We next assess the impact of eachunion group by replacing Union with Minju,Hanguk, and Nonaffiliated in column (2). We finda positive coefficient of Minju that is statisticallysignificant at p < 0.05, an insignificant coefficientof Hanguk, and a negative coefficient ofNonaffiliated that is significant at p < 0.05. Theseresults suggest that firms affiliated with Minju aremore likely to choose a Big 4 audit firm than non-Union firms, while those affiliated with Hanguk arenot. Surprisingly, firms with Nonaffiliated unions areless likely than firms without unions to hire a Big 4auditor. The insignificant coefficient of Union inmodel (1) is likely due to the result after cancellingout the two opposite effects of Minju andNonaffiliated.
In columns (3)–(6), we report the impact ofunions on the choice of industry specialist auditor(ISPE). Columns (3) and (4) show the regressionresults where the industry specialist classification isdefined by the number of audit clients. The variableof Union in column (3) is significantly positive(p < 0.05), suggesting that unionization positivelyaffects the choice of industry expert. In column (4),the coefficient of Minju is significantly positive(p < 0.01), that of Hanguk is positive but not sig-nificant and that of Nonaffiliated is negatively sig-nificant (p < 0.1).
Table 1. Definition of variables.Dependent VariablesBIG = 1 if the firm is audited by a Big 4 auditor, and 0
otherwise;ISPE_Client = 1 if the auditor has the largest number of clients in the
industry, 0 otherwiseindustry, and 0 otherwise;
ISPE_ Fee = 1 if the auditor has the largest market share of annualaudit revenue from clients in the industry, and 0otherwise;
Test VariablesUnion = 1 if the firm has unionized labour, and 0 otherwise;Minju = 1 if the union of the firm belongs to the Minju
Confederation of Korean Trade Union, and 0otherwise;
Hanguk = 1 if the union of the firm belongs to the HangukFederation of Korean Trade Union, and 0 otherwise;
Nonaffiliated = 1 if the union of the firm does not belong to anyfederation, and 0 otherwise;
ControlVariables
Size = Natural logarithm of total asset;Export = Ratio of export sales to total sales;Invrec = Sum of inventory and accounts receivables divided by
total assets;Lev = Total debt divided by total equity;Loss = 1 if the net income is negative, and 0 otherwise;ROA = Net income divided by total assets;Ini = 1 for the first year of audit, and 0 otherwise; andConsol = 1 if the firm reports consolidated financial statements,
and 0 otherwise.
Table 2. Sample selection procedure.Nonfinancial firms listed in Korea Stock Exchange and KOSDAQfrom 2005 to 2008
6594
Less: Firms with non-December fiscal year-end (287)Less: Firms without financial data in KIS-Value III (1709)Less: Firms affiliated with both Minju and Hanguk (30)Final sample 4568
Minju refers to the Minju Confederation of Korean Trade Union, and Hangukrefers to the Hanguk Federation of Korean Trade Union. Of the finalsample, the Union sample is 1751 and the non-Union sample is 2817.
APPLIED ECONOMICS 9
We apply another definition of industry specialist,based on audit fees, in columns (5) and (6). Theresults are similar to those reported in columns (3)and (4) with an exception of Union being insignif-icant. Overall, we find strong evidence that firmsaffiliated with Minju are more likely to hire a Big 4or an industry specialist auditor. Unexpectedly, firmswith Nonaffiliated unions (Nonaffiliated), relative tonon-Union firms, are less likely to engage a Big 4 oran industry specialist auditor. Regarding the controlvariables, the results indicate that the probability ofhiring a high-quality auditor is generally high infirms that are large in size, less complex measuredby export sales and less risky in terms of leverage.
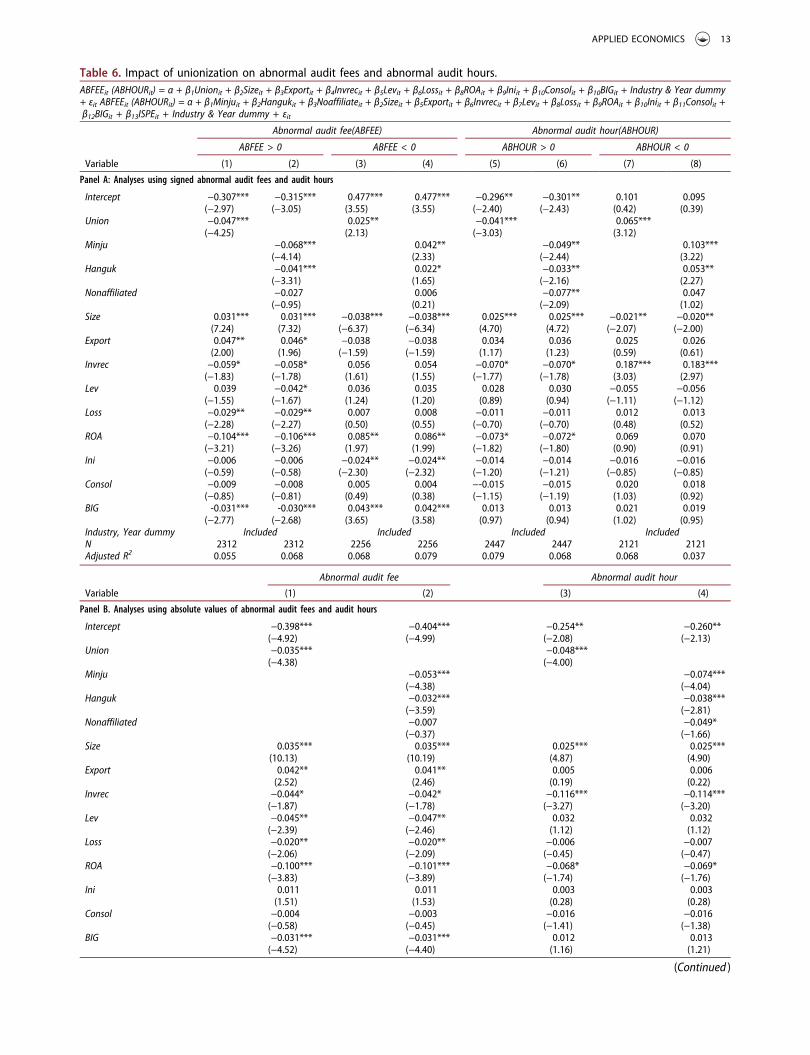
Table 6 shows results of testing the effects of unionson abnormal audit fees and audit hours. In Panel A, weconduct separate tests according to the sign of theabnormal audit fees and hours. The impact of
unionization on abnormal audit fees is reported incolumns (1)–(4). When actual audit fees are higherthan normal audit fees (i.e.ABFEE > 0),Union decreasesthe abnormal audit fee (p < 0.01) in column (1), and thisnegative effect of Union is driven by both Minju(p < 0.01) and Hanguk (p < 0.01), as shown in column(2). Nonaffiliated firms have no significant impact onthe abnormal audit fees. Collectively, these results sug-gest that bothMinju and Hanguk effectively reduce thepossibility of a loss of auditor independence, whilenonaffiliated unions do not.
When the actual audit fees are lower than normal (i.e.ABFEE < 0), Union increases abnormal audit fees incolumn (3), and this positive effect of Union also comesfrom bothMinju and Hanguk, as shown in column (4).This result suggests that bothMinju and Hanguk effec-tively prevent insufficient audits, while Nonaffiliateddoes not.We also find that, in both positive and negative
This table reports the descriptive statistics for the variables used in the regression tests. Panel A reports the mean and median values of the full sample, non-Union sample and Union sample.
*, ** and *** in the Union column indicate statistical significance of differences in the mean and median between the Union and non-Union samples at the10%, 5% and 1% levels, respectively, using t-test (mean) and Wilcoxon z-test (median).
Panel B reports the mean and median values of Minju, Hanguk and Nonaffiliated unions.*, **, *** in the Hanguk column indicate the statistical comparisons between the Minju and Hanguk samples.*, **, *** in the Nonaffiliated column indicate the statistical comparisons between the Minju and Nonaffiliated samples. See Table 1 for the definitions of thevariables.
10 J. R. CHUNG ET AL.
cases, the coefficient ofMinju is significantly larger thanthat of Hanguk, which suggests that the Minju, thestronger union, reduces abnormal audit fees morethan does Hanguk.
We also report the impact of unionization on abnor-mal audit hours in columns (5)–(8) in Panel A. Whenactual audit hours are higher than normal or necessary(i.e. AHOUR > 0), Union can effectively reduce theabnormal hours (p < 0.01), as seen in column (5). Thisreduction happens in all union groups, as shown incolumn (6). When AHOUR < 0, Union increases theabnormal audit hour, as indicated by the positive coeffi-cient of Union (p < 0.01) in column (7). This effect isdriven by bothMinju (p < 0.01) and Hanguk (p < 0.05)but not from Nonaffiliated, as shown in column (8). Tothe extent that abnormally lower audit hours likely leadto lower audit quality, Minju and Hanguk effectivelydeter the audit quality impairment. Overall, we findthat both Minju and Hanguk effectively monitor auditquality, if we accept the argument of Asthana and Boone(2012) that, when audit fees (audit hours) depart fromthe normal levels, audit quality declines. By contrast,Nonaffiliated unions generally lack the power to moni-tor audit quality.
In Panel B, as a sensitivity test, we also examinewhether unionized firms reduce the absolute valuesof abnormal audit fees and audit hours. Asthana andBoone (2012) contend that above-normal audit feesrepresent quasi-rents and below-normal audit feesrepresent strong client bargaining power, both ofwhich cause auditors to succumb to client requestsfor earnings management, implying that large abso-lute values of audit fees (audit hours) representlower audit quality. Our results in Panel B revealthat unionization reduces the absolute abnormalaudit fees and hours, thereby improving audit qual-ity. This effect is found in both Minju and Hanguk.
Tests using propensity-score matching (PSM) model
The analyses in previous sections reveal the effect ofunionization and differentiated impacts of each unionfederation on audit quality measures. However, thedifferences in firm characteristics across union andnon-Union groups may drive the documented results.To illustrate, as shown in Table 3, workers are morelikely to unionize in larger and more profitable firms.These larger and more profitable firms in turn tend to
Lev (12) 1.000 0.187 −0.262 0.034 0.110<.0001 <.0001 0.022 <.0001
Loss (13) 1.000 −0.638 0.015 −0.048<.0001 0.317 0.001
ROA(14) 1.000 −0.024 0.0660.104 <.0001
Ini (15) 1.000 0.0170.245
Consol (16) 1.000
This table reports the Pearson correlations among the variables used in regression tests. See Table 1 for the definition of all variables. ISPE is reported basedon ISPE_Client, where industry specialists are defined as the audit firm that has the largest number of clients in the industry.
APPLIED ECONOMICS 11
hire high-quality auditors. Therefore, other factors (i.e.size, profitability) may affect both choice variables ofunionization and high-quality auditors. To address thisendogeneity issue, we retest our hypotheses by employ-ing a PSM model.
First, we calculate the unionization propensityscore (predicted values) from a logistic regressionthat estimates the probability of being a unionizedfirm using determinants such as firm size (the nat-ural log of total assets and number of employees),profitability (ROA), solvency and liquidity measures(leverage, cash flow from operation, current ratio)and growth opportunity (market to book ratio).Then we match each Union sample (N = 1751) to anon-Union sample based on the closest propensityscore using caliper distance of 3%, without replace-ment (Lawrence, Minutti-Meza, and Zhang 2011;Minutti-Meza 2013). To check the appropriatenessof the matching process, we compare the basic sta-tistics of Union and non-Union matched sample
using Paired t-test. The results indicate that there isno significant difference between two groups in allcontrol variables used in main model as well as inthe variables used in propensity score estimation.
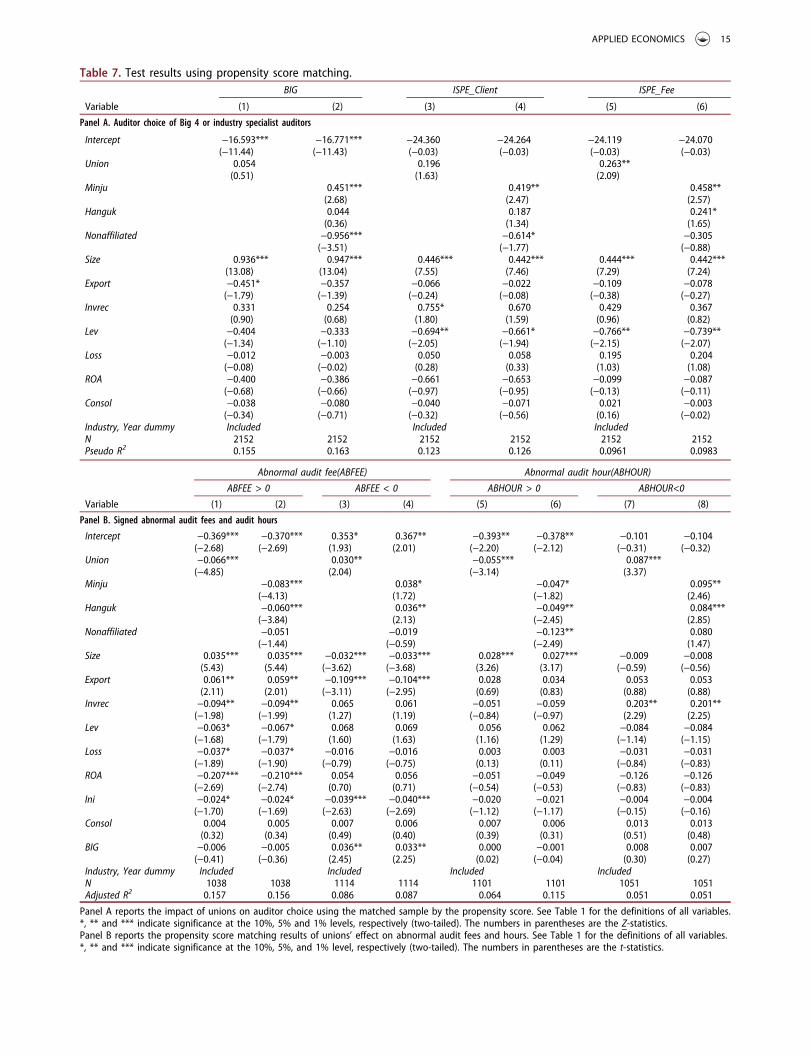
Table 7 Panel A displays the impact of union-ization on auditor choice. We generally find resultssimilar to those documented in previous sections.More specifically, firms with Minju increase the like-lihood of choosing Big 4 or industry specialists,while those with Nonaffiliated decrease the likeli-hood or have no effect. Table 7 Panel B reports theeffects of unions on positive and negative abnormalaudit fees and audit hours. The results are qualita-tively the same as the main results. Most impor-tantly, we continue to find that unions affiliatedwith Minju, the strongest unions, effectively reduce(increase) the positive (negative) abnormal portionof audit fees/hours, even in PSM regressions. Theseresults reinforce the findings of the previoussections.
Industry, Year dummy Included Included IncludedN 4568 4568 4568 4568 4568 4568Pseudo R2 0.158 0.160 0.110 0.112 0.0801 0.0823
This table reports the results of estimating the auditor choice as a function of unions and other determinants. Column (1) reports the impact of unionizationon the choice of Big 4 auditors, and Columns (3) and (5) report the impact of unionization on the choice of industry specialist auditors. Columns (2), (4) and(6) report the different impacts of each Federation of Trade Union (Minju, Hanguk and Nonaffiliated) on auditor choices of Big 4 or industry specialistauditors. See Table 1 for the definition of all variables.
*, ** and *** indicate significance at the 10%, 5% and 1% levels, respectively (two-tailed). The numbers in parentheses are the Z-statistics.
BIG −0.031*** −0.031*** 0.012 0.013(−4.52) (−4.40) (1.16) (1.21)
(Continued )
APPLIED ECONOMICS 13
Tests including corporate governance
As another sensitivity test, we also explore whethercorporate governance moderates the associationbetween unions and audit quality. We use firm-levelcorporate governance scores (CGS) as a proxy forcorporate governance. CGS is announced on an annualbasis by Korea Corporate Governance Service (KCGS),a non-profit organization. We conduct tests with 2030samples where CGS are available. In our main regres-sions, we add highcgs variable which indicates 1 if CGSis above median value, and 0 otherwise.
The untabulated analyses indicate that interactionterms of main independent variables (Union, Minju,Hanguk and Nonaffiliated) and highcgs are in generalinsignificant, which suggests that corporate govern-ance does not have additional impact on the relationbetween union and high-quality auditors. We alsofind only weak evidence that the high level of govern-ance positively affects the association between Minjuand abnormal audit fee, but not in the case of abnor-mal audit hours. One limitation using CGS as a proxyfor governance is that CGS is only available in firmsthat have above-average governance score, whichcauses our study to suffer from a selection bias.
We further test using other proxies suggested byprior studies including institutional investors, manage-ment ownership and ratio of independent board ofdirectors. However, we fail to find any conclusive resultsfor these tests. Collectively, we do not find any strongmoderate effect of corporate governance in the relationbetween unions and auditor choice/audit quality.
Tests to address econometric issues
The same firm appears multiple times in our researchwindow since the unit of analysis in our tests is a firm-
year rather than a unique firm, which implies that theremay exist issues of heteroscedasticity and autocorrela-tion. To address these issues, we rerun all tests usingNewey–West standard errors (Newey and West 1987).Untabulated results reveal that our inferences remainunchanged.
V. Conclusion
This article investigates the association betweenunions and external audits, particularly the choiceof Big 4 or industry specialist auditors. We also testthe association between unions and abnormal auditfees and audit hours. To gain ascendancy in wagenegotiations with management, unions try to obtainquality information, while management is reluctantto share inside information. We posit that strongunions will more successfully push management toselect high-quality auditors and to demand high-quality audit services.
Using Korean unique data, we find that unionsaffiliated with Minju (the strongest unions) posi-tively affect the choice of Big 4/industry specialistauditor, while unions without any affiliation (theweakest) negatively affect this choice. Unions asso-ciated with Hanguk (modest unions) have no impacton the choice of Big 4 auditor/industry specialist.
Moreover, Minju reduces (increases) positive(negative) abnormal audit fees and hours. Theseresults hold even after we control for firm character-istics using a PSM. Hanguk also generally reducesabnormal audit fees and hours, although the influ-ence is not as strong as Minju. The overall resultssuggest that the strongest unions increase audit qual-ity, while the most management-friendly unions, thenonaffiliated ones, do not. Hanguk in some senseincreases audit quality, but less than Minju.
Table6. (Continued).
Industry, Year dummy Included IncludedN 4568 4568 4568 4568Adjusted R2 0.059 0.059 0.036 0.037
Panel A reports the results of estimating abnormal audit fees and audit hours as a function of unions and other determinants. Columns (1) and (3) report theimpact of unionization on abnormal audit fees when the abnormal audit fee is positive and negative, respectively. Columns (5) and (7) report theunionization impact on abnormal audit hours when the abnormal audit hour is positive and negative, respectively. Columns (2) and (4) report thedifferential impacts of each Federation of Trade Union (Minju/Hanguk) on abnormal audit fees when the abnormal audit fee is positive and negative,respectively. Columns (6) and (8) report the impact of union types on abnormal audit hours when the abnormal audit fee is positive and negative,respectively. See Table 1 for the definitions of all variables.
*, ** and *** indicate significance at the 10%, 5%, and 1% levels, respectively (two-tailed). The numbers in parentheses are the t-statistics.In Panel B, we use absolute values of abnormal audit fees and hours as dependent variables for the tests. See Table 1 for the definitions of all variables.*, ** and *** indicate significance at the 10%, 5% and 1% levels, respectively (two-tailed). The numbers in parentheses are the t-statistics.
14 J. R. CHUNG ET AL.
Table 7. Test results using propensity score matching.BIG ISPE_Client ISPE_Fee
Variable (1) (2) (3) (4) (5) (6)
Panel A. Auditor choice of Big 4 or industry specialist auditors
Industry, Year dummy Included Included Included IncludedN 1038 1038 1114 1114 1101 1101 1051 1051Adjusted R2 0.157 0.156 0.086 0.087 0.064 0.115 0.051 0.051
Panel A reports the impact of unions on auditor choice using the matched sample by the propensity score. See Table 1 for the definitions of all variables.*, ** and *** indicate significance at the 10%, 5% and 1% levels, respectively (two-tailed). The numbers in parentheses are the Z-statistics.Panel B reports the propensity score matching results of unions’ effect on abnormal audit fees and hours. See Table 1 for the definitions of all variables.*, ** and *** indicate significance at the 10%, 5%, and 1% level, respectively (two-tailed). The numbers in parentheses are the t-statistics.
APPLIED ECONOMICS 15
This study extends the literature by examininghow the union, an important information usergroup, affects external audit quality and, ultimately,financial reporting quality. These results that strongunions play a monitoring role help investors evalu-ate the quality of a firm’s financial reporting. Ourresults suggest that a firm’s financial information ismore likely to be of high quality if the firm hasstrong unions. In addition, our results that unionsadd values to firms by enhancing monitoring maychange regulators’ prior belief about unions, whichin turn influences their policy towards unions.
As common in archival studies, this study alsohas some limitations, which also offer futureresearch opportunities. First, we acknowledge thatother factors, such as the number of strikes andtheir duration or unions’ demanded wage levels,could serve as better proxies than the membershipof specific federation used in this study for unionstrength. However, data unavailability prevented usfrom performing such tests. Second, unknown firmcharacteristics may affect both unionization andaudit quality. Despite our efforts to minimize thispossibility, we are unable to rule out all possibili-ties. Given that we are unable to provide directevidence that unions actually participate in audit-related decisions, results documented in our studyare of limited value. Finally, this study examinesunions’ impact on auditor choice, audit fee andaudit hours, all of which are audit inputs(DeFond, Erkens, and Zhang 2014). Future studiescould investigate the impact of unions on auditquality using output measures of audits (e.g. qualityof financial reporting or restatement).
Disclosure statement
No potential conflict of interest was reported by the authors.
Funding
The authors received no financial support for the research,authorship and/or publication of this article.
References
Abbott, L., S. Parker, G. Peters, and K. Raghunandan. 2003.“The Association between Audit CommitteeCharacteristics and Audit Fees.” Auditing: A Journal of
Practice and Theory 22 (2): 17–32. doi:10.2308/aud.2003.22.2.17.
Appelbaum, E., and L. Hunter. 2004. “Union Participation inStrategic Decisions of Corporations.” In Emerging LaborMarket Institutions for the Twenty-First Century, 265–292.National Bureau of Economic Research.
Asthana, S. C., and J. P. Boone. 2012. “Abnormal Audit Feeand Audit Quality.” Auditing: A Journal of Practice &Theory 31 (3): 1–22. doi:10.2308/ajpt-10294.
Balsam, S., J. Krishnan, and J. Yang. 2003. “Auditor IndustrySpecialization and Earning Quality.” Auditing: A Journalof Practice and Theory 22 (2): 71–97. doi:10.2308/aud.2003.22.2.71.
Banning, K., and T. Chiles. 2007. “Trade-Offs in the LaborUnion-CEO Compensation Relationship.” Journal ofLabor Research 28 (2): 347–357.
Behn, B., J. H. Choi, and T. Kang. 2008. “Audit Quality andProperties of Analyst Earnings Forecasts.” The AccountingReview 83 (2): 327–359. doi:10.2308/accr.2008.83.2.327.
Blanchflower, D., G. A. Oswald, and P. Sanfey. 1996. “Wages,Profits, and Rent-Sharing.” The Quarterly Journal ofEconomics 111 (1): 227–251. doi:10.2307/2946663.
Blankley, A. I., D. Hurtt, and J. MacGregor. 2012. “AbnormalAudit Fees and Restatements.” Auditing: A Journal ofPractice & Theory 31 (1): 79–96. doi:10.2308/ajpt-10210.
Bova, F. 2013. “Labor Unions and Management’s Incentiveto Signal a Negative Outlook.” Contemporary AccountingResearch 30: 14–41. doi:10.1111/care.2013.30.issue-1.
Caramanis, C., and C. Lennox. 2008. “Audit Effort andEarnings Management.” Journal of Accounting andEconomics 45 (1): 116–138. doi:10.1016/j.jacceco.2007.05.002.
Carcello, J., D. Hermanson, T. Neal, and R. Riley Jr. 2002.“Board Characteristics and Audit Fees.” ContemporaryAccounting Research 19 (3): 365–384. doi:10.1506/CHWK-GMQ0-MLKE-K03V.
Chen, H., M. Kacperczyk, and H. Ortiz-Molina. 2011. “LaborUnions, Operating Flexibility, and the Cost of Equity.”Journal of Financial and Quantitative Analysis 46 (1):25–58. doi:10.1017/S0022109010000645.
Chen, H., M. Kacperczyk, and H. Ortiz-Molina. 2012. “DoNon-financial Stakeholders Affect Agency Costs of Debt?Evidence from Unionized Workers.” Review of Finance 16(2): 347–383. doi:10.1093/rof/rfq028.
Choi, C. S., P. Sohn, and J. Y. Seo. 2016. “Relationshipbetween Leverage and the Bargaining Power of LaborUnions: Evidence from Theoretical and EmpiricalPerspectives.” Estudios de Economía 43 (1): 53–69.doi:10.4067/S0718-52862016000100003.
Choi, J., J. Kim, and Y. Zang. 2010. “Do Abnormally HighAudit Fees Impair Audit Quality?” Auditing: A Journal ofPractice & Theory 29 (2): 115–140. doi:10.2308/aud.2010.29.2.115.
Choi, J., and T. Wong. 2007. “Auditors’ GovernanceFunctions and Legal Environments: An InternationalInvestigation.” Contemporary Accounting Research 24 (1):13–46. doi:10.1506/X478-1075-4PW5-1501.
Chung, R., B. B. Lee, W. J. Lee, and B. C. Sohn. 2016. “DoManagers Withhold Good News from Labor Unions?”Management Science 62 (1): 46–68.
Chyz, J. A., W. S. C. Leung, O. Z. Li, and O. M. Rui. 2013.“Labor Unions and Tax Aggressiveness.” Journal ofFinancial Economics 108 (3): 675–698. doi:10.1016/j.jfineco.2013.01.012.
Connolly, R., B. Hirsch, and M. Hirschey. 1986. “Union RentSeeking, Intangible Capital, and the Market Value of theFirm.” Review of Economics and Statistics 68: 567–577.doi:10.2307/1924515.
Craswell, A., and J. Francis. 1999. “Pricing Initial AuditEngagements: A Test of Competing Theories.” TheAccounting Review 74: 201–216. doi:10.2308/accr.1999.74.2.201.
Craswell, A., J. Francis, and S. Taylor. 1995. “Auditor BrandName Reputation and Industry Specialization.” Journal ofAccounting and Economics 20: 297–322. doi:10.1016/0165-4101(95)00403-3.
Craswell, A., and S. L. Taylor. 1991. “The Market Structure ofAuditing in Australia: The Role of Industry Specialization.”Research in Accounting Regulation 5 (1): 55–77.
Croson, R. T. 1996. “Information in Ultimatum Games: AnExperimental Game.” Journal of Economic Behavior andOrganization 30: 197–212. doi:10.1016/S0167-2681(96)00857-8.
Cullinan, C., and J. Knoblett. 1994. “Unionization andAccounting Policy Choices: An Empirical Examination.”Journal of Accounting and Public Policy 13 (1): 49–78.doi:10.1016/0278-4254(94)90012-4.
D’Souza, J., J. Jacob, and K. Ramesh. 2001. “The Use ofAccounting Flexibility to Reduce Labor RenegotiationCosts and Manage Earnings.” Journal of Accounting andEconomics 30 (2): 187–208. doi:10.1016/S0165-4101(01)00004-0.
DeAngelo, H., and L. DeAngelo. 1991. “Union Negotiationsand Corporate Policy: A Study of Labor Concessions inthe Domestic Steel Industry during the 1980s.” Journal ofFinancial Economics 30 (1): 3–43.
DeAngelo, L. 1981. “Auditor Size and Audit Quality.” Journalof Accounting and Economics 3 (3): 183–199. doi:10.1016/0165-4101(81)90002-1.
DeFond, M., and J. Zhang. 2014. “A Review of ArchivalAuditing Research.” Journal of Accounting andEconomics 58(2-3): 275-326..
DeFond, M. L., D. H. Erkens, and J. Zhang. 2014. “Do ClientCharacteristics Really Drive the Big N Audit QualityEffect? New Evidence from Propensity Score Matching.”Management Science 62 (9): 1–24.
DeFond, M. L., J. R. Francis, and T. J. Wong. 2010. “AuditorIndustry Specialization and Market Segmentation:Evidence from Hong Kong.” Auditing: A Journal ofPractice and Theory 19 (1): 49–66. doi:10.2308/aud.2000.19.1.49.
Dye, R. 1991. “Informationally Motivated AuditorReplacement.” Journal of Accounting and Economics 14(4): 347–374. doi:10.1016/0165-4101(91)90008-C.
Dye, R. 1993. “Auditing Standards, Legal Liability, andAuditor Wealth.” Journal of Political Economy 101: 887–914. doi:10.1086/261908.
Eshleman, J. D., and P. Guo. 2014. “Abnormal Audit Feesand Audit Quality: The Importance of consideringManagerial Incentives in Tests of EarningsManagement.” Auditing: A Journal of Practice & Theory33 (1): 117–138. doi:10.2308/ajpt-50560.
Faleye, O., V. Mehrotra, and R. Morck. 2006. “When LaborHas a Voice in Corporate Governance.” Journal ofFinancial and Quantitative Analysis 41 (3): 489–510.doi:10.1017/S0022109000002519.
Farber, D. B., H. Hsieh, B. Jung, and H. Yi. 2012. “The Impactof Non-Financial Stakeholders on AccountingConservatism: The Case of Labor Unions.” IndianaUniversity Kelley School of Business IndianapolisWorking paper .
Ferguson, A., and D. Stokes. 2002. “Brand Name AuditPricing, Industry Specialization, and Leadership PremiumPost-Big 8 and Big 6 Mergers.” Contemporary AccountingResearch 19 (1): 77–110. doi:10.1506/VF1T-VRT0-5LB3-766M.
Fortin, S., and J. Pittman. 2007. “The Role of Auditor Choice inDebt Pricing in Private Firms.” Contemporary AccountingResearch 24 (3): 859–896. doi:10.1506/car.24.3.8.
Francis, J., D. Philbrick, and K. Schipper. 1994. “ShareholderLitigation and Corporate Disclosures.” Journal ofAccounting Research 32 (2): 137–164. doi:10.2307/2491279.
Gramling, A. A., and D. N. Stone. 2001. “Audit Firm IndustryExpertise: A Review and Synthesis of the ArchivalLiterature.” Journal of Accounting Literature 20: 1–29.
Grout, P. 1984. “Investment and Wages in the Absence ofBinding Contracts: A Nash Bargaining Approach.”Econometrica: Journal of the Econometric Society 52: 449–460. doi:10.2307/1911498.
Hamm, S. J. W., B. Jung, and W. J. Lee. 2013. “Labor Unionand Income Smoothing”, Ohio State University FisherColleage of Business Working paper.
Hilary, G. 2006. “Organized Labor and InformationAsymmetry in the Financial Markets.” Review ofAccounting Studies 11 (4): 525–548. doi:10.1007/s11142-006-9015-y.
Hirsch, B. 1991. “Union Coverage and Profitability among U.S. Firms.” The Review of Economics and Statistics 73: 69–77. doi:10.2307/2109688.
Hirsch, B. 1992. “Firm Investment Behavior and CollectiveBargaining Strategy.” Industrial Relations 31: 95–121.
Hope, O., T. Kang, W. Thomas, and Y. Yoo. 2007. “Cultureand Auditor Choice: A Test of the Secrecy Hypothesis.”Journal of Accounting and Public Policy 27 (5): 357–373.doi:10.1016/j.jaccpubpol.2008.07.003.
Hribar, P., T. Kravet, and R. Wilson. 2014. “A New Measureof Accounting Quality.” Review of Accounting Studies 19(1): 506–538. doi:10.1007/s11142-013-9253-8.
Jensen, M. C., and W. H. Meckling. 1976. “Theory of theFirms: Managerial Behavior, Agency Costs and Ownership
Structure.” Journal of Financial and Economics 3 (4): 305–360. doi:10.1016/0304-405X(76)90026-X.
Johnstone, K., and J. Bedard. 2004. “Audit Firm PortfolioManagement Decisions.” Journal of Accounting Research42 (4): 659–690. doi:10.1111/j.1475-679X.2004.00153.x.
Khurana, I., and K. Raman. 2004. “Litigation Risk and theFinancial Reporting Credibility of Big 4 versus Non-Big 4Audits: Evidence from Anglo-American Countries.” TheAccounting Review 79 (2): 473–495. doi:10.2308/accr.2004.79.2.473.
Kinney, W. R., Jr., and R. Libby. 2002. “Discussion of theRelation between Auditors’ Fees for Nonaudit Services andEarnings Management.” The Accounting Review 77(Supplement): 107–114. doi:10.2308/accr.2002.77.s-1.107.
Klasa, S., W. Maxwell, and H. Ortiz-Molina. 2009. “The StrategicUse of Corporate CashHoldings in Collective Bargaining withLabor Unions.” Journal of Financial Economics 92 (3): 421–442. doi:10.1016/j.jfineco.2008.07.003.
Kleiner, M., and M. Bouillon. 1988. “Providing BusinessInformation to Production Workers: Correlates ofCompensation and Profitability.” Industrial and LaborRelations Review 41 (4): 605–617. doi:10.1177/001979398804100409.
Korea Labor Institute. 2008. “Business Panel Research.”http://www.kli.re.kr [Printed in Korean].
Korean Ministry of Employment and Labor. 2008. “LaborWhite Paper.” http://www.kli.re.kr [Printed in Korean].
Lawrence, A., M. Minutti-Meza, and P. Zhang. 2011. “CanBig 4 versus Non-Big 4 Differences in Audit-QualityProxies Be Attributed to Client Characteristics?” TheAccounting Review 86 (1): 259–286. doi:10.2308/accr.00000009.
Lennox, C. 1999. “Audit Quality and Auditor Size: AnEvaluation of Reputation and Deep PocketsHypothesiss.” Journal of Business Finance & Accounting26 (7): 779–805. doi:10.1111/1468-5957.00275.
Leung, W., O. Li, and O. Rui. 2009. “Labor Union andAccounting Conservatism.” Working paper.
Liberty, S., and J. Zimmerman. 1986. “Labor Union ContractNegotiations and Accounting Choices.” The AccountingReview 61 (4): 692–712.
Matsa, D. 2010. “Capital Structure as a Strategic Variable:Evidence from Collective Bargaining.” The Journal ofFinance 65 (3): 1197–1232. doi:10.1111/j.1540-6261.2010.01565.x.
Mautz, R., and F. Richardson. 1992. “Employer FinancialInformation and Wage Bargaining: Issues and Evidence.”Labor Studies Journal 17 (3): 35–52.
Mayhew, B., and M. Wilkins. 2003. “Audit Firm IndustrySpecialization as a Differentiation Strategy: Evidence from
Fees Charged to Firms Going Public.” Auditing: A Journalof Practice & Theory 22 (2): 33–52. doi:10.2308/aud.2003.22.2.33.
Minutti-Meza, M. 2013. “Does Auditor IndustrySpecialization Improve Audit Quality?” Journal ofAccounting Research 51 (4): 779–817.
Newey, W., and K. West. 1987. “A Simple, PositiveSemidefinite, Heteroscedasticity and AutocorrelationConsistent Covariance Matrix.” Econometrica 55: 703–708. doi:10.2307/1913610.
Palmrose, Z. 1986. “Audit Fees and Auditor Size: FurtherEvidence.” Journal of Accounting Research 24: 97–110.doi:10.2307/2490806.
Picconi, M., and J. Reynolds. 2013. “Do Auditors Know Morethan the Market?” Colleage of William and Mary Workingpaper.
Reynolds, L. 1978. Labor Economics and Labor Relations. 7thed. Englewood Cliffs, NJ: Prentice-Hall.
Ruback, R., and M. Zimmerman. 1984. “Unionization andProfitability: Evidence from the Capital Market.” Journalof Political Economy 92 (6): 1134–1157. doi:10.1086/261278.
Scott, T. 1994. “Incentives and Disincentives for FinancialDisclosure: Voluntary Disclosure of Defined BenefitPension Plan Information from Canadian Firms.” TheAccounting Review 69 (1): 26–43.
Simon, D., and J. Francis. 1988. “The Effect of AuditorChange on Audit Fee: Tests of Price Cutting and PriceRecovery.” The Accounting Review 63 (2): 255–269.
Simunic, D. 1980. “The Pricing of Audit Service: Theory andEvidence.” Journal of Accounting Research 18 (Spring):161–190. doi:10.2307/2490397.
Simunic, D., and M. Stein. 1987. Product Differentiationin Auditing: A Study of Auditor Choice in the Marketfor Unseasoned New Issues. Vancouver, BC: TheCanadian Certified General Accountants’ ResearchFoundation.
St. Pierre, K., and J. Anderson. 1984. “An Analysis of FactorsAssociated with Lawsuits Against Public Accountants.”The Accounting Review 59 (2): 242–263.
Tackett, J., F. Wolf, and G. Claypool. 2004. “Sarbanes-Oxleyand Audit Failure.” Managerial Auditing Journal 19 (3):340–350. doi:10.1108/02686900410524355.
Teoh, S., and T. Wong. 1993. “Perceived Auditor Quality andthe Earning Response Coefficient.” The Accounting Review68 (2): 346–366.
Yoon, C., and D. Lee. 2008. “A Study on the Effect ofCollectivism on Union Militancy among Union Leaders.”Korean Human Resource Management Journal 32 (2): 23–53. [Printed in Korean].