Page 1
THE IMPACT OF LEADERSHIP PRACTICES ON SERVICE QUALITY IN PRIVATE
HIGHER EDUCATION IN SOUTH AFRICA
by
Riaan Dirkse van Schalkwyk
Submitted in fulfilment of the requirements for
the degree of
MASTER OF COMMERCE
in the subject
Business Management
at the
UNIVERSITY OF SOUTH AFRICA
SUPERVISORS: Mrs A. Davis and Prof. R. Pellissier
November 2011
Page 2
ii
ABSTRACT
The purpose of this study was to to investigate the impact of leadership practices on
service quality in private higher education in South Africa as a source of competitive
advantage. Higher education institutions and, more specifically, private higher education
institutions, have faced increasing pressure on many fronts in recent years. These
pressures include increased competition, lack of support from key constituencies, an
increase in the size and diversity of the student population, dealing with changing
technology, increased calls for accountability, a higher demand for quality by all the
stakeholders involved, more responsibility for research and teaching and greater
emphasis on efficient and effective management. The literature review for this study
suggested that leadership impacts positively on quality and, equally important, on
service quality. The academic leaders at these institutions have a tremendous influence
on the quality of the education provided and the service rendered to the growing
number of students. Using a quantitative methodology and a cross-sectional survey
research design, this study was conducted on five campuses of a prominent private
higher education provider across South Africa using two survey instruments. The
Leadership Practices Inventory (LPI) questionnaire was utilised to conduct the
leadership survey while the SERVQUAL instrument was applied in the service quality
survey. The campus principals of the five campuses and some of their selected
subordinates completed the LPI survey. The SERVQUAL questionnaires were
completed by 984 students from the five campuses. Correlation analysis was the major
statistical tool used to analyse the data. The findings of the study indicated a strong
positive linear correlation between the leadership practices of principals and service
quality to students at these institutions.
Page 3
iii
LIST OF ABBREVIATIONS
CFA - Confirmatory factor analysis
CHE - Council on Higher Education
CK scale - Conger-Kanungo scale
DoE - Department of Education
EFQM - European Foundation for Quality Management
EQA - European Quality Award
FET - Further Education and Training
GET - General Education and Training
GTL - Global Transformational Leadership scale
HE - Higher education
HEdPERF - Higher education performance only
HEQC - Higher Education Quality Committee
HET - Higher education and training
HWI - Historically white institutions
ISO - Organisation for International Standards
LAI - Leader Assessment Inventory
LPI - Leadership Practices Inventory
MBNQA - Malcolm Baldrige National Quality Award
MLQ - Multifactor Leadership Questionnaire
Page 4
iv
NCHE - National Commission on Higher Education
NQF - National Qualifications Framework
NSC - National Senior Certificate
PHE - Private higher education
SADC - Southern African Development Community
SAQA - South African Qualifications Authority
SARU - Southern African Universities Association
SERVQUAL - Service Quality Measurement Instrument
TLI - Transformational Leadership Behaviour Inventory
TLQ - Transformational Leadership Questionnaire
TQM - Total quality management
TQS - Total quality service
TVET - Technical and vocational education and training institutes
USA - United States of America
This study focuses on the impact of leadership practices on service quality in private
higher education (PHE) in South Africa. A well-known brand of a prominent service
provider in the field was selected for the study. The brand, as well as the service
provider, will remain anonymous for the purpose of the study. To ensure confidentiality,
the brand will be referred to as “The College”.
Page 5
v
ACKNOWLEDGEMENTS
I wish to express my sincere gratitude to those who assisted me with the compilation of
this dissertation.
In particular, I would like to thank the following:
• My study leaders, Mrs A. Davis and Prof. R. Pellissier, for their enthusiasm, advice,
assistance and guidance
• Dr Felicity Coughlan, for her willingness to share her experience and viewpoints
with me
• My employer, for providing the opportunity and tools to conduct this study
• Prof. R.J. Steenkamp, for his encouragement, motivation and belief that I could
accomplish this, in the midst of numerous pressures
• My family, Elouise, Hein and Elri, for all their support and understanding
Page 6
vi
DEDICATION
To my Lord and Saviour, all the honour and glory
To my wife, Elouise, for all her love, support and encouragement
To my children, Hein and Elri, for their love
To my parents, for their support
To the late Dr Charles Freysen, for his encouragement and contribution to private
higher education in South Africa
Page 7
vii
DECLARATION
I, the undersigned, declare that this dissertation, “The impact of leadership practices on
service quality in private higher education in South Africa”, is my own work, and that all
the sources I have used or cited have been indicated and acknowledged by means of
complete references.
______________________ ________________ __
Riaan Dirkse van Schalkwyk November 2011
Page 8
viii
Table of Contents
1.CHAPTER 1: INTRODUCTION AND BACKGROUND ................................................. 1
1.1 BACKGROUND ..................................................................................................... 2
1.2 PROBLEM STATEMENT ....................................................................................... 7
1.3 RESEARCH STATEMENT .................................................................................... 8
1.4 RESEARCH OBJECTIVES .................................................................................... 8
1.4.1 Primary objective ............................................................................................. 8
1.4.2 Secondary objectives ....................................................................................... 8
1.5 LITERATURE STUDY............................................................................................ 9
1.5.1 Introduction ...................................................................................................... 9
1.5.2 Definitions of leadership and service quality .................................................. 10
1.6 RESEARCH DESIGN .......................................................................................... 22
1.6.1 Empirical research ......................................................................................... 22
1.6.2 Research population ...................................................................................... 25
1.7 DATA ANALYSIS ................................................................................................. 26
1.8 LIMITATIONS OF THE RESEARCH ................................................................... 26
1.9 VALUE OF THE RESEARCH .............................................................................. 27
1.10 CHAPTER LAYOUT........................................................................................... 28
1.11 CHAPTER CONCLUSION ................................................................................. 29
2.CHAPTER 2: THE PHE ENVIRONMENT IN SOUTH AFRICA .................................. 30
2.1 INTRODUCTION ................................................................................................. 30
2.3 HE IN SOUTH AFRICA ........................................................................................ 33
2.3.1 The HE environment ...................................................................................... 33
2.3.2 Governance of HE ......................................................................................... 34
2.3.3 Challenges of HE ........................................................................................... 35
Page 9
ix
2.4 PHE IN SOUTH AFRICA ..................................................................................... 39
2.4.1 The PHE environment ................................................................................... 39
2.4.2 Governance of PHE ....................................................................................... 41
2.4.3 The student and product profile in PHE ......................................................... 43
2.4.4 The institutional profile of PHE ....................................................................... 44
2.4.5 Public-private partnerships ............................................................................ 48
2.4.6 The geographic location of PHE institutions .................................................. 49
2.4.7 For-profit nature of PHE ................................................................................. 51
2.4.8 Service quality and leadership ....................................................................... 53
2.5 CHAPTER CONCLUSION ................................................................................... 54
3.CHAPTER 3: SERVICE QUALITY ............................................................................. 55
3.1 INTRODUCTION ................................................................................................ 55
3.2 QUALITY ............................................................................................................. 57
3.2.1 Overview of quality ........................................................................................ 57
3.2.2 A brief history of quality ................................................................................. 60
3.2.3 The benefits of quality .................................................................................... 61
3.2.4 Theories on quality ........................................................................................ 63
3.2.5 Core quality variables of various quality experts ............................................ 65
3.3 QUALITY MANAGEMENT ................................................................................... 66
3.3.1 Approaches to quality .................................................................................... 66
3.4 SERVICES ........................................................................................................... 70
3.4.1 Service defined .............................................................................................. 71
3.4.2 Management of services ................................................................................ 72
3.4.3 Service characteristics ................................................................................... 75
3.4.4 Conceptual frameworks for analysing the service encounter ......................... 78
Page 10
x
3.5 SERVICE QUALITY ............................................................................................. 81
3.5.1 Service quality defined ................................................................................... 81
3.5.2 Service quality dimensions ............................................................................ 81
3.5.3 The importance of service quality .................................................................. 85
3.6 SERVICE QUALITY MODELS ............................................................................. 90
3.6.1 Technical and functional quality model (SQ1) ................................................ 91
3.6.2 The gap model (SQ2) .................................................................................... 92
3.6.3 Attribute service quality model (SQ3) ............................................................ 95
3.6.4 Synthesised model of service quality (SQ4) .................................................. 97
3.6.5 Performance only model (SQ5) ..................................................................... 99
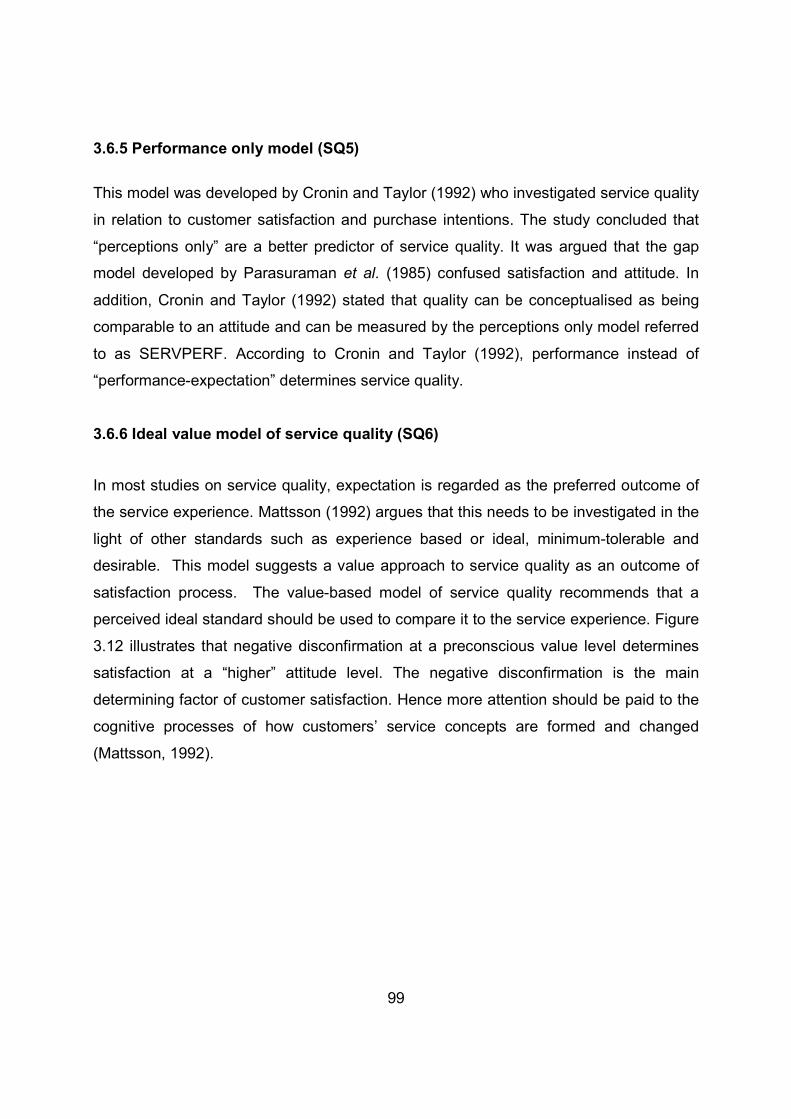
3.6.6 Ideal value model of service quality (SQ6)..................................................... 99
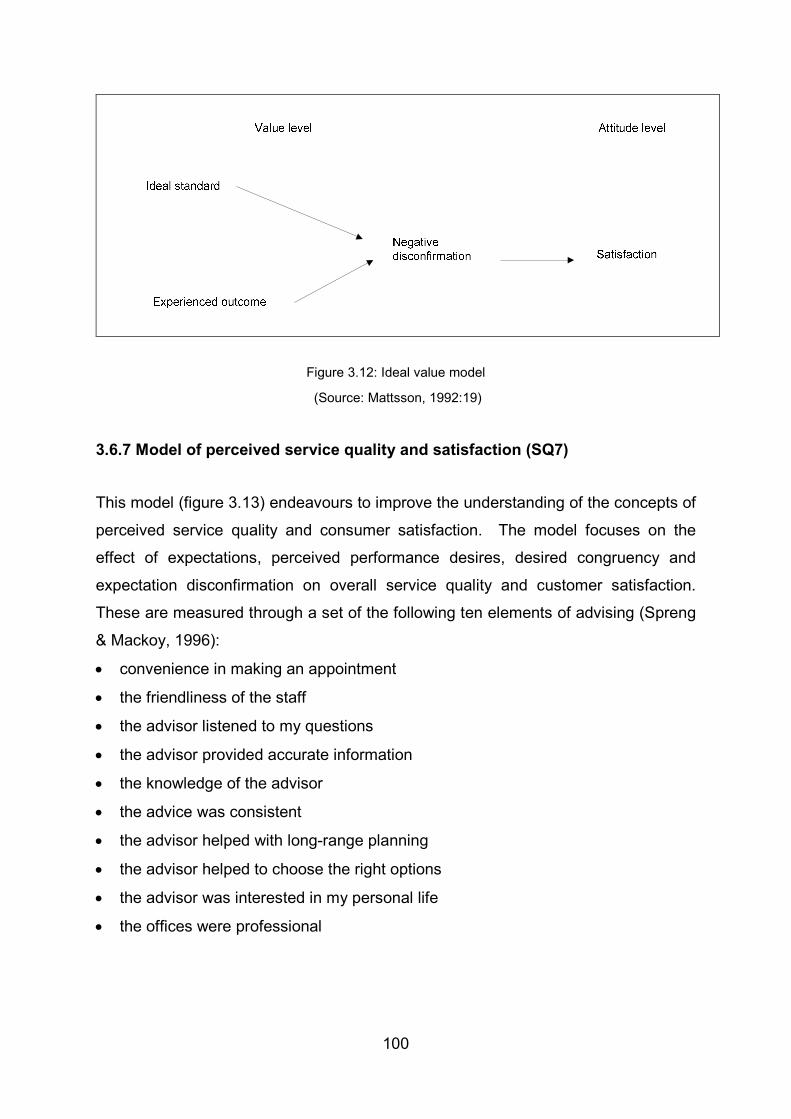
3.6.7 Model of perceived service quality and satisfaction (SQ7) .......................... 100
3.6.8 PCP attribute model (SQ8) .......................................................................... 101
3.6.9 Summary and comparison of service quality models ................................... 102
3.7 SERVQUAL ....................................................................................................... 106
3.7.1 The history of SERVQUAL ........................................................................... 107
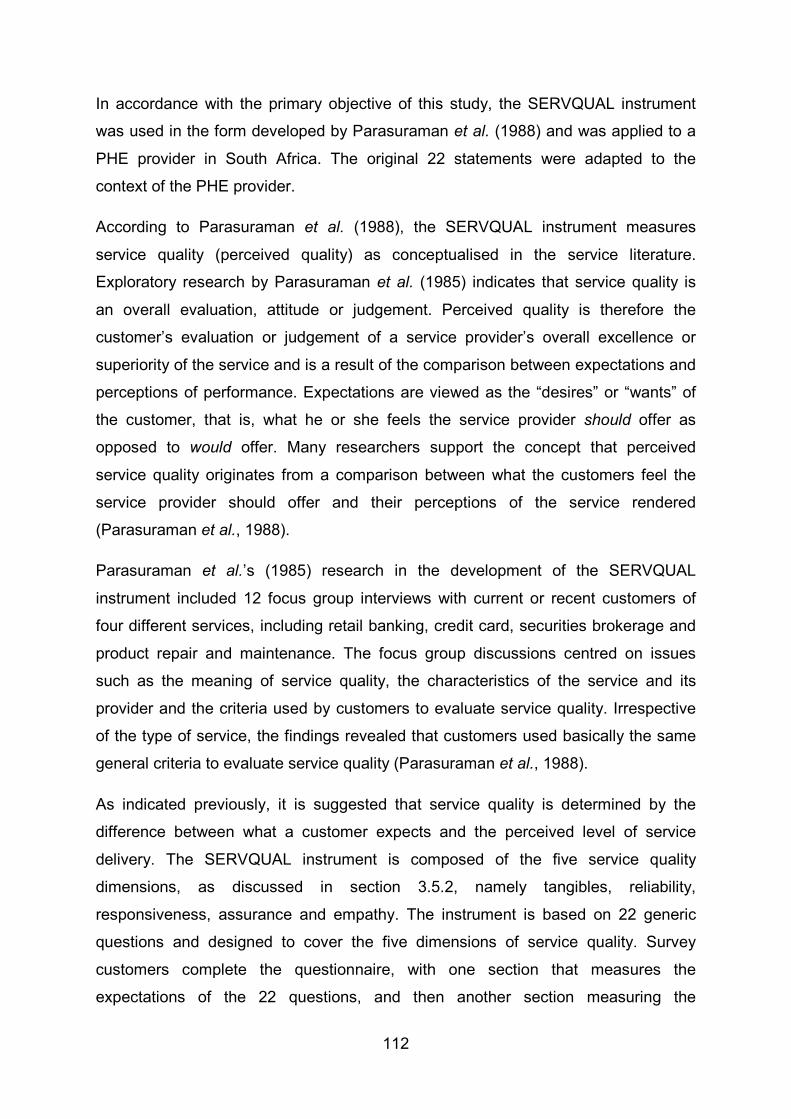
3.7.2 The SERVQUAL instrument ........................................................................ 110
3.7.3 Service quality gaps ..................................................................................... 114
3.7.4 Criticisms of SERVQUAL ............................................................................. 115
3.7.5 Applications of SERVQUAL ......................................................................... 116
3.7.6 HEdPERF .................................................................................................... 118
3.7.7 SERVQUAL versus SERVPERV ................................................................. 119
3.8 CHAPTER CONCLUSION ................................................................................. 121
4.CHAPTER 4: LEADERSHIP .................................................................................... 122
4.1 INTRODUCTION ............................................................................................... 122
Page 11
xi
4.2 LEADERSHIP .................................................................................................... 124
4.2.1 Definitions of leadership .............................................................................. 125
4.2.2 Leadership and management ...................................................................... 126
4.2.3 Leadership effectiveness ............................................................................. 129
4.2.4 Leadership skills .......................................................................................... 130
4.2.5 Leadership responsibilities........................................................................... 131
4.3 LEADERSHIP THEORIES ................................................................................. 133
4.3.1 Traditional leadership theories ..................................................................... 134
4.3.2 Modern leadership theories ......................................................................... 135
4.4 LEADERSHIP STYLES...................................................................................... 138
4.5 LEADERSHIP AND QUALITY ........................................................................... 140
4.5.1 THE MBNQA ............................................................................................... 142
4.5.2 The EFQM ................................................................................................... 143
4.5.3 ISO 9000:2008 ............................................................................................. 145
4.5.4 Total quality management (TQM) ................................................................ 146
4.6 LEADERSHIP AND SERVICE QUALITY ........................................................... 147
4.7 LEADERSHIP IN HE .......................................................................................... 149
4.8 LEADERSHIP MEASUREMENT INSTRUMENTS ............................................. 152
4.8.1 The Multifactor Leadership Questionnaire (MLQ) ........................................ 153
4.8.2 The Transformational Leadership Behaviour Inventory (TLI) ....................... 153
4.8.3 The Leader Assessment Inventory (LAI) ..................................................... 154
4.8.4 The Follower Belief Questionnaire and the Attributes of Leader Behaviour
Questionnaire ....................................................................................................... 154
4.8.5 The Conger-Kanungo (CK) scale ................................................................. 154
4.8.6 The Transformational Leadership Questionnaire (TLQ) .............................. 155
Page 12
xii
4.8.7 The Global Transformational Leadership (GTL) scale ................................. 155
4.9 THE LEADERSHIP PRACTICES INVENTORY (LPI) ........................................ 155
4.9.1 History of the LPI ......................................................................................... 156
4.9.2 The LPI instrument ...................................................................................... 157
4.9.3 Application of the LPI instrument ................................................................. 158
4.10 CHAPTER CONCLUSION ............................................................................... 159
5.CHAPTER 5: RESEARCH DESIGN......................................................................... 161
5.1 INTRODUCTION ............................................................................................... 161
5.2 RESEARCH STRATEGY ADOPTED ................................................................ 163
5.3 DATA COLLECTION METHOD ......................................................................... 165
5.3.1 The questionnaires ...................................................................................... 165
5.3.2 The SERVQUAL survey .............................................................................. 173
5.3.3 The LPI survey ............................................................................................. 177
5.3.4 Pretesting ..................................................................................................... 179
5.4 DATA ANALYSIS ............................................................................................... 179
5.5 RESEARCH QUALITY ....................................................................................... 182
5.6 DELIMITATIONS ............................................................................................... 185
5.7 RESEARCH ETHICS ......................................................................................... 186
5.8 CHAPTER CONCLUSION ................................................................................. 187
6.CHAPTER 6: FINDINGS .......................................................................................... 188
6.1 INTRODUCTION ............................................................................................... 188
6.2 RELIABILITY ANALYSIS ................................................................................... 190
6.3 DESCRIPTIVE STATISTICS ............................................................................. 191
6.3.1 Programme enrolled for and year of study ................................................... 191
6.3.2 Service quality expectations versus service quality perceptions .................. 193
Page 13
xiii
6.4 SERVQUAL: GAP ANALYSIS ........................................................................... 194
6.4.1 Gap analysis: Campus 1 .............................................................................. 194
6.4.2 Gap analysis: Campus 2 .............................................................................. 199
6.4.3 Gap analysis: Campus 3 .............................................................................. 203
6.4.4 Gap analysis: Campus 4 .............................................................................. 207
6.4.5 Gap analysis: Campus 5 .............................................................................. 211
6.4.6 Gap analysis: all campuses ......................................................................... 215
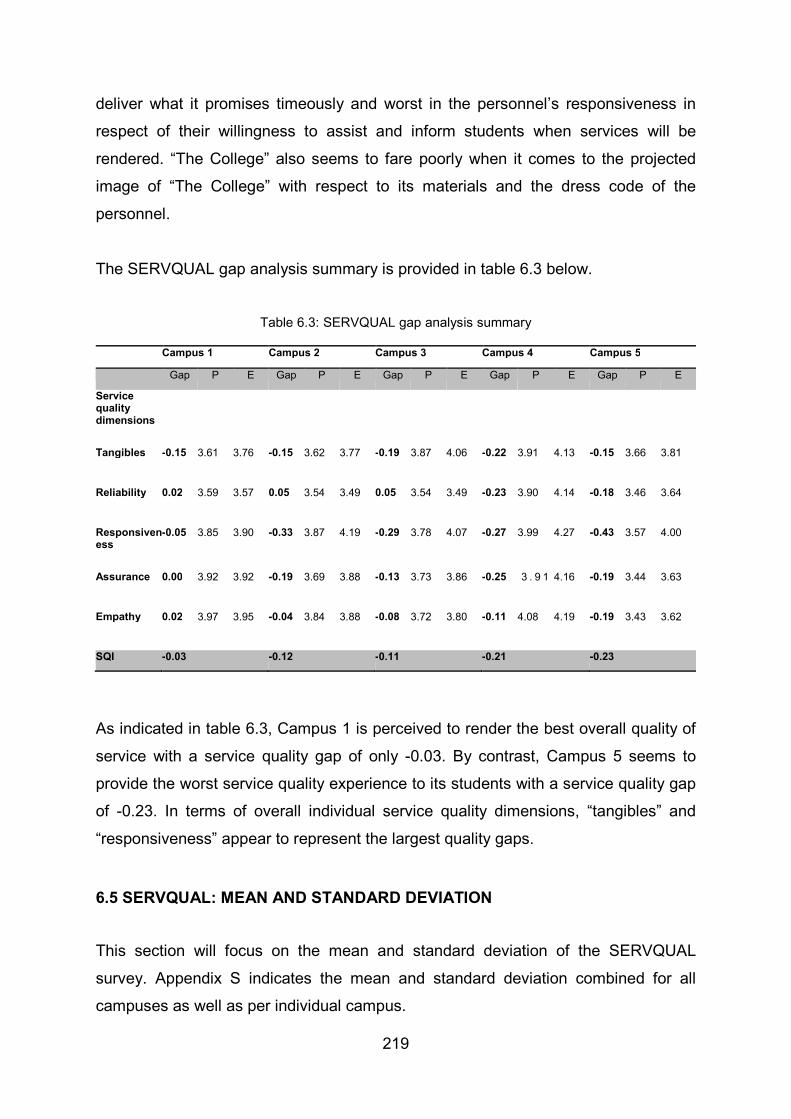
6.5 SERVQUAL: MEAN AND STANDARD DEVIATION .......................................... 219
6.6 CORRELATION ANALYSIS ............................................................................... 222
6.7 LPI DATA SUMMARY ........................................................................................ 223
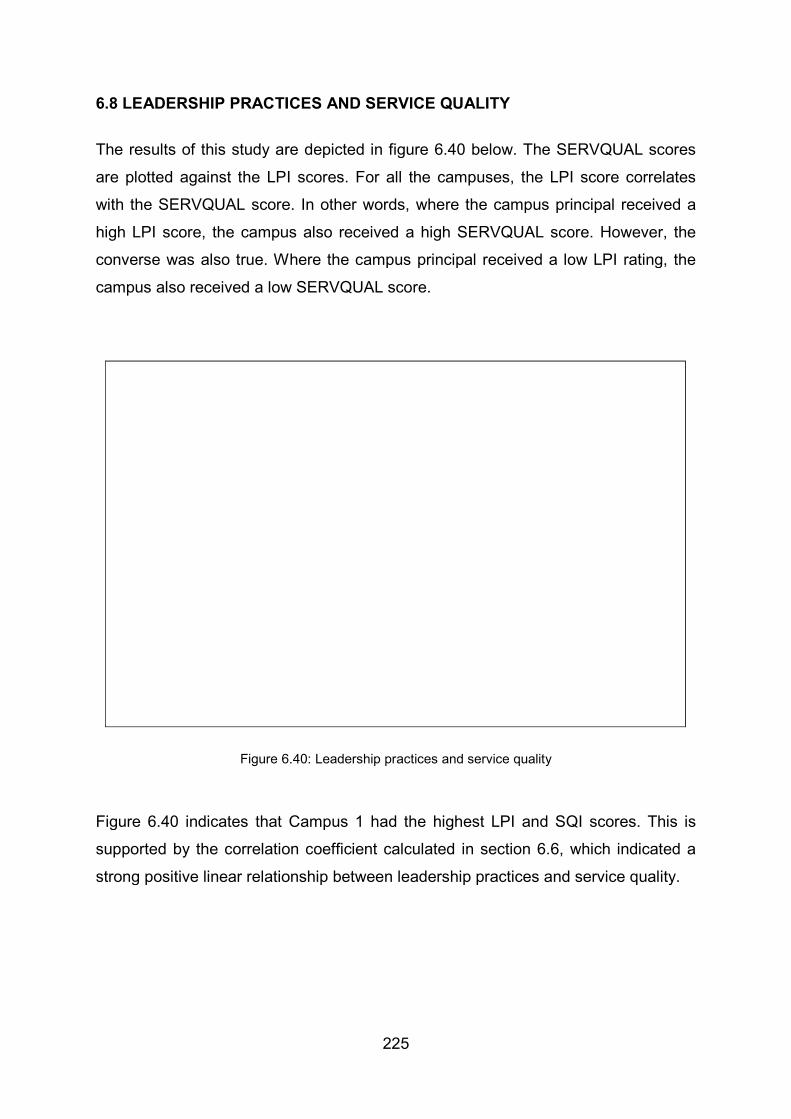
6.8 LEADERSHIP PRACTICES AND SERVICE QUALITY ..................................... 225
6.9 CHAPTER CONCLUSION ................................................................................. 226
7.CHAPTER 7: CONCLUSIONS AND RECOMMENDATIONS .................................. 227
7.1 INTRODUCTION ............................................................................................... 227
7.2 FINDINGS .......................................................................................................... 230
7.2.1 Primary objective ......................................................................................... 231
7.2.2 Secondary objectives ................................................................................... 231
7.3 RELIABILITY AND VALIDITY OF THE RESEARCH ......................................... 234
7.4 DELIMITATIONS ............................................................................................... 234
7.5 LIMITATIONS .................................................................................................... 235
7.6 RESEARCH CONCLUSIONS AND RECOMMENDATIONS ............................. 236
8.REFERENCES ......................................................................................................... 241
Page 14
xiv
APPENDICES
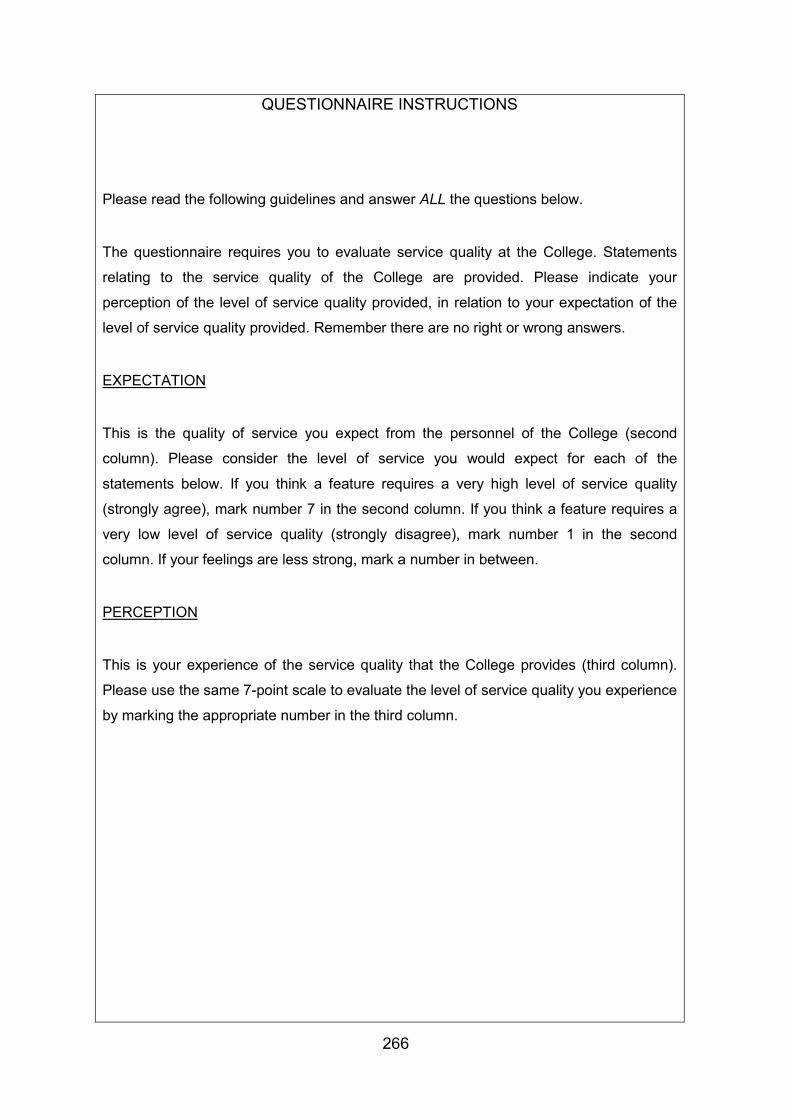
Appendix A: SERVQUAL ............................................................................................ 263
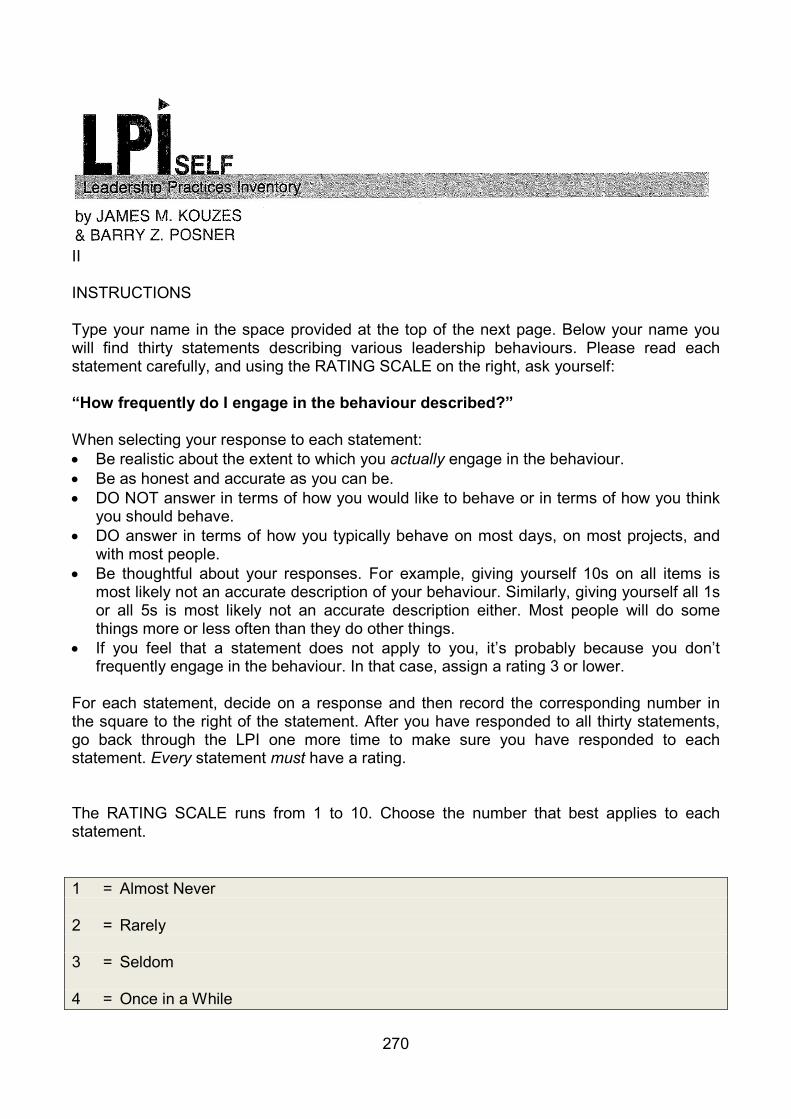
Appendix B: “LPI self” .................................................................................................. 269
Appendix C: “LPI observer” ......................................................................................... 273
Appendix D: Leadership Practices Inventory (LPI) invitation letter .............................. 278
Appendix E: Campus 1 – the five practices data summary ......................................... 281
Appendix F: Campus 2 – the five practices data summary ......................................... 283
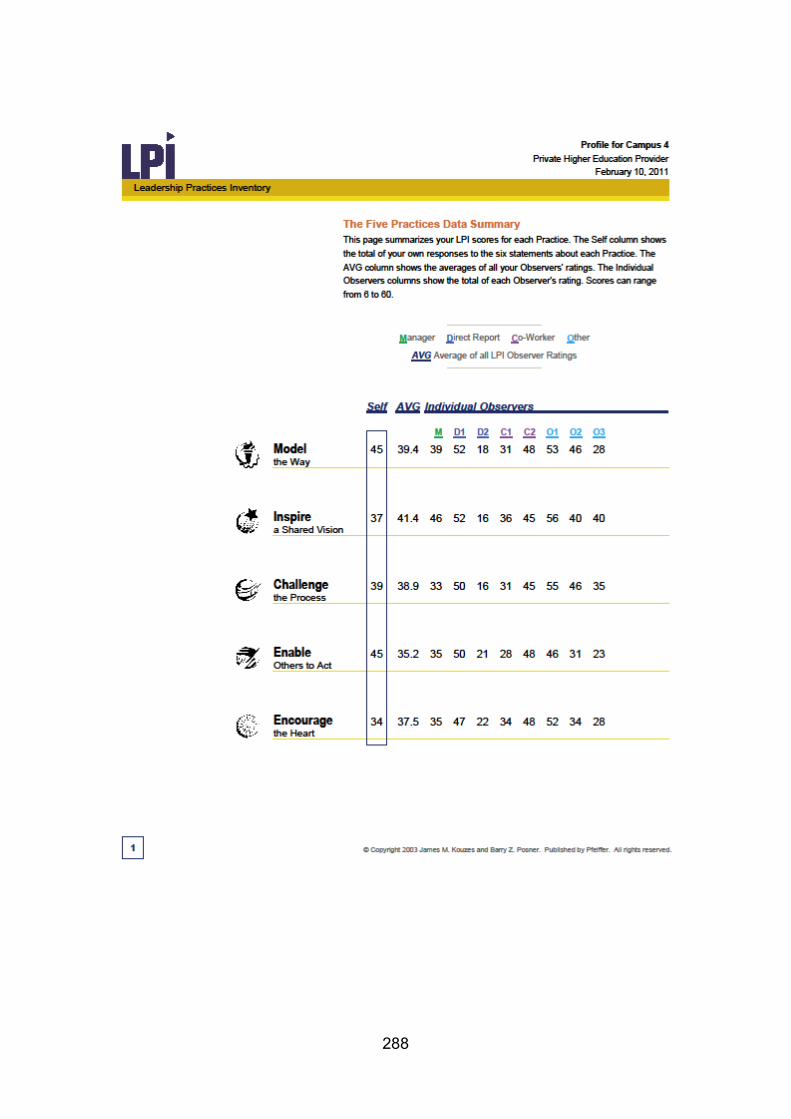
Appendix G: Campus 3 – the five practices data summary ......................................... 285
Appendix H: Campus 4 – the five practices data summary ......................................... 287
Appendix I: Campus 5 – the five practices data summary........................................... 289
Appendix J: Programme enrolled for and year of study............................................... 291
Appendix K: Service quality expectation ..................................................................... 295
Appendix L: Service quality perception ....................................................................... 298
Appendix M: Gap analysis of all campuses across all dimensions .............................. 301
Appendix N: Gap analysis of all dimensions across Campus 1 ................................... 303
Appendix O: Gap analysis of all dimensions across Campus 2 .................................. 305
Appendix P: Gap analysis of all dimensions across Campus 3 ................................... 307
Appendix Q: Gap analysis of all dimensions across Campus 4 .................................. 309
Appendix R: Gap analysis of all dimensions across Campus 5 ................................... 311
Appendix S: Mean and standard deviation .................................................................. 313
Page 15
xv
LIST OF FIGURES
Figure 1.1: Layout of chapter 1 ....................................................................................... 1
Figure 1.2: Gaps and the service quality model ............................................................ 15
Figure 2.1: Layout of chapter 2 ..................................................................................... 31
Figure 2.2: PHE subsectors in South Africa .................................................................. 46
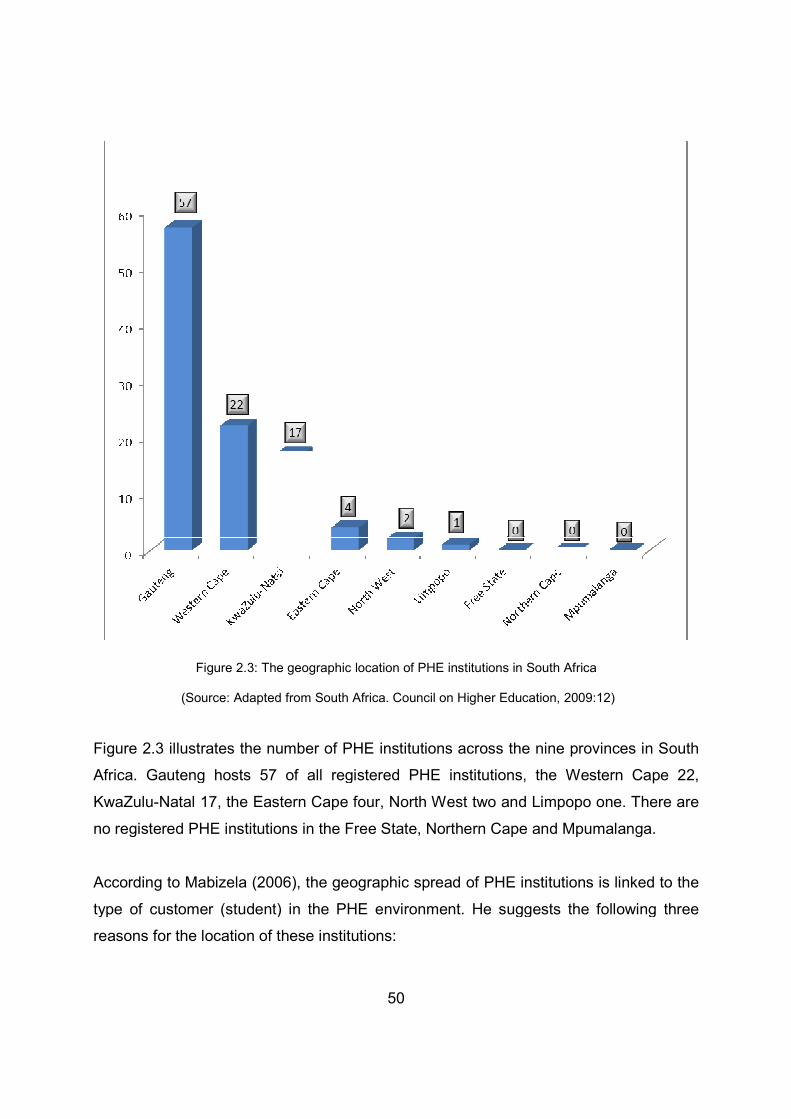
Figure 2.3: The geographic location of PHE institutions in South Africa........................ 50
Figure 3.1: Layout of chapter 3 ..................................................................................... 56
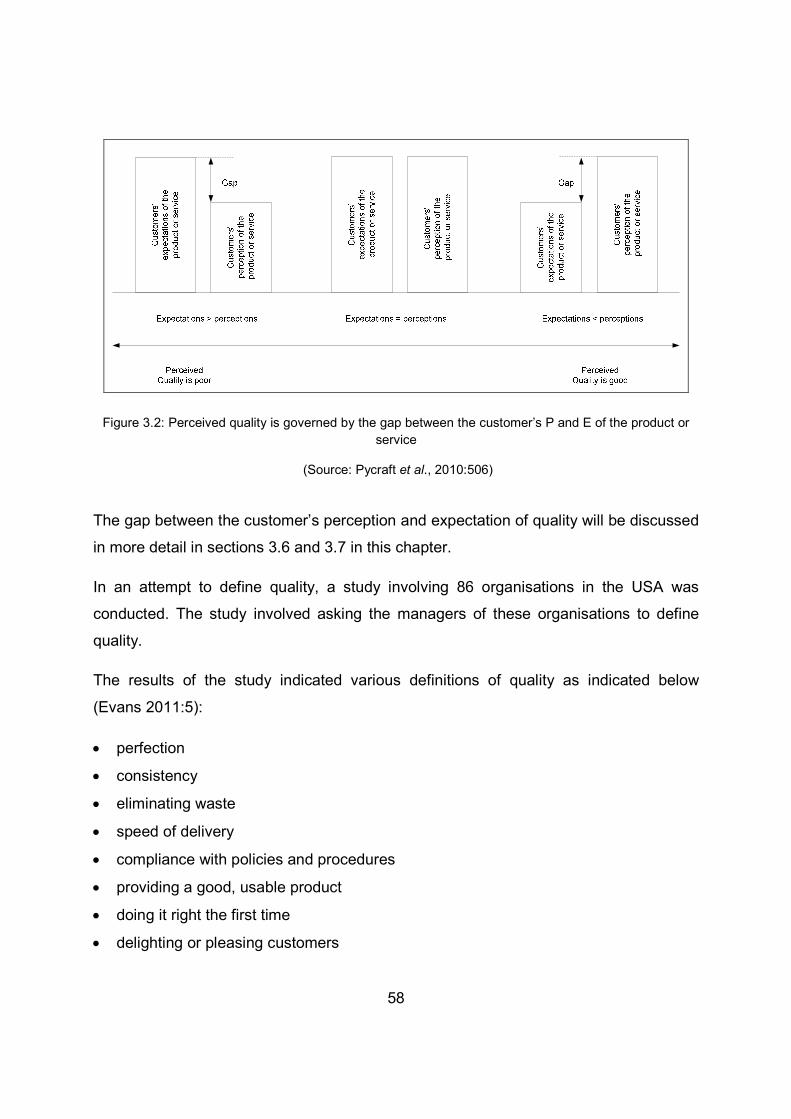
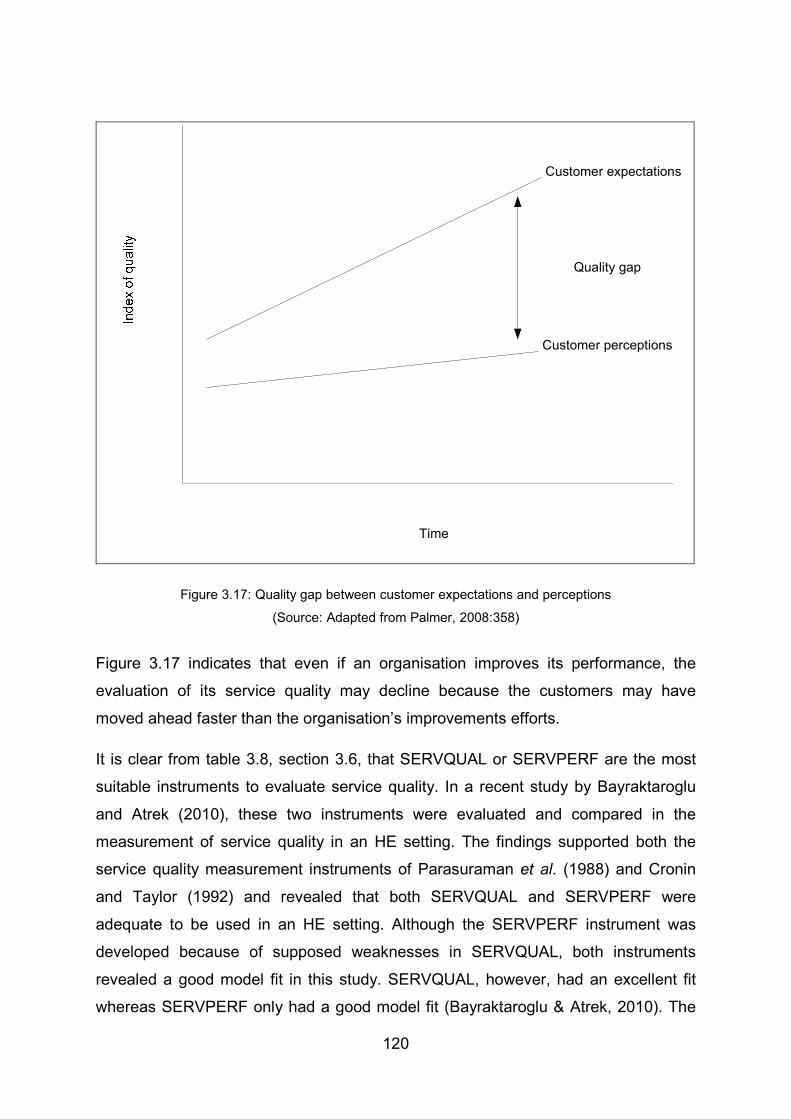
Figure 3.2: Perceived quality is governed by the gap between the customer’s P and E of
the product or service .................................................................................................... 58
Figure 3.3: Higher quality has a beneficial effect on both revenue and costs ............... 62
Figure 3.4: Framework for understanding environment-user relationships in service
organisations ................................................................................................................. 79
Figure 3.5: The five service quality dimensions ............................................................. 83
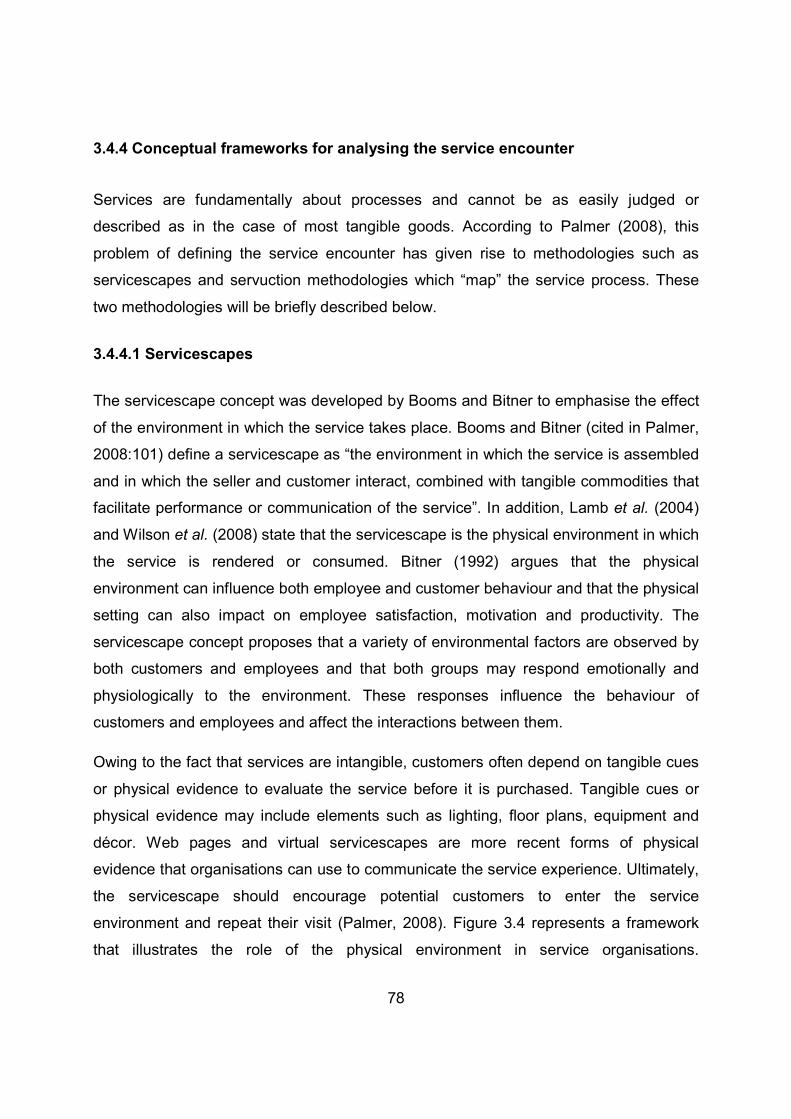
Figure 3.6: The service-profit chain ............................................................................... 87
Figure 3.7: Cut-off point of service quality improvements.............................................. 89
Figure 3.8: Consumers’ perception of technical and functional quality .......................... 92
Figure 3.9: Gaps and the service quality model ............................................................ 94
Figure 3.10: Attribute service quality model .................................................................. 96
Figure 3.11: A synthesised service quality model ......................................................... 98
Figure 3.12: Ideal value model .................................................................................... 100
Figure 3.13: Perceived quality and satisfaction model ................................................ 101
Figure 3.14: PCP attribute model ................................................................................ 102
Figure 3.15: Summary of the steps in developing the service quality scale ................ 111
Figure 3.16: Gaps 1 to 5 .............................................................................................. 114
Figure 3.17: Quality gap between customer expectations and perceptions ................ 120
Page 16
xvi
Figure 4.1: Layout of chapter 4 ................................................................................... 123
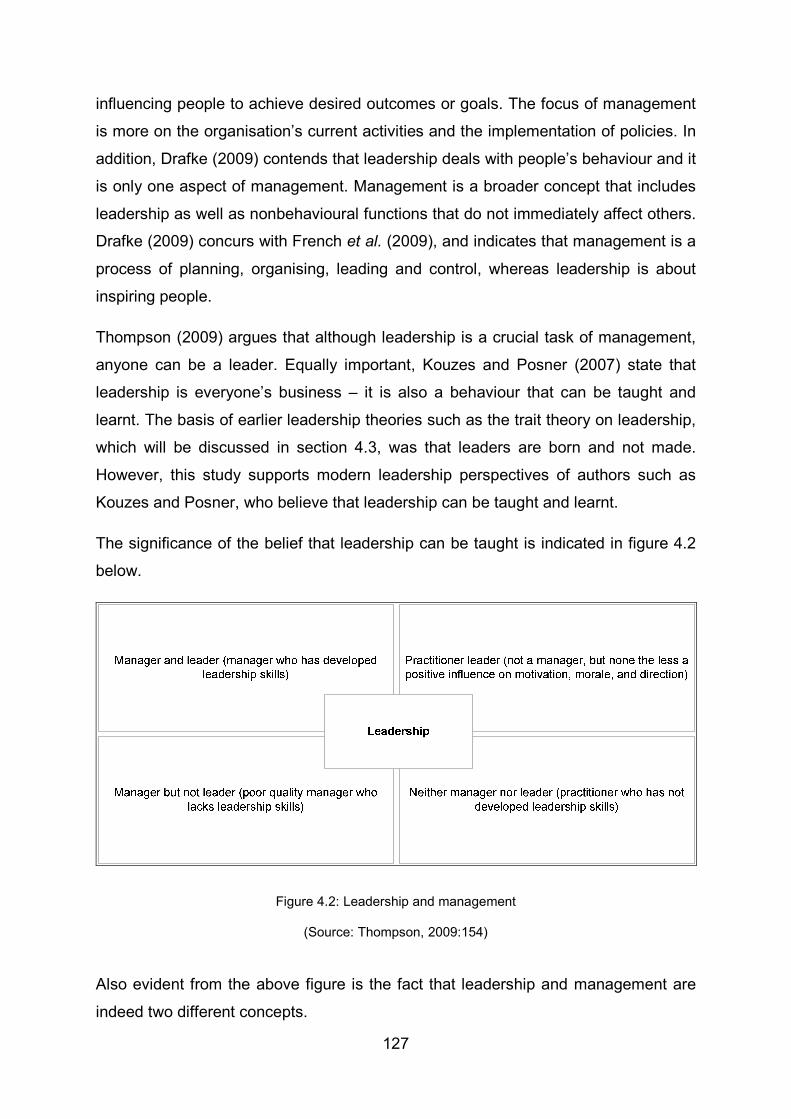
Figure 4.2: Leadership and management .................................................................... 127
Figure 4.3: Leadership and management compared ................................................... 128
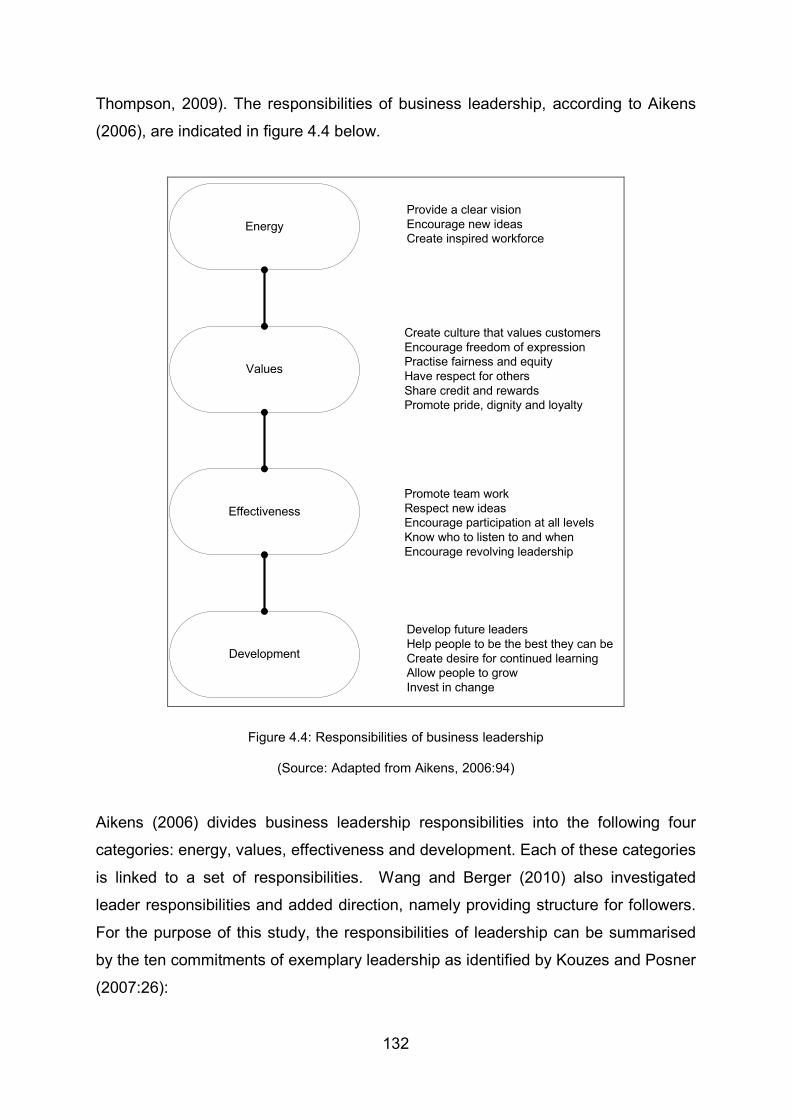
Figure 4.4: Responsibilities of business leadership ..................................................... 132
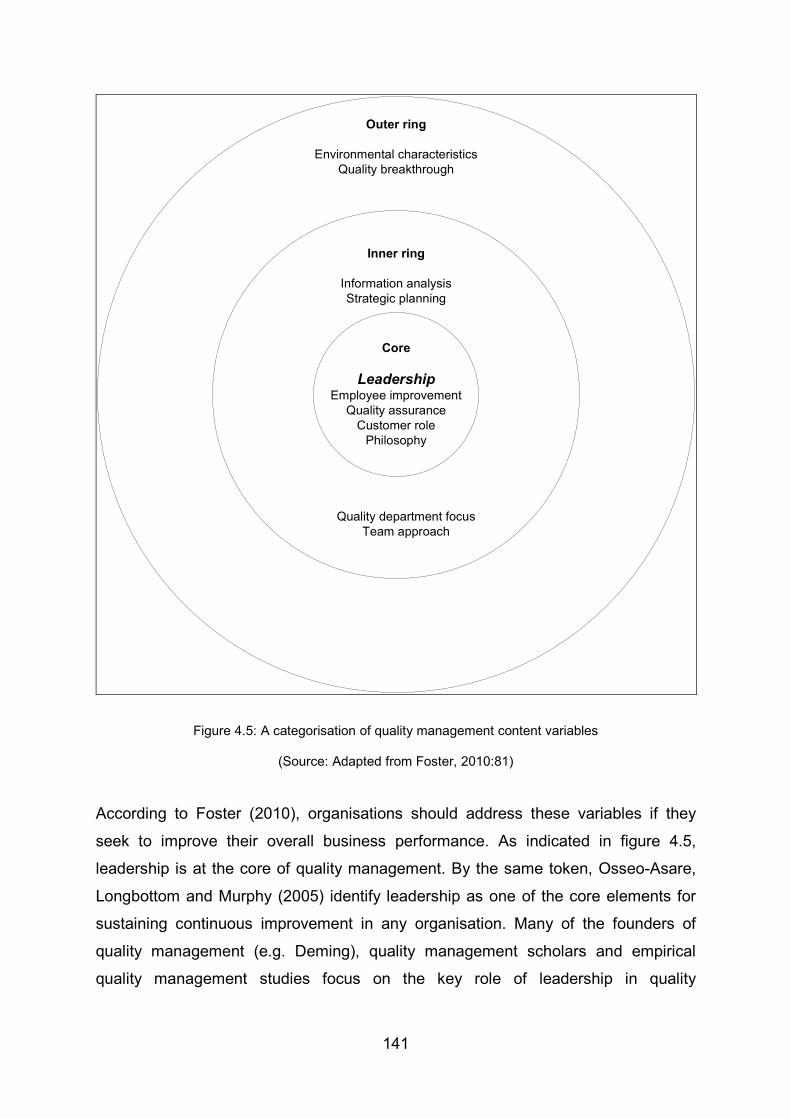
Figure 4.5: A categorisation of quality management content variables ....................... 141
Figure 4.6: Baldrige Award framework ........................................................................ 143
Figure 4.7: European Quality Award ........................................................................... 144
Figure 4.8: An interactive model for TQS .................................................................... 148
Figure 5.1: Layout of chapter 5 ................................................................................... 162
Figure 6.1: Layout of chapter 6 ................................................................................... 189
Figure 6.2: Programme enrolled for and year of study – all campuses ....................... 192
Figure 6.3: Service quality expectations versus perceptions ....................................... 193
Figure 6.4: Gap analysis of tangibles across Campus 1 ............................................. 195
Figure 6.5: Gap analysis of reliability across Campus 1 .............................................. 195
Figure 6.6: Gap analysis of responsiveness across Campus 1 ................................... 196
Figure 6.7: Gap analysis of assurance across Campus 1 ........................................... 196
Figure 6.8: Gap analysis of empathy across Campus 1 .............................................. 197
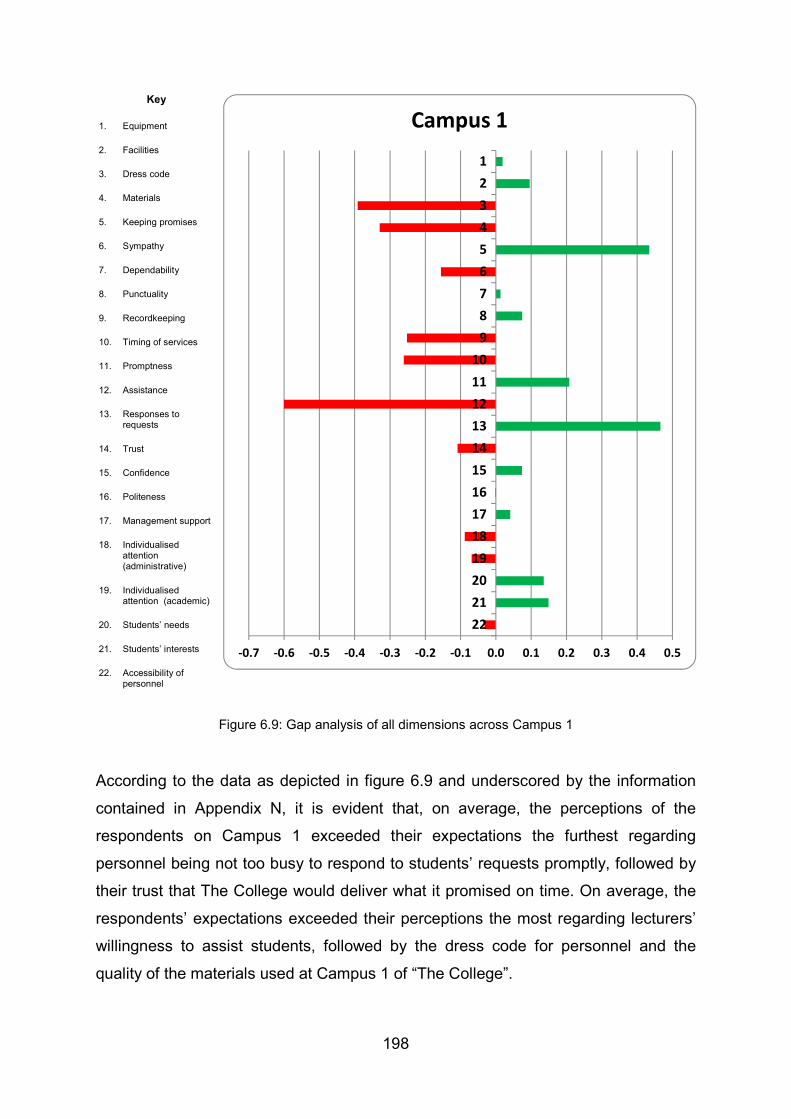
Figure 6.9: Gap analysis of all dimensions across Campus 1 ..................................... 198
Figure 6.10: Gap analysis of tangibles across Campus 2 ........................................... 199
Figure 6.11: Gap analysis of reliability across Campus 2 ............................................ 200
Figure 6.12: Gap analysis of responsiveness across Campus 2 ................................. 200
Figure 6.13: Gap analysis of assurance across Campus 2 ......................................... 201
Figure 6.14: Gap analysis of empathy across Campus 2 ............................................ 201
Figure 6.15: Gap analysis of all dimensions across Campus 2 ................................... 202
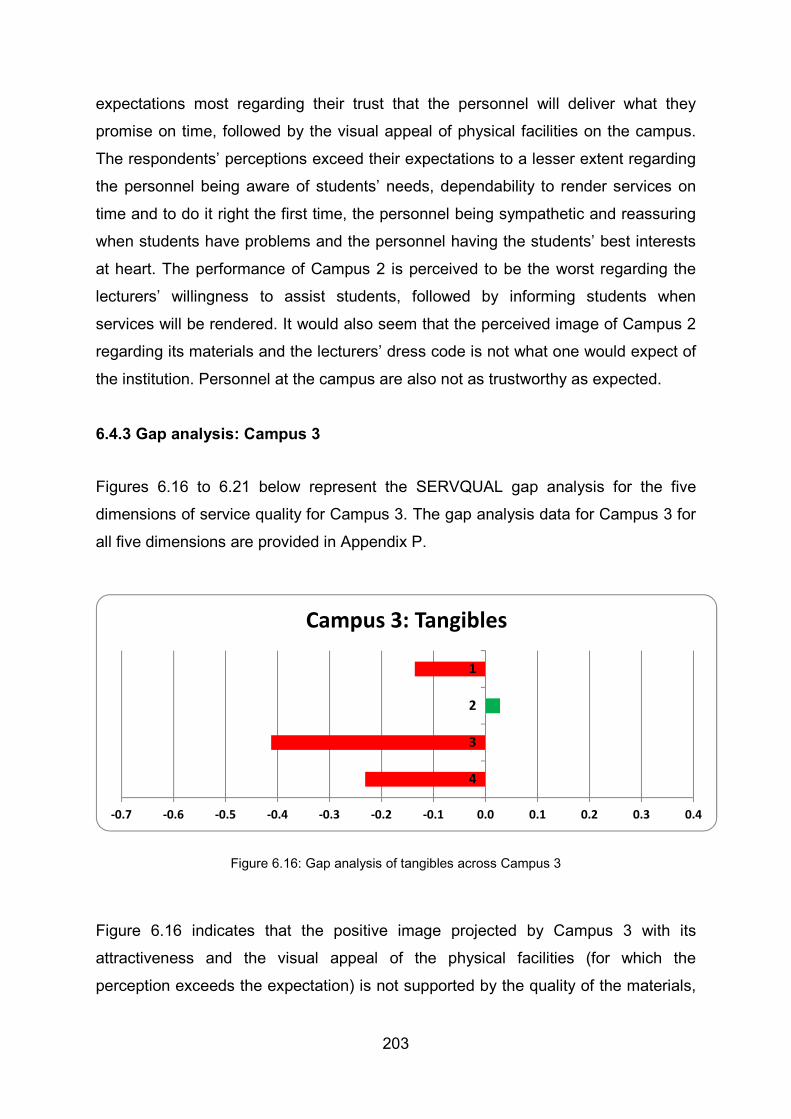
Figure 6.16: Gap analysis of tangibles across Campus 3 ........................................... 203
Page 17
xvii
Figure 6.17: Gap analysis of reliability across Campus 3 ............................................ 204
Figure 6.18: Gap analysis of responsiveness across Campus 3 ................................. 204
Figure 6.19: Gap analysis of assurance across Campus 3 ......................................... 205
Figure 6.20: Gap analysis of empathy across Campus 3 ............................................ 205
Figure 6.21: Gap analysis of all dimensions across Campus 3 ................................... 206
Figure 6.22: Gap analysis of tangibles across Campus 4 ........................................... 207
Figure 6.23: Gap analysis of reliability across Campus 4 ............................................ 208
Figure 6.24: Gap analysis of responsiveness across Campus 4 ................................. 208
Figure 6.25: Gap analysis of assurance across Campus 4 ......................................... 209
Figure 6.26: Gap analysis of empathy across Campus 4 ............................................ 209
Figure 6.27: Gap analysis of all dimensions across Campus 4 ................................... 210
Figure 6.28: Gap analysis of tangibles across Campus 5 ........................................... 211
Figure 6.29: Gap analysis of reliability across Campus 5 ............................................ 212
Figure 6.30: Gap analysis of responsiveness across Campus 5 ................................. 212
Figure 6.31: Gap analysis of assurance across Campus 5 ......................................... 213
Figure 6.32: Gap analysis of empathy across Campus 5 ............................................ 213
Figure 6.33: Gap analysis of all dimensions across Campus 5 ................................... 214
Figure 6.34: Gap analysis of tangibles across all campuses ....................................... 215
Figure 6.35: Gap analysis of reliability across all campuses ....................................... 216
Figure 6.36: Gap analysis of responsiveness across all campuses ............................ 216
Figure 6.37: Gap analysis of assurance across all campuses ..................................... 217
Figure 6.38: Gap analysis of empathy across all campuses ....................................... 217
Figure 6.39: Gap analysis of all dimensions across all campuses .............................. 218
Figure 6.40: Leadership practices and service quality ................................................ 225
Figure 7.1: Layout of chapter 7 ................................................................................... 229
Page 18
xviii
Figure 7.2: A diagrammatical depiction of this study .................................................. 239
Page 19
xix
LIST OF TABLES
Table 1.1:The five practices and ten commitments of leadership .................................. 21
Table 1.2: Proportional stratified sampling .................................................................... 26
Table 3.1: History of quality ........................................................................................... 60
Table 3.2: Research of the leading quality experts (1950s–1980s) ............................... 63
Table 3.3: Quality and traditional strategic planning ...................................................... 69
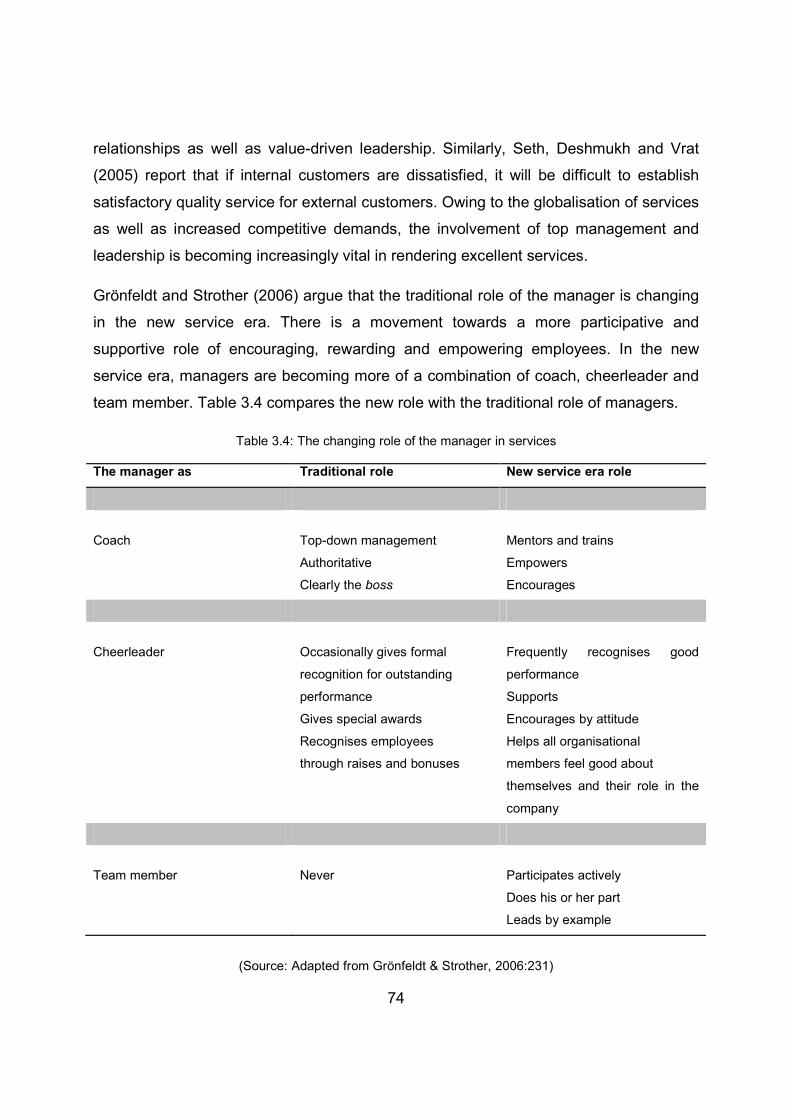
Table 3.4: The changing role of the manager in services .............................................. 74
Table 3.5: Goods and services ...................................................................................... 77
Table 3.6: Limitations of service quality models .......................................................... 103
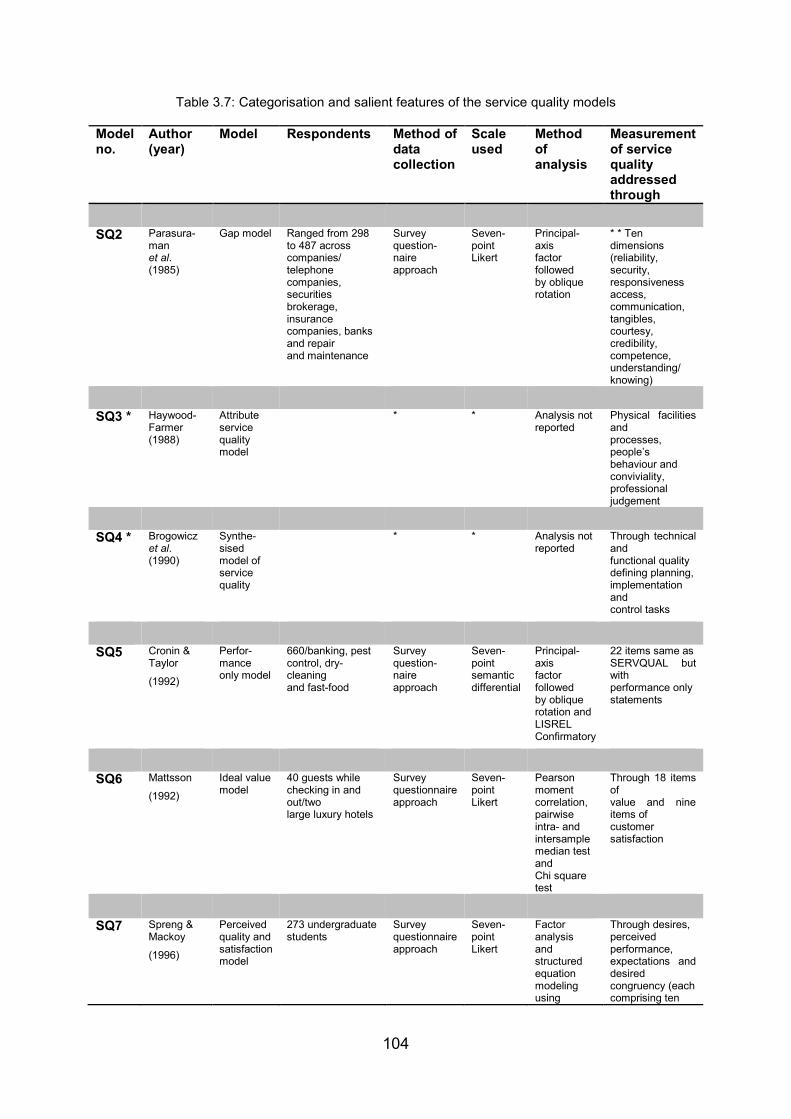
Table 3.7: Categorisation and salient features of the service quality models .............. 104
Table 3.8: Evaluation of service quality models .......................................................... 105
Table 3.9: Original dimensions of SERVQUAL ........................................................... 108
Table 4.1: Definitions of leadership ............................................................................. 125
Table 4.2: Leadership skills ......................................................................................... 130
Table 4.3: Continuum of leadership styles .................................................................. 139
Table 5.1: The cross-sectional method ...................................................................... 164
Table 5.2: Comparison of the original refined SERVQUAL statements and the adapted
SERVQUAL statements applied in this study .............................................................. 166
Table 5.3: Random sampling ...................................................................................... 175
Table 5.4: Stratified random sampling ......................................................................... 175
Table 5.5: Student respondents per campus ............................................................... 176
Table 5.6: Demographics of campus principals ........................................................... 181
Table 5.7: Strength of positive or negative correlations............................................... 182
Table 5.8: Reliability estimates .................................................................................... 183
Page 20
xx
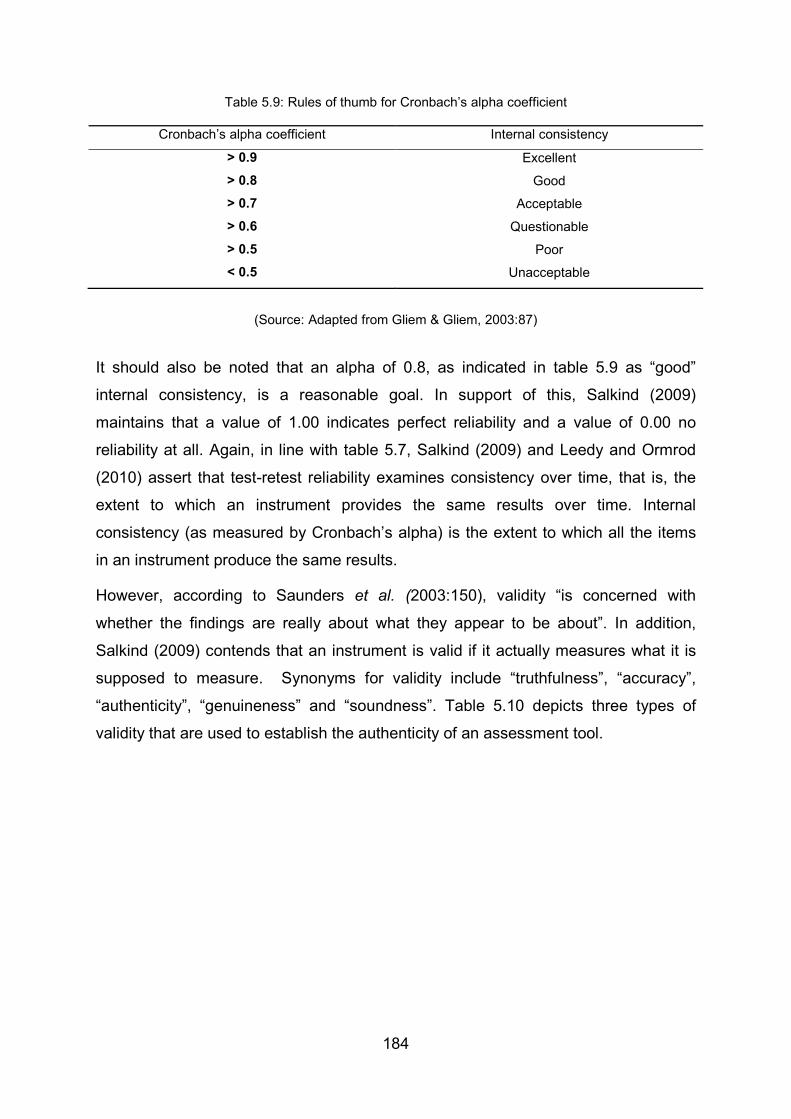
Table 5.9: Rules of thumb for Cronbach’s alpha coefficient ........................................ 184
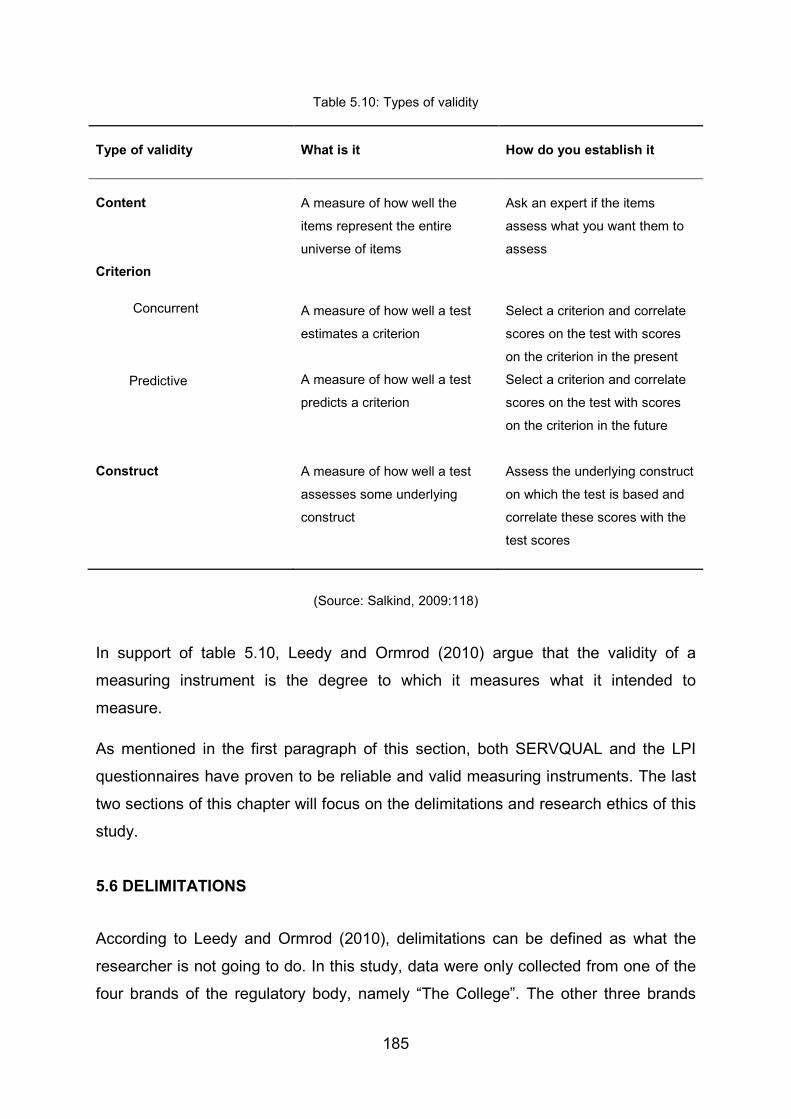
Table 5.10: Types of validity ........................................................................................ 185
Table 6.1: Reliability statistics for expectation dimensions .......................................... 190
Table 6.2: Reliability statistics for perception dimensions ........................................... 190
Table 6.3: SERVQUAL gap analysis summary ........................................................... 219
Table 6.4: Mean and standard deviation per dimension – all campuses ..................... 221
Table 6.5: Correlation coefficient between the LPI (leadership practices) and
SERVQUAL (service quality) ....................................................................................... 222
Table 6.6: LPI data summary ...................................................................................... 224
Table 7.1: Correlation between leadership practices and service quality .................... 236
Page 21
1
1. CHAPTER 1: INTRODUCTION AND BACKGROUND
The main sections of this chapter are depicted in figure 1.1 below.
Figure 1.1: Layout of chapter 1
Page 22
2
1.1 BACKGROUND
This study focuses on the impact of leadership practices on service quality in private
higher education (PHE) in South Africa. “The College”, which is one of the four brands
of a prominent service provider in the field, was selected as the focus of this study. The
service provider is a PHE provider registered with the Department of Education (DoE)
offering a full range of qualifications and short learning programmes on 19 sites of
delivery, organised into four brands. Owing to the dynamic nature of the PHE
environment in South Africa, providers specifically need to be leaders in their field to
compete successfully in order to maintain a competitive advantage in the marketplace.
Fendt and Varek (1992) identify four characteristics of PHE institutions. Firstly, in order
to survive, PHE institutions require fundraising because of the lack of government
subsidies. They need to maintain a warm, friendly and personal relationship with their
students to ensure customer retention. Secondly, PHE institutions tend to be smaller,
which means that students should feel important and cared for. This implies that there
may be less bureaucracy in decision making, which gives these institutions the
advantage of rapidly responding to the needs of the marketplace. Thirdly, PHE
institutions are free of public monetary control and spending on tuition, and salaries are
determined by the institution itself. Lastly, in the past, the only focus was on effective
teaching. A new trend is emerging in the sense that PHE institutions are starting to feel
the pressure and therefore have to conduct research and generate publications if they
wish to be taken seriously as part of the HE sector.
With reference to the characteristics of PHE institutions, as indicated by Fendt and
Varek (1992), certain competitive challenges arise in this environment. This provides a
great opportunity for research projects focusing, among other things, on leadership and
service quality.
Page 23
3
The National Qualifications Framework (NQF) in South Africa consists of three streams
of education and training, namely general education and training (GET), further
education and training (FET) and higher education and training (HET). As stated
previously, this study focuses on the higher education (HE) stream. Entry into HET is
acquired via a Grade 12 certificate with or without exemption. All PHE institutions must
register with the DoE in accordance with the HE Act 101 of 1997 (South Africa.
Department of Education, 2009). Only private institutions that want to offer qualifications
(certificates, diplomas or degrees) at NQF levels 5 to 10 are required to register with the
DoE.
The purpose of registering private institutions offering HE, is to ensure that PHE
institutions offer an acceptable quality of education and that students enrol at institutions
that have the capacity and expertise to offer such programmes. In addition, being
registered with and accredited by the DoE means that the institutions offer qualifications
that are aligned with the NQF and as such contribute to transformation that is in line
with government policy (South Africa. Department of Education, 2009).
The regulatory framework further dictates which institutions may apply for registration
and the responsibilities of such an institution once it has been registered. An institution
is eligible to apply for registration as a PHE provider if it is a registered company in
accordance with the Companies Act 61 of 1973 and intends providing HE as
contemplated in chapter 1 of the Act (South Africa. Department of Education, 2009).
This basically means that the institution must provide functions such as registering
students at a higher educational level and offering curricula, assessing students on
learning programmes and awarding qualifications. An institution that applies for
registration must also fulfil the requirements for quality assurance set out by the Higher
Education Quality Committee (HEQC) of the Council on Higher Education (CHE). The
CHE is the body responsible for quality assurance in HE, while the HEQC is responsible
Page 24
4
for conducting institutional and programme assessment, which is known as
accreditation.
One of the benefits of accreditation is a guarantee that the progammes offered by the
institution are indeed HE. The institution must also provide evidence of its financial
sustainability in terms of sureties. This is to prove that the institution is able to offer its
programmes and meet its financial obligations to students. The institution must also
comply with health and safety regulations.
The responsibilities of a registered institution are stipulated in chapter 6 of the
Regulations for the Registration of Private Higher Education Institutions, published in
Government Gazette, No. 24124, dated 13 December 2002. A summary of these
responsibilities is provided below (South Africa. Department of Education, 2009:7).
i. Maintaining registration through continuing to comply with the requirements of
the Act and the conditions of registration.
ii. Reporting any changes in information submitted to the registrar.
iii. Reporting loss of any physical facility, supporting service that may have
consequences for the provision of programmes.
iv. Displaying the registration certificate conspicuously on the premises.
v. Publishing at least once a year a prospectus, calendar or brochure. Amongst
other things, the prospectus must feature information on the managers of the
institution, its academic staff, admission requirements and procedures, rules
relating to assessment and academic credit accumulation and progression, fees
and charges, student support services and student financial aid.
vi. Keeping a comprehensive record of the academic achievement of each student
enrolled.
vii. Making available transcripts of academic records and certificates on request.
Page 25
5
viii. Ensuring accurate advertising and making no false, fraudulent or misleading
statements.
ix. Submitting to the registrar an annual report on or before 30 April of each year;
and
x. On cancellation of registration, informing students, issuing students with copies
of records of academic achievements, reimbursing students and making
arrangements for them to complete their studies at comparable public or private
institutions.
The then Minister of Education, Mrs. Naledi Pandor indicated that South Africa has a
shortage of educational leadership (Niemann & Kotze, 2006: 609). According to her,
current leaders cannot formulate strategic plans or formulate perspectives that will lead
to success. This study also complements the strategic plan of the DoE for 2007 to 2011
as is evident from the vision and mission of the DoE. The mission reads as follows: “Our
mission is to provide leadership in the establishment of a South African education
system for the 21st century.” The vision is as follows: “Striving to address the training
needs for high-quality service and seeking ways to achieve our goals” (South Africa.
Department of Education, [s.a.]:9). Linked to the DoE’s vision of providing leadership
and vision of high-quality service, Kouzes and Posner (2007) state that exemplary
leadership occurs when a leader gets extraordinary things done. This is achieved by
engaging in the following leadership practices: modelling the way, inspiring a shared
vision, challenging the process, enabling others to act and encouraging the heart.
These practices form the basis of the Leadership Practices Inventory (LPI) assessment
instrument that was used in this study, as discussed in section 1.5.2.4. McKenna (2003)
argues that to execute successful service strategies one needs leaders and not
managers, and that leadership is the key to success. Hui, Chiu, Yu, Cheng and Tse
(2007) support this view, and state that when an organisation is not rendering quality
service, leadership behaviour makes a significant difference. Where service quality is
poor, leadership behaviour plays a key role in maintaining service excellence to external
customers.
Page 26
6
In the South African PHE environment, the Register of PHE Institutions of 2010
indicates that there are currently 78 PHE institutions registered with the DoE in South
Africa. At that time there were also 22 provisionally registered providers and four
providers with an extension on provisional registration. In total, there are 104 role
players in the PHE market, all competing for the same market share with new (local and
international) stakeholders entering the market despite the relatively high barriers to
entry such as cost and regulations.
In addition to the competitive forces in the PHE environment, the educational regulatory
environment also poses challenges for PHE providers. The new National Senior
Certificate (NSC) affords school leavers the opportunity to enrol at a public university
that would not have been possible in the past owing to stricter entry requirements. The
implication for the PHE sector is that it is losing a huge part of its market to public
providers. There is still a perception in South Africa that public universities offer higher
quality education and service than the private sector. Previously, private providers
competed with one another to win clients (students). Now, the competition is not
restricted to the private sector alone, but institutions also have to compete directly with
public providers. Exceptional service quality could offer PHE providers a competitive
advantage.
Service quality is also linked to increased profits and is essential to maintain a
competitive advantage. Abdullah (2005) confirms that HE has been compelled towards
commercial competition and that these institutions should not only be concerned with
the abilities and skills of their graduates, but also the way in which the students perceive
their educational experience.
It is evident from the above that the PHE environment is not only highly regulated, but
also highly competitive and takes into account the number of role players involved. It is
Page 27
7
now more imperative than ever for private institutions to offer superior services and
products to students if they wish to remain competitive. This is in line with the Higher
Education Act 101 of 1999, which states that no PHE provider may offer HE unless it is
registered with the DoE.
It has become crucial for PHE institutions to revisit their mission statements and
“practise what they preach” – a balance between the financial perspective and client
(service quality) perspective should become part of the business model. The focus
should shift from a moneymaking approach to a balance between sound business
practices and service quality. As indicated previously by Pandor (Niemann & Kotze,
2006), there is a shortage of educational leadership, and exemplary leadership should
be the way to address this focus shift. Similarly, according to Dauffenbach (1995),
effective leadership is needed for institutions to excel and motivate employees to put in
the extra effort. Without effective leadership, no HE institution will be continuously
successful.
Given the scenario in the PHE environment in South Africa, several challenges such as
sustainability and long-term competitive advantage, as well relatively high barriers to
entry, have been identified. The following section describes one specific problem that
was investigated in this research study.
1.2 PROBLEM STATEMENT
One of the challenges facing PHE institutions is an increasingly competitive, marketing-
oriented and highly regulated environment. In this environment, these institutions have
to function, survive and compete, not only with one another, but also with HE public
institutions. Hence the problem is that competition is on the increase and PHE
institutions need to find new ways to compete if they wish to survive in this dynamic
Page 28
8
environment. As indicated previously, leadership appears to influence service quality,
which is essential in gaining a competitive edge in this ever-evolving environment.
1.3 RESEARCH STATEMENT
Proven leadership practices will have a positive impact on service quality in a PHE
institution in South Africa. This will thus impact on the competitive advantage which, in
turn, will then lead to the long-term sustainability of the institution.
1.4 RESEARCH OBJECTIVES
1.4.1 Primary objective
The primary objective of this study was to investigate the impact of leadership practices
on service quality in PHE in South Africa as a source of competitive advantage. Hence
the impact of leadership (the independent variable) on service quality (the dependent
variable) will be investigated.
1.4.2 Secondary objectives
In order to achieve the primary objective, the following secondary objectives were
formulated for this study:
(1) To identify service quality criteria used to evaluate the quality of service
(2) To identify a leadership assessment instrument that measures leadership practices
(3) To analyse students’ perceptions and expectations of service quality
(4) To evaluate the way in which leaders view themselves in terms of exemplary
leadership
(5) To evaluate the way in which the organisation views its leader in terms of exemplary
leadership
Page 29
9
(6) To recommend interventions to improve leadership and service quality in a PHE
provider in South Africa
The next section deals with the literature study on leadership and service quality.
1.5 LITERATURE STUDY
1.5.1 Introduction
The aim of the literature study was to report on existing knowledge on the constructs
leadership and service quality, and to understand the relationship between these
constructs. The literature study would also promote a better understanding of the PHE
environment which was the context in which the study would be conducted.
The need for educational leadership and service quality (as part of the DOE’s vision)
was emphasised earlier in this discussion. The next section will focus on the literature
consulted on leadership and service quality as well as the relevant instruments that
would be used to conduct the study.
Many experts agree that leadership is the key to improving quality. According to Fendt
and Varek (1992), the components of a total quality service include leadership, a quality
management system, quality management processes, education and training and a
strategy for implementation. They believe that of these five components, leadership is
the driving force behind service quality and it should come from the top. Foster (2010)
confirms this by indicating that quality experts such as Deming, Juran, Crosby, Taguchi,
Ishikawa and Feigenbaum all agree that certain variables form the core of quality
management. One of these core variables is leadership. Goetsch and Davis (2006)
report that Juran’s quality trilogy comprises planning, control and continuous
improvement. However, these three functions do not occur automatically but are driven
by leadership.
Page 30
10
As stated earlier, the PHE environment in South Africa is highly competitive. There are
numerous role players trying to secure a share of the market. Robbins and DeCenzo
(2008) argue that the more an organisation can satisfy its customers’ needs for quality
and build up a loyal customer base, the more it can differentiate itself from its
competition. Constant improvement in the quality of services can lead to a competitive
advantage that other organisations cannot emulate. Linked to this is Foster’s (2010)
contention that organisations with weak leadership will not gain a market advantage in
quality.
Zahorik and Keiningham (Ham & Hayduk, 2003) emphasise service quality as an
investment that is required to remain competitive in the global market. According to
Wang, Lo and Yang (2004), customer perceived service quality is one of the principal
success factors of sustained competitive advantage for both manufacturers and service
providers. Voon (2006) agrees and adds that there has been an increase in the
internationalisation of the labour market, lecturers, researchers, students and
competitive education programmes. HE policy makers need to adopt a formal approach
that will ensure quality products and services. He confirms that service quality is
important to HE institutions for a number of reasons, including competitive advantages
and meeting the ever-increasing public expectations.
A review of the literature indicated that there are various definitions of leadership and
service quality, which will be discussed in the next section.
1.5.2 Definitions of leadership and service quality
1.5.2.1 Leadership
Batten (1989:35) defines leadership as “a clear and complete system of expectations in
order to identify, evoke, and use the strengths of all resources in the organisation – the
most important of which is people”. Staub (1997:160) adds to this by stating that
“leadership is, by definition, the capacity to forge ahead, blaze new trails, open up new
Page 31
11
realms. It is characterised by breaking with tradition and seizing new opportunities
where others see only danger and ruin.” Co et al. (2006:203) focus on the behavioural
side of leadership and define it as “the ability to influence the behaviour of others so that
they can cooperate willingly to reach goals”. Moreover, according to Goetsch and Davis
(2006:255), “leadership is the ability to inspire people to make a total, willing, and
voluntary commitment to accomplishing or exceeding organisational goals”. In addition,
Hellriegel et al. (2006:286) explain that leadership “involves influencing others to act
towards the attainment of a goal. It is based on interpersonal relationships, not
administrative activities and directives.”
According to Marden (2007:333), leadership is a process, which means “that it is a
dynamic interaction or transactional event that occurs between the leader and his or her
followers. The leader affects and is affected by the followers.” He further states that
leadership occurs in a group context and that “leadership involves influencing a group of
individuals who are in some way inter-related or interacting in a purposive manner”. He
adds that leadership is also goal-oriented and that “it involves influencing the individual
and the group towards accomplishing some objective or task”.
Despite the plethora of definitions of leadership, some authors such as Doh and Stumpf
(2005) contend that the ultimate question is not what the definition of leadership is, but
rather what constitutes good leadership. They add that there is no confusion about
what leaders do - the question is, what would be the best way to do it. After all, that is
the point of studying leadership.
With due consideration of the multitude of definitions, for the purpose of this study,
leadership was defined as “the mobilisation and influencing of people to work towards a
common goal through the building of interpersonal relationships and the breaking of
tradition to achieve the organisation’s objectives despite risk and uncertainty”.
The link between the definition of leadership and the LPI assessment instrument is
evident and will be discussed in section 1.5.2.4.
Page 32
12
As stated previously, the focus of this study was on the impact of leadership practices
on service quality. The next section investigates the definitions of service quality.
1.5.2.2 Service quality
Stamatis (1996:6) provides a useful summary of the definitions of quality by the gurus of
quality management over the years:
• conformance to requirements (Crosby 1979)
• fitness for use (Juran 1979)
• continual improvement (Deming 1982)
• as defined by customers (Ford 1984, 1990).
Zeithaml, Parasuraman and Berry (1990:18) define service quality as “meeting or
exceeding what customers expect from the service”. Asubonteng, McClearly and Swan
(1996:64) refer to service quality “as the difference between customers’ expectations for
service performance prior to the service encounter and their perceptions of the service
received”. Palmer (1998:153) adds to the above and defines service quality as “the
extent to which a service meets customers’ requirements” and “the extent to which
perceived service delivery matches up to those individual expectations”. Markovic
(2006:88) also focuses on expectations and reports that service quality “is a measure of
the extent to which the service delivered meets the customers’ expectations.”
Khoshafian (2007:312) adopts a different approach and states that service quality “is
always associated with the reliability and performance of the service”.
Because this study would investigate service quality for PHE, it is necessary to define
service quality in HE. O'Neill and Palmer (in Voss, Gruber & Szmigin 2007: 950) define
service quality in HE as “the difference between what a student expects to receive and
his/her perceptions of actual delivery”.
Page 33
13
For the purpose of this study, and following on the above-mentioned definitions, service
quality in HE was defined as “meeting and exceeding students’ expectations and
perceptions by constantly rendering a reliable service that conforms to pre-determined
requirements”.
A clear link exists between this definition of service quality and the SERVQUAL
instrument which will be discussed below. The next section describes the two research
instruments that were used in this study, namely SERVQUAL and the LPI.
1.5.2.3 SERVQUAL
The SERVQUAL instrument was developed by Zeithaml, Parasuraman and Berry in
1988. It is an instrument for assessing quality along five service dimensions (tangibles,
reliability, responsiveness, assurance and empathy). Many organisations use this
instrument because it is an off-the-shelf approach that can be used in a variety of
service settings (Foster, 2007). It has two parts – customer (student) expectations and
customer (student) perceptions. Zeithaml et al. (1990) define the five dimensions as
follows:
• tangibles - physical facilities, equipment, personnel and communication materials
• reliability - the ability to perform service dependably and accurately
• responsiveness - the willingness to help students and provide prompt service
• assurance - the knowledge and courtesy of employees and their ability to convey
trust and confidence
• empathy – the organisation provides care and individualised attention to its students
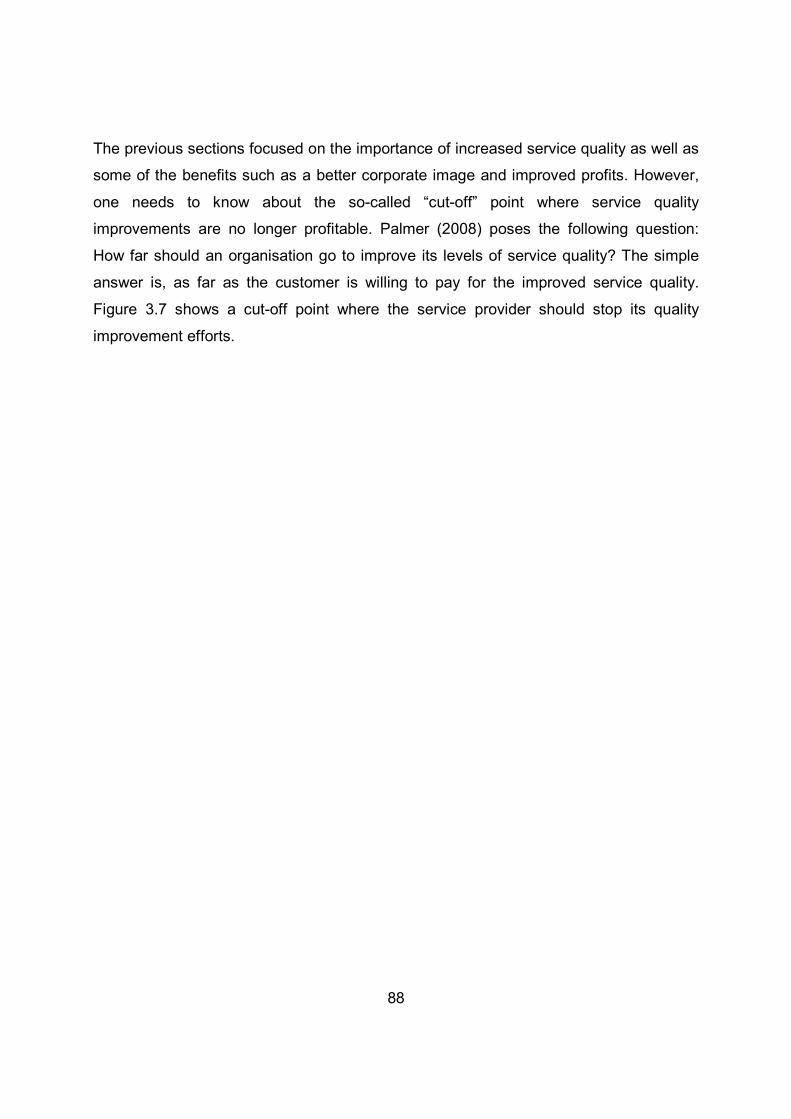
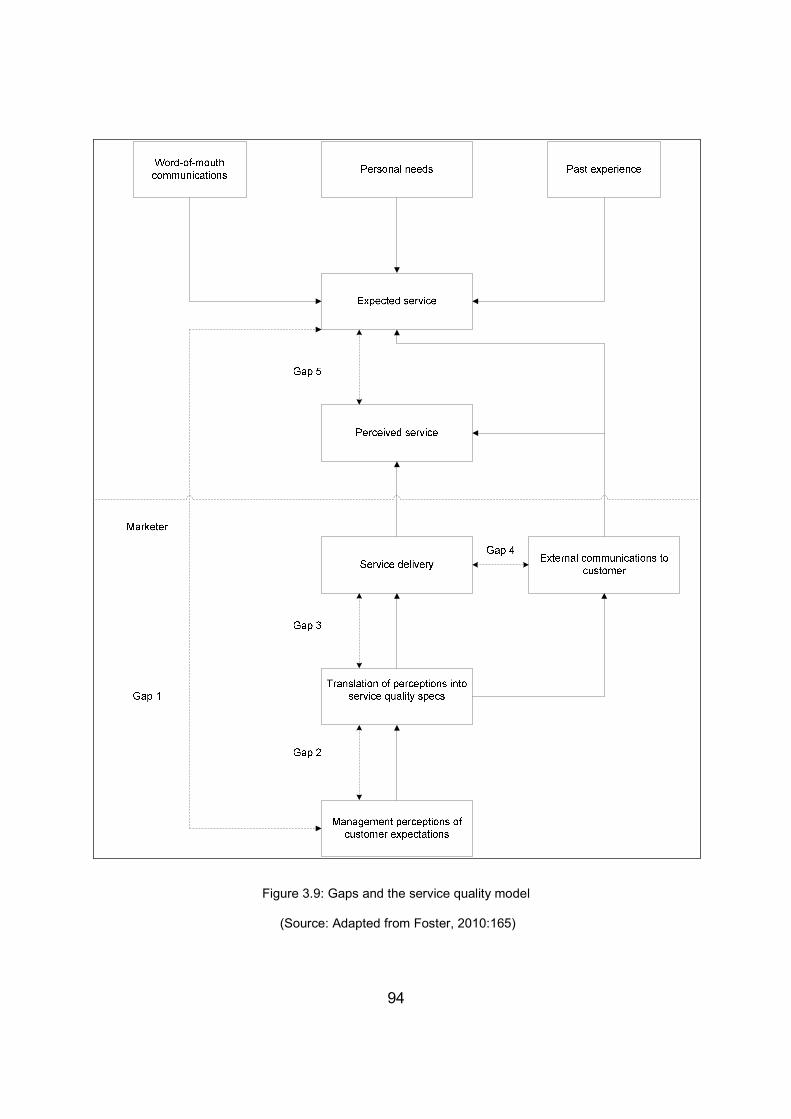
According to Foster (2010), SERVQUAL identifies five discrepancies or "gaps" that may
cause problems in service delivery and therefore influence customer evaluations of
service quality.
Page 34
14
• gap 1: the gap between customer expectations and management’s perception of
these expectations
• gap 2: the gap between management’s perception of what customers want and the
specifications that management develop to provide the service
• gap 3: the gap between the service quality specifications (delivery systems) and the
service that is actually provided
• gap 4: the gap between what the service system actually provided, and what the
customer is told it provides (a communication gap)
• gap 5: the gap between customers’ perceptions of service performance and their
expectations
For the purpose of this study, the following serves as an example to indicate the gaps
that may be identified through SERVQUAL: If students have higher expectations for
tangibles than for reliability, and they perceive tangibles as poor, then a large gap exists
between the expected and delivered performance on tangibility. Given that this gap is
larger, increasing customer (student) satisfaction lies in addressing tangibles first.
The SERVQUAL survey has two parts, namely customer expectations and customer
perceptions. Figure 1.2 below depicts the service quality gaps of SERVQUAL.
Page 35
15
Figure 1.2: Gaps and the service quality model
(Source: Foster, 2010:165)
Page 36
16
In evaluating the SERVQUAL instrument, the following potential drawbacks are
considered:
According to Kim, Lee and Yun (2004), many researchers have criticised the SERQUAL
model and argued that the score can lead to psychometric problems such as variance
restrictions by having given variables in a gap-based model. Lee (2005) mentions that
the SERVQUAL instrument has been adopted for many studies in services research but
also that the instrument has been questioned. In support of Lee’s statement, Bicheno
and Catherwood (2005) point out that research has shown that the SERVQUAL
dimensions and weightings do not necessarily apply to all cultures in the world.
Bienstock, Mentzer and Bird (Bicheno & Catherwood, 2005) suggest that dimensions
such as timelines, availability and condition are absent from the instrument. Carmen
(Swart, 2006) criticises the instrument for the use of different scores, dimensionality and
the lack of validity in terms of the five dimensions.
Despite the instrument’s drawbacks, the following advantages are presented:
Foster (2010) lists a number of advantages of using the SERVQUAL instrument. He
indicates that it is accepted as a standard for assessing different dimensions of service
quality and it has been shown to be valid for a number of service institutions. Equally
important, he adds that it has been shown to be reliable and has only 22 items which
can be filled out quickly by the respondents. He concludes summary by pointing out that
it has a standardised analysis procedure to aid in the interpretation of results.
A review of the literature indicates that SERQUAL, although an “older” instrument, is still
reliable for measuring service quality. Carrillat, Jaramillo and Mulki (2007) confirm this
by stating that SERVQUAL and SERVPERF are equally reliable instruments in
assessing service quality. SERVPERF is an alternative service quality measurement
instrument and will be discussed in more detail in chapter 3, section 3.7.7, of this study.
Page 37
17
The SERVQUAL instrument was chosen for this study on the basis of the above
advantages as well as research conducted by many authors that confirms the validity
and authenticity of the instrument. The 22 items can be customised for any
organisation and are widely published in academic textbooks (e.g. Foster, 2010; Gryna,
Chua & DeFeo, 2007) as a valid and reliable method to assess service quality.
SERVQUAL is especially appropriate for a study in HE. Hughey, Chawla and Khan
(2003) provide further evidence of the validity of SERVQUAL in an HE institution. They
mention that a longitudinal application of a SERVQUAL survey (over two years) to
measure services provided by computer labs in a Southwest state university showed
remarkable consistency. Markovic (2006) concurs and posits that SERVQUAL is a
suitable instrument for HE institutions to design service strategies that will meet
students’ expectations in relation to service quality.
As mentioned in the problem statement, this study focused on a PHE provider. Baxter
(2004) contends that SERVQUAL is also extremely valuable in an environment in which
the focus is on income, business needs and value for money.
According to Mukherjee and Nath (2005), the SERVQUAL instrument is best suited to
measure the current performance of a service organisation by identifying the delivery
gaps. Cronin and Taylor (Mukherjee & Nath, 2005) propose that the SERVPERF
approach, which is performance based, is superior to the SERVQUAL gap method.
However, Parasuraman et al. (Mukherjee & Nath, 2005) provide evidence that the
SERVQUAL model is superior to other models, both theoretically and empirically. Badri,
Abdulla and Al-Madani (2005) confirm that the SERVQUAL model has been used and
tested in many service industries, including education. Despite all the criticisms of the
model, the developers contend that using a gap-based model is a much richer approach
to measuring service quality. They add that service quality is a multidimensional as
opposed to a unidimensional construct.
Despite its many criticisms, SERVQUAL is still a popular instrument for measuring
service quality in service organisations. According to the developers of the SERVQUAL
Page 38
18
model, it is still recommended because of its superior diagnostic capacity (Kim et al.,
2004).
Barnes (2007) concurs with the above statements and provides evidence that
SERVQUAL is a tried-and-tested instrument that has been successfully applied in
various service industries and that its strengths more than outweigh its weaknesses.
Barnes (2007) further stipulates that SERVQUAL is a useful instrument for studying
service quality and is can also be applied as a postgraduate research tool. Recently, the
SERVQUAL instrument was used as part of the University of Houston’s improvement
effort and it provided useful data on service gaps to improve service quality (Quinn,
Lemay, Larsen & Johnson, 2009).
The previous section discussed the drawbacks and potential advantages of SERVQUAL
as a research instrument. Since the advantages outweigh the disadvantages,
SERVQUAL was deemed to be the most appropriate instrument for this study.
1.5.2.4 The LPI
As indicated earlier, there are numerous definitions of leadership as well as leadership
assessment tools. According to Conger and Riggo (2007), the leadership assessment
tools include interviews, assessment centres, cognitive ability tests and personality
inventories. However, a review of all the instruments is beyond the scope of this
research.
The following leadership assessment tools were investigated as possible instruments
for this study:
(1) Innovative Leadership Assessment (http://www.chartcourse.com/articleassess.htm)
(2) Leadership Self-Assessment (http://www.nsba.org/sbot/toolkit/leadSA.html)
(3) Leadership Skills Assessment Questionnaire
(http://www.optimalthinking.com/leader-assessment.asp)
Page 39
19
(4) The Leadership Motivation Assessment
(http://www.mindtools.com/pages/article/newLDR_01.htm)
(5) Leadership Self-Assessment Activity
(http://www.nwlink.com/~donclark/leader/survlead.html)
It was found that all of the above instruments are based on self-assessment only and
there is little evidence to prove their reliability and validity.
According to Conger and Riggo (2007), the value of a leadership assessment tool lies in
its economic value, whether or not standards were followed in its development and
whether it has construct validity. It can be argued that the above instruments are
inadequate tools for leadership assessment.
By contrast, Kouzes and Posner (2003b) report that the LPI has proven to be both
reliable and valid on the basis of more than 25 years of research and the fact that more
than 200 academic studies and master’s dissertations used the LPI as a research
instrument. Kouzes and Posner (2003b:17) assert the following: “For an instrument to
be used in an academic environment, it must meet certain psychometric tests that
internally developed competency surveys do not always have to meet. Academic
institutions are very rigorous in the criteria they use to determine whether or not an
instrument passes these tests. The knowledge that the LPI is considered valid and
reliable by these standards should give confidence to all those who use the LPI in their
work that they can count on the LPI feedback. Furthermore, LPI gives 360-degree
feedback on leadership behaviour. Feedback is essential because leadership is a
relationship.
The concept of leadership was highlighted earlier. A definition for leadership was
formulated with leadership behaviour as one of its core components. According to
Hough and Neuland (2007), leaders work with people and the globalisation of business
has a significant effect on the behavioural side of leading an organisation.
Page 40
20
Kouzes and Posner developed the LPI, based on 25 years of research and data from
over three million leaders across the globe. The instrument measures leadership on the
basis of “five practices of exemplary leadership” (Kouzes & Posner, 2007:14). It reveals
the leader’s behaviour in terms of challenging the process; inspiring a shared vision;
enabling others to act; modelling the way; and encouraging the heart. The LPI consists
of 30 items requesting constituents (college employees) to rate the leader’s (principal’s)
abilities on a ten-point rating scale. It indicates how frequently leaders engage in the five
practices. The LPI is one of the most widely used leadership assessment instruments in
the world today (Kouzes & Posner, [s.a.]).The LPI is a 360-degree measurement
instrument as well as an instrument to improve and teach successful leadership
behaviour and can be applied in the PHE environment. “Leadership is everybody’s
business” is the foundation of the LPI. It is behaviour that can be taught and learnt.
Research conducted by Professors Kouzes and Posner has proven that managers,
principals, government administrators and other leaders who use the five practices of
exemplary leadership are seen by others as more effective leaders. For example
(Kouzes & Posner, 2007:343):
• They are more effective in meeting job-related demands.
• They are more successful in representing their units to upper management.
• They create higher performing teams.
• They foster renewed loyalty and commitment.
• They provide higher levels of involvement.
• They reduce absenteeism, turnover and drop-out rates.
• They possess high degrees of personal credibility.
According to Kouzes and Posner (2007), the constituents of leaders who engage in the
five practices are more productive, they accept and embrace the strategies of these
leaders and they are more committed to the organisation and the leader. Plowman
(1991) reports that higher LPI scores are linked to higher organisational effectiveness.
Hyatt (2007) concurs with this and states that Kouzes and Posner’s leadership practices
Page 41
21
should guide leaders in order to improve organisational effectiveness. An organisation’s
performance could suffer if its leaders do not embrace the five practices of exemplary
leadership. In addition, Holt (2003) confirms that the LPI identifies strengths and
weaknesses and leaders can focus on those elements that are essential for systematic
change – this will result in an overall improved campus climate. According to Roi (2006),
there is a significant relationship between the five practices and positive financial
results. He argues that organisations that engage in the five leadership practices are
more frequently associated with long-term income growth. The LPI provides information
on how the leader rates himself or herself and how others rate the leader on these
behaviours. It does not evaluate IQ, leadership style, management style or personality.
Accordingly, there is no such thing as a “bad” or “good” score. Because these are not
“grades”. The results indicate opportunities to focus on areas in which leadership
behaviour is lacking, to improve on these and to become more skilful as a leader
(Kouzes & Posner, [s.a]).
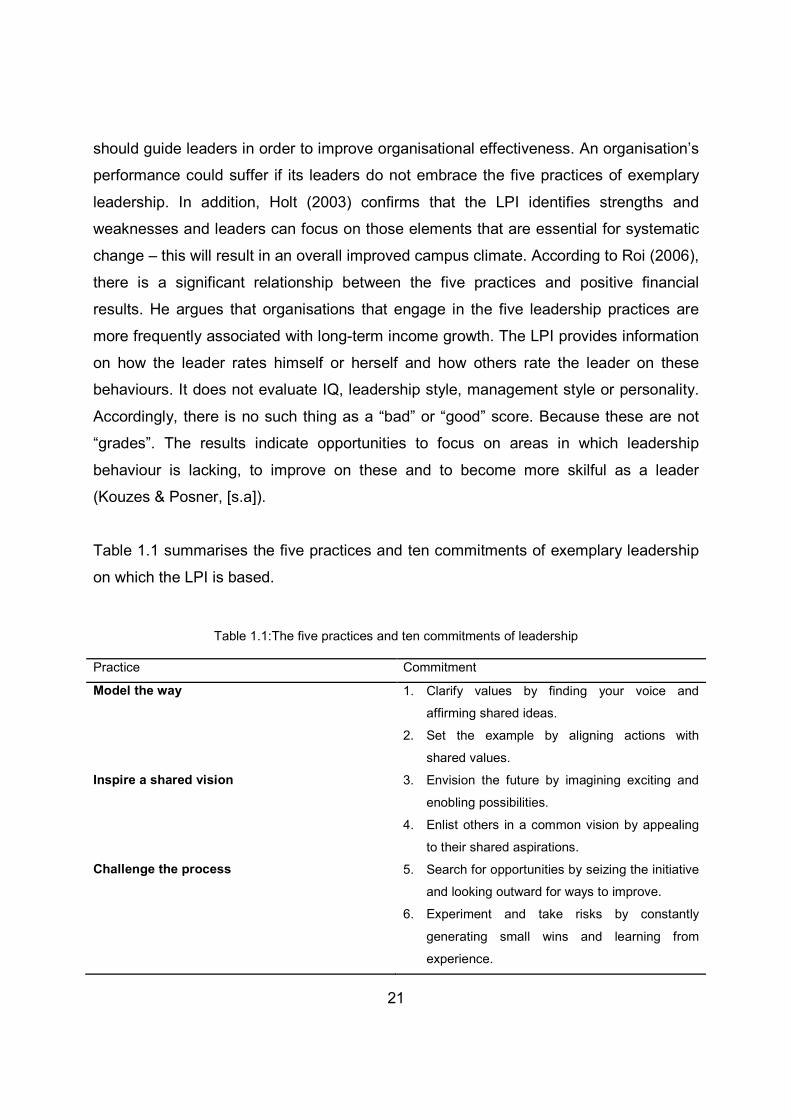
Table 1.1 summarises the five practices and ten commitments of exemplary leadership
on which the LPI is based.
Table 1.1:The five practices and ten commitments of leadership
Practice Commitment
Model the way 1. Clarify values by finding your voice and
affirming shared ideas.
2. Set the example by aligning actions with
shared values.
Inspire a shared vision 3. Envision the future by imagining exciting and
enobling possibilities.
4. Enlist others in a common vision by appealing
to their shared aspirations.
Challenge the process 5. Search for opportunities by seizing the initiative
and looking outward for ways to improve.
6. Experiment and take risks by constantly
generating small wins and learning from
experience.
Page 42
22
Enable others to act 7. Foster collaboration by building trust and
facilitating relationships.
8. Strengthen others by increasing self-
determination and developing competence.
Encourage the heart 9. Recognise contributions by showing
appreciation for individual excellence.
10. Celebrate the values and victories by creating
a spirit of community.
(Source: Kouzes & Posner, 2007:26)
The following section focuses on the research design applied in this study.
1.6 RESEARCH DESIGN
Saunders, Lewis and Thornhill (2007) state that the research design is the general plan
for a research study. It contains clear objectives, the reasons why a particular
organisation was chosen for the research, identifies sources from which data will be
collected and discusses the research limitations.
1.6.1 Empirical research
The two constructs investigated in this study were service quality and leadership. As
such, the two instruments were used on two different populations. The next section
describes the primary data collection process.
In the same way as the campuses are concerned about the quality of their relationships
with their students, the best leaders should seek feedback – positive and negative – on
how they are doing with their constituents. Leaders (principals) have multiple
constituents including managers, co-workers and direct reports. Only by grasping all of
these different perspectives can they learn to fully appreciate how they are seen from all
angles and points of view. With data from multiple perspectives they can see where
there is consistency and inconsistency in and agreement and disagreement about their
Page 43
23
strengths and weaknesses. Using this information, they can then determine what and
how to improve. To this end, the researcher decided to use the LPI survey.
All the questionnaires were distributed to the five campuses of “The College” and
completed by means of an online survey system. This system had been used by the
service provider as part of its national customer survey during the second semester of
2008 and had proven to be a highly efficient platform for administering survey
questionnaires.
The exceptionally high return rate can be attributed to the user-friendliness of the online
survey system and the fact that calls for participation in such surveys made from the
service provider as a regulatory body are usually perceived in a positive light. This
positive sentiment combined with the use of the online survey system and the scope
(the sample size for this study was 984 compared to the service provider’s more than 3
000 completed and usable questionnaires) and timing (August 2009 – February 2010)
of the data collection, paved the way for a high return rate.
For the SERVQUAL survey, the research population consisted of “The College’s” five
sites of delivery in Gauteng, Western Cape and KwaZulu-Natal. The campuses are
situated in Pretoria, Benoni, Johannesburg, Cape Town and Durban.
In order to optimise feedback, the participants should have had sufficient exposure to
provide meaningful feedback on their expectations and perceptions of the quality of their
student experience at “The College”. First-year students (enrolled at “The College” for
longer than six months) and second-year students participated. The respondents were
not limited to business faculty students only, but included students from all the faculties,
in an effort to prevent distorted results in terms of quality expectations and perceptions
(all students have expectations/perceptions of quality, not only the students in the
business faculty). As indicated in the previous section, the questionnaires were
distributed electronically to the campuses via the online survey system for students to
complete. An agreement was reached with “The College’s” management that students
Page 44
24
would be permitted to complete the questionnaire during a class session. Computer
laboratory time is scheduled for all qualifications offered at “The College”, both for first-
and second-year students. Lecturers in the computer laboratory would facilitate a
session guiding the students through the completion of the online SERVQUAL
questionnaire. Once the questionnaire had been completed, it was stored on the server
at the campus and sent back to the service provider for interpretation and analysis. The
study was completed during the period, August 2009 to February 2010 (see table 1.2 for
an explanation of the sampling method).
Leaders, in this instance, “The College’s” campus principals, completed the “LPI self”.
This instrument requires leaders to rate themselves on the frequency with which they
think they engage in each of the 30 behaviours (items). Seven staff members (who may
be selected by the leader) as well as the leader’s manager complete the “LPI observer”
questionnaire, rating their leader on the frequency with which they think they (the
principals) engage in each of the 30 behaviours. The respondents can indicate their
relationship to the leader as manager, co-worker, direct report or other observer. All the
observers’ feedback was anonymous except for the leaders’ manager.
As in the case of the SERVQUAL questionnaire, all the questionnaires were distributed
to the campuses electronically via the online survey system from the service provider’s
head office – five “LPI self” questionnaires (one for each principal) and 40 “LPI other”
questionnaires (seven constituents and one manager per principal). The questionnaires
were also completed electronically on each campus and sent back to the service
provider’s head office. All five campuses confirmed their cooperation in participating in
the LPI questionnaire. The study was conducted concurrently with the SERVQUAL
study and completed during the period from August 2009 to February 2010.
Both instruments (the questionnaires for SERVQUAL and the LPI) were pretested on
respondents who fitted the profile of both “The College’s” students and principals. This
was done to ensure that both instruments were understandable, which would increase
the reliability of the data collected.
Page 45
25
1.6.2 Research population
As stated earlier, the service provider is a PHE provider comprising four business-
related HE brands (trading divisions). The scope of this study was focused on one of the
brands referred to as “The College”.
“The College” has five sites of delivery in three provinces – Gauteng, Western Cape and
KwaZulu-Natal, with a total student population of approximately 5 000. This afforded the
researcher an opportunity to gain a representative view of student experiences in the
country and not merely in a specific region.
“The College’s” specific market is largely influenced by government legislation - hence
the need for such a study to contribute to the survival of “the College”. The selection of
“The College” over any of the other brands was based on various factors. The
compelling case for the inclusion of “The College” in this study included but was not
limited to the following:
• “The College’s” student profile is aligned with other PHE institutions (second
language, previously disadvantaged students).
• “The College’s” national footprint as described in the previous section.
• “The College” has the largest number of students of all the service provider’s brands
in excess of 5 000 students.
• The CEO of “The College” welcomed this study and felt that it would add value in the
long term.
Table 1.2 indicates the method of proportional stratified sampling that was used to
select the target population (ideal number of participants) to participate in the survey.
According to Tustin, Ligthelm, Martins and Van Wyk (2003:353), the stratified sampling
method implies that the population is divided into subgroups (strata) and random
samples are then drawn from each subgroup. For the purpose of this study, the
Page 46
26
population was segmented according to campuses across South Africa. Each stratum
was in proportion to its size in the overall population, that is, 5 085 students.
Table 1.2: Proportional stratified sampling
Proportional stratified sampling of 984 students (student numbers based on 2009 registrations)
Population segments Population size –
Students (N)
Sample size (n) Calculation
Campus 1
415 80 984 x 415 / 5 085
Campus 2
1 604 310 984 x 1 604 / 5 085
Campus 3
1 916 371 984 x 1 916 / 5 085
Campus 4
726 141 984 x 726 / 5085
Campus 5
424 82 984 x 424 / 5085
Total
5 085 984
1.7 DATA ANALYSIS
Since a random sample was drawn, the data were analysed by means of correlation
analysis.
1.8 LIMITATIONS OF THE RESEARCH
The principals involved in the study may have felt uncomfortable about being scrutinised
by their constituents and they could well have chosen constituents with whom they had
a good relationship, to participate in the “LPI observer” survey. Staff-turnover could
have been another limitation. There was also the possibility of a principal being newly
Page 47
27
appointed or leaving prior to the completion of the study, which would have impacted on
the study. Owing to operational constraints, it was decided that first-year students would
also participate in the SERVQUAL survey. It was thus possible that these students
would not yet have a clear perception of service quality at the campus. In addition, the
SERVQUAL questionnaire was completed as part of a class exercise. Students may
have completed it as quickly as possible and not given their true opinions of service
quality. This risk could have been avoided by not permitting students to leave the
classroom before the designated class time had expired. Another method would have
been for the lecturers to engage students and assist them with questions pertaining to
the questionnaire. The researcher was of the opinion that these interventions would not
hamper the objectivity of the student in completing the questionnaire. The study focused
on “The College” only and not on other brands of the service provider or other PHE
institutions. The data that were collected would represent a “snapshot” and not a trend,
that is, only the “depth” of data and not the “width” would be obtained. This would
provide a solid foundation for further research.
1.9 VALUE OF THE RESEARCH
This study could well be the first of its kind in PHE in South Africa, and the researcher
felt that the study would add value to the college on which the study was based in terms
of leadership development in the long term and improving the level of quality of services
offered to students. The LPI evaluation provides the basis for leadership development
and can become a continuous process in “The College” and thus also be applied to
other PHE institutions or even other service industries. According to Niemann and
Kotze (2006:623), if selection committees knew what leadership traits to look for when
appointing principals, this would foster a culture of teaching and learning and investing
in the future of education. Owing to the highly competitive nature of PHE, it is imperative
that providers offer a top-quality service to students if they wish to remain competitive.
This is confirmed by Abdullah (2005) who contends that service quality is also linked to
increased profits and is essential for maintaining a competitive advantage.
Page 48
28
No academic work was found that focused on the relationship between leadership and
service quality in HE, and more specifically, PHE. This study could therefore be the only
attempt to report on the impact of leadership practices or behaviour on service quality in
the PHE environment.
1.10 CHAPTER LAYOUT
Chapter 1: Introduction and background
Chapter 1 provided a brief overview of the background to the study, the problem
statement and research statement, followed by a discussion of the primary and
secondary research objectives, the research method and the definition of terms used in
the study.
Chapter 2: The PHE environment in South Africa
Chapter 2 forms part of the literature review focusing on the PHE environment in South
Africa. PHE practices in other countries will also be considered and compared with the
practices in South Africa.
Chapter 3: Service quality
Chapter 3 forms part of the literature review focusing on service quality. Definitions and
previous research in terms service quality will be investigated. The chapter will also
provide an in-depth overview of the adapted SERVQUAL instrument that was used to
conduct the study as well as alternative service quality measuring instruments. The
importance of service quality and the five dimensions of service quality will also be
discussed.
Chapter 4: Leadership
Chapter 4 forms part of the literature review focusing on leadership and leadership
practices. Definitions and previous research in terms of leadership will be investigated.
The chapter will also provide an in-depth overview of the LPI instrument that was used
Page 49
29
to conduct the study as well as alternative leadership assessment instruments. The
importance of leadership and its impact on service quality will also be discussed. The
five practices of exemplary leadership will be investigated.
Chapter 5: Research design
Chapter 5 will describe the research design, including the research strategy adopted,
data collection method, data analysis, research quality and delimitations and research
ethics.
Chapter 6: Findings
Chapter 6 will discuss the analysis of the collected data.
Chapter 7: Conclusions and recommendations
Chapter 7 will provide a concluding overview on the relationship between leadership
and service quality experiences in a PHE provider. The findings in chapter 6 will be
discussed in relation to the research objectives, and the shortcomings and
recommendations for further research will also be presented.
1.11 CHAPTER CONCLUSION
This chapter served as an introduction to the study. The first four sections included a
description of the background to the study, the problem and research statements as
well as the research objectives. This was followed by a brief discussion of the literature
study, research design and the data analysis. It included definitions of leadership and
service quality as well as an explanation of the empirical research process and research
population. The chapter concluded with a discussion of the limitations and value of the
research. The chapter layout of the whole study was also briefly indicated.
Chapter 2 will introduce the PHE environment which formed the background against
which the study was conducted.
Page 50
30
2. CHAPTER 2: THE PHE ENVIRONMENT IN SOUTH AFRICA
2.1 INTRODUCTION
Chapter 1 indicated that the primary objective of this study was to investigate the impact
of leadership practices on service quality in the HE environment in South Africa, and
more specifically, the PHE environment.
In support of this objective, the purpose of this chapter is threefold: (1) to present a brief
report on PHE in selected developed and developing countries, (2) to introduce the HE
environment in South Africa, and (3) to provide an overview of the PHE environment in
South Africa, past and present, as the background to this study. Since this chapter
provides the context for this study, it should be emphasised that only an overview of the
PHE environment is provided so as not to deviate from the main purpose of the study.
The main themes of this chapter are depicted in figure 2.1 below.
Page 51
31
Figure 2.1: Layout of chapter 2
Page 52
32
2.2 PHE IN SELECTED DEVELOPED AND DEVELOPING COUNTRIES
The PHE sector is growing worldwide, especially in countries where it was previously
nonexistent. In some countries such as the USA, Japan, Mexico and Brazil, PHE has a
long history. It is often well developed in these countries and sometimes perceived to be
superior to public institutions. In countries such as Japan and Brazil, more than 80% of
the enrolments in HE are in the PHE sector (Asmal, 2002).
There are also growing numbers in PHE enrolments in countries such as China,
Malaysia, the Philippines, Ukraine and India. By contrast, in some countries such as
Germany, Greece, Canada and Australia, the HE sector is dominated by public
institutions and PHE providers are almost nonexistent. HE systems in developing
countries tend to be more privatised than those in developed countries. In some
developed countries, enrolments in public HE are as high as 90 to 95% of all
enrolments. However, the growth rate of PHE in other countries is so high that there is a
possibility that it could eventually replace the public HE system in the near future. PHE
is ideal for two reasons: (1) governments do not always have the necessary resources
to fund HE; and (2) PHE promotes competition and thus improves the HE system as a
whole. The rate at which PHE is growing is indeed amazing (Tilak, 2006).
Worldwide, these institutions provide products that serve the three stakeholders in a
PHE institution – consumers, clients and owners. PHE institutions operate like
businesses and apply the fundamentals of business management in their day-to-day
activities. They are regarded as entrepreneurial and can be found in all societies of the
world. It is interesting to note that as far back as 1918 it was predicted that universities
would eventually evolve from a philanthropic state to a focus on profit and
entrepreneurship (Tilak, 2006).
In conclusion, according to Levy (2002), South Africa is not a world leader in terms of
PHE, but it is near the forefront of global trends in a commercial approach to PHE, with
Page 53
33
the focus on profits and market-related products. The following section deals specifically
with HE in South Africa.
2.3 HE IN SOUTH AFRICA
2.3.1 The HE environment
In 2010, the public HE environment consisted of 23 public institutions in South Africa.
These institutions included 11 universities, six comprehensive universities and six
universities of technology (South Africa. Council on Higher Education, 2009).
The problem statement in chapter 1 stipulated that PHE is increasingly competitive and
marketing oriented. Hay and Monnapula-Mapesela (2009) confirm that this is also true
of public HE and they appeal to contemporary universities to become more service
oriented and efficient to ensure their survival. The competition out there is intense.
Fourie (2009) adds that universities compete for students, research grants and
development contracts which compel academic leaders to become more
entrepreneurial.
According to Levy (2002), commercial PHE, much like other organisations in our
society, is business oriented. However, Fourie (2009) identifies the following three
characteristics that differentiate universities from other organisations: Firstly, universities
are systems that are loosely joined with different divisions, with weak links between
them and with the larger organisation. Secondly, universities are sometimes referred to
as professional bureaucracies where academics are independent to a certain extent
and quite often have a stronger allegiance to their subject than to the university. Thirdly,
the missions and goals of universities are often vague and although they are
traditionally non-profit organisations, they are forced to become more entrepreneurial.
Page 54
34
Hay and Monnapula-Mapesela (2009) further stipulate that universities are involved in
various social and economic activities and are largely reliant on government funding as
part of their income.
As can be seen from the above, the contemporary HE environment is characterised by
unique features and challenges.
2.3.2 Governance of HE
After South Africa’s first democratic election in 1994 and the abolition of apartheid,
policy development in South African HE commenced with the appointment of the
National Commission on Higher Education (NCHE). The main purpose of the NCHE
was to create a policy for the transformation of South Africa’s HE sector. This process
ultimately led to the promulgation of the Higher Education Act 101 of 1997.
The principal recommendations made by the NCHE in its attempt to transform the
system were as follows (Hay & Monnapula-Mapesela, 2009:13):
• an expansion of student enrolment and broader access to reach a wider
distribution of social groups and classes, including adult learners
• greater responsiveness to societal needs and interests
• increased cooperation and partnership in structures of governance, both at
system and institutional levels
• an HE system designed, planned, managed and funded as a single coordination
system comprising universities, technikons and colleges
• alignment of qualifications with the NQF allowing adequate channels, flexible
entry and exit points and horizontal and vertical mobility
• a strategic public funding framework taking into account the number of students
in different fields and levels of study; and addressing the special needs of
institutions, such as equity, redress and research infrastructure
Page 55
35
• the establishment of an HE quality committee responsible for programme
accreditation, institutional auditing and quality promotion
• distance education and resource-based learning
HE in South Africa is highly regulated and almost all decisions are made and plans
formulated according to set policies. Several years into the transformation of the HE
process, Hay and Monnapula-Mapesela (2009) indicate that a number of challenges still
exist in South African HE regarding policy analysis. Some of these challenges include
misconceptions about the value of policy which could hamper policy development and
the fact that some stakeholders deny their roles in policy issues and are unwilling to
make hard choices in the progressive implementation of transformation. There are
instances of resistance to policy analysis, funds are sometimes misdirected and
apparent poor policy planning prevents the potential advantages of sound policy
practices.
According to Botha (2009), regulatory measures by government have increased over
the last ten years. These measures include the reform of curricula, restructuring the
academic system and holding academics more accountable for the quality and
accreditation of programmes. Botha (2009) adds that all HE programmes must be
registered with the South African Qualifications Authority (SAQA), accredited by the
Higher Education Quality Committee (HEQC) and approved by the Department of
Education (DoE).
2.3.3 Challenges of HE
With reference to the characteristics of HE in South Africa, Parington and Brown (Koen
& Bester, 2009) report that, since the 1990s, HE worldwide has experienced intense
changes. These include an increase in the size and diversity of the student population,
a greater demand for quality by all stakeholders involved, more responsibility for
research and teaching as well as more emphasis on efficient and effective
management.
Page 56
36
According to Subotzky (2003a:354-355), the current HE system is characterised by the
following:
• marked race and gender inequalities, manifesting in three ways: skewed
enrolments in various fields of study and qualification levels;
unrepresentative staff complements, especially in senior ranks; and
disproportionate research output by race, gender, institution type and field
of study
• low participation, graduation and success rates
• uneven quality of teaching and learning
• a strict binary divide with a skewed academic/vocational mix and a separate
qualifications structure that restricts mobility across the system
• insufficient alignment between programmes and changing labour market
needs
• low levels of overall research output
• insufficient managerial and administrative capacity in institutions and in
government
• anomalous programme duplication in apartheid-created institutions
To tie in with the challenges mentioned by Subotzky (2003a) in the previous section,
Macgregor (2009) states that a study conducted on HE in 15 Southern African
Development Community (SADC) countries identified 20 leadership challenges facing
HE institutions (including PHE institutions). The study was conducted by the Southern
African Universities Association (SARU) in 2008. The findings indicated that SADC has
66 public universities, 119 publicly funded polytechnics or colleges and 178 private
universities or colleges. There are more private institutions, but the majority of
enrolments are in public institutions with 72% in contact study. The 20 HE leadership
challenges identified include the following:
Page 57
37
• data collection and availability
• access (of the just over one million students in HE in SADC countries over
70% are in South Africa)
• postgraduate registrations
• student success
• staffing
• funding
• planning capability
• infrastructure and space
• the quality of private provision
• commercialisation and entrepreneurism
• research development
• mobility
• quality
• qualification frameworks
• curricula
• information technologies
• policy and planning
• community engagement
• regional cooperation
• leadership
This study focused on two of the identified challenges, namely service quality and
leadership. The primary objective, as stated in chapter 1, was to investigate the impact
of leadership practices on service quality in PHE in South Africa as a source of
competitive advantage. The impact of leadership as an independent variable on service
quality as a dependent variable was examined.
Page 58
38
According to Coughlan (Fourie, 2009), HE has never been stagnant and is constantly
evolving. This statement implies that extreme challenges exist for transforming the
South African HE environment.
Furthermore, Fourie (2009) predicts a decidedly bleak picture of HE in South Africa. He
mentions that moving from the apartheid era to a single coordinated system and poor
quality primary and secondary education have contributed to a number of challenges
facing HE providers in South Africa. Added to these challenges are declining
government subsidies, outstanding student fees and the new concern of the obsession
with money and management shares with which quality has to compete. In support of
the statements made by Fourie (2009), Nzimande (2009) adds that the end of the
apartheid system spelt political freedom, which has led to the marketisation of many
public HE institutions. Nowadays, many institutions are preoccupied with generating
income, cutting costs and outsourcing. Institutional leadership are in a sense compelled
to focus more on administrative and economic matters instead of academic issues.
Similarly, in the early years of the new millennium, Subotzky (2003a) stated that, as in
other parts of the world, South African HE faces certain challenges. Besides the
increasing competition between public institutions, they also have to contend with
competition from PHE providers.
Based on the challenges mentioned by Subotzky (2003a) and Macgregor (2009) above,
it would appear that South African HE is not unique in terms of challenges that have to
be faced and difficulties that have to be overcome. HE in South Africa consists of two
subsectors or environments, namely the public HE environment and the PHE
environment. This section offered a broad overview of the public HE environment in
South Africa.
As indicated previously, the research in this study was conducted in the context of the
PHE environment in South Africa. The following section will explore the PHE sector.
The focus will be on the PHE environment, governance of the sector, student and
Page 59
39
institutional profiles, public-private partnerships, geographic locations, the for-profit
nature as well as a brief look at service quality and leadership in the sector.
2.4 PHE IN SOUTH AFRICA
2.4.1 The PHE environment
PHE in South Africa dates back as far as the 19th century, to the early years of the HE
system. According to Mabizela (2006), PHE institutions at that time did not remain
private but were later taken over by government to become state owned. Fehnel (2007)
explains that the first PHE institution, the South African College, was established in
Cape Town in 1829 by prominent members of society who desired better education for
their children. In 1918, this college was granted university status and is today known as
the University of Cape Town. The Correspondence Act 59 of 1965 was the first piece of
legislation by government to regulate private provision of postsecondary education in
South Africa (Mabizela, 2006).
The majority of for-profit PHE institutions were established in the 1990s. This surge of
private institutions during this period can be attributed to the growing demand in flexible,
postsecondary education, especially for market-related short courses and distance
education. The perception also existed of declining quality and instability in public
institutions owing to post-apartheid transformation (International Education Association
of South Africa, 2007).
The PHE sector in South Africa is small compared with the public HE sector in terms of
student numbers. However, as noted earlier, the public HE sector comprises 23
institutions, while the PHE sector consists of more than 100 providers. There is now
relative stability in the PHE sector in South Africa, with 78 registered institutions, 22
provisionally registered institutions and four institutions that have been granted
extension on provisional registration. The 22 provisionally registered institutions did not
fulfil the requirements for registration and had six months (until mid-2010) to “get their
Page 60
40
house in order” and comply with the requirements (South Africa. Department of
Education, 2010). This implies that by 2010, 104 PHE institutions in South Africa would
be competing for the same market segment. This ties in with the problem statement in
chapter 1, which describes the PHE environment as dynamic and highly competitive.
PHE institutions are mostly situated in urban areas and offer a wide range of product
offerings. Most are local institutions because many foreign institutions withdrew their
campuses from South Africa after the registration process of PHE institutions became
compulsory (see also section 2.3.2). The majority of institutions cater for middle-class
students and offer products of quality that are, in many instances, well rated by
employers. The product offerings of these institutions range from traditional degrees to
diplomas and certificates in niche areas such as theology, commercial arts, beauty,
media and marketing, tourism, education, law, sports science, business and
management. Some PHE institutions also offer contact sessions leading to
qualifications offered by the University of South Africa, a mega university offering open
distance learning (International Education Association of South Africa, 2007).
According to Subotzky (2003b), the PHE sector can contribute significantly to the
human resource and other developmental goals in South Africa. Mabizela (2006)
concurs and states that the NCHE recognised the presence of PHE and the potential
advantage this sector has to improve access to HE. The absence of regulation
contributed to the rapid growth of the PHE sector. According to the International
Education Association of South Africa (2007), in 1995 it was estimated that over 150
000 students were enrolled in private colleges across South Africa. The DoE became
concerned because it had received numerous reports implicating “fly-by-night colleges”
which lacked suitable qualified personnel and substandard product offerings. This led to
the establishment of quality assurance and accreditation processes to regulate the
sector. This was to become the responsibility of the Higher Education Quality
Committee (HEQC) of the Council on Higher Education (CHE). Consequently, all PHE
institutions are required to take part in the processes of quality assurance and
Page 61
41
accreditation. PHE institutions can only offer courses if they are registered with the DoE
(International Education Association of South Africa, 2007).
To date, the PHE sector has received little attention nationally and has been seen as
possible competition for the public sector. Owing to the high skills demand in South
Africa as well as demands from individual learners, the private sector can no longer be
ignored because of the limited capacity of public HE. There is potential for PHE to play
an increasingly significant role in providing niche market skills and tertiary education to
students (South Africa. Council on Higher Education, 2009).
2.4.2 Governance of PHE
As mentioned in the previous section, PHE can play an increasingly significant role in
giving students more access to HE, particularly in niche areas where considerable skills
shortages exist. One of the principal challenges in increasing the role of PHE is not to
overregulate the sector and not to allow “fly-by-night operators” into the market (South
Africa. Department of Education, 1997).
The 1997 White Paper on HE acknowledges funding, planning and quality assurance as
the three key factors in transforming HE in South Africa. It further states that these three
factors will contribute to high-quality institutions that are equitable, sustainable and well
managed. These institutions will also address the needs of economic growth and social
development in a new democracy (Council on Higher Education, 2003).
The HE Act 101 of 1997 and its amendments provide a framework that ensures that
PHE institutions are financially sound and have the necessary human and physical
resources to provide quality programmes. This Act also assigned the responsibility of
quality assurance to the CHE. This responsibility is borne by a permanent committee of
the CHE, the HEQC, whose functions include accrediting learning programmes,
conducting institutional audits of public and private HE institutions and promoting
quality. As mentioned by Fourie (2009) in section 2.3.3 above, the HE system in South
Page 62
42
Africa is a single coordinated system. There are two basic steps in the creation of such
a system in relation to private providers. Firstly, these institutions must be registered
with the DoE, and secondly, their programmes must be registered with SAQA. This
registration with SAQA confirms that the programmes adhere to the National
Qualifications Framework (NQF) (Council on Higher Education, 2003). Fehnel (2007)
asserts that the new constitution and the HE Act 101 of 1997 make it possible for PHE
providers to offer degrees and diplomas. These offerings could previously only be
provided by universities and technikons.
Since the 1st of April 2003, PHE institutions have had to comply with the new
Regulations for the Registration of Private Higher Education Institutions. These
regulations require institutions to register with the DoE. It also states that institutions
must be financially viable and comply with health and safety regulations (South Africa.
Council on Higher Education, 2009).
The Regulations for the Registration of Private Higher Education Institutions, as
described in Mabizela (2006), also insist that an organisation that applies to operate as
a PHE institution must provide a written declaration of the following: (1) that it will have
the necessary academic and administrative staff with the relevant qualifications and
experience to achieve the outcomes and objectives for each learning programme; (2)
that it will maintain adequate space, material and equipment to provide tuition to
achieve the outcomes and objectives of each learning programme; (3) that it will not
exceed the maximum student enrolments that the facilities can accommodate; and (4)
that it will maintain full student records, including academic and administrative records,
for each learning programme (Mabizela, 2006:157-158).
It is evident from the above-mentioned facts that the PHE environment is highly
regulated. According to Asmal (2002), this highly regulated environment will remove fly-
by-night PHE institutions that provide poor quality at a considerable cost. However,
Cosser (2002) contends that accreditation and registration by no means ensure quality,
Page 63
43
but that a quality culture should be nurtured in institutions to be accountable to students
and to serve the broader society.
2.4.3 The student and product profile in PHE
Most students enrol at PHE institutions on the basis that they do not have the financial
resources to pay for a public provider or that they do not meet the minimum entry
requirements of the public institution (Kruss, 2002). Levy (2002) concurs and adds that
students who cannot gain access to public HE or the public HE institution of their
choice, gain access through the private sector. In addition, Mabizela (Levy, 2003) states
that PHE institutions attract traditionally disadvantaged students who failed to gain
access to public institutions. These students often enrol at PHE institutions because of
the convenience offered by the institution and sometimes the perception is created that
a diploma or degree is easily obtainable. Mabizela (2005) adds that distance education
previously catered mainly for non-traditional students or working adults. Today, a large
number of students who have completed the National Senior Certificate enter distance
education through PHE institutions.
As mentioned in section 2.4.1 above, according to Asmal (2002), PHE institutions
mostly consist of small providers specialising in programme offerings such as
information technology, business, beauty therapy and hospitality, mostly at certificate
and diploma level. Mabizela (2006) confirms that most PHE institutions offer mainly
business and management studies. In addition, Subotzky (2003b) reports that few PHE
providers address the much-needed scarce skills fields such as science, engineering,
health and social services. Almost 50% of enrolments at PHE institutions in South Africa
are in commerce and management fields. The same trend is evident in other countries,
especially in the for-profit PHE market (Levy, 2002). According to the CHE, only 12 of
these institutions offer master’s degrees and three of them doctoral degrees (South
Africa. Council on Higher Education, 2009).
Page 64
44
2.4.4 The institutional profile of PHE
Many people still think of HE in terms of university education, despite the rapid growth
of PHE worldwide and the fact that most nonuniversity HE is privately owned (Levy,
2002). According to Asmal (2002), although there are many well-established role
players in the PHE market, there are currently no private universities registered in South
Africa.
Kruss (South Africa. Council on Higher Education, 2009) identifies two subsectors in the
South African PHE environment. According to Kruss, the first subsector consists of
institutions that hold out the promise of mobility or “better” education and the second
those that offer specialised credentials or “different” education.
Institutions that hold out the promise of mobility or, according to Kruss, “better”
education, generally target fairly privileged students. Students often choose these
institutions because they are convinced that they offer better qualifications, are linked to
the workplace and are internationally recognised. Some of these institutions are owned
by large holding companies with a strong profit motive. Their product offerings are
linked to the marketplace to prepare students for employment, especially in business
and management (Kruss, 2004a). The entrance requirements of these institutions are in
line with those of public providers. Matriculation exemption is needed to access
undergraduate degrees and a bachelor’s degree with relevant experience for access to
a Master in Business Administration (MBA). Fees in these institutions tend to be higher
than those in public institutions. Returns for shareholders are realised through the
income from student fees (Kruss, 2004b).
According to Kruss (South Africa. Council on Higher Education, 2009), institutions that
offer specialised credentials or (according to Kruss), “different” education, generally
target nontraditional students who would not normally enrol in HE. Students choose
these institutions because they offer employability, lower fees and flexibility in the
learning process. These institutions offer qualifications that are recognised and directly
Page 65
45
linked to employability in niche markets. Qualification offerings generally include new
occupational fields such as tourism, leisure, entertainment and media (Kruss, 2004a).
The study fees charged by these institutions are normally lower because they provide
for the previously disadvantaged market. These institutions are generally owned by
individuals who are also profit driven with a view to surviving as a small business,
relying on student fees as their main source of income (Kruss, 2004b). Figure 2.2 below
depicts the two subsectors of PHE in South Africa.
Page 66
46
Figure 2.2: PHE subsectors in South Africa
(Source: Kruss, 2004b:7)
Page 67
47
In the two subsectors discussed in the previous section, Levy (2003) identifies the
following categories of PHE institutions in South Africa: transnational institutions,
agency or franchise institutions, technical and vocational education and training
institutes (TVET) and corporate classrooms.
(1) Transnational institutions. This category includes PHE institutions owned by
foreign organisations, but based in South Africa.
(2) Agency or franchise institutions. These are local organisations that provide HE.
There is a strong profit orientation in this category and many of the PHE
institutions are owned by company groups listed on the Johannesburg Stock
Exchange (JSE). This category is far larger than the transnational category, both
in terms of students and campuses.
(3) TVET. Most of the PHE institutions in South Africa form part of this category
which consists mostly of small institutions offering qualifications at NQF level 5.
Most of the qualifications offered are also not regarded as traditional HE
qualifications.
(4) Corporate classrooms. The corporate classroom forms part of larger
corporations, such as Old Mutual, which prefers to train its own employees.
Linked to the previous section on categories of PHE institutions in South Africa, Kruss
(2002) confirms that profit orientation drives PHE in South Africa and that three forms of
ownership are evident.
Firstly, the larger PHE institutions in South Africa are owned by companies listed on the
JSE. These institutions operate much like traditional universities but with a highly driven
profit approach and student fees as their main source of income. The listed holding
company usually grants the initial funding to the PHE institution in the form of a capital
loan. The holding company then absorbs the profit generated by the institution.
Secondly, the largest number of private institutions is owned by individuals and
registered as a proprietary limited. The owners of these institutions bear the financial
risk and student fees tend to be lower.
Page 68
48
The third form of ownership resides in larger corporations that meet the training needs
of the organisation (and sometimes the industry).
The PHE provider selected for this study forms part of the first subsector of the PHE
environment previously explained, namely the mobility (so-called “better”’ education)
sector. The selected provider forms part of the second category as identified by Levy in
a previous section, which is the agency or franchise institution that is exclusively profit
driven.
Most of these for-profit-oriented PHE institutions have the following five common values
embedded in their vision and mission statements, as identified by Kruss (2002):
• They offer commitment to academic quality.
• They offer the promise of international recognition of qualifications.
• They offer the promise of a safe study environment.
• They aim to prepare students for the workplace.
• They emphasise the fact that their tuition models are flexible to fit the work and
family commitments of working students.
2.4.5 Public-private partnerships
According to Mabizela (2005), partnerships between public and private institutions have
existed throughout the history of HE in South Africa, and this is certainly not a new
practice. In the early 1990s, these partnerships took off and were a means whereby
foreign HE institutions could gain access to the South African market. This phenomenon
escalated when face-to-face public institutions became involved in distance education.
From the mid-1990s, there was pressure on historically white institutions (HWI) to
conform to the transformation process in South African HE. One of the goals of this
transformation process was to increase the enrolments of black students. Many HWIs
responded to this new challenge by offering distance education. This was mainly
achieved through partnerships with private institutions.
Page 69
49
According to Mabizela (2005), the public-private partnership concept grew because of
increased competition in both the public and private sectors, and he identifies the
following reasons for establishing partnerships, from the perspective of both the private
and public sectors:
• Private providers had to build their reputations and credibility as HE providers.
• Being in a partnership with a reputable public provider would attract more students
because this would give credibility to the PHE institution’s own programmes.
• There was a great need for public distance education students to receive face-to-
face tuition.
• Public institutions had to show compliance with the transformation agenda of HE.
• Many public institutions were (and still are) inaccessible to students residing in
remote areas, and being in partnership with a PHE provider was a means to reach
out to those students.
The South African government is in favour of increasing access to HE through public-
private partnerships. The condition for these partnerships, according to the CHE, is that
they must be responsible partnerships. The National Plan for Higher Education also
stipulates that PHE provision can complement public provision. The main goal of public-
private partnerships was to take HE to the people and create a sound HE academic
culture. However, these partnerships were not developed to address social
development, but were purely profit driven. If one considers the above reasons for the
formation of public-private partnerships, it is debatable whether the main goal of these
partnerships has in fact been achieved (Mabizela, 2005).
2.4.6 The geographic location of PHE institutions
Figure 2.3 below summarises the geographic location of PHE institutions by province.
Page 70
Figure 2.3: The geographic location of PHE ins
(Source: Adapted from
Figure 2.3 illustrates the number of PHE institutions across the nine provinces in South
Africa. Gauteng hosts 57 of all registered PHE institutions, the
KwaZulu-Natal 17, the Eastern Cape four, North West two and Limpopo one. There are
no registered PHE institutions in the Free State, Northern Cape and Mpumalanga.
According to Mabizela (2006), the geographic spread of PHE institutions is
type of customer (student) in the PHE environment. He suggests the following three
reasons for the location of these institutions:
50
: The geographic location of PHE institutions in South Africa
(Source: Adapted from South Africa. Council on Higher Education, 2009:12)
Figure 2.3 illustrates the number of PHE institutions across the nine provinces in South
Africa. Gauteng hosts 57 of all registered PHE institutions, the
Natal 17, the Eastern Cape four, North West two and Limpopo one. There are
no registered PHE institutions in the Free State, Northern Cape and Mpumalanga.
According to Mabizela (2006), the geographic spread of PHE institutions is
type of customer (student) in the PHE environment. He suggests the following three
reasons for the location of these institutions:
titutions in South Africa
South Africa. Council on Higher Education, 2009:12)
Figure 2.3 illustrates the number of PHE institutions across the nine provinces in South
Africa. Gauteng hosts 57 of all registered PHE institutions, the Western Cape 22,
Natal 17, the Eastern Cape four, North West two and Limpopo one. There are
no registered PHE institutions in the Free State, Northern Cape and Mpumalanga.
According to Mabizela (2006), the geographic spread of PHE institutions is linked to the
type of customer (student) in the PHE environment. He suggests the following three
Page 71
51
Firstly, institutions are located in urban areas with high levels of business activities.
There are large numbers of employees (potential customers or students) who need
higher-level skills or qualifications. Secondly, there is a wide variety of industries in
these areas that utilise the skills of these institutions, for example, training programmes
offered after hours for personnel. Finally, there is a strong presence of public institutions
in these areas. Students who fail to gain entrance to a public HE institution, have the
option to enrol at a PHE provider.
2.4.7 For-profit nature of PHE
The problem statement in chapter 1 states that PHE in South Africa is increasingly
competitive and marketing oriented. In order for PHE institutions to survive in this
dynamic environment, they must be profit driven and have an entrepreneurial
orientation. Kruss (2004b) concurs with this statement by indicating that the primary
reason for the establishment of these institutions is indeed profit. According to Levy
(2002), commercial PHE originates from market needs and not from government
initiatives, and it is directly linked to economic forces. Hence most of the PHE
institutions in South Africa are profit driven and the qualifications offered reflect the need
as identified by students (South Africa. Council on Higher Education, 2009). This is
confirmed by Levy (2003), who states that in South Africa, according to law, PHE
institutions must declare themselves as for-profit or nonprofit. For-profit institutions form
the majority of the PHE sector, which is fairly unique since PHE institutions in most
parts of the world are legally nonprofit organisations.
As mentioned previously in section 2.4.1, the PHE sector experienced major growth in
the 1990s. Fehnel (2007) suggests the following possible three reasons for this growth:
• the conviction that government was going to invest substantially in education and
training
• the lack of regulation in the sector
• the belief that this sector would become highly profitable
Page 72
52
In addition, Mabizela (2006) states that many of the larger PHE providers are listed
companies on the JSE. One of the additional reasons for listing these institutions on the
JSE is to increase their capital base with an accompanying additional source of income
- in other words, greater profit.
The for-profit element is evident in almost all of the key aspects of South African PHE
providers. These include the provider’s mission, the functions of role players in HE, links
to the job market and relationships with the public sector. Growth in South Africa’s PHE
sector fits the worldwide surge of PHE growth in other parts of the world. The unique
entrepreneurial and for-profit focus in the South African PHE sector was mentioned
earlier (Levy, 2002). Tilak (2006) adds that a for-profit PHE institution operates like a
business, with every department treated as a so-called “profit centre”. In other words,
every single department, from admissions to the research department, must focus on
generating as much revenue as possible.
As mentioned earlier in section 2.3.1, in order to survive in the face of intense
competition, public HE institutions also need to be efficient and service oriented. Levy
(2003) adds that there may also be competition between public and private providers of
HE for funds and students. The possible threat that public institutions should be aware
of is that private institutions can easily adapt to the market demand and satisfy the need
for job-related qualifications which are becoming increasingly popular.
The discussion above confirms that the PHE sector is profit driven and that it responds
to market forces and demands from customers (students). Mabizela (2005) agrees by
stating that PHE institutions, like all other organisations, must be dynamic to ensure
their long-term survival in the market. This means that PHE institutions are just like
other businesses that continually face new challenges and are often compelled to seek
alternative means of growth in order to remain competitive.
Page 73
53
2.4.8 Service quality and leadership
This section briefly discusses the importance of service quality and leadership in the
PHE environment. A detailed discussion of these two constructs will be provided in
chapters 3 and 4 respectively.
According to Varey (1993), HE is an environment in which service quality is recognised
as a key strategic and business tool. Quality in HE is one or more of the following
(Varey, 1993:45):
• a measure of high standards
• uniformity in meeting process specifications
• fitness for purpose or use
• value for money
• successful transformation of the educated
Varey (1993) adds that managing quality requires effective leadership. Because the
focus is on value for money, continuous service quality improvement is necessary for
the success and survival of organisations providing HE. Service quality cannot therefore
be emphasised enough. Levy (2002) acknowledges the significance of this in for-profit
PHE by stating that the student is the paying customer and most of the PHE providers
in South Africa rely totally on student tuition fees as their main source of income. Levy
(2003) adds that the management style of a business is in line with that of a PHE
institution since profit is the main focus. One of the core divisions in this “business-like”
PHE institution is the faculty, whose primary function is to serve students. These
faculties have even been referred to as “delivery people”, because they deliver to and
for students. Public providers frequently offer qualifications in line with their own
interests. By contrast, PHE institutions offer qualifications based on the needs of the
market. Breneman (2005) concurs with these statements and reports that one of the
characteristics of a successful PHE provider is a focused approach to training for
employment and treating students as clients or consumers.
Page 74
54
2.5 CHAPTER CONCLUSION
This chapter provided an overview of the HE environment in South Africa with the
emphasis on the PHE environment. The first section of this chapter briefly mentioned
PHE in selected developed and developing countries. The next section briefly detailed
the public HE environment, including the governance and challenges of this sector. A
discussion on the PHE environment followed with the emphasis on governance, student
and institutional profile, partnerships with public providers, the geographic location of
PHE institutions and the for-profit nature of these institutions. Service quality and
leadership, the primary focus of this study, were introduced in the PHE environment.
Many authors maintain that the PHE environment is dynamic and constantly changing.
This indicates the importance of continuously studying this sector in order to understand
how it can be developed to support the HE system in South Africa, together with the
public HE sector.
Chapter 3 will investigate service quality as one of the constructs that forms part of the
main purpose of this study – the impact of leadership practices on service quality in
PHE in South Africa. The SERVQUAL instrument will also be reviewed as a means to
measure service quality in a PHE institution.
Page 75
55
3. CHAPTER 3: SERVICE QUALITY
3.1 INTRODUCTION
The previous chapter provided an overview of the HE environment in South Africa with the
emphasis on the PHE environment. The purpose of this chapter is to gain insight into quality
and more specifically service quality, and its significance in the PHE environment as a
competitive factor. Quality and quality management will be introduced and the focus will then
shift to services and service quality. The chapter goes on to identify different service quality
models and offer a detailed description of the SERVQUAL measurement instrument. The use
of this particular measurement instrument is also justified in this study. The chapter concludes
with criticisms of the SERVQUAL instrument and its applications in research.
The main sections of this chapter are depicted in figure 3.1 below.
Page 76
56
Figure 3.1: Layout of chapter 3
Page 77
57
3.2 QUALITY
The following section explains quality, its history and benefits as a business principle
and various quality experts’ theories of the concept.
3.2.1 Overview of quality
There are numerous definitions of quality. Some experts refer to it as zero defects while
others see it as a superior or excellent product or service (Ramphal, 2011b). Many
quality professionals simply refer to quality as “everything that makes a consumer
satisfied” (Harding, 2005). According to Pycraft, Singh, Phihlela, Slack, Chambers and
Johnston (2010), quality is consistent with the expectations of customers, which
involves “doing things right”. Most organisations regard quality as essential because in
some instances it is the only visible part of what the organisation does and it is
something that the customer can judge fairly easily. If the customer’s perception is that
the product is of a high quality, the possibility exists that he or she will return to the
business in the future.
The core focus of quality is to meet customer expectations. Pycraft et al. (2010:505)
define quality as “… the degree of fit between customers’ expectations and customer
perception of the product or service”. Figure 3.2 indicates that perceived quality is
governed by the gap between the customer’s perception and expectation of the product
or service. If the product or service experience was better than expected, then the
customer will perceive the quality thereof to be high. The converse is also true: if the
product or service experience was less than expected, its quality will be perceived as
low and this may lead to dissatisfaction. Hence, if the customer’s expectations are met,
he or she deems the quality to be acceptable.
Page 78
58
Figure 3.2: Perceived quality is governed by the gap between the customer’s P and E of the product or
service
(Source: Pycraft et al., 2010:506)
The gap between the customer’s perception and expectation of quality will be discussed
in more detail in sections 3.6 and 3.7 in this chapter.
In an attempt to define quality, a study involving 86 organisations in the USA was
conducted. The study involved asking the managers of these organisations to define
quality.
The results of the study indicated various definitions of quality as indicated below
(Evans 2011:5):
• perfection
• consistency
• eliminating waste
• speed of delivery
• compliance with policies and procedures
• providing a good, usable product
• doing it right the first time
• delighting or pleasing customers
Page 79
59
• total customer service and satisfaction
One of the most respected collections of definitions of quality was compiled by Garvin
(Foster 2010). According to this definition, quality is transcendent, product based, user
based, manufacturing based or value based (Foster, 2010:30).
These terms are explained below:
• Transcendent. Quality is something that is intuitively understood but nearly
impossible to communicate, such as beauty or love.
• Product based. Quality is found in the components and attributes of a product.
• User based. If the customer is satisfied, the quality of the product is acceptable.
• Manufacturing based. If the product conforms to the design specifications, its
quality is satisfactory.
• Value based. If the product is perceived to provide good value for the price, its
quality is acceptable.
Based on this collection of the definition of quality, Garvin (Foster, 2010:31) compiled a
list of eight product quality dimensions:
• Performance refers to the efficiency with which a product achieves its intended
purpose.
• Features are attributes of a product that supplement the product’s basic
performance.
• Reliability refers to the propensity for a product to perform consistently over its
useful design life.
• Conformance is perhaps the most traditional definition of quality. When a product is
designed, certain numerical dimensions for its performance are established, such as
capacity, speed, size, durability and the like. These numerical dimensions are
referred to as specifications.
• Durability is the degree to which a product tolerates stress or trauma without failing.
• Serviceability is the ease of repair of a product.
Page 80
60
• Aesthetics are subjective sensory characteristics such as taste, feel, sound, look
and smell.
• Perceived quality is based on customer opinion.
There does not seem to be a single recognised definition of quality. However,
regardless of the context in which it is used, it usually distinguishes one product,
process, service or organisation from another (Dale, Van der Wiele & Van Iwaarden,
2007).
It is necessary to consider the history of the quality movement in order to provide a
holistic perspective of quality as a concept.
3.2.2 A brief history of quality
Table 3.1 below depicts the brief history of the quality movement.
Table 3.1: History of quality
Early 1900s Frederick Taylor, Frank and Lillian Gilbreth, and scientific management
1920s Walter Shewhart and statistical process control
1930s Dodge and Romig introduce acceptance sampling
1940s Military standards introduced
1950s Deming and Juran introduce quality management in Japan
1960s Taguchi method and other tools developed
1970s Quality becomes strategic, beginning of major adoption in the United States
1980s “If Japan Can, Why Can’t We?” airs on U.S. TV; introduction of lean with
Page 81
61
Schonberger, Shingo and Hall; TQM and empowerment become watchwords
in quality field; Baldrige award programme implemented
1990s Re-engineering and Six Sigma become major movements with mixed results;
wide dissemination of quality approaches
2000s Growth of supply chain management and improvement of supplier
development; lean Six Sigma becomes popular; contingency theory in quality
becomes recognised as important
(Source: Foster, 2010:60)
Table 3.1 shows that quality as a concept has evolved and developed over many years.
3.2.3 The benefits of quality
A focus on quality in an organisation indicates several benefits, as highlighted in figure
3.3, which illustrates the ways in which quality improvements can impact on a
company’s performance. Revenues can be increased by better sales and prices in the
market. Costs can also be reduced by improved efficiencies and productivity (Pycraft et
al., 2010).
Page 82
62
QUALITY UP
PROFITS UP
Revenue up
Price
competition
down
Sales volume
up
Service costs
downImage up
Inspection and
test costs
down
Scale
economies up
Rework and
scrap costs
down
Inventory downProcessing
time down
Complaint and
warranty costs
down
Productivity upCapital costs
down
Operation
costs down
Figure 3.3: Higher quality has a beneficial effect on both revenue and costs
(Source: Pycraft et al., 2010:504)
In addition to the benefits of quality indicated in figure 3.3, Dale et al. (2007:12–23)
report the following benefits of quality after studying a number of successful
organisations in the USA:
• Quality and service improvements enhance an organisation’s revenue.
• Higher quality leads to higher profit margins since customers are prepared to pay a
premium price for better quality.
Page 83
63
• Quality increases productivity.
• Quality leads to better performance in the marketplace.
• Quality means improved business performance.
• Quality improves work life.
• Quality decreases costs. As quality increases, there is a decrease in complaints,
scrap and rework that results in a decrease in costs (Gryna et al., 2007).
It is evident from the section above that a focus on quality will not only lead to tangible
benefits for the organisation, but also intangible benefits such as a better quality work
life for its employees.
3.2.4 Theories on quality
There are several theories on quality management. Theories can be established in two
ways, namely induction and deduction. Induction involves observation and description,
while deduction involves the development of a model based on prior research and tests
to verify models (Foster, 2010). Many of the concepts and models in quality
management have been developed through induction by quality experts such as
Deming, Juran and Crosby, who based their principles on years of experience in a wide
variety of organisations (Ramphal, 2011b).
Table 3.2 provides a summary of the research of the leading quality experts.
Table 3.2: Research of the leading quality experts (1950s–1980s)
Expert Theory Summary
W. Edwards Deming Emphasis on the management of a system for the improvement of
quality. His thinking was based on the use of statistics for continual
improvement.
Joseph M. Juran Promoted the view that quality problems are mainly the result of
insufficient and ineffective planning for quality. Companies must
revise and master their strategic planning processes. He also
Page 84
64
identified three processes essential for managing quality
improvement. These three processes are known as the “Juran
Trilogy” and comprise planning, control and improvement.
Kaoru Ishikawa He was a great believer in training and maintained that success
depends on everyone in the organisation being responsible for
statistical analysis and interpretation. Perhaps his greatest
achievement was the development of the seven basic tools of
quality, namely process maps, check sheets, histograms, scatter
plots, control charts, cause and effect diagrams and Pareto analysis.
Armand Feigenbaum He studied quality in the context of a business organisation; his main
contribution to quality thinking in America was the claim that the
entire organisation should be involved in quality improvement. He
proposed a three-step process to improving quality: quality
leadership, quality technology and organisational commitment.
Philip Crosby The core of his theory is that quality can be a source of profit. His
approach focused on behavioural and motivational factors rather
than on statistical methods, and he adopted a human approach to
the quality improvement plan.
Genichi Taguchi Ideal quality refers to a reference point for determining the quality
level of a product or service. This reference point is expressed as a
target value. Ideal quality is delivered if a product or service performs
its intended function throughout its projected life under reasonable
operating conditions without harmful side effects. In services,
because production and consumption often occur simultaneously,
ideal quality is a function of customer perceptions and satisfaction.
Service quality is measured in terms of loss to society if the service is
not performed as expected.
(Source: Adapted from Foster, 2010:60-76)
Page 85
65
3.2.5 Core quality variables of various quality experts
As indicated in table 3.2, the leading quality experts identified various common themes.
Foster (2010) compiled a list of these common themes as highlighted below.
(1) Leadership. The role of the leader is the critical and primary force behind quality
improvement.
(2) Employee involvement. Employees must be trained and developed.
(3) Quality assurance. Quality can only be assured during the design phase of the
production process. A proactive approach towards quality should be followed.
(4) Customer focus. An understanding of customer requirements is crucial to quality
management.
(5) Quality philosophy. A quality philosophy towards quality improvement is
important.
(6) Information analysis. Data gathering and statistical control are key variables for
quality improvement.
(7) Strategic planning. This provides a framework to link the quality strategy to the
company’s key business factors.
(8) Infrastructure. An environment must be created to support quality management
efforts.
(9) Team approach. Cross-functional and project teams are sound approaches to
quality improvement efforts.
(10) Focus on the quality department. The quality department should refrain from
performing a policing function and focus instead on a coaching function. The
message should be that the entire workforce should take responsibility for quality
improvement.
(11) Breakthrough. The focus should be on radical improvement instead of
continuous improvement.
Page 86
66
3.3 QUALITY MANAGEMENT
In this section only an overview of quality management as a business principle is
provided so as not to deviate from the main purpose of the study.
Chapter 1 indicated that the primary objective of this study was to investigate the impact
of leadership practices on service quality in the HE environment in South Africa, and
more specifically, the PHE environment. The key element in implementing quality
strategies and achieving a successful competitive advantage is leadership by top
management. Commitment to quality by management is assumed but it is not enough.
Top management must develop and implement strategies for quality through personal
leadership (Gryna et al., 2007).
3.3.1 Approaches to quality
Two of the most popular approaches to quality, namely total quality management (TQM)
and the Six Sigma approach will be briefly described in the following sections.
3.3.1.1 Total quality management (TQM)
The focus of TQM is on designing and delivering quality products to customers. It is a
company-wide approach to quality and can significantly improve company performance.
After World War I, the TQM approach was developed and implemented in Japanese
organisations by Dr W. Deming and Dr Joseph Duran.
During the last few decades, TQM has become the basis of quality programmes in large
and small organisations alike (Ehlers & Lazenby, 2010; Pearce & Robinson, 2005). In
addition, Pearce and Robinson (2005) state that TQM can be viewed as a new
organisational culture. It focuses on customer satisfaction, continuous improvement and
relationships based on teamwork and trust. Furthermore, Pycraft et al. (2010) define
TQM as a holistic approach to quality management that emphasises the role of
everyone in the organisation to influence and improve quality.
Page 87
67
Similarly, Malnyk and Denzler (cited in Ehlers & Lazenby, 2010:370) define TQM as “a
culture; inherent in this culture is a total commitment to quality and attitude expressed
by everybody’s involvement in the process of continuous improvement of products and
services, through the use of innovative scientific methods”.
a Principles of TQM
According to Ehlers and Lazenby (2010), this definition identifies the four basic
principles of TQM. The first principle is commitment to quality. The entire workforce,
including top management and suppliers, need to be committed to quality. The second
principle involves the use of scientific tools and methods to help managers effect
changes in processes and procedures. The third principle is involvement in quality
through teamwork and empowerment. The last principle is never-ending continuous
improvement.
b The focus of TQM
Similar to Ehlers and Lazenby’s four principles mentioned above, Pycraft et al. (2010)
state that the focus of TQM is on
• meeting the needs of customers
• covering the whole organisation
• including everyone in the organisation
• examining all costs relating to quality
• doing things “right the first time”
• developing systems to support quality and improvement
• continuous improvement
TQM is thus a vital quality approach in the sense that it involves everyone in the
organisation in the process of continuous improvement.
3.3.1.2 Six Sigma
The Six Sigma approach was first used by Motorola in the 1980s and has been
Page 88
68
described by some as the new TQM. The core of the Six Sigma methodology is an
improvement in profitability. It requires leadership and is a popular continuous
improvement tool for realising above-average financial returns. The Six Sigma approach
consists of five steps which include define, measure, analyse, improve and control
(Ehlers & Lazenby, 2010; Brue, 2002).
According to Pearce and Robinson (2011), the Six Sigma approach is highly analytical
and rigorous in its focus on achieving improved profits through defect reduction,
improved customer satisfaction and best-in-class performance. Six Sigma, like TQM,
also focuses on leadership, education, customers and statistics. According to Brue
(2002), Six Sigma is a statistical concept that measures a process in terms of defects
(3.4 million defects per million opportunities), it is a management philosophy that
focuses on the elimination of defects. Six Sigma is not a theory. It defines, measures,
analyses, improves and controls the processes that link quality improvement to bottom-
line results.
3.3.2 Strategic quality planning
Effective strategies focus on business requirements (Ramphal, 2011b). Strategic
planning helps leaders to determine an organisation’s future by aligning the
organisation’s vision, mission, goals and objectives to ensure survival in the long term.
In addition, according to Summers (2005), for every organisation that wishes to
maximise its success, decisions on what to emphasise and how resources should be
allocated must be made accordingly. Strategic planning involves everyone in linking the
organisation’s vision, mission, and core values to the present situation in order to focus
strategic activities now and in the future. Strategic quality planning adopts a broader
view of the planning process than traditional strategic planning as indicated in table 3.3
below.
Page 89
69
Table 3.3: Quality and traditional strategic planning
Strategic Quality Planning Traditional Strategic Planning
Focus on customers. Focus is not defined or spread among many
considerations.
Leaders determine critical success factors. Leaders lack understanding of factors critical to
success.
Goals and objectives are process and results
orientated.
Goals and objectives are results orientated.
Goals and objectives are based on data and are
driven by trend or pattern analysis.
Goals and objectives may be based on hunches or
guesses.
Focus is on processes. Focus is on products.
Alignment exists between critical success factors,
mission, vision, goals, objectives and day-to-day
activities.
No alignment exists.
Everyone knows how his or her day-to-day
activities align with critical success factors, mission,
vision, goals and objectives.
Few people know how their day-to-day activities fit
in with the plan.
Improvement activities are focussed on activities
critical to success.
Improvement activities lack focus.
Improvement activities are both within and across
functional areas.
Improvement activities are usually within functional
areas.
(Source: Summers, 2005:113)
Strategies are so-called “game plans” for the future and define strategic quality
management as creating long-term customer goals describing the approach to achieve
Page 90
70
those goals. Strategic quality management should be part of the overall strategic plan
and developed and implemented by top management (Gryna et al., 2007).
The basic elements of strategic quality management include the following (Gryna et al.,
2007:243-244):
• Define the mission and critical success factors.
• Study the internal and external environments, and identify the strengths,
weaknesses, opportunities and threats to the organisation.
• Define a long-term, ultimate goal (a “vision”).
• Develop key strategies to achieve the vision.
• Develop strategic goals (long term and short term).
• Subdivide the goals and develop operational plans and projects (“deploy the goals”)
to achieve the goals.
• Provide executive leadership to implement strategies.
• Review progress with measurements, assessments and audits.
Strategic quality management is a relatively new concept and detailed approaches to its
implementation are still evolving. However, there are certain necessary components for
strategic quality management to be successful, such as a focus on customer needs;
continuous improvement throughout the organisation; understanding the customer
market; leadership; translation of strategies into annual business plans; and adequate
resource allocation (Gryna et al., 2007).
Inherent in this study is the concept of services, which will be discussed in the following
section.
3.4 SERVICES
Services are as old as transactions and interactions between people. Services have
been studied since the 1980s, when socialists examined service customers and service
personnel in department stores by means of participation and observation (Pieters &
Botschen, 1999).
Page 91
71
Today, service managers need to design service delivery systems with technical
efficiency which provides a satisfying experience for customers (Prideaux, Moscardo &
Laws, 2006). The importance of sound service delivery is evident in the fact that
organisations not only compete in terms of physical products, but also on the basis of
the service provided. Owing to the huge number of product offerings in the market, the
competitive advantage of the service component is becoming increasingly critical.
Organisations with similar product offerings can differentiate themselves through service
delivery – not “what” is offered but “how” it is offered. The “how” is what truly adds value
to the customer (Kandampully & Kandampully, 2006). The vital role of service quality
will be elaborated on in section 3.5.3.
3.4.1 Service defined
Services are often produced and consumed at the same time. This implies that the
consumer is in the “factory” and experiences total service in the organisation’s physical
facility. This “factory” cannot be hidden and has a powerful impact on the consumer’s
perception of the service experience (Bitner, 1992).
Wilson, Zeithaml, Bitner and Gremler (2008:6) define services as “all economic activities
whose output is not a physical product or construction, is generally consumed at the
time it is produced, and provides added value in forms (such as convenience,
amusement, comfort or health) that are essentially intangible concerns of its first
purchaser”. In addition, according to Lamb, Hair, McDaniel, Boshoff and Terblanche
(2004), services are deeds or acts that cannot be physically owned and are thus
intangible. The principal characteristic of a service is that it is intangible. The
characteristics of services will be discussed in more detail in section 3.4.3.
3.4.1.1 Service marketing mix
One of the fundamental concepts in marketing literature is the marketing mix. It is
referred to as the elements that an organisation can control to satisfy or communicate
Page 92
72
with customers. It consists of the four Ps: product, price, place (or distribution) and
promotion (Wilson et al., 2008).
In addition to the four Ps of the marketing mix, the service marketing mix consists of
people, physical evidence and process. People refer to all human activities that are part
of the service delivery process and that influence the customer’s perception of service
delivery. This includes the organisation’s personnel, customers and other customers in
the service environment. Physical evidence is the environment in which the service is
delivered and where interaction between the organisation and the customer takes place.
It includes all tangible elements that assist the communication or performance of the
service. Process includes the flow of activities, procedures, mechanisms and operating
systems used to deliver the service (Lamb et al., 2004; Wilson et al., 2008)
3.4.1.2 Service categories
Services can be categorised as internal or external services, as well as voluntary or
involuntary services. According to Foster (2010), in external services, it is the customer
who pays the bill. Internal services are “in-house” services such as mail, printing and
data processing. Foster (2010) also states that voluntary services are the services the
customer seeks such as a hotel, a petrol station or the choice of a restaurant.
Involuntary services are those services the customer does not necessarily choose such
as a hospital or police department. Customers generally have unclear expectations of
this type of service. It is also more difficult to realise high levels of satisfaction in
involuntary services.
3.4.2 Management of services
According to Kotler (2000), well-managed service organisations share certain common
practices, namely a strategic concept, a history of top management commitment to
quality, high standards, systems for monitoring service performance and customer
Page 93
73
complaints and an emphasis on employee satisfaction. These practices are explained
below.
• Strategic concept. Top service organisations are “obsessed” with their customers,
know and understand their customers’ needs and have well-developed strategies to
satisfy these needs.
• Top management commitment. Top management do not focus only on financial
performance, but also on service performance on a month-to-month basis.
• Top service organisations’ high standards for service. A distinction can be made
between organisations offering a “good” service and those that strive for a
“breakthrough” of a 100% defect-free service.
• Auditing of service performance. Organisations should monitor systems that
regularly audit service performance.
• Satisfying customer complaints. On average, a satisfied customer tells three
people about a good experience, whereas an unsatisfied customer complains to 11
people.
• Satisfying both employees and customers. Top service organisations believe that
employee relations affect customer relations, and the focus is therefore on employee
support and rewards.
Palmer (2008) concurs with the common practices mentioned by Kotler (2000) in the
previous section and indicates that service quality does not happen by chance.
Organisations need to develop strategies for reliable top-quality services. Palmer (2008)
further contends that certain characteristics are evident in organisations that render
these high-quality services. These include top management commitment where
measures of service quality are just as important as financial performance – hence a
customer-focused approach in the organisation and a culture that rewards employees
for being customer-centric. This entails satisfying customers and employees on the
basis that satisfied employees will probably result in satisfied customers. Suitable
service quality monitoring systems are required for this.
In addition, according to Wilson et al. (2008), successful service organisations share
certain common themes such as commitment to employee investment and trust-based
Page 94
74
relationships as well as value-driven leadership. Similarly, Seth, Deshmukh and Vrat
(2005) report that if internal customers are dissatisfied, it will be difficult to establish
satisfactory quality service for external customers. Owing to the globalisation of services
as well as increased competitive demands, the involvement of top management and
leadership is becoming increasingly vital in rendering excellent services.
Grönfeldt and Strother (2006) argue that the traditional role of the manager is changing
in the new service era. There is a movement towards a more participative and
supportive role of encouraging, rewarding and empowering employees. In the new
service era, managers are becoming more of a combination of coach, cheerleader and
team member. Table 3.4 compares the new role with the traditional role of managers.
Table 3.4: The changing role of the manager in services
The manager as Traditional role New service era role
Coach
Top-down management
Authoritative
Clearly the boss
Mentors and trains
Empowers
Encourages
Cheerleader
Occasionally gives formal
recognition for outstanding
performance
Gives special awards
Recognises employees
through raises and bonuses
Frequently recognises good
performance
Supports
Encourages by attitude
Helps all organisational
members feel good about
themselves and their role in the
company
Team member
Never
Participates actively
Does his or her part
Leads by example
(Source: Adapted from Grönfeldt & Strother, 2006:231)
Page 95
75
As indicated in table 3.4, there is a significant difference between the traditional roles of
the manager in services compared to the new service era role. The new role adopts a
more participative and “human” approach to the management of services.
3.4.3 Service characteristics
The diversity in service industries gives rise to certain unique characteristics, as
highlighted below. A physical product may be involved, such as a restaurant meal.
Contact with a service person might not take place, for instance, using an ATM machine
instead of withdrawing money inside a bank and interacting with a teller. Contact with a
service person may be verbal or in person (a call centre or a salesperson). The service
might be brief or extended, for example, a retail transaction or electricity services.
Finally, the service person may have various degrees of knowledge, say a fast-food
service or financial advice from a stock broker (Gryna et al., 2007).
Services are differentiated from physical products by four unique characteristics, namely
intangibility, inseparability, perishability and heterogeneity (Lamb et al., 2004). These
characteristics of services will be described in more detail in the sections below.
3.4.3.1 Intangibility
Services cannot be seen, touched, tasted, felt or smelled in the same way as physical
goods can be sensed. They cannot be inventoried or stored for long periods of time and
they are difficult to duplicate. There are usually little or no tangible evidence once the
service has been performed. Services are also more difficult to measure than physical
products (Foster, 2010; Grönroos, 1988; Kotler, 2000 ; Lamb et al., 2004; Lewis, 2007;
Palmer, 2008).
3.4.3.2 Inseparability
Physical products are produced, sold and then consumed, whereas services are often
produced, sold and consumed at the same time and place (Lamb et al., 2004). This
means that the production and consumption of services are inseparable activities.
Page 96
76
Services cannot therefore be produced in a centralised location and consumed in
decentralised locations. Hence the service interaction between staff and customers is
an integral part of the service delivery process (Lewis, 2007; Palmer, 2008). Kotler
(2000) and Foster (2010) agree with this view and add that services are produced and
consumed simultaneously. This means that the customer is present during the
production of service which makes it impossible for the service provider to hide any
quality shortfall (Lau, Akbar & Gun Fie, 2005).
3.4.3.3 Perishability
Because the services offered cannot be stored, warehoused or inventoried, supply and
demand need to be managed by service organisations (Kotler, 2000; Lamb et al., 2004;
Lewis, 2007).
3.4.3.4 Heterogeneity
Services tend to be less standardised and uniform than goods. Quality control and
consistency are difficult to achieve because services are labour intensive and
production and consumption are inseparable (Lamb et al., 2004; O’Brian & Deans,
1996). In addition, Lewis (2007) and Foster (2010) state that variability in services often
exists because of nonstandardisation of delivery. Standardisation and the training of
service personnel may help to increase the quality control and consistency of the
service delivery process because the staff will understand the customer’s requirements
and react appropriately (Ghobadian, Speller & Jones, 1994).
In section 3.2.1, the eight product quality dimensions were described as part of the
discussion of what quality entails. Following on the discussion, table 3.5 below
summarises the differences between goods and services and the implications of these
characteristics.
Page 97
77
Table 3.5: Goods and services
Goods Services Resulting Implications
Tangible Intangible Services cannot be inventoried
Services cannot be easily patented Services cannot be readily displayed or communicated Pricing is difficult
Standardised Heterogeneous Service delivery and customer
satisfaction depend on employee and customer actions Service quality depends on many uncontrollable factors There is no sure knowledge that the service delivered matches what was planned and promoted
Production separate from consumption
Inseparability – simultaneous production and consumption
Customers participate in and affect the transaction Customers affect each other Employees affect the service outcome Decentralisation may be essential Mass production is difficult
Non-perishable Perishable It is difficult to synchronise supply
and demand with services Services cannot be returned or resold
(Source: Wilson et al., 2008:15)
The last section below, which discusses services, will focus on two frameworks for
analysing the service encounter, namely so-called “servicescapes” and “servuction”
methodologies. These methodologies are considered because they help to explain the
nature of the service encounter between the customer and service provider.
Page 98
78
3.4.4 Conceptual frameworks for analysing the service encounter
Services are fundamentally about processes and cannot be as easily judged or
described as in the case of most tangible goods. According to Palmer (2008), this
problem of defining the service encounter has given rise to methodologies such as
servicescapes and servuction methodologies which “map” the service process. These
two methodologies will be briefly described below.
3.4.4.1 Servicescapes
The servicescape concept was developed by Booms and Bitner to emphasise the effect
of the environment in which the service takes place. Booms and Bitner (cited in Palmer,
2008:101) define a servicescape as “the environment in which the service is assembled
and in which the seller and customer interact, combined with tangible commodities that
facilitate performance or communication of the service”. In addition, Lamb et al. (2004)
and Wilson et al. (2008) state that the servicescape is the physical environment in which
the service is rendered or consumed. Bitner (1992) argues that the physical
environment can influence both employee and customer behaviour and that the physical
setting can also impact on employee satisfaction, motivation and productivity. The
servicescape concept proposes that a variety of environmental factors are observed by
both customers and employees and that both groups may respond emotionally and
physiologically to the environment. These responses influence the behaviour of
customers and employees and affect the interactions between them.
Owing to the fact that services are intangible, customers often depend on tangible cues
or physical evidence to evaluate the service before it is purchased. Tangible cues or
physical evidence may include elements such as lighting, floor plans, equipment and
décor. Web pages and virtual servicescapes are more recent forms of physical
evidence that organisations can use to communicate the service experience. Ultimately,
the servicescape should encourage potential customers to enter the service
environment and repeat their visit (Palmer, 2008). Figure 3.4 represents a framework
that illustrates the role of the physical environment in service organisations.
Page 99
79
Figure 3.4: Framework for understanding environment-user relationships in service organisations
(Source: Adapted from Bitner, 1992:60)
Page 100
80
The environment-user relationship is illustrated in figure 3.5, as discussed in the
previous section.
The servicescape as a satisfaction model has been used in previous research,
predominantly in the leisure and tourism field. Some of these studies include the
development of a framework for the understanding of a tourism service setting
(Abubakar, 2002), the role of the physical environment in service consumption at
sporting events (Hightower, Brady & Baker, 2002) and the slot satisfaction in a Las
Vegas hotel casino (Lucas, 2003).
3.4.4.2 Servuction
Servuction adopts a somewhat diverse perspective and concentrates on the customer’s
perception of the service encounter. The servuction framework, developed by Eiglier
and Langeard, focuses on the experimental aspects of the service and is centred on the
idea that organisations provide customers with complex bundles of benefits (Palmer,
2008). The service features are divided into two parts, namely visible and invisible. The
visible parts include the physical environment in which the service experience occurs
and service personnel who interact with the customer. The invisible part comprises the
infrastructure to support the visible parts. The service experiences of customers are
determined by content and process elements as well as structural elements, and in
nonroutinised services, with many customers, content and process elements become
extremely important. It is advisable to apply the servuction concept in service settings
where there are high levels of input from fellow customers or third-party producers
(Palmer, 2008). Ultimately, servuction is a description of the producer-consumer service
production system (Davies, Barron & Harris, 1999; De´caudin & Lacoste, 2010; Nicholls,
2010; Palmer, 2008; Swart, 2006).
The previous sections introduced quality, quality management and services as
subthemes in this chapter. The following sections will focus on service quality, which is
linked to the primary objective of this study, namely to investigate the impact of
leadership practices on service quality in the HE environment in South Africa, and more
specifically, the PHE environment.
Page 101
81
3.5 SERVICE QUALITY
3.5.1 Service quality defined
Prior to 1980, research on measuring quality emanated largely from the goods sector.
Most definitions of service quality focused on the complexity for consumers to evaluate
service quality, forming service quality expectations compared to the actual service
delivery and the evaluation of quality in the “process” of service delivery as opposed to
the “gaps” that exist in the perceptions and expectations in the delivery of quality service
to customers (Parasuraman, Zeithaml & Berry, 1985). Several definitions of service
quality were presented in section 1.5.2 in chapter 1, based on the literature from 1990 to
2007. Following on these definitions, it was proposed that for the purpose of this study,
service quality in PHE would be defined as “meeting and exceeding students’
expectations and perceptions by constantly rendering a reliable service that conforms to
predetermined requirements”.
3.5.2 Service quality dimensions
Parasuraman et al. (1985; 1988) developed the SERVQUAL instrument as a means for
the measurement of service quality. As indicated in chapter 1, section 1.5.2, the
SERVQUAL instrument will be used to measure the quality of service at a PHE provider
based on the difference between the students’ expectations and perceptions (P-E) of
service quality at a PHE campus. The SERVQUAL instrument will be discussed in detail
in section 3.7.
In addition to the dimensions of the SERVQUAL instrument, Grönroos (1988) identified
six criteria for acceptable perceived service quality. These are as follows:
Page 102
82
• Professionalism and skills. The customers realise that the service provider, its
employees, operational systems and physical resources have the knowledge and
skills required to solve their problems professionally.
• Attitudes and behaviour. The customers feel that the contact personnel are
concerned about them and are really interested in solving of their problems in a
friendly manner.
• Accessibility and flexibility. The customers feel that the service provider, its
location, operating hours, employees and operational systems are designed and
operated so that they can easily gain access to the service that is flexible to their
demands.
• Reliability and trustworthiness. The customers know that whatever takes place or
has been agreed upon, they can rely on the service provider, the employees and
systems to keep promises and perform with the best interests of the customers at
heart.
• Recovery. The customers know that if something goes wrong, the service provider
will vigorously take corrective action.
• Reputation and credibility. The customers believe that the service provider has
sound values and can be trusted.
Section 3.7 will elaborate on the term “perceived quality” as part of the discussion of the
service quality gaps (customer perceptions minus expectations regarding service
quality).
In section 3.4 it was stated that organisations with similar product offerings can
differentiate themselves through service delivery – not “what” is offered but “how” it is
offered and that the “how” is what truly adds value to the customer. Grönroos (Prideaux
et al., 2006; Palmer, 2008) argues that service quality consists of two fundamental
concepts, namely technical and functional quality. Technical quality refers to the “what”
that is delivered. This is easily measured and is essential for evaluating the quality of
service. Functional quality is “how” the service is rendered and is not as easily
Page 103
83
measured as technical quality. The concepts of technical quality and functional quality
will be elaborated on in section 3.6 as part of the evaluation of the Grönroos quality
model.
Figure 3.5 depicts the five service quality dimensions, namely tangibles, reliability,
responsiveness, assurance and empathy. All of these service quality dimensions are
briefly discussed in sections 3.5.2.1 to 3.5.2.5.
Responsiveness:
Promptness
Convenience
Accessibility
Reliability:
Consistency
Dependability
On-time performance
Accuracy
Empathy:
Caring
Individualised attention
Approachability
Assurance:
Competence
Courtesy
Security
Credibility
Communication
Tangibles:
Setting
Equipment
Appearance
Customers
Logos
Figure 3.5: The five service quality dimensions
(Source: Getz, 1997:177)
Page 104
84
3.5.2.1 Tangibles
Tangibility was previously mentioned as one of the characteristics of services in section
3.4.3. However, it is also one of the service quality dimensions in the SERVQUAL
instrument and refers to the service provider’s physical facilities, equipment, personnel
and communication materials (Kotler, 2000; Parasuraman et al., 1988).
3.5.2.2 Reliability
Reliability refers to the ability of the service provider to do what it promises and perform
the service dependably and accurately (Kotler, 2000; Parasuraman et al., 1988).
3.5.2.3 Responsiveness
Responsiveness is the willingness and determination of the service provider to help the
customers and provide quick services (Alzola & Robaina, 2005; Kotler, 2000;
Parasuraman et al., 1988).
3.5.2.4 Assurance
Assurance or security is the knowledge and courtesy of the service provider’s personnel
and their ability to inspire trust, confidence and credibility in the customers (Alzola &
Robaina, 2005; Kotler, 2000; Parasuraman et al., 1988).
3.5.2.5 Empathy
This is the individualised attention and care that the service provider offers to its
customers (Alzola & Robaina, 2005; Kotler, 2000; Parasuraman et al., 1988).
Service quality and its dimensions will be discussed in more detail in section 3.7, which
focuses on the SERVQUAL instrument.
Page 105
85
3.5.3 The importance of service quality
The primary objective of this study, as stated in chapter 1, was to investigate the impact
of leadership practices on service quality in PHE in South Africa as a source of
competitive advantage. The impact of leadership as the independent variable on service
quality as the dependent variable was thus investigated. The following sections deal
with the importance of service quality.
As mentioned in sections 3.4 and 3.5.1, it was only after the 1980s that organisations
started to investigate service quality as a form of differentiation and competitive
advantage. Since then, service quality has been the basis for success across various
industries, and organisations acknowledge that it enhances competitiveness by
differentiating in terms of service quality. According to Wilson et al. (2008), strategies
that focus on customer satisfaction, high returns and service quality may actually be
more successful than those that focus on cost cutting only. In addition, Lamb et al.
(2004) and Seth et al. (2005) state that many organisations have realised that because
their competitors offer similar quality products and similar prices, the only means to
differentiate is to offer superior service. Not only is excellent service quality difficult to
emulate, but it is also a vital buying consideration for many customers. Service quality is
becoming increasingly important because of factors such as the opening up of markets
as well as the increased use of information technology and higher levels of customer
knowledge (Seth et al., 2005).
According to Lewis (2007), a lack of focus on service quality could lead to problems
such as customer and employee complaints as well as other related costs. A service
quality programme can have beneficial results such as an enhanced corporate image,
reduced costs, increased productivity, sales and market share as well as overall
improved business performance. Dale et al. (2007) agree and report that service quality
improvements can be linked to improved revenue, which in turn can lead to higher profit
margins. Similarly, Foster (2010) states that service quality is one of the major
differentiating factors to beat competitors in the market.
Page 106
86
The importance of service quality was highlighted in the section above. In addition,
Prideaux et al. (2006) state that customers who are dissatisfied with the quality of
service, will take their business elsewhere and these dissatisfied customers are likely to
discuss their dissatisfaction with many people, which in turn could damage the
organisation’s credibility. Dale et al. (2007:18) concur and emphasise the following
customer service facts which indicate the significance of service quality for the
sustainability for any organisation:
• If 20 customers are dissatisfied with your service, 19 will not tell you. Fourteen of the
20 will take their business elsewhere.
• Dissatisfied customers tell an average of ten other people about their bad
experience, whereas 12% tell up to 20 people.
• Satisfied customers will tell an average of five people about their positive
experience.
• It costs five times more money to attract a new customer than to retain an existing
one.
• Up to 90% of dissatisfied customers will not buy from you again, and they will not tell
you why.
• In many industries, service quality is one of the few variables that can distinguish a
business from its competition.
• Providing top-quality service can save your business money. The same skills that
lead to increased customer satisfaction also lead to increased employee
productivity.
• Customers are willing to pay more to receive better service.
• Of dissatisfied customers, 95% will become loyal customers again if their complaints
are handled well and quickly.
As mentioned by Dale et al. (2007) in the previous section, there is a direct link between
enhanced service quality and high profit margins. Research by the Harvard Business
School explains the service-profit chain. It indicates a link between internal service and
employee satisfaction to customer value and ultimately to profits (Wilson et al., 2008).
Page 107
87
The proposed service-profit chain that links improvements in service quality to
increased profits is depicted in figure 3.6 below.
Figure 3.6: The service-profit chain
(Source: Palmer, 2008:324)
Page 108
88
The previous sections focused on the importance of increased service quality as well as
some of the benefits such as a better corporate image and improved profits. However,
one needs to know about the so-called “cut-off” point where service quality
improvements are no longer profitable. Palmer (2008) poses the following question:
How far should an organisation go to improve its levels of service quality? The simple
answer is, as far as the customer is willing to pay for the improved service quality.
Figure 3.7 shows a cut-off point where the service provider should stop its quality
improvement efforts.
Page 109
89
Co
st/
reve
nu
e p
er
un
it
COST PER CUSTOMER
REVENU
E PER CU
STOMER
Quality improvement needed in
order to gain profitable
customer acceptance
Profitable level of quality
High level of quality
cannot be sustained by
customers’ willingness
to pay
R
Notional level of quality
0
Lowest Highest
100%88%50%
Figure 3.7: Cut-off point of service quality improvements
(Source: Adapted from Palmer, 2008:340)
Page 110
90
The service provider must have a clear understanding of its market and customers’
willingness to pay extra for increased levels of service quality. Figure 3.8 shows that if
an organisation increases its notional level of service quality, there is an expected
increase in the amount that customers are willing to pay for the service. However, it is
evident that above a notional level of 88%, the cost of providing the service becomes
more than what the customer is willing to pay.
According to Palmer (2008), even though this is a simple example of reality, it shows
that total quality is not always the most profitable and that a thorough knowledge of
markets is required to establish the ideal level of service quality. In addition, Wilson et
al. (2008) state the unfortunate fact that many managers still see service quality
improvements as an unnecessary expense instead of a factor that actually contributes
to profits. The reason for this is that, much like advertising results, the results from
service quality improvements are cumulative and are thus only evident in the long term.
The next section will focus on various service quality models that could possibly be
applied in a PHE environment to measure the quality of service. A review of all existing
models of service quality is beyond the scope of this study.
3.6 SERVICE QUALITY MODELS
According to Seth et al. (2005), service quality models should assist management to
identify quality problems and help in the planning of a quality improvement programme,
thereby improving effectiveness and overall business performance. The primary
purpose of these models is to enable management to improve the organisation and its
service offering. Seth et al. (2005) have investigated several service quality models and
suggest that the following factors are suitable for comparative evaluations of these
models:
• The model should identify factors affecting service quality.
• The model should be suitable for a variety of service settings.
Page 111
91
• The model should be flexible to account for changes in the environment and in
customer perceptions.
• The model should clearly indicate directions for the improvement of service quality.
• The model should be able to develop a link for the measurement of customer
satisfaction.
• There should be a clear indication for the need to train and educate employees.
• The model should suggest suitable measures for improvements of service quality.
• It should be able to accommodate the use of IT in services.
• The model should be able to be used as a tool for benchmarking.
The following sections will describe and compare eight specific service quality models
that could be applied in a PHE environment to measure the quality of service. The
service quality models will be abbreviated as SQ1 to SQ8 for easier reference to the
tables at the end of this section.
3.6.1 Technical and functional quality model (SQ1)
For an organisation to compete successfully, it needs to have a sound understanding of
the customer’s perception of service quality. To manage perceived service quality, the
organisation must be able to match service expectations and perceptions to achieve
customer satisfaction. The model identifies three components of service quality, namely
technical quality, functional quality and image. Technical quality is what the customer
receives as a result of the interaction with the service organisation; functional quality is
the way in which the customer receives the technical quality; and image is important to
service providers and it comprises mainly technical and functional service quality (Seth
et al., 2005). Figure 3.8 depicts the technical and functional quality model.
Page 112
92
Figure 3.8: Consumers’ perception of technical and functional quality
(Source: Adapted from Palmer, 2008:322)
Figure 3.8 is a visual representation of how technical and functional quality contributes
to an organisation’s corporate image. In addition, corporate image is one of the
components of service quality which is described as the difference between the
customer’s expectation and perception with regard to service quality.
3.6.2 The gap model (SQ2)
The gap model was developed by Parasuraman et al. (1985) and it proposes that
service quality is a function of the differences between the expectation and perception
of customers in terms of service delivery. Parasuraman et al. (1985) developed the
service quality model (figure 3.9), known as SERVQUAL, based on gap analysis, and
identified the following gaps:
Page 113
93
• gap 1: the difference between consumers’ expectation and management’s
perceptions of those expectations
• gap 2: the difference between management’s perceptions of consumers’
expectations and service quality specifications
• gap 3: the difference between service quality specifications and the actual service
delivered
• gap 4: the difference between service delivery and the external communications to
consumers about service delivery
• gap 5: the difference between consumers’ expectation and perception of the service;
this gap depends on the size of the first four gaps relating to service delivery
The gap model, also referred to as SERVQUAL, is the service quality measuring
instrument that was applied in this study, and will be discussed in more detail in section
3.7.
Page 114
94
Figure 3.9: Gaps and the service quality model
(Source: Adapted from Foster, 2010:165)
Page 115
95
3.6.3 Attribute service quality model (SQ3)
This model (depicted in figure 3.10) indicates that “high quality” in a service setting is
experienced when an organisation consistently meets customer preferences and
expectations. The separation of certain features into various groups is the first step
towards the development of a service quality model. Services have the following three
basic features: physical facilities and processes, people’s behaviour and professional
judgement. The model maps different service settings as per degree of contact and
interaction, degree of labour intensity and degree of service customisation. The suitable
quality balance will be near the centre of the triangle in figure 3.10, where physical
facilities and processes, people’s behaviour and professional judgement are all
important, but none is stressed at the expense of any other group of quality features
(Haywood-Farmer, 1988).
Page 116
96
Figure 3.10: Attribute service quality model
(Source: Seth et al., 2005:919)
Page 117
97
3.6.4 Synthesised model of service quality (SQ4)
This model attempts to incorporate traditional managerial structure, service design and
operations and marketing activities. The purpose is to identify the dimensions relating to
service quality in a traditional managerial framework of planning, implementation and
control. The synthesised model of service quality (figure 3.11) considers three factors,
namely company image, external influences and traditional marketing activities as the
factors that have an impact on technical and functional quality expectations (Brogowicz,
Delene & Lyth, 1990).
Page 118
98
Figure 3.11: A synthesised service quality model
(Source: Brogowicz et al., 1990:36)
Page 119
99
3.6.5 Performance only model (SQ5)
This model was developed by Cronin and Taylor (1992) who investigated service quality
in relation to customer satisfaction and purchase intentions. The study concluded that
“perceptions only” are a better predictor of service quality. It was argued that the gap
model developed by Parasuraman et al. (1985) confused satisfaction and attitude. In
addition, Cronin and Taylor (1992) stated that quality can be conceptualised as being
comparable to an attitude and can be measured by the perceptions only model referred
to as SERVPERF. According to Cronin and Taylor (1992), performance instead of
“performance-expectation” determines service quality.
3.6.6 Ideal value model of service quality (SQ6)
In most studies on service quality, expectation is regarded as the preferred outcome of
the service experience. Mattsson (1992) argues that this needs to be investigated in the
light of other standards such as experience based or ideal, minimum-tolerable and
desirable. This model suggests a value approach to service quality as an outcome of
satisfaction process. The value-based model of service quality recommends that a
perceived ideal standard should be used to compare it to the service experience. Figure
3.12 illustrates that negative disconfirmation at a preconscious value level determines
satisfaction at a “higher” attitude level. The negative disconfirmation is the main
determining factor of customer satisfaction. Hence more attention should be paid to the
cognitive processes of how customers’ service concepts are formed and changed
(Mattsson, 1992).
Page 120
100
Figure 3.12: Ideal value model
(Source: Mattsson, 1992:19)
3.6.7 Model of perceived service quality and satisfaction (SQ7)
This model (figure 3.13) endeavours to improve the understanding of the concepts of
perceived service quality and consumer satisfaction. The model focuses on the
effect of expectations, perceived performance desires, desired congruency and
expectation disconfirmation on overall service quality and customer satisfaction.
These are measured through a set of the following ten elements of advising (Spreng
& Mackoy, 1996):
• convenience in making an appointment
• the friendliness of the staff
• the advisor listened to my questions
• the advisor provided accurate information
• the knowledge of the advisor
• the advice was consistent
• the advisor helped with long-range planning
• the advisor helped to choose the right options
• the advisor was interested in my personal life
• the offices were professional
Page 121
101
Expectations
Desires
Perceived
performance
Desires
Congruency
Expectations
Disconfirmation
Overall
Service
Quality
Overall
Satisfaction
Figure 3.13: Perceived quality and satisfaction model
(Source: Spreng & Mackoy, 1996:209)
3.6.8 PCP attribute model (SQ8)
This model has a hierarchical structure based on three main features or classes,
namely pivotal (outputs), core and peripheral (inputs and processes). According to
the model (figure 3.14), every service consists of these three features. Pivotal
features, positioned at the core, are the determining factors why the customer
purchased the service and have the greatest impact on customer satisfaction. Pivotal
features are referred to as the “output” of the service encounter. Core features are
the people, processes and structures through which the customer receives the
pivotal features. The peripheral features can be seen as the “extras” which make the
service encounter more delightful. The customer is satisfied if the pivotal features are
received. However, as a service is used more frequently, the core and peripheral
features become increasingly important (Philip & Hazlett, 1997).
Page 122
102
Figure 3.14: PCP attribute model
(Source: Adapted from Seth et al., 2005:926)
3.6.9 Summary and comparison of service quality models
This section summarises and compares the eight models discussed in the previous
section in terms of their limitations (table 3.6) and categorisation and salient features
(table 3.7). Table 3.8 evaluates and compares the eight models on the basis of the
factors used to compare service quality models, as indicated in the first paragraph in
section 3.6.
Page 123
103
Table 3.6: Limitations of service quality models
Model no./type Select weaknesses/limitations
SQ1: Technical and functionalquality model
The model does not offer an explanation on how to measure functional and technical quality.
SQ2: Gap model
Exploratory study. The model does not explain the clear measurement procedure for the measurement of gaps at different levels.
SQ3: Attribute service quality model
It does not offer the measurement of service quality. It does not offer a practical procedure capable of helping management to identify service quality problems or practical means of improving service quality.
SQ4: Synthesised model of service quality
Needs empirical validation. Needs to be reviewed for different type of service settings.
SQ5: Performance only
model
Needs to be generalised for all types of service settings. Quantitative relationship between consumer satisfaction and service quality needs to be established.
SQ6: Ideal value model of service quality
Fewer number of items used for value and customer satisfaction. Needs to be defined for all types of service settings.
SQ7: Model of perceived quality and satisfaction
The model does not highlight how the service quality is achieved and operationalised. The model is weak in providing directions for improvements in service quality.
SQ8: PCP attribute model The model fails to provide general dimensions to three levels
of attributes. Lacks empirical validation.
(Source: Adapted from Seth et al., 2005:935-937)
Page 124
104
Table 3.7: Categorisation and salient features of the service quality models
Model no.
Author (year)
Model Respondents Method of data collection
Scale used
Method of analysis
Measurement of service quality addressed through
SQ2 Parasura-man et al. (1985)
Gap model Ranged from 298 to 487 across companies/ telephone companies, securities brokerage, insurance companies, banks and repair and maintenance
Survey question-naire approach
Seven-point Likert
Principal-axis factor followed by oblique rotation
* * Ten dimensions (reliability, security, responsiveness access, communication, tangibles, courtesy, credibility, competence, understanding/ knowing)
SQ3 * Haywood-Farmer (1988)
Attribute service quality model
* * Analysis not reported
Physical facilities and processes, people’s behaviour and conviviality, professional judgement
SQ4 * Brogowicz et al. (1990)
Synthe-sised model of service quality
* * Analysis not reported
Through technical and functional quality defining planning, implementation and control tasks
SQ5 Cronin & Taylor
(1992)
Perfor-mance only model
660/banking, pest control, dry-cleaning and fast-food
Survey question-naire approach
Seven-point semantic differential
Principal-axis factor followed by oblique rotation and LISREL Confirmatory
22 items same as SERVQUAL but with performance only statements
SQ6 Mattsson
(1992)
Ideal value model
40 guests while checking in and out/two large luxury hotels
Survey questionnaire approach
Seven-point Likert
Pearson moment correlation, pairwise intra- and intersample median test and Chi square test
Through 18 items of value and nine items of customer satisfaction
SQ7 Spreng & Mackoy
(1996)
Perceived quality and satisfaction model
273 undergraduate students
Survey questionnaire approach
Seven-point Likert
Factor analysis and structured equation modeling using
Through desires, perceived performance, expectations and desired congruency (each comprising ten
Page 125
105
LISREL attributes)
SQ8 * Philip & Hazlett
(1997)
PCP attribute model
* * Analysis not reported
Pivotal attributes, core attributes and peripheral attributes
Notes: *Mainly conceptual models, not tested/validated; * *later in 1988 and 1991 the authors
proposed and revised the 22-item, five-dimension service quality measurement tool SERVQUAL.
(Source: Adapted from Seth et al., 2005:940-942)
Table 3.8: Evaluation of service quality models
Items SQ1 SQ2 SQ3* SQ4* SQ5 SQ6 SQ7 SQ8*
Identification of factors affecting service quality
♦ ♦ ♦ ♦ ♦ ♦ ♦
Suitability for variety of services in consideration
♦ ♦ ♦ ♦
Flexibility to account for changing nature of customers’ perceptions
♦ ♦ ♦
Directions for improvement in service quality
♦ ♦ ♦ ♦ ♦ ♦ ♦ ♦
Suitability for developing a link for measurement of customer satisfaction
♦ ♦ ♦
Diagnosing the needs for training and education of employees
♦ ♦ ♦
Flexible enough for modifications as per the changes in the environment/conditions
♦ ♦ ♦ ♦
Page 126
106
Suggests suitable measures for improvements of service quality both upstream and downstream in the organisation in focus
♦ ♦ ♦ ♦ ♦
Identifies future needs (infrastructure, resources) and thus provides help in planning
♦ ♦
Accommodates use of IT in services
Capability of being used as a tool for benchmarking
♦ ♦ ♦ ♦ ♦ ♦ ♦
Note: *conceptual model
(Source: Adapted from Seth et al.:943)
From this review it seems clear that there is not a universally accepted service
quality model or a clear operational definition of how to measure service quality.
However, the majority of service quality models support the notion that service
quality is measured by comparing the customer’s service quality expectation with the
service quality perception or experience. Furthermore, the SERVQUAL instrument
seems to have the most support in the service quality research field (Seth et al.,
2005).
As indicated in table 3.8, on the basis of the factors used to compare service quality
models, the gap model (SQ2) or SERVQUAL and the performance only model (SQ5)
or SERVPERF seem to be the most suitable models to evaluate service quality.
These two models will be explained below.
3.7 SERVQUAL
As indicated in chapter 1, section 1.5.2, the SERVQUAL instrument was used to
conduct this study. In this section, the SERVQUAL instrument will be examined in
more detail and its application in this study justified. Mention will also be made of
Page 127
107
possible applications of the SERVQUAL instrument. The section will conclude with
reference to an HE-specific service quality measurement instrument, namely
HEdPERF and the exclusion of this instrument from this study will be justified. A
comparison between SERVQUAL and SERVPERF in an HE environment will also
be provided. The development of the SERVQUAL instrument by Parasuraman et al.
(1985) will be discussed in more detail in chapter 5, which deals with the research
design. The focus will be on SERVQUAL’s data collection process, the generation of
the instrument’s scale items and scale purification as well as its validity, reliability
and factor structure.
3.7.1 The history of SERVQUAL
According to Parasuraman et al. (1985), prior to 1980, research on measuring quality
emanated largely from the goods sector. Despite the growth in the services sector,
only a few researchers focused on service quality. There were also on-going debates
on the extent to which service marketing was different from goods marketing. The
characteristics of services (intangibility, inseparability, perishability and
heterogeneity) as listed in section 3.4.3, were a result from these debates. The
research conducted on service quality (prior to 1985) suggested the following three
themes: (1) service quality is more difficult to evaluate than goods quality; (2) service
quality perceptions are a result of a comparison between the expectations of the
consumer and the actual service performance; and (3) the process of service
delivery is also important in the evaluation of service quality.
The first statements of the SERVQUAL instrument were published in 1985 by
Parasuraman, Zeithaml and Berry and officially introduced in 1988. The original
SERVQUAL instrument consisted of ten dimensions based on the exploratory
research by Parasuraman et al. in 1985. These dimensions included tangibles,
reliability, responsiveness, communication, credibility, security, competence,
courtesy, understanding/knowing the customer and access. Table 3.9 provides a
detailed description of the original ten dimensions. Additional research, data
collection and scale purification by Parasuraman et al. (1988) led to the design of a
five-dimensional SERVQUAL scale consisting of the following dimensions: tangibles,
reliability, responsiveness, assurance and empathy (Parasuraman et al., 1985,
Page 128
108
1988). Since then, their research has dominated the field of research in service
quality.
Table 3.9: Original dimensions of SERVQUAL
Tangibles Include physical evidence of the service
− physical facilities
− appearance of personnel
− tools or equipment used to provide the service
− physical representations of the service, such as a plastic credit
card or a bank statement
− other customers in the service facility
Reliability Involves consistency of performance and dependability. It means that the
firm performs the service right the first time. It also means that the firm
honours its promises. Specifically, it involves
− accuracy in billing
− keeping records correctly
− performing the service at the designated time
Responsiveness Concerns the willingness or readiness of employees to provide the
service. It involves
− timelines of service
− mailing a transaction slip immediately
− calling the customer back quickly
− giving prompt service (e.g. setting up appointments quickly)
Communication Means keeping customers informed in a language they can understand
and listening to them. It may mean that the company has to adjust its
language for different consumers – increasing the sophistication with a
well-educated customer and speaking simply and plainly with a novice.
It involves
− explaining the service itself
− explaining how much the service will cost
− explaining the trade-offs between service and cost
− assuring the customer that a problem will be handled
Page 129
109
Credibility Involves trustworthiness, believability and honesty. It involves having the
customer’s best interest at heart. Contributing to credibility are
− company name
− company reputation
− personal characteristics of contact personnel
− the degree of hard sell involved in interactions with the customer
Security Is there freedom from danger, risk or doubt? It involves
− physical safety (Will I be mugged at the automatic teller
machine?)
− financial security (Does the company know where my stock
certificate is?)
− confidentiality (Are my dealings with the company private?)
Competence Means possession of the required skills and knowledge to perform the
service. It involves
− knowledge and skill of the contact personnel
− knowledge and skill of the operational support personnel
− research capability of the organisation (e.g. securities brokerage
firm)
Courtesy Involves politeness, respect, consideration, and friendliness of contact
personnel (including receptionists, telephone operators, etc). It includes
− consideration for the consumer’s property (e.g. no muddy shoes
on the carpet)
− clean and neat appearance of public contact personnel
Understanding/knowing
the customer
Involves making the effort to understand the customer’s needs. It involves
− learning the customer’s specific requirements
− providing individualised attention
− recognising the regular customer
Access Involves approachability and ease of contact. It means
− the service is easily assessable by telephone (lines are not busy
and customers are not put on hold)
Page 130
110
− waiting time to receive service (e.g. at a bank) is not extensive
− convenient hours of operation
− convenient location of service facility
(Source: Adapted from Foster, 2010:164)
The detail provided in table 3.9 leads up to the next section, which elaborates on the
updated five dimensions of SERVQUAL as applied in this study.
3.7.2 The SERVQUAL instrument
Section 3.7.2 will focus on the SERVQUAL instrument, including the development of
the service quality scale, the updated five dimensions, how it is applied as well as
some of its advantages.
The steps in the development of the service quality scale are illustrated in figure
3.15.
Page 131
111
Figure 3.15: Summary of the steps in developing the service quality scale (Source: Parasuraman et al., 1988:14)
Section 1 categorises the domain of the service quality construct and describes the
generation of the items as indicated in steps 1, 2 and 3. The second section consists
of steps 4 to 9 and presents the data collection and scale purification procedures.
The third section (step 10) provides an evaluation of the scale’s reliability and factor
structure, while the last section (step 11) consists of the assessment of the scale’s
validity (Parasuraman et al., 1988). This will be elaborated on in chapter 5.
Page 132
112
In accordance with the primary objective of this study, the SERVQUAL instrument
was used in the form developed by Parasuraman et al. (1988) and was applied to a
PHE provider in South Africa. The original 22 statements were adapted to the
context of the PHE provider.
According to Parasuraman et al. (1988), the SERVQUAL instrument measures
service quality (perceived quality) as conceptualised in the service literature.
Exploratory research by Parasuraman et al. (1985) indicates that service quality is
an overall evaluation, attitude or judgement. Perceived quality is therefore the
customer’s evaluation or judgement of a service provider’s overall excellence or
superiority of the service and is a result of the comparison between expectations and
perceptions of performance. Expectations are viewed as the “desires” or “wants” of
the customer, that is, what he or she feels the service provider should offer as
opposed to would offer. Many researchers support the concept that perceived
service quality originates from a comparison between what the customers feel the
service provider should offer and their perceptions of the service rendered
(Parasuraman et al., 1988).
Parasuraman et al.’s (1985) research in the development of the SERVQUAL
instrument included 12 focus group interviews with current or recent customers of
four different services, including retail banking, credit card, securities brokerage and
product repair and maintenance. The focus group discussions centred on issues
such as the meaning of service quality, the characteristics of the service and its
provider and the criteria used by customers to evaluate service quality. Irrespective
of the type of service, the findings revealed that customers used basically the same
general criteria to evaluate service quality (Parasuraman et al., 1988).
As indicated previously, it is suggested that service quality is determined by the
difference between what a customer expects and the perceived level of service
delivery. The SERVQUAL instrument is composed of the five service quality
dimensions, as discussed in section 3.5.2, namely tangibles, reliability,
responsiveness, assurance and empathy. The instrument is based on 22 generic
questions and designed to cover the five dimensions of service quality. Survey
customers complete the questionnaire, with one section that measures the
expectations of the 22 questions, and then another section measuring the
Page 133
113
perceptions of the same 22 questions. For each question, the customer must rate,
on a Likert scale from 1 (strongly disagree) to 7 (strongly agree) whether or not he or
she agrees with each statement. The SERVQUAL score is then the difference
between the perception and expectation scores of actual service delivery (perception
– expectation or P – E). This is referred to as the service quality gap which will be
discussed in section 3.7.3. An organisation can then determine its level of service
quality for each of the five dimensions by taking the average score across the
questions for that dimension and then calculating the overall score. The five
dimensions and the number of statements associated with each dimension are as
follows:
• Tangibles (appearance and physical evidence): questions 1 to 4
• Reliability (dependability and accuracy): questions 5 to 9
• Responsiveness (helpfulness and promptness): questions 10 to 13
• Assurance (credibility, competence and courtesy): questions 14 to 17
• Empathy (easy access, communication and understanding): questions 18 to 22
(Aaker, Kumar & Day, 2007; Foster, 2010; Gryna et al., 2007; Lewis, 2007;
Moscardo, 2006; Palmer, 2008; Wilson et al., 2008.)
As indicated in chapter 1, section 1.5.2.3, according to Foster (2010), the
SERVQUAL instrument has several advantages such as the fact that it is accepted
as a standard for assessing different dimensions of service quality and it has been
shown to be valid for a number of service institutions. Equally important, it has been
shown to be reliable and it has only 22 items which can be filled out quickly by
respondents. It also has a standardised analysis procedure to help with the
interpretation of results. Foster (2010), Lewis (2007) and Palmer (2008) further state
that SERVQUAL can be used to track service quality trends and improve service
across a broad range of industries and can be modified to suit organisational
requirements. It can also be used to compare branches of an organisation, for
example, a PHE institution with campuses across the country, as in this study, as
well as compare an organisation with its competitors. It can therefore be utilised to
identify areas requiring management attention to improve service quality as a source
of competitive advantage.
Page 134
114
3.7.3 Service quality gaps
In section 3.7.2 it was indicated that the service quality gap is the difference between
the customers’ perception and expectation of service quality (P – E). According to
Foster (2010), the gap approach is widely recognised in quality literature and it refers
to the difference between what the customer expects and what is actually delivered.
Gaps are important because once a gap has been identified, corrective action and
improvement must follow. Similarly, Moscardo (2006) indicates that gaps can be
used to direct change and improvement in a service organisation. Figure 3.16
illustrates the five gaps identified by the SERVQUAL instrument.
Figure 3.16: Gaps 1 to 5
(Source: Foster, 2010:261)
Page 135
115
Figure 3.16 indicates that gap 1 shows the difference between customer
expectations and management’s perception. Management do not always know and
understand what the customer wants. Gap 2 is the difference between management
perceptions of customer expectations and service quality specifications. Gap 3 is the
gap between service quality specifications and service delivery. This could be the
result of inadequate training of personnel or poor management. Gap 4 refers to the
gap between service delivery and external communications to customers. This could
stem from the difference between what an organisation promises to deliver and the
service that is actually delivered. Gap 5 is the difference between perceived and
expected service delivery. The difference between the customers’ expectations and
perceptions or experience of the service is directly related to their perceptions of
service quality. This gap occurs because of one or more of the previous gaps. The
key to closing gap 5 is to close gaps 1 to 4 by means of improved communication,
improved system design and highly trained personnel who render outstanding
customer service (Foster, 2010; Kotler, 2000; Palmer; 2008).
3.7.4 Criticisms of SERVQUAL
Some of the drawbacks and criticisms of the SERVQUAL instrument were discussed
in chapter 1, section 1.5.2.3. Kang and James (2004) elaborate on the criticism of
the use of SERVQUAL and state that it only reports on the service delivery process
and fails to address the service encounter outcomes. Buttle (1996) adds to this
criticism by subdividing it into theoretical and operational criticism. Theoretical
criticism includes elements such as the fact that SERVQUAL focuses on the process
of service delivery and not the outcomes of the service encounter. One of the
operational criticisms provided by Buttle (1996) indicates that completing the
SERVQUAL questionnaire is a lengthy process (survey customers complete the
questionnaire in one section that measures the expectations of the 22 questions and
then another section measuring the perceptions of the same 22 questions ), and this
could lead to confusion.
However, despite the above criticism and that in chapter 1 and other similar studies,
SERVQUAL is still the most widely applied instrument in service quality research.
This is evident in the fact that it is still identified as an appropriate service quality
Page 136
116
measurement instrument in recent marketing and quality management textbooks
(e.g. Aaker et al., 2007; Foster, 2010; Gryna et al., 2007; Kotler, 2000; Palmer,
2008; Prideaux et al., 2006; Wilson et al., 2008) and journal articles (e.g. Baki,
Basfirinci, Cilingir & Murat, 2009; Bayraktaroglu & Atrek, 2010; Chau & Kao, 2009;
Chowdhury, 2009; Etgar & Fuchs, 2009; Gilmore & McMullan, 2009; Kumar, Kee &
Manshor, 2009; Lai, Hutchinson, Li & Bai, 2007; Ruiqi & Adrian, 2009; Wong,
Rexha & Phau, 2008). This use of the SERVQUAL instrument indicates that
consensus has not yet been reached on the superiority of the other service quality
measurement instruments over SERVQUAL.
Despite the criticism and limitations of the SERVQUAL instrument, as indicated in
this section, it was applied in this study, at a PHE provider, in its original form as
developed by Parasuraman et al. (1985, 1988). The items under each of the five
dimensions were adapted to suit the measurement of service quality in the PHE
environment. Furthermore, it is the most popular instrument for measuring service
quality and has been applied in a wide variety of service settings, including HE
(Arambewela & Hall, 2009; Anderson, 1995; Barnes, 2007; Brochado, 2009;
Bayraktaroglu & Atrek, 2010; Markovic, 2006; Quinn et al., 2009; Qureshi, Shaukat &
Hijazi, 2010; Radder & Han, 2009; Smith & Smith, 2007; Tahir, Abu Bakar & Ismail,
2010; Yeo, 2008). Until a new instrument is developed, SERVQUAL will undoubtedly
dominate in the field of service quality research (Wisniewski, 2001).
3.7.5 Applications of SERVQUAL
This section will focus on some of the applications of the SERVQUAL instrument as
suggested by Parasuraman et al. (1988).
Firstly, the SERVQUAL instrument was originally developed for retailers of goods
and services. Retailers that offer the same quality goods can only competitively
differentiate themselves in terms of quality of service. Retailers that only sell services
have nothing to offer if their services are poor. The SERVQUAL instrument is a
concise multiple-item model that is reliable and valid and can be adapted and
applied across a variety of service settings, such as a PHE provider. Secondly, the
SERVQUAL instrument is most valuable when it is used at regular intervals in
Page 137
117
conjunction with other forms of service quality measurement. Service quality trends
could be identified that could be used as a guideline to improve the quality of service,
which in turn could improve the marketability of the provider. Thirdly, the SERVQUAL
instrument can be used to assess the five service quality dimensions, namely
tangibles, reliability, responsiveness, assurance and empathy, by averaging the
different scores on the items of each dimension. Fourthly, the SERVQUAL
instrument can determine the relative importance of the five service quality
dimensions in influencing the customers’ overall quality perception. A possible fifth
application of the SERVQUAL instrument includes the categorisation of the service
organisation’s consumers into several perceived-quality segments, that is, high,
medium and low, on the strength of their individual SERVQUAL scores. The sixth
application of the SERVQUAL instrument states that it can also be applied by multi-
unit organisations, say, a PHE provider, with different campuses across South Africa
to track the quality of service rendered by each campus. The average SERVQUAL
score of each campus can then be compared. This could then potentially be a factor
in the campus principal’s performance appraisal and compensation.
From the above discussion it is evident that the SERVQUAL instrument has a variety
of potential applications. It can assist a wide range of service providers to assess
consumer expectations and perceptions of service quality. It can also help to identify
areas that require action from top management to improve service quality.
More recently, Wilson et al. (2008:132) summarised the application of SERVQUAL
data as follows:
• to determine the average gap score (between customers’ perceptions and
expectations) for each service attribute
• to assess a company’s service quality along each of the five SERVQUAL
dimensions
• to track customers’ expectations and perceptions (on individual service attributes
and/or SERVQUAL dimensions) over time
• to compare a company’s SERVQUAL scores against those of competitors
• to identify and examine customer segments that differ significantly in their
assessment of a company’s service performance
Page 138
118
• to assess internal service quality (i.e. the quality of service rendered by one
department or division to others within the same company)
The application of the SERVQUAL instrument to measure service quality in South
Africa is limited. Kgaile and Morrison (2006), Radder and Han (2009), Roelofse
(2007) and Van der Wal, Pampallis and Bond (2002) applied the SERVQUAL
instrument for research in a cellular telecommunications organisation, education and
analytical laboratories.
3.7.6 HEdPERF
Section 3.6 above evaluated and compared different service quality models.
Because this study was conducted against the backdrop of HE, and more specifically
PHE, this section will briefly describe a “new” service quality measurement
instrument namely the HEdPERF (Higher Education PERformance only) instrument,
specifically designed for the HE sector. It was developed by Dr F. Abdullah from the
MARA University of Technology in Malaysia.
According to Abdullah (2006a), little research has been conducted to identify the
determinants of service quality from the perspective of students as the primary
customers in HE. There are still many areas of disagreement in the academic
community on how to measure service quality. Many researchers have adopted the
popular SERVQUAL instrument to measure service quality in HE. In addition,
Abdullah (2006a) contends that generic measures of service quality may not be the
most appropriate way to determine service quality in an HE institution. Owing to the
lack of an HE-specific service quality measurement instrument in HE, the HEdPERF
was developed. The instrument consists of 41 items that were empirically tested for
unidimensionality, reliability and validity using both exploratory and confirmatory
factor analysis (CFA). It contains six dimensions, namely nonacademic elements,
academic elements, reputation, access, programme issues and understanding. The
development and validation of HEdPERF consisted of three stages. Stage 1 included
the identification of critical success factors or determinants of service quality, stage 2
the development of a research instrument and stage 3 a survey. All three stages
were conducted in six tertiary institutions throughout Malaysia.
It was decided not to apply this research instrument in this study owing to the fact the
Page 139
119
instrument has only been tested in Malaysia by its developer. To suggest that
HEdPERF is superior to other service quality instruments would be premature and
further studies should apply the instrument in other countries in order to test its
consistency across different samples and cultures (Abdullah, 2006b).
3.7.7 SERVQUAL versus SERVPERV
The SERVQUAL instrument was criticised on account of the use of different scores,
dimensionality, applicability and the lack of validity of the model in terms of the five
dimensions (Babakus & Boller, 1992; Cronin & Taylor, 1992, 1994). Based on this
criticism, Cronin and Taylor (1994) developed an alternative service quality
measurement instrument, namely SERVPERF. This model justified discarding the
expectations section of the SERVQUAL instrument, thus retaining only the
perception portion of the scale. The SERVPERF scale is based only on customers’
perception of the quality of service provided as opposed to the difference between
the customer’s perception and expectation of service quality. In addition, according
to Palmer (2008) and Wilson et al. (2008), the instrument is easier to administer and
analyse than SERVQUAL because the respondents rate only the performance of a
service provider on a Likert scale from 1 (strongly disagree) to 5 (strongly agree).
Brady, Cronin and Brand (2002) mention that Cronin and Taylor (1992) provided
empirical evidence that SERFPERF outperforms the disconfirmation-based
SERVQUAL instrument. However, SERVPERF has not achieved the same level of
popularity in service quality research as SERVQUAL (Wilson et al., 2008).
According to Palmer (2008), service organisations should recognise the dynamic
nature of the relationship between customers’ perceptions and expectations. As
such, it is insufficient for an organisation to only maintain customers’ level of
perceived quality because of the fact that their perceptions may rise over time.
Figure 3.17 depicts the quality gap between customer expectations and perceptions.
Page 140
120
Time
Customer expectations
Customer perceptions
Quality gap
Figure 3.17: Quality gap between customer expectations and perceptions
(Source: Adapted from Palmer, 2008:358)
Figure 3.17 indicates that even if an organisation improves its performance, the
evaluation of its service quality may decline because the customers may have
moved ahead faster than the organisation’s improvements efforts.
It is clear from table 3.8, section 3.6, that SERVQUAL or SERVPERF are the most
suitable instruments to evaluate service quality. In a recent study by Bayraktaroglu
and Atrek (2010), these two instruments were evaluated and compared in the
measurement of service quality in an HE setting. The findings supported both the
service quality measurement instruments of Parasuraman et al. (1988) and Cronin
and Taylor (1992) and revealed that both SERVQUAL and SERVPERF were
adequate to be used in an HE setting. Although the SERVPERF instrument was
developed because of supposed weaknesses in SERVQUAL, both instruments
revealed a good model fit in this study. SERVQUAL, however, had an excellent fit
whereas SERVPERF only had a good model fit (Bayraktaroglu & Atrek, 2010). The
Page 141
121
findings in the above-mentioned research project serve as another justification for
the use of the SERVQUAL instrument in the current study.
3.8 CHAPTER CONCLUSION
The chapter provided an overview of quality and service quality and was divided into
six sections. Sections 3.1 and 3.2 focused on quality and quality management. The
focus of sections 3.3, 3.4 and 3.5 was on services, service quality and service quality
models. In section 3.6, the use of the SERVQUAL instrument was justified and the
discussion revolved around its history, service quality gaps, criticism of the
instrument and its application in South African research. It was determined that
SERVQUAL has a variety of applications in different service settings and that it has
been extensively applied in recent service quality research in HE. The chapter
concluded with a brief look at a HE- specific instrument, namely HEdPERF and the
application of SERVQUAL and SERVPERF in HE.
Chapter 5 focuses on leadership as the other construct that form part of the main
purpose of this study – the impact of leadership practices on service quality in PHE
in South Africa. The Leadership Practices Inventory (LPI) will also be reviewed as a
means to assess leadership practices in a PHE institution.
Page 142
122
4. CHAPTER 4: LEADERSHIP
4.1 INTRODUCTION
The aim of this chapter is to provide an overview of leadership and its impact on
quality, specifically service quality. The previous chapter provided an overview of
quality in management and dealt specifically with service quality and its importance
in the PHE environment as a competitive factor. Sections 4.1 to 4.3 of this chapter
will serve as an introduction to leadership. Factors such as the definition of
leadership, the difference between leadership and management, effective
leadership, leadership skills and responsibilities will be discussed. Leadership
theories and styles will also form part of the introductory section of this chapter. The
remainder of the chapter will focus on leadership and quality, service quality and
leadership in HE. The chapter concludes with a discussion on leadership
measurement instruments with the main focus on the LPI instrument. The use of this
measurement instrument is then also justified for this study.
The main sections of this chapter are depicted in figure 4.1 below.
Page 143
123
Figure 4.1: Layout of chapter 4
Page 144
124
4.2 LEADERSHIP
Leadership principles can be traced back as far as Egyptian hieroglyphics (2 300
B.C.), the works of sixth-century Chinese philosophers, the Bible and the Icelandic
tales of Viking heroes and villains. The word “leadership” first appeared in the
English language in the first half of the 19th century in literature referring to the British
Parliament. Although the concept of leadership has been around for many centuries,
it was only after the 1930s that it was formally researched and studied. Prior to the
birth of the transformational leadership theory in 1978, studies on leadership focused
on the manager’s role and his or her relationship with followers. Since the 1980s,
there has been a change in the way leadership is perceived. There has been a shift
in the focus from control to the establishment of an environment in which people are
successful and organisational results are positive (Barker, Sullivan & Emery, 2006;
Grönfeldt & Strother, 2006). Leadership theories will be briefly introduced in section
4.3 of this chapter.
Leadership is vital in business. Effective leaders have a global outlook and take risks
- they influence the way in which work is performed and how people are managed
and interact. The focus of effective leaders is on transformation (Bratton, 2007;
Kumar & Kumar, 2011). On the the strength of this statement, one needs to
determine the exact meaning of leadership.
From a modern perspective, Foster (2010) maintains that leadership is a process in
which a group of people are influenced by a leader to achieve superordinate goals.
These are goals that not only benefit the individual but also the group. In addition,
Foster (2010) indicates that leadership is about sharing power. This power assumes
many forms such as the power of expertise (special knowledge); reward power
(reward subordinates for goals achieved); coercive power (power to punish for not
adhering to the rules); referent power (the leader is charming and is liked); and
legitimate power (power stems from the person’s position in the organisation).
The next section will provide a few definitions of leadership in an attempt to explain
the phenomenon.
Page 145
125
4.2.1 Definitions of leadership
It is evident from literature that there are a plethora of definitions of leadership
(Grönfeldt & Strother, 2006). According to Bratton (2007:132), “leadership is one of
the most observed but least understood phenomena on earth”. Grönfeldt and
Strother (2006) state that the most recent definitions view leadership as a process
that focuses less on the characteristics of the leader and more on his or her ability to
coordinate the efforts of an organisation. Several definitions of leadership were
presented in section 1.5.2 in chapter 1, based on the literature from 1996 to 2007.
This section will briefly expound on additional definitions of leadership which have
been proposed by several authors, as indicated in table 4.1.
Table 4.1: Definitions of leadership
Author Definition
Burns (Barker et al.,
2006:15-16)
Leadership is when “persons with certain motives and purposes
mobilise, in competition or conflict with others, institutional,
psychological, and other resources to arouse, engage and satisfy the
motives of followers”.
Bratton (2007:132) “Leadership is the process where an individual member of a group or
organisation influences the interpretation of events, the choice of
objectives and strategies, the organisation of work activities, the
motivation of people to achieve the objectives, the maintenance of
cooperative relationships, the development of skills and confidence
by members, and the enlistment of support and cooperation from
people outside the group or organisation.”
Drafke (2009:460) “Leadership is the ability to influence the activities of others, through
the process of communication, toward the attainment of a goal.”
Thompson (2009:155) “It involves developing a shared view of the destination you are
aiming for and the route you intend to follow to get there … a good
leader ‘pulls’ the team by motivating and inspiring members to
pursue shared goals.”
Page 146
126
Northouse (Wang &
Berger, 2010:6)
Leadership is defined as “a process whereby an individual influences
a group of individuals to achieve a common goal”.
Colquitt, Lepine and
Wesson (2011:483)
Leadership is defined as “the use of power and influence to direct the
activities of followers toward goal achievement”.
Following on the common themes of these definitions, it was proposed in chapter 1,
section 1.5.2, that for the purpose of this study, leadership would be defined as “the
mobilisation and influencing of people to work towards a common goal through the
building of interpersonal relationships and the breaking of tradition to achieve the
organisation’s objectives despite risk and uncertainty”.
4.2.2 Leadership and management
Leadership and management are often erroneously considered to be the same.
However, a review of the management and leadership literature reveals distinct
differences between these two concepts.
According to French, Rayner, Rees and Rumbles (2009), a simple differentiation
between management and leadership would be that management is concerned with
the daily running of the organisation, while leadership has more to do with inspiration
and long-term change. However, management can be distinguished from leadership
in that the former focuses on problem solving as well as planning, organising,
leading and control the use of resources, while the latter provides inspiration and
motivation to gain subordinate support for the attainment of long-term goals. Thomas
(2006) distinguishes between management and leadership in terms of output. The
output of management is making the right decisions, while strong business results
are the output of leadership – hence the importance of leadership as a contributing
factor to service quality. Similarly, Yielder and Codling (2004) argue that
management refers to systems, tasks, goals and results, whereas leadership
focuses on human relations, organising people and creating a vision of what might
be as well as adopting a culture that can achieve that vision. Furthermore, according
to Spendlove (2007), although there are a number of similarities between leadership
and management, they are differentiated by the fact that leadership involves
Page 147
127
influencing people to achieve desired outcomes or goals. The focus of management
is more on the organisation’s current activities and the implementation of policies. In
addition, Drafke (2009) contends that leadership deals with people’s behaviour and it
is only one aspect of management. Management is a broader concept that includes
leadership as well as nonbehavioural functions that do not immediately affect others.
Drafke (2009) concurs with French et al. (2009), and indicates that management is a
process of planning, organising, leading and control, whereas leadership is about
inspiring people.
Thompson (2009) argues that although leadership is a crucial task of management,
anyone can be a leader. Equally important, Kouzes and Posner (2007) state that
leadership is everyone’s business – it is also a behaviour that can be taught and
learnt. The basis of earlier leadership theories such as the trait theory on leadership,
which will be discussed in section 4.3, was that leaders are born and not made.
However, this study supports modern leadership perspectives of authors such as
Kouzes and Posner, who believe that leadership can be taught and learnt.
The significance of the belief that leadership can be taught is indicated in figure 4.2
below.
Figure 4.2: Leadership and management
(Source: Thompson, 2009:154)
Also evident from the above figure is the fact that leadership and management are
indeed two different concepts.
Page 148
128
Bratton (2009) argues that the distinction between leadership and management is
vital in this era of rapid change because successful transformation is 70 to 90%
leadership and only 10 to 30% management, thus emphasising the significant role of
leadership in a rapidly changing society. The comparison between leadership and
management is indicated by Bratton (2009) in figure 4.3 below.
Plans and budgets: establishes detailed steps
and timetables for achieving results. Allocates
necessary resources
Establishes direction: develops a vision of the
future and the strategies for its achievement
Organises and staffs: establishes structure for
achieving the plans, staffs; delegates; develops
policies to guide subordinates; designs control
systems
Aligning people:
Communicates direction by and deeds to all
people whose cooperation may be needed to
influence the creation of teams and coalitions
that understand the vision and strategies, and
accept their validity
ManagementLeadership
Controls and solves problems; monitors results
against plans, identifies deviations, and then
organises to close any gaps
Motivates and inspires:
Energises people to overcome the barriers to
change by satisfying basic human needs
Produces a degree of predictability and order.
Has the potential to produce key results
expected by shareholders
Produces change, often to a dramatic degree.
Has the potential of producing extremely useful
change (e.g. new products).
Creating an
agenda
Developing a
network for
achieving the
agenda
Execution
Outcomes
Figure 4.3: Leadership and management compared
(Source: Adapted from: Bratton, 2007:134)
It is clear from the discussion above that there is a definite distinction between
management and leadership. However, in a study to differentiate between leadership
Page 149
129
and management, Nienaber (2010) found that management is more comprehensive
than leadership, but these two concepts are often used interchangeably and are
indeed intertwined. Nienaber (2010) conducted an extensive literature search which
included leading databases in business and management such as ProQuest,
EBSCOHost, Emerald and SABINET. The findings revealed that there are no
individual leadership tasks, only those that overlap with management tasks.
The next three sections will elaborate on leadership effectiveness, skills and
responsibilities.
4.2.3 Leadership effectiveness
According to Oakland (2003), effective leadership starts with the chief executive
officer’s (CEO’s) vision and strategy that will lead to business or service success.
Effective leadership, together with TQM, results in the organisation doing the right
things right, the first time. Oakland (2003) further identifies the following five
requirements for effective leadership: (1) having a clear corporate purpose; (2)
developing clear and effective strategies; (3) identifying critical success factors and
critical processes; (4) clearly defined responsibilities of the management structure;
and (5) employee empowerment. Clawson (2006), however, took Oakland’s findings
further by identifying six characteristics of effective leadership. These characteristics
are as follows: (1) effective leaders know who they are and what they wish to
achieve; (2) they have a clear view of where they wish to take the organisation; (3)
they recognise the talents of others that can contribute to accomplishing the vision;
(4) they are skilled organisational designers; (5) they never give up; and (6) they
recognise and praise subordinates for progress towards achieving the vision. Kumar
and Kumar (2011) added their findings to the leadership literature by arguing that in
practising effective leadership, leaders not only respond to change, but also
understand the actual change process, gain support for change, involve people in
decision making and reward progress and success (Kumar & Kumar, 2011).
Finally, one can conclude that leadership can only be effective when management
have close ties with their employees. Leaders must establish clear communication
with their subordinates and act on what has been communicated (Oakland, 2003).
Page 150
130
4.2.4 Leadership skills
A review of leadership literature indicates that various authors identify different
leadership skills that make a leader successful. Some of the common themes in
terms of leadership skills found in the literature include, but are not limited to, the
following: advocate for change, visionary, being able to empathise, adaptability to
change, setting clear and consistent goals, enthusiasm, integrity, team builder,
honesty, flexibility, mentor, communicator and being able to inspire (Aikens, 2006;
Bodla & Nawaz, 2010; Bratton, 2007; Evans, 2011; Manning & Curtis, 2003;
Martinez & Wolverton, 2009; Palmer, 2008; Spendlove, 2007; Wang & Berger,
2010).
According to Foster (2010), four crucial skills, namely knowledge, communication,
planning and vision, are necessary for effective leadership. Table 4.2 depicts these
skills of effective leadership.
Table 4.2: Leadership skills
Quadrant 1:
Knowledge
Quadrant 2:
Communication
Quadrant 3:
Planning
Quadrant 4:
Vision
Acceptance of diversity Assertiveness Structuring (for task
accomplishment)
Assessing the climate
(internal and external)
Developing
competence
Conflict management Decision making Identifying
opportunities
Health/Wellness Team building Evaluation skills
Learning style Trust building Task and time
management
Time management Motivating others
Ethics Recruiting others
Risk taking Effective speaking
Coping skills Effective writing
Page 151
131
Effective listening
Image building
(Source: Foster, 2010:132)
With reference to table 4.2 above, in quadrant 1, knowledge helps the leader accept
risk. In quadrant 2, the leader needs to communicate with subordinates as well as
other leaders. In quadrant 3, the leader must plan and make decisions, and finally, in
quadrant 4, the internal and external environment needs to be assessed and a vision
of the future formulated.
Drafke (2009) distinguishes between four leadership skills, namely technical skills
(the ability to perform the task required), human resource management skills
(behavioural skills as in being able to work with people), conceptual skills (the ability
to analyse and see the “big picture”) and trust building skills (the ability to build a
trust relationship with subordinates).
Kumar and Kumar (2011) underscore the importance of leadership skills and claim
that leadership skills guide the way, are measurable and can be learnt (Kumar &
Kumar, 2011). This view builds on the findings of Kousez and Posner (2007) and
Osseo-Asare, Longbottom and Chourides (2007), who argue that leadership is a skill
or behaviour that can be taught and learnt. The LPI instrument is based on the five
practices of exemplary leadership, namely modelling the way, inspiring a shared
vision, challenging the process, enabling others to act and encouraging the heart
(Kouzes & Posner, 2007). A detailed discussion of the LPI instrument will follow in
section 4.9 of this chapter.
4.2.5 Leadership responsibilities
Some of the main leadership responsibilities identified in the literature include, but
are not limited to, the formulation of a clear vision, effective communication and
shaping the organisational culture. The vision is future oriented and refers to a clear
picture of the future. Organisational culture refers to the habits or unwritten rules in
the organisation or “the way we do things around here” (Manning & Curtis, 2003;
Page 152
132
Thompson, 2009). The responsibilities of business leadership, according to Aikens
(2006), are indicated in figure 4.4 below.
Energy
Effectiveness
Development
Values
Provide a clear vision
Encourage new ideas
Create inspired workforce
Create culture that values customers
Encourage freedom of expression
Practise fairness and equity
Have respect for others
Share credit and rewards
Promote pride, dignity and loyalty
Promote team work
Respect new ideas
Encourage participation at all levels
Know who to listen to and when
Encourage revolving leadership
Develop future leaders
Help people to be the best they can be
Create desire for continued learning
Allow people to grow
Invest in change
Figure 4.4: Responsibilities of business leadership
(Source: Adapted from Aikens, 2006:94)
Aikens (2006) divides business leadership responsibilities into the following four
categories: energy, values, effectiveness and development. Each of these categories
is linked to a set of responsibilities. Wang and Berger (2010) also investigated
leader responsibilities and added direction, namely providing structure for followers.
For the purpose of this study, the responsibilities of leadership can be summarised
by the ten commitments of exemplary leadership as identified by Kouzes and Posner
(2007:26):
Page 153
133
(1) Clarify values by finding your voice and affirming shared ideas.
(2) Set the example by aligning actions with shared values.
(3) Envision the future by imagining exciting and ennobling possibilities.
(4) Enlist others in a common vision by appealing to their shared aspirations.
(5) Search for opportunities by seizing the initiative and looking outwards for
ways to improve.
(6) Experiment and take risks by constantly generating small wins and learning
from experience.
(7) Foster collaboration by building trust and facilitating relationships.
(8) Strengthen others by increasing self-determination and developing
competence.
(9) Recognise contributions by showing appreciation for individual excellence.
(10) Celebrate values and victories by creating a spirit of community.
The next two sections focus on leadership theories and styles. The purpose of these
two sections is to briefly explain some of the different theories and styles on
leadership and how research on this construct has developed in the last century.
Given the research objectives stated in section 1.4 of chapter 1, an in-depth
discussion of leadership theories and styles is beyond the scope of this study.
The literature on leadership uses the terms “leadership theory”, “leadership
approach”, “leadership style”, “leadership behaviour”, “leadership perspective”, and
to a lesser extent “leadership model”, interchangeably. For consistency and for the
purpose of this study, the terms “model” and “theory” will be represented by the term
“theory” and the terms “approach”, “behaviour”, “perspective” and “style” will be
represented by the term “style”.
4.3 LEADERSHIP THEORIES
Various leadership theories have developed in the last eight decades (Grönfeldt &
Strother, 2006). This section will focus on a select few that can be classified as either
traditional or modern leadership theories. The first part of this section will focus on
traditional leadership theories and the second part on modern theories or modern
schools of leadership.
Page 154
134
4.3.1 Traditional leadership theories
Traditional leadership theories consist of the trait theory, the behavioural theory and
the contingency theory.
4.3.1.1 Trait theory
The birth of the trait theory dates back as far as the turn of the 20th century. The
focus of the trait theory was on an individual’s physical, social and personal
characteristics such as height, integrity, intelligence, self-confidence, strong values,
attractiveness and creativity, to name but a few. Research on the trait theory was
published mainly between the 1930s and 1950s. The trait theory tried to distinguish
leaders from nonleaders or effective leaders from noneffective leaders. It was
assumed that some people are born with these traits or characteristics and that they
will be better leaders (Bodla & Nawaz, 2010; Bratton, 2007; French et al., 2009;
Grönfeldt & Strother, 2006; Laohavichien, Fredendall & Cantrell, 2009; Manning &
Curtis, 2003; Nevarez & Wood, 2010; Von Eck & Verwey, 2007).
4.3.1.2 Behavioural theory
The behavioural theory developed from the trait theory in the 1950s. Researchers
focused more on the behaviour of leaders that led to improved organisational
effectiveness as well as increased productivity and satisfaction of followers. The
focus was on how leaders behaved towards followers, that is, the interaction
between leaders and followers. Research on the behavioural theory identified two
types of behaviours, namely task- and person-oriented behaviour. The former refers
to the leader’s focus on the achievement of goals while the latter focuses on the
building of interpersonal relationships. Thus the behavioural theory of leadership
focuses on certain behaviours that differentiate effective leaders from ineffective
leaders (Bodla & Nawaz, 2010; Bratton, 2007; French et al., 2009; Grönfeldt &
Strother, 2006; Laohavichien et al., 2009; Nevarez & Wood, 2010; Von Eck &
Verwey, 2007).
Page 155
135
4.3.1.3 Contingency theory
Researchers found that leaders with the same traits and behaviours displayed
various success rates in different situations. The third traditional leadership theory,
namely the contingency theory, developed in the late 1960s. The focus of this theory
is on the interaction between the leader’s traits and behaviours and his or her
specific situation. A desired outcome will thus be reached depending on contextual
factors contributing to the way in which the leader approaches a certain situation.
Leadership effectiveness therefore depends on the leader, the follower and
situational factors such as the external and internal environment and the type of work
(Bratton, 2007; French et al., 2009; Grönfeldt & Strother, 2006; Laohavichien et al.,
2009; Manning & Curtis, 2003; Nevarez & Wood, 2010; Von Eck & Verwey, 2007;
Wang & Berger, 2010).
4.3.2 Modern leadership theories
This section examines the transformational and transactional leadership theories.
4.3.2.1 Transformational leadership
In terms of the modern schools of leadership, Wang and Berger (2010) state that
after the early 1980s, a fourth leadership theory emerged, namely transformational
leadership, which has become the focal point of much research. According to this
theory, people engage with one another and create a connection that leads to higher
levels of motivation for both leaders and followers. In addition, Grönfeldt and Strother
(2006) mention that the transformational theory shifted the focus towards the
relationship between leadership and change. Similarly, according to Osseo-Asare et
al. (2007) and Laohavichien et al. (2009), transformational leadership is necessary to
create and lead change.
According to Spendlove (2007), transformational leadership is based on a leader’s
charisma and intellectual inspiration. Research supports the notion that a charismatic
or transformational leadership style may be more effective in HE. Similarly, Von Eck
and Verwey (2007) contend that transformational leadership is based on developing
Page 156
136
an appealing vision of the future and motivating and inspiring followers to achieve
organisational goals. Charismatic leadership is sometimes used interchangeably with
transformational goals and is also based on motivation to attain goals. This is
supported by the research of Bodla and Nawaz (2010), which indicates that
transformational leadership occurs when a leader is charismatic and motivates,
inspires and stimulates his or her followers intellectually to achieve extraordinary
goals.
According to French et al. (2009) and Evans (2011), transformational leadership has
four dimensions, namely inspirational motivation, intellectual stimulation,
individualised influence and individualised consideration. Furthermore, Von Eck and
Verwey (2007) maintain that some of the skills associated with transformational
leadership include the creation of a clear vision, communication skills, the ability to
obtain buy-in for change, empowering people, flexibility and empathy.
Research has shown that transformational leadership is associated with higher
quality and that transformational leaders outperform transactional leaders (Jabnoun
& Juma AL Rasasi, 2005). According to Osseo-Asare et al. (2007), transformational
leadership seems to improve staff satisfaction and overall business results. Colquitt
et al. (2011) mention that transformational leadership has strong effects in
organisations and business units that are led by a transformational leader seem to
be financially more successful and produce higher quality products and services.
Furthermore, transformational leaders seem to have higher quality relationships of
mutual respect with their followers who also tend to have higher levels of job
performance.
The concept of transformational leadership is closely aligned with the five practices
of exemplary leadership upon which the LPI instrument is based. Similarly, according
to Colquitt et al. (2011), the four dimensions of transformational leadership have
much in common with the five practices of exemplary leadership. As indicated in
section 1.5.2.4 in chapter 1, the LPI instrument was applied in this study. Hence the
LPI measures transformational leadership behaviour as demonstrated by leaders.
Page 157
137
4.3.2.2 Transactional leadership
In transactional leadership, leaders and followers exchange services to achieve their
objectives. This theory is based on a contractual commitment where the leader
rewards his or her followers for objectives achieved. It involves exchanges or
transactions between leaders and followers such as agreements or contingent
rewards on a daily basis. The leader takes the initiative to make contact with his or
her followers for the purpose of exchange. The need of both the leader and follower
are met through the exchange process, but their purposes are not related in the
sense that they do not pursue a common goal or direction. The transactional
leadership theory therefore assumes that followers will wield extraordinary efforts to
achieve the organisational goals based on exchanges such as contingent rewards
(Barker et al., 2006; Bodla & Nawaz, 2010; Evans, 2011; French et al., 2009;
Spendlove, 2007).
Laohavichien et al. (2009) claim that transactional leadership is a process of
exchange whereby the leader rewards or punishes constituents on the basis of the
achievement of organisational goals. Some authors point out that transactional
leadership is necessary because it clarifies goals and ways to accomplish them.
According to Laohavichien et al. (2009), transformational and transactional
leadership are different but complementary behaviours and that leaders demonstrate
varying degrees of these behaviours as required. However, more effective leaders
demonstrate higher levels of transformational leadership than transactional
leadership. Earlier research by Bass and Avolio (1994) and Waldman (1994)
suggests that transactional leadership can have a negative effect because
constituents might feel that they are forced to do unpleasant tasks which could then
impact negatively on quality performance.
Page 158
138
4.4 LEADERSHIP STYLES
There is a wealth of literature on leadership styles such as instructional,
participatory, servant and distributive leadership (Nevarez & Wood, 2010). Drafke
(2009) and Manning and Curtis (2003) mention three classical leadership styles that
will also be considered in this discussion, namely the authoritarian or autocratic,
participative or democratic and free-rein or laissez-faire leadership styles.
Wang and Berger (2010) also refer to the three leadership styles, namely
authoritarian, laissez-faire and democratic. (1) Authoritarian leaders thrive on group
dependence on the leader; it is the presence of the leader that keeps the group
together and in his or her absence, no work will be done. (2) Laissez-faire leaders
achieve little work whether they are present or not; and (3) democratic leaders
achieve healthy working relationships, whether they are present or absent. Robbins
and Coultar (cited in Bodla & Nawaz, 2010: 209) define the autocratic style as “a
leader who tends to centralise authority, dictate work methods, make unilateral
decisions, and limit employee participation”; the democratic style as “a leader who
tends to involve employees in decision making, designate authority, encourage
participation in deciding work methods and goals, and use feedback as an
opportunity for coaching employees”; and the laissez-faire style as “leaders who
generally give the group complete freedom to make decisions and complete the work
in whatever way it see fit”. In addition, Bodla and Nawaz (2010) state that in laissez-
faire leadership, the leader avoids commitment to making decisions and does not
make use of his or her authority. Table 4.3 indicates the different use of power in the
three styles of leadership.
Page 159
139
Table 4.3: Continuum of leadership styles
Directive style Participative style Free-rein style
Maximum use of authority by
leader
Maximum area of freedom of
followers
Leader
decides what
is to be done
and how it is
to be done,
and presents
the decision to
followers,
allowing no
questions or
opposing
points of view.
Leader
attempts to
convince
followers of
the “rightness”
of the
decision.
Leader
announces
principles and
sets forth
methods of
decision
making, yet
permits ideas,
questions and
discussion
from followers.
Leader
presents a
problem, asks
for followers’
ideas and
makes final
decisions
based on their
input.
Leader
presents
problems with
some
boundaries
and allows
followers to
make final
decision.
Leader allows
followers as
much freedom
as leader has
to define
problems and
make
decisions
Directive style
(Leader-centred
decision making)
Participative style
(Leader and followers share
decision making)
Free-rein style
(Follower-centred
decision making)
Range of behaviour
(Source: Adapted from Manning & Curtis, 2003:48)
Manning and Curtis (2003: 49) mention five key points relating to leadership styles:
• Styles of leading are influenced by experience.
• An individual usually prefers the same style of leading and following.
• Leaders have been successful along all points of the continuum (see table 4.3).
• There is no universally effective style of leading. Sometimes it is best for the
leader to tell employees what to do; sometimes it is best for leaders and
subordinates to make decisions together; and sometimes it is best for employees
to direct themselves. The best style of leadership depends on the qualities of the
leader, the characteristics of the followers and the nature of the situation.
Page 160
140
• If styles of leading and styles of following conflict, extra patience and
communication are needed.
Drafke (2009) seems to agree with point 4 of Manning and Curtis (2003) above by
stating that the best leadership style depends on three factors, namely the situation,
the type of followers and the type of leader. In addition, Trivellas and Dargenidou
(2009) maintain that leaders who balance different leadership styles seem to be
more successful than those who focus on one style or role.
4.5 LEADERSHIP AND QUALITY
Leadership by top management is crucial for achieving quality superiority (Gryna et
al., 2007). In addition, Foster (2010) holds that quality management begins with
leadership, which is a core element of the quality management process. The impact
of leadership is clear – organisations with weak leadership will not gain a market
advantage in quality. According to Evans (2011), quality can only be improved
through strong leadership, which is top management’s responsibility. Quality
improvement efforts cannot be sustained without strong leadership from the top.
Evans’s view is not singular. Earlier, Jabnoun and Juma AL Rasasi (2005) confirmed
the importance of leadership in quality initiatives and referred to the findings of many
scholars, including quality experts such as Deming and Juran. Figure 4.5 below
indicates the content variables of quality management.
Page 161
141
Outer ring
Environmental characteristics
Quality breakthrough
Inner ring
Information analysis
Strategic planning
Quality department focus
Team approach
Core
LeadershipEmployee improvement
Quality assurance
Customer role
Philosophy
Figure 4.5: A categorisation of quality management content variables
(Source: Adapted from Foster, 2010:81)
According to Foster (2010), organisations should address these variables if they
seek to improve their overall business performance. As indicated in figure 4.5,
leadership is at the core of quality management. By the same token, Osseo-Asare,
Longbottom and Murphy (2005) identify leadership as one of the core elements for
sustaining continuous improvement in any organisation. Many of the founders of
quality management (e.g. Deming), quality management scholars and empirical
quality management studies focus on the key role of leadership in quality
Page 162
142
management. This is based on the fact that leaders motivate constituents, who in
turn help to improve quality performance (Laohavichien et al., 2009).
According to Laohavichien et al. (2009), many researchers have indicated that the
visionary leadership concept promoted by Deming as the most appropriate type of
leadership for quality management, is in fact transformational leadership. Research
conducted by Laohavichien et al. (2009) found that transformational leadership
impacts positively on both infrastructure (the organisation’s internal practices that
show management support for internal and external relationships) and quality
management practices (technical aspects, i.e. statistical process control), while
transactional leadership does not affect either. The research has provided evidence
that effective quality management requires top management commitment, and
systems and policies to support quality. The evidence indicates that quality
performance increases when there is support from top management, especially
where leaders emphasise relationship-oriented and communication leadership
practices. This confirms that organisations with higher quality performance display
higher levels of transformational leadership than organisations that are less
successful quality performers.
The remainder of this section will focus on the significance of leadership in
international quality awards such as the Malcolm Baldrige National Quality Award
(MBNQA) and the European Foundation for Quality Management (EFQM)
Excellence Model. The section concludes with a discussion of the role of leadership
in the ISO 9000: 2008 standard and in total quality management (TQM).
4.5.1 THE MBNQA
This award is presented annually in the USA and is one of the most powerful
assessment tools for an organisation to measure quality business performance. The
award has been used as the basis for various international quality awards. Small
(fewer than 500 employees) and large (more than 500 employees) organisations in
the manufacturing, health care, education and services sector are eligible to apply
for the MBNQA process. The MBNQA consists of seven categories that form the
organisational system for performance, as represented in figure 4.6 below.
Page 163
143
Figure 4.6: Baldrige Award framework
(Source: Adapted from Foster, 2010:98)
Category 1 represents the criteria for leadership which evaluate the extent to which
top management are involved in the creation of goals, the setting of objectives and
involvement with customers (Foster, 2010; Gryna et al., 2007). According to
Laohavichien et al. (2009), empirical tests of the MBNQA criteria support the fact that
leadership is critical to success in quality management.
4.5.2 The EFQM
European organisations created the EFQM in 1988 following the success of the
MBNQA, the acknowledgement that changes were needed if Europe wanted to
compete in the world market as well as increased competition from abroad. The
EFQM manages the European Quality Award (EQA) as indicated in figure 4.7 below.
Page 164
144
LeadershipKey
Performance
results
Processes
People
Policy and
strategy
Partnerships
and
resources
ResultsEnablers
People
results
Customer
results
Society
results
Figure 4.7: European Quality Award
(Source: Foster, 2010:111)
The focus of the Baldrige criteria is more on customer service and improved
products, whereas the focus of the EQA is more on employee satisfaction as an
outcome of the quality system (Foster, 2010). Leadership is the first criterion of the
EQA.
According to Dale et al. (2007: 48), the leadership criteria for the EQA are divided
into the following five parts:
• Leaders develop the mission, vision, values and ethics and are role models of a
culture of excellence.
• Leaders are personally involved in ensuring the organisation’s management
system is developed, implemented and continuously improved.
• Leaders interact with customers, partners and representatives of society.
• Leaders reinforce a culture of excellence with the organisation’s people.
• Leaders identify and champion organisational change.
Page 165
145
Furthermore, Osseo-Asare et al. (2005) maintain that leadership can be expressed
in terms of what leaders are expected to do, that is, “doing right things right”. This
phrase can then be divided into “doing right things”, referring to “effectiveness” and
“doing things right”, referring to “efficiency”, suggesting a functional relationship
between effectiveness and efficiency. The EFQM framework confirms this functional
relationship by means of the following definition of leadership: “How leaders develop
and facilitate the achievement of the mission and vision, develops values required for
long-term success and implement these via appropriate actions and behaviours, and
are personally involved in ensuring the organisation’s management system is
developed and implemented” (British Quality Foundation cited in Osseo-Asare et al.,
2005:151).
4.5.3 ISO 9000:2008
ISO is the Organisation for International Standards located in Geneva in Switzerland.
The ISO 9000:2008 standard was developed so that a uniform international standard
for the documentation of quality systems could be utilised by different countries. The
ISO standard is broad in the sense that it can be adapted for various industries. The
eight principles that form the basis of the ISO standard include customer focus,
leadership, a process approach, the involvement of people, a systems approach to
management, continual improvement, a factual approach to decision making and
mutual beneficial supplier relationships (Dale et al., 2007; Foster, 2010).
Furthermore, according to Ramphal (2011a), top management should create a
quality culture in which all stakeholders contribute to the optimisation of quality. The
application of the leadership principle of the ISO 9000:2008 standard includes, but is
not limited to, a proactive leadership approach which entails leading by example,
establishing a clear vision, promoting open communication, setting clear goals,
building trust and so forth.
The vital role of leadership in the management of quality cannot be overemphasised.
From the discussion in the previous sections, it is evident that leadership is the
fundamental building block on which the MBNQA, the EQA and the ISO 9000:2008
series of standards are based. This is supported by Osseo-Asare et al.’s (2007)
statement that the primary role of leadership in effecting continuous improvement is
Page 166
146
recognised by quality management-based models such as the EFQM Excellence
Model and the MBNQA.
4.5.4 Total quality management (TQM)
In section 3.3.1.1 of chapter 3, TQM was referred to as a company-wide approach to
quality that can significantly improve company performance. Hence TQM is a vital
quality approach in getting everyone in the organisation involved in the process of
continuous improvement.
Kumar and Kumar (2011) identify the following principles of TQM: (1) top
management commitment (leadership); (2) supplier quality management; (3)
continuous improvement; (4) product innovation; (5) benchmarking; (6) employee
involvement; (7) reward and recognition; (8) education and training; (9) customer
focus; and (10) product quality.
Leadership is the core element in all TQM approaches in HE providers and also
seems to be a critical factor for success. Leadership commitment to quality
improvement has led to the success of TQM applications in many HE providers in
the UK. Based on strategic management principles and TQM models such as the
EFQM excellence model, leadership “processes” are necessary for excellent
performance results. Referring back to figure 4.7, leadership is the “input” into the
“process” and the results the “output” from the process. In section 4.5.2 it was
indicated leaders need to be both effective and efficient in what they do. TQM
provides proof of a shift in leadership from being inspection oriented to being
prevention–oriented, which combines effectiveness and efficiency and acknowledges
people as a strategic resource (Osseo-Asare et al., 2005). Likewise, Osseo-Asare et
al. (2007) contend that leadership is the principal element for successful
implementation of TQM in HE providers.
A study conducted by Kumar and Kumar (2011) confirms that leadership is essential
for the implementation of TQM. Academics and practitioners agree that the success
of TQM relies primarily on leadership. This is confirmed by various quality awards
such as the EQA and the MBNQA which also identify leadership as a crucial element
for continuous performance improvement (Kumar & Kumar, 2011).
Page 167
147
In conclusion, Spigener (2004) contends that a complete quality system works from
the top down through strong leadership and engagement with workers, and that
successful leaders adopt quality as part of their every day work life. Effective leaders
also link quality objectives to organisational objectives, connect employees and
managers and align behaviours and practices across the organisation to achieve a
quality culture that expedites the achievement of overall organisational goals.
4.6 LEADERSHIP AND SERVICE QUALITY
According to Rausch (1999), leadership skills can have a positive impact on the
quality of service, and in service organisations, more than in manufacturing
organisations, people’s actions are the core of service quality. In the manufacturing
industry, for example, when a problem is identified in the first phase of the production
of an item, it can be rectified in the next phase, long before the item reaches the
customer. However, when a service organisation fails in the same way, the client will
be the first to know. According to Milakovich (2006), leadership should know how to
continually improve systems, predict customer needs and adopt service cultures to
focus on customer-driven quality. It is imperative to achieve high service quality to
ensure an organisation’s survival in a competitive, profit-driven economy. If an
organisation fails to achieve its set objectives, the cause can often be traced back to
a lack of leadership commitment. Leadership in a service environment generally
tends to adopt a transformational leadership approach as described in section 4.3. In
addition, according to Trivellas and Dargenidou (2009), the role of leadership is
critical in improving service quality. Although there are many different forms of
leadership, many theorists support the contention that a style based on human
relationships will result in higher levels of staff satisfaction, group unity and improved
organisational performance. In a similar vein, Tata and Prasad (Trivellas &
Dargenidou, 2009) mention that people-oriented leadership roles based on
teamwork, empowerment, customer focus and continuous improvement, are more
beneficial for quality management implementation initiatives. According to Trivellas
and Dargenidou (2009), this is also applicable to HE. Hence to improve service
quality in HE, leadership behaviour needs to shift towards a transformational role
based on people-oriented leadership.
Page 168
148
Milakovich (2006) refers to the term total quality service (TQS) which is a simple but
powerful improvement process for achieving customer satisfaction. It can be
described as a strategy for improving services through continual improvements in
quality. TQS is a critical first step to exceed customer expectations in terms of
service quality and thus to increase market share. Similar to TQM, leadership is one
of the core components of TQS, as indicated in figure 4.8 below.
LEADERSHIP TEAMWORK
CUSTOMER
ORIENTATION
SYSTEMS
THINKING
PEOPLE TOOLS STATISTICAL TOOLS
Brainstorming
Scenario Writing
Synetics
Nominal Group Technique
Delphi Method
Multivoting
Consensus Building
Cause and Effect diagrams
Pareto Charts
Flow Diagrams
Check Lists
Scatter Diagrams
Histograms
Run Charts
Control Charts
Figure 4.8: An interactive model for TQS
(Source: Milakovich, 2006:108)
Milakovich (2006) goes on to say that leadership in the TQS model is essential for
transforming the behaviour of people in service organisations. The model views
human, managerial and technical subsystems as being interrelated to the mission of
the organisation. Successful TQS may result in higher productivity, lower operating
Page 169
149
costs and improved job satisfaction. Likewise, Milakovich (2006) suggests the
following action strategies for leadership to improve service quality: (1) encourage
teamwork and break down barriers between departments; (2) formulate a mission
that represents the shared values of the organisation; (3) empower employees; (4)
attend to the needs of customers and suppliers; and (5) continually adapt to change.
In a study conducted by Jabnoun and Juma AL Rasasi (2005) it was found that
service quality was positively related to both transformational and transactional
leadership. Many research studies provide evidence that transformational leadership
improves employee performance. However, these studies only focused on
performance measures such as profit, sales figures and stock performance.
Jabnoun and Juma AL Rasasi (2005) further maintain that no other empirical study
could be found that investigates the relationship between leadership practices or
behaviour and service quality. This study could in fact be the only other attempt to
report on the impact of leadership practices or behaviour on service quality. Whereas
the study of Jabnoun and Juma AL Rasasi (2005) focussed on United Arab Emirates
hospitals, the current study was conducted in the PHE sector in South Africa, as
highlighted in chapter 2.
The last three sections of this chapter will focus on leadership in HE, leadership
measurement instruments and the LPI instrument. The use of this measurement
instrument in this study will also be justified.
4.7 LEADERSHIP IN HE
Section 2.3.3 in chapter 2 provided an overview of the changes and current
challenges in HE. In the same vein, Yielder and Codling (2004) assert that
leadership in HE has become increasingly uncertain because of external challenges.
According to Van Ameijde, Nelson, Billsberry and Van Meurs (2009), HE institutions
are constantly facing the pressures of change. Some of these pressures can be
attributed to increased competition between colleges and universities for students
and funding as well as the expectation of the private sector to produce highly
qualified graduates. This has also led to a change in the “academic language” of
principals, students and courses to a language more common to line managers,
customers and products. Hence HE institutions, especially PHE institutions, are no
Page 170
150
longer in a protected environment and are expected to function according to market
requirements and pressures. According to Trivellas and Dargenidou (2009), the
study of leadership in HE is problematic because of dual control systems
(professional and administrative authority) and unclear goals. Leadership has to be
applied in both administrative and academic departments. Academic leaders face
more challenges than ever before because of new rules and regulations, systems of
quality assurance and external bodies that expect HE providers to simply accept
change and restructure accordingly.
Wang and Berger (2010) identify the following problems that seem to have infected
HE in the 21st century:
• People in leadership positions in HE (i.e. college principals) are hired on the
basis of nepotism as well as their connections with HE administrative bodies.
• People in leadership positions in HE (i.e. college principals) are not committed to
shared governance.
• People in leadership positions in HE (i.e. college principals) make policy
decisions behind closed doors.
• People in leadership positions in HE (i.e. college principals) favour certain groups
and retain unqualified staff, while there are more suitable and qualified staff being
excluded from the faculty.
• People in leadership positions in HE (i.e. college principals) make uninformed
decisions that are not research or evidence based.
The authors summarise their list of problems in HE by stating that some HE leaders
are simply incompetent and should never have been appointed as leaders.
Osseo-Asare et al. (2005:151) define leadership in HE as “a personal and
professional ethical relationship between those in leadership positions and their
subordinate staff, needed in order to appreciate and call forth their full potential”.
Management in an HE setting includes managing resources, staff, space and
operational and strategic planning. Leadership in HE includes activities such as
giving academic direction, setting an example, building teamwork, teaching and
research, consultation with students and decisions relating to academic
programmes. Leadership and management involve different but overlapping abilities
Page 171
151
and skills. In HE, someone in a management position is “in authority” as part of an
organisational structure, while someone in a leadership position is “an authority” on
the basis of his or her knowledge of a particular field of study (Yielder & Codling,
2004). Furthermore, Neave and Van Vught (Yielder & Codling, 2004) assert that the
managerial aspect of leadership in HE providers is characterised by the following
three features: (1) increased influence of external stakeholders (i.e. government), (2)
a strong focus on strategic planning, and (3) the embracing of corporate techniques
and characteristics.
Effective leadership practices are one of the critical success factors for quality
improvement in HE and consist of two factors. The first is clear “communication” of
the vision and mission, while the second entails the implementation of “core
processes” with the help of empowered staff to deliver a superior service to students
and other stakeholders (Osseo-Asare et al., 2005). In addition, according to Osseo-
Asare et al. (2007), leadership is the driver that accomplishes academic excellence
in HE. Staff in leadership positions in HE have a dual responsibility. Firstly, they must
be effective leaders in deciding on the right teaching and research objectives.
Secondly, they must be efficient managers in terms of resource allocation in order to
achieve the set objectives. Leadership in HE should be based on empowerment,
motivation, support and encouragement instead of inspection and control of staff.
Spendlove’s (2007) findings indicate that credibility and experience of university life
are fundamental elements for effective leadership in HE. Additional key elements
include people skills, honesty and the ability to think strategically and negotiate and
communicate with others. Credibility was found to be the main element for effective
leadership in HE. Taken as a whole, these findings confirm Kouzes and Posner’s
(2007) assumption that credibility is the foundation of leadership.
From the discussion above it would seem that some of the key characteristics of
leadership in HE include giving academic direction, clear communication of the
vision and mission, team building, strategic planning and credibility, to mention but a
few. Research by Thorp and Goldstein (2010) identified the following commonalities
of leadership in HE: (1) the setting of a clear mission and vision, (2) establishing a
culture that celebrates innovation and creativity, (3) strategic planning in order to
create a sustainable competitive advantage, and (4) team building.
Page 172
152
Osseo-Asare et al. (2005) clearly indicate that transformational leadership is crucial
in an HE provider in order to transform weak practices into best practices, thus
reducing staff turnover, raising morale and reducing workloads and staff
dissatisfaction to acquire better results through empowerment. In addition, Bodla and
Nawaz (2010) compared transformational and transactional leadership in public and
private HE institutions. They found that leaders in both sectors have the same
degree of transformational leadership. This confirms the statements of Spendlove
(2007) and Trivellas and Dargenidou (2009) in sections 4.3 and 4.6 respectively that
a transformational leadership approach is more effective in HE.
4.8 LEADERSHIP MEASUREMENT INSTRUMENTS
What makes a leader more effective is a question that has been posed since the
birth of the traditional leadership theories. Hence a large group of leadership
measurement instruments were developed to investigate effective leadership.
Leadership effectiveness can be measured in various ways. Leaders may be judged
on performance measures such as profit margins, market share, return on
investment, productivity, quality and so forth. Other approaches to measuring
leadership effectiveness include employee surveys that assess the observed
performance of the leader, including respect for him or her and his or her legitimacy
(Colquitt et al., 2011). The most common themes of leadership measurement
instruments are discussed below.
In chapter 1, five leadership assessment tools were investigated. It was found that all
the instruments under investigation were based on self-assessment only and lacked
reliability and validity. It was stated in section 1.5.2.4 in chapter 1 that the LPI would
be utilised to conduct this study. This section will briefly expound on seven additional
leadership assessment tools that could be applied in a PHE environment to measure
leadership effectiveness. The fact that the LPI was deemed to be the most
appropriate instrument for this study will also be confirmed. The review of all existing
leadership assessment tools is beyond the scope of this study.
Page 173
153
4.8.1 The Multifactor Leadership Questionnaire (MLQ)
The MLQ was developed by Bass in 1985 and consists of 142 statements measuring
three transformational and three transactional factors. The transformational factors
include charisma, intellectual stimulation and individualised consideration. The
transactional factors comprise contingent reward, active management by exception
and passive-avoidant leadership. The MLQ is a well-established research tool and
has been applied in a variety of research settings (Jabnoun & Juma AL Rasasi,
2005; Sylvester, 2009). The MLQ was not chosen for this study because the primary
focus is not on transactional leadership characteristics. In addition, Carless, Wearing
and Mann (1994:16) clearly indicate that “the results of this research provide
evidence that the LPI has better discriminate validity compared with the MLQ. Based
on these findings, it is recommended that future empirical research is undertaken
with the LPI. The findings of this research indicate that the LPI, compared to the
MLQ, is a more effective discriminating instrument. In addition, there was substantial
agreement between the self and other ratings on the LPI compared with the MLQ."
4.8.2 The Transformational Leadership Behaviour Inventory (TLI)
The TLI was developed by Podsakoff, Mackenzie, Moorman and Fetter in 1990. The
model assesses six transformational leadership components and one component of
transactional leadership, namely contingency rewards. The six components of
transformational leadership are: (1) identifying and articulating the vision; (2)
providing an appropriate model; (3) fostering acceptance of group goals; (4) high
performance expectations; (5) providing individualised support; and (6) intellectual
stimulation. The TLI questionnaire consists of 28 questions (four questions per
component) and respondents have to rate each item on a Likert scale from 1
(strongly disagree) to 7 (strongly agree). The TLI was originally developed on the
basis of research in a large petrochemical organisation and has also been applied in
a study in secondary education, private organisations in Pakistan and a leadership
study in organisations in the USA and Canada. Researchers have found that the
psychometric properties of the TLI are acceptable for research purposes.
(Odegaard, 2008; Podsakoff, Mackenzie & Bommer, 1996; Riaz & Haider, 2010;
Sylvester, 2009). However, according to Podsakoff et al. (1990), the three
Page 174
154
dimensions of identifying and articulating the vision, providing an appropriate model
and fostering acceptance of group goals were found to be highly intercorrelated. For
this reason as well as the limited use of this model in research, it was decided not to
apply the TLI in this study.
4.8.3 The Leader Assessment Inventory (LAI)
The LAI was developed by Warren Burke in 1994. It is a 35-item, five-point Likert
scale questionnaire that measures transformational and transactional leadership
styles. The LAI has been applied in leadership development programmes and
empirical studies (Doolos, 1997; Feinhberg, Ostroff & Burke, 2005; Rakoff, 2010;
Sylvester, 2009). However, this model is rarely used in research and is difficult to
obtain (Sylvester, 2009).
4.8.4 The Follower Belief Questionnaire and the Attributes of Leader Behaviour
Questionnaire
The Syncretical Model of Charismatic /Transformational Leadership was developed
by Behling and McFillen in 1996. The questionnaire consists of 66 items with a five-
point Likert scale in which six attributes of leader behaviour and three of follower
behaviour are assessed (Behling & McFillen, 1996; McCann, Langford & Rawlings,
2006; Sylvester, 2009). Behling and McFillen’s (1996:184) article states that “…
further tests of the instrument are in order”. Furthermore, additional research
provided only partial support for Behling and McFillen’s original theory and raised
questions about certain attributes of leadership behaviour applied in the model
(McCann et al., 2006). On the strength of the above information, this instrument was
not applied in this study.
4.8.5 The Conger-Kanungo (CK) scale
The CK scale is a 20-item, five-dimensional scale with which charismatic leadership
is assessed. The five dimensions include (1) strategic vision and articulation, (2)
sensitivity to the environment, (3) personal risk, (4) unconventional behaviour, and
(5) sensitivity to member needs (Conger, 1999; Conger, Kanungo, Menon & Mathur,
Page 175
155
1997; Yang, 2009). The application of the CK scale in research is limited and not as
extensively documented as the LPI and MLQ (Sylvester, 2009).
4.8.6 The Transformational Leadership Questionnaire (TLQ)
The TLQ, which was developed by Alban-Metcalfe and Alimo-Metcalfe in 2000, is
based on data obtained from 1 464 managers in local government organisations in
the UK. Further research conducted by Alban-Metcalfe and Alimo-Metcalfe in 2001
and 2007 respectively found that the TLQ possesses psychometric criteria of
reliability, construct, content and convergent validity (Alban-Metcalfe & Alimo-
Metcalf, 2000; Alban-Metcalfe & Alimo-Metcalf, 2001; Alban-Metcalfe & Alimo-
Metcalf, 2007). Although a review of the literature shows that the instrument has
been applied in various studies, there is a need for further research on the TLQ in
terms of a broader sample of industries and organisations to examine the predictive
validity of the instrument (Sylvester, 2009).
4.8.7 The Global Transformational Leadership (GTL) scale
The GTL was developed by Carless et al. in 2000 and based on data collected from
a sample of 1 440 subordinates who assessed the leader behaviour of 695 branch
managers in an Australian financial organisation. The GTL is a short assessment of
transformational leadership comprising a seven-item survey with a five-point Likert
scale. The scale measures whether a leader is visionary, innovative, supportive,
participative and worthy of respect and distinguishes between strong and weak
leaders. Research has proven that the scale is reliable with convergent and
discriminant validity (Carless et al., 2000; Sylvester, 2009). However, according to
Sylvester (2009), the GTL has not been applied as extensively in research as the LPI
and the MLQ, and it was thus not used in this study.
4.9 THE LEADERSHIP PRACTICES INVENTORY (LPI)
As indicated in the previous section, the LPI was selected for this study. In this
section the LPI will be examined in more detail and its application in this study
justified. Mention will also be made of other studies that have applied the LPI
Page 176
156
instrument in empirical research. The development of the LPI instrument by Kouzes
and Posner, which started in 1983, will be discussed in more detail in chapter 5. The
focus will be on the LPI’s psychometric properties, validity and reliability.
4.9.1 History of the LPI
According to Kouzes and Posner (2003a), after hundreds of interviews, thousands of
case analyses and hundreds of thousands of survey questionnaires, it was
discovered that leaders follow similar patterns in guiding and leading others. From
these similar patterns, the following five practices of exemplary leadership were
formed (Kouzes & Posner, 2003a:1-6):
• MODEL THE WAY – Credibility is the foundation of leadership. If people don’t
believe the messenger, they won’t believe the message. Leaders Model the Way
by clarifying their values and setting an example.
• INSPIRE A SHARED VISION – Leaders Inspire a Shared Vision by envisioning
the future and enlisting others in a common vision.
• CHALLENGE THE PROCESS – Leaders Challenge the process by searching for
opportunities and by experimenting, taking risks, and learning from experience.
• ENABLE OTHERS TO ACT – Leaders Enable others to Act by fostering
collaboration and strengthening others.
• ENCOURAGE THE HEART - Leaders Encourage the Heart by recognising
contributions and celebrating values and victories.
The LPI has its origins in a research project started by Kouzes and Posner in 1983.
The purpose of the research project was to determine what people do when they
were at their “personal best” in leading others. The assumption was that to discover
best practices in leadership, it was not necessary to interview “star” leaders of
excellent organisations. After some preliminary research, a leadership survey was
developed consisting of a few open-ended questions such as the following:
• Who initiated the project?
• How were you prepared for this experience?
Page 177
157
• What special techniques and strategies did you use to get other people involved
in the project?
• What did you learn about leadership from this experience?
By 1987, Kouzes and Posner had conducted more that 550 of these surveys. At the
same time, a shorter version of the survey was completed by 80 managers. An
additional 42 in-depth interviews were also conducted. In this initial study, middle
and senior level managers in private and public sector organisations were evaluated.
On the basis of this research, a research model was developed that consisted of the
five practices of exemplary leadership as described in the previous section. This led
to the development of a quantitative leadership measurement instrument, namely the
LPI. Over its more than 20-year history, it has been translated into 12 languages
(Kouzes & Posner [s.a.]).
4.9.2 The LPI instrument
The LPI gives people 360-degree feedback on their leadership behaviours. This
feedback is vital because leadership is a relationship be it on a one-to-one or one-to-
many basis. It is a relationship between those who choose to lead and those who
choose to follow. Leaders succeed in their roles on the strength of the quality of the
relationship they have with their followers. One of the main reasons why leaders fail
is poor relationships with constituents; and the number one reason why people leave
organisations is poor relationships with their immediate managers. Leaders who
engage in the five practices of exemplary leadership, as described in section 4.9.1,
tend to be more effective than those who are not (Kouzes & Posner, 2003a; Kouzes
& Posner, 2003b).
The LPI questionnaire consists of 30 statements that address behaviours when
people are at their personal best. The questionnaire has a “self” version and an
“observer” version. The former is completed by the leader, while the latter gives 360-
degree feedback from constituents, managers, colleagues and others in order to
provide a balanced picture of leadership behaviours. Five to ten people, usually
selected by the leader, complete the “LPI observer” form. Respondents can indicate
their relationship to the leader, namely the manager, co-worker or peer, direct report
Page 178
158
or other observer. With the exception of the leader’s manager, all the observers’
feedback is anonymous. Responses are captured on a ten-point scale with
behavioural anchors. For each statement, the respondent indicates how often the
leader engages with that particular behaviour. Responses range from 1 (almost
never) to 10 (almost always). Six questions are linked to each of the five practices of
exemplary leadership. A high value represents more frequent use of a particular
behaviour. Computerised scoring software provides feedback along a number of
dimensions, including comparisons by respondent category, rankings by frequency
and variances between “self” and “observer” scores (Kouzes & Posner, 2003a;
Kouzes & Posner, 2003b).
Kouzes and Posner (2003b) report that the LPI has proven to be both reliable and
valid on the basis of more than 25 years of research and more than 200 academic
studies and master’s dissertations using the LPI as a research instrument. The
authors (2003b:17) assert the following: “For an instrument to be used in an
academic environment, it must meet certain psychometric tests that internally
developed competency surveys do not always have to meet. Academic institutions
are very rigorous in the criteria they use to determine whether or not an instrument
passes these tests. The knowledge that the LPI is considered valid and reliable by
these standards should give confidence to all those who use the LPI in their work
that they can count on the LPI feedback.
4.9.3 Application of the LPI instrument
The LPI seems to be the most widely applied instrument in leadership assessment
research and has been referred to as “the most reliable leadership development
instrument available today” (Kouzes & Posner, 2003a:9). This statement is confirmed
by the fact that the LPI is identified as an appropriate leadership assessment
instrument in recent journal articles and doctoral theses (Abdullah, 2009; Leigh,
Shapiro & Penney, 2010; Artley, 2008; Garraway, 2008; Mancheno-Smoak, Endres,
Potak & Athanasaw, 2009; Matviuk, 2010a; Matviuk, 2010b; Quaglieri, Penney &
Waldner, 2007). The LPI has been applied as a research instrument in a wide variety
of sectors, including HE (Aaker, 2003; Broome, 2003; Hyatt, 2007; Langbein, 2010;
Page 179
159
Marcketti, Arendt & Shelley, 2011; Suwandee, 2009; Vasquez-Guignard, 2010;
Wardell, 2010).
Findings from more than 350 doctoral research projects applying the LPI presented a
number of interesting conclusions, as highlighted below (Kouzes & Posner,
2003a:10)
• LPI scores are positively related to job satisfaction and employee commitment
levels.
• Teachers from high-performing schools report consistently higher LPI scores for
their principals than teachers from less effective schools.
• LPI scores of hospital managers are significantly correlated with constituent
reports of workplace empowerment, job satisfaction and productivity.
• Effective bank managers have consistently higher LPI scores than less effective
managers.
Findings such as these have been recorded all over the world. Studies in the USA,
Canada, Mexico, Europe, Asia, Japan and Australia have revealed that job
satisfaction, productivity and organisational commitment are significantly correlated
with the Five Practices of Exemplary Leadership (Kouzes & Posner, 2003a).
4.10 CHAPTER CONCLUSION
The chapter provided an overview of leadership and its impact on quality, especially
service quality. The first three sections introduced the concept of leadership and
focused on the definition of leadership, the difference between leadership and
management, effective leadership, leadership skills, responsibilities theories and
styles. The remainder of the chapter dealt with leadership and quality and service
quality and leadership in HE. The chapter concluded with a discussion on leadership
measurement instruments with the main focus on the LPI instrument.
The study by Laohavichien et al. (2009) focused on the effects of transformational
and transactional leadership on quality improvement. It was found that
transformational leadership, and to a lesser extent, transactional leadership, impact
positively on organisational performance. The conclusion of the study indicates that
Page 180
160
a more quantitative approach to measuring customer quality ratings would be the
next step in studying the leadership-quality relationship. As stated in chapter 1,
section 1.4, of this study, the primary objective was to investigate the impact of
leadership practices on service quality in PHE in South Africa as a source of
competitive advantage, following a quantitative approach.
The next chapter deals with the research design of this study.
Page 181
161
5. CHAPTER 5: RESEARCH DESIGN
5.1 INTRODUCTION
The primary objective of this study was to investigate the impact of leadership
practices on service quality in PHE in South Africa as a source of competitive
advantage. Hence the impact of leadership as the independent variable on service
quality as the dependent variable was studied. According to Salkind (2009), the
dependent variable is the variable that is examined as the result of a research
project, while the independent variable is the variable that is manipulated in order to
examine its effect on the dependent variable. The two constructs that were
investigated were service quality and leadership. As such, two instruments were
used on two different populations. This chapter deals with the research design for
the study. According to Cooper and Schindler (2003) and Tustin et al. (2005), the
research design is the blueprint or plan used to achieve the research objectives. In
addition, Saunders et al. (2007) assert that the research design is the general plan
for the research. It contains clear objectives, states the reasons for the selection of a
particular organisation or department for the research, identifies the sources from
which data will be collected and explains the research constraints and ethical issues.
The first two sections of this chapter will describe the research strategy that was
formulated and the data collection method, using two different instruments. The
remainder of the chapter will focus on the data analysis, research quality and
delimitations of the study. The chapter concludes with a discussion of research
ethics.
The main sections of this chapter are depicted in figure 5.1 below.
Page 182
162
Figure 5.1: Layout of chapter 5
Page 183
163
5.2 RESEARCH STRATEGY ADOPTED
According to Saunders et al. (2007), the term “research philosophy” is the broad
term referring to the development of knowledge and the nature of that knowledge.
The research philosophy that the researcher follows contains vital assumptions
about his or her view of the world. These assumptions will reinforce the research
strategy and methods used in a study. This study was conducted within the positivist
paradigm. Saunders et al. (2007:606) define positivism as “the epistemological
position that advocates working with an observable social reality. The emphasis is on
highly structured methodology in order to facilitate replication, and the end product
can be law-like generalisations similar to those produced by the physical and natural
scientists”. The authors (2007) add that a positivist paradigm emphasises
quantifiable observations with possible statistical analysis, as in the current study.
A deductive process was followed in this study. According to Cooper and Schindler
(2003:36), “deduction is a form of inference that purports to be conclusive – the
conclusion must necessarily flow from the reasons given. These reasons are said to
imply the conclusion and represent the truth.” In order for deduction to be correct, it
must be true and valid. The reasons for the conclusion must therefore be true and
the conclusion must flow from the reasons. Added to this, Saunders et al. (2007)
assert that in the deductive approach, literature is used to identify ideas or theories
that will be tested by means of data. Hence a theoretical framework can be
developed and tested with data. Saunders et al. (2007) add that deduction has
several significant characteristics: (1) it is the search to explain fundamental
relationships between variables; (2) a highly structured methodology is followed; (3)
quantitative data are collected; (4) the researcher is independent of the study; and
(4) the concepts need to be operationalised so that the facts can be measured
quantitatively.
The data collection strategy in this study consisted of quantitative surveys to study
leadership practices and service quality. Salkind (2009) reports that the
characteristics of populations are studied through surveys. In addition, Leedy and
Ormrod (2010) contend that survey research involves obtaining information such as
attitudes or opinions from one or more groups of people by asking questions and
tabulating answers. The goal is to acquire information about the larger population by
Page 184
164
surveying a sample of that population. A survey is like a snapshot – a single-frame
photograph of an on-going activity. This is in line with Saunders et al.’s (2007) view
that a survey is usually associated with the deductive approach.
Two basic research methods have developed over the last 100 years, namely the
longitudinal and cross-sectional methods (Salkind, 2009). The former studies a
single group of people over a period of time, whereas the latter examines several
groups of people at one point in time (i.e. a “snapshot”) (Cooper & Schindler, 2003;
Leedy & Ormrod, 2010; Salkind, 2009; Saunders et al., 2007). Table 5.1 indicates
the advantages and disadvantages of the cross-sectional method.
Table 5.1: The cross-sectional method
Research strategy Advantages Disadvantages
Cross-sectional method • Inexpensive
• Short time span
• Low dropout rate
• Requires no long-term
administration or
cooperation between staff
and participants
• Limits comparability of
groups
• Gives no idea as to the
direction of change that a
group might take
• Examines people of the
same chronological age
who may be of different
maturational levels
• Reveals nothing about the
continuity of development
on an individual basis
(Source: Adapted from Salkind, 2009:249)
With due consideration of the advantages and disadvantages indicated in table 5.1
above as well as the primary objective of this study, a cross-sectional design was
followed in which the participants were surveyed at a specific point in time.
The focus of the following section will be on the data collection method employed in
this study.
Page 185
165
5.3 DATA COLLECTION METHOD
All the questionnaires were distributed to the five campuses of the “The College” and
completed and returned electronically using an online survey system. This survey
system had been used by the regulatory body of “The College” as part of its national
customer survey during the second semester of 2008 and had proven to be a highly
efficient platform for administering survey questionnaires.
The exceptionally high return rate (see section 5.3.2) can be attributed to both the
user friendliness of the online survey system and the fact that calls for participation in
such surveys made from “The College’s” regulatory body, is usually perceived
positively. This positive sentiment, combined with the use of the online survey
system and timing (August 2009–February 2010) of the data collection, ensured a
high return rate.
5.3.1 The questionnaires
Two separate, existing and structured questionnaires were used to gather the
service quality and leadership practices data for the study.
The following sections focus on the initial development, data collection and
psychometric properties of the SERVQUAL and LPI questionnaires.
5.3.1.1 The SERVQUAL questionnaire
In chapter 3, section 3.7.2, it was indicated the original SERVQUAL statements were
adapted to fit the profile of a PHE provider. Table 5.2 below provides a comparison
of the original and the adapted SERVQUAL statements. Appendix A indicates the
application of the adapted statements as part of the SERVQUAL questionnaire for
the student respondents at the five PHE sites of delivery.
Page 186
166
Table 5.2: Comparison of the original refined SERVQUAL statements and the adapted SERVQUAL
statements applied in this study
Statement The original refined SERVQUAL
statements
The PHE adapted SERVQUAL
statements
1. XYZ has modern looking equipment. The College has up-to-date equipment.
2. XYZ’s physical facilities are visually
appealing.
The College physical facilities (e.g.
buildings and furniture) are attractive,
visually appealing and stylish.
3. XYZ’s employees are neat appearing. Personnel at the College are well-
dressed and neat at all times.
4 Materials associated with the service
(such as pamphlets or statements) are
visually appealing at XYZ.
The materials of the College (e.g.
pamphlets and study material) suit the
image of the College.
5. When XYZ promises to do something by
a certain time, it does so.
When the College promises to do
something by a certain time, it does so.
6. When you have a problem, XYZ shows
a sincere interest in solving it.
When students have problems, the
personnel of the College are
sympathetic and reassuring.
7. XYZ performs the service right the first
time.
The College is always dependable and
renders the service right the first time.
8. XYZ provides its services at the time it
promises to do so.
The College provides services at the
time it promises to do so.
9. XYZ insists on error-free records. The College keeps accurate records
(e.g. accounts, academic reports, etc.)
10. Employees of XYZ tell you exactly when
services will be performed.
The College tells students when
services will be rendered.
11. Employees of XYZ give you prompt
service.
Students receive fast (prompt) service
delivery from the College’s personnel.
12. Employees of XYZ are always willing to
help you.
Lecturers at the College are willing to
assist students.
Page 187
167
13. Employees of XYZ are never too busy to
respond to your requests.
Personnel of the College are not too
busy to respond promptly to students’
requests.
14. The behaviour of employees of XYZ
instills confidence in customers.
Students can trust the personnel of the
College.
15. You feel safe in your transactions with
XYZ.
Personnel at the College inspire
confidence.
16. Employees of XYZ are constantly
courteous to you.
Personnel at the College are polite.
17. Employees of XYZ have the knowledge
to answer your questions.
Personnel receive adequate support
from the College management to
improve their service provision.
18. XYZ gives you individual attention. Students receive individualised attention
from administrative personnel (e.g.
doing something extra for students.)
19. XYZ has operating hours convenient to
all its customers.
Lecturers provide individual attention to
students.
20. XYZ has employees who give you
personal attention.
Personnel of the College do know what
the needs of the students are (e.g.
recognising students as customers).
21. XYZ has your best interest at heart. The College personnel have the
student’s best interests at heart.
22. Employees of XYZ understand your
specific needs.
The College personnel are easily
accessible to students (e.g. easily
available to see or to contact by phone,
email, etc.).
(Source: Adapted from Parasuraman, Zeithaml & Berry, 1991:446-449)
The following sections will focus on the SERVQUAL’s scale items, data collection,
reliability, factor structure and validity, as developed by Parasuraman et al. (1988).
Page 188
168
a The generation of the scale items for the SERVQUAL model
Parasuraman et al. (1988) identified ten service quality dimensions (see section
3.7.1 in chapter 3) in the development of the original SERVQUAL instrument. These
ten dimensions resulted in the generation of 97 items. These items were categorised
into two statements, one to measure the expectation and the other to measure the
perception of service quality for a specific organisation. The statements were
arranged in a seven-point Likert scale ranging from “strongly disagree” (1) to
“strongly agree” (7). Approximately half of the statements were worded positively and
the other half negatively. The “expectations” formed the first half of the instrument
and “perceptions” the second half.
b Data collection and scale purification
The creation of the 97-item instrument consisted of two stages of data collection.
The first stage involved (1) preserving only those items capable of discriminating
across the respondents who had differing quality perceptions about the organisations
in several categories; and (2) investigating the dimensionality of the scale and
establishing the reliabilities of its components. The second stage consisted of re-
evaluating the dimensionality and reliability of the scale through an analysis of the
fresh data from four independent samples (Parasuraman et al., 1988).
The first and second stages of data collection as well as SERVQUAL’s reliability,
factor structure and validity will be described in more detail in the following sections,
as reported by Parasuraman et al. (1988).
i Stage 1: data collection
Data were collected from a sample of 200 respondents for the initial refinement of
the 97-item instrument. The respondents (25 years or older) were recruited in a
shopping mall in a large metropolitan area. The sample was divided equally into
male and female respondents, and were spread across five different service
categories, namely appliance repair, retail banking, long-distance telephone,
securities brokerage and credit cards. Only respondents who had used the service in
question during the last three months qualified for the study. The respondents had to
Page 189
169
complete the 97-item self-administered questionnaire consisting of a 97-item
expectations part followed by a 97-item perceptions part.
ii Stage 1: scale purification
Parasuraman et al. (1988) refined the 97-item instrument by analysing the pooled
data (data from all five service categories together). The aim of this stage was to
develop an instrument for the reliable measuring of service quality in multiple service
sectors, that is, an instrument that could be applied to measure service quality in
general. Five of the original ten dimensions were retained, namely tangibles,
reliability, responsiveness, understanding/knowing customers and access. The other
five dimensions of communication, credibility, security, competence and courtesy
were combined into two dimensions. Thus the scale purification stage produced a
34-item scale with seven dimensions.
iii Data collection for stage 2
To further assess the 34-item scale and its psychometric properties, data were
collected from four of the original five service categories, namely appliance repair,
retail banking, long-distance telephone and credit cards (excluding security
brokerage). The sample again consisted of 200 respondents (25 years or older) who
had been recruited in a shopping mall in a large metropolitan area and were equally
divided between male and female respondents. As in the first stage of data
collection, only those respondents who used the service in question during the
preceding three months qualified for the study.
iv Scale purification for stage 2
The main objective of this stage was to evaluate the robustness of the 34-item scale
in the measurement of service quality of four the service organisations. The second
stage scale purification process produced a refined 22-item scale with five
dimensions, namely tangibles, reliability, responsiveness, assurance and empathy,
as discussed in section 3.5.2 in chapter 3.
Page 190
170
c SERVQUAL model’s reliability and factor structure
The 34-item scale with seven dimensions resulting from the first stage data set was
then refined to a 22-item scale with five dimensions in the second stage of scale
purification. This serves as an additional verification of the reliability and factor
structure of the SERVQUAL instrument. The results of the reassessment
authenticate the high dimensional distinctiveness and reliabilities of the instrument.
The procedure used to improve the instrument was guided by empirical criteria and
the objective of developing an instrument that could be used to measure service
quality in a variety of service organisations. The stable psychometric properties were
indicated by the reliabilities and factor structure of the final 22-item scale and its five
dimensions. Only the items that were relevant to all four of the service organisations
were included. This indicates that the SERVQUAL instrument can be applied in a
variety of service settings to measure and assess service quality. The instrument can
be adapted by reworking the items under each of the five dimensions to make it
more relevant to the service setting in which the instrument is applied.
d Assessment of the SERVQUAL model’s validity
The assessment of a scale’s content validity is essentially qualitative instead of
quantitative. Parasuraman et al. (1988:28) confirm that it involves the investigation of
the following two factors: “(1) the thoroughness with which the construct to be scaled
and its domain were explicated and (2) the extent to which the scale items represent
the construct’s domain.” Since the procedures applied in the development of the
SERVQUAL instrument adhered to both these requirements, the instrument could be
considered to possess construct validity. The instrument’s validity was also
measured by examining its convergent validity. The findings offered strong support
for SERVQUAL’s convergent validity. Lastly, the validity of SERVQUAL was
assessed by examining whether the measured construct was empirically associated
with measures of other conceptually related variables. All the findings confirmed the
SERVQUAL instrument’s validity.
The next section will elaborate on the LPI instrument.
Page 191
171
5.3.1.2 The LPI questionnaire
In section 1.5.2.4 in chapter 1, it was mentioned that the LPI would be utilised to
conduct this study. Appendices B, C and D provide the “LPI self” questionnaire, the
“LPI observer” questionnaire and the “LPI invitation letter” respectively, as used in
this study. As indicated in chapter 4, section 4.9.2, the responses were captured on
a ten-point scale with behavioural anchors. For each statement, the respondent
indicated how often the leader engaged with that particular behaviour. The
responses ranged from 1 to 10. The scale items on the “LPI self” and “LPI observer”
questionnaire were displayed as follows:
1 = almost never 2 = rarely 3 = seldom 4 = once in a while 5 = occasionally 6 = sometimes 7 = fairly often 8 = usually 9 = very frequently
10 = almost always
When analysing data from the MLQ, as discussed in chapter 5, it is stated that “the
Leader form would naturally contain a bias, the Rater form is considered to be the
more important of the two” (Transformational leadership, 2010). Similarly, Kouzes
and Posner (2003a) state that in order to minimise bias, responses from the “LPI
observer” are used for analyses instead of responses from the “LPI self”. Hence for
the purpose of this study, only the data from the “LPI observer” were used in the
analyses of the impact of leadership practices on service quality. The focus of the
sections below will be on the LPI’s psychometric properties, including its validity and
reliability as developed and reported by Kouzes and Posner (2003a).
Page 192
172
a Psychometric properties of the LPI
As indicated in section 4.9.3 in chapter 4, the LPI has been extensively applied in
various industries and has proven reliable to identify the behaviours of effective
leaders. It consists of 30 statements and takes about ten minutes to complete. The
LPI provides 360-degree feedback from one’s manager, peers or direct reports.
Based on data from over 200 000 respondents, the LPI continues to demonstrate
sound psychometric properties (Kouzes & Posner, 2003a).
The LPI is highly regarded in both the academic and practitioner sectors. Over
250 000 leaders and close to 1 000 000 observers have completed it. Analysis and
refinement of the instrument are ongoing. According to Kouzes and Posner (2003b),
research spanning more than 20 years confirms the validity and reliability of the LPI
and validates the five practices of exemplary leadership as a constant and reliable
description of what leaders do to achieve extraordinary things in organisations. As in
this study, these authors contend that many researchers have combined the five
practices of exemplary leadership of the LPI to measure transformational leadership.
This single measure was found to have acceptable psychometric properties and
correlated with positive organisational outcomes (Kouzes & Posner, [s.a.])
i Reliability
According to Kouzes and Posner (2003a: 11), internal reliability is when “the extent
to which items in a scale are associated with one another, is quite strong”. All five
leadership practices have strong internal reliability scores that are above 0.75 for the
“self” version and above 0.85 for the “observer” version. Test-retest reliability scores
are high in the 0.90 “plus” range (test-retest reliability will be explained in table 5.8 in
section 5.5). This means that if the LPI is applied and then reapplied a few months
later using the same or similar observers, the scores will be generally consistent.
The tests also indicated that there is no social desirability unfairness (Kouzes &
Posner, 2003a; Kouzes & Posner, 2003b).
ii Validity
Page 193
173
According to Kouzes and Posner (2003a:11), validity answers the following question:
“So what difference do scores on the LPI make?” This question is answered
empirically by considering how the LPI scores are correlated with other measures
such as job satisfaction, employee commitment, work group productivity, credibility,
sales performance and so forth. The five practices of the LPI are orthogonal,
meaning they do not measure the same behaviour but five different practices. The
LPI also has concurrent, face and predictive validity. Kouzes and Posner (2003a)
add that concurrent validity means that high LPI scores are correlated with positive
outcomes such as credibility or commitment to employees. Face validity means that
the results make sense, while predictive validity means that the results can be used
for predictions such as high or low performance. The results of the LPI, for instance,
can distinguish between high-performing and low-performing leaders. Leadership
behaviour as measured by the LPI is related to positive organisational outputs.
These relationships have been found across industries and disciplines, in public and
nonprofit organisations as well as in the private sector, regardless individual
differences such as, gender, ethnicity, age and so forth. These findings are relatively
consistent in countries around the world (Kouzes & Posner, 2003a; Kouzes &
Posner, 2003b).
5.3.2 The SERVQUAL survey
As stated in section 1.6.2 in chapter 1, “The College” is one of four business-related
HE brands (trading divisions) belonging to one regulatory body. The scope of the
study was focused on one of these brands, namely “The College” which has five
delivery sites in three provinces – Gauteng, Western Cape and KwaZulu-Natal. “The
College” has a total student population of 5 085 students (based on 2009 registration
figures). This afforded the researcher an opportunity to gain a representative view of
student experiences in the country and not merely in a specific region. Since “The
College’s” specific market is affected largely by government legislation such a study
is imperative to ensure the survival of the institution.
According to Salkind (2009:89), a population is “a group of potential participants to
whom you want to generalise the results of a study”. Thus the population of this
study comprised full-time students enrolled at the “The College’s” five delivery sites.
Page 194
174
The reason for the selection of “The College” over any of the other brands is based
on various factors, which include but are not limited to the following:
• “The College’s” student profile is aligned with other PHE institutions (second
language, previously disadvantaged students).
• “The College’s” national footprint is described in the previous section.
• “The College” has the largest number of students of all the service provider’s
brands in excess of 5 000 students in this category.
• The CEO of “The College” welcomed this study and felt that it would add value in
the long term.
For the purpose of the service quality survey, the units of investigation consisted of
the five delivery sites, while the units of analysis were the students at the five sites.
Different sampling designs are appropriate for different situations. Sampling falls into
two major categories: probability sampling and nonprobability sampling. In probability
sampling, it can be specified in advance that each segment of the population will be
represented in the sample. This is the main feature that sets probability sampling
apart from nonprobability sampling. Probability sampling techniques include simple
random, stratified random, proportional stratified, cluster and systematic sampling.
However, in nonprobability sampling, there is no guarantee that each member of the
population will be represented in the sample. According to Leedy and Ormrod
(2010), the three common forms of nonprobability sampling include convenience,
quota and purposive sampling. This study followed a probability sampling approach.
Proportional stratified sampling was used to select the target population (ideal
number of respondents) to participate in the service quality survey. According to
Tustin et al. (2003), the stratified sampling method implies that the population is
divided into subgroups (strata), each with a specific characteristic and a random
sample is then dawn from each subgroup. For the purpose of this study, the
population was segmented according to the campuses across South Africa. Each
stratum is in proportion to its size in the overall population, in this case, 5 085
students. A random sample was drawn from each stratum. Tables 5.3 and 5.4
indicate the advantages and disadvantages of the random sampling and stratified
random sampling methods respectively.
Page 195
175
Table 5.3: Random sampling
Type of sampling When to use it Advantage Disadvantages
Simple random sampling
When the population
members are similar to
one another on
important variables
Ensures high
degree of
representation
Time consuming
and tedious
(Source: Adapted from Salkind, 2009:97)
Table 5.4: Stratified random sampling
Type of sampling When to use it Advantage Disadvantages
Stratified sampling
When the population is
heterogeneous and
contains several
different groups, some
of which are related to
the topic of the study
Ensures a high
degree of
representation of all the
strata or layers in the
population
Time consuming
and tedious
(Source: Adapted from Salkind, 2009:97)
In line with table 5.3, Cooper and Schindler (2003) and Saunders et al. (2007)
explain that in a simple random sample, each element has an equal probability of
being selected in the sample.
The SERVQUAL instrument was used for the collection of service quality data.
According to Saunders et al. (2007), the research population consists of the group
members who are being researched. The research population (actual number of
respondents) of the service quality survey consisted of students from the five
campuses, as indicated in table 5.5 below (n = 984). Although the number of realised
respondents corresponds with the target population, the proportions of the various
campuses differ.
Page 196
176
Table 5.5: Student respondents per campus
Frequency % Cumulative %
Campus 1 104 10.6 10.6
Campus 2 276 28.0 38.6
Campus 3 336 34.1 72.8
Campus 4 148 15.0 87.8
Campus 5 120 12.2 100.0
Total 984 100.0
The respondents (students) evaluated service quality on a Likert scale from 1 to 7, in
in terms of their expectations and perceptions of the quality of service rendered at
their campus. According to Saunders et al. (2007), in a Likert scale, the respondent
is asked how strongly he or she agrees or disagrees with a statement. Likert scales
usually consist of four-, five-, six- or seven-point scales. In this study, a seven-point
scale was used. The SERVQUAL instrument consists of 22 items (22 items for the
perception section and 22 items for the expectation section) divided into five sections
(the five dimensions of service quality), namely tangibles, responsiveness, reliability,
assurance and empathy.
The research population of the SERVQUAL survey consisted of students from “The
College’s” five delivery sites in Gauteng, Western Cape and KwaZulu-Natal. The
campuses are situated in Pretoria, Benoni, Johannesburg, Cape Town and Durban.
In order to optimise feedback, the participants had sufficient exposure to provide
meaningful feedback on their expectations and perceptions of the quality of their
student experience at “The College”. First-year students (who had been enrolled at
“The College” for longer than six months) and second-year students participated.
The questionnaires were distributed electronically to the campuses via the online
survey system (as explained in chapter 1, section 1.6.1) for students to complete. An
agreement was reached with “The College’s” management regarding the completion
of questionnaires. Students were allowed to complete the questionnaires during a
Page 197
177
class session. The SERVQUAL questionnaire took about 15 minutes to complete.
The respondents were not limited to students in the business faculty only, but
included all students to prevent distorted results in terms of quality expectations and
perceptions (all students have expectations and perceptions of quality, not only the
students in the business faculty). Computer laboratory time was scheduled for all
qualifications offered at “The College”, both for first- and second-year students.
Lecturers in the computer laboratory facilitated a session that guided students
through the completion of the online SERVQUAL questionnaire. Once it had been
completed, it was stored on the server at the campus and sent back to the regulatory
body of “The College”. An electronic dataset of the completed questionnaires was
provided by the IT department of the “The College’s” regulatory body in Microsoft
Excel format. This dataset was used for interpretation and analysis. The study was
completed during the period of August 2009 to February 2010. At that time, the
researcher was employed by the “The College’s” regulatory body as “Head of
Programme: Business”. Hence access to the dataset and feedback on the progress
of the survey were not deemed to be a limitation in the study.
The second part of this study entailed a leadership survey which is explained in the
next section.
5.3.3 The LPI survey
In the same way as the campuses are concerned about the quality of their
relationships with their students, leaders should seek feedback (positive and
negative) on how they are doing with constituents. Leaders (principals) have multiple
constituents, including managers, co-workers and direct reports. Only by analysing
all these different perspectives can they learn to fully appreciate how they are viewed
from various perspectives. With data from multiple perspectives they can see where
there is consistency and inconsistency and agreement and disagreement about their
strengths and weaknesses. Using this information they can then determine what and
how to improve (Kouzes & Posner, 2003a). To this end, the LPI instrument was used
in the leadership survey based on a literature review as discussed in section 4.9 in
chapter 4.
Page 198
178
Two LPI questionnaires (the “LPI self” and “LPI observer”) were used to collect data
on the leadership practices of the campus principals.
The leaders, in this instance the campus principals, completed the “LPI self” (n = 5).
This instrument required the leaders to rate themselves on the frequency with which
they thought they engaged in each of the 30 behaviours (items) on a rating scale
from 1 to 10. The 30 questionnaire items were based on the five practices of
exemplary leadership as developed by Kouzes and Posner (2003a). These include
modelling the way, inspiring a shared vision, challenging the process, enabling
others to act and encouraging the heart. Seven staff members (who were selected
by the leader) as well as the leader’s manager completed the “LPI observer” (n = 40)
questionnaire, rating their leader on the frequency with which they thought the
principals engaged in each of the 30 behaviours (items), also on a rating scale from
1 to 10. The 30 questionnaire items of the “LPI observer” are also based on the five
practices of exemplary leadership. The respondents indicated their relationship with
the leader as manager, co-worker, direct report or other observer. All the observers’
feedback was anonymous except for that of the leaders’ manager. Both the “LPI self”
and “LPI observer” questionnaires were completed in approximately ten minutes.
As in the case of the SERVQUAL questionnaire, all the questionnaires were
distributed to the campuses electronically via the online survey system from “The
College’s” regulatory body head office – five “LPI self” questionnaires (one for each
principal) and 40 “LPI observer” questionnaires (seven constituents and one
manager per principal). The questionnaires were also completed electronically,
stored on the campus server and sent back to the regulatory body of “The College”
where they were interpreted and analysed. Confirmation of cooperation was given by
all five campuses for participation in the leadership survey. The study was conducted
concurrently with the SERVQUAL study and completed during the period of August
2009 to February 2010.
Appendices E to I contain the “LPI self” and “LPI observer” results of the five campus
principals. These results are discussed in more detail in chapter 6. Computerised
scoring software which is part of the LPI assessment tool, provided feedback along a
number of dimensions, including comparisons by the respondent category, rankings
by frequency and variances between “self” and “observer” scores. For each principal,
Page 199
179
a data summary of the five practices of exemplary leadership is provided in the
above-mentioned appendices.
5.3.4 Pretesting
Various steps were taken to ensure the validity of the results. These included
consultations with an expert in questionnaire design as well as teleconferences with
the VPs (Vice Principals) of the five campuses to explain the questionnaires as well
as the purpose and importance of the study. The expert in questionnaire design is
employed as a senior data analyst at the Bureau for Market Research (BMR) at the
University of South Africa. Because the aim of the pretest or pilot test of a survey
instrument is to identify possible weaknesses in its design, it should be tested on
elements of the target population and follow the same procedures that will be used in
the data collection (Cooper & Schindler, 2003). Both instruments (SERVQUAL and
LPI) were pretested on respondents who fitted the profile of “The College’s” students
as well as the principals and their constituents. The pretest was conducted during
July 2009. This was done to ensure that both instruments were understandable,
which would then increase the reliability of the data collected.
5.4 DATA ANALYSIS
The Statistical Package for the Social Sciences (SPSS) and the LPI scoring software
were used to perform and calculate all statistical procedures. Data were analysed by
means of Cronbach’s alpha as a measure of internal consistency, descriptive
statistics including means and standard deviations, gap analysis, the Pearson
product moment correlation coefficient (r) and the coefficient of determination (R2).
Demographic data provided additional information on and insight into participants in
the survey.
The reliability of both the expectation and perception dimensions of the SERVQUAL
instrument were calculated using Cronbach’s alpha. Section 5.5 will elaborate on the
validity and reliability of measuring instruments.
Page 200
180
According to Salkind (2009), descriptive statistics can be used to describe some of
the characteristics of the distribution of scores that have been collected such as the
average score on one variable or the degree to which one score differs from another.
Tustin et al. (2005:523) suggest that the purpose of descriptive statistics is to
• provide preliminary insights into the nature of the responses obtained, as
reflected in the distribution of the values for each variable of interest
• help to detect errors in the coding and the data capturing processes
• provide a means of presenting the data in a transparent manner with tables and
graphs
• provide summary measures of “typical” or “average” responses as well as the
extent of variation in responses for a given variable
• provide an early opportunity for evaluating whether the distributional assumptions
of subsequent statistical tests are likely to be satisfactory
Means and standard deviations were the descriptive statistics used in this study,
based on the quantitative responses obtained from the two measuring instruments.
The mean is the sum of a set of values divided by the number of the values and is
usually accompanied by the standard deviation, which is the most common measure
of variability. The standard deviation is the square root of the average amount that
each of the individual values varies from the mean set of values (Salkind, 2009).
Appendix S indicates the mean and standard deviation combined for all campuses
as well as per individual campus respectively.
The LPI survey also provided additional information such as the period as principal
for each of the five participants of the “LPI self” questionnaire. This information is
provided in table 5.6 below.
Page 201
181
Table 5.6: Demographics of campus principals
Campus 1 Campus 2
Campus 3
Campus 4
Campus 5
Duration of Service
Years/months 9 months 5 years 2 years 4 years 3 years
Gender
Female ♦ ♦ ♦ ♦
Male ♦
Race
African ♦ Asian Coloured Indian White ♦ ♦ ♦ ♦
As indicated in table 5.6, the principal of Campus 1 had the least amount of
experience as a principal on that particular campus, followed by the principal of
Campus 3, Campus 5 and Campus 4. The principal of Campus 2 had the longest
period of service, namely five years. The principal of Campus 1 was the only African
male, while the principals of Campuses 1 to 4 were white females.
A gap analysis was performed on all 22 items of the SERVQUAL instrument. This
was done for all five campuses individually in order to calculate the mean of the
service quality gap. The mean of the five practices of exemplary leadership of the
LPI instrument were also determined for each of the five principals. This was done
with the aid of the LPI scoring software. In addition, the Pearson product moment
correlation (usually represented by the letter r) was used to measure the relationship
between leadership practices and service quality for “The College’s” five campuses.
The coefficient of determination (R2) was also used to calculate the proportion of
variance. Saunders et al. (2007) explain that the Pearson product moment
correlation (r) is a statistical measure indicating the strength of the linear relationship
between two quantifiable data variables. A correlation coefficient helps to determine
the strength of the linear relationship between two ranked or quantifiable variables.
This coefficient (r) can take any value between -1 and +1. A value of +1 signifies a
perfect positive linear correlation which means that two variables are precisely
Page 202
182
related, and as the value of the one variable increases, so does the value of the
other. However, the value of -1 signifies a perfect negative correlation. This also
means that two variables are precisely related, but as the values of one variable
increases, so do the values of the other decrease. Table 5.7 classifies the strength of
positive or negative correlations:
Table 5.7: Strength of positive or negative correlations
Positive correlations
between:
Strength Negative correlations
between:
Strength
0.8 and 1.0 Very strong -0.8 and -1.0 Very strong
0.6 and 0.8 Strong -0.6 and -0.8 Strong
0.4 and 0.6 Moderate -0.4 and -0.6 Moderate
0.2 and 0.4 Weak -0.2 and -0.4 Weak
0.0 and 0.2 Very weak 0.0 and -0.2 Very weak
(Source: Adapted from Salkind, 2009:204)
In support of table 5.7, Leedy and Ormrod (2010) assert that the strength of the
relationship is indicated by the size of the correlation coefficient. If two variables are
closely related with a strong correlation, knowing the level of one variable allows one
to predict the other variable with considerable accuracy. However, Tustin et al.
(2005) point out that the researcher can go beyond the calculation of the correlation
coefficient and calculate the proportion of the variance explained by a specific model.
R2 is known as the coefficient of determination. In support of this, Saunders et al.
(2007) state that the coefficient of determination (R2) can take on any value between
0 and +1. This measures the proportion of the variation in a dependent variable, in
this study service quality, that can be explained statistically by the independent
variable (leadership). This could show the strength of a relationship in nonlinear
cases too.
5.5 RESEARCH QUALITY
It was indicated in section 5.3.1.1 and 5.3.1.2 that both the SERVQUAL and LPI
demonstrated the psychometric properties of reliability (consistency from one
measurement to the next) and validity (accurate measurement of the concepts)
consistent with the literature findings. According to Cooper and Schindler (2003), a
Page 203
183
measure is reliable if it supplies consistent results. Saunders et al. (2007) and Leedy
and Ormrod (2010) also assert that reliability is the degree to which the data
collection techniques will produce consistent results when the unit being measured
has not changed. Salkind (2009) provides synonyms such as “dependable”,
“consistent”, “stable”, “trustworthy”, “predictable” and “faithful” to help explain the
term “reliability”. Table 5.8 below provides reliability estimates as identified by
Cooper and Schindler (2003).
Table 5.8: Reliability estimates
Type Coefficient What is measured
Test-retest Stability Reliability of a test or instrument
inferred from examinee scores.
Same test is administered twice
to same subjects over an
interval of less than six months.
Cronbach’s alpha Internal consistency Degree to which instrument
items are homogeneous and
reflect the same underlying
construct(s).
(Source: Adapted from Cooper & Schindler, 2003:237)
To underscore the information provided by Cooper and Schindler (2003) in table 5.8,
Gliem and Gliem (2003) explain that Cronbach’s alpha, also referred to as the alpha
coefficient and coefficient alpha, is a measure of the internal consistency of a set of
items comprising a scale. Besides reporting the coefficient only, it is also essential in
providing a description of the measures (including means and standard deviations)
used to derive the reliabilities. Cronbach’s alpha reliability coefficient normally ranges
between 0 and 1. However, there is actually no lower limit to the coefficient. The
closer Cronbach’s alpha coefficient is to 1.0, the greater the internal consistency of
the items in the scale will be. The following rules of thumb can be applied:
Page 204
184
Table 5.9: Rules of thumb for Cronbach’s alpha coefficient
Cronbach’s alpha coefficient Internal consistency
> 0.9 Excellent
> 0.8 Good
> 0.7 Acceptable
> 0.6 Questionable
> 0.5 Poor
< 0.5 Unacceptable
(Source: Adapted from Gliem & Gliem, 2003:87)
It should also be noted that an alpha of 0.8, as indicated in table 5.9 as “good”
internal consistency, is a reasonable goal. In support of this, Salkind (2009)
maintains that a value of 1.00 indicates perfect reliability and a value of 0.00 no
reliability at all. Again, in line with table 5.7, Salkind (2009) and Leedy and Ormrod
(2010) assert that test-retest reliability examines consistency over time, that is, the
extent to which an instrument provides the same results over time. Internal
consistency (as measured by Cronbach’s alpha) is the extent to which all the items
in an instrument produce the same results.
However, according to Saunders et al. (2003:150), validity “is concerned with
whether the findings are really about what they appear to be about”. In addition,
Salkind (2009) contends that an instrument is valid if it actually measures what it is
supposed to measure. Synonyms for validity include “truthfulness”, “accuracy”,
“authenticity”, “genuineness” and “soundness”. Table 5.10 depicts three types of
validity that are used to establish the authenticity of an assessment tool.
Page 205
185
Table 5.10: Types of validity
Type of validity What is it How do you establish it
Content A measure of how well the
items represent the entire
universe of items
Ask an expert if the items
assess what you want them to
assess
Criterion
Concurrent
Predictive
A measure of how well a test
estimates a criterion
A measure of how well a test
predicts a criterion
Select a criterion and correlate
scores on the test with scores
on the criterion in the present
Select a criterion and correlate
scores on the test with scores
on the criterion in the future
Construct A measure of how well a test
assesses some underlying
construct
Assess the underlying construct
on which the test is based and
correlate these scores with the
test scores
(Source: Salkind, 2009:118)
In support of table 5.10, Leedy and Ormrod (2010) argue that the validity of a
measuring instrument is the degree to which it measures what it intended to
measure.
As mentioned in the first paragraph of this section, both SERVQUAL and the LPI
questionnaires have proven to be reliable and valid measuring instruments. The last
two sections of this chapter will focus on the delimitations and research ethics of this
study.
5.6 DELIMITATIONS
According to Leedy and Ormrod (2010), delimitations can be defined as what the
researcher is not going to do. In this study, data were only collected from one of the
four brands of the regulatory body, namely “The College”. The other three brands
Page 206
186
were thus excluded from the study. Further research will be required to determine
whether the findings of this study could be extended and made applicable to other
PHE providers in South Africa.
5.7 RESEARCH ETHICS
Research ethics, according to Saunders et al. (2003: 606), can be defined as “the
appropriateness of the researcher’s behaviour in relation to the rights of those who
become the subject of the research project, or who is affected by it”. Leedy and
Ormrod (2010) contend that most ethical issues in research fall into one of the
following four categories:
(1) Protection from harm – participants should not be exposed to unnecessary
physical or psychological harm.
(2) Informed consent – when people are recruited to take part in a research study,
they should be informed about the nature of the study and given a choice to
either participate or not participate.
(3) Right to privacy – the nature and quality of a participant’s performance should be
kept confidential.
(4) Honesty with professional colleagues – findings should be reported in an honest
manner without misrepresentation or misleading others about the nature of the
findings.
Every effort was made to adhere to the above four categories during the duration of
this study. The research proposal for this study was submitted to the director of “The
College’s” regulatory body to gain approval prior to the commencement of the study.
A verbal agreement was entered into with the director of “The College’s” regulatory
body relating to the fact that the data of both the SERVQUAL and LPI surveys would
be used for academic purposes only, and that it would not be utilised as part of a
commercial initiative. This agreement included a confidentiality clause stating that
“The College”, the regulatory body and the other brands of the regulatory body would
remain anonymous for the purpose of this study. In addition, the purpose of the study
was clearly articulated so that parties involved understood the nature of the study as
well as its possible impact on them. The participants had the right to ask questions
and request a copy of the findings. Except for the “LPI self” questionnaire, all the
Page 207
187
respondents for both the SERVQUAL and LPI surveys were anonymous and their
responses treated in strict confidence. Finally, care was taken not to misrepresent
the findings to meet the intended purpose of the study.
Permission was granted by the publishers of the LPI instrument, John Wiley & Sons,
Inc., to buy and use the LPI survey instrument for this study. This permission was
granted on the basis of an executive summary that was provided to them explaining
the scope and purpose of the study. The conditions for approval were communicated
via e-mail by the publisher’s contracts manager.
5.8 CHAPTER CONCLUSION
This study followed a quantitative approach. A study of service quality and
leadership practices was conducted by means of reliable and valid measuring
instruments, namely the SERVQUAL and LPI questionnaires. Surveys were sent to
the participants electronically and the responses stored on a central server for
analysis and interpretation.
Chapter 5 introduced the research design and methodology to investigate the impact
of leadership practices on service quality in PHE in South Africa. The first three
sections focused on the research strategy, the data collection methods and the data
analysis. The chapter then considered research quality, delimitations and research
ethics. The theme of this chapter was determining the impact of leadership practices
on service quality by calculating the correlation between the LPI composite mean
and SERVQUAL composite mean for each campus. This will be elaborated on in
chapters 6 and 7. Chapter 6 discusses the analysis of the data from the surveys and
the population described in this chapter.
Page 208
188
6. CHAPTER 6: FINDINGS
6.1 INTRODUCTION
Chapter 1 indicated that the primary objective of this study was to investigate the
impact of leadership practices on service quality in the HE environment in South
Africa, and more specifically, the PHE environment. Chapters 2, 3 and 4 involved the
literature review for the study and included discussions of the PHE environment,
service quality and leadership respectively. In chapter 5, the research design and
plan were explained and this included a discussion on how the research objectives
would be achieved. This chapter deals with the empirical findings of the research
plan as elucidated in chapter 5 in order to address the research objectives for the
study. The first two sections of this chapter focus on the reliability analysis of the
SERVQUAL and LPI instruments as well as descriptive statistics including the
student respondents’ programme and year of study. Service quality expectations
versus service quality perceptions also form part of this section. A detailed service
quality gap analysis per individual campus and for “The College” as a whole will then
be conducted.
The remainder of this chapter focuses on the calculation of the mean and standard
deviation as well as the correlation analysis between leadership practices and
service quality. The strength of the linear relationship between these two constructs
(leadership and service quality) is explained by means of Pearson’s product moment
correlation coefficient and the coefficient of determination. The chapter concludes
with a data summary of the LPI as well as a visual representation of the impact of
leadership practices on service quality.
The main sections of this chapter are depicted in figure 6.1 below.
Page 209
189
6.1: INTRODUCTION
6.3: DESCRIPTIVE STATISTICS
6.3.1 Programme enrolled for and year of study
6.3.2 Service quality expectations versus service quality perceptions
CHAPTER 6: FINDINGS
6.9: CONCLUSION
6.2: RELIABILITY ANALYSIS
6.4: SERVQUAL: GAP ANALYSIS
6.4.1 Gap analysis: Campus 1
6.4.2 Gap analysis: Campus 2
6.4.3 Gap analysis: Campus 3
6.4.4 Gap analysis: Campus 4
6.4.5 Gap analysis: Campus 5
6.4.6 Gap analysis: all campuses
6.5: SERVQUAL: MEAN AND STANDARD DEVIATION
6.6: CORRELATION ANALYSIS
6.7: LPI DATA SUMMARY
6.8: LEADERSHIP PRACTICES AND SERVICE QUALITY
Figure 6.1: Layout of chapter 6
Page 210
190
6.2 RELIABILITY ANALYSIS
As stated in section 5.5 in chapter 5, reliability is the degree to which the data
collection techniques will produce consistent results when the unit being measured
has not changed. Synonyms such as “dependable”, “consistent”, “stable”,
“trustworthy”, “predictable” and “faithful” are used to explain the term “reliability”
(Leedy & Ormrod, 2010; Salkind, 2009; Saunders et al., 2007). In addition, Gliem
and Gliem (2003) explain that Cronbach’s alpha is a measure of the internal
consistency of a set of items comprising a scale. The closer Cronbach’s alpha
coefficient is to 1.0, the greater the internal consistency of the items in the scale will
be. Tables 6.1 and 6.2 below represent the Cronbach’s alpha coefficient for both the
expectation and perception dimensions of the SERVQUAL instrument.
Table 6.1: Reliability statistics for expectation dimensions
Dimension Cronbach’s alpha N of Items
Tangibles .773 4
Reliability .856 5
Responsiveness .790 4
Assurance .888 4
Empathy .854 5
Overall .953 22
Table 6.2: Reliability statistics for perception dimensions
Dimension Cronbach’s alpha N of Items
Tangibles .837 4
Reliability .913 5
Responsiveness .863 4
Assurance .930 4
Empathy .897 5
Overall .971 22
Tables 6.1 and 6.2 indicate that all the scales for both the expectation and
perception dimensions demonstrate acceptable internal consistency.
Page 211
191
In line with Kouzes and Posner’s (2003a) finding, as indicated in chapter 5, section
5.3.1.2a, all five leadership practices have strong internal reliability scores that are
above 0.75 for the “self” version and above 0.85 for the “observer” version.
Considering the rules of thumb proposed by Gliem and Gliem (2003) in table 5.9 in
chapter 5, the reliability for both the SERVQUAL and LPI insttruments can be
described as varying between “good” and “excellent”.
6.3 DESCRIPTIVE STATISTICS
According to Salkind (2009), descriptive statistics can be used to describe some of
the characteristics of the distribution of scores that have been collected, such as the
average score on one variable or the extent to which one score differs from another.
The sections below describe the respondents’ “programme enrolled for and year of
study”. The service quality expectations versus service quality perceptions per
campus are also included.
6.3.1 Programme enrolled for and year of study
Figure 6.2 indicates the distribution of respondents among the various programmes
offered at the PHE provider as a single group.
Page 212
Figure 6.2: Programme enrolled for and year of study
As indicated in figure 6.2, the largest group of respondents were enrolled for the first
year of Business Management. The data in figure 6.2 are supported by the
information in Appendix J.
Business Management 1st Year
Internet Engineering 1st Year
Accounting and Financial Computing 2nd Year
Journalism 1st Year
Programming 2nd Year
Office and Computing Studies
Programming 1st Year
Graphic Design and Web Development 1st Year
Public Relations 1st Year
Internet Engineering 2nd Year
Construction and Engineering Drafting
Sport Management 1st Year
Secretarial Studies
Graphic Design and Web Development 2nd Year
Business Information Technology 1st Year
Business Management 2nd Year
Accounting and Financial Computing 1st Year
Business Information Technology 2nd Year
Marketing Management 2nd Year
Computer Technical Support
Journalism 2nd Year
Advertising Management 1st Year
Tourism and Tour Operations 1st Year
Sample as a Single Group
192
: Programme enrolled for and year of study – all campuses
As indicated in figure 6.2, the largest group of respondents were enrolled for the first
siness Management. The data in figure 6.2 are supported by the
0.0% 5.0% 10.0% 15.0% 20.0%
Business Management 1st Year
Internet Engineering 1st Year
Accounting and Financial Computing 2nd Year
Journalism 1st Year
Programming 2nd Year
Office and Computing Studies
Programming 1st Year
Graphic Design and Web Development 1st Year
Public Relations 1st Year
Internet Engineering 2nd Year
Construction and Engineering Drafting
Sport Management 1st Year
Secretarial Studies
Graphic Design and Web Development 2nd Year
Business Information Technology 1st Year
Business Management 2nd Year
Accounting and Financial Computing 1st Year
Business Information Technology 2nd Year
Marketing Management 2nd Year
Computer Technical Support
Journalism 2nd Year
Advertising Management 1st Year
Tourism and Tour Operations 1st Year
9.2%
6.6%
5.8%
5.6%
5.5%
5.4%
5.2%
5.0%
4.2%
3.2%
3.1%
2.9%
1.9%
1.0%
0.9%
0.8%
0.7%
0.6%
0.5%
0.4%
0.2%
0.2%
Sample as a Single Group
all campuses
As indicated in figure 6.2, the largest group of respondents were enrolled for the first
siness Management. The data in figure 6.2 are supported by the
25.0% 30.0%
30.9%
Page 213
6.3.2 Service quality expectations versus service quality perceptions
Figure 6.3 below shows that for all campuses, on average, the expectations were
consistently higher than the perceptions. This is supported by the
Appendices K and L. The information in these appendices shows the proportions of
respondents who selected different ratings (1 to 7) to indicate how high their
expectations and perceptio
dimensions of service quality.
Figure 6.3:
It is evident from figure 6.3 that for all the campuses
lower than the respondents expectations of service quality. Campus 1 shows the
smallest service quality gap of
0.22.
.00 1.00
Campus 1
Campus 2
Campus 3
Campus 4
Campus 5
Overall mean of SQ
193
6.3.2 Service quality expectations versus service quality perceptions
Figure 6.3 below shows that for all campuses, on average, the expectations were
higher than the perceptions. This is supported by the
Appendices K and L. The information in these appendices shows the proportions of
respondents who selected different ratings (1 to 7) to indicate how high their
expectations and perceptions were regarding the different aspects of the different
dimensions of service quality.
: Service quality expectations versus perceptions
It is evident from figure 6.3 that for all the campuses, the level of service quality was
lower than the respondents expectations of service quality. Campus 1 shows the
smallest service quality gap of -0.03, while Campus 5 represents the largest gap of
2.00 3.00 4.00 5.00
3.82
3.84
3.85
4.18
3.74
3.78
3.70
3.72
3.95
3.52
Overall mean of SQ - Perception Overall mean of SQ - Expectation
6.3.2 Service quality expectations versus service quality perceptions
Figure 6.3 below shows that for all campuses, on average, the expectations were
higher than the perceptions. This is supported by the information in
Appendices K and L. The information in these appendices shows the proportions of
respondents who selected different ratings (1 to 7) to indicate how high their
ns were regarding the different aspects of the different
, the level of service quality was
lower than the respondents expectations of service quality. Campus 1 shows the
0.03, while Campus 5 represents the largest gap of -
6.00 7.00
Expectation
Page 214
194
6.4 SERVQUAL: GAP ANALYSIS
The service quality gap is calculated by subtracting the service quality expectation
from the perceptions of respondents and then calculating the mean gap score for
each service quality dimension. As indicated in chapter 3, section 3.7.2, the
SERVQUAL instrument comprises five service quality dimensions, namely tangibles,
reliability, responsiveness, assurance and empathy. The survey respondents
(students) completed the questionnaire in one section measuring the expectations of
the 22 questions and then another section measuring the perceptions of the same 22
questions. For each question, the student rated, on a Likert scale from 1 (strongly
disagree) to 7 (strongly agree) whether or not they agreed with each statement. The
SERVQUAL score was then calculated as the difference between the perception and
expectation scores of actual service delivery (perception – expectation or P – E).
This is referred to as the service quality gap.
The sections below calculate the level of service quality for each of the five
dimensions for each campus individually, as well as for “The College” as a whole.
This was done by taking the average score across the questions for that dimension
and then calculating the overall score.
6.4.1 Gap analysis: Campus 1
Figures 6.4 to 6.9 below represent the SERVQUAL gap analysis for the five
dimensions of service quality for Campus 1. The gap analysis data of Campus 1 for
all five dimensions are provided in Appendix N.
Page 215
195
Figure 6.4: Gap analysis of tangibles across Campus 1
Figure 6.4 indicates that Campus 1 was positively perceived in terms of its
attractiveness and the visual appeal of the physical facilities and the fact that it has
up-to-date equipment (for which the perception exceeds the expectation). However,
this is not supported by the way the personnel dress (they are expected to dress
professionally, but the perception was that they do not) and the quality of their
materials (expected to suit the image of “The College”, whereas the perception was
that the quality did not suit its image).
Figure 6.5: Gap analysis of reliability across Campus 1
-0.7 -0.6 -0.5 -0.4 -0.3 -0.2 -0.1 0.0 0.1 0.2 0.3 0.4 0.5
4
3
2
1
Campus 1: Tangibles
-0.7 -0.6 -0.5 -0.4 -0.3 -0.2 -0.1 0.0 0.1 0.2 0.3 0.4 0.5
9
8
7
6
5
Campus 1: Reliability
Page 216
Figure 6.5 indicates that at Campus 1, “The College” can be trusted to do what its
promises correctly and on tim
recordkeeping, and the personnel are not as sympathetic and reassuring as they are
expected to be.
Figure 6.6: Gap analysis of responsiveness across Campus
Figure 6.6 indicates that the lecturers at Campus 1 are not perceived to be willing to
assist students as expected and that students are also not informed when services
will be rendered. Regarding the promptness of service delivery and responses to
student requests by The College’s personnel, the perception was higher than the
expectation.
Figure 6.7
-0.7 -0.6 -0.5 -0.4
Campus 1: Responsiveness
196
Figure 6.5 indicates that at Campus 1, “The College” can be trusted to do what its
promises correctly and on time, but that it does appear to have problems with
recordkeeping, and the personnel are not as sympathetic and reassuring as they are
Gap analysis of responsiveness across Campus 1
Figure 6.6 indicates that the lecturers at Campus 1 are not perceived to be willing to
assist students as expected and that students are also not informed when services
will be rendered. Regarding the promptness of service delivery and responses to
ent requests by The College’s personnel, the perception was higher than the
7: Gap analysis of assurance across Campus 1
-0.3 -0.2 -0.1 0.0 0.1 0.2
13
12
11
10
Campus 1: Responsiveness
Figure 6.5 indicates that at Campus 1, “The College” can be trusted to do what its
e, but that it does appear to have problems with
recordkeeping, and the personnel are not as sympathetic and reassuring as they are
1
Figure 6.6 indicates that the lecturers at Campus 1 are not perceived to be willing to
assist students as expected and that students are also not informed when services
will be rendered. Regarding the promptness of service delivery and responses to
ent requests by The College’s personnel, the perception was higher than the
0.3 0.4 0.5
Page 217
197
Figure 6.7 indicates that the expectation of politeness at Campus 1 was on a par
with the students’ perceptions. Personnel at Campus 1 appear to inspire confidence
in their students and they are perceived to be well supported by management to
enable them to improve their performance and the quality of their service delivery.
However, the personnel at Campus 1 were not perceived to be trustworthy.
Figure 6.8: Gap analysis of empathy across Campus 1
According to the data depicted in figure 6.8, it would seem that even though Campus
1 was perceived to recognise the needs of the students and indeed have their best
interests at heart, their personnel were perceived not to project this goodwill by
performing below the expected level of service to students owing to their perceived
unwillingness to show empathy with individual student needs, lack of individual
attention to students and the perceived inaccessibility of the personnel.
-0.7 -0.6 -0.5 -0.4 -0.3 -0.2 -0.1 0.0 0.1 0.2 0.3 0.4 0.5
22
21
20
19
18
Campus 1: Empathy
Page 218
198
Key
1. Equipment
2. Facilities
3. Dress code
4. Materials
5. Keeping promises
6. Sympathy
7. Dependability
8. Punctuality
9. Recordkeeping
10. Timing of services
11. Promptness
12. Assistance
13. Responses to requests
14. Trust
15. Confidence
16. Politeness
17. Management support
18. Individualised attention (administrative)
19. Individualised attention (academic)
20. Students’ needs
21. Students’ interests
22. Accessibility of personnel
Figure 6.9: Gap analysis of all dimensions across Campus 1
According to the data as depicted in figure 6.9 and underscored by the information
contained in Appendix N, it is evident that, on average, the perceptions of the
respondents on Campus 1 exceeded their expectations the furthest regarding
personnel being not too busy to respond to students’ requests promptly, followed by
their trust that The College would deliver what it promised on time. On average, the
respondents’ expectations exceeded their perceptions the most regarding lecturers’
willingness to assist students, followed by the dress code for personnel and the
quality of the materials used at Campus 1 of “The College”.
-0.7 -0.6 -0.5 -0.4 -0.3 -0.2 -0.1 0.0 0.1 0.2 0.3 0.4 0.5
22
21
20
19
18
17
16
15
14
13
12
11
10
9
8
7
6
5
4
3
2
1
Campus 1
Page 219
199
6.4.2 Gap analysis: Campus 2
Figures 6.10 to 6.15 below represent the SERVQUAL gap analysis for the five
dimensions of service quality for Campus 2. The gap analysis data for Campus 2 for
all five dimensions are provided in Appendix O.
Figure 6.10: Gap analysis of tangibles across Campus 2
According to the data depicted in figure 6.10, Campus 2 appears to be positively
perceived regarding the visual appeal of its physical facilities. However, there was a
negative perception of the campus regarding the dress code of personnel, whether
or not the materials suit the image of “The College” and the contemporaneousness
of the equipment.
-0.7 -0.6 -0.5 -0.4 -0.3 -0.2 -0.1 -1E-15 0.1 0.2 0.3 0.4 0.5
Campus 2: Tangibles
1
2
3
4
Page 220
200
Figure 6.11: Gap analysis of reliability across Campus 2
Figure 6.11 indicates that at Campus 2, students’ perceptions exceeded their
expectations with respect to all aspects of reliability except in relation to accurate
recordkeeping.
Figure 6.12: Gap analysis of responsiveness across Campus 2
According to figure 6.12, Campus 2 was not perceived to perform according to
expectations in relation to any of the aspects of responsiveness. In addition, Campus
-0.7 -0.6 -0.5 -0.4 -0.3 -0.2 -0.1 -1E-15 0.1 0.2 0.3 0.4 0.5
Campus 2: Reliability
-0.7 -0.6 -0.5 -0.4 -0.3 -0.2 -0.1 -1E-15 0.1 0.2 0.3 0.4 0.5
Campus 2: Responsiveness
5
6
7
8
9
10
11
12
13
Page 221
2 was perceived to perform the worst in the lecturers’ willingness to assist students
and inform them when services will be ren
Figure 6.13
According to the information in figure 6.13, it would seem that at Campus 2 the
students’ expectations of all aspects of assurance are high
with the campus faring the worst when it comes to trusting the personnel.
Figure 6.14
-0.7 -0.6 -0.5 -0.4
201
2 was perceived to perform the worst in the lecturers’ willingness to assist students
and inform them when services will be rendered.
13: Gap analysis of assurance across Campus 2
According to the information in figure 6.13, it would seem that at Campus 2 the
students’ expectations of all aspects of assurance are higher than their perceptions,
with the campus faring the worst when it comes to trusting the personnel.
14: Gap analysis of empathy across Campus 2
-0.3 -0.2 -0.1 -1E-15 0.1 0.2
Campus 2: Assurance
14
15
16
17
18
19
20
21
22
2 was perceived to perform the worst in the lecturers’ willingness to assist students
According to the information in figure 6.13, it would seem that at Campus 2 the
er than their perceptions,
with the campus faring the worst when it comes to trusting the personnel.
0.3 0.4 0.5
Page 222
Key
1. Equipment
2. Facilities
3. Dress code
4. Materials
5. Keeping promises
6. Sympathy
7. Dependability
8. Punctuality
9. Recordkeeping
10. Timing of services
11. Promptness
12. Assistance
13. Responses to requests
14. Trust
15. Confidence
16. Politeness
17. Management support
18. Individualised attention (administrative)
19. Individualised attention (academic)
20. Students’ needs
21. Students’ interests
22. Accessibility of personnel
Figure 6.14 indicates that even though the per
know what the needs of the students are and they do have students’ best interests at
heart, the lecturers and the administrative personnel are perceived not to give
individual attention to students. In fact, the personn
easily accessible to students.
Figure 6.15:
The data in figure 6.15, supported by the information contained in Appendix O,
indicate that, on average, respondent perceptions of Campus 2 exceed their
202
Figure 6.14 indicates that even though the personnel of Campus 2 were perceived to
know what the needs of the students are and they do have students’ best interests at
heart, the lecturers and the administrative personnel are perceived not to give
individual attention to students. In fact, the personnel at Campus 2 do not seem to be
easily accessible to students.
Gap analysis of all dimensions across Campus 2
The data in figure 6.15, supported by the information contained in Appendix O,
indicate that, on average, respondent perceptions of Campus 2 exceed their
sonnel of Campus 2 were perceived to
know what the needs of the students are and they do have students’ best interests at
heart, the lecturers and the administrative personnel are perceived not to give
el at Campus 2 do not seem to be
Gap analysis of all dimensions across Campus 2
The data in figure 6.15, supported by the information contained in Appendix O,
indicate that, on average, respondent perceptions of Campus 2 exceed their
Page 223
203
expectations most regarding their trust that the personnel will deliver what they
promise on time, followed by the visual appeal of physical facilities on the campus.
The respondents’ perceptions exceed their expectations to a lesser extent regarding
the personnel being aware of students’ needs, dependability to render services on
time and to do it right the first time, the personnel being sympathetic and reassuring
when students have problems and the personnel having the students’ best interests
at heart. The performance of Campus 2 is perceived to be the worst regarding the
lecturers’ willingness to assist students, followed by informing students when
services will be rendered. It would also seem that the perceived image of Campus 2
regarding its materials and the lecturers’ dress code is not what one would expect of
the institution. Personnel at the campus are also not as trustworthy as expected.
6.4.3 Gap analysis: Campus 3
Figures 6.16 to 6.21 below represent the SERVQUAL gap analysis for the five
dimensions of service quality for Campus 3. The gap analysis data for Campus 3 for
all five dimensions are provided in Appendix P.
Figure 6.16: Gap analysis of tangibles across Campus 3
Figure 6.16 indicates that the positive image projected by Campus 3 with its
attractiveness and the visual appeal of the physical facilities (for which the
perception exceeds the expectation) is not supported by the quality of the materials,
-0.7 -0.6 -0.5 -0.4 -0.3 -0.2 -0.1 0.0 0.1 0.2 0.3 0.4
4
3
2
1
Campus 3: Tangibles
Page 224
204
the contemporaneousness of the equipment and the way the personnel dress (they
are expected to dress professionally but the perception is that they do not).
Figure 6.17: Gap analysis of reliability across Campus 3
Figure 6.17 indicates that the respondents’ perception of Campus 3 exceeds their
expectations with respect to all aspects of reliability except for the Campus’s ability
to keep accurate records.
Figure 6.18: Gap analysis of responsiveness across Campus 3
-0.7 -0.6 -0.5 -0.4 -0.3 -0.2 -0.1 0.0 0.1 0.2 0.3 0.4
9
8
7
6
5
Campus 3: Reliability
-0.7 -0.6 -0.5 -0.4 -0.3 -0.2 -0.1 0.0 0.1 0.2 0.3 0.4
13
12
11
10
Campus 3: Responsiveness
Page 225
205
According to figure 6.18, it would seem that the lecturers at Campus 3 are not
perceived to be willing to assist students as expected, that students are not informed
when services will be rendered and that personnel are perceived to be too busy to
respond promptly to the students’ requests.
Figure 6.19: Gap analysis of assurance across Campus 3
The data in figure 6.19 indicate that at Campus 3, the students’ expectations of all
aspects of assurance are higher than their perceptions of those aspects, with
politeness and trusting the personnel at the bottom of the list.
Figure 6.20: Gap analysis of empathy across Campus 3
-0.7 -0.6 -0.5 -0.4 -0.3 -0.2 -0.1 0.0 0.1 0.2 0.3 0.4
17
16
15
14
Campus 3: Assurance
-0.7 -0.6 -0.5 -0.4 -0.3 -0.2 -0.1 0.0 0.1 0.2 0.3 0.4
22
21
20
19
18
Campus 3: Empathy
Page 226
206
Key
1. Equipment
2. Facilities
3. Dress code
4. Materials
5. Keeping promises
6. Sympathy
7. Dependability
8. Punctuality
9. Recordkeeping
10. Timing of services
11. Promptness
12. Assistance
13. Responses to requests
14. Trust
15. Confidence
16. Politeness
17. Management support
18. Individualised attention (administrative)
19. Individualised attention (academic)
20. Students’ needs
21. Students’ interests
22. Accessibility of personnel
Figure 6.20 indicates that Campus 3 is perceived to recognise the needs of the
students and indeed have their best interests at heart. However, the personnel are
perceived not to project this goodwill by performing below the expected level of
service to students owing to the perceived inaccessibility of the personnel, lack of
individual attention to students and perceived unwillingness to show empathy
towards individual student’s needs.
Figure 6.21: Gap analysis of all dimensions across Campus 3
-0.7 -0.6 -0.5 -0.4 -0.3 -0.2 -0.1 0.0 0.1 0.2 0.3 0.4
22
21
20
19
18
17
16
15
14
13
12
11
10
9
8
7
6
5
4
3
2
1
Campus 3
Page 227
207
The data in figure 6.21, supported by the information contained in Appendix P,
indicate, on average, that the respondents’ perceptions of Campus 3 exceed their
expectations by the furthest regarding their trust that “The College” will deliver what it
promises timeously, and slightly exceed their expectations regarding recognition of
student’s needs, the visual appeal of the physical facilities and the promptness of
service delivery from the campus’s personnel. On average, the respondents’
expectations exceed their perceptions by the furthest regarding the lecturers’
willingness to assist students, followed by the students being told when services will
be rendered and the dress code for personnel.
6.4.4 Gap analysis: Campus 4
Figures 6.22 to 6.27 below represent the SERVQUAL gap analysis for the five
dimensions of service quality for Campus 4. The gap analysis data for Campus 4 for
all five dimensions are provided in Appendix Q.
Figure 6.22: Gap analysis of tangibles across Campus 4
Figure 6.22 indicates that Campus 4 is perceived to perform the worst when it comes
to the quality of its materials, followed by the lack of a professional dress code for the
personnel on campus.
-0.7 -0.6 -0.5 -0.4 -0.3 -0.2 -0.1 0.0 0.1 0.2 0.3 0.4
4
3
2
1
Campus 4: Tangibles
Page 228
208
Figure 6.23: Gap analysis of reliability across Campus 4
According to the data in figure 6.23 the respondents’ expectations of Campus 4
appear to exceed their perceptions in all aspects of reliability. The campus is
perceived to perform the worst regarding the extent to which the personnel act
sympathetically and reassuringly towards students when they have problems,
followed by rendering the promised services timeously.
Figure 6.24: Gap analysis of responsiveness across Campus 4
-0.7 -0.6 -0.5 -0.4 -0.3 -0.2 -0.1 0.0 0.1 0.2 0.3 0.4
9
8
7
6
5
Campus 4: Reliability
-0.7 -0.6 -0.5 -0.4 -0.3 -0.2 -0.1 0.0 0.1 0.2 0.3 0.4
13
12
11
10
Campus 4: Responsiveness
Page 229
209
Figure 6.24 indicates that Campus 4 is perceived to perform the worst when it comes
to informing students when services will be rendered, followed by the promptness
with which services are provided.
Figure 6.25: Gap analysis of assurance across Campus 4
From figure 6.25 it seems that Campus 4 does not perform well regarding all aspects
of assurance, with the perceived politeness of personnel being the worst.
Figure 6.26: Gap analysis of empathy across Campus 4
According the data in figure 6.26, Campus 4 is perceived to perform the worst when
it comes in recognition of students’ needs, followed by the perceived inaccessibility
of personnel to students.
-0.7 -0.6 -0.5 -0.4 -0.3 -0.2 -0.1 0.0 0.1 0.2 0.3 0.4
17
16
15
14
Campus 4: Assurance
-0.7 -0.6 -0.5 -0.4 -0.3 -0.2 -0.1 0.0 0.1 0.2 0.3 0.4
22
21
20
19
18
Campus 4: Empathy
Page 230
210
Key
1. Equipment
2. Facilities
3. Dress code
4. Materials
5. Keeping promises
6. Sympathy
7. Dependability
8. Punctuality
9. Recordkeeping
10. Timing of services
11. Promptness
12. Assistance
13. Responses to requests
14. Trust
15. Confidence
16. Politeness
17. Management support
18. Individualised attention (administrative)
19. Individualised attention (academic)
20. Students’ needs
21. Students’ interests
22. Accessibility of personnel
Figure 6.27: Gap analysis of all dimensions across Campus 4
According to data in figure 6.27, supported by the information contained in Appendix
Q, it is evident that, on average, the respondents’ expectations of Campus 4 exceed
their perceptions of all the aspects of all the dimensions of service quality. The
campus is perceived to perform the worst when it comes to informing students when
services will be rendered, followed by personnel being perceived as not being
sympathetic and reassuring when students have problems, the quality of materials
that are perceived not to suit the image of “The College”, the perceived impoliteness
-0.7 -0.6 -0.5 -0.4 -0.3 -0.2 -0.1 0.0 0.1 0.2 0.3 0.4
22
21
20
19
18
17
16
15
14
13
12
11
10
9
8
7
6
5
4
3
2
1
Campus 4
Page 231
211
of the personnel and the perception that the promptness of service delivery is
lacking.
6.4.5 Gap analysis: Campus 5
Figures 6.28 to 6.33 below represent the SERVQUAL gap analysis for the five
dimensions of service quality for Campus 5. The gap analysis data for Campus 5 for
all five dimensions are provided in Appendix R.
Figure 6.28: Gap analysis of tangibles across Campus 5
According to figure 6.28, the only positive perception of the tangibles at Campus 5
seems to be that the materials that suit the image of “The College”. Campus 5
performs worst in respect of the perceived dress code for personnel at the campus.
-0.7 -0.6 -0.5 -0.4 -0.3 -0.2 -0.1 0.0 0.1 0.2 0.3 0.4
4
3
2
1
Campus 5: Tangibles
Page 232
212
Figure 6.29: Gap analysis of reliability across Campus 5
Figure 6.29 indicates that the respondents’ expectations of Campus 5 exceed their
perceptions when it comes to all aspects of reliability, except with keeping promises
on time. The campus is perceived to perform the worst in accurate recordkeeping.
Figure 6.30: Gap analysis of responsiveness across Campus 5
Figure 6.30 indicates that Campus 5 is not perceived to perform according to
expectations regarding any of the aspects of responsiveness. The campus is
perceived to perform the worst when it comes to the willingness of lecturers to assist
students, followed by informing students when services will be rendered.
-0.7 -0.6 -0.5 -0.4 -0.3 -0.2 -0.1 0.0 0.1 0.2 0.3 0.4
9
8
7
6
5
Campus 5: Reliability
-1.0 -0.9 -0.8 -0.7 -0.6 -0.5 -0.4 -0.3 -0.2 -0.1 0.0 0.1 0.2 0.3 0.4
13
12
11
10
Campus 5: Responsiveness
Page 233
213
Figure 6.31: Gap analysis of assurance across Campus 5
Figure 6.31 indicates that at Campus 5 the respondents’ expectations of all aspects
of assurance are higher than their perceptions of those aspects, with support for
personnel by management and trusting personnel at the bottom of the list.
Figure 6.32: Gap analysis of empathy across Campus 5
The data in figure 6.32 indicate that even though Campus 5 is perceived to
recognise the needs of its students and indeed have their best interests at heart, the
personnel are perceived not to project this goodwill by performing below the
expected level of service to students owing to the perceived inaccessibility of the
-0.7 -0.6 -0.5 -0.4 -0.3 -0.2 -0.1 0.0 0.1 0.2 0.3 0.4
17
16
15
14
Campus 5: Assurance
-0.7 -0.6 -0.5 -0.4 -0.3 -0.2 -0.1 0.0 0.1 0.2 0.3 0.4
22
21
20
19
18
Campus 5: Empathy
Page 234
214
Key
1. Equipment
2. Facilities
3. Dress code
4. Materials
5. Keeping promises
6. Sympathy
7. Dependability
8. Punctuality
9. Recordkeeping
10. Timing of services
11. Promptness
12. Assistance
13. Responses to requests
14. Trust
15. Confidence
16. Politeness
17. Management support
18. Individualised attention (administrative)
19. Individualised attention (academic)
20. Students’ needs
21. Students’ interests
22. Accessibility of personnel
personnel, lack of individual attention to students and perceived unwillingness to
show empathy with the needs of individual students.
Figure 6.33: Gap analysis of all dimensions across Campus 5
According to the data in figure 6.33, supported by the information in Appendix R, it is
evident that, on average, respondents’ expectations of Campus 5 exceed their
perceptions when it comes to most of the aspects of the dimensions of service
quality. The campus is perceived to perform the worst in respect of the lecturers’
willingness to assist students, followed by informing students when services will be
rendered, the accessibility of personnel to students, lecturers providing individual
-1.0 -0.9 -0.8 -0.7 -0.6 -0.5 -0.4 -0.3 -0.2 -0.1 0.0 0.1 0.2 0.3 0.4
22
21
20
19
18
17
16
15
14
13
12
11
10
9
8
7
6
5
4
3
2
1
Campus 5
Page 235
215
attention to students, the dress code for personnel at the campus and the
adequateness of the support of management for personnel. The campus is
perceived to recognise the needs of students and have their best interests at heart.
The quality of the material is perceived to suit the image of “The College” and it is
perceived to render the promised services timeously.
6.4.6 Gap analysis: all campuses
Figures 6.34 to 6.39 below represent the SERVQUAL gap analysis for the five
dimensions of service quality for all five campuses. The gap analysis data of the
campuses for all five dimensions are provided in Appendix M.
Figure 6.34: Gap analysis of tangibles across all campuses
The data in figure 6.34 indicate the positive image projected by “The College” with
the attractiveness and visual appeal of the physical facilities (for which the
perception exceeds the expectation) is not supported by the way the personnel dress
(they are expected to dress professionally, but they are perceived not to), the quality
of the materials (expected to suit the image of “The College”, but it is perceived not
to) and the contemporaneousness of the equipment (expected to be up to date, but
perceived not to be).
-0.7 -0.6 -0.5 -0.4 -0.3 -0.2 -0.1 0.0 0.1 0.2 0.3 0.4
4
3
2
1
Tangibles
Page 236
216
Figure 6.35: Gap analysis of reliability across all campuses
Figure 6.35 indicates that “The College” can be trusted to do what it has promised
correctly and timeously, but it does have problems with recordkeeping and the
personnel are not as sympathetic and reassuring as they are expected to be.
Figure 6.36: Gap analysis of responsiveness across all campuses
The data in figure 6.36 indicate that the lecturers at “The College” are not perceived
to be willing to assist students as expected and that students are also not informed
when services will be provided. Regarding the promptness of service delivery and
responses to students’ requests by “The College’s” personnel, the students’
perception is only slightly lower than their expectation.
-0.7 -0.6 -0.5 -0.4 -0.3 -0.2 -0.1 0.0 0.1 0.2 0.3 0.4
9
8
7
6
5
Reliability
-0.7 -0.6 -0.5 -0.4 -0.3 -0.2 -0.1 0.0 0.1 0.2 0.3 0.4
13
12
11
10
Responsiveness
Page 237
217
Figure 6.37: Gap analysis of assurance across all campuses
Figure 6.37 indicates that the personnel of “The College” cannot be fully trusted, are
not that polite and do not inspire as much confidence as expected. This could be
explained by the perception that they do not receive as much support from
management to improve their performance and service delivery quality as one would
expect.
Figure 6.38: Gap analysis of empathy across all campuses
The data in figure 6.38 indicate that even though “The College” is perceived to
recognise the needs of its students and indeed have their best interests at heart, the
personnel are perceived not to project this goodwill by performing below the
expected level of service for students, owing to the perceived inaccessibility of
-0.7 -0.6 -0.5 -0.4 -0.3 -0.2 -0.1 0.0 0.1 0.2 0.3 0.4
17
16
15
14
Assurance
-0.7 -0.6 -0.5 -0.4 -0.3 -0.2 -0.1 0.0 0.1 0.2 0.3 0.4
22
21
20
19
18
Empathy
Page 238
218
Key
1. Equipment
2. Facilities
3. Dress code
4. Materials
5. Keeping promises
6. Sympathy
7. Dependability
8. Punctuality
9. Recordkeeping
10. Timing of services
11. Promptness
12. Assistance
13. Responses to requests
14. Trust
15. Confidence
16. Politeness
17. Management support
18. Individualised attention (administrative)
19. Individualised attention (academic)
20. Students’ needs
21. Students’ interests
22. Accessibility of
personnel
personnel, lack of individual attention to students and unwillingness to show empathy
towards the needs of individual student.
Figure 6.39: Gap analysis of all dimensions across all campuses
Figure 6.39 depicts the differences between expectations and perceptions for all
dimensions and for all the campuses of “The College” as a single group. It would
appear that, on average and in general, “The College” fares the best in reliability to
-0.7 -0.6 -0.5 -0.4 -0.3 -0.2 -0.1 0 0.1 0.2 0.3 0.4
5
20
2
8
21
7
13
11
18
1
6
15
17
19
16
22
14
9
4
3
10
12
Page 239
219
deliver what it promises timeously and worst in the personnel’s responsiveness in
respect of their willingness to assist and inform students when services will be
rendered. “The College” also seems to fare poorly when it comes to the projected
image of “The College” with respect to its materials and the dress code of the
personnel.
The SERVQUAL gap analysis summary is provided in table 6.3 below.
Table 6.3: SERVQUAL gap analysis summary
Campus 1 Campus 2 Campus 3 Campus 4 Campus 5
Gap P E Gap P E Gap P E Gap P E Gap P E
Service quality dimensions
Tangibles -0.15 3.61 3.76 -0.15 3.62 3.77 -0.19 3.87 4.06 -0.22 3.91 4.13 -0.15 3.66 3.81
Reliability 0.02 3.59 3.57 0.05 3.54 3.49 0.05 3.54 3.49 -0.23 3.90 4.14 -0.18 3.46 3.64
Responsiveness
-0.05 3.85 3.90 -0.33 3.87 4.19 -0.29 3.78 4.07 -0.27 3.99 4.27 -0.43 3.57 4.00
Assurance 0.00 3.92 3.92 -0.19 3.69 3.88 -0.13 3.73 3.86 -0.25 3 . 9 1 4.16 -0.19 3.44 3.63
Empathy 0.02 3.97 3.95 -0.04 3.84 3.88 -0.08 3.72 3.80 -0.11 4.08 4.19 -0.19 3.43 3.62
SQI -0.03 -0.12 -0.11 -0.21 -0.23
As indicated in table 6.3, Campus 1 is perceived to render the best overall quality of
service with a service quality gap of only -0.03. By contrast, Campus 5 seems to
provide the worst service quality experience to its students with a service quality gap
of -0.23. In terms of overall individual service quality dimensions, “tangibles” and
“responsiveness” appear to represent the largest quality gaps.
6.5 SERVQUAL: MEAN AND STANDARD DEVIATION
This section will focus on the mean and standard deviation of the SERVQUAL
survey. Appendix S indicates the mean and standard deviation combined for all
campuses as well as per individual campus.
Page 240
220
The mean is the sum of a set of values divided by the number of the values and is
usually accompanied by the standard deviation, which is the most common measure
of variability. The standard deviation is the square root of the average amount that
each of the individual values varies from the mean set of values (Salkind, 2009).
The mean is a measure of location in descriptive statistics. The standard deviation is
a measure of how well (accurately) the mean describes the data and to what extent
the actual data vary from the mean value. Small standard deviations (relative to the
mean itself) indicate that the data values tend to be close to the mean. A large
standard deviation (relative to the mean itself) indicates that the data values lie far
from the mean, that is, the mean is not an accurate representation of the data. A
standard deviation of zero would mean that all the scores are the same.
According to Field (2005) and Utts and Heckard (2007), the empirical rule states
that for any bell-shaped (normal) data distribution, approximately
• 68% of the values fall within one standard deviation from the mean in either
direction
• 95% of the values fall within two standard deviations from the mean in either
direction
• 99.7% of the values fall within three standard deviations from the mean in either
direction
Table 6.4 below represents the mean and standard deviation per dimension overall
as well as per individual campus. The data are supported by the data in Appendix S
which indicate that all the values for the items measured for both expectations and
perceptions have roughly the same variation, with all the standard deviations being
around 2.
Page 241
221
Table 6.4: Mean and standard deviation per dimension – all campuses
Overall Perceptions Expectations
Valid N Mean SD Valid N Mean SD Tangibles 930 3.7520 1.6137 983 3.9225 1.4851 Reliability 894 3.5900 1.7041 982 3.6199 1.6003 Responsiveness 889 3.8104 1.6500 980 4.1024 1.5161 Assurance 889 3.7243 1.7234 976 3.8838 1.6220 Empathy 895 3.7959 1.6866 979 3.8681 1.5578
Campus 1 Perceptions Expectations
Valid N Mean SD Valid N Mean SD Tangibles 96 3.5929 1.5860 104 3.7556 1.5026 Reliability 91 3.5850 1.7148 104 3.5702 1.6457 Responsiveness 91 3.8480 1.6786 104 3.8926 1.6208 Assurance 91 3.9212 1.7433 104 3.9255 1.5843 Empathy 92 3.9696 1.7600 104 3.9399 1.6350
Campus 2 Perceptions Expectations
Valid N Mean SD Valid N Mean SD Tangibles 260 3.6147 1.6485 276 3.7645 1.5121 Reliability 250 3.5190 1.7583 276 3.5053 1.5788 Responsiveness 249 3.8454 1.7152 276 4.1754 1.5384 Assurance 249 3.6831 1.7850 274 3.8796 1.6657 Empathy 252 3.8345 1.7510 276 3.8696 1.5945
Campus 3 Perceptions Expectations
Valid N Mean SD Valid N Mean SD Tangibles 324 3.8598 1.6350 335 4.0512 1.4793 Reliability 317 3.5426 1.6988 334 3.4864 1.5933 Responsiveness 316 3.7859 1.5968 332 4.0665 1.4292 Assurance 316 3.7173 1.7148 332 3.8461 1.6191 Empathy 317 3.7113 1.6447 331 3.7970 1.4902
Campus 4 Perceptions Expectations
Valid N Mean SD Valid N Mean SD Tangibles 142 3.9396 1.5185 148 4.1256 1.4791 Reliability 135 3.9269 1.6947 148 4.1536 1.6402 Responsiveness 134 3.9621 1.7145 148 4.2725 1.5728 Assurance 134 3.8787 1.6985 146 4.1553 1.6373 Empathy 134 4.0663 1.7259 148 4.1765 1.6326
Campus 5 Perceptions Expectations
Valid N Mean SD Valid N Mean SD Tangibles 108 3.6535 1.5906 120 3.8208 1.3884 Reliability 101 3.4690 1.5599 120 3.6399 1.4640 Responsiveness 99 3.5606 1.5337 120 4.0056 1.5264 Assurance 99 3.4604 1.5965 120 3.6313 1.5160 Empathy 100 3.4447 1.4675 120 3.6183 1.4506
For the total group and for each campus individually, the calculated dimension
scores have more or less the same variance, with standard deviations around 1.7.
Page 242
222
6.6 CORRELATION ANALYSIS
As indicated in chapter 5, section 5.4, the Pearson product moment correlation
(represented by the letter r) was used to measure the relationship between
leadership practices and service quality for “The College’s” five campuses. The
coefficient of determination (R2) was also used to calculate the proportion of
variance. A correlation coefficient helps to determine the strength of the linear
relationship between two ranked or quantifiable variables. This coefficient (r) can
take any value between -1 and +1. Table 5.7 in chapter 5 indicates the strength of
the positive or negative correlations.
The correlation between leadership and service quality is calculated by using the
SERVQUAL scores (mean SQI score) and LPI scores (mean observer scores). For
the purpose of this study, only the LPI observer scores were used. As stated in
chapter 1, section 1.6.1, leaders have multiple constituents, including managers, co-
workers and direct reports. By receiving feedback from all perspectives leadership
can be measured in terms of the five practices of exemplary leadership.
Table 6.5 below represents the calculation of the Pearson product moment
correlation coefficient.
Table 6.5: Correlation coefficient between the LPI (leadership practices)
and SERVQUAL (service quality)
Overall mean
of LPI -
observed
Overall
SERVQUAL
gap
Overall mean of LPI -
observed
Pearson correlation 1
Sig. (1-tailed)
N 5
Overall SERVQUAL gap Pearson correlation .915* 1
Sig. (1-tailed) .029
N 5 5
*. Correlation is significant at the 0.05 level (1-tailed).
Page 243
223
The Pearson product moment correlation coefficient: r = 0.915
The coefficient of determination: R2 = (0.915)2 = 0.847 (85%).
The correlation coefficient (r) indicates a strong positive linear relationship between
leadership practices and service quality. The coefficient of determination (R2) is
calculated as 85%. This indicates that leadership practices explain 85% of the
variation in service quality. The level of service quality based on leadership practices
can be viewed with a high degree of confidence, since only 15% of the variation in
service quality is unexplained by leadership practices.
6.7 LPI DATA SUMMARY
Table 6.6 below provides the LPI data summary of the leadership survey conducted
on the five delivery sites of “The College”. The data are supported by the information
in Appendices E to I, which indicate the “LPI observer” scores of each principal as
part of the so-called “five practices data summary”. The “LPI observer” scores are
utilised to calculate the correlation between leadership practices and service quality.
It was indicated in chapter 5, section 5.3.1.2, that in order to minimise bias, the
responses from the “LPI observer” were used for analyses instead of responses from
the “LPI self”.
Page 244
224
Table 6.6: LPI data summary
Campus 1 Campus 2 Campus 3 Campus 4 Campus 5 Five practices
mean scores
The five practices of exemplary leadership
Model the way
47.10 47.20 43.20 39.40 36.60 42.7
Inspire a shared vision
51.50 46.60 39.50 41.40 36.00 43
Challenge the process
47.20 45.80 44.50 38.90 33.20 41.92
Enable others to act
46.00 46.60 48.90 35.20 31.50 41.64
Encourage the heart
47.40 50.00 45.50 37.50 29.90 42.06
LPI score 47.84 47.24 44.32 38.48 33.44
Table 6.6 indicates the LPI mean scores for each campus as well as the mean
scores for the five practices.
In terms of the LPI mean scores, Campus 1 had the highest score of 47.84,
indicating that the leader (principal) of Campus 1 engaged in the five practices of
exemplary leadership fairly often. By comparison, the lack of leadership on Campus
5 was prominent, with an LPI score of 33.44.
There is little variation in terms of the mean scores for the five practices. The
leadership practice of “Enable others to act” had the lowest score, with a mean score
of 41.64. This indicates that the leaders of the five campuses engaged the least in
this practice. By contrast, the practice of “Inspire a shared vision” had the highest
score of 43, indicating that on average, leaders engaged in this practice more
frequently.
The LPI and SERVQUAL data summaries are depicted graphically in the next
section.
Page 245
6.8 LEADERSHIP PRACTICES AND
The results of this study are depicted in figure 6.40 below. The SERVQUAL scores
are plotted against the LPI scores. For all the campuses, the LPI score correlates
with the SERVQUAL score. In other words, where the campus principal receiv
high LPI score, the campus also received a high SERVQUAL score. However, the
converse was also true. Where the campus principal received a low LPI rating, the
campus also received a low SERVQUAL score.
Figure 6
Figure 6.40 indicates that Campus 1 had the highest LPI and SQI scores. This is
supported by the correlation coefficient calculated in section 6.6, which indicated a
strong positive linear relationsh
225
6.8 LEADERSHIP PRACTICES AND SERVICE QUALITY
The results of this study are depicted in figure 6.40 below. The SERVQUAL scores
are plotted against the LPI scores. For all the campuses, the LPI score correlates
with the SERVQUAL score. In other words, where the campus principal receiv
high LPI score, the campus also received a high SERVQUAL score. However, the
converse was also true. Where the campus principal received a low LPI rating, the
campus also received a low SERVQUAL score.
6.40: Leadership practices and service quality
Figure 6.40 indicates that Campus 1 had the highest LPI and SQI scores. This is
supported by the correlation coefficient calculated in section 6.6, which indicated a
strong positive linear relationship between leadership practices and service quality.
The results of this study are depicted in figure 6.40 below. The SERVQUAL scores
are plotted against the LPI scores. For all the campuses, the LPI score correlates
with the SERVQUAL score. In other words, where the campus principal received a
high LPI score, the campus also received a high SERVQUAL score. However, the
converse was also true. Where the campus principal received a low LPI rating, the
Figure 6.40 indicates that Campus 1 had the highest LPI and SQI scores. This is
supported by the correlation coefficient calculated in section 6.6, which indicated a
ip between leadership practices and service quality.
Page 246
226
6.9 CHAPTER CONCLUSION
This chapter discussed the findings of the quantitative study conducted on the five
campuses of “The College”. The first two sections focused on the reliability analysis
of the SERVQUAL and LPI instruments and descriptive statistics, including the
student respondents’ programme and year of study. Service quality expectations
versus perceptions also formed part of this section. Section 6.4 provided the
SERVQUAL gap analysis for each campus individually and for the “The College” as
a whole.
The remainder of the chapter dealt with descriptive statistics such as the mean and
standard deviation in an effort to obtain a picture of leadership practices and service
quality overall (mean) and to provide a sense of variation (standard deviation)
around the mean responses. Pearson’s product moment correlation coefficient and
the coefficient of determination were utilised to determine the strength of the linear
relationship between the constructs of leadership and service quality. The chapter
concluded with a visual representation of the impact of leadership practices on
service quality.
It is evident from the empirical findings in this chapter that there are conclusive
differences in the levels of leadership and service quality provided on each of the five
campuses. In order to improve service quality, campus principals should start by
addressing the practice of “enabling others to act” by fostering collaboration and
strengthening others. In addition, the service quality dimension of “responsiveness”
represented the largest overall service quality gap and this needs to be addressed
first in an effort to close the gap between students’ perceptions and expectations of
service quality.
Chapter 7 draws conclusions for this study and makes recommendations for possible
future research.
Page 247
227
7. CHAPTER 7: CONCLUSIONS AND RECOMMENDATIONS
7.1 INTRODUCTION
While an almost infinite amount of literature on leadership and service quality is
available, no academic work was found that focused on the relationship between
leadership and service quality in HE, and more specifically, the PHE sector. This
study, comprising seven chapters, investigated the impact of leadership practices on
service quality in PHE in South Africa. As such, the study examined the impact of
leadership (the independent variable) on service quality (the dependent variable).
Chapter 1 provided a brief overview of the background to the study, the problem
statement and research statement, followed by the primary and secondary research
objectives, research method and definitions of the terms used in the study.
Chapters 2, 3 and 4 formed part of the literature review for this study. Chapter 2
explored the PHE environment in South Africa. PHE practices in other countries
were considered and compared with the practices in South Africa. The chapter also
investigated the governance, challenges and profiles of PHE providers.
Chapter 3 focused on service quality. Definitions and previous research in terms
service quality were investigated. The chapter provided an in-depth overview of the
adapted SERVQUAL instrument that was used to conduct the study and selected
alternative service quality measuring instruments. The importance of service quality
and its five dimensions was discussed.
The focus of chapter 4 was to provide a review of the existing literature on
leadership. The chapter reviewed numerous leadership definitions and theories. It
then went on to give an in-depth overview of the LPI instrument that was used to
conduct the study and selected alternative leadership assessment instruments. The
significance of leadership and its impact on service quality were also discussed. In
addition, the five practices of exemplary leadership were investigated.
In chapter 5 the research design and methodology employed in this study were
explained. The discussion revolved around the research strategy that was adopted,
Page 248
228
the data collection method, data analyses, research quality and delimitations and
research ethics.
Chapter 6 presented the data and findings of the surveys conducted at the five
delivery sites of “The College”. The data included descriptive statistics such as an
analysis of service quality expectations and perceptions, the service quality gap
analysis and the means and standard deviations. The chapter concluded with a
correlation analysis of leadership practices and service quality.
This chapter summarises the findings, reliability and validity of the research,
limitations and delimitations as well as conclusions and recommendations for
possible further research. The summary of the findings includes a discussion of the
purpose of the study, a description of the methodology used in the research, how the
primary and secondary objectives were achieved and an explanation of the results of
the data analyses. The third section confirms the reliability and validity of the
research. The fourth and fifth sections focus on the delimitations and limitations of
the study. The last section draws conclusions and makes recommendations for
possible future research.
The main sections of this chapter are depicted in figure 7.1 below.
Page 249
229
Figure 7.1: Layout of chapter 7
Page 250
230
7.2 FINDINGS
The purpose of this study was to examine the impact of leadership practices on
service quality as a source of competitive advantage. Hence the impact of
leadership, (the independent variable) on service quality (the dependent variable)
was investigated.
This study was conducted within the positivist paradigm and a deductive process
was applied. The data collection strategy consisted of cross-sectional quantitative
surveys to study leadership practices and service quality. The service quality
research data were gathered by means of the SERVQUAL instrument, while the
leadership data were obtained through the LPI assessment instrument. As indicated
in chapter 3, section 3.7.4, and chapter 4, section 4.9.3, respectively, a significant
number of recent studies have utilised the SERVQUAL and LPI instruments.
The research population (the actual number of respondents) of the service quality
survey consisted of 984 students from the five campuses in South Africa, located in
three provinces - Gauteng, Western Cape and KwaZulu-Natal (n = 984). The survey
also included demographics of the respondents (students). The demographic data
were not discussed because they did not form part of the research objectives of this
study.
Two LPI questionnaires (the “LPI self” and “LPI observer”) were used to collect data
on the leadership practices of campus principals. The LPI survey included the
principal of each of the five campuses (n = 5) who completed the “LPI self”. In
addition, seven staff members (who were selected by the principal) as well as the
principal’s manager completed the “LPI observer” (n = 40) questionnaire.
The Statistical Package for the Social Sciences (SPSS) and the LPI scoring software
were used to perform and calculate all statistical procedures. Data were analysed by
means of Cronbach’s alpha as a measure of internal consistency, descriptive
statistics including means and standard deviations, gap analysis, the Pearson
product moment correlation coefficient (r) and the coefficient of determination (R2).
Demographic data provided additional information on and insight into the participants
in the survey.
Page 251
231
In chapter 6, the quantitative results of the surveys were presented, described and
analysed. The next two sections provide a synthesis of the literature review of the
study and the findings in chapter 6 in relation to the research objectives of the study.
7.2.1 Primary objective
The primary objective of this study was to investigate the impact of leadership
practices on service quality in PHE in South Africa as a source of competitive
advantage. A comprehensive literature study on service quality (chapter 3) and
leadership (chapter 4) was conducted and perspectives on these two constructs and
the impact of leadership on service quality were obtained and analysed. The
empirical findings in chapter 6, section 6.6, indicated the existence of an extremely
strong positive linear correlation between leadership practices and service quality.
Based on these results, it was confirmed that there is indeed a strong positive linear
relationship between leadership practices and service quality. Figure 6.40 in chapter
6 depicted these findings visually.
The secondary objectives stated in chapter 1, section 1.4.2, contributed to the
achievement of the primary objective. The next section will focus on how the
secondary objectives were achieved.
7.2.2 Secondary objectives
In order to achieve the primary objective, the following secondary objectives were
pursued:
(1) To identify the service quality criteria used to evaluate the quality of
service
In order to achieve this objective, service quality and service quality criteria were
analysed as part of the literature review. In chapter 3, section 3.5.1, service quality
was defined as meeting and exceeding students’ expectations and perceptions by
constantly rendering a reliable service that conforms to predetermined requirements.
Furthermore, the five dimensions of service quality that were examined in chapter 3,
Page 252
232
section 3.5.2, namely tangibles, reliability, responsiveness, assurance and empathy
were identified as criteria to evaluate the quality of service at a PHE provider. These
five dimensions also comprised the core of the SERVQUAL instrument that was
applied in the study.
(2) To identify a leadership assessment instrument that measures
leadership practices
The second objective was addressed in chapter 4, sections 4.8 and 4.9. Eight
different leadership assessment instruments were evaluated. The LPI instrument
was identified as the most appropriate means of assessing leadership in a PHE
provider. This was based on various considerations, including the fact that it has
been widely applied in current research projects, including research in HE.
(3) To analyse students’ perceptions and expectations of service quality
The third objective focused on the analysis of the perceptions and expectations of
service quality. Similar to section 4.8 in chapter 4, sections 3.6 and 3.7 in chapter 3
provided an overview of eight service quality measurement instruments. The
SERVQUAL instrument was identified as the most appropriate means of assessing
service quality. The instrument assesses the service quality perceptions and
expectations of respondents. The service quality gap was calculated by subtracting
the service quality expectations from the perceptions of respondents and then
calculating the mean gap score for each service quality dimension. This assessment
was conducted as part of the empirical research in chapter 6, sections 6.3.2 and 6.4.
(4) To evaluate how leaders view themselves in terms of exemplary
leadership
As indicated under secondary objective 2 above, the LPI instrument was identified as
the most appropriate means of assessing leadership in this study. In chapter 4,
section 4.9.2, it was explained that the instrument consists of two questionnaires, the
“LPI self”, which was completed by the principals on each of the five campuses, and
the “LPI observer”, which was completed by the leader’s constituents. Appendices E
Page 253
233
to I indicated the “LPI self” scores of each principal as part of the “five practices data
summary”.
(5) To evaluate how the organisation views its leader in terms of exemplary
leadership
Similar to secondary objective 4, objective 5 evaluated how the organisation
(constituents) viewed their leader in terms of exemplary leadership. Appendices E to
I indicated the “LPI observer” scores of each principal as part of the “five practices
data summary”. The “observer” scores were utilised to calculate the correlation
between leadership practices and service quality, as indicated in chapter 6, sections
6.6 and 6.7. The “observer” scores thus formed part of the data analysis of this
study.
(6) To recommend interventions to improve leadership and service quality
in a PHE provider in South Africa
The aim of the last objective was to recommend interventions to improve leadership
and service quality in a PHE provider in South Africa. Based on the results obtained
in chapter 6, the following guidelines are suggested:
Chapter 6, section 6.4.6, indicated that the service quality dimensions of “tangibles”
and “responsiveness” represented the largest quality gap. Hence the first step for
“The College” would be to improve its overall service quality by addressing these
dimensions first. In terms of leadership improvement, table 6.6 in chapter 6 provided
a summary of the LPI scores obtained from the five campuses of “The College”. To
improve leadership, the campus principals should focus on addressing the practice
of “Enable others to act” first by fostering collaboration and strengthening others.
Sections 7.2.1 and 7.2.2 indicated that the primary and secondary objectives of the
study, as stated in chapter 1, section 1.4, were addressed. The next section will
focus on the reliability and validity of this study.
Page 254
234
7.3 RELIABILITY AND VALIDITY OF THE RESEARCH
It was indicated in chapter 5, sections 5.3.1.1 and 5.3.1.2, that both the SERVQUAL
and LPI demonstrated the psychometric properties of reliability (consistency from
one measurement to the next), and validity (accurate measurement of the concepts)
consistent with the literature findings. As stated in chapter 5, section 5.5, according
to Gliem and Gliem (2003), Cronbach’s alpha is a measure of the internal
consistency of a set of items comprising a scale. The closer Cronbach’s alpha
coefficient is to 1.0, the greater the internal consistency of the items in the scale will
be.
Tables 6.1 and 6.2 in chapter 6, section 6.2, confirmed the internal consistency of
both the expectation and perception dimensions of the SERVQUAL instrument.
Cronbach’s alpha coefficient for the expectation dimensions varied between 0.77
and 0.95, while the perception dimensions were in the 0.84 to 0.97 range. As
mentioned by Kouzes and Posner (2003a:11), in chapter 5, section 5.3.1.2.1, all five
leadership practices have strong internal reliability scores that are above 0.75 for the
“self” version and above 0.85 for the “observer” version. Test-retest reliability scores
are high in the 0.90 “plus” range. On the strength of the rules of thumb proposed by
Gliem and Gliem (2003) in table 5.9, chapter 5, the reliability of both the SERVQUAL
and LPI can be described as varying between “good” and “excellent”.
Both the SERVQUAL and the LPI questionnaires have thus proven to be reliable and
valid measuring instruments.
7.4 DELIMITATIONS
According to Leedy and Ormrod (2010), as explained in chapter 5, section 5.6, in this
study, delimitations are what the researcher is not going to do. In this study, data
were only collected from one of the four brands of the regulatory body, namely “The
College”. Hence the other three brands of the regulatory body and additional PHE
providers in South Africa were excluded from the study. The outcomes of this study
cannot therefore be generalised to all PHE providers in South Africa.
Page 255
235
7.5 LIMITATIONS
It is necessary to highlight the limitations of this study since several notable
limitations affected this study’s findings and the researcher’s ability to ultimately
generalise them to the greater PHE population in South Africa.
Firstly, there is no one ideal model or instrument that can be used to measure
service quality and leadership practices in the PHE environment in South Africa.
Although the SERVQUAL and LPI instruments seemed to be the most widely applied
in service quality and leadership research (as explained in chapter 3, section 3.7.4,
and chapter 4, section 4.9.3, respectively), many additional instruments exist to
measure these constructs. Further investigation using a different measurement
instrument to assess service quality and leadership in the PHE environment could
yield different or similar results, especially if the surveys were to be conducted during
a major crisis or administration change.
Secondly, the research implemented the “LPI self” and “LPI observer” form for the
leaders to rate themselves and the participants to rate their leaders. However, only
the “LPI observer” form was actually used in the data analysis.
Thirdly, the data were obtained in a relatively short period of time and represented a
“snapshot” as opposed to a trend. Hence only the “depth” and not the width of the
data were examined.
Fourthly, as indicated in section 7.4 above, the study focused on “The College” only
and not on other brands of the regulatory body or other PHE institutions. The
findings therefore cannot be generalised to other PHE institutions in South Africa.
In conclusion, the principals may have felt uncomfortable being scrutinised by their
constituents and the constituents selected to participate in the “LPI observer” survey
with whom they had a good relationship. First-year students also participated in the
SERVQUAL survey, and it is possible that at that early stage of their studies, they
may not have had a clear perception of service quality at the campus. Also, the
SERVQUAL questionnaire was completed as part of a class exercise, and the
Page 256
236
students could have completed it as quickly as possible and not given their true
opinion of service quality.
7.6 RESEARCH CONCLUSIONS AND RECOMMENDATIONS
A review of the literature indicated that a limited amount of research has been
conducted on the impact of leadership practices on service quality. To the best of the
researcher’s knowledge, this is the first study to be designed to determine the impact
of leadership practices on service quality in the PHE environment, moreover, in the
South African PHE environment. Hence the findings of this research study could
serve as the basis for future studies on leadership and service quality.
The empirical findings collectively suggested that there is a strong linear relationship
between leadership practices and service quality. Table 7.1 below indicates the
strength of this linear relationship.
Table 7.1: Correlation between leadership practices and service quality
Overall mean
of LPI -
observed
Overall
SERVQUAL
gap
Overall mean of LPI -
observed
Pearson correlation 1
Sig. (1-tailed)
N 5
Overall SERVQUAL gap Pearson correlation .915* 1
Sig. (1-tailed) .029
N 5 5
*. Correlation is significant at the 0.05 level (1-tailed).
According to the data in table 7.1, the Pearson product moment correlation
coefficient has a strong positive linear relationship between leadership practices and
service quality of r = 0.915. In addition, the coefficient of determination was
calculated. According to Wegner (2010:424), the coefficient of determination is
Page 257
237
defined as “the proportion (or percentage) of variation in the dependent variable, y,
that is explained by the independent variable, x”. Given the correlation coefficient of r
= 0.915, the coefficient of determination was calculated as R2 = (0.915)2 = 0.847
(85%).
Leadership practices (x) therefore explain 85% of the variation in service quality. The
level of service quality based on leadership practices can be viewed with a high
degree of confidence, since only 15% of the variation in service quality is
unexplained by leadership practices. This is excellent news for PHE providers
interested in improving their service quality as a source of competitive advantage.
Correlations between the dimensions of the SERVQUAL instrument were calculated
and appeared to be strong. These were not included in the study because they were
not relevant to the research objectives.
Table 6.6 in chapter 6 provided a summary of the LPI scores obtained from the five
campuses of “The College”. In addition to the LPI mean scores for each campus, the
mean scores of the five practices were also calculated. Although there were few
variances in the scores, the lowest score was obtained in the leadership practice of
“Enable others to act” while “Inspire a shared vision” obtained the highest score. It
would therefore seem that to improve service quality, campus principals should start
by addressing the practice of “Enable others to act” by fostering collaboration and
strengthening others.
As mentioned previously, this study focused on a PHE provider in South Africa with
five delivery sites across the country. In HE, future research could examine and
compare service quality and leadership practices in other PHE providers as well as
public institutions of HE. Future research could also be conducted in sectors other
than education where nonprofit and for-profit organisations are competitors. Such
research would promote a better understanding the impact of leadership on service
quality.
In addition to the use of quantitative instruments such as SERVQUAL and LPI, future
research could include the use of case study research, personal interviews and
Page 258
238
focus groups. The use of such qualitative methods could help future investigators to
identify new service quality and leadership research themes on which to focus. An
ethnographic study, in which a researcher observes the service quality and
leadership practices of the participants, and talks to students and the subordinates
under the leader’s authority, could produce interesting findings and affirm or
disaffirm the findings of this study.
Furthermore, based on the criticism of the SERVQUAL instrument as described in
chapter 3, section 3.7.4, further research could also be conducted to develop an
improved model to measure service quality in the PHE environment in South Africa.
As indicated in chapter 5, section 5.2, this study adopted a cross-sectional design.
This provides a solid foundation for further research to conduct a similar study
following a longitudinal method where a single group of people is observed over a
period of time.
These recommendations were made with reference to the literature review and the
findings of the empirical study.
This chapter concluded the study by summarising the findings and discussing the
reliability and validity of the research, the limitations and delimitations. Conclusions
were drawn and recommendations made for possible future research in this area.
Figure 7.2 below is a diagrammatical depiction of the research conducted from
chapters 1 to 7.
Page 259
239
Research objective:
The primary objective of this study was to investigate the impact of leadership practices on service quality as a source
of competitive advantage. Thus, the impact of leadership as independent variable on service quality as dependent
variable was investigated.
Definition of service quality for this study
based on a literature review:
Meeting and exceeding students’
expectations and perceptions by constantly
rendering a reliable service that conforms to
predetermined requirements
Research design:
Cross-sectional quantitative surveys
Intr
od
ucti
on
to
th
e s
tud
y
Lite
ratu
re
revie
w
Lite
ratu
re
revie
w
Data
co
llectio
n
an
d a
naly
sis
SERVQUAL survey:
The research population for the SERVQUAL
survey consisted of students from the five
campuses of “The College” and were selected
by means of the proportional stratified
sampling method
From the literature
review, the
SERVQUAL and LPI
instruments were
identified as the most
appropriate to
measure service
quality and leadership
respectivly
Definition of leadership for this study
based on a literature review:
The mobilisation and influencing of people to
work towards a common goal through the
building of interpersonal relationships and
the breaking of tradition to reach the
organisation’s objectives despite risk and
uncertainty
PHE:
The PHE environment in SA and other
countries was introduced to serve as the
background for the study
Backg
rou
nd
to th
e s
tud
y
The literature review on service
quality included the following:
Quality
Quality management
Services
Service quality
Service quality models
SERVQUAL
The literature review on leadership
included the following:
Leadership
Leadership theories
Leadership styles
Leadership and quality
Leadership and service quality
Leadership in HE
Leadership measurement
instruments
LPI
LPI survey:
The research population for the LPI survey
consisted of the principals of each of the five
campuses of “The College” as well as the
principal’s manager and seven constituents
Data collection:
The data were collected by means of
cross-sectional quantitative surveys
Data analysis:
Data were analysed by means of Cronbach’s alpha as a
measure of internal consistency, descriptive statistics
including means and standard deviations, gap analysis,
Pearson product moment correlation coefficient (r) as well
as the coefficient of determination (R2).
Findings:
From the data analysis it was concluded that there is a
strong linear relationship between leadership practices
and service quality
Figure 7.2: A diagrammatical depiction of this study
Page 260
240
In conclusion, it would be worthwhile to repeat this study to include all PHE service
providers in order to obtain a bigger picture of the impact of leadership on service
quality. Alternatively, a study could be undertaken to compare the PHE and public
HE domains in terms of the above constructs. This, however, was outside the scope
of this study.
Page 261
241
8. REFERENCES
Aaker, D.A., Kumar, V. & Day, G.S. 2007. Marketing research. 9th edition. New York:
Wiley.
Aaker, S. 2003. Leadership styles of executive female administrators in Tennessee
Community Colleges. Doctoral thesis, Tennessee State University, Nashville.
Abdullah, F. 2005. Measuring service quality in higher education: HEdPERV versus
SERVPERV. Marketing Intelligence and Planning, 24(1):31-47.
Abdullah, F. 2006a. The development of HEdPERF: a new measuring instrument of
service quality for the higher education sector. International Journal of Consumer
Studies, 30(6):569-581.
Abdullah, F. 2006b. Measuring service quality in higher education: HEdPERF versus
SERVPERV. Marketing Intelligence and Planning, 24(1):31-47.
Abdullah, M.C. 2009. A leadership and psycap: a study of the relationship between
positive leadership behaviors and followers’ positive psychological capital. Doctoral
thesis, Capella University, Minneapolis.
Abubaker, B. 2002. Developing a framework for understanding a tourism service
setting: an exploratory study. Services Marketing Quarterly, 23(3):17.
Aikens, C.H. 2006. Quality: a corporate force. Upper Saddle River, NJ: Prentice-Hall.
Alban-Metcalfe, R.J. & Alimo-Metcalf, B. 2000. An analysis of the convergent and
discriminant validity of the Transformational leadership Questionnaire. International
Journal of Selection and Assessment, 8(3):158-175.
Alban-Metcalfe, R.J. & Alimo-Metcalf, B. 2001. The development of a new leadership
questionnaire. Journal of Occupational and Organizational Psychology, 74:1-27.
Alban-Metcalfe, R.J. & Alimo-Metcalf, B. 2007. Development of a private sector
version of the (engaging) Transformational Leadership Questionnaire. Leadership
and Organization Development Journal, 28(2):104-121.
Alzola, L.M. & Robaina, V.P. 2005. SERVQUAL: its applicability in electronic
commerce B2C. The Quality Management Journal, 12(4):46-57.
Page 262
242
Anderson, E. 1995. High tech v. high touch: a case study of TQM implementation in
higher education. Managing Service Quality, 5(2):48-56.
Arambewela, R. & Hall, J. 2009. An empirical model of international student
satisfaction. Asia Pacific Journal of Marketing and Logistics, 21(4):555-569.
Artley, J.B. 2008. The impact of leadership practices on Generation X employee
commitment in the health insurance industry. Doctoral thesis, Nova Southeastern
University, Fort Lauderdale.
Asmal, K. 2002. Private higher education in South Africa. Perspectives in Education,
20(4):125-128.
Asubonteng, P., McClearly, K.J. & Swan, J.E. 1996. SERVQUAL revisited: a critical
review of service quality. The Journal of Service Marketing, 10(6):62-81.
Babakus, E. & Boller, G.W. 1992. An empirical assessment of the SERVQUAL scale.
Journal of Business Research. New York: Elsevier Science, 24: 253-268.
Badri, M.A., Abdulla, M. & Al-Madani, A. 2005. Information technology center service
quality: assessment and application of SERVQUAL. The International Journal of
Quality and Reliability Management, 22(8):819-848.
Baki, B., Basfirinci, C.S., Cilingir, Z. & Murat, I. 2009. An application of integrating
SERVQUAL and Kano’s model into QFD for logistics services. Asia Pacific Journal
of Marketing and Logistics, 21(1):106-126.
Barker, A.M., Sullivan, D.T. & Emery, M.J. 2006. Leadership competencies for
clinical managers: the Renaissance of transformational leadership. London: Jones &
Bartlett International.
Barnes, B.R. 2007. Analysing service quality: the case of post-graduate Chinese
students. Total Quality Management and Business Excellence, 18(3):313-331.
Bass, B.M. & Avolio, B.J. 1994. Improving organizational effectiveness: through
transformational leadership. Thousand Oaks, CA: Sage.
Batten, J.D. 1989. Tough-minded leadership. New York: Amacom.
Baxter, L. 2004. Up to scratch? Occupational Health, 56(3):24-27.
Page 263
243
Bayraktaroglu, G. & Atrek, B. 2010. Testing the superiority and dimensionality of
SERVQUAL vs. SERVPERF in higher education. The Quality Management Journal,
17(1):47-59.
Behling, O. & McFillen, J.M. 1996. A syncretical model of
charismatic/transformational leadership. Group and Organizational Management,
21(2):163-191.
Bicheno, J. & Catherwood, P. 2005. Six Sigma and the Quality Toolbox for service
and manufacturing. Buckingham, UK: Picsie Books.
Big Dog & Little Dog’s Performance Juxtaposition. [S.a.]. Leadership self-
assessment activity. [Online]. Available from: <http://www.nwlink.com
/~donclark/leader/survlead.html> [accessed on 2009-05-24].
Bitner, M.J. 1992. Servicescape: the impacts of physical surroundings on customers
and employees. Journal of Marketing 56(2):57-67.
Bodla, M.A. & Nawaz, M.M. 2010. Comparative study of full range leadership model
among faculty members in public and private sector higher education institutes and
universities. International Journal of Business and Management, 5(4):208-214.
Botha, N. 2009. Some current curriculum issues in South African higher education,
in Brady, M.K., Cronin, J.J. & Brand, R.R. 2002. Performance-only measurement of
service quality: a replication and extension. Journal of Business Research, 55:17-31.
Bratton, J. 2007. Work and organisational behaviour. New York: Palgrave Macmillan.
Breneman, D.W. 2005. Entrepreneurship in higher education. New Directions for
Higher Education, 129:3-9.
Brochado, A. 2009. Comparing alternative instruments to measure service quality in
higher education. Quality Assurance in Education, 17(2):174-190.
Brogowicz, A.A., Delene, L.M. & Lyth, D.M. 1990. A synthesised service quality
model with managerial implications. International Journal of Service Industry
Management, 1(1):27-44.
Page 264
244
Broome, P.H. 2003. The relationship between perceptions of presidential leadership
practices and organizational effectiveness in Southern Community Colleges.
Doctoral thesis, University of Mississippi, Oxford.
Brue, G. 2002. Six Sigma for managers. New York: McGraw-Hill.
Buttle, F. 1996. SERVQUAL: review, critique, research agenda. European Journal of
Marketing, 30(1):8–32.
Byraktaroglu, G. & Atrek, B. 2010. Testing the superiority and dimensionality of
SERVQUAL vs SERFPERF in Higher Education. The Quality Management Journal,
17(1):47-59.
Carless, S.A., Wearing, A.J. & Mann, L. 1994. Transformational leadership: does it
make a difference? 3rd Western Academy of Management International Conference,
Brisbane, 11-13 July.
Carless, S.A., Wearing, A.J. & Mann, L. 2000. A short measure of transformational
leadership. Journal of Business and Psychology, 14(3):389-405.
Carrillat, F.A., Jaramillo, F. & Mulki P.J. 2007. The validity of the SERVQUAL and
SERVPERF scales: a meta-analytic view of 17 years of research across five
continents. International Journal of Service Industry Management, 18(5):472-490.
Chart Your Course International. [S.a.]. Innovative leadership assessment. [Online].
Available from: <http://www.chartcourse.com/articleassess.htm> [accessed on
2009-05-24].
Chau, V.S. & Kao, Y. 2009. Bridge over troubled water or long and winding road?
Gap-5 in airline service quality performance measures. Managing Service Quality,
19(1):106-134.
Chowdhury, M.U. 2009. Customer expectations and management perceptions in
healthcare services in Bangladesh: an overview. Journal of Services Research,
8(2):121-140.
Clawson, J.G. 2006. Level three leadership: getting below the surface. 3rd edition.
Upper Saddle River, NJ: Prentice Hall.
Page 265
245
Co, M.J., Groenewald, J., Mitchell,B., Nayager, T., Van Zyl, J., Visser, K., Train, W.
& Emanual, B. 2006. Entrepreneurship: fresh perspectives. Cape Town: Pearson
Education.
Cohen, J. 1988. Statistical power analysis for the behavioral sciences. Hillside, NJ:
Erlbaum.
Colquitt, J.A., Lepine, A.J. & Wesson, M.J. 2011. Organisational behaviour:
improving performance and commitment in the workplace. 2nd edition. New York:
McGraw-Hill.
Conger, J.A. 1999. Charismatic and transformational leadership in organisations: an
insider’s perspective on these developing streams of research. Leadership Quarterly,
10(2):145-179.
Conger, J.A. & Riggo, R.E. 2007. The practice of leadership: developing the next
generation of leaders. San Francisco, CA: Wiley.
Conger, J.A., Kanungo, R.N., Menon, S.T. & Mathur, P. 1997. Measuring charisma:
dimensionality and validity of the Conger-Kanungo scale of charismatic leadership.
Canadian Journal of Administrative Services, 14(3):290-302.
Cooper, D.R. & Schindler, P.S. 2003. Business research methods. 8th edition. New
York: McGraw-Hill.
Cosser, M. 2002. Quality through regulation? Towards quality provision in the South
African private higher education sector. Perspectives in Education, 20(4):111-121.
Council on Higher Education. 2003. Higher Education Monitor no.1: the state of
private higher education in South Africa. Pretoria: Council on Higher Education.
Cronin, J.J. & Taylor, S.A. 1992. Measuring service quality: a re-examination and
extension. Journal of Marketing, 56(3):55-68.
Cronin, J.J. & Taylor, S.A. 1994. SERVPERF vs SERVQUAL: reconciling
performance-based and perceptions-minus-expectations measurement of service
quality. Journal of Marketing, 58(1):125-131.
Page 266
246
Dale, B.G., Van der Wiele, T. & Van Iwaarden, J. (eds). 2007. Managing quality.
Malden: Blackwell.
Dauffenbach, V.K. 1995. Leadership practices and job satisfaction: an examination
of the relationship between academic deans and department chairpersons. Doctoral
thesis., Western Michigan University, Michigan.
Davies, B., Barron, S. & Harris, K. 1999. Observable oral participation in the
servuction system: toward a content and process model. Journal of Business
Research, 44:47-53.
De´caudin, JM. & Lacoste, D. 2010. Are services advertised differently? An
empirical examination. Journal of Services Marketing, 24(7):546-543.
Doh, J.P. & Stumpf, S.A. 2005. Handbook on responsible leadership and
governance in global business. Cheltenham, UK: Edward Elgar.
Doolos, C.L. 1997. Leadership: developing a personal understanding. The Armed
Forces Comptroller, 42(3):44.
Drafke, M. 2009. The human side of organisations. 10th edition. Upper Saddle River,
NJ: Prentice-Hall.
Ehlers, T. & Lazenby, K. 2010. Strategic management: South African concepts and
cases. 3rd edition. Pretoria: Van Schaik.
Etgar, M. & Fuchs, G. 2009. Why and how service quality perceptions impact
consumer responses. Managing Service Quality, 19(4):474-485.
Evans, J.R. 2011. Quality management, organization and strategy. 6th edition.
Cincinnati: South-Western.
Fehnel, R. 2007. Private higher education, in Transformation in higher education:
global pressures and local realities, edited by N. Cloete, P. Maassen, R. Fehnel, T.
Moja, T. Gibbon & H. Perold. Dordrecht: Springer.
Feinhberg, J.B., Ostroff, C. & Burke, W.W. 2005. The role of within-group agreement
in understanding transformational leadership. Journal of Occupational and
Organizational Psychology, 78:471-488.
Page 267
247
Fendt, P.F. & Varek, G.M. 1992. Quality improvement in continuing higher education
and service organisations. Lewiston, NY: Edwin Mellen Press.
Field, A. 2005. Discovering statistics using SPSS. 2nd edition. London: Sage.
Foster, S.T. 2010. Managing quality: integrating the supply chain. 4th edition. Upper
Saddle River, NJ: Prentice-Hall.
Fourie, M. 2009. Institutional governance in SA higher education: for the common
good or political power play? in Higher education in South Africa: a scholarly look
behind the scenes, edited by E. Bitzer. Stellenbosch: SUN Media.
French, R., Rayner, C., Rees, G. & Rumbles, S. 2009. Organizational behaviour.
West Sussex: Wiley.
Garraway, O.L. 2008. A study of the relationship between corporate leaders' beliefs
and the firm's strategic decisions. Doctoral thesis, University of Phoenix, Phoenix.
Getz, D. 1997. Event management and event tourism. New York: Cognizant
Communications Corporation.
Ghobadian, A., Speller, S. & Jones, M. 1994. Service quality concepts and models.
International Journal of Quality and Reliability Management, 11(9):43-66.
Gilmore, A. & McMullan, R. 2009. Scales in service marketing research: a critique
and way forward. European Journal of Marketing, 43(5/6):640-651.
Gliem, J.A. & Gliem, R.R. 2003. Calculating, interpreting, and reporting Cronbach’s
alpha reliability coefficient for Likert-type scales. Midwest Research to Practice
Conference in Adult, Continuing, and Community Education.
Goetsch, D.L. & Davis, S.B. 2006. Quality management: introduction to total quality
management for production, processing, and services. 5th edition. Upper Saddle
River, NJ: Pearson Education.
Grönfeldt, S. & Strother, J. 2006. Service leadership: the quest for competitive
advantage. Thousand Oaks, CA: Sage.
Page 268
248
Grönroos, C. 1984. A service quality model and its marketing implications. European
Journal of Marketing, 18(4):36-44.
Grönroos, C. 1988. Service quality: the six criteria of good perceived service quality.
Review of business, Winter:10-13.
Gryna, F.M., Chua, R.C.H. & DeFeo, J.A. 2007. Juran’s quality planning and
analysis for enterprise quality. 5th edition. New York: McGraw-Hill.
Ham, L. & Hayduk, S. 2003. Gaining competitive advantages in higher education:
analyzing the gap between expectations and perceptions of service quality.
International Journal of Value-Based Management, 16(2):223-242.
Harding, P. 2005. Quality and conceptual tool-making. Management Today, 21(8):
31-32.
Hay, D. & Monnapula-Mapesela, M. 2009. South African higher education before
and after 1994: a policy analysis perspective, in Higher education in South Africa: a
scholarly look behind the scenes, edited by E. Bitzer. Stellenbosch: SUN Media.
Haywood-Farmer, J. 1988. A conceptual model of service quality. International
Journal of Operations and Production Management, 8(6):19-29.
Hellriegel, D., Jackson, S.E., Slocum, J., Staude, G., Amos, T., Klopper, H.B., Louw,
L. & Oosthuizen, T. 2006. Management. 2nd South African edition. Cape Town:
Oxford University Press.
Higher Education Act 101 of 1997. [Online]. Available from: <http://www.che.ac.za
/documents/d000004/Higher_Education_Act.pdf> [accessed on 2009-12-03].
Hightower, R., Brady, M.K. & Baker, T.L. 2002. Investigating the role of the physical
environment in hedonic service consumption: an exploratory study of sporting
events. Journal of Business Research, 55(9):697.
Holt, D.J. 2003. Administrator behaviour leadership practices: a Comparative
assessment of administrators and observers at selected community colleges in
Texas. Doctoral thesis, Texas A&M University, Houston.
Page 269
249
Hough, J. & Neuland, E. 2007. Global business. environments and strategies:
managing for global competitive advantage. 3rd edition. Cape Town: Oxford
University Press.
Hughey, D.W., Chawla S.K. & Khan Z.U. 2003. Measuring the quality of university
computer labs using SERVQUAL: a longitudinal study. The Quality Management
Journal, 10(3):33.
Hui, C.H., Chiu, W.C.K., Yu, P.L.H., Cheng, K. & Tse, H.H.M. 2007. The effects of
service climate and the effective leadership behavior of supervisors on frontline
employee service quality: a multi-level analysis. Journal of Occupational and
Organizational Psycology, 80:151-172.
Hyatt, K.E. 2007. The influence of leadership practices on subordinates’ perceived
organizational support in MBA students. Doctoral thesis, Nova Southeastern
University, Fort Lauderdale.
International Education Association of South Africa. 2007. South Africa in Africa:
defining the landscape of higher education. Durban: International Education
Association of South Africa.
Jabnoun, N. & Juma AL Rasasi, A. 2005. Transformational leadership and service
quality in UAE hospitals. Managing Service Quality, 15(1):70-81.
Kandampully, J. & Kandampully, R. 2006. Service system: a strategic approach to
innovate and manage service superiority. in Managing tourism and hospitality
services: theory and international applications, edited by B. Prideaux, G. Moscardo &
E. Laws Wallingford, UK: CAB International.
Kang, G.D. & James, J. 2004. Service quality dimensions: an examination of
Grönroos service quality model. Managing Service Quality, 14(4):266-277.
Kgaile, A. & Morrison, K. 2006. Measuring and targeting internal conditions for
school effectiveness in the Free State of South Africa. Educational Management
Administration and Leadership, 34(1):47-68.
Khoshafian, S. 2007. Service orientated enterprises. Broken Sound Parkway, NY:
Averbach.
Page 270
250
Kim, Y., Lee, S. & Yun, D. 2004. Integrating current and competitive service-quality
level analysis for service-quality improvement programmes. Managing Service
Quality, 14(4):288-296.
Koen, M. & Bester M. 2009. Two master’s students’ perspectives on higher
education studies: in pursuit of scholarship, in Higher education in South Africa: a
scholarly look behind the scenes, edited by E. Bitzer. Stellenbosch: SUN Media.
Kotler, P. 2000. Marketing management: the millennium edition.
Upper Saddle River, NJ: Prentice-Hall.
Kouzes, J.M. & Posner, B.Z. 2003a. The five practices of exemplary leadership. 3rd
edition. San Francisco: Wiley.
Kouzes, J.M. & Posner, B.Z. 2003b. Leadership practices inventory: facilitator’s
guide. 3rd edition. San Francisco: Wiley.
Kouzes, J.M. & Posner, B.Z. 2007. The leadership challenge. 4th edition. San
Francisco: Jossey-Bass.
Kouzes, J.M. & Posner, B.Z. [S.a.]. Leadership challenge facilitators guide. [Online].
Available from: <http://wwwleadershipchallenge.com/WileyCDA/Section/id-
131088.html> [accessed on 2008-12-23].
Kruss, G. 2002. More, better, different? Understanding private higher education in
South Africa. Perspectives in Education, 20(4):15-28.
Kruss, G. 2004a. Examining private higher education in South Africa. HSRC Review,
2(4):15.
Kruss, G. 2004b. Chasing credentials and mobility: private higher education in South
Africa. Cape Town: HSRC Press.
Kumar, M., Kee, F.T. & Manshor, A.T. 2009. Determining the relative importance of
critical factors in delivering service quality of Banks: an application of dominance
analysis in SERVQUAL model. Managing Service Quality, 19(2):211-228.
Page 271
251
Kumar, V. & Kumar, U. 2011. The role of leadership competencies for implementing
TQM: an empirical study in the Thai manufacturing industry. International Journal of
Quality and Reliability Management, 28(2):159-219.
Lai, F., Hutchinson, J., Li, D. & Bai, C. 2007. An empirical assessment of the
application of SERVQUAL in mainland China’s mobile communications industry.
International Journal of Quality and Reliability Management, 24(3):244-262.
Lamb, C.W., Hair, J.F., McDaniel, C., Boshoff, C. & Terblanche, N.S. 2004.
Marketing. 2nd South African edition. Cape Town: Oxford University Press.
Langbein, M.L. 2010. The effects of age and experience on levels of leadership
practices of nontraditional undergraduate management students. Doctoral thesis,
Robert Morris University, Pittsburgh, Pennsylvania.
Laohavichien, T., Fredendall, L.D. & Cantrell, R.S. 2009. The effects of
transformational and transactional leadership on quality improvement. The Quality
Management Journal, 16(2):7-24.
Lau, P.M., Akbar, K. & Gun Fie, D.Y. 2005. Service quality: a study of the luxury
hotels in Malaysia. The Journal of American Academy of Business, 7(2):46-55.
Leadership self-assessment. [S.a.]. Tools for improved advocacy. [Online]. Available
from: <http://www.nsba.org/sbot/toolkit/leadSA.html> [accessed on 2009-05-24].
Lee, J. 2005. Measuring service quality in a medical setting in a developing country:
the applicability of SERVQUAL. Services Marketing Quarterly, 27(2):1-14.
Leedy, P.D. & Ormrod, J.E. 2010. Practical research. 9th edition. Upper Saddle
River, NJ: Pearson Education.
Leigh, J.M., Shapiro, R.E. & Penney, S.H. 2010. Developing diverse, collaborative
leaders: an empirical program evaluation. Journal of Leadership and Organizational
Studies, 17(4):370-379.
Levy, D.C. 2002. Commercial private higher education: South Africa as a stark
example. Perspectives in Education, 20(4):29-39.
Page 272
252
Levy, D.C. 2003. Profits and practicality: how South Africa epitomizes the global
surge in commercial private higher education, in PROPHE Working Paper Series.
New York: PROPHE (WP No. 2 March). [Online]. Available from: <
http://www.albany.edu/dept/eaps/prophe/publication/paper.html> [accessed on 2010-
03-25].
Lewis, B.R. 2007. Managing service quality, in Managing quality, edited by B.G.
Dale, T. Van der Wiele & J. Van Iwaarden. Malden: Blackwell.
Lucas, A.F. 2003. The determinants and effects of slot servicescape satisfaction in a
Las Vegas hotel casino. UNLV Gaming Research and Review Journal, 7(1):109-108.
Mabizela, M. 2005. The business of higher education: a study of public-private
partnerships in the provision of higher education in South Africa. Cape Town: HSRC
Press.
Mabizela, M. 2006. Recounting the state of private higher education, in Growth and
expansion of private higher education in Africa, edited by N.V. Varghese. Paris:
International Institute for Educational Planning.
Macgregor, K. 2009. Southern Africa: study identifies 20 HE challenges. [Online].
Available from: <http://www.universityworldnews.com/article.php?
story=20090802095036735> [accessed on 2010-03-02].
Mancheno-Smoak, L., Endres, G.M., Potak, R. & Athanasaw, Y. 2009. The
individual cultural values and job satisfaction of the transformational leader.
Organization Development Journal, 27(3):9-21.
Manning, G. & Curtis, K. 2003. The art of leadership. New York: McGraw-Hill.
Marcketti, S.B., Arendt, S.W. & Shelley, M.C. 2011. Leadership in action: student
leadership development in an event management course. Leadership and
Organization Development Journal, 32(2):170-189.
Marden, T. 2007. Principles of strategic management. 3rd edition. Hampshire, UK:
Ashgate.
Page 273
253
Markovic, S. 2006. Expected service quality measurement in tourism higher
education. Nase Gospodarstvo, 52(1/2):86-95.
Martinez, M.C. & Wolverton, M. 2009. Innovative strategy making in higher
education. Miami: Information Age.
Mattsson, J. 1992. A service quality model based on ideal value standard.
International Journal of Service Industry Management, 3(3):18-33.
Matviuk, S.G. 2010a. A study of Peruvian entrepreneurs' leadership expectations.
Journal of American Academy of Business, Cambridge, 16(1):65-70.
Matviuk, S.G. 2010b. A correlational study of culture and leadership expectations in
a Mexican manufacturing plant. The Business Review, Cambridge, 15(1):14-19.
McCann, J.A., Langford, P.H. & Rawlings, R.M. 2006. Testing Behling and McFillen’s
syncretical model of charismatic transformational leadership. Group and
Organizational Management, 31(2):237-263.
McKenna, T. 2003. Why service strategies fail. National Petroleum News, 95(2):15.
Milakovich, M.E. 2006. Improving service quality in the global economy: achieving
high performance in the public and private sectors. 2nd edition. Broken Sound
Parkway, NW: Auerbach.
Mind tools. [S.a.]. The leadership motivation assessment. [Online]. Available from:
<http://www.mindtools.com/pages/article/newLDR_01.htm> [accessed on 2009-05-
24].
Moscardo, G. 2006. Using the critical incidents technique to understand service
quality in tourist accommodation, in Managing tourism and hospitality services:
theory and international applications, edited by B. Prideaux, G. Moscardo & E.
Laws.. Wallingford, UK: CAB International.
Mukherjee, A. & Nath, A. 2005. An empirical assessment of comparative approaches
to service quality measurement. The Journal of Services Marketing, 19(2):174-184.
Nevarez, C. & Wood, L. 2010. Community college leadership and administration:
theory, practice and change. New York: Peter Lang.
Page 274
254
Nicholls, R. 2010. New directions for customer-to-customer interaction research.
Journal of Services Marketing, 24(1):87-97.
Niemann, R. & Kotze, T. 2006. The relationship between leadership practices and
organisational culture: an education management perspective. South African Journal
of Education, 26(4):609-624.
Nienaber, H. 2010. Conceptualisation of management and leadership. Management
Decision, 48(5):661-675.
Nzimande, B. 2009. Challenges facing the South African higher education system.
250th seminar of the University of Johannesburg’s Faculty of Humanities,
Johannesburg, 14 August. [Online]. Available from:
<http://www.politicsweb.co.za/politicsweb/view/politicsweb/en/page71656?oid=1398
07&sn=Detail> [accessed on 2010-08-25].
O’Brian, E.M. & Deans, K.R. 1996. Educational supply chain: a tool for strategic
planning in higher education. Marketing Intelligence and Planning, 14(2):33-40.
Oakland, J.S. 2003. TQM: text with cases. 3rd edition. Oxford: Elsevier.
Odegaard, L.C. 2008. The relationship between teacher-identified principal
leadership behaviour and student achievement in South Dakota secondary schools.
Doctoral thesis, University of South Dakota, Vermillion, South Dakota.
Optimal thinking. [S.a.]. Leadership skills assessment questionnaire. [Online].
Available from: <http://www.optimalthinking.com/leader-assessment.asp> [accessed
on 2009-05-24].
Osseo-Asare, A.E., Longbottom, D. & Chourides, P. 2007. Managerial leadership for
total quality improvement in UK higher education. The TQM Magazine, 19(6):541-
560.
Osseo-Asare, A.E., Longbottom, D. & Murphy, W.D. 2005. Leadership best practices
for sustaining quality in UK higher education from the perspective of the EFQM
Excellence Model. Quality Assurance in Education, 13(2):148-170.
Palmer, A. 1998. Principles of services marketing. 2nd edition. London: McGraw-Hill.
Page 275
255
Palmer, A. 2005. Principles of services marketing. 4th edition. London: McGraw-Hill.
Palmer, A. 2008. Principles of services marketing. 5th edition. Berkshire: McGraw-
Hill.
Parasuraman, A., Zeithaml, V.A. & Berry, L.L. 1985. A conceptual model of service
quality and its implications for future research. Journal of Marketing, 49:41-50.
Parasuraman, A., Zeithaml, V.A. & Berry, L.L. 1988. SERVQUAL: a multiple-item
scale for measuring consumer perceptions of service quality. Journal of Retailing,
64(1):12-40.
Parasuraman, A., Zeithaml, V.A. & Berry, L.L. 1991. Refinement and reassessment
of the SERVQUAL scale. Journal of Retailing, 67(4):420-450.
Pearce, J.A. & Robinson, R.B. 2005. Formulation, implementation and control of
competitive strategy. 9th edition. Boston: McGraw-Hill.
Pearce, J.A. & Robinson, R.B. 2011. Strategic management: formulation,
implementation and control. 12th edition. New York: McGraw-Hill.
Philip, G. & Hazlett, S.A. 1997. The measurement of service quality: a new P-C-P
attributes model. International Journal of Quality and Reliability Management,
14(3):260-286.
Pieters, P. & Botschen, G. 1999. Special issue on service marketing and
management: European contributions. Journal of Business Research, 44:1-4.
Plowman, R.D. 1991. The perceptions of presidential leadership behaviour and
institutional environment by presidents and vice presidents of selected four-year
colleges and universities in Florida. Doctoral thesis, University of Mississippi, Waco,
Mississippi
Podsakoff, P.M., Mackenzie, S.B., Moorman, R.H. & Fetter, R. 1990.
Transformational leader behaviours and their effects on followers’ trust in leader,
satisfaction, and organizational citizenship behaviours. Leadership Quarterly,
1(2):107-142.
Page 276
256
Podsakoff, P.M., Mackenzie, S.B. & Bommer, H. 1996. ‘Transformational leader
behaviours and substitutes for leadership as determinants of employee satisfaction,
commitment, trust, and organisational citizenship behaviours’, Journal of
Management, 22(2): 259-298.
Politicsweb. 2009. Nzimande on the challenges facing higher education. [Online].
Available from:
<http://www.politicsweb.co.za/politicsweb/view/politicsweb/en/page71656
?oid=139807&sn=Detail> [accessed on 2010-08-25].
Prideaux, B., Moscardo, G. & Laws, E. 2006. Quality and service management
perspectives, in Managing tourism and hospitality services: theory and international
applications, edited by B. Prideaux, G. Moscardo & E. Laws. Walingford, UK: CAB
International.
Pycraft, M., Singh, H., Phihlela, K., Slack, N., Chambers, S. & Johnston, R. 2010.
Operations management. 2nd edition. Cape Town: Pearson Education.
Quaglieri, P.L., Penney, S.H. & Waldner, J. 2007. Developing future business and
civic leaders: the emerging leaders program. Management Decision, 45(10):1685-
1694.
Quinn, A., Lemay, G., Larsen, P. & Johnson, D.M. 2009. Service quality in higher
education. Total Quality Management, 20(2):139-152.
Qureshi, T.M., Shaukat, M.Z. & Hijazi, S.T. 2010. Service quality SERVQUAL model
in higher educational institutions: what factors are to be considered? Interdisciplinary
Journal of Contemporary Research in Business, 2(5):281-290.
Radder, L. & Han, X. 2009. Service quality of on-campus student housing: a South
African experience. The International Business and Economics Research Journal,
8(11):107-119.
Rakoff, S. 2010. Expanding leader capability: an exploratory study of the effect of
daily practices for leader development. Doctoral thesis, Antioch University, Seattle.
Ramphal, R. 2011a. ISO 9001:2008 quality management systems: an interpretation
handbook. Sandton: Picsie Press.
Page 277
257
Ramphal, R.R. 2011b. A quality framework for services in a shared services
environment. DTech thesis, Tshwane University of Technology, Pretoria.
Rausch, E. 1999. More effective leadership can bring higher service quality.
Managing Service Quality, 9(3):154-157.
Riaz, A. & Haider, M.H. 2010. Role of transactional and transformational leadership
on job satisfaction and career satisfaction. Business and Economic Horizons,
1(1):29-38.
Robbins, S.P. & DeCenzo, A. 2008. Fundamentals of management: essential
concepts and applications. 6th edition. Upper Saddle River, NJ: Pearson Education.
Roelofse, F. 2007. An exploratory study into the multidimensional nature of quality in
analytical laboratories: managerial implications. The Quality Management Journal,
14(3):7-14.
Roi, R.C. 2006. Leadership, corporate culture and financial performance. Doctoral
thesis, University of San Francisco, San Francisco.
Ruiqi, Z & Adrian, P. 2009. Using SERVQUAL to measure the service quality of
travel agents in Guangzhau, South China. Journal of Services Research, 9(1):87-
107.
Salkind, N.J. 2009. Exploring research. 7th edition. Upper Saddle River, NJ: Pearson
Education.
Saunders, M., Lewis, P. & Thornhill, A. 2007. Research methods for business
students. 4th edition. Edinburgh Gate, Harlow, UK: Pearson Education.
Seth, N., Deshmukh, S.G. & Vrat, P. 2005. Service quality models: a review.
International Journal of Quality and Reliability Management, 22(9):913-949.
Smith, G. & Smith, A. 2007. Evaluating service quality in universities: a service
department perspective. Quality Assurance in Education, 15(3):334-351.
South Africa. Council on Higher Education. 2009. Higher Education Monitor no. 8.
The state of higher education in South Africa. [Online]. Available from: <
http://www.che.ac.za/publications/ALL>> [accessed on 2010-03-08].
Page 278
258
South Africa. Department of Education. 1997. Education White Paper 3: a
programme for the transformation of higher education. [Online]. Available from:
<http://www.education.gov.za/dynamic/dynamic.aspx?pageid=329&catid=12&catego
ry=White papers&legtype=7> [accessed: 2010-03-08].
South Africa. Department of Education. 2009. Register of private higher education
institutions. [Online]. Available from: < http://www.education.gov.za and look under
DoE Branches/Higher Education/Private Higher Education Institutions/Directorate
Documents/Register of Private Higher Education Institutions> [accessed: 2009-04-
04].
South Africa. Department of Education. 2010. Register of private higher education
institutions. [Online]. Available from: <http://www.education.gov.za
/dynamic/dynamic.aspx?pageid=326&dirid=47> [accessed: 2010-02-03].
South Africa. Department of Education. [S.a.]. Strategic plan 2007 to 2011.
Spendlove, M. 2007. Competencies for effective leadership in higher education.
International Journal of Educational Management, 21(5):407-417.
Spigener, J.B. 2004. Beyond management: using leadership to achieve your goals in
quality. Annual Quality Congress Proceedings: American Society for Quality Control,
Milwaukee. ASQ:229-232.
Spreng, R.A. & Mackoy, R.D. 1996. An empirical examination of a model of
perceived service quality and satisfaction. Journal of Retailing, 72(2):201-214.
Stamatis, D.H. 1996. Total quality service. Delray Beach, FL: St. Lucia Press.
Staub, R.E. 1997. The heart of leadership: 12 practices of courageous leaders.
Provo, UT: Executive Excellence.
Subotzky, G. 2003a. Public higher education, in Human resources development
review 2003: education, employment and skills in South Africa. Pretoria: HSRC
Press.
Page 279
259
Subotzky, G. 2003b. Private higher education and training, in Human resources
development review 2003: education, employment and skills in South Africa.
Pretoria: HSRC Press.
Summers, D.C.S. 2005. Quality management: creating and sustaining organisational
effectiveness. Upper Saddle River, NJ: Pearson Education.
Suwandee, A. 2009. Organizational leadership development among the middle
executives of Kasem Bundit University, Thailand. Doctoral thesis. Pepperdine
University, Malibu, California.
Swart, M.P. 2006. Service quality: a survey amongst convention consumers at the
CSIR International Convention Centre. MCom dissertation, University of Pretoria,
Pretoria.
Sylvester, M.H. 2009. Transformational leadership behaviours of frontline sales
professionals: an investigation of the impact of resilience and key demographics.
Doctoral thesis, Capella University, Minneapolis.
Tahir, I.M., Abu Bakar, N.M. & Ismail, W.Z.W. 2010. Importance-performance
analysis of service quality among business students: an exploratory study.
Interdisciplinary Journal of Contemporary Research in Business, 2(1):132-141.
The leadership challenge. [S.a.]. Ask an expert. [Online]. Available from:
<http://eu.leadershipchallenge.com/WileyCDA/Section/id-131340.html#June09>
[accessed on 2011-07-05].
The leadership challenge. [S.a.]. History. [Online]. Available from:
<http://www.leadershipchallenge.com/WileyCDA/Section/id-131054.html> [accessed
on 2010-12-23].
Thomas, M. 2006. The complete CEO: the executive’s guide to constant peak
performance. West Sussex: Capstone..
Thompson, N. 2009. People skills. 3rd edition. New York: Palgrave Macmillan.
Page 280
260
Thorp, H. & Goldstein, B. 2010. Engines of innovation: the entrepreneurial
university in the twenty-first century. Chapel Hill, NC: University of North Carolina
Press.
Tilak, J.B.G. 2006. Private higher education: philanthropy to profits, in Higher
education in the world 2006: the financing of universities. New York: Palgrave
Macmillan.
Transformational leadership. 2010. Transformational leadership evaluation methods
and tools. [Online]. Available from: <http://www.transformationalleadership.net
/imarticle.php?articleid=246003> [accessed on 2011-07-05].
Trivellas, P. & Dargenidou, D. 2009. Leadership and service quality in higher
education. International Journal of Quality and Service Sciences, 1(3):294-310.
Tustin, D.H., Ligthelm, A.A., Martins, J.H. & Van Wyk, H.de J. 2005. Marketing
research in practice. Pretoria: University of South Africa.
University World News. 2009. Southern Africa: study identifies 20 HE challenges.
[Online]. Available from: <http://www.universityworldnews.com/article.php?story
=20090802095036735> [accessed on 2010-03-02].
Utts, J.M. & Heckard, R.F. 2007. Mind on statistics. 3rd edition. Duxbury: Thomson
Learning.
Van Ameijde, J.D.J, Nelson, P.C., Billsberry, J. & Van Meurs, N. 2009. Improving
leadership in higher education institutions. Higher Education, 58:763-779.
Van der Wal, R.W.E., Pampallis, A. & Bond, C. 2002. Service quality in a
telecommunications company: a South African experience. Managing Service
Quality, 12(5):323-335.
Varey, R. 1993. The course of higher education. Managing Service Quality,
September:45-49.
Page 281
261
Vasquez-Guignard, S.J. 2010. Latina university professors: insights into the journeys
of those who strive to leadership within academia. Doctoral thesis, Pepperdine
University, Malibu, California.
Von Eck, C. & Verwey, A. 2007. Change dynamics and related leadership
competencies. Journal of Human Resource Management, 5(2):42-50.
Voon, B.H. 2006. Linking a service-driven market orientation to service quality.
Managing Service Quality, 16(6):595-619.
Voss, R., Gruber, T. & Szmigin, I. 2007. Service quality in higher education: the role
of student expectations. Journal of Business Research, 60:949-959.
Waldman, D.A. 1994. The contributions of total quality management to a theory of
work performance. Academy of Management Review, 19(3):510-536.
Wang, V.C.X. & Berger, J. 2010. Critical analysis of leadership needed in higher
education. International Forum of Teaching and Studies, 6(2):3-12.
Wang, Y., Lo, H. & Yang, Y. 2004. An integrated framework for service quality,
customer value, satisfaction: evidence from China’s telecommunication industry.
Information Systems Frontiers, 6(4):325-340.
Wardell, M.J.L. 2010. Leadership behaviours and practices among executive women
of colour in higher education. Doctoral thesis, Pepperdine University, Malibu,
California.
Wegner, T. 2010. Applied business statistics. 2nd edition. Cape Town: Juta.
Wilson, A., Zeithaml, V.A., Bitner, J. & Gremler, D. 2008. Services marketing.
Maidenhead, Berkshire: McGraw-Hill.
Wisniewski, M. 2001. Using SERVQUAL to assess customer satisfaction with public
sector services. Managing Service Quality, 11(6):380-388.
Wong, H.D., Rexha, N. & Phau, I. 2008. Re-examining traditional service quality in
an e-banking era. International Journal of Bank Marketing, 26(7):526-545.
Yang, L. 2009. Narcissistic leadership in organizations. MA dissertation, University of
Guelph, Ottawa, Ontario.
Page 282
262
Yeo, R.K. 2008. Brewing service quality in higher education: characteristics of
ingredients that make up the recipe. Quality Assurance in Education, 16(3):266-286.
Yielder, J. & Codling, A. 2004. Management and leadership in the contemporary
university. Journal of Higher education Policy and Management, 26(3):315-328.
Zeithaml, V.A., Parasuraman, A. & Berry, L.L. 1990. Delivering service quality:
balancing customer perceptions and expectations. New York: Free Press.
Page 283
263
Appendix A: SERVQUAL
Page 284
264
RESEARCH STUDY: SERVICE QUALITY AT THE COLLEGE
Research conducted by: R. Dirkse van Schalkwyk
Dear Respondent,
You are invited to participate in an academic research study conducted by Riaan
Dirkse van Schalkwyk.
The purpose of the study is to explore the level of service quality experienced by
students.
Please note the following:
• This study is an anonymous survey. Your name will not appear on the
questionnaire and the answers you give will be treated as strictly
confidential. You cannot be identified in person on the basis of your
responses.
• Please answer the questions in the attached questionnaire as
completely and honestly as possible. This should not take more than
15 minutes of your time.
• The results of the study will be used for academic purposes only and
may be published in an academic journal. I will provide you with a
summary of my findings on request.
• Please contact your campus principal if you have any questions or
comments about the study.
Thanking you, in advance, for your contribution to this study.
Kind regards
Riaan Dirkse van Schalkwyk
Page 285
265
PLEASE COMPLETE THE FOLLOWING BY MARKING THE APPROPRIATE BLOCK: Campus you are registered with: Pretoria
Braamfontein
Benoni
Cape Town
Durban
1st year 2nd year Male Female PLEASE COMPLETE THE FOLLOWING BY TYPING YOUR RESPONSE IN THE SPACE PROVIDED: Qualification you are registered for: ____________________________________________ Home language: ____________________________________________
Page 286
266
QUESTIONNAIRE INSTRUCTIONS
Please read the following guidelines and answer ALL the questions below.
The questionnaire requires you to evaluate service quality at the College. Statements
relating to the service quality of the College are provided. Please indicate your
perception of the level of service quality provided, in relation to your expectation of the
level of service quality provided. Remember there are no right or wrong answers.
EXPECTATION
This is the quality of service you expect from the personnel of the College (second
column). Please consider the level of service you would expect for each of the
statements below. If you think a feature requires a very high level of service quality
(strongly agree), mark number 7 in the second column. If you think a feature requires a
very low level of service quality (strongly disagree), mark number 1 in the second
column. If your feelings are less strong, mark a number in between.
PERCEPTION
This is your experience of the service quality that the College provides (third column).
Please use the same 7-point scale to evaluate the level of service quality you experience
by marking the appropriate number in the third column.
Page 287
267
STATEMENT:
My EXPECTATION of the
service quality is:
My PERCEPTION of the
College’s service quality is:
LOW 1 2 3 4 5 6 7 HIGH
LOW 1 2 3 4 5 6 7 HIGH
Tangibles
1. The College has up- to-date equipment.
1 2 3 4 5 6 7 1 2 3 4 5 6 7
2. The College’s physical facilities (e.g. buildings and furniture) are attractive, visually appealing and stylish.
1 2 3 4 5 6 7 1 2 3 4 5 6 7
3. Personnel at the College are well dressed and neat at all times.
1 2 3 4 5 6 7 1 2 3 4 5 6 7
4. The materials of the College (e.g. pamphlets and study material) suit the image of the College.
1 2 3 4 5 6 7 1 2 3 4 5 6 7
Reliability
5. When the College promises to do something by a certain time, it does so.
1 2 3 4 5 6 7 1 2 3 4 5 6 7
6. When students have problems, the personnel of the College are sympathetic and reassuring.
1 2 3 4 5 6 7 1 2 3 4 5 6 7
7. The College is always dependable and provides the service right the first time.
1 2 3 4 5 6 7 1 2 3 4 5 6 7
8. The College provides services at the time it promises to do so.
1 2 3 4 5 6 7 1 2 3 4 5 6 7
9. The College keeps accurate records (e.g. accounts, academic reports, etc.)
1 2 3 4 5 6 7 1 2 3 4 5 6 7
Responsiveness
10. The College tells students when services will be provided.
1 2 3 4 5 6 7 1 2 3 4 5 6 7
11. Students receive fast (prompt) service delivery from the College’s personnel.
1 2 3 4 5 6 7 1 2 3 4 5 6 7
Page 288
268
12. Lecturers at the College are willing to assist students.
1 2 3 4 5 6 7 1 2 3 4 5 6 7
13. Personnel of the College are not too busy to respond promptly to students’ requests.
1 2 3 4 5 6 7 1 2 3 4 5 6 7
Assurance
14. Students can trust the College personnel.
1 2 3 4 5 6 7 1 2 3 4 5 6 7
15. The College personnel inspire confidence.
1 2 3 4 5 6 7 1 2 3 4 5 6 7
16. The College personnel are polite.
1 2 3 4 5 6 7 1 2 3 4 5 6 7
17. Personnel receive adequate support from the College management to improve the provision of their services.
1 2 3 4 5 6 7 1 2 3 4 5 6 7
Empathy
18. Students receive individualised attention from administrative personnel (e.g. doing something extra for students).
1 2 3 4 5 6 7 1 2 3 4 5 6 7
19. Lecturers give the students individual attention.
1 2 3 4 5 6 7 1 2 3 4 5 6 7
20. The College personnel do know what the needs of the students are (e.g. recognising students as customers).
1 2 3 4 5 6 7 1 2 3 4 5 6 7
21. The College personnel have the students’ best interests at heart
1 2 3 4 5 6 7 1 2 3 4 5 6 7
22. The College personnel are easily accessible to students (e.g. easily available to see or to contact by phone, email, etc.).
1 2 3 4 5 6 7 1 2 3 4 5 6 7
Page 289
269
Appendix B: “LPI self”
Page 290
270
II INSTRUCTIONS Type your name in the space provided at the top of the next page. Below your name you will find thirty statements describing various leadership behaviours. Please read each statement carefully, and using the RATING SCALE on the right, ask yourself: “How frequently do I engage in the behaviour described?” When selecting your response to each statement:
• Be realistic about the extent to which you actually engage in the behaviour.
• Be as honest and accurate as you can be.
• DO NOT answer in terms of how you would like to behave or in terms of how you think you should behave.
• DO answer in terms of how you typically behave on most days, on most projects, and with most people.
• Be thoughtful about your responses. For example, giving yourself 10s on all items is most likely not an accurate description of your behaviour. Similarly, giving yourself all 1s or all 5s is most likely not an accurate description either. Most people will do some things more or less often than they do other things.
• If you feel that a statement does not apply to you, it’s probably because you don’t frequently engage in the behaviour. In that case, assign a rating 3 or lower.
For each statement, decide on a response and then record the corresponding number in the square to the right of the statement. After you have responded to all thirty statements, go back through the LPI one more time to make sure you have responded to each statement. Every statement must have a rating. The RATING SCALE runs from 1 to 10. Choose the number that best applies to each statement.
1 = Almost Never 2 = Rarely 3 = Seldom 4 = Once in a While
Page 291
271
5 = Occasionally 6 = Sometimes 7 = Fairly often 8 = Usually 9 = Very Frequently 10 = Almost Always
Your Name: _______________________________________________ To what extent do you typically engage in the following behaviours? Choose the response
number that best applies to each statement and record it in the box to the right of that
statement.
1. I set a personal example of what I expect of others.
2. I talk about future trends that will influence how our work gets done.
3. I seek out challenging opportunities that test my own skills and abilities.
4. I develop cooperative relationships among the people I work with.
5. I praise people for a job well done.
6. I spend time and energy making certain that the people I work with adhere
to the principles and standards that we have agreed on.
7. I describe a compelling image of what our future could be like.
8. I challenge people to try out new and innovative ways to do their work.
9. I actively listen to diverse points of view.
10. I make it a point to let people know about my confidence in their abilities.
11. I follow through on promises and commitments that I make.
12. I appeal to others to share an exciting dream of the future.
Page 292
272
13. I search outside the formal boundaries of my organisation for innovative
ways to improve what we do.
14. I treat others with dignity and respect.
15. I make sure that people are creatively rewarded for their contributions to the success of our projects.
16. I ask for feedback on how my actions affect other people’s performance.
17. I show others how their long-term interests can be realised by enlisting in a common vision.
18. I ask “What can we learn?” when things don’t go as expected.
19. I support the decisions that people make on their own.
20. I publicly recognise people who exemplify commitment to shared values.
21. I build consensus around a common set of values for running our organisation.
22. I paint the “big picture” of what we aspire to accomplish.
23. I make certain that we set achievable goals, make concrete plans, and
establish measurable milestones for the projects and programs that we work on.
24. I give people a great deal of freedom and choice in deciding how to do their work.
25. I find ways to celebrate accomplishments.
26. I am clear about my philosophy of leadership.
27. I speak with genuine conviction about the higher meaning and purpose of
our work.
28. I experiment and take risks, even when there is a chance of failure.
29. I ensure that people grow in their jobs by learning new skills and developing themselves.
30. I give the members of the team lots of appreciation and support for their contributions.
Page 293
273
Appendix C: “LPI observer”
Page 294
Copyright © 2003 James M. Kouzes and Barry Z. Posner. All rights reserved
___________________________________________________________________________________________________
INSTRUCTIONS
You are being asked by the person whose name appears at the top of the next page to
assess his or her leadership behaviours. Below the person’s name you will find thirty
statements describing various leadership behaviours. Please read each statement carefully,
and using the RATING SCALE on the right, ask yourself:
“How frequently does this person engage in the behaviour described?”
When selecting your response to each statement:
• Be realistic about the extent to which this person actually engages in the behaviour.
• Be as honest and accurate as you can be.
• Do NOT answer in terms of how you would like to see this person behave or in terms of
how you think he or she should behave.
• DO answer in terms of how this person typically behaves on most days, on most
projects, and with most people.
• Be thoughtful about your responses. For example, giving this person 10s on all items is
most likely not an accurate description of his or her behaviour. Similarly, giving someone
all 1s or all 5s is most likely not an accurate description either. Most people will do some
things more or less often than they do other things.
• If you feel that a statement does not apply, it’s probably because you don’t see or
experience the behaviour. That means this person does not frequently engage in the
behaviour, at least around you. In that case, assign a rating 3 or lower.
Page 295
Copyright © 2003 James M. Kouzes and Barry Z. Posner. All rights reserved
___________________________________________________________________________________________________
For each statement, decide on a response and then record the corresponding number in
the square to the right of the statement. After you have responded to all thirty statements,
go back through the LPI one more time to make sure you have responded to each
statement. Every statement must have a rating.
The RATING SCALE runs from 1 to 10. Choose the number that best applies to each
statement.
1 = Almost Never 2 = Rarely 3 = Seldom 4 = Once in a While 5 = Occasionally 6 = Sometimes 7 = Fairly often 8 = Usually 9 = Very Frequently 10 = Almost Always
Name of Leader: _______________________________________________ I (the observer) am This Leader’s (Check one): Manager Direct Report
Co-Worker Other To what extent does this leader typically engage in the following behaviours? Choose the
response number that best applies to each statement and record it in the box to the right of
that statement.
Page 296
Copyright © 2003 James M. Kouzes and Barry Z. Posner. All rights reserved
___________________________________________________________________________________________________
He or She:
1. Sets a personal example of what he/she expects of others.
2. Talks about future trends that will influence how our work gets done.
3. Seeks out challenging opportunities that tests his/her own skills and abilities.
4. Develops cooperative relationships among the people he/she works with.
5. Praises people for a job well done.
6. Spends time and energy making certain that the people he/she works with
adhere to the principles and standards that we have agreed on.
7. Describes a compelling image of what our future could be like.
8. Challenges people to try out new and innovative ways to do their work.
9. Actively listens to diverse points of view.
10. Makes it a point to let people know about his/her confidence in their abilities.
11. Follows through on promises and commitments he/she makes.
12. Appeals to others to share an exciting dream of the future.
13. Searches outside the formal boundaries of his/her organisation for
innovative ways to improve what we do.
14. Treats others with dignity and respect.
15. Makes sure that people are creatively rewarded for their contributions to
the success of projects.
16. Asks for feedback on how his/her actions affect other people’s
performance.
17. Shows others how their long-term interests can be realised by enlisting in
a common vision.
18. Asks “What can we learn?” when things don’t go as expected.
19. Supports the decisions that people make on their own.
Page 297
Copyright © 2003 James M. Kouzes and Barry Z. Posner. All rights reserved
___________________________________________________________________________________________________
20. Publicly recognises people who exemplify commitment to shared values.
21. Builds consensus around a common set of values for running our organisation.
22. Paints the “big picture” of what we aspire to accomplish.
23. Makes certain that we set achievable goals, make concrete plans, and
establish measurable milestones for the projects and programs that we work on.
24. Gives people a great deal of freedom and choice in deciding how to do their work.
25. Finds ways to celebrate accomplishments.
26. Is clear about his/her philosophy of leadership.
27. Speaks with genuine conviction about the higher meaning and purpose of our work.
28. Experiments and takes risks, even when there is a chance of failure.
29. Ensures that people grow in their jobs by learning new skills and developing themselves.
30. Gives the members of the team lots of appreciation and support for their contributions.
Page 298
278
Appendix D: Leadership Practices Inventory (LPI) invitation letter
Page 299
279
Leadership Practices Inventory (LPI) invitation letter: the College
(Campus name)
Dear (Principal’s name),
As you may know, you have been selected to participate in a Leadership Practices
Inventory (LPI) research survey. As part of the survey, you, and several people who
have directly observed you in a leadership role, will be asked to complete an LPI
questionnaire. This questionnaire has been used in leadership assessment and
development programmes for more than 20 years. The LPI, which was developed by Jim
Kouzes and Barry Posner, will be used to produce a 360-degree feedback report that will
be used to assess your leadership behaviours. It does not measure your IQ, personality,
style and/or general management skills.
There are two types of LPI questionnaires; an “LPI self” form and an “LPI observer” form.
You will be given a “LPI self” form to complete. The “LPI observer” form will be
distributed to a group of eight other people who work with you. They are the people who
observe you directly in your leadership role. This group includes your manager, people
who report directly to you, co-workers and others who have directly observed your
leadership behaviours, such as vice-principals, HoDs, lecturers and administrative staff.
Your name will appear on the “LPI observer” form in the space marked “leader”, at the
top of the LPI questionnaire page. The observer’s relationship to you will be indicated as:
“manager”, “direct report”, “co-worker” or “other”. It is the individual’s relationship to you
that is key. For example, “manager” will be selected only for someone who is your line
manager. “Direct report” will be selected only for people who report to you.
To protect your observers’ anonymity, their names WILL NOT appear on their response
sheets. Furthermore, you will know the observer category from which the feedback
comes. However, feedback will be elicited from at least two or three people in each
category, except your manager. If only one form marked “direct report” is received, for
example, that individual’s feedback will be grouped with “other observers” in order to
protect his or her anonymity.
Page 300
280
You need to assure your observers that their responses will be completely confidential.
In addition, you should inform them of the following:
• They are participating in a leadership assessment research survey and would
appreciate their feedback on your leadership behaviours.
• Their responses will be completely confidential.
• For the process to work properly, they must respond to each item on the form
and fill in every space on the form.
• They should not write their names on the questionnaire – the scores are
calculated by category.
• The completed questionnaires must be submitted no later than 28/02/2010.
You need to complete the “LPI self” questionnaire. Ensure that you fill in every space.
Please complete and submit the questionnaire no later than 28/02/2010.
I trust you will find the LPI both an interesting and valuable process. Please let me know
if you have any questions.
Sincerely,
Riaan Dirkse van Schalkwyk
Page 301
281
Appendix E: Campus 1 – the five practices data summary
Page 303
283
Appendix F: Campus 2 – the five practices data summary
Page 305
285
Appendix G: Campus 3 – the five practices data summary
Page 307
287
Appendix H: Campus 4 – the five practices data summary
Page 309
289
Appendix I: Campus 5 – the five practices data summary
Page 311
291
Appendix J: Programme enrolled for and year of study
Page 312
292
Programme enrolled for and year of study
Campus 1 Campus 2 Campus 3 Campus 4 Campus 5 Total
Computer Technical Support
0 1 0 0 4 5
.0% .4% .0% .0% 3.3% .5%
Construction and Engineering Drafting
0 17 0 6 8 31
.0% 6.2% .0% 4.1% 6.7% 3.2%
Secretarial Studies 6 0 10 12 0 28
5.8% .0% 3.0% 8.2% .0% 2.9%
Office and Computing Studies 0 23 14 9 8 54
.0% 8.4% 4.2% 6.2% 6.7% 5.5%
Accounting and Financial Computing 1
st year
7 1 0 0 0 8
6.7% .4% .0% .0% .0% .8%
Accounting and Financial Computing 2
nd year
10 28 25 0 1 64
9.6% 10.2% 7.5% .0% .8% 6.6%
Advertising Management 1st year
0 0 2 0 0 2
.0% .0% .6% .0% .0% .2%
Advertising Management 2nd year
0 0 0 0 0 0
.0% .0% .0% .0% .0% .0%
Business Information Technology 1st year
0 1 1 0 8 10
.0% .4% .3% .0% 6.7% 1.0%
Business Information Technology 2nd year
0 0 0 0 7 7
.0% .0% .0% .0% 5.8% .7%
Business Management 1st year
17 40 115 82 48 302
16.3% 14.6% 34.5% 56.2% 40.0% 30.9%
Business Management 2nd year
4 1 4 0 0 9
3.8% .4% 1.2% .0% .0% .9%
Graphic Design and Web Development 1
st year
16 0 23 7 5 51
15.4% .0% 6.9% 4.8% 4.2% 5.2%
Graphic Design and Web Development 2
nd year
3 0 11 0 5 19
2.9% .0% 3.3% .0% 4.2% 1.9%
Page 313
293
Internet Engineering 1st year
1 27 36 18 8 90
1.0% 9.9% 10.8% 12.3% 6.7% 9.2%
Internet Engineering 2nd year
4 31 1 0 5 41
3.8% 11.3% .3% .0% 4.2% 4.2%
Journalism 1st year
7 50 0 0 0 57
6.7% 18.2% .0% .0% .0% 5.8%
Journalism 2nd year
2 2 0 0 0 4
1.9% .7% .0% .0% .0% .4%
Programming 1st year
12 8 28 0 5 53
11.5% 2.9% 8.4% .0% 4.2% 5.4%
Programming 2nd year
7 18 16 12 2 55
6.7% 6.6% 4.8% 8.2% 1.7% 5.6%
Sport Management 1st year
0 0 24 0 6 30
.0% .0% 7.2% .0% 5.0% 3.1%
Sport Management 2nd year
0 0 0 0 0 0
.0% .0% .0% .0% .0% .0%
Tourism and Tour Operations 1st
year
2 0 0 0 0 2
1.9% .0% .0% .0% .0% .2%
Tourism and Tour Operations 2nd
year
0 0 0 0 0 0
.0% .0% .0% .0% .0% .0%
Hotel Management 1st year
0 0 0 0 0 0
.0% .0% .0% .0% .0% .0%
Hotel Management 2nd year
0 0 0 0 0 0
.0% .0% .0% .0% .0% .0%
Beauty Therapy 1st year
0 0 0 0 0 0
.0% .0% .0% .0% .0% .0%
Beauty Therapy 2nd year
0 0 0 0 0 0
.0% .0% .0% .0% .0% .0%
Public Relations 1st year
0 26 23 0 0 49
.0% 9.5% 6.9% .0% .0% 5.0%
Page 314
294
Public Relations 2nd year
0 0 0 0 0 0
.0% .0% .0% .0% .0% .0%
Public Relations 3rd year
0 0 0 0 0 0
.0% .0% .0% .0% .0% .0%
Marketing Management 1st year
0 0 0 0 0 0
.0% .0% .0% .0% .0% .0%
Marketing Management 2nd year
6 0 0 0 0 6
5.8% .0% .0% .0% .0% .6%
Marketing Management 3rd year
0 0 0 0 0 0
.0% .0% .0% .0% .0% .0%
Total 104 274 333 146 120 977
100.0% 100.0% 100.0% 100.0% 100.0% 100.0%
Page 315
295
Appendix K: Service quality expectation
Page 316
296
Service quality expectation
1 2 3 4 5 6 7 Total
Tangibles
E_TAN1 The College has up-to-date equipment
193 112 154 199 164 63 98 983
19.6% 11.4% 15.7% 20.2% 16.7% 6.4% 10.0%
E_TAN2 The College’s physical facilities (e.g.
buildings and furniture) are attractive, visually
appealing and stylish
203 177 164 159 118 80 78 979
20.7% 18.1% 16.8% 16.2% 12.1% 8.2% 8.0%
E_TAN3 The College personnel are well
dressed and neat at all times
82 87 115 152 157 181 201 975
8.4% 8.9% 11.8% 15.6% 16.1% 18.6% 20.6%
E_TAN4 The materials of the College (e.g.
pamphlets and study material) suit the image of
the College
152 100 117 161 162 125 156 973
15.6% 10.3% 12.0% 16.5% 16.6% 12.8% 16.0%
Reliability
E_REL5 When the College promises to do
something by a certain time, it does so
303 132 127 121 112 70 102 967
31.3% 13.7% 13.1% 12.5% 11.6% 7.2% 10.5%
E_REL6 When students have problems, the
College personnel are sympathetic and
reassuring
186 128 148 186 139 90 94 971
19.2% 13.2% 15.2% 19.2% 14.3% 9.3% 9.7%
E_REL7 The College is always dependable and
provides the service right the first time
208 137 158 163 143 83 77 969
21.5% 14.1% 16.3% 16.8% 14.8% 8.6% 7.9%
E_REL8 The College provides services at the
time it promises to do so
257 148 126 158 114 70 97 970
26.5% 15.3% 13.0% 16.3% 11.8% 7.2% 10.0%
E_REL9 The College keeps accurate records
(e.g. accounts, academic reports, etc.)
157 73 108 128 142 128 242 978
16.1% 7.5% 11.0% 13.1% 14.5% 13.1% 24.7%
Responsiveness
E_RES10 The College tells students when
services will be rendered
120 81 125 148 151 137 204 966
12.4% 8.4% 12.9% 15.3% 15.6% 14.2% 21.1%
E_RES11 Students receive fast (prompt)
service delivery from the College personnel
201 140 152 166 127 89 95 970
20.7% 14.4% 15.7% 17.1% 13.1% 9.2% 9.8%
E_RES12 Lecturers at the College are willing to
assist students
79 54 90 134 177 188 241 963
8.2% 5.6% 9.3% 13.9% 18.4% 19.5% 25.0%
Page 317
297
E_RES13 The College personnel are not too
busy to respond to students’ requests promptly
177 142 160 162 154 90 89 974
18.2% 14.6% 16.4% 16.6% 15.8% 9.2% 9.1%
Assurance
E_ASS14 Students can trust the College
personnel
169 106 136 172 158 112 118 971
17.4% 10.9% 14.0% 17.7% 16.3% 11.5% 12.2%
E_ASS15 The College personnel inspire
confidence
119 124 166 194 148 114 103 968
12.3% 12.8% 17.1% 20.0% 15.3% 11.8% 10.6%
E_ASS16 The College personnel are polite 138 112 142 194 161 104 119 970
14.2% 11.5% 14.6% 20.0% 16.6% 10.7% 12.3%
E_ASS17 Personnel receive adequate support
from the College management to improve the
provision of their services
122 130 155 214 166 93 87 967
12.6% 13.4% 16.0% 22.1% 17.2% 9.6% 9.0%
Empathy
E_EMP18 Students receive individualised
attention from administrative personnel (e.g.
doing something extra for students)
169 138 138 157 147 101 119 969
17.4% 14.2% 14.2% 16.2% 15.2% 10.4% 12.3%
E_EMP19 Lecturers give students
individualised attention
127 93 115 168 163 156 145 967
13.1% 9.6% 11.9% 17.4% 16.9% 16.1% 15.0%
E_EMP20 The College personnel do know what
the needs of the students are (e.g. recognising
students as customers)
190 128 132 170 160 99 85 964
19.7% 13.3% 13.7% 17.6% 16.6% 10.3% 8.8%
E_EMP21 The College personnel have the
students’ best interests at heart
177 130 163 182 149 86 77 964
18.4% 13.5% 16.9% 18.9% 15.5% 8.9% 8.0%
E_EMP22 The College personnel are easily
accessible to students (e.g. easily available to
see or to contact by phone, email, etc.)
149 108 138 145 126 131 178 975
15.3% 11.1% 14.2% 14.9% 12.9% 13.4% 18.3%
Page 318
298
Appendix L: Service quality perception
Page 319
299
Service quality perception
1 2 3 4 5 6 7 Total
Tangibles
P_TAN1 The College has up-to-date equipment 216 125 127 160 126 76 100 930
23.2% 13.4% 13.7% 17.2% 13.5% 8.2% 10.8%
P_TAN2 The College’s physical facilities (e.g.
buildings and furniture) are attractive, visually
appealing and stylish
186 145 168 157 101 76 74 907
20.5% 16.0% 18.5% 17.3% 11.1% 8.4% 8.2%
P_TAN3 The College personnel are well
dressed and neat at all times
121 86 119 128 154 112 167 887
13.6% 9.7% 13.4% 14.4% 17.4% 12.6% 18.8%
P_TAN4 The materials of the College (e.g.
pamphlets and study material) suit the image of
the College
145 110 129 145 149 89 108 875
16.6% 12.6% 14.7% 16.6% 17.0% 10.2% 12.3%
Reliability
P_REL5 When the College promises to do
something by a certain time, it does so
217 112 131 135 123 76 75 869
25.0% 12.9% 15.1% 15.5% 14.2% 8.7% 8.6%
P_REL6 When students have problems, the
College personnel are sympathetic and
reassuring
174 131 125 168 109 87 72 866
20.1% 15.1% 14.4% 19.4% 12.6% 10.0% 8.3%
P_REL7 The College is always dependable and
provides the service right the first time
178 138 141 144 121 70 78 870
20.5% 15.9% 16.2% 16.6% 13.9% 8.0% 9.0%
P_REL8 The College provides services at the
time it promises to do so
213 139 121 143 100 58 90 864
24.7% 16.1% 14.0% 16.6% 11.6% 6.7% 10.4%
P_REL9 The College keeps accurate records
(e.g. accounts, academic reports, etc.)
136 87 127 131 103 105 181 870
15.6% 10.0% 14.6% 15.1% 11.8% 12.1% 20.8%
Responsiveness
P_RES10 The College tells students when
services will be rendered
150 119 120 138 118 101 128 874
17.2% 13.6% 13.7% 15.8% 13.5% 11.6% 14.6%
P_RES11 Students receive fast (prompt)
service delivery from the College personnel
173 122 153 155 119 69 75 866
20.0% 14.1% 17.7% 17.9% 13.7% 8.0% 8.7%
P_RES12 Lecturers at the College are willing to
assist students
106 92 115 132 140 119 167 871
12.2% 10.6% 13.2% 15.2% 16.1% 13.7% 19.2%
Page 320
300
P_RES13 The College personnel are not too
busy to respond promptly to students’ requests
165 120 133 162 143 77 74 874
18.9% 13.7% 15.2% 18.5% 16.4% 8.8% 8.5%
Assurance
P_ASS14 Students can trust the College
personnel
164 113 137 158 120 87 87 866
18.9% 13.0% 15.8% 18.2% 13.9% 10.0% 10.0%
P_ASS15 The College personnel inspire
confidence
132 114 141 178 113 102 91 871
15.2% 13.1% 16.2% 20.4% 13.0% 11.7% 10.4%
P_ASS16 The College personnel are polite 141 117 138 168 119 94 94 871
16.2% 13.4% 15.8% 19.3% 13.7% 10.8% 10.8%
P_ASS17 Personnel receive adequate support
from the College management to improve the
performance of their services
131 127 147 173 139 78 81 876
15.0% 14.5% 16.8% 19.7% 15.9% 8.9% 9.2%
Empathy
P_EMP18 Students receive individualised
attention from administrative personnel (e.g.
doing something extra for students)
164 115 148 145 112 102 94 880
18.6% 13.1% 16.8% 16.5% 12.7% 11.6% 10.7%
P_EMP19 Lecturers give students
individualised attention
133 85 110 161 120 127 129 865
15.4% 9.8% 12.7% 18.6% 13.9% 14.7% 14.9%
P_EMP20 The College personnel do know what
the needs of the students are (e.g. recognising
students as customers)
173 117 133 133 130 99 94 879
19.7% 13.3% 15.1% 15.1% 14.8% 11.3% 10.7%
P_EMP21 The College personnel have the
students’ best interests at heart
180 112 137 156 116 81 93 875
20.6% 12.8% 15.7% 17.8% 13.3% 9.3% 10.6%
P_EMP22 The College personnel are easily
accessible to students (e.g. easily available to
see or contact by phone, email, etc.)
153 111 132 141 106 109 141 893
17.1% 12.4% 14.8% 15.8% 11.9% 12.2% 15.8%
Page 321
301
Appendix M: Gap analysis of all campuses across all dimensions
Page 322
302
Gap analysis of all campuses across all dimensions
PROC MEANS variables
OVERALL Q* = P* – E*
Valid
N Gap
score Valid N
Mean Valid
N Mean
1. The College has up-to-date equipment
929 -0.1011 930 3.5194 983 3.6205
2. The College’s physical facilities (e.g. buildings and furniture) are attractive, visually appealing and stylish
904 0.0317 907 3.4035 979 3.3718
3. The College personnel are well dressed and neat at all times
881 -0.3484 887 4.2537 975 4.6021
4. The materials of the College (e.g. pamphlets and study material) suit the image of the College
868 -0.2620 875 3.8480 973 4.1100
5. When the College promises to do something by a certain time, it does so
859 0.1850 869 3.4177 967 3.2327
6. When students have problems, the College personnel are sympathetic and reassuring
856 -0.1016 866 3.5266 971 3.6282
7. The College is always dependable and provides the service right the first time
862 0.0084 870 3.4759 969 3.4675
8. The College provides services at the time it promises to do so
858 0.0291 864 3.3611 970 3.3320
9. The College keeps accurate records accurately (e.g. accounts, academic reports, etc.)
867 -0.2390 870 4.1690 978 4.4080
10. The College tells students when services will be rendered
864 -0.5227 874 3.8810 966 4.4037
11. Students receive fast (prompt) service delivery from the College personnel
859 -0.0424 866 3.4988 970 3.5412
12. Lecturers at the College are willing to assist students
862 -0.5725 871 4.3008 963 4.8733
13. The College personnel are not too busy to respond promptly to students’ requests
869 -0.0153 874 3.6007 974 3.6160
14. Students can trust the College personnel
859 -0.2238 866 3.6536 971 3.8774
15. The College personnel inspire confidence
860 -0.1121 871 3.7991 968 3.9112
16. The College personnel are polite
862 -0.1808 871 3.7635 970 3.9443
17. Personnel receive adequate support from the College management to improve the performance of their services
866 -0.1185 876 3.7078 967 3.8263
18. Students receive individualised attention from administrative personnel (e.g. doing something extra for students)
872 -0.0872 880 3.6909 969 3.7781
19. Lecturers gives students individualised attention
856 -0.1410 865 4.0948 967 4.2358
20. The College personnel do know what the needs of the students are (e.g. recognising students as customers)
864 0.0439 879 3.6860 964 3.6421
21. The College personnel have the students’ best interest sat heart
862 0.0239 875 3.6069 964 3.5830
22. The College personnel are easily accessible to students (e.g. easily available to see or to contact by phone, email, etc.)
884 -0.1980 893 3.9261 975 4.1241
Page 323
303
Appendix N: Gap analysis of all dimensions across Campus 1
Page 324
304
Gap analysis of all dimensions across Campus 1
PROC MEANS variables
CAMPUS 1 Q* = P* – E*
Valid
N Gap
score Valid N
Mean Valid
N Mean
1. The College has up-to-date equipment
96 0.0184 96 3.2396 104 3.2212
2. The College’s physical facilities (e.g. buildings and furniture) are attractive, visually appealing and stylish
93 0.0951 93 3.1720 104 3.0769
3. The College personnel are well dressed and neat at all times
91 -0.3915 92 4.1522 103 4.5437
4. The materials of the College (e.g. pamphlets and study material) suit the image of the College
89 -0.3290 89 3.8652 103 4.1942
5. When the College promises to do something by a certain time, it does so
90 0.4340 90 3.3667 104 2.9327
6. When students have problems, the College personnel are sympathetic and reassuring
88 -0.1556 88 3.7386 104 3.8942
7. The College is always dependable and renders the service right the first time
88 0.0127 88 3.4205 103 3.4078
8. The College provides services at the time it promises to do so
89 0.0742 89 3.3146 104 3.2404
9. The College keeps accurate records (e.g. accounts, academic reports, etc.)
88 -0.2517 88 4.1136 104 4.3654
10. The College tells students when services will be rendered
91 -0.2610 91 3.8352 104 4.0962
11. Students receive fast (prompt) service delivery from the College personnel
88 0.2073 88 3.5568 103 3.3495
12. Lecturers at the College are willing to assist students
89 -0.6005 89 4.1348 102 4.7353
13. Personnel of the College are not too busy to respond promptly to students’ requests
90 0.4658 90 3.8889 104 3.4231
14. Students can trust the College personnel
91 -0.1084 91 3.7363 103 3.8447
15. The College personnel inspire confidence
89 0.0738 89 4.0449 104 3.9712
16. The College personnel are polite
91 -0.0014 91 4.1429 104 4.1442
17. Personnel receive adequate support from the College management to improve the provision of their services
88 0.0400 89 3.7753 102 3.7353
18. Students receive individualised attention from administrative personnel (e.g. doing something extra for students)
91 -0.0884 91 3.8242 103 3.9126
19. Lecturers give students individualised attention
89 -0.0686 89 4.1910 104 4.2596
20. The College personnel do know what the needs of the students are (e.g. recognising students as customers)
90 0.1349 91 3.8242 103 3.6893
21. The College personnel have the students’ best interests at heart
89 0.1486 89 3.6966 104 3.5481
22. The College personnel are easily accessible to students (e.g. easily available to see or to contact by phone, email, etc.)
92 -0.0322 92 4.3043 104 4.3365
SQI -0.03
Page 325
305
Appendix O: Gap analysis of all dimensions across Campus 2
Page 326
306
Gap analysis of all dimensions across Campus 2
PROC MEANS variables
CAMPUS 2 Q* = P* – E*
Valid
N Gap
score Valid N
Mean Valid
N Mean
1. The College has up-to-date equipment
260 -0.1116 260 3.2615 276 3.3732
2. The College’s physical facilities (e.g. buildings and furniture) are attractive, visually appealing and stylish
252 0.1399 252 3.2381 275 3.0982
3. Personnel at the College are well dressed and neat at all times
248 -0.3016 248 4.2984 275 4.6000
4. The materials of the College (e.g. pamphlets and study material) suit the image of the College
247 -0.3157 248 3.6734 274 3.9891
5. When the College promises to do something by a certain time, it does so
240 0.2724 243 3.3169 270 3.0444
6. When students have problems, the College personnel are sympathetic and reassuring
243 0.0606 244 3.4672 273 3.4066
7. The College is always dependable and provides the service right the first time
241 0.0868 244 3.3893 271 3.3026
8. The College provides services at the time it promises to do so
245 0.0829 245 3.2367 273 3.1538
9. The College keeps accurate records (e.g. accounts, academic reports, etc.)
245 -0.2507 245 4.3020 275 4.5527
10. The College tells students when services will be rendered
243 -0.5967 244 3.9344 273 4.5311
11. Students receive fast (prompt) service delivery from the College personnel
245 -0.0292 246 3.5569 273 3.5861
12. Lecturers at the College are willing to assist students
239 -0.6336 240 4.4708 268 5.1045
13. The College personnel are not too busy to respond promptly to students’ requests
248 -0.0531 248 3.5000 273 3.5531
14. Students can trust the College personnel
245 -0.2971 245 3.6000 272 3.8971
15. The College personnel inspire confidence
243 -0.1905 245 3.7429 270 3.9333
16. The College personnel are polite
246 -0.1437 246 3.6951 273 3.8388
17. Personnel receive adequate support from the College management to improve the provision of their services
245 -0.1439 247 3.7085 271 3.8524
18. Students receive individualised attention from administrative personnel (e.g. doing something extra for students)
249 -0.0511 250 3.7320 272 3.7831
19. Lecturers gives students individualised attention
244 -0.1756 245 4.2082 271 4.3838
20. The College personnel do know what the needs of the students are (e.g. recognising students as customers)
248 0.0861 250 3.7120 270 3.6259
21. The College personnel have the students’ best interests at heart
246 0.0442 250 3.5920 272 3.5478
22. The College personnel are easily accessible to students (e.g. easily available to see or to contact by phone, email, etc.)
248 -0.0908 251 3.9641 273 4.0549
SQI -0.12
Page 327
307
Appendix P: Gap analysis of all dimensions across Campus 3
Page 328
308
Gap analysis of all dimensions across Campus 3
PROC MEANS variables
CAMPUS 3 Q* = P* – E*
Valid
N Gap
score Valid N
Mean Valid
N Mean
1. The College has up-to-date equipment
323 -0.1360 324 3.5864 335 3.7224
2. The College’s physical facilities (e.g. buildings and furniture) are attractive, visually appealing and stylish
314 0.0277 317 3.5773 333 3.5495
3. The College personnel are well dressed and neat at all times
307 -0.4123 310 4.3581 331 4.7704
4. The materials of the College (e.g. pamphlets and study material) suit the image of the College
302 -0.2316 306 3.9739 331 4.2054
5. When the College promises to do something by a certain time, it does so
304 0.1909 307 3.2997 331 3.1088
6. When students have problems, the College personnel are sympathetic and reassuring
304 0.0182 309 3.4563 331 3.4381
7. The College is always dependable and provides the service right the first time
307 0.0467 310 3.4323 332 3.3855
8. The College provides services at the time it promises to do so
307 0.1810 310 3.3290 331 3.1480
9. The College keeps accurate records (e.g. accounts, academic reports, etc.)
307 -0.1935 310 4.1710 332 4.3645
10. The College tells students when services will be rendered
307 -0.4973 310 3.9452 330 4.4424
11. Students receive fast (prompt) service delivery from the College personnel
305 0.0138 311 3.3087 329 3.2948
12. Lecturers at the College are willing to assist students
307 -0.6031 313 4.3450 328 4.9482
13. The College personnel are not too busy to respond promptly to students’ requests
306 -0.0677 310 3.5323 330 3.6000
14. Students can trust the College personnel
301 -0.2225 306 3.6078 330 3.8303
15. The College personnel inspire confidence
304 -0.0163 311 3.8617 328 3.8780
16. The College personnel are polite
303 -0.2292 309 3.7282 328 3.9573
17. Personnel receive adequate support from the College management to improve the provision of their services
305 -0.0769 310 3.7097 328 3.7866
18. Students receive individualised attention from administrative personnel (e.g. doing something extra for students)
304 -0.0777 309 3.6052 328 3.6829
19. Lecturers gives students individualised attention
303 -0.1306 308 4.0584 328 4.1890
20. The College personnel do know what the needs of the students are (e.g. recognising students as customers)
303 0.0496 311 3.5756 327 3.5260
21. The College personnel have the students’ best interests at heart
303 0.0024 310 3.4871 326 3.4847
22. The College personnel are easily accessible to students (e.g. easily available to see or to contact by phone, email, etc.)
312 -0.2293 317 3.8644 331 4.0937
SQI -0.11
Page 329
309
Appendix Q: Gap analysis of all dimensions across Campus 4
Page 330
310
Gap analysis of all dimensions across Campus 4
PROC MEANS variables
CAMPUS 4 Q* = P* – E*
Valid
N Gap
score Valid N
Mean Valid
N Mean
1. The College has up-to-date equipment
142 -0.0484 142 3.9718 148 4.0203
2. The College’s physical facilities (e.g. buildings and furniture) are attractive, visually appealing and stylish
140 -0.0876 140 3.6286 148 3.7162
3. The College personnel are well dressed and neat at all times
136 -0.2982 137 4.1168 147 4.4150
4. The materials of the College (e.g. pamphlets and study material) suit the image of the College
131 -0.4212 132 3.9394 147 4.3605
5. When the College promises to do something by a certain time, it does so
127 -0.0379 129 3.9070 145 3.9448
6. When students have problems, the College personnel are sympathetic and reassuring
126 -0.5451 129 3.7674 144 4.3125
7. The College is always dependable and provides the service right the first time
129 -0.1089 131 3.8702 144 3.9792
8. The College provides services at the time it promises to do so
124 -0.3056 126 3.7778 144 4.0833
9. The College keeps accurate records (e.g. accounts, academic reports, etc.)
130 -0.1741 130 4.2000 147 4.3741
10. The College tells students when services will be rendered
124 -0.5983 130 3.8769 141 4.4752
11. Students receive fast (prompt) service delivery from the College personnel
126 -0.3184 126 3.8254 146 4.1438
12. Lecturers at the College are willing to assist students
129 -0.0947 130 4.3231 146 4.4178
13. The College personnel are not too busy to respond to students’ requests promptly
128 -0.0873 129 3.9535 147 4.0408
14. Students can trust the College personnel
124 -0.1669 126 4.0317 146 4.1986
15. The College personnel inspire confidence
128 -0.2797 130 3.8231 146 4.1027
16. The College personnel are polite
125 -0.3738 128 3.9297 145 4.3034
17. Personnel receive adequate support from the College management to improve the provision of their services
130 -0.1569 132 3.8636 146 4.0205
18. Students receive individualised attention from administrative personnel (e.g. doing something extra for students)
129 -0.0890 131 4.0000 146 4.0890
19. Lecturers give students individualised attention
125 -0.0217 128 4.2422 144 4.2639
20. The College personnel do know what the needs of the students are (e.g. recognising students as customers)
124 -0.2283 128 3.9453 144 4.1736
21. The College personnel have the students’ best interests at heart
129 -0.0542 131 4.0153 144 4.0694
22. The College personnel are easily accessible to students (e.g. easily available to see or contact by phone, email, etc.)
133 -0.1604 134 4.1866 147 4.3469
SQI -0.21
Page 331
311
Appendix R: Gap analysis of all dimensions across Campus 5
Page 332
312
Gap analysis of all dimensions across Campus 5
PROC MEANS variables
CAMPUS 5 Q* = P* – E*
Valid
N Gap
score Valid N
Mean Valid
N Mean
1. The College has up-to-date equipment
108 -0.1657 108 3.5926 120 3.7583
2. The College’s physical facilities (e.g. buildings and furniture) are attractive, visually appealing and stylish
105 -0.1552 105 3.1810 119 3.3361
3. The College personnel are well dressed and neat at all times
99 -0.3202 100 4.1000 119 4.4202
4. The materials of the College (e.g. pamphlets and study material) suit the image of the College
99 0.0227 100 3.7600 118 3.7373
5. When the College promises to do something by a certain time, it does so
98 0.0383 100 3.4400 117 3.4017
6. When students have problems, the College personnel are sympathetic and reassuring
95 -0.2196 96 3.3854 119 3.6050
7. The College is always dependable and provides the service right the first time
97 -0.1537 97 3.3505 119 3.5042
8. The College provides services at the time it promises to do so
93 -0.1471 94 3.2766 118 3.4237
9. The College keeps accurate records (e.g. accounts, academic reports, etc.)
97 -0.4399 97 3.8351 120 4.2750
10. The College tells students when services will be rendered
99 -0.5905 99 3.5960 118 4.1864
11. Students receive fast (prompt) service delivery from the College personnel
95 -0.0620 95 3.4842 119 3.5462
12. Lecturers at the College are willing to assist students
98 -0.9548 99 3.8687 119 4.8235
13. The College personnel are not too busy to respond promptly to students’ requests
97 -0.1098 97 3.3402 120 3.4500
14. Students can trust the College personnel
98 -0.2327 98 3.3673 120 3.6000
15. The College personnel inspire confidence
96 -0.1875 96 3.4792 120 3.6667
16. The College personnel are polite
97 -0.0674 97 3.4742 120 3.5417
17. Personnel receive adequate support from the College management to improve the provision of their services
98 -0.2881 98 3.4286 120 3.7167
18. Students receive individualised attention from administrative personnel (e.g. doing something extra for students)
99 -0.2101 99 3.3232 120 3.5333
19. Lecturers give students individualised attention
95 -0.3434 95 3.6316 120 3.9750
20. The College personnel do know what the needs of the students are (e.g. recognising students as customers)
99 0.1884 99 3.5051 120 3.3167
21. The College personnel have the students’ best interests at heart
95 0.0166 95 3.3895 118 3.3729
22. The College personnel are easily accessible to students (e.g. easily available to see or contact by phone, email, etc.)
99 -0.5851 99 3.3232 120 3.9083
SQI -0.23
Page 333
313
Appendix S: Mean and standard deviation
Page 334
314
Mean and standard deviation
Mean and standard deviation – all campuses
Overall Perceptions Expectations
Valid
N Mean SD
Valid N
Mean SD
1. The College has up-to-date equipment
930 3.5194 1.9920 983 3.6205 1.8867
2. The College’s physical facilities (e.g. buildings and furniture) are attractive, visually appealing and stylish
907 3.4035 1.8706 979 3.3718 1.8789
3. The College personnel are well dressed and neat at all times
887 4.2537 2.0157 975 4.6021 1.9058
4. The materials of the College (e.g. pamphlets and study material) suit the image of the College
875 3.8480 1.9522 973 4.1100 2.0131
5. When the College promises to do something by a certain time, it does so
869 3.4177 1.9614 967 3.2327 2.0659
6. When students have problems, the College personnel are sympathetic and reassuring
866 3.5266 1.9010 971 3.6282 1.9117
7. The College is always dependable and provides the service right the first time
870 3.4759 1.9066 969 3.4675 1.8937
8. The College provides services at the time it promises to do so
864 3.3611 1.9800 970 3.3320 1.9972
9. The College keeps accurate records (e.g. accounts, academic reports, etc.)
870 4.1690 2.0983 978 4.4080 2.1419
10. The College tells students when services will be rendered
874 3.8810 2.0328 966 4.4037 2.0120
11. Students receive fast (prompt) service delivery from the College personnel
866 3.4988 1.8779 970 3.5412 1.9421
12. Lecturers at the College are willing to assist students
871 4.3008 1.9992 963 4.8733 1.8746
13. The College personnel are not too busy to respond promptly to students’ requests
874 3.6007 1.8770 974 3.6160 1.8945
14. Students can trust the College personnel
866 3.6536 1.9270 971 3.8774 1.9621
15. The College personnel inspire confidence
871 3.7991 1.8846 968 3.9112 1.8351
16. The College personnel are polite
871 3.7635 1.9080 970 3.9443 1.8943
17. Personnel receive adequate support from the College management to improve the provision of their services
876 3.7078 1.8328 967 3.8263 1.7812
18. Students receive individualised attention from administrative personnel (e.g. doing something extra for students)
880 3.6909 1.9569 969 3.7781 1.9775
19. Lecturers give students individualised attention
865 4.0948 1.9919 967 4.2358 1.9487
20. The College personnel do know what the needs of the students are (e.g. recognising students as customers)
879 3.6860 1.9804 964 3.6421 1.9204
21. The College personnel have the students’ best interests at heart
875 3.6069 1.9568 964 3.5830 1.8496
22. The College personnel are easily accessible to students (e.g. easily available to see or to contact by phone, email, etc.)
893 3.9261 2.0529 975 4.1241 2.0637
Page 335
315
Mean and standard deviation – Campus 1
Campus 1 Perceptions Expectations
Valid
N Mean SD
Valid N
Mean SD
1. The College has up-to-date equipment
96 3.2396 1.8680 104 3.2212 1.7346
2. The College’s physical facilities (e.g. buildings and furniture) are attractive, visually appealing and stylish
93 3.1720 1.7422 104 3.0769 1.7275
3. The College personnel are well dressed and neat at all times
92 4.1522 1.8092 103 4.5437 1.7137
4. The materials of the College (e.g. pamphlets and study material) suit the image of the College
89 3.8652 1.9081 103 4.1942 1.9954
5. When the College promises to do something by a certain time, it does so
90 3.3667 1.8870 104 2.9327 1.9522
6. When students have problems, the College personnel are sympathetic and reassuring
88 3.7386 1.9797 104 3.8942 1.8743
7. The College is always dependable and provides the service right the first time
88 3.4205 1.9222 103 3.4078 1.8705
8. The College provides services at the time it promises to do so
89 3.3146 1.8925 104 3.2404 1.9583
9. The College keeps accurate records (e.g. accounts, academic reports, etc.)
88 4.1136 2.0978 104 4.3654 2.1991
10. The College tells students when services will be rendered
91 3.8352 2.0070 104 4.0962 2.0740
11. Students receive fast (prompt) service delivery from the College personnel
88 3.5568 1.9408 103 3.3495 1.8928
12. Lecturers at the College are willing to assist students
89 4.1348 1.8961 102 4.7353 1.8928
13. The College personnel are not too busy to respond promptly to students’ requests
90 3.8889 1.8750 104 3.4231 1.7774
14. Students can trust the College personnel
91 3.7363 1.9370 103 3.8447 1.7974
15. The College personnel inspire confidence
89 4.0449 2.0052 104 3.9712 1.8458
16. The College personnel are polite
91 4.1429 1.8109 104 4.1442 1.8297
17. Personnel receive adequate support from the College management to improve the provision of their services
89 3.7753 1.8571 102 3.7353 1.7796
18. Students receive individualised attention from administrative personnel (e.g. doing something extra for students)
91 3.8242 2.0741 103 3.9126 1.9759
19. Lecturers give students individualised attention
89 4.1910 1.9822 104 4.2596 1.9608
20. The College personnel do know what the needs of the students are (e.g. recognising students as customers)
91 3.8242 1.9641 103 3.6893 1.8944
21. The College personnel have the students’ best interests at heart
89 3.6966 2.0416 104 3.5481 1.8998
22. The College personnel are easily accessible to students (e.g. easily available to see or to contact by phone, email, etc.)
92 4.3043 2.0952 104 4.3365 1.9835
Page 336
316
Mean and standard deviation – Campus 2
Campus 2 Perceptions Expectations
Valid
N Mean SD
Valid N
Mean SD
1. The College has up-to-date equipment
260 3.2615 1.9944 276 3.3732 1.9377
2. The College’s physical facilities (e.g. buildings and furniture) are attractive, visually appealing and stylish
252 3.2381 1.9370 275 3.0982 1.8721
3. The College personnel are well dressed and neat at all times
248 4.2984 2.1179 275 4.6000 1.9817
4. The materials of the College (e.g. pamphlets and study material) suit the image of the College
248 3.6734 2.0046 274 3.9891 2.0816
5. When the College promises to do something by a certain time, it does so
243 3.3169 2.0027 270 3.0444 2.0363
6. When students have problems, the College personnel are sympathetic and reassuring
244 3.4672 1.8951 273 3.4066 1.8189
7. The College is always dependable and provides the service right the first time
244 3.3893 1.9980 271 3.3026 1.9410
8. The College provides services at the time it promises to do so
245 3.2367 2.0529 273 3.1538 2.0069
9. The College keeps accurate records (e.g. accounts, academic reports, etc.)
245 4.3020 2.1421 275 4.5527 2.1512
10. The College tells students when services will be rendered
244 3.9344 2.1592 273 4.5311 2.1126
11. Students receive fast (prompt) service delivery from the College personnel
246 3.5569 1.9280 273 3.5861 2.0167
12. Lecturers at the College are willing to assist students
240 4.4708 2.0958 268 5.1045 1.7770
13. The College personnel are not too busy to respond promptly to students’ requests
248 3.5000 1.9425 273 3.5531 1.9054
14. Students can trust the College personnel
245 3.6000 1.9885 272 3.8971 2.0538
15. The College personnel inspire confidence
245 3.7429 1.9426 270 3.9333 1.8958
16. The College personnel are polite
246 3.6951 1.9817 273 3.8388 1.9637
17. Personnel receive adequate support from the College management to improve the provision of their services
247 3.7085 1.9180 271 3.8524 1.8540
18. Students receive individualised attention from administrative personnel (e.g. doing something extra for students)
250 3.7320 2.0952 272 3.7831 2.0744
19. Lecturers give students individualised attention
245 4.2082 2.0389 271 4.3838 1.9964
20. The College personnel do know what the needs of the students are (e.g. recognising students as customers)
250 3.7120 2.0113 270 3.6259 2.0011
21. The College personnel have the students’ best interests at heart
250 3.5920 1.9822 272 3.5478 1.8835
22. The College personnel are easily accessible to students (e.g. easily available to see or to contact by phone, email, etc.)
251 3.9641 2.1510 273 4.0549 2.1301
Page 337
317
Mean and standard deviation – Campus 3
Campus 3 Perceptions Expectations
Valid
N Mean SD
Valid N
Mean SD
1. The College has up-to-date equipment
324 3.5864 2.0281 335 3.7224 1.8853
2. The College’s physical facilities (e.g. buildings and furniture) are attractive, visually appealing and stylish
317 3.5773 1.9055 333 3.5495 1.8983
3. The College personnel are well dressed and neat at all times
310 4.3581 2.0803 331 4.7704 1.9730
4. The materials of the College (e.g. pamphlets and study material) suit the image of the College
306 3.9739 1.9850 331 4.2054 2.0136
5. When the College promises to do something by a certain time, it does so
307 3.2997 1.9922 331 3.1088 2.0933
6. When students have problems, the College personnel are sympathetic and reassuring
309 3.4563 1.8955 331 3.4381 1.9598
7. The College is always dependable and provides the service right the first time
310 3.4323 1.9073 332 3.3855 1.8806
8. The College provides services at the time it promises to do so
310 3.3290 2.0293 331 3.1480 1.9800
9. The College keeps accurate records (e.g. accounts, academic reports, etc.)
310 4.1710 2.1647 332 4.3645 2.1882
10. The College tells students when services will be rendered
310 3.9452 2.0591 330 4.4424 2.0267
11. Students receive fast (prompt) service delivery from the College personnel
311 3.3087 1.8720 329 3.2948 1.8383
12. Lecturers at the College are willing to assist students
313 4.3450 1.9650 328 4.9482 1.7766
13. The College personnel are not too busy to respond promptly to students’ requests
310 3.5323 1.8584 330 3.6000 1.8884
14. Students can trust the College personnel
306 3.6078 1.8947 330 3.8303 1.9449
15. The College personnel inspire confidence
311 3.8617 1.8983 328 3.8780 1.8250
16. The College personnel are polite
309 3.7282 1.9383 328 3.9573 1.9358
17. Personnel receive adequate support from the College management to improve the provision of their services
310 3.7097 1.8485 328 3.7866 1.7566
18. Students receive individualised attention from administrative personnel (e.g. doing something extra for students)
309 3.6052 1.9187 328 3.6829 1.9528
19. Lecturers give students individualised attention
308 4.0584 2.0331 328 4.1890 1.9694
20. The College personnel do know what the needs of the students are (e.g. recognising students as customers)
311 3.5756 1.9903 327 3.5260 1.8892
21. The College personnel have the students’ best interests at heart
310 3.4871 1.9702 326 3.4847 1.8443
22. The College personnel are easily accessible to students (e.g. easily available to see or to contact by phone, email, etc.)
317 3.8644 2.0339 331 4.0937 2.0759
Page 338
318
Mean and standard deviation – Campus 4
Campus 4 Perceptions Expectations
Valid
N Mean SD
Valid N
Mean SD
1. The College has up-to-date equipment
142 3.9718 1.9640 148 4.0203 1.9324
2. The College’s physical facilities (e.g. buildings and furniture) are attractive, visually appealing and stylish
140 3.6286 1.7886 148 3.7162 1.9415
3. The College personnel are well dressed and neat at all times
137 4.1168 1.8789 147 4.4150 1.8126
4. The materials of the College (e.g. pamphlets and study material) suit the image of the College
132 3.9394 1.8441 147 4.3605 1.9123
5. When the College promises to do something by a certain time, it does so
129 3.9070 1.9782 145 3.9448 2.1531
6. When students have problems, the College personnel are sympathetic and reassuring
129 3.7674 1.8978 144 4.3125 1.8754
7. The College is always dependable and provides the service right the first time
131 3.8702 1.8663 144 3.9792 1.8976
8. The College provides services at the time it promises to do so
126 3.7778 1.8714 144 4.0833 2.0364
9. The College keeps accurate records (e.g. accounts, academic reports, etc.)
130 4.2000 1.9585 147 4.3741 2.0681
10. The College tells students when services will be rendered
130 3.8769 1.9290 141 4.4752 1.8616
11. Students receive fast (prompt) service delivery from the College personnel
126 3.8254 1.8334 146 4.1438 1.9722
12. Lecturers at the College are willing to assist students
130 4.3231 2.0468 146 4.4178 2.1391
13. The College personnel are not too busy to respond promptly to students’ requests
129 3.9535 1.8577 147 4.0408 1.9299
14. Students can trust the College personnel
126 4.0317 1.8673 146 4.1986 2.0329
15. The College personnel inspire confidence
130 3.8231 1.8021 146 4.1027 1.7955
16. The College personnel are polite
128 3.9297 1.8366 145 4.3034 1.7374
17. Personnel receive adequate support from the College management to improve the provision of their services
132 3.8636 1.7066 146 4.0205 1.7674
18. Students receive individualised attention from administrative personnel (e.g. doing something extra for students)
131 4.0000 1.8688 146 4.0890 1.8861
19. Lecturers give students individualised attention
128 4.2422 1.9592 144 4.2639 1.9105
20. The College personnel do know what the needs of the students are (e.g. recognising students as customers)
128 3.9453 1.9933 144 4.1736 1.9588
21. The College personnel have the students’ best interests at heart
131 4.0153 1.9255 144 4.0694 1.8346
22. The College personnel are easily accessible to students (e.g. easily available to see or to contact by phone, email, etc.)
134 4.1866 2.0119 147 4.3469 1.9361
Page 339
319
Mean and standard deviation – Campus 5
Campus 5 Perceptions Expectations
Valid
N Mean SD
Valid N
Mean SD
1. The College has up-to-date equipment
108 3.5926 1.9240 120 3.7583 1.7247
2. The College’s physical facilities (e.g. buildings and furniture) are attractive, visually appealing and stylish
105 3.1810 1.7639 119 3.3361 1.7864
3. The College personnel are well dressed and neat at all times
100 4.1000 1.9254 119 4.4202 1.7921
4. The materials of the College (e.g. pamphlets and study material) suit the image of the College
100 3.7600 1.8969 118 3.7373 1.9499
5. When the College promises to do something by a certain time, it does so
100 3.4400 1.7368 117 3.4017 1.8572
6. When students have problems, the College personnel are sympathetic and reassuring
96 3.3854 1.8602 119 3.6050 1.8696
7. The College is always dependable and provides the service right the first time
97 3.3505 1.6648 119 3.5042 1.7557
8. The College provides services at the time it promises to do so
94 3.2766 1.8044 118 3.4237 1.8136
9. The College keeps accurate records (e.g. accounts, academic reports, etc.)
97 3.8351 1.9509 120 4.2750 2.0455
10. The College tells students when services will be rendered
99 3.5960 1.7838 118 4.1864 1.8302
11. Students receive fast (prompt) service delivery from the College personnel
95 3.4842 1.7251 119 3.5462 1.9167
12. Lecturers at the College are willing to assist students
99 3.8687 1.8552 119 4.8235 1.9118
13. The College personnel are not too busy to respond promptly to students’ requests
97 3.3402 1.7314 120 3.4500 1.8958
14. Students can trust the College personnel
98 3.3673 1.9016 120 3.6000 1.8168
15. The College personnel inspire confidence
96 3.4792 1.6606 120 3.6667 1.7601
16. The College personnel are polite
97 3.4742 1.7624 120 3.5417 1.7818
17. Personnel receive adequate support from the College management to improve the provision of their services
98 3.4286 1.7051 120 3.7167 1.7061
18. Students receive individualised attention from administrative personnel (e.g. doing something extra for students)
99 3.3232 1.6526 120 3.5333 1.9050
19. Lecturers give students individualised attention
95 3.6316 1.7385 120 3.9750 1.8125
20. The College personnel do know what the needs of the students are (e.g. recognising students as customers)
99 3.5051 1.8592 120 3.3167 1.6852
21. The College personnel have the students’ best interests at heart
95 3.3895 1.7522 118 3.3729 1.6835
22. The College personnel are easily accessible to students (e.g. easily available to see or to contact by phone, email, etc.)
99 3.3232 1.7428 120 3.9083 2.0904