The Impact of Mandated Employment Verification Systems on State-Level Employment by Foreign Affiliates Catalina Amuedo-Dorantes Professor Department of Economics San Diego State University 5500 Campanile Drive San Diego, CA 92182 Phone: (619) 594-1663 [email protected]Cynthia Bansak Associate Professor Department of Economics St. Lawrence University 23 Romoda Drive Canton, NY 13617 Phone: (315) 229-5428 [email protected]Allan Zebedee Associate Professor Financial Studies Clarkson University Bertrand H. Snell Hall Potsdam, NY 13699 Phone: (315) 268-3890 [email protected]December 28, 2012 Abstract Faced with a bleak prospect for a comprehensive immigration reform at the federal level, states have started to take immigration matters into their own hands. For example, many states have been mandating the use of employment verification (E-Verify) systems to confirm work eligibility. Some of the consequences of these E-Verify mandates remain unclear. In this paper, we focus on one example, namely the possibility that negative publicity stemming from anti- illegal immigrant laws may threaten states’ efforts to increase foreign investment. Specifically, we exploit the state-level and time variation in the enactment and implementation of E-Verify mandates to explore if more punitive measures against undocumented immigrants impact states’ ability to attract foreign investment. We quantify foreign investment through the employment of majority-owned affiliates of foreign as measured by the U.S. Bureau of Economic Analysis. Our results shed light on one of the unintended consequences of patchwork state-level immigration legislation, reinforcing the need for comprehensive immigration reform at the federal level.
Transcript
The Impact of Mandated Employment Verification Systems on State-Level Employment by Foreign Affiliates
Catalina Amuedo-Dorantes Professor
Department of Economics San Diego State University
5500 Campanile Drive San Diego, CA 92182 Phone: (619) 594-1663
Faced with a bleak prospect for a comprehensive immigration reform at the federal level, states have started to take immigration matters into their own hands. For example, many states have been mandating the use of employment verification (E-Verify) systems to confirm work eligibility. Some of the consequences of these E-Verify mandates remain unclear. In this paper, we focus on one example, namely the possibility that negative publicity stemming from anti-illegal immigrant laws may threaten states’ efforts to increase foreign investment. Specifically, we exploit the state-level and time variation in the enactment and implementation of E-Verify mandates to explore if more punitive measures against undocumented immigrants impact states’ ability to attract foreign investment. We quantify foreign investment through the employment of majority-owned affiliates of foreign as measured by the U.S. Bureau of Economic Analysis. Our results shed light on one of the unintended consequences of patchwork state-level immigration legislation, reinforcing the need for comprehensive immigration reform at the federal level.
1
“This state has prided itself on its ability to attract international companies like Daimler-Benz AG, Toyota Motor Corp. and ThyssenKrupp AG. But negative publicity stemming from Alabama’s new anti-illegal immigrant law threatens to complicate the state’s effort to continue luring foreign investment, some business leaders say.” (Campo-Flores and Martin, Wall Street Journal, December 3, 2011)
1. Introduction
Immigration reform efforts in the United States have traditionally targeted illegal
immigration. During the past decades, proposals for a comprehensive immigration reform have
increasingly addressed both the supply-side and the demand-side of the labor market as a means
to curb the number of undocumented immigrants in the country. As efforts to reform the
country’s immigration policy were unsuccessful in both 2006 and 2007, some states have taken
matters into their own hands and started to adopt the employment verification (E-Verify) system
as a means to curtail the hiring of undocumented workers.1 In addition to potentially increasing
labor costs, the adoption of the E-Verify system –a federally developed identity and work
authorization verification system– often flags the state being unwelcoming of immigration and
foreigners. Negative media attention, accompanied by arrests of foreign business executives and
confusion regarding these measures may make it more difficult to attract foreign business
development. At this point, there is very little statistical evidence regarding the impact of these
state-level actions on the investment decisions of foreign firms in the United States.
In this project, we address that gap in the literature by examining the potential
consequences of implementing state-level E-verify mandates on the employment at firms owned
by foreign affiliates. Because firms might make investment decisions once a year and, therefore,
may not be able to respond immediately, we also look at the possibility of a lagged response.
Using annual BEA state and industry-level data from 2004-2010, we find that these mandates do 1According to the Public Policy Institute of California (PPIC), over 118 laws related to the employment of immigrants were enacted in 37 states during the 2005-2010 five-year period (Bohn et al. 2011).
2
appear to have a negative effect on the employment of foreign affiliates in states with any E-
verify mandate in place. This effect is found even after progressively controlling for a host of
time-varying state-level characteristics that may draw or deter foreign firms from entering the
United States market, such as worker skills, corporate taxes, labor costs, and immigrant
networks, as well as a battery of industry, regional and time fixed-effects plus industry- and
region-time trends.
In what follows, we briefly discuss employment verification programs and their expected
impacts on foreign direct investment as proxied by the employment growth rate of foreign
affiliates across various industries and states. We then describe the data and methodology used
in our analysis, to conclude with a discussion of the results and some policy recommendations
based on our findings.
II. Background: E-Verify and its Potential Consequences for FDI
E-verify is an internet-based, free program run by the United States government that
compares information from an employee's employment eligibility verification form I-9 to data
from U.S. government records. If the information matches, that employee is eligible to work in
the United States. If there is a mismatch, E-Verify alerts the employer and the employee is
allowed to work while he or she resolves the problem, but they must contact the appropriate
agency to resolve the mismatch within eight federal government work days from the referral
date. As of 2012, seven states (i.e. Arizona in 2008, Mississippi in 2009, Utah in 2010, North
Carolina and Alabama in 2011, and Tennessee and South Carolina in 2012) required all firms to
screen their new hires through the system, while ten other states have only imposed E-Verify
mandates on public agencies and contractors.
3
The introduction of this employee verification system may have a number of effects that
could impact firms’ investment decisions. First, the E-Verify system imposes numerous
administrative costs to firms (Gonzalez 2008). According to the United States Citizenship and
Immigration Services (USCIS), officials estimate that a mandatory E-Verify program for the
2009 through 2012 fiscal years could cost $765 million if only newly hired employees are
screened through the program, and about $838 million over the same 4-year period if both newly
hired and current employees are processed (U.S. GAO 2011). Additional expenses include: (a)
hiring delays, which are estimated to be around 1.6 million individuals per year, and (b) lost
productivity from letting go unauthorized immigrants, which could add up to about 14 million
work-days (Rosenblum 2011).
Second, E-Verify mandates may have a ‘chilling effect’ on the immigrant labor force,
thereby limiting the size of the workforce. Immigrants may choose to leave the states that
introduce legislation increasingly hostile towards undocumented immigrants. Evidence of a
strong and immediate supply-response on the part of immigrants has been confirmed by the
literature (Amuedo-Dorantes and Bansak 2012, Bohn et al. 2011).
Third, because a considerably large share of undocumented immigrants live in mixed-
status families, the passing of stricter hiring controls targeting undocumented immigrants may
lead to a diminished presence of immigrants and the deterioration of immigrant networks.
Recent work by Foad (2011) suggests that immigrants in the receiving country create
externalities that attract foreign direct investment.2 If E-Verify has the unintended consequence
of pushing undocumented workers further ‘into the shadows’, state-level mandates may also
2 Other examples of the literature emphasizing the importance of immigrant networks on FDI include the works of Gould (1994) and Javorcik et al. (2011).
4
result in a reduction in network effects and foreign investment, putting states at a disadvantage
relative to their counterparts lacking such measures.
As employment costs rise in states with E-Verify mandates, foreign firms may choose to
locate elsewhere. While no studies have looked directly at the impact of E-Verify mandates on
foreign direct investment, several authors have theorized and empirically examined how
differences in labor market regulations, restrictions and standards impact firms’ investment
decisions and location choices. For example, Dewit et al. (2003) and Dewit et al. (2009)
developed theoretical models to explain strategic foreign direct investment decisions in response
to labor market flexibility in uncertain markets. In particular, Dewit et al. (2009) predict that “(i)
firms are less likely to locate in countries with a high degree of employment protection; (ii) firms
that do locate in countries with a high degree of employment protection will keep their plant, at
least initially, relatively small, and (iii) firms located in countries with a high degree of
employment protection are less likely to relocate than those located in countries with a low
degree of employment protection.”
Empirical evidence supports the prediction that firms are less likely to invest where
employment protection is higher and where employees are more likely to impose additional costs
through collective bargaining. The analyses of how labor market regulations impact foreign
direct investment have varied in terms of the geographic coverage of the samples object of study,
the time period under analysis and the measure of labor market costs being used, among other
things. Overwhelmingly, they document a negative relationship between labor market
regulations and the ability to attract foreign direct investment (e.g. Dewit et al. (2003), Nicoletti
et al. (2003), Javorcik and Spatareanu (2005) and Olney (2012)). For instance, Javorcik and
Spatareanu (2005) examine firm-level data on foreign direct investment undertaken by European
5
companies from 1998 through 2001. They find that a more flexible labor market in the host
country is positively associated with inward foreign direct investment. This effect is greater for
firms in the service industry compared to their counterparts in manufacturing. More recently,
Olney (2012) examines differences in labor standards across 26 countries over a 23-year period
and finds that there is an inverse relationship between the level of employment protection and
U.S. foreign direct investment. Furthermore, this negative and significant relationship is even
stronger for mobile foreign direct investment.
The consequences of the decline in FDI due to strict labor market conditions and costly-
E-Verify mandates may hurt regional economic growth and productivity. Mullen and Williams
(2005) examine FDI at the state-level from 1977 to 1997 and find that foreign investment has a
significant impact on economic activity through FDI-related externalities. Although they do not
quantify the magnitude of the impact, their findings have policy implications for local FDI
promotion, especially in sectors where foreign and domestic capital is complementary. In a
recent study by the Immigration Policy Center (2012), it is estimated that foreign companies
employ 77,500 workers or 5 percent of Alabama’s workforce. If investors no longer experience
a hassle-free environment for work permits for foreign managers and workers alike, future
investment may be deterred. The study concludes that state-level anti-immigration legislation
may “hinder prospects for economic growth”.
III. Data and Some Descriptive Statistics
In this paper, our goal is to assess the impact of state-level E-Verify mandates on foreign
direct investment at the state-industry level from 2004-2010. To do so, we gather data on the
employment of foreign affiliates from the Bureau of Economic Analysis (BEA), as well as data
on the enactment and implementation dates of E-Verify mandates at the state-level from the
6
National Conference of State Legislatures (NCSL). We augment our dataset with time-varying
state-level data on various demographic indicators, including states’ population size, the size of
their foreign-born population (overall and likely unauthorized), the number of residents with a
high school education or with a college plus, and their average per capital income. Additionally,
we control for time-varying state-level economic information, including the size of its market –
captured by its gross state product, as well as for average labor costs and the level of corporate
taxes.
As noted above, E-Verify dates are gathered from the NCSL. The earliest state-level E-
Verify mandates were enacted in 2006 and have continued through the present, with Virginia
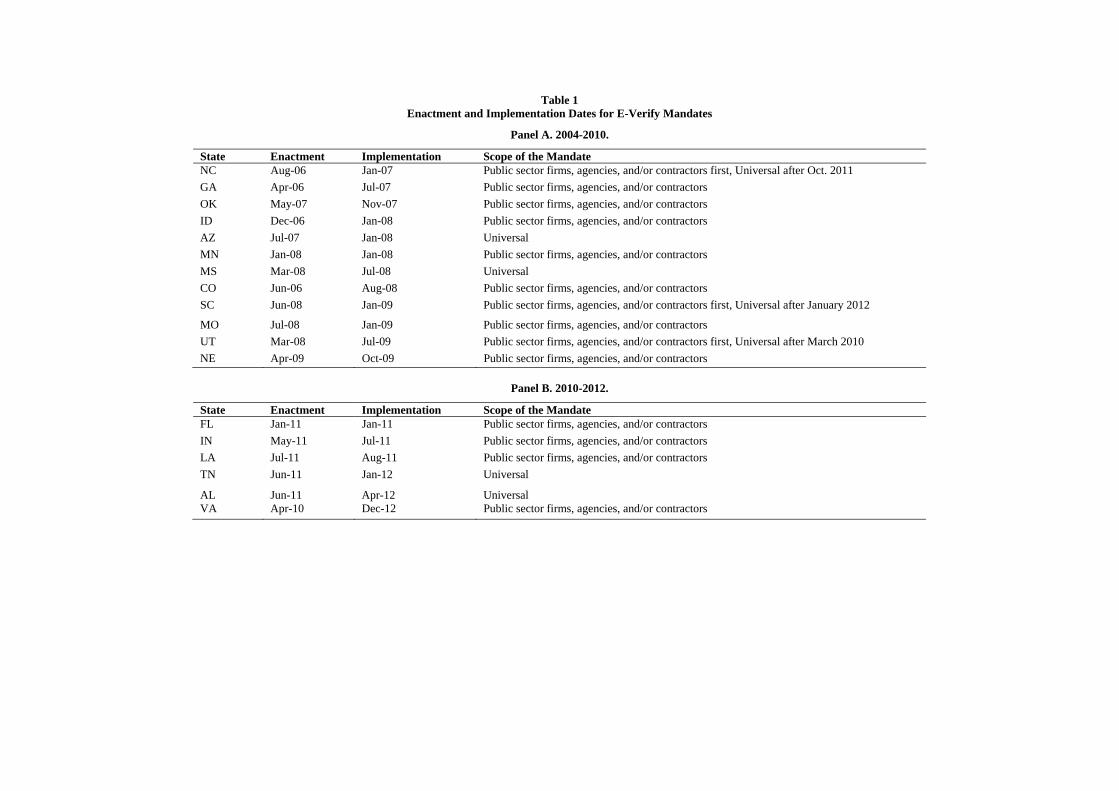
recently implementing an E-Verify mandate. Table 1 presents a summary of the states with E-
verify mandates. Panel A identifies states implementing mandates within our sample period,
while Panel B identifies the states that have enacted mandates more recently outside our sample
period. In total, we examine 12 states with E-Verify mandates; however, an additional six states
have recently implemented E-Verify mandates. Due to restrictions in the availability of data on
foreign direct investment (FDI), these additional six states are not included in the analysis as E-
Verify states at this time.
The NCSL identifies both an enactment and implementation date. The enactment date is
the date the state’s governing body passed the E-Verify mandate, while the implementation date
is the date the mandate went into effect. For the most part, states implemented their E-Verify
mandates through a phase-in process. For example, Mississippi enacted the Mississippi
Employment Protection Act in March 2008, which required all government agencies and private
sector firms with more than 250 employees to use E-Verify with new hires by July 2008.
Smaller firms were phased into the law over the next three years, such that by July 2011 all
7
businesses in Mississippi were required to use E-Verify. Results are rather similar regardless of
whether we use enactment or implementation dates. Therefore, we display the results using the
implementation date of the policy, as well as an alternative definition of the policy variable as a
robustness check.
In addition to identifying the enactment and implementation dates, Table 1 describes the
scope of the mandate. The latter can be categorized into two categories: public sector mandates
and universal mandates. Public sector mandates require government agencies as well as
contractors to use the E-Verify system, whereas universal mandates require all firms within the
state to use the E-Verify system. Within our sample period, only two of the twelve E-Verify
states have enacted a universal mandate –namely Arizona and Mississippi. Three other states
have recently expanded the scope of their public sector mandate to universal, providing ad hoc
evidence of the public sector mandate functioning as an intermediary step to a universal
mandate. In the empirical analysis, an attempt to distinguish the impacts of public sector and
universal mandates was made. Nevertheless, due to the very limited incidence of universal
mandates in our sample, public sector and universal mandates are grouped into a single E-Verify
mandate variable at this time.
The Bureau of Economic Analysis disseminates wide-ranging statistics on foreign-direct
investment in the United States based on mandatory annual surveys of U.S. affiliates of foreign
companies. A U.S. affiliate is a business enterprise with a direct or indirect ownership by a
foreign investor of 10 percent or more. While the BEA collects a wealth of information from
these affiliates of foreign direct investors, ranging from financial and operating data to direct
investment and balance of payment data, the source data is not disseminated to the public.
Instead, select data are made available aggregated across different classifications, such as source
8
country, state and/or industry. In addition to reporting data for all U.S. affiliates of foreign direct
investors, select data are reported for majority owned U.S. affiliates. Majority owned U.S.
affiliates are affiliates that are owned more than 50 percent by foreign direct investors. For this
study, we use employment data of majority owned U.S. affiliates aggregated by state and
industry to measure inward foreign direct investment.
Because each state implements E-verify mandates at a different time, we can exploit this
variation across states and time to study the impact that the mandates are having on the
employment by U.S. affiliates of foreign direct investment. As we shall explain in what follows,
we use a quasi-experimental approach that compares the change in the employment of foreign
affiliates in states that implement E-Verify mandates (our treatment group) to the change in the
employment of foreign affiliates in states that did not implement such mandates (our control
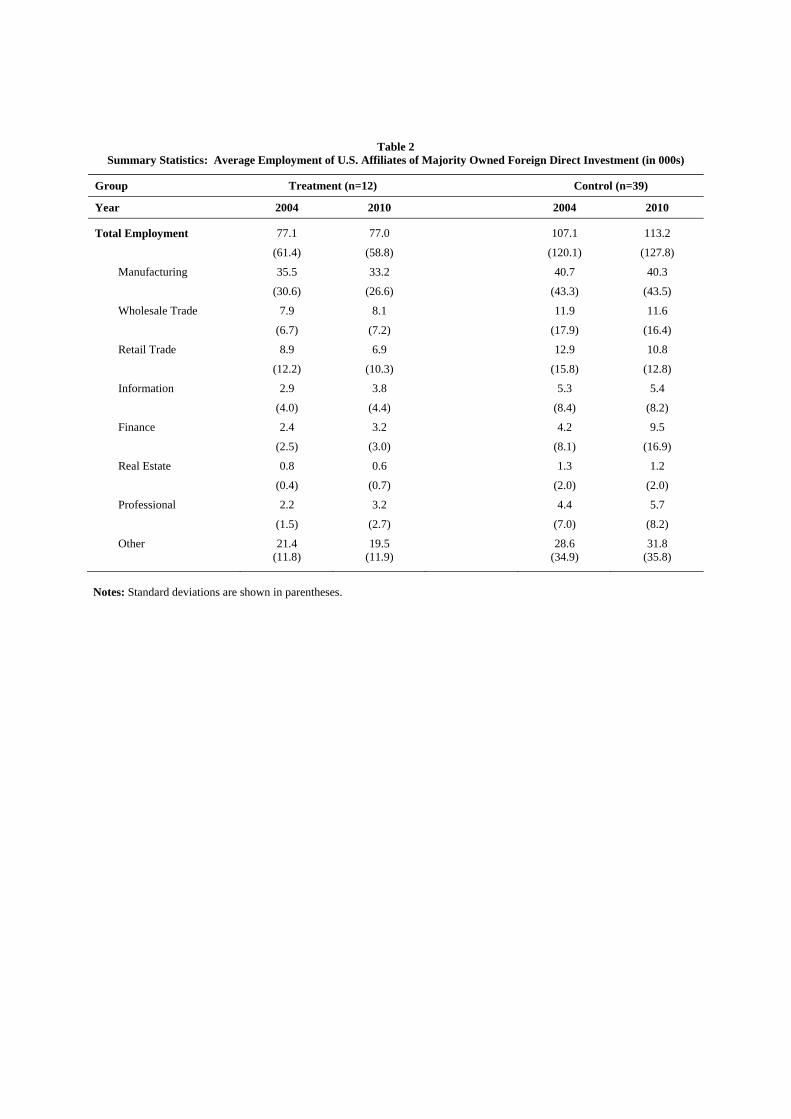
group), pre- vs. post-implementation of said policies. To provide some preliminary descriptive
evidence, Table 2 compares the employment by foreign affiliates during the pre- and the post-
treatment periods (2004 and 2010) in treatment and control states. States implementing E-Verify
mandates maintain, on average, stable total employment levels (77.1 in 2004 and 77.0 in 2010),
whereas control states enjoy a small increase in total employment levels (107.1 compared 113.2)
over the same period.
The total employment data is also decomposed into eight industry categories. In general,
the aforementioned pattern is mimicked at the industry level. For example, the largest industry
group (i.e. manufacturing) experienced an employment reduction from 35.5 to 33.2 in treated
states over the sample period being examined, whereas employment in that industry remained
fairly stable in control states over the same time span (40.7 compared 40.3). However, for most
9
industries –typically displaying employment levels significantly smaller than manufacturing, the
employment data are rather noisy, requiring a formal analysis to more clearly identify a link.
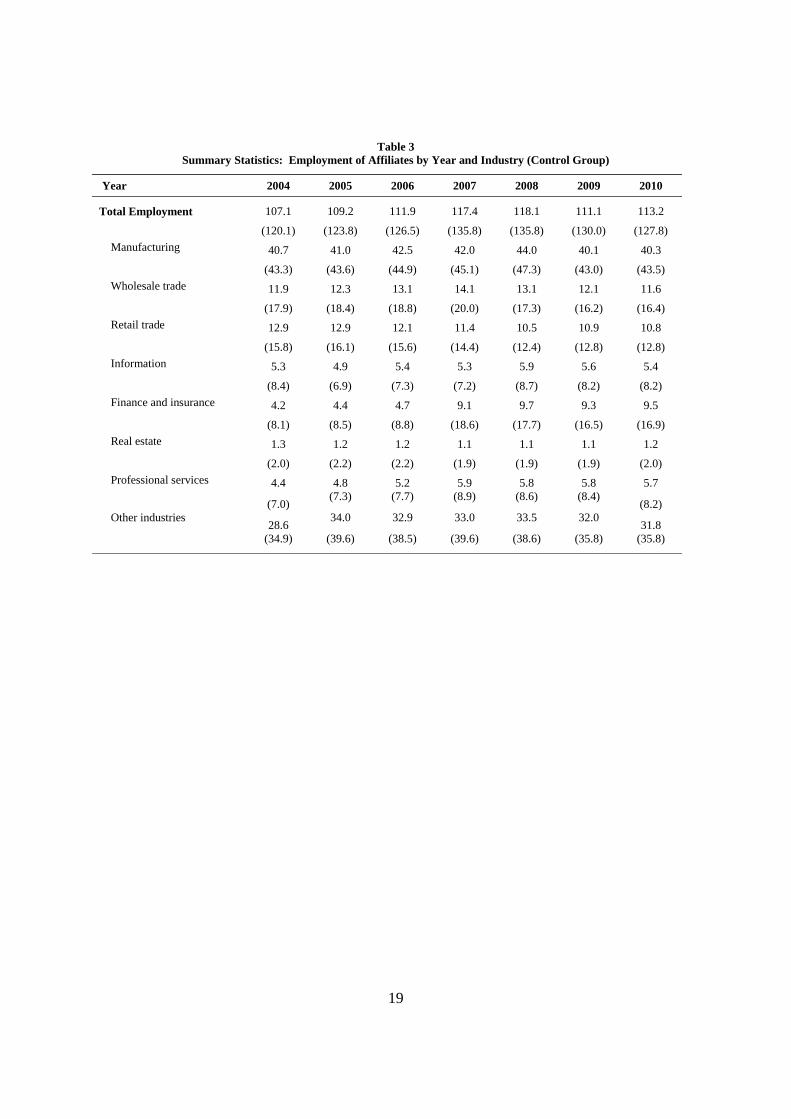
Table 3 goes on to provide a complete summary of the employment levels by U.S.
affiliates of foreign direct investors across the sample period. For homogeneity purposes, we
restrict the sample to non-E-Verify or control states. A close inspection of the data clearly shows
a responsiveness of foreign direct investors to macroeconomic conditions and, as such, the need
to account for them in order to identify the impact of E-Verify mandates. Indeed, total
employment falls between 2008 and 2009 from 181.1 to 111.1 employees, or by nearly six
percent. Across the industry groups, the general trend is similar, with employment growing prior
to the economic downturn in 2008 and significantly contracting in 2009.
In examining the determinants of employment by U.S. affiliates of foreign direct
investors, a number of time-varying state-level demographic and economic data are also included
as controls. In particular, we include information on the state’s population, shares of foreign-
born and likely unauthorized immigrants,3 as well as information on the educational attainment
of the state’s population. Population data are extracted from the BEA. The educational
attainment data (that is, the share of the population with at least high school diploma and the
share with a college degree) were obtained from the U.S. Department of Commerce. Figures on
the shares of foreign-born –overall and likely unauthorized– are computed using annual data
from the American Community Survey (ACS) extracted and tabulated through the IPUMS
website. Economic data examined includes the state’s gross state product, per capita income,
labor costs and corporate income tax rates. Gross state product and per capita income are
3 To measure the population of likely unauthorized immigrants, we follow the literature (see, for instance, Loftstrom et al. 2011), and focus our attention on a group of workers previously shown to be a very good representation of the most likely unauthorized (Passel and Cohn 2010). This group is composed of Hispanic, non-citizen, working age (under 45) individuals with a high school education or less.
10
extracted from the BEA website, while average wage estimates for manufacturing are
downloaded from the Department of Labor’s Occupational Employment Statistics. Finally, state
corporate income tax rates were downloaded from the Tax Foundation a non-partisan tax
research group. Similar to individual tax rates, corporate tax rates for many states are
progressive. For this paper, we used the tax rate for the highest income bracket, which on
average is approximately $60,000. Furthermore, some states (Ohio, Texas and Washington, in
particular) have a gross receipt tax which is not comparable to corporate income tax rates. For
these states, the annual corporate tax rate is set to zero.
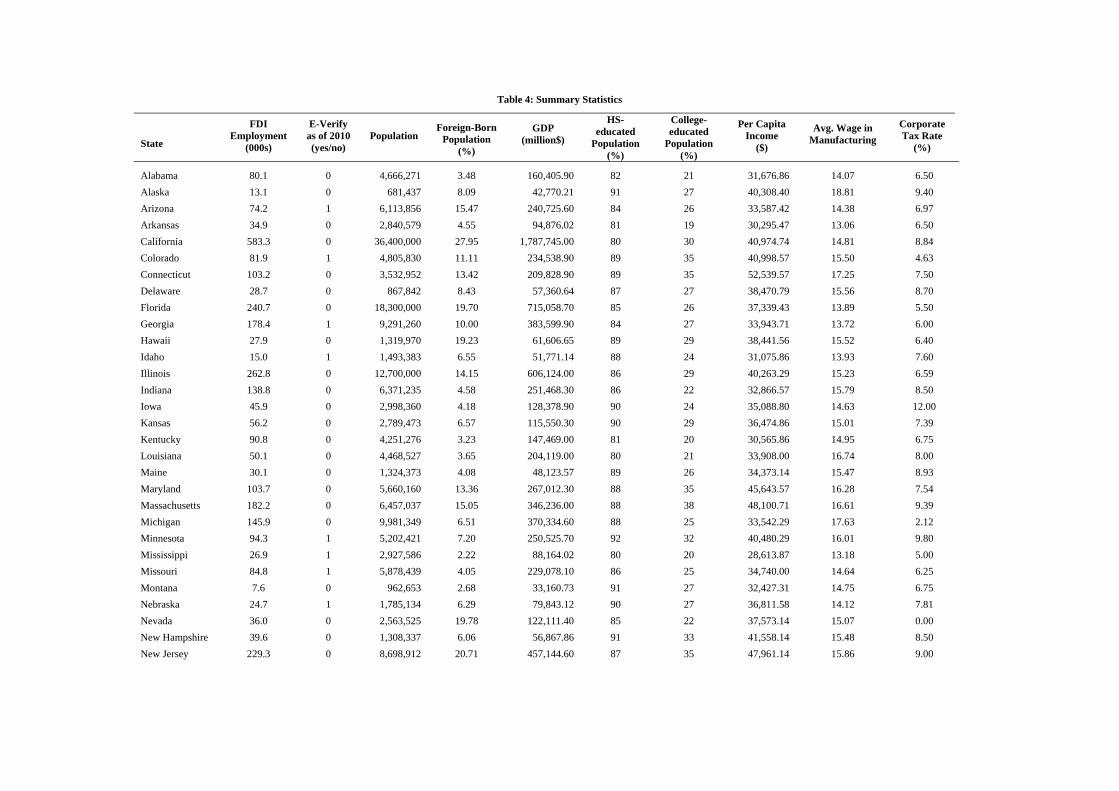
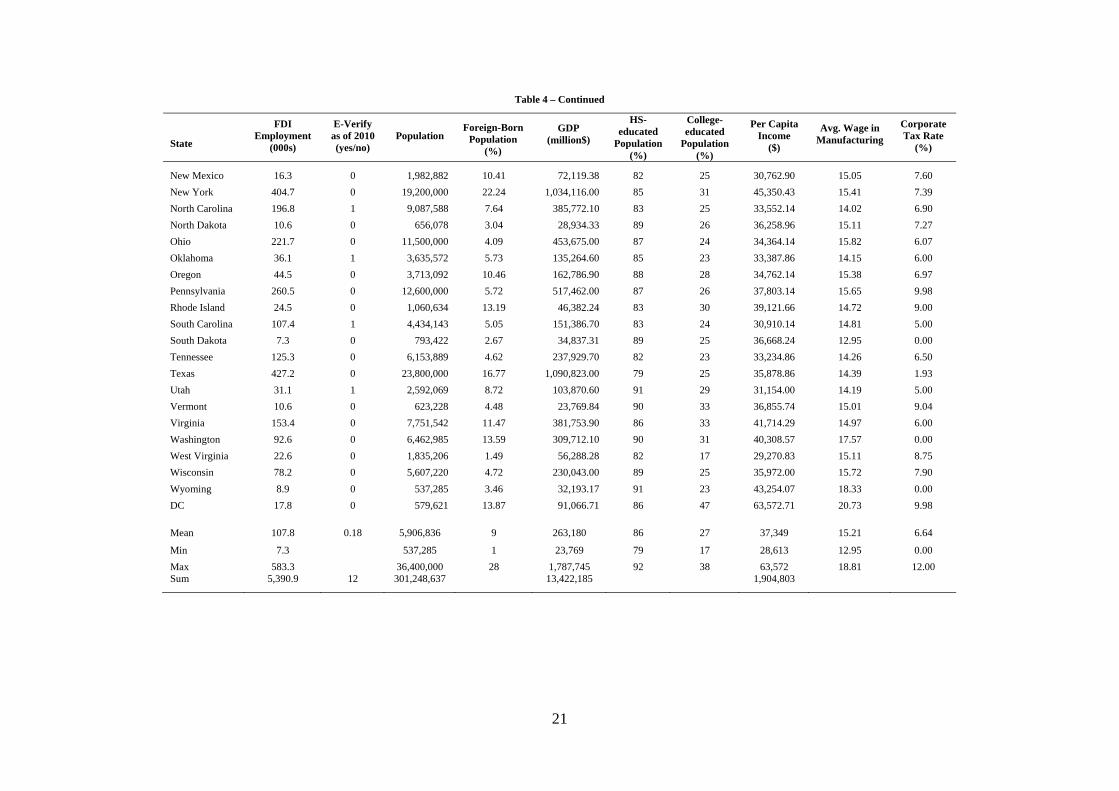
Table 4 shows the summary statistics of these controls by state as well as across the entire
sample period. To provide a sense of how they are related to total employment by foreign direct
investors, Table 4 also displays the latter. Total employment by foreign direct investors is
closely correlated with the size of the state in terms of population. The three largest states,
California, Texas and New York, are also the three largest in terms of employment by foreign
direct investors, with California representing over a half million employees. The largest E-
Verify state is North Carolina, with nearly 200,000 total employees by foreign direct investors.
In total, between 2004 and 2010, over five million people were employed by U.S. affiliates of
foreign direct investors.
IV. Methodology
To evaluate the consequences of employment verification mandates on the employment
of foreign affiliates by industry at the state level, we exploit the variation in the enactment and
implementation dates of E-Verify mandates across states and over time. Specifically, we
where: ( )2,~ σμε Nist , i=1…n industries, s=state, and t=year. The dependent variable List
stands for the employment of foreign affiliates in a particular industry, state and year; and E-
Verify is a dummy initially set equal to 1 if E-Verify was implemented in the state (see Table 1
for the enactment and implementation dates of the various states’ E-Verify mandates).4 The
vector X includes a variety of state-level characteristics known to impact the employment of
foreign affiliates, such as proxies for market size (population, GDP, per capita income),
immigrant networks (captured by both the shares of foreign-born and likely unauthorized
foreign-born population), skill level (captured by the shares of high-school and of college-
educated population), corporate taxes, and average labor costs (average wage in manufacturing).
These characteristics are included with a lag to avoid simultaneity problems. Additionally, a
battery of industry fixed-effects (χi), regional fixed-effects (δs), year fixed-effects (φ t), industry
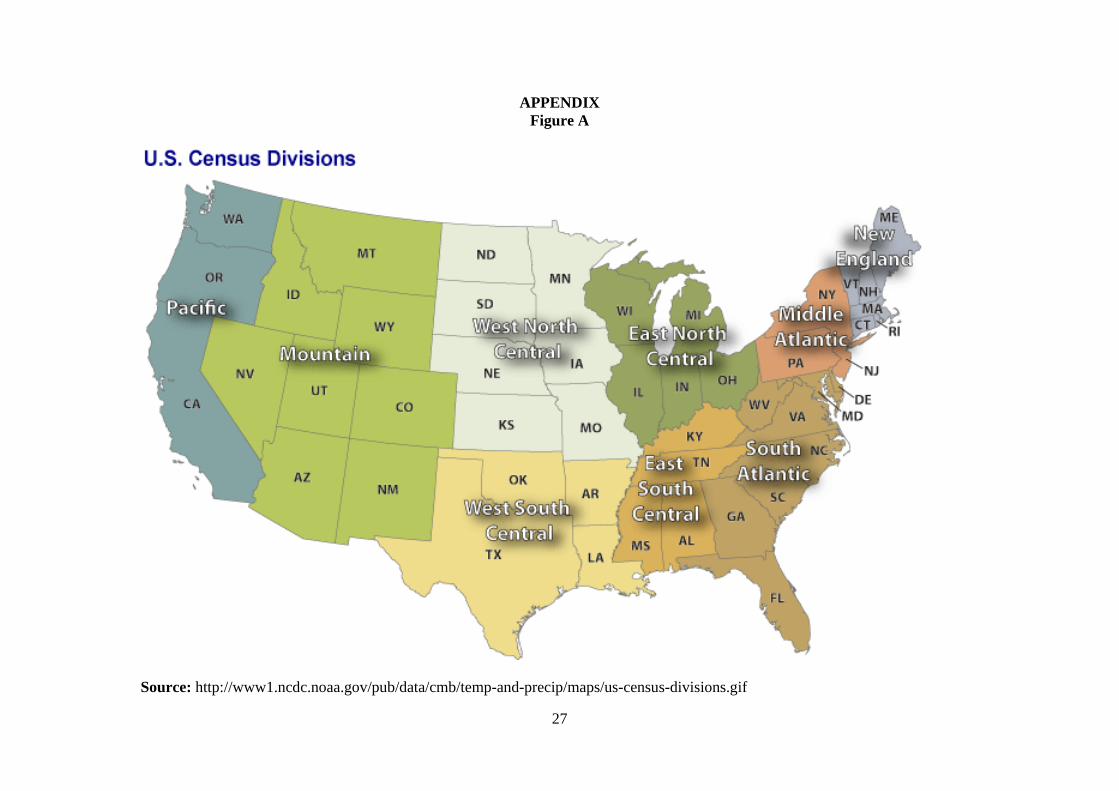
and region-level time trends (χit and δst) are included in the analysis. Because corporate taxes
rarely fluctuate over time within states over the time period being examined, we are unable to
include state fixed-effects. Instead, our regional fixed-effects and region-time trends are defined
using information on the Census division in which the state is located.5 Overall, the various
fixed-effects and time trends included in the analysis are intended to capture idiosyncratic
industry and regional level characteristics, sector-specific and economy-wide shocks, as well as
time-varying economic conditions at the industry and regional levels, such as changes in industry
regulations or economic trends in the region.
Equation (1) is estimated in log differences, with the exception of the policy variable,
which is a dummy variable. First differencing the series ensures stationarity of the time series.
4 Results are rather similar when we using the enactment as opposed to the implementation date, probably signaling that firms make investment decisions once a year, once the policy has been enacted and is about to be implemented. Nevertheless, as a robustness check, we also consider an alternative specification of our policy variable. 5 Figure A in the appendix displays the various Census divisions.
12
In particular, by examining the log difference in foreign-affiliates’ employment levels (namely:
log( istL )-log( 1−istL )), we address the fact that current levels of foreign-direct investment are
likely to depend on recently observed levels of foreign-direct investment –the so-called
agglomeration effect in state-level FDI noted in the literature (e.g. Woodward 1992, List 2001).6
To avoid unnecessary assumptions about the functional form of the underlying distribution, we
estimate equation (1) as a linear probability model and compute robust standard errors clustered
at the state level.7 Finally, we estimate alternative model specifications to evaluate the
robustness of our findings to changes in the regressors –some of them potentially endogeneous,
as well as to changes in the definition of our policy variable (E-Verifyst) and sample composition.
V. Do E-Verify Mandates Curtail Employment by Foreign Affiliates?
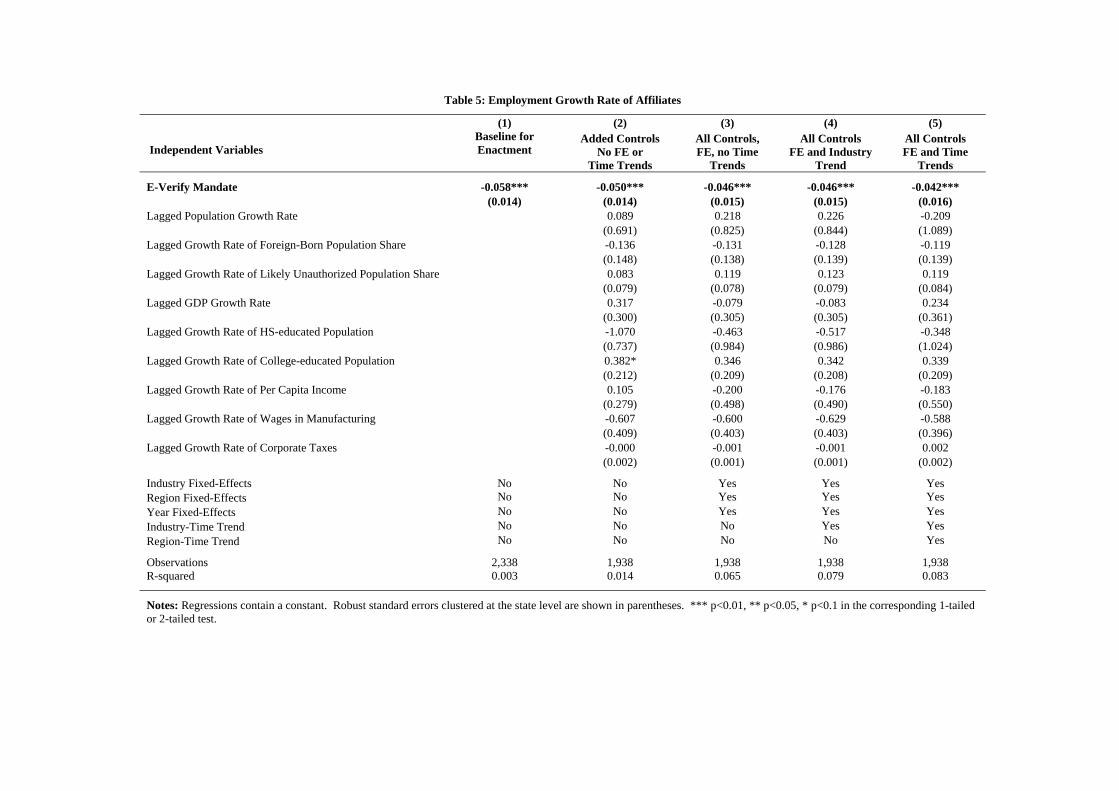
Do E-Verify mandates negatively impact the employment of foreign affiliates? Table 5
shows the coefficient estimates from regressing the employment of foreign affiliates by industry
and state on a policy dummy indicative of the implementation of an E-Verify mandate at the
state level. Column (1) does not include any controls, column (2) adds the time-varying region-
level characteristics likely impacting the investment decisions of foreign affiliates, and columns
(3), (4) and (5) progressively add the industry, region and year fixed-effects, followed by
industry and region-level time trends. Regardless of the specification used, we find that E-Verify
mandates have a negative and statistically significant impact on the employment of foreign
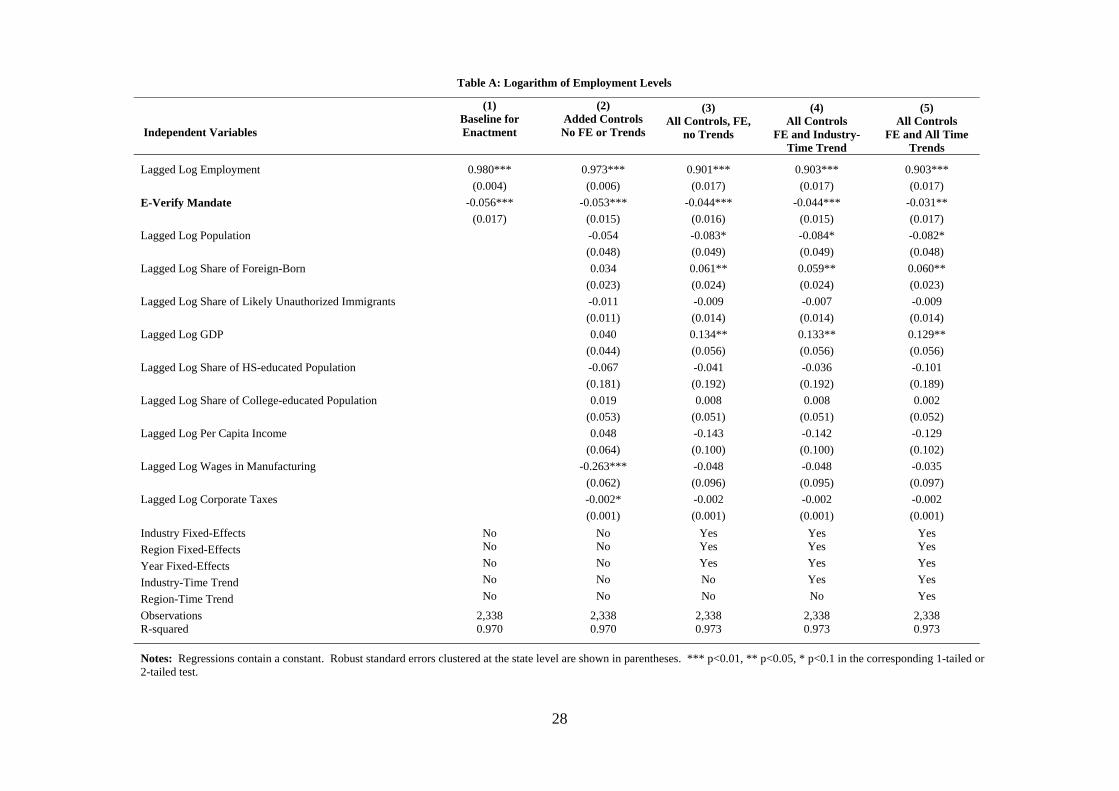
6 As a robustness check, we also estimate equation (1) in log levels, including the lagged employment level as one of the regressors to account for its persistence over time. Results from this specification are shown in Table A in the appendix. The findings are consistent with the results using log first differences, with the only difference that the share of foreign-born and GDP –capturing immigrant networks and market size, seem to serve as significant pull factors of foreign direct investment as noted in the literature. The state’s population appears to be inversely related to the employment level of foreign affiliates, although it is barely significant at the 10 percent level. Overall, the specification serves as a robustness check, but fails to address the non-stationarity of the regressors. 7 Although, in some instances, linear probability models can yield predicted probabilities that fall outside the unit circle, they impose fewer restrictions on the distribution of the error term and facilitate convergence when working with small samples (Wooldridge 2008).
13
affiliates. Because of the estimation of equation (1) in log differences, our dependent variable is
the employment growth rate from period t-1 to period t. To turn the growth rate into a
percentage, we simply multiply by 100. Hence, the estimates from Table 5 reveal that E-Verify
mandates lower the employment growth rate of foreign affiliates anywhere between 4 to 6
percent on average. None of the other state-level controls plays much of a role, with the sole
exception of having a more skilled population, possibly with stronger business and international
ties that attract both immigrants and foreign direct investment.
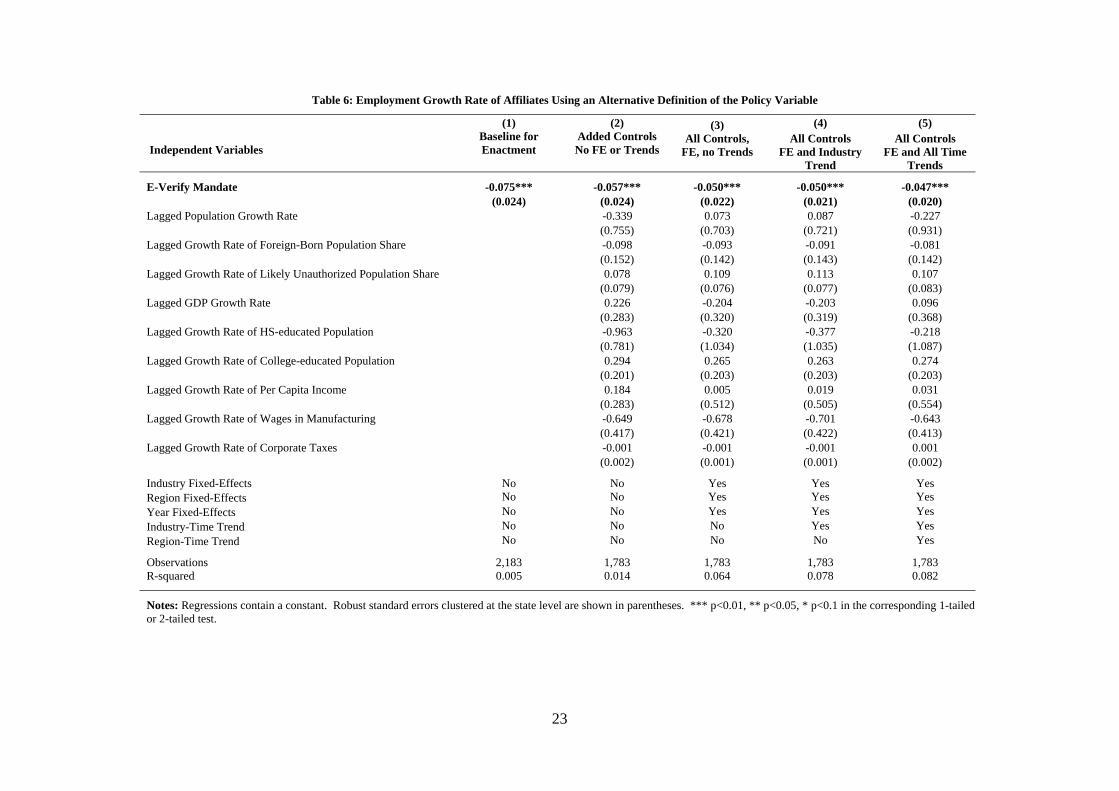
As shown in Table 1, there is often a lag between the enactment and actual
implementation date of many of these mandates. Because firms might make investment
decisions once a year and, therefore, might make their decisions before or after the
implementation date but following the enactment of an E-Verify mandate, we try an alternative
specification of the policy variable and drop all observations corresponding to the years between
the enactment and implementation dates. Table 6 displays the results from such an exercise.
The estimated impact of E-Verify mandates remains quite robust despite the change in the
definition of the policy variable, still lowering the employment growth rate of foreign affiliates
by approximately 5 percent in our most complete specification (column (5)).
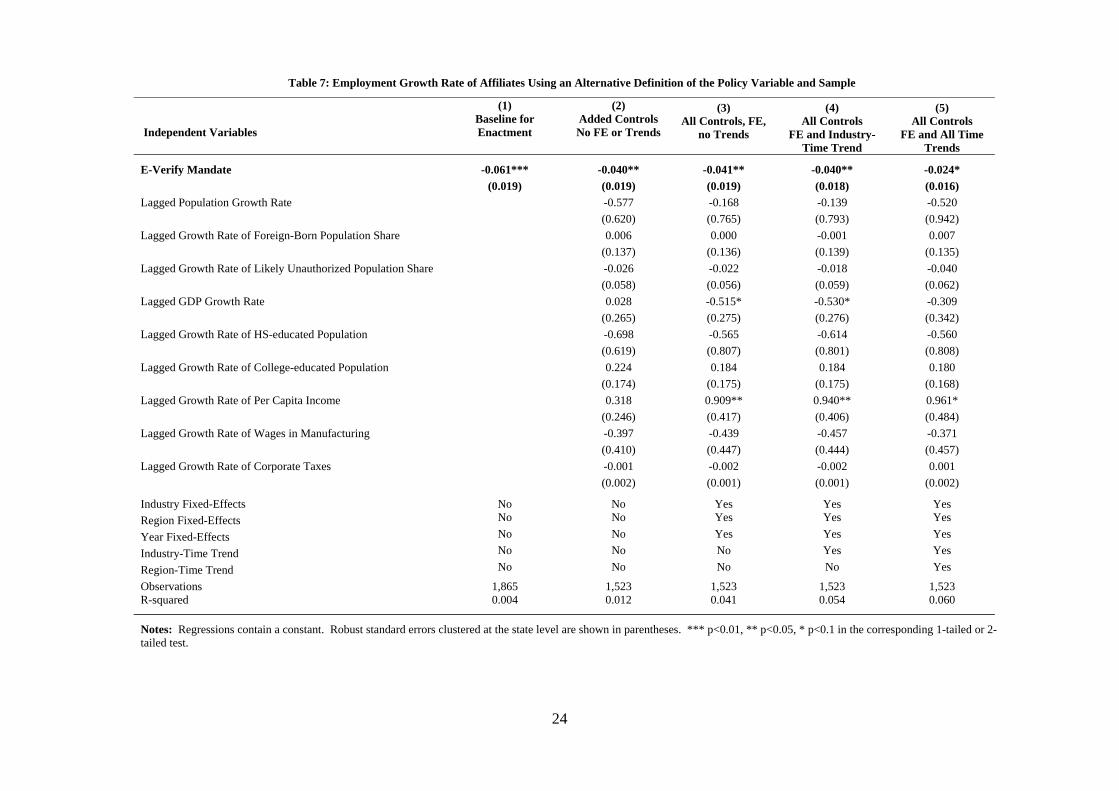
Lastly, we also contemplate making some changes to our sample. In particular, we drop
the observations corresponding to Oklahoma and to the employment of foreign affiliates in the
finance industry. For the period 2004-2006, the state of Oklahoma only provided a range for the
employment level of foreign-affiliates. To make use of this information, we compute the mid-
point value and use it in our analysis. However, as a robustness check, we drop those
observations. Additionally, we drop the information on the employment of foreign affiliates in
the finance industry as employment in this industry started to be recorded by the BEA at a later
14
date and, therefore, presents a large number of missing values. The results from such an exercise
are displayed in Table 7. Even after dropping a sizeable share of our sample, the size of the
estimated impact of E-Verify mandates on the employment of foreign affiliates is still consistent
with our previous findings. In particular, in the most complete specification (column (5) of
Table 7), E-Verify mandates still reduce the employment growth rate of foreign affiliates by 2.4
percent.
In sum, the results from Tables 5 through 7 suggest that E-Verify mandates do have a
negative and statistically significant on the employment of foreign affiliates. This effect might
be emerging through various channels. As found by some of the literature on foreign direct
investment for investment levels, greater flexibility in the host labor market is associated with
larger employment levels by foreign affiliates. Hence, the passing of E-Verify mandates might
inhibit the desire by some foreign investors to establish themselves in markets with increased
hiring controls. Even the enactment and implementation of an E-Verify mandate imposed on
public sector firms, agencies and contractors might be regarded by foreign investors as a sign of
forthcoming enhanced restrictions on hiring that eventually will be expanded to all firms in the
state –as it has indeed been the case in several states. The uncertainty associated to changing
employment conditions might be enough for firms to consider alternative locations for their
investments.
Alternatively, as noted by previous studies, E-Verify mandates may alter the residential
decisions of many migrants, both likely unauthorized as well as legal migrants living in mixed-
status families, thus reducing the immigrant presence in the state (Bohn et al. 2011). If
immigration rises foreign direct investment by lowering the risk of foreign investment through
increased information flows and a built in market (Gould 1994, Hisham 2011, Javorcik et al.
15
2011), E-Verify mandates may reduce the size of immigrant communities and, in turn, foreign
direct investment. Note, however, that the lagged growth rate of the foreign-born and likely
unauthorized population in the state should be capturing much of the impact that changes in the
share of immigrants might be having on the employment of foreign affiliates in the United
States. Hence, much of the impact of E-Verify mandates on the employment of foreign affiliates
in the United States is likely to be originating from increased hiring restrictions and the
uncertainty created by the introduction of employment policy changes.
Finally, one caveat to our analysis worth noting is the potential endogeneity of the policy
implementation. While there is no doubt that the passing of an E-Verify mandate by the state is
not a random event, it is unlikely to be a response to the employment of foreign affiliates in the
state. Rather, other factors we already control for, such as the growth rate in the foreign-born
population or the share of likely unauthorized immigrants in the state, are more likely to be
driving the enactment and implementation of the abovementioned policies.
VI. Summary and Conclusions
This paper investigates the impact that hiring restrictions mandated at the state level
through the enactment/implementation of E-Verify mandates have on the employment of foreign
affiliates. With that aim in mind, we construct a panel data set of the employment of foreign
affiliates by industry and by state from 2004 through the year 2010. We then use a quasi-
experimental methodology that exploits the variation in the enactment and implementation of E-
Verify mandates across states and over time to assess their impact on the employment of foreign
affiliates.
The results reveal a clearly negative impact of E-Verify mandates on the employment of
foreign firms, which persists even after accounting for a wide range of state-level determinants
16
of FDI, including the relative size of the foreign-born population in the state. On average, E-
Verify mandates appear to reduce the employment of foreign affiliates in the United States
anywhere between 4 and 5 percent using the most complete sample and model specification.
This is a sizeable and economically meaningful impact. To put in perspective, a 4 to 5 percent
reduction in employment levels translates to an average loss of 215,600 to 269,545 jobs in the
United States. The negative effect of the policy may be driven by the increased restrictions on
hiring placed by the mandates or by the uncertainty created by the passing of the mandate on
labor market flexibility and forthcoming restrictions that may follow.
Overall, the findings inform on, yet, other implications of employment verification
systems that may be worth considering by states and by the federal government in a hopefully
forthcoming comprehensive immigration reform.
Table 1 Enactment and Implementation Dates for E-Verify Mandates
Panel A. 2004-2010.
State Enactment Implementation Scope of the Mandate NC Aug-06 Jan-07 Public sector firms, agencies, and/or contractors first, Universal after Oct. 2011 GA Apr-06 Jul-07 Public sector firms, agencies, and/or contractors OK May-07 Nov-07 Public sector firms, agencies, and/or contractors ID Dec-06 Jan-08 Public sector firms, agencies, and/or contractors AZ Jul-07 Jan-08 Universal MN Jan-08 Jan-08 Public sector firms, agencies, and/or contractors MS Mar-08 Jul-08 Universal CO Jun-06 Aug-08 Public sector firms, agencies, and/or contractors SC Jun-08 Jan-09 Public sector firms, agencies, and/or contractors first, Universal after January 2012
MO Jul-08 Jan-09 Public sector firms, agencies, and/or contractors UT Mar-08 Jul-09 Public sector firms, agencies, and/or contractors first, Universal after March 2010 NE Apr-09 Oct-09 Public sector firms, agencies, and/or contractors
Panel B. 2010-2012.
State Enactment Implementation Scope of the Mandate FL Jan-11 Jan-11 Public sector firms, agencies, and/or contractors IN May-11 Jul-11 Public sector firms, agencies, and/or contractors LA Jul-11 Aug-11 Public sector firms, agencies, and/or contractors TN Jun-11 Jan-12 Universal
AL Jun-11 Apr-12 Universal VA Apr-10 Dec-12 Public sector firms, agencies, and/or contractors
Table 2 Summary Statistics: Average Employment of U.S. Affiliates of Majority Owned Foreign Direct Investment (in 000s)
Group Treatment (n=12) Control (n=39)
Year 2004 2010 2004 2010
Total Employment 77.1 77.0 107.1 113.2
(61.4) (58.8) (120.1) (127.8)
Manufacturing 35.5 33.2 40.7 40.3
(30.6) (26.6) (43.3) (43.5)
Wholesale Trade 7.9 8.1 11.9 11.6
(6.7) (7.2) (17.9) (16.4)
Retail Trade 8.9 6.9 12.9 10.8
(12.2) (10.3) (15.8) (12.8)
Information 2.9 3.8 5.3 5.4
(4.0) (4.4) (8.4) (8.2)
Finance 2.4 3.2 4.2 9.5
(2.5) (3.0) (8.1) (16.9)
Real Estate 0.8 0.6 1.3 1.2
(0.4) (0.7) (2.0) (2.0)
Professional 2.2 3.2 4.4 5.7
(1.5) (2.7) (7.0) (8.2)
Other 21.4 19.5 28.6 31.8 (11.8) (11.9) (34.9) (35.8)
Notes: Standard deviations are shown in parentheses.
19
Table 3 Summary Statistics: Employment of Affiliates by Year and Industry (Control Group)
Industry Fixed-Effects No No Yes Yes Yes Region Fixed-Effects No No Yes Yes Yes Year Fixed-Effects No No Yes Yes Yes Industry-Time Trend No No No Yes Yes Region-Time Trend No No No No Yes
Notes: Regressions contain a constant. Robust standard errors clustered at the state level are shown in parentheses. *** p<0.01, ** p<0.05, * p<0.1 in the corresponding 1-tailed or 2-tailed test.
23
Table 6: Employment Growth Rate of Affiliates Using an Alternative Definition of the Policy Variable
Industry Fixed-Effects No No Yes Yes Yes Region Fixed-Effects No No Yes Yes Yes Year Fixed-Effects No No Yes Yes Yes Industry-Time Trend No No No Yes Yes Region-Time Trend No No No No Yes
Notes: Regressions contain a constant. Robust standard errors clustered at the state level are shown in parentheses. *** p<0.01, ** p<0.05, * p<0.1 in the corresponding 1-tailed or 2-tailed test.
24
Table 7: Employment Growth Rate of Affiliates Using an Alternative Definition of the Policy Variable and Sample
Notes: Regressions contain a constant. Robust standard errors clustered at the state level are shown in parentheses. *** p<0.01, ** p<0.05, * p<0.1 in the corresponding 1-tailed or 2-tailed test.
25
References Amuedo-Dorantes, Catalina and Cynthia Bansak. 2012. “The Labor Market Impact of Mandated Employment Verification Systems” American Economic Review: Papers and Proceedings, 102(3): 1-7. Bohn, Sarah, Magnus Lofstrom and Steven Raphael. 2010. “The Effect of State-Level Legislation Targeted Towards Limiting the Employment of Undocumented Immigrants on the Internal Composition of State Populations: The Case of Arizona”, mimeo. Dewit, G., D. Leahy, and C. Montagna. 2003. “Employment Protection and Globalisation in Dynamic Oligopoly.” CEPR Discussion Paper 3871. Dewit, Gerda, Holger Gorg, Catia Montagna. 2009. “Should I Stay or Should I Go? Foreign Direct Investment, Employment Protection and Domestic Anchorage.” Review of World Economics, 145: 93-110. Foad, Hisham. 2011. “FDI and Immigration: A Regional Analysis” Annual Regional Science. DOI 10.1007/S00168-011-0438-4. Gonzalez, Daniel. 2008. “Illegal Workers Manage to Skirt Arizona Employer-Sanctions Law – Borrowed Identities, Cash Pay Fuel an Underground Economy”, Arizona Republic, November 30, 2008. At: www.azcentral.com/news/articles/2008/11/30/20081130underground1127.html Gould, D. 1994. “Immigration Links to the Home Country: Empirical Implications for U.S. Bilateral Trade Flows” Review of Economics and Statistics, 76(2): 302-16. Javorcik B., �zden, C., Spatareanu, M., Neagu, C. 2011. “Migrant Networks and Foreign Direct Investment” Journal of Development Economics, 94(2): 231-41. List, J. A. 2001. “U.S. Country-level Determinants of Inbound FDI: Evidence from a Two-Step Modified Count Data Model” International Journal of Industrial Organization, 19(2): 953-73. Nicoletti, G., S. Golub, D. Hajkova, D. Mirza and K-Y. Yoo. 2003. “Policies and international integration: Influences on trade and foreign direct investment.” OECD Economics Department Working Paper No. 359. Olney, William W. 2012. “A Race to the Bottom? Employment Protection and Foreign Direct Investment”. Williams College Department of Economics Working Papers 2011-02. Passel, Jeffrey, and D’Vera Cohn. 2010. “U.S. Unauthorized Immigration Flows Are Down Sharply Since Mid‐Decade.” Washington DC: Pew Hispanic Center. Rosenblum, Marc R. 2011. E-Verify: Strengths, Weaknesses, and Proposals for Reform. Washington, DC: Migration Policy Institute.
26
U.S. Government Accountability Office (GAO). 2011. “Federal Agencies Have Taken Steps to Improve E-Verify, but Significant Challenges Remain”, GAO-11-146, Jan 18, 2011. Woodward, D. 1992. “Locational Determinants of Japanese Manufacturing Start-Ups in the United States” Southern Economic Journal, 58: 69-708. Wooldridge, Jeffrey M. 2008. Introductory Econometrics: A Modern Approach (4th ed.). Ohio: South-Western Cengage Learning.
Notes: Regressions contain a constant. Robust standard errors clustered at the state level are shown in parentheses. *** p<0.01, ** p<0.05, * p<0.1 in the corresponding 1-tailed or 2-tailed test.