Page 1
1
THE IMPACT OF MARKETING CHANNELS USED BY U.S. MEAT GOAT
PRODUCERS ON FARM PROFITABILITY
Jeffrey Gillespie, Narayan Nyaupane, Kenneth McMillin, and Wes Harrison
Selected Paper prepared for presentation at the Southern Agricultural Economics Association (SAEA)
Annual Meeting , Dallas, TX, February 1-4, 2014
Copyright 2014 by Jeffrey Gillespie, Narayan Nyaupane, Kenneth McMillin, and Wes Harrison. All
rights reserved. Readers may make verbatim copies of this document for non-commercial purposes by
any means, provided this copyright notice appears on all such copies.
Page 2
2
THE IMPACT OF MARKETING CHANNELS USED BY U.S. MEAT
GOAT PRODUCERS ON FARM PROFITABILITY
Jeffrey Gillespie, Narayan Nyaupane, Kenneth McMillin, and Wes Harrison
This study investigates factors influencing the use of marketing channels in U.S. meat goat production.
Producer demographics, production system, socioeconomic, and regional variables impacted marketing
channel selection. Larger-scale producers selling goat meat or selling larger percentages of goats as
slaughter or as meat were more profitable.
Key words: marketing channels, meat goat, probit, profitability
INTRODUCTION
Effective product marketing is one of the most important aspects of business enterprises. To
successfully market products, it is important for a producer to have answers to three questions (1) what,
(2) where, and (3) when (Jones and Raper 2012). Sound understanding of market dynamics helps not only
in making immediate marketing decisions but also provides insights in designing future production
strategies. Although the rate of growth of the US meat goat industry has decreased in the last few years, it
has been one of the most rapidly growing agricultural industries over the past few decades, largely
because of increased demand from the immigrant population. In spite of its production growth, areas of
production and consumption are widely separated across the nation. Most of the U.S. meat goats are
produced in Texas and the Southeast whereas the major goat consuming population resides on the West
and East coasts of the U.S. (Pinkerton et al. 1991). Furthermore, the type of goat meat demanded widely
varies based on the origin of the immigrant population and their associated religious cultures. A number
of studies have discussed U.S. meat goat marketing dynamics and price seasonality (Pinkerton et al. 1991;
Frasor 2004; Larson and Thompson 2005; Jones et al. 2012; and Jones and Raper 2012). Some of the
initial meat goat marketing studies (Degner and Lin 1993; Glimp 1995) discussed the issues behind the
Page 3
3
meat goat production systems and consumer tastes and preferences on meat goat marketing. Other studies
have discussed goat marketing in different countries (Aduku et al. 1991; Pandit and Dhaka 2005). We
found no previous studies dealing with the what, where, and when questions of marketing, which are
prerequisites for a sustainable and competitive U.S. meat goat industry.
By using data collected from a nationwide mail-survey, this study provides comprehensive
information on the types of meat goats produced in the U.S., when producers market them, and where
they market them. This study further investigates the factors affecting the profitability of U.S. meat goat
farms. The specific objectives of this study are to determine: (1) how meat goats are marketed in U.S. and
factors affecting producer selection of marketing channels, and (2) the factors affecting profitability of the
meat goat enterprise, i.e., which of those marketing channels led to greater farm profit. Seven major
marketing channels were analyzed in this study: (a) live auctions, (b) dealers, brokers, or meat packers,
(c) wholesale and retail businesses, (d) selling of goat meat, (e) direct sale to consumers, (f) market
pooling, and (g) cooperatives.
U.S. Meat Goat Industry and Ethnic Demand
The U.S. population has increased significantly over the last 60 years (152.3 million in 1950 to
308.7 million in 2010) and a primary contributor has been immigration (Shrestha and Heisler 2011). The
foreign-born population residing in U.S. in 2005 was 12% of the total; the percentage is projected to be
19% by 2050 (Passel and Cohn 2008). Hispanics and the Asian population were 14% and 5% of the total
in 2005, respectively, expected to rise to 29% and 9%, respectively, in 2050. Having a significant increase
in immigrants especially from goat meat consuming nations, the US demand for meat goats has increased
in recent years, and this should continue to increase as long as there is an accelerated growth in the
immigrant population. Although there has been considerably increased domestic meat goat production
over the last few decades, the U.S. continues to fulfill its demand by importing frozen meat from
Australia and New Zealand. Meat goat imports of 1,749 metric tons in 1991 increased to 15,752 metric
tons in 2011, approximately equivalent to 1,052,340 live goats (Stanton 2012). Since most ethnic
Page 4
4
consumers prefer fresh meat over frozen, there is significant potential for growth and development of
domestic meat goat production (Knudson 2006).
In a typical meat goat supply chain, first, meat goats are marketed to the nearby live auction
markets. Second, dealers purchase them and sell them either to meat packers, wholesale businesses, or via
the regional auctions. Third, meat packers (who also have slaughterhouses) sell meat cuts or carcasses to
retailers and wholesale businesses arrange for further processing of animals (Stanton 2006). This typical
scenario is not universally the case for all farms and locations. In addition to the availability of markets,
the advantages/disadvantages associated with alternative markets are also considered to have significant
impacts on producer selection decisions.
Factors Influencing Producer Selection of Marketing Channels
In this study, we describe the producer selection decision using the following equation:
1. Selection of Marketing Channel(s) = f (Demographic Variables, Farming Characteristics,
Production Systems, Economic Indicators, Regional Variables)
Since the selection of a marketing channel can be described as a discrete choice (1 if selected; 0 if not
selected), the probability distribution of their selection can be estimated by using the probit (normal
distribution) function (Judge et al. 1988). In accordance with Greene (2008), the probability of a producer
selecting a given marketing channel can be described as:
2. Prob(Y=1|x) = ∫
The function is defined as the normal distribution function, Y=1 denotes that the marketing channel
has been selected, and x is a vector of explanatory variables hypothesized to influence the selection
decision.
Marginal effects for continuous and dummy variables are respectively estimated as follows
(Greene, 2008):
3. [ | ]
=
where is the standard normal density, and
Page 5
5
4. Prob[Y = 1| dx , d = 1] – Prob[Y = 1| dx , d = 0]
where dx , denotes the means of all the other variables in the model. Separate probit models were run for
each of the market outlets.
Independent Variables Used in the Probit Models
Num_meatgoats is the average total number of meat goats raised on the farm, serving as a proxy
for farm size. Sale_slaugh% is the percentage of goat sales for slaughter or as meat. Age is a continuous
variable representing the producers age in 15 year intervals, starting at 30 years. Bachelor is a dummy
variable indicating whether a producer holds at least a college bachelor’s degree. Offfarmjob is a dummy
variable representing the producer held an off-farm job. Risk averse is a dummy variable indicating that
the producer tends to avoid risk when possible in investment decisions. Farm_income is a continuous
variable indicating the percentage of annual net farm income derived from goat operation.
Four basic production systems may be used on U.S. meat goat farms. In pastured but not rotated,
PAS_notrot%, goats are pastured without using a management intensive rotational grazing system. In
pastured and rotated, PAS_rot%, pastures are cross-fenced into “paddocks” so that the animals can be
easily monitored in terms of grazing, feed supply, health, safety and many more. Animals are rotated in
this system. In a dry lot, Drylot%, goats are kept in a dry lot where there is no growing forage. Goats are
fed with purchased feed and/or hay. Extensive-range or pasture/woods, Extensive%, was used as the base.
In the extensive system, goats are not handled much. They are kept on large tracts of pasture or rangeland,
mostly “fending for themselves.” Goats forage for food and care for young with minimal assistance
(Coffey 2006).
Regional variables, Southeast (AL, AR, FL, GA, KY, LA, MS, NC, SC, TN, VA, and WV),
Northeast (CT, DE, MA, MD, ME, NH, NJ, NY, PA, RI, and VT), Midwest (KS, IA, IL, IN, MI, MN,
MO, ND, NE, OH, SD, and WI), and West (AK, AZ, CA, CO, HI, ID, MT, NM, NV, OR, UT, WA, and
WY) were used to capture the geographical differences around the nation. Land quality, market
availability, price, and many other key factors differ across the regions; therefore producer selection of
Page 6
6
marketing channels is also expected to differ across the country. Texas/Oklahoma (TX, and OK) was
considered as base.
Profitability Measures
There are two major approaches used in estimating farm profitability: the whole-farm approach
(Kopke et al. 2008, Young et al. 2011), and the enterprise approach (McBride et al. 2004, Gillespie et al.
2009); sometimes both are used (Tauer and Knoblach 1997, Gillespie et al. 2010). Using the whole-farm
approach, profit is estimated for the entire farm whereas in the enterprise approach it is estimated only for
the particular enterprise of interest. Profit can be further estimated in terms of per unit of land, per unit of
output, or per unit of breeding animals. Since land quality and output prices differ widely across the
country, thereby requiring estimation adjustments, we chose to estimate profit per breeding doe. Similar
to Tauer and Mishra (2006) with dairy, we found significant correlation between the total number of
breeding animals (does) and their production (number of goats) with a correlation coefficient of 0.88.
Advantages of using per unit breeding-animal-based analysis is that it is one major consistent measure of
estimation and can be predetermined unlike other farm products that are stochastic in nature and are
correlated to the error terms (Tauer and Mishra 2006).
Estimating Cost of Production: Costs associated only with meat goat production were measured
directly and those associated to the entire farm were adjusted according to the share of meat goat revenue
relative to total revenue. Direct total cost of meat goat production includes: operating costs (purchases of
meat goats; purchased feed; bedding and litter expenses; medical supplies, veterinary and custom
services; fuels, oils and lubricants; electricity; maintenance and repair for the upkeep of all farm
buildings, land improvements, and all other farm/ranch improvements; depreciation of farm assets used
for breeding goats; cash wages paid to hired farm and ranch labor plus payroll taxes and benefits; cash
value of feed, farm commodities, fuel, housing, meals, other food, utilities, vehicles for personal use, and
other non-cash payment for farm work) and marketing and storage expenses.
Other operating expenses shared for the entire farm include: seeds, sets, plants, seed cleaning and
treatments, transplants, trees, and nursery stock; nutrients, fertilizer, lime, and soil conditioners; bio-
Page 7
7
controls and agricultural chemicals for crops, livestock, poultry, and general farm use; all other utilities
and water for irrigation; water purchased for irrigation or otherwise, internet access etc.; farm supplies,
marketing containers, hand tools, and farm shop power equipment; repairs, parts, and accessories for
motor vehicles, machinery, and farm equipment; insurance for the farm business; interest and fees paid on
debts for the operation; property taxes paid on farm real estate (land and buildings), livestock, machinery,
and other farm production items; renting or leasing of tractors, farm vehicles, equipment, or storage
structures; farm vehicle and licensing fees; custom work, performed by machines and labor hired as a
unit; and professional or farm management services such as record-keeping, accounting, tax and business
planning, farm product advice, conservation practices, etc. These were allocated to the goat enterprise
according to the percentage of total farm revenues from meat goats.
Estimating returns: Total meat goat related revenue was estimated by summing the total sales of
goats for meat, breeding stock, and goat meat. Other farm revenue was generated by the sale of field
crops, hay and silage, fruits and vegetables, animals and animal products other than meat goats and their
related products. After adjusting the costs associated to the entire farm, net enterprise profit was estimated
by subtracting meat goat related total costs from those of total meat goat related revenue. Net enterprise
profit was divided by the total number does bred in 2011.
Factors Affecting Farm Profitability
Enterprise profit per breeding doe was modeled as the following OLS equation:
5. Profit = f(Marketing Channels, Number of Meat Goats, Types of Animals Sold, Producer
Demographics, Production Systems Used, and Regional Variables)
Independent variables used in this equation include the marketing channels analyzed in the first-
stage probit runs; therefore endogeneity was suspected. Testing for endogeneity was conducted for each
of the marketing channels by using 4 different instruments, gs2_smallacre, mp4_targmarket,
poic1_foreign, and marketinfo, respectively, for sales to dealers, selling of meat, direct to consumer, and
auction market. Gs2_smallacre is a continuous variable representing the extent of producers’ agreement
that ‘they can raise goats on a relatively small acreage’ as a reason of selecting goat enterprise as opposed
Page 8
8
to other agricultural enterprises. Mp4_targmarket is a dummy variable indicating that producers target
their goat production to specific ethnic holiday markets. Poic1_foreign shows the extent to which
producers agree or disagree that the surplus supply of foreign goat meat product has significant negative
impacts on goat producers in their areas. Marketinfo shows the total number of primary information
sources producers use to know the market prices of goats. The alternative sources include: extension
service; media - TV, radio, or magazines; other farmers; the internet; farm organizations; and others. The
first-stage probit models were run with the core variables and the respective instrument mentioned above
for each marketing channel. Then the residuals from each of those models were included in the second-
stage Ordinary Least Square regression on farm profitability. The significance of the residuals in OLS
regression would serve as an indicator of endogeneity. No endogeneity problem was found.
DATA
A mail survey was sent to 1,600 U.S. meat goat producers during Summer and early Fall, 2012,
using Dillman’s Tailored Design Method (2007). Producer names were collected online. Phrases like
“meat goat producers in Louisiana,” “meat goat association, LA,” or “meat goat farms, Louisiana” were
entered for each state and 4-5 Google pages were thoroughly visited if there were any web-links available
for the meat goat producers. Most of the producers were found as members of meat goat associations, or
they were listed in www.eatwild.com. Some of the addresses were also collected by individually visiting
the respective websites of the farms. The first round of mailing included a cover letter, a ten page
questionnaire, a complementary pen, and a postage-paid return envelope. After one week, the first
postcard reminder was sent to non-respondents. This was followed by a new cover letter, a survey, and a
return envelope to non-respondents two weeks later. One week later, a final reminder (second postcard)
was sent. All of the follow-ups were made only to the non-respondents as of the date. After removing 190
producers who did not produce meat goats during 2011 and 52 undeliverable from the total population, an
adjusted response rate of 43% was received with the 584 completed responses.
Page 9
9
To determine the marketing channels producers used, the following question was asked: “Which
of the following marketing channels do you use to sell goats? (Check all that apply),” with possible
choices: (a) Dealers, brokers, or meat packers, (b) Wholesale and retail businesses, (c) I sell goat meat, (d)
Live auctions, (e) Market pooling, (f) Direct sale to consumers, and (g) Cooperatives. The above question
was followed by: “If you answered that you sell goat meat [(c)], through what outlets do you market the
meat?,” with possible choices: (a) Farmers markets, (b) Direct to consumers, (c) Grocery stores, (d)
Restaurants, and (e) Other. To meet the second objective, a question was asked as follows: “Do you target
your goat production for specific ethnic holiday markets?,” with possible choices of “Yes” and “No.”
Producers responding “Yes” to the above question were directed to a follow-up question as follows: “For
which of the following holiday seasons do you generally focus sales? (Circle all that apply),” with the
following possible choices: (a) Easter, (b) Ramadan, (c) Id al Adha, (d) Hispanic holidays, (e) Christmas
and/or New Year, (f) Dashain, (g) Caribbean holidays, and (h) Other. Most of these ethnic holidays have
their own characteristic demands of specific types of meat goats. To study the consistency between the
use of ethnic holiday markets and an annual goat sale, information on different types of meat goats sold
were collected by the following question: “Please list the total number of goats you sold in each of the
following categories during 2011.” Possible choices were: “(a) Suckling kids, (b) Weaned kids (≤30 lbs),
(c) Wethers (>30 lbs), (d) Bucks (31- 120 lbs), (e) Bucks (>120 lbs), (f) Does (31-100 lbs), (g) Does
(>100 lbs), and (h) Other.”
At the end of the survey, producers were asked if they were willing to participate in a follow-up
survey related to production costs and returns. A total of 433 producers responded “yes.” The follow-ups
were sent and 127 completed responses were received.
RESULTS
Table 1 shows the percentage use of different marketing channels by US meat goat producers.
Two marketing channels found to be the most commonly used were direct to consumer (79%) and live
auction (65%), whereas others were used by relatively smaller portions of the population. Fifteen percent
Page 10
10
of the producers used dealers, brokers, or meat packers, 11% sold goat meat, 5% used market pooling,
3% used wholesale and retail businesses, and 3% used cooperatives. Since very few farms used 3
marketing channels (Wholesale and retail businesses, market pooling, and cooperatives), only the 4 more
frequently used marketing channels (direct sale to consumer, live auction, dealers, brokers, or meat
packers, and I sell goat meat) were used in the profitability runs.
Table 1: Percentage use of marketing channels
Marketing Channels Percent using
Direct sale to consumer 79
Live auction 65
Dealer, brokers, or meat packers 15
I sell goat meat 11
Market pooling 5
Wholesale and retail businesses 3
Cooperatives 3
Summary Statistics of the Variables Used in This Study
Table 2 describes the summary statistics of the independent variables used in the probit runs for
producer selection of marketing channels. On average, there were 61 meat goats per farm. The average
age of survey respondents was 52 years and 45% of the respondents had at least a bachelor’s degree.
Sixty-one percent of the respondents held an off farm job, and 45% considered themselves as risk averse.
The average annual net farm income derived from goat operation was found to be 40%. Forty-five percent
of the goats sold in 2011 were slaughter goats. Geographically, most of the respondents were in the
Southeast (36%) and Midwest (37%); and significantly smaller share of population were in the Northeast
(7%), West (9%), and Texas/Oklahoma (11%).
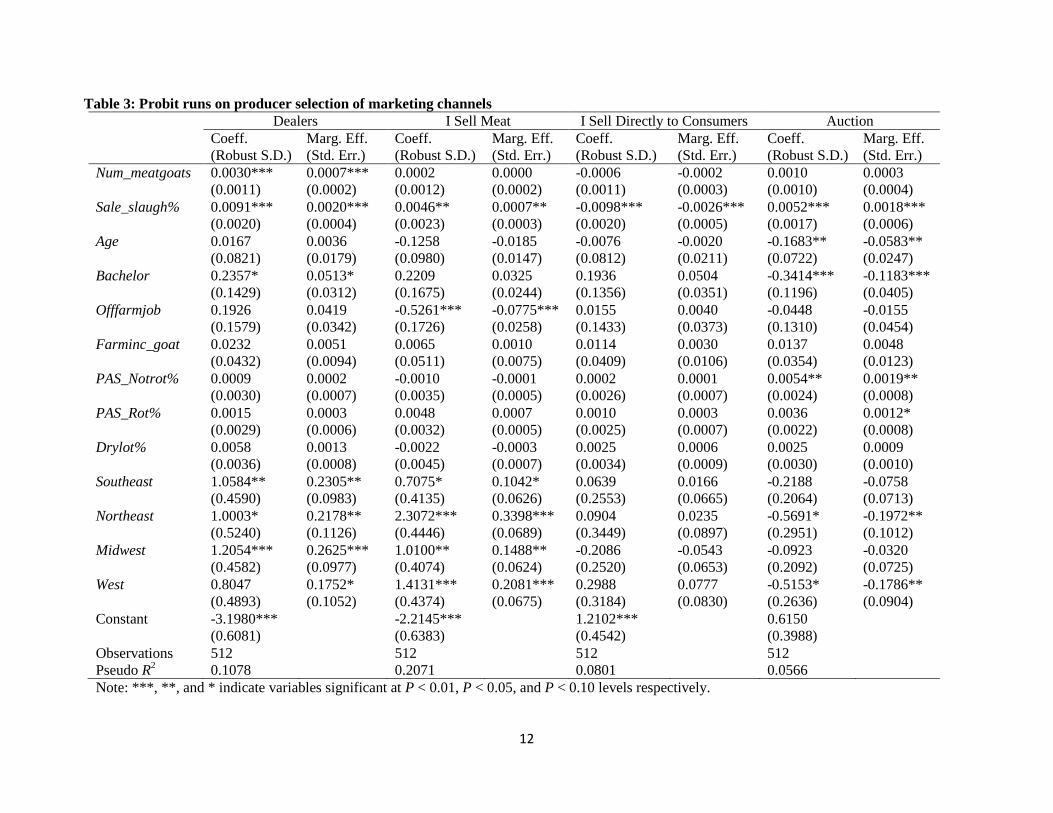
Factors Affecting Producer Selection of Meat Goat Marketing Channels
Larger-scale farmers were more likely to market animals via dealers and wholesale markets.
Producers selling higher percentages of slaughter animals were more likely to market via dealers, live
auctions, and cooperatives, were more likely to sell goat meat, and were less likely to sell direct to
Page 11
11
consumers. Age of the producer was negatively associated with the use of live auction markets. Producers
holding a bachelor’s degree were more likely to market via dealers and less likely to market via live
auction markets. Producers holding an off farm job were less likely to sell goat meat, but were more likely
to market via cooperatives. Producers receiving a higher percentage of net farm income from the goat
enterprise (Farminc_goat) were more likely to sell via wholesale and retail markets. As compared to the
producers having extensive-range production systems, those using pastured but not rotated systems
(PAS_NotRot%) were more likely to use auction markets and were less likely to market via wholesale
outlets and cooperatives whereas those with pastured with rotation systems (PAS_Rot%) had narrowly
positive marginal effects on auction markets.
Table 2: Means of independent variables used in the probit runs
Variables Description Mean
Num_meatgoat Total number of meat goats in the farm 60.84
Sale_Slaugh% Percentage of goat sold for slaughter or as meat 44.61
Age Producer age (years):
(a) ≤30, (b) 31-45, (c) 46-60, (d) 61-75, (e) ≥76 2.95
Bachelor Dummy = Whether producer holds at least a bachelor’s degree:
(a) Less than high school, (b) high school diploma/GED, (c) some
college/technical college, (d) bachelor’s degree, (e) advanced degree
(M.S., Ph.D., J.D., M.D., etc.)
0.45
Offfarmjob Dummy = Whether a producer holds an off farm job 0.61
Riskaverse Dummy = Producer self-characterization relative to other investors:
(I tend to avoid risk when possible in my investment decision.) 0.45
Farminc_goat Percentage annual net farm income derived from goat operation:
(a) 0-19% (b) 20-39% (c) 40-59% (d) 60-79% (e) 80-100% 2.52
Extensive% Percentage of meat goats raised under this system 10.53
PAS_NotRot% Percentage of meat goats raised under this system 28.59
PAS_Rot% Percentage of meat goats raised under this system 47.84
Drylot% Percentage of meat goats raised under this system 13.03
Southeast Producers belong to the states: AL, AR, FL, GA, KY, LA, MS, NC, SC,
TN, VA, and WV 0.36
Northeast Producers belong to the states: CT, DE, MA, MD, ME, NH, NJ, NY, PA,
RI, and VT 0.07
Midwest Producers belong to the states: KS, IA, IL, IN, MI, MN, MO, ND, NE,
OH, SD, and WI 0.37
West Producers belong to the states: AK, AZ, CA, CO, HI, ID, MT, NM, NV,
OR, UT, WA, and WY 0.09
Texas/Oklahoma Producers belong to the states: TX, and OK 0.11
Page 12
12
Table 3: Probit runs on producer selection of marketing channels
Dealers I Sell Meat I Sell Directly to Consumers Auction
Coeff.
(Robust S.D.)
Marg. Eff.
(Std. Err.)
Coeff.
(Robust S.D.)
Marg. Eff.
(Std. Err.)
Coeff.
(Robust S.D.)
Marg. Eff.
(Std. Err.)
Coeff.
(Robust S.D.)
Marg. Eff.
(Std. Err.)
Num_meatgoats 0.0030***
(0.0011)
0.0007***
(0.0002)
0.0002
(0.0012)
0.0000
(0.0002)
-0.0006
(0.0011)
-0.0002
(0.0003)
0.0010
(0.0010)
0.0003
(0.0004)
Sale_slaugh% 0.0091***
(0.0020)
0.0020***
(0.0004)
0.0046**
(0.0023)
0.0007**
(0.0003)
-0.0098***
(0.0020)
-0.0026***
(0.0005)
0.0052***
(0.0017)
0.0018***
(0.0006)
Age 0.0167
(0.0821)
0.0036
(0.0179)
-0.1258
(0.0980)
-0.0185
(0.0147)
-0.0076
(0.0812)
-0.0020
(0.0211)
-0.1683**
(0.0722)
-0.0583**
(0.0247)
Bachelor 0.2357*
(0.1429)
0.0513*
(0.0312)
0.2209
(0.1675)
0.0325
(0.0244)
0.1936
(0.1356)
0.0504
(0.0351)
-0.3414***
(0.1196)
-0.1183***
(0.0405)
Offfarmjob 0.1926
(0.1579)
0.0419
(0.0342)
-0.5261***
(0.1726)
-0.0775***
(0.0258)
0.0155
(0.1433)
0.0040
(0.0373)
-0.0448
(0.1310)
-0.0155
(0.0454)
Farminc_goat 0.0232
(0.0432)
0.0051
(0.0094)
0.0065
(0.0511)
0.0010
(0.0075)
0.0114
(0.0409)
0.0030
(0.0106)
0.0137
(0.0354)
0.0048
(0.0123)
PAS_Notrot% 0.0009
(0.0030)
0.0002
(0.0007)
-0.0010
(0.0035)
-0.0001
(0.0005)
0.0002
(0.0026)
0.0001
(0.0007)
0.0054**
(0.0024)
0.0019**
(0.0008)
PAS_Rot% 0.0015
(0.0029)
0.0003
(0.0006)
0.0048
(0.0032)
0.0007
(0.0005)
0.0010
(0.0025)
0.0003
(0.0007)
0.0036
(0.0022)
0.0012*
(0.0008)
Drylot% 0.0058
(0.0036)
0.0013
(0.0008)
-0.0022
(0.0045)
-0.0003
(0.0007)
0.0025
(0.0034)
0.0006
(0.0009)
0.0025
(0.0030)
0.0009
(0.0010)
Southeast 1.0584**
(0.4590)
0.2305**
(0.0983)
0.7075*
(0.4135)
0.1042*
(0.0626)
0.0639
(0.2553)
0.0166
(0.0665)
-0.2188
(0.2064)
-0.0758
(0.0713)
Northeast 1.0003*
(0.5240)
0.2178**
(0.1126)
2.3072***
(0.4446)
0.3398***
(0.0689)
0.0904
(0.3449)
0.0235
(0.0897)
-0.5691*
(0.2951)
-0.1972**
(0.1012)
Midwest 1.2054***
(0.4582)
0.2625***
(0.0977)
1.0100**
(0.4074)
0.1488**
(0.0624)
-0.2086
(0.2520)
-0.0543
(0.0653)
-0.0923
(0.2092)
-0.0320
(0.0725)
West 0.8047
(0.4893)
0.1752*
(0.1052)
1.4131***
(0.4374)
0.2081***
(0.0675)
0.2988
(0.3184)
0.0777
(0.0830)
-0.5153*
(0.2636)
-0.1786**
(0.0904)
Constant -3.1980***
(0.6081)
-2.2145***
(0.6383)
1.2102***
(0.4542)
0.6150
(0.3988)
Observations 512 512 512 512
Pseudo R2 0.1078 0.2071 0.0801 0.0566
Note: ***, **, and * indicate variables significant at P < 0.01, P < 0.05, and P < 0.10 levels respectively.
Page 13
13
Table 3: Probit runs for producer selection of marketing channels, continued
Wholesale Cooperatives Market Pooling
Coeff.
(Robust S.D.)
Marg. Eff.
(Std. Err.)
Coeff.
(Robust S.D.)
Marg. Eff.
(Std. Err.)
Coeff.
(Robust S.D.)
Marg. Eff.
(Std. Err.)
Num_Meatgoats 0.0021*
(0.0012)
0.0001
(0.0001)
0.0003
(0.0013)
1.4E-05
(7.3E-05)
-0.0017
(0.0014)
-0.0002
(0.0001)
Sale_slaugh% -0.0023
(0.0028)
-0.0001
(0.0002)
0.0070**
(0.0033)
0.0004*
(0.0002)
0.0034
(0.0025)
0.0003
(0.0002)
Age 0.0016
(0.1326)
0.0001
(0.0074)
0.2340
(0.1432)
0.0132
(0.0090)
0.1637
(0.1049)
0.0152
(0.0100)
Bachelor 0.4776*
(0.2761)
0.0265*
(0.0151)
0.1324
(0.2394)
0.0075
(0.0135)
-0.1295
(0.2046)
-0.0120
(0.0189)
Offfarmjob -0.1061
(0.2709)
-0.0059
(0.0150)
0.6911**
(0.2974)
0.0389**
(0.0192)
-0.2769
(0.1990)
-0.0257
(0.0186)
Farminc_goat 0.1814**
(0.0752)
0.0101**
(0.0043)
-0.0065
(0.0750)
-0.0004
(0.0042)
0.0084
(0.0589)
0.0008
(0.0055)
PAS_Notrot% -0.0099**
(0.0045)
-0.0005**
(0.0003)
-0.0089*
(0.0046)
-0.0005*
(0.0003)
-0.0047
(0.0037)
-0.0004
(0.0003)
PAS_Rot% -0.0065
(0.0040)
-0.0004
(0.0002)
-0.0032
(0.0039)
-0.0002
(0.0002)
-0.0031
(0.0034)
-0.0003
(0.0003)
Drylot% -0.0090
(0.0057)
-0.0005
(0.0003)
-0.0020
(0.0055)
-0.0001
(0.0003)
-0.0019
(0.0054)
-0.0002
(0.0005)
Southeast 4.7682***
(0.6273)
0.2647***
(0.0722)
0.2717
(0.4385)
0.0153
(0.0249)
4.9702***
(0.5410)
0.4608***
(0.0916)
Northeast 6.2586***
(0.6268)
0.3475***
(0.0844)
Midwest 5.1734***
(0.6140)
0.2872***
(0.0757)
0.4213
(0.4262)
0.0237
(0.0247)
5.3066***
(0.5729)
0.4920***
(0.0965)
West 4.9330***
(0.6884)
0.2739***
(0.0736)
1.0920**
(0.4456)
0.0615**
(0.0279)
4.8314***
(0.5651)
0.4479***
(0.0903)
Constant -7.1633
(0.0000)
-3.5851***
(0.6535)
-6.7608
(0.0000)
Observations 512 511 512
Pseudo R2 0.2444 0.1628 0.0981
Note: ***, **, and * indicate variables significant at P < 0.01, P < 0.05, and P < 0.10 levels respectively.
Page 14
14
Results for the regional variables show that, as compared to the producers in TX and OK,
producers in the other regions (Southeast, Northeast, Midwest, and West) were more likely to market via
dealers, brokers, or meat packers; and wholesale and retail businesses; and were more likely to sell goat
meat. Producers residing in the Northeast and the West were less likely to sell via live auction markets.
Producers in the Southeast, Midwest, and West were found to be more likely to use market pooling.
Producers in the West were also found to be more likely to form cooperatives in marketing their meat
goats. Northeast was dropped from the regression for the market pooling and cooperatives. Overall, this
result shows that the producer selection of marketing channels varied significantly based on region, which
could be primarily because of the availability of the markets, population density and its diversity, and
differential cost of production/marketing.
Table 4 shows the results of the OLS run on factors affecting the profitability of the meat goat
enterprise. As mentioned earlier, only the four most commonly used marketing channels were used in this
analysis. The only marketing outlet that was more likely to be profitable was ‘I sell goat meat’. Size of
the farm (Num_meatgoats) and percentage sale of slaughter goats (Sale_slaugh%) were also positively
associated with enterprise profit.
Page 15
15
Table 4: Profitability run; marketing channels and other variables
Variables Coefficient Robust S.E.
Dealers 37.29 210.44
I sell meat 340.97* 174.57
Consumer -191.24 209.66
Auction 192.28 212.64
Num_meatgoats 4.44* 2.30
Sale_slaugh% 5.07* 2.82
Age 19.94 87.16
Bachelor 143.55 203.20
Off farm job 420.80 285.12
Risk averse 191.42 189.68
Farmincome_goat 39.19 47.21
PAS_NotRot% -0.75 3.18
PAS_Rot% -0.28 3.90
Drylot% -7.10 6.10
Southeast 196.34 265.66
Northeast 172.85 325.50
Midwest -325.64 384.90
West 28.90 390.54
Constant - 1527.97** 676.49
Observations 94
R2
0.2022
DISCUSSION AND CONCLUSIONS
Using nationwide survey data, this study examines three major aspects of meat goat marketing in
the United States, the factors affecting producer use of marketing channels, and the factors affecting
profitability of a meat goat enterprise. Results showed that direct sale to consumer and live auction were
the two most commonly used marketing channels in the industry. Very few producers, 11% and 15%,
were found to sell goat meat and use dealers, brokers, or meat packers, respectively, whereas other
marketing channels were used by less than 5% each. Farm size, type of animals sold, producer
demographics, production systems, and regional variables were found to be significant determinants in
producer selection of marketing channels.
Page 16
16
Producers tended to select marketing channels that required minimal animal handling and limited
producer responsibilities. Marketing channels such as dealers, brokers, or meat packers; and wholesale
and retail businesses require either to pay commission or to perform systematic arrangements of
slaughter, processing and transporting to the consumers. On the other hand, live auctions are easier, have
guaranteed timely payment and provide a competitive price if more buyers are competing. Selling direct
to consumers reduces transportation costs. Note that producers selling larger numbers of slaughter goats
were less likely to directly sell to consumers but to sell via live auction, which is understandable in that
dealing with consumers for individual animals would be cumbersome as the volume of sale increases.
One of the limitations of directly selling to consumers is that one needs to be skillful to deal with
customers and have bargaining power, unless the price is fixed beforehand. Producers selling breeding
stock and show goats generally advertise their price online and it would be probably convenient for them
to use this outlet. On the other hand, regional variables showed producers in the Northeast and West were
less likely to use live auction markets as compared to those in Texas/Oklahoma.
Selling goat meat requires significant time spent on searching and maintaining business
relationships with clients, maintaining inspection standards, and having reliable sources of regular meat
supply. Although on-farm selling of goat meat is relatively easier in the sense that you do not have to
meet slaughter inspection standards as the ownership of the animal is transferred to the consumers before
slaughter, producers still have to spend considerable time if they chose this route. Therefore, it was
evident that producers holding an off farm job were less likely to sell goat meat. Although producers were
inclined towards the marketing channels requiring less marketing effort, the more profitable route found
from this study was rather time demanding - selling goat meat.
REFERENCES
Aduku, A.O., A.A. Aganga, I.D.I. Yaakugh, and D.O.A. Philip. 1991. “The Marketing of Goats in
Northern Nigeria.” Small Ruminant Research 6(1): 175-178.
Coffey L. 2006. “General Overview of Goat Production.” Meat Goat Production Handbook.
Page 17
17
Degner, R.L., and C.T.J. Lin. 1993. Marketing Goat Meat: An Evaluation of Consumer Perceptions and
Preferences. University of Florida, Food Resource Economics Department, Florida Agricultural
Market Research Center.
Dillman, D.A. 2007. Mail and Internet Surveys: The Tailored Design Method. John Wiley & Sons. New
York.
Frasor, R. 2004. The Market for Goat Meat in Central Alabama.
http://www.ams.usda.gov/AMSv1.0/getfile?dDocName=STELPRD3319274
Gillespie, J.M., R. Nehring, C. Hallahan, C. Sandretto, and L. Tauer. 2010. “Adoption of Recombinant
Bovine Somatotropin and Farm Profitability: Does Farm Size Matter?” AgBioForum 13(3): 251-
262.
Gillespie, J.M., R. Nehring, C. Hallahan, and C. Sandretto. 2009. Pasture-based Dairy Systems: Who Are
the Producers and Are Their Operations More Profitable than Conventional Dairies?" Journal of
Agricultural and Resource Economics 34(3): 412-427.
Glimp, H.A. 1995. Meat Goat Production and Marketing. Journal of Animal Science 73(1): 291-295.
Greene, W.H. 2008. Econometric Analysis. Sixth Edition. Pearson Prentice Hall. Upper Saddle River,
New Jersey 07458.
Jones J.J., and K.C. Raper. 2012. Meat Goat Marketing and Price Seasonality. Oklahoma Cooperative
Extension Service. AGEC-622. Division of Agricultural Sciences and Natural Resources.
Oklahoma State University.
http://pods.dasnr.okstate.edu/docushare/dsweb/Get/Document-7530/AGEC-622pod.pdf
Jodie P. and M. McCarter. 2012. Marketing of Meat Goats. Agriculture and Natural Resources.
University of Arkansas, Division of Agriculture, Research and Extension. FSA-3094.
http://ar.marketmaker.uiuc.edu/uploads/da0c52ec76dbd91858d6f9e35adf9897.pdf
Judge, G.G., R.C. Hill, W.E. Griffths, H. Lutkephol, and T. Lee. 1988. Introduction to the Theory and
Practice of Econometrics, Second Edition. John Wiley and Sons, New York.
Knudson, W.A. 2006. Market Opportunities for Meat Goats. Michigan State University Product Center
for Agriculture and Natural Resources.
Kopke, E., J. Young, and R. Kingwell. 2008. The Relative Profitability and Environmental Impacts of
Different Sheep Systems in a Mediterranean Environment. Agricultural Systems 96(1): 85-94.
Larson A. and E. Thompson. 2005. Niche and Ethnic Markets for Goat Meat in Illinois. Initiatives for the
Development of Entrepreneurs in Agriculture (IDEA), University of Illinois Extension.
http://www.marketmaker.uiuc.edu/uploads/dc0ce7248ccaae7b1b2e172d2f11dff9.pdf
McBride, W.D., S. Short, and H. El-Osta. 2004. The Adoption and Impact of Bovine Somatotropin on US
Dairy Farms. Applied Economic Perspectives and Policy 26(4): 472-488.
Pandit, A., and Dhaka, J. P. 2005. Efficiency of Male Goat Markets in the Central Alluvial Plains of West
Bengal. Agricultural Economics Research Review 18(2): 197-209.
Page 18
18
Passel J.S. and D. Cohn. 2008. “U.S. Populations Projections: 2005-2050.” Pew Research Center, Social
and Demographic Trends. www.pewresearch.org
Pinkerton, F., D. Scarfe, and B.W. Pinkerton. 1991. Meat Goat Production and Marketing. E.(Kika) de la
Garza Institute for Goat Research. http://www.luresext.edu/goats/library/fact_sheets/m01.htm
Stanton, T. 2012. An Overview of the Meat Goat Market 2012.
http://sheepgoatmarketing.info/education/meatgoatmarket.php
Stanton, T. 2006. Marketing Slaughter Goats and Goat Meat. Meat Goat Production Hand Book.
American Institute for Goat Research. E(Kika) de la Garza. Langston University.
Shrestha, L.B., and E.J. Heisler. 2011. The Changing Demographic Profile of the United States.
Congressional Research Service Report for Congress (March).
http://www.fas.org/sgp/crs/misc/RL32701.pdf
Tauer, L.W. and W.A. Knoblauch. 1997. The empirical impact of bovine somatotropin on New York
dairy farms. Journal of Dairy Science, 80(6), 1092-1097.
Tauer, L.W., and A.K. Mishra. 2006. Can the Small Dairy Farm Remain Competitive in US Agriculture?
Food Policy 31(5): 458-468.
Young, J.M., A.N. Thompson, M. Curnow, and C.M. Oldham. 2011. Whole-farm Profit and the Optimum
Maternal Liveweight Profile of Merino Ewe Flocks Lambing in Winter and Spring are Influenced
by the Effects of Ewe Nutrition on the Progeny's Survival and Lifetime Wool Production. Animal
Production Science 51(9): 821-833.