Page 1
THE IMPACT OF MICROFINANCE ON FORMAL FINANCIAL SECTOR
DEVELOPMENT IN KENYA
BY
JOSEPH KEREGOMBE
D61/7066/2006
A RESEARCH PROJECT SUBMITTED IN PARTIAL FULFILLMENT OF THE
REQUIREMENTS FOR THE AWARD OF THE DEGREE OF MASTER OF
BUSINESS ADMINISTRATION (MBA) OF UNIVERSITY OF NAIROBI
OCTOBER, 2011
Page 2
DECLARATION
This management research project is my original work and has not been submitted
for moderation in any other University.
18th October 2011
Signature:........................................... D a te :..............................................
JOSEPH KERE GOMBE
D61/7066/2006
This research project has been submitted for examination with my approval as a
university supervisor.
i
Page 3
ABSTRACT
The importance of the financial system to economic development is well understood
and Kenya's long-term national strategy, Vision 2030, identified the sector as one of
the country's core growth pillars. Key to the success of the Kenya's financial system
is the microfinance. Its contribution in the economic development of Kenyan
economy through the promotion of micro and small enterprises is now widely
recognized as a viable and dynamic strategy for achieving national goals, including
employment creation and poverty alleviation.
Despite the grandeurs role played by this sector, studies are limited in terms of
showing the impact of microfinance on the financial sector development. This
research sought to evaluate the contributions of microfinance towards financial
sector development in Kenya.
Key words: Microfinance, Financial Sector Development, Macroeconomic impact.
ii
Page 4
TABLE OF CONTENTS
DECLARATION.......................................................................................................i
ABSTRACT............................................................................................................ ii
LIST OF ABBREVIATIONS.................................................................................. v
LIST OF TABLES................................................................................................. vi
LIST OF FIGURES..............................................................................................vii
CHAPTER O N E..................................................................................................... 1
INTRODUCTION..................................................................................................1
1.1 Background...................................................................................................1
1.2 Statement of the Problem............................................................................6
1.3 Objective of the Study................................................................................. 7
1.4 Importance of the Study..............................................................................8
CHAPTER TW O ....................................................................................................9
LITERATURE REVIEW ........................................................................................9
2.1 Introduction................................................................................................. 9
2.2 Theoretical Literature....................................................................................9
2.3 Empirical Literature..................................................................................... 16
2.4 Summary of Literature................................................................................22
CHAPTER THREE...............................................................................................23
RESEARCH METHODOLOGY............................................................................ 23
3.1 Introduction................................................................................................23
3.2 Research Design......................................................................................... 23
3.3 Population...................................................................................................23
3.4 Data Collection........................................................................................... 23
3.5 Data Analysis.............................................................................................. 24
CHAPTER FOUR.................................................................................................26
DATA ANALYSIS AND RESULTS......................................................................26
4.1 Introduction................................................................................................26
4.2 Descriptive Analysis....................................................................................26iii
Page 5
4.3 Multivariate Analysis................................................................................... 32
4.4 Chapter Summary....................................................................................... 44
CHAPTER FIVE................................................................................................... 46
SUMMARY, CONCLUSION AND RECOMMENDATIONS..................................46
5.1 Introduction................................................................................................46
5.2 Summary and Discussion of Findings......................................................... 46
5.3 Conclusions.................................................................................................47
5.4 Recommendations......................................................................................48
5.5 Limitations of the study.............................................................................. 49
5.6 Suggestions for Further Research............................................................... 49
REFERENCES..................................................................................................... 51
APPENDICES..................................................................................................... 57
iv
Page 6
LIST OF ABBREVIATIONS
MFI Microfinance Institutions
BRI Bank Rakyat Indonesia
IMF International Monetary Fund
GDP Gross Domestic Product
NGO Non Governmental Organizations
KWFT Kenya Women Finance Trust
SMEP Small and Medium Enterprise Programme
KSTES Kenya Small Traders and Entrepreneurs Society
ECLOF Ecumenical Loans Fund
KPSOB Kenya Post Office Savings Bank
AM FI Association of Microfinance Institutions
FSD Financial Sector Development
InNAB Natural Logarithm of Active Borrowers
InTLP Natural Logarithm of Total Loan portfolio
OSS Operational Sustainability
ROA Return on Assets
ROE Return on Equity
POPDENS Population Density
RURPOP Rural Population
FDI Foreign Direct Investment
AID Aid Per Capita
GNI Gross National Income
SPSS Statistical Package for Social Sciences
Page 7
LIST OF TABLES
Table 4:1 Number of MFIs since 2000-2010........................................................ 26
Table 4:2 Trend analysis of NAB/TLP for MFIs from 2000-2010..........................27
Table 4:3 Operational self-sustainability of MFIs................................................28
Table 4:4 Trend analysis of return on assets for MFIs from 2000-2010............ 29
Table 4:5 Trend analysis of return on equity for MFIs from 2000-2010 ............ 29
Table 4:6 Banking sector development trend analysis........................................30
Table 4:7 Stock market development trend analysis...........................................31
Table 4:8 Descriptive results...............................................................................32
Table 4:9 Tests of normality of distribution........................................................ 33
Table 4:10 Correlation matrix for independent variables...................................... 34
Table 4:11 Correlation between independent and dependent variables................35
Table 4:12 Full rank score regression model for domestic credit.......................... 36
Table 4:13 Normal score regression model for domestic credit............................ 36
Table 4:14 Full rank score regression model for bank deposit ra te...................... 37
Table 4:15 Normal score regression model for bank deposit ra te ........................ 38
Table 4:16 Full rank score regression model for bank lending rate...................... 38
Table 4:17 Normal score regression model for bank lending rate......................... 39
Table 4:18 Full rank score regression model for domestic listed firms..................40
Table 4:19 Normal score regression model for domestic listed firm s....................41
Table 4:20 Rank score regression model for stock market capitalization.............. 41
Table 4:21 Normal score regression model for stock market capitalization..........42
Table 4:22 Full rank score regression model for stock market return...................43
Table 4:23 Normal score regression model for stock market return.....................44
Table 4:24 Summary of ranked and normal OLS regression results......................44
VI
Page 8
LIST OF FIGURES
Figure 4:1 Number of MFIs since 2000-2010........................................................ 26
Figure 4:2 Trend analysis of NAB/TLP for MFIs from 2000-2010..........................27
Figure 4:3 Operational self-sustainability of MFIs................................................. 28
Figure 4:4 Trend analysis of return on assets for MFIs from 2000-2010...............29
Figure 4:5 Trend analysis of return on equity for MFIs from 2000-2010 ...............29
Figure 4:6 Banking sector development trend analysis.........................................30
Figure 4:7 Stock market development trend analysis............................................31
vii
Page 9
CHAPTER ONE
INTRODUCTION
1.1 Background
Recently, microfinance has received a lot of attention, both from policy makers as
well as from academics. In particular, it has been mentioned as an important
instrument to combat poverty. To support this view, the UN declared 2005 as the
international Year of Microcredit. In 2006, the attention for microfinance and its role
in reducing poverty was further increased when Mohammad Yunus received the
Nobel Peace prize. These developments led to high expectations among policy
makers and aid organizations about the potential poverty reducing effects of
microfinance.
This section presents the background of the study. The section shows a brief
discussion on the relationship between microfinance and formal financial sector
development and also presents a brief review on the microfinance sector in Kenya.
1.1.1 Microfinance and Formal Financial Sector Development
Development policy is increasingly concerned with expanding financial services to
the poorer sections of the population. In a recent World Bank book, Demirgug-Kunt
et al. (2008) investigated what hinders and stimulates financial access and
development. A policy for increasing access to financial services for the poor that
receives a lot of attention is microfinance. Microfinance is the provision of small
financial services to the poorer sections of the population. It is thought of as having
a positive impact on the life of the poor by providing them access to something they
previously did not have, namely access to financial services (Morduch, 1999).
Consequently, through serving more people, the providers of microfinance services
increase their societal impact.
The microfinance movement has known an important growth during the last couple
of decades. However, growth seems unequally dispersed among countries and
institutions. Microfinance institutions (MFIs) have known different levels of success:l
Page 10
some have become very significant in size and serve a lot of clients, like the
Grameen Bank in Bangladesh, or Bank Rakyat Indonesia (BRI) in Indonesia, while
other MFIs remain small or even cease to exist (Ahlin et al., 2008). The literature
has mainly focused on MFI-specific characteristics such as governance and
management-related issues in explaining these differences in success. For instance,
Hartarska (2005) explored the relation between managers' experience and
compensation schemes on MFI-performance. Along the same lines, Mersland and
Strom (2009) analyzed the relation between board-structures and MFI-performance.
Recently, a number of studies have explicitly investigated the relationship between
microfinance institutions' performance and changes in the macro-environment of the
country in which the institution operates. These studies recognized that the macro-
economic environment in which the MFI is active is an important determinant for
MFI-performance in addition to institution-specific characteristics. Or as Ahlin et al.
(2008) put it, any assessment that does not take into account the macro-economic
and macro-institutional environment is incomplete.
Financial sector development refers to changes in the characteristics of financial
systems of a country over time. A financial system consists of financial institutions
such as commercial banks, development banks, stock exchanges, pension funds,
etc., regulatory and supervisory institutions such as central banks, and financial
instruments such as debt and equity. Financial systems and instruments exist
because they help allocating resources across space and time. Financial sector
development can be described in terms of the existing variety of financial institutions
and instruments, as well as their contribution with respect to improving the efficient
allocation of scarce resources. Financial development improves macroeconomic
performance, since it helps allocating scarce financial sources to the most profitable
and efficient investment projects (Levine, 2005). Thus, well developed financial
institutions and instruments provide a growth-stimulating environment.
2
Page 11
According to the IMF (2011), indicators of financial structure include system-wide
indicators of size, breadth, and composition of the financial system; indicators of key
attributes such as competition, concentration, efficiency, and access; and measures
of the scope, coverage, and outreach of financial services. The indicators of financial
sector development are the size, access, efficiency, and stability of banking and
capital markets (World Bank, 2011). On the other hand, the IMF (2011) broadens
the scope of financial sector development indicators to include other sub-sectors
such as insurance, pensions, mortgage, leasing, money markets, foreign exchange
markets, and collective investment funds. The World Bank (2011) indicators were
used in this study.
1.1.2 Microfinance Sector in Kenya
The contribution of the microfinance sector in the economic development of Kenyan
economy cannot be overlooked. It is now widely recognized in Kenya that the
promotion of micro and small enterprises is a viable and dynamic strategy for
achieving national goals, including employment creation and poverty alleviation.
According to a baseline survey conducted in 1999, the micro finance industry
contributes at least 13.8% of Kenya's Gross domestic product (GDP) (Mullei &
Bokea, 1999).
The Kenyan micro finance industry emerged in the past 20 years in response to the
lack of access to formal financial services for most of Kenya's low-income people.
The industry is the pillar to development of the informal sector of the Kenya's
economy by promoting the small and micro enterprises. Ratemo (2004) noted that
the industry helps mitigate information asymmetry between lenders and borrowers,
and increases access to financial services. While micro finance institutions (MFIs)
serve an ever-increasing number of low-income clients, the demand for such
financial services still far outstrips their capacity (Maru 2004).
Many Non Governmental Organizations (NGO) micro finance institutions, with donor
funding have started to fill some of this financial gap with credit facilities to poor3
Page 12
people, mainly based on the Grameen Bank group-based collateral model. Most of
the programs, however, because of the restrictions in the Banking Act and limited
funding, have developed as credit-led programs, thus limiting the extent to which
these institutions can mobilize deposits and build clients' capacities through
education to ensure the program's sustainability (Dondo 2003).
Currently, most micro finance institutions offer a single product (credit only) to a
single market segment comprising of operators of Micro and Small Enterprises. They
use a single methodology of delivering the service (that is group-based lending),
thus reaching a limited segment of the MFI market (Ledgerwood and White 2006).
Kenya's MFIs vary in formality, commercial orientation, professionalism, visibility,
size, and geographical coverage. The legal form of the micro finance industry is
quite diverse. Micro finance institutions can be registered under 9 different Acts of
Parliament, namely the Banking Act, the Company Act (limited liability), Non
Governmental Organizations (NGOs) Coordination Act, Building Society Act,
Cooperative Act, Trustees Act, Kenya Institute of Education Act, and the Societies
Act. These fall under the registrar of Societies office. Other organizations such as
the Self Help Groups, the rotating savings and credit associations, the accumulated
savings and credit associations are registered with the relevant ministries and they
too practice micro finance (Dondo, 2003).
The micro finance deposit taking Act 2006 is a government effort to regulate the
industry. The Act has proposed regulation of micro finance on two-tier based on the
capital requirements. These are the community banks and the micro finance
deposit-taking banks. The micro finance Act 2006 is an Act of parliament that makes
provision for the licensing, regulation and supervision of micro finance business and
for connected purposes. It provides a regulatory framework for MFIs and pro poor
programs. The Act applies to every deposit taking micro finance business and
specialized non-deposit taking micro finance business providing loans or other
facilities to micro or small enterprises and low-income households. The Act does not4
Page 13
apply to companies licensed under the banking Act Cap 488, building societies Act
Cap 489 and the Kenya post office savings bank Act cap 493 B.
The Act addresses a number of issues such as licensing, governance, supervision,
and protection of depositors. The Act sets out the minimum capital requirements
and provides for a two-tier regulation for the deposit taking micro finance
organizations. Governance issues relate to maintenance of minimum capital
requirements, maintenance of minimum liquid assets, declaration of dividends,
prohibited activities, insider lending, limits in shareholding, and management of
institutions. Supervision aims at ensuring compliance by institutions. The Act
provides for inspection of institutions for breach/ contravention of the law,
irregularities, mismanagement and periodic reporting (Micro finance Act 2006).
The emergence of the microfinance sector presents an unprecedented opportunity
to extend financial services to the vast majority of the economically active
population. The World Bank estimates that the potential global market for micro
enterprise credit currently stands at 100 million clients. In many developing
economies small and micro businesses comprise of nearly ninety percent (90%) of
all firms (Berenbach & Churchill, 1997).
1.1.3 Informal Financial Sector in Kenya
According to a FinAccess Survey report in 2009, half the Kenyan population (50.6%)
make use of various forms of informal financial service. The most common of these
are rotating savings and credit associations (ROSCAs), often referred to as merry-
go-rounds. These provide a simple means through which to save and accumulate a
lump sum through the regular pooling of usually small contributions in a group
which is taken by each group member in turn. More sophisticated arrangements
allow for a less regimented approach with members contributing and borrowing
from a group more according to their needs rather than the dictates of their turn.
5
Page 14
Interestingly a significant proportion of those with access to the formal providers
also use informal mechanisms. Over a third of those with a bank account also use
an informal service. The use of informal systems increases the level of total financial
inclusion in Kenya.
1.2 Statement of the Problem
The importance of the financial system to economic development is well understood
and Kenya's long-term national strategy, Vision 2030, identified the sector as one of
the country's core growth pillars. While generally more developed than others in the
region, Kenya's financial sector has remained far from achieving its full potential.
Despite considerable progress in the last decade, the financial sector in Kenya had
only met a modest fraction of the growing demand from poorer households and
micro, small and medium enterprises. Key to the success of the Kenya's financial
system is the microfinance. Despite the growth of this sector, studies are limited in
terms of showing the impact of MFIs on the financial sector development. This
research sought to evaluate the contributions of microfinance towards financial
sector development in Kenya.
Over one hundred organizations, including about 50 NGOs, practice some form of
microfinance business in Kenya (Aduda, 2009). About 20 of the NGOs practice pure
micro-financing, while the rest practice micro-financing alongside social welfare
activities. Major players in the sector include Faulu Kenya, Kenya Women Finance
Trust (KWFT), Pride Ltd, Wedco Ltd, Small and Medium Enterprise Programme
(SMEP), Kenya Small Traders and Entrepreneurs Society (KSTES), Ecumenical Loans
Fund (ECLOF) and Vintage Management (Jitegemee Trust). The Kenya Post Office
Savings Bank (KPSOB) is also a major player in the sector but only to the extent of
providing savings and money transfer facilities. Many microfinance NGOs have
successfully replicated the Grameen Bank method of delivering financial services to
the low-income households and MSEs (Omino, 2005).
6
Page 15
Recently, research has focused on the possible determinants of financial
sustainability of MFIs. In particular, researchers have looked at micro-institutional,
as well as macro-institutional and macroeconomic determinants of sustainability.
Micro-institutional factors that have been discussed are, among other things, the
type of borrowers, the costs of operation, the type of loans offered, etc. (Cull et al.,
2007; Gutierrez-Nieto et al., 2007; Hermes et al., 2009). Macro-institutional factors
that have been investigated are regulation and economic freedom Hartarska and
Nadolnyak, 2007; Cull et al. 2008; Crabb, 2008); macroeconomic factors that have
been studied are general macroeconomic performance and inflation (Ahlin and Lin,
2006). One potentially important macro-institutional issue that has not been
explicitly researched is the effect that microfinance has on a country's formal
financial system. This issue is the focus of the current study.
A number of studies have been done on MFIs in Kenya. For instance, Magiri (2002)
studied the relationship between credit models used by MFIs in Kenya and the
attainment of outreach, Mutua (2006) studied the linkages between MFIs and
commercial banks in Kenya, Ogindo (2006) assessed the performance of MFIs in
Kenya, Wambugu (2007) did a study to determine the financial and social impact of
microfinance lending in Kawangware, Kamau (2008) and Mulandi (2010) studied the
determinants of profitability of microfinance institutions in Kenya and Karuri (2010)
studied the impact of microfinance services on poverty alleviation. As seen, these
studies were basically focusing on the micro-economic effects of the MFIs despite
the important role the sector plays in the Kenyan economy. Nothing had been done
on the macroeconomic impact of MFIs on financial sector development in Kenya.
This is the gap the present study sought to bridge by answering the question: what
is the impact of microfinance on formal financial sector development in Kenya?
1.3 Objective of the Study
To assess the impact of microfinance on formal financial sector development in
Kenya.
7
Page 16
1.4 Importance of the Study
This study fills a knowledge gap in regard to the impact of microfinance on formal
financial sector development in Kenya thus add to the body of knowledge that exists
in regard to the development of financial systems.
This study is also be invaluable to the government: There is no question concerning
the contribution of micro finance industry to national development as the
Government expects to have the highest number of job creation to occur in this
sector. This is depicted in the government's inclusion of the micro finance sector in
its strategic papers such as the Poverty Reduction Strategy Paper (2001), the
Economic Recovery Strategy for Wealth and Employment Creation (2003-2007), and
the economic blue-print vision 2030. The findings of this study is of interest to the
government in understanding what impact on financial sector development
microfinance has.
Micro practitioners in Kenya also have immense benefits to derive from the study.
This study is important to microfinance practitioners because it helps them
understand the industry, the expected changes and be able to position themselves
strategically in the long run. It also benefits the management consultants who
advice their clients on what impact the development of MFI has on the performance
of the formal financial sector and how to strategize on the same.
To the academicians, this study offers more avenues for discussions and future
research on the same. This study can be applied in other countries by future
researchers.
8
Page 17
CHAPTER TWO
LITERATURE REVIEW
2.1 Introduction
This chapter presents a review of related literature in the area of microfinance
lending and small medium enterprises. First, the chapter presents a review on MFI
lending approaches. This is followed by a review on the impact of MFIs on growth of
SMEs. The chapter wraps up with a conceptual framework of the study.
2.2 Theoretical Literature
This section presents a review of the microfinance lending models as well as a
review of organisation of microfinance institutions.
2.2.1 Microfinance Lending Models
There are two broad microfinance lending approaches towards small and medium
enterprises. These are financial systems models and poverty lending models.
Following is an explanation of each of the models.
2.2.1.1 Financial Systems Model
The financial systems approach aims to achieve maximum outreach of microfinance
services through financially sustainable institutions that focus on a financial
intermediation model (Robinson, 2003). The microfinance institutions under this
approach provide finance to the public e.g. commercial banks; or serve only their
members such as village banks. They finance their loan portfolios from locally
mobilized savings, commercial debt and for-profit investment, or retained earnings
such as micro lenders.
Microfinance institutions under this approach are differentiated from informal money
lenders, from unregulated institutions such as NGOs and from subsidized formal
micro credit - where a regulated institution such as a state-owned bank channels
government or donor funds to borrowers at subsidized interest rates (Robinson,
2003). The proponents of the financial systems approach argue that donors and
9
Page 18
governments should shift the allocation of their scarce resources from direct
financing of loan portfolios, to promoting the replication of this model by
disseminating lessons from the best practices of fully sustainable microfinance
institutions and financing the development of more microfinance institutions of this
type. One challenge of the financial systems approach is that it relies on market
approaches, which may be thin and weak in marginal areas (Pralahad, 2004).
However, even in these areas, market solutions can be found to overcome any
obstacles (Hitchins, Elliot & Gibson, 2005).
2.2.1.2 Poverty Lending Model
The poverty lending approach focuses on reaching the poorest of the poor, who are
typically engaged in pre-entrepreneurial activities that are more focused on
consumption-smoothing than productivity enhancing activities (Honohan, 2004).
This group requires assistance in the form of income transfers to meet their basic
needs, because any credit extended to them is most probably consumed rather than
invested in something that generates a return sufficient to repay the debt
(Rosengard, 2001).
The poverty lending approach differs from the minimalist financial services model
Characterized by the financial systems approach. In addition to microfinance
services, it provides ancillary services such as training on nutrition, better farming
techniques, family planning, health and basic financial management skills aimed at
reducing the target group's vulnerability to avoidable risk. The funding for these
ancillary services is typically provided by governments, donor grants and other
subsidized funds. Previously, loan portfolios used to be funded by donors and
governments and loan provision was subsidized at below market interest rates.
However, increasing evidence that the microfinance target group repayment rates
are not affected by market related interest rates has changed the practice of
subsidizing interest rates. In addition the use of 'forced savings' has reduced the
10
Page 19
extent to which donors and governments are required to fund loan portfolios, even if
the microfinance target group is not able to save, initially.
Practices have been adopted to ensure that the provision of ancillary services that
target those in the pre-entrepreneurial group is done without compromising the
financial sustainability of the microfinance function of the institution. This is done by
making a clear distinction between the funds allocated to services. Member savings
are used to fund the former, while government and donors support is used to fund
the latter.
2.2.2 Theories of Financial Intermediation
The theories of financial intermediation discussed here are the traditional theories of
perfect market and the modern theories of banks as delegated monitors, regulatory
factors theory, transaction cost theory, liquidity insurance theory, and information
asymmetry theory.
2.2.2.1 Traditional Theories
One of the traditional theories of financial intermediation is the perfect model
theory. Market based theories of resource allocation contends that firms and
households interact through markets and financial intermediaries play no role. They
maintain that when markets are perfect and complete, allocation of resources is
Pareto optimal efficient and there is no scope for intermediaries to improve welfare.
One such theory is the Arrow-Debrew theory (1954). Named after American
economist Kenneth Arrow and French-born economist Gerard Debreu (1921), who
examined the dynamics of the whole economic system and were able to prove the
existence of a multimarket equilibrium in which no excess demand or supply exists.
The theory is based on assumptions that a competitive equilibrium exists if each
person in the economy possesses some quantity of every good available for sale in
the market and that exploitable labour resources exist which are capable of being
used in the production of desired goods / services.
li
Page 20
The existence of financial intermediaries needs to be justified in economic terms
because in the Arrow-Debreu world, the financing of firms (and governments) by
households occurs via financial markets in a frictionless manner - there are no
transactions costs - which leaves no role for financial intermediaries. However
traditional theories of financial intermediation are based on transaction costs and
asymmetric information. They are designed to account for institutions which take
deposits or issue insurance policies and channel funds to firms. The traditional
theory of financial intermediation is focused on the real-world market features of
transactions costs and asymmetric information (Allen and Santomero, 1998). These
are central to the activity of banks and insurance companies.
The idea of transactions costs, first developed in the context of the theory of the
firm (Coase, 1937), was introduced as a key form of friction in financial markets
(Gurley 81 Shaw, 1960). Economies of scale which benefit intermediaries result from
indivisibilities and non convexities in transactions technology which restrict
diversification and risk sharing under direct financing. Examples include fixed costs
of evaluating assets, and declining average trading costs which mean intermediaries
may diversify more cheaply than individuals. The "liquidity insurance" banks provide
to depositors and borrowers (whereby deposits can be cashed on demand while
banks' assets are mainly long-term and illiquid) also results from scale economies in
risk pooling (Diamond and Dybvig, 1983).
The General equilibrium theory, attributed to Walras (1910-1934) who studied a
theoretical economic system in which all consumers were utility maximizers and
firms were perfectly competitive, shows that a unique stable equilibrium can exist
under such conditions. In addition, (employing Modigliani-Miller theory), financial
structure is irrelevant as in a world such as that described; households can construct
portfolios which offset the actions of an intermediary and intermediation cannot add
any value (Fama, 1980). The views above seem to be supported by the fact that
increasingly, financial markets have been and continues to be highly liberalized and
12
Page 21
deregulated. According to Allen and Santomero (1998) all information on important
macroeconomic and monetary data and on the quality and activities of market
participants is available in 'real time', on a global scale, twenty-four hours a day,
owing to the developments in information , communication technology and financial
innovations.
Firms can now issue shares over the Internet and investors can put their order
directly in financial markets. The communication revolution has also reduced
information costs tremendously and improved investor information. The liberalization
and deregulation give, moreover, a strong stimulus towards the securitization of
financial instruments, making them transparent, homogeneous, and tradable in the
international financial centers in the world. These imply that the traditional
arguments are no longer sufficient to justify intermediaries' existence and continued
growth. Insolvency and liquidity risks, however, still are an important source of
heterogeneity of financial titles. Accordingly, a sound theory of intermediation
should in their view also take into account the activity of risk transfer and risk
control between and by intermediaries on the one hand, and facilitation of
participation in markets by individuals on the other. Scholtens and Wensveen (1999)
suggest in addition that dynamic aspects of financial innovation and adaptation of
institutions to gain competitive advantage should play a central role.
The Arrow-Debreu world is based on the paradigm of complete markets. In the case
of complete markets, present value prices of investment projects are well defined.
Savers and investors find each other because they have perfect information on each
other's preferences at no cost in order to exchange savings against readily available
financial instruments. These instruments are constructed and traded costlessly and
they fully and simultaneously meet the needs of both savers and investors. With
complete information, it is expected that market parties have homogenous
expectations and act rationally. In so far as this does not occur naturally,
13
Page 22
intermediaries are useful to bring savers and investors together and to create
instruments that meet their needs.
Therefore, intermediaries are at best tolerated and would be eliminated in a move
towards market perfection, with all intermediaries becoming redundant: the perfect
state of disintermediation. This model is the starting point in the present theory of
financial intermediation. All deviations from this model which exist in the real world
and which cause intermediation by the specialized financial intermediaries are seen
as market imperfections. This suggests that intermediation is something which
exploits a situation which is not perfect, therefore is undesirable and should be
temporary (Scholtens and Wensveen, 2003).
2.2.2.2 Modern Theories
The following are theories that explain reasons of the existence of financial
intermediation: banks as delegated monitors, regulatory factors theory, transaction
cost theory, liquidity insurance theory, and information asymmetry theory.
Transaction costs argument (approach) holds that financial intermediaries exist
because they have a transaction costs advantage over individuals. This approach is
being supported by the works of scholars like Benston and Smith (1976), Campbell
and Kracaw (1980) and Fama (1980). This is based on non convexities in
transaction technologies, whereby the financial intermediaries act as a coalition of
individual lenders or borrowers who exploit economies of scale or scope in the
transaction technology. The notion of transaction costs encompasses not only
exchange or monetary transaction cost (Tobin, 1963; Towey, 1974; Fischer, 1983)
but also search costs, monitoring and auditing costs (Benston and Smith, 1976).
The existence of asymmetries of information between borrowers and lenders gives
rise to difficulties in screening the quality of entrepreneurs and firms to avoid
adverse selection (Leland and Pyle 1977) and monitoring their performance to
minimise moral hazard (Diamond, 1984). Lenders would benefit from knowing the
true characteristics of borrowers. But moral hazard hampers the direct transfer of14
Page 23
information between market participants. Borrowers cannot be expected to be
entirely straightforward about their characteristics, nor entrepreneurs about their
projects, since there may be substantial rewards for exaggerating positive qualities.
And verification of true characteristics by outside parties may be costly or
impossible. Without information transfer, markets may perform poorly (Leland and
Pyle, 1977). Intermediaries, which specialise in collecting information, evaluating
projects and borrowers, and monitoring borrowers' performance, can help overcome
the information problem. These asymmetries can be of ex ante nature, generating
adverse selection, they can be interim, generating moral hazard, and they can be of
ex post nature resulting in auditing or costly state verification and enforcement.
Regulation theory explains the reason of financial intermediaries' existence - which
is based on regulation of money production and of saving in and financing of the
economy as advanced by such scholars as Guttentag and Lindsay (1968), Fama
(1980), Mankiw (1986) and Merton (1995b) among others. The above scholars
maintain that regulation affects solvency and liquidity, with the financial institution
as part of the monetary policy management of an economy. The financial history
shows a clear interplay between financial institutions and markets and the
regulators, be it the present-day specialized financial supervisors or the old-
fashioned sovereigns (Kindleberger, 1993).
The role of the financial intermediaries in liquidity insurance theory is to transform
particular financial claims into other types of claims (so-called qualitative asset
transformation). This approach is attributed largely to the works of Pyle (1971),
Diamond and Dybvig (1983), and Hellwig (1991).The liquidity insurance approach
asserts that financial institutions enable consumers to alter their consumption
patterns according to the influence of shocks. They argue that in the absence of
perfect information, consumers are unsure of their future liquidity requirements in
the face of unanticipated events and hence they maintain a pool of liquidity.
Provided that shocks are not perfectly correlated across individuals, portfolio theory
15
Page 24
suggests that total liquid reserves needed by financial institutions would be less than
the aggregation of reserves required by individual consumers acting independently.
As such, they offer liquidity (Pyle, 1971) and diversification opportunities (Hellwig,
1991). The provision of liquidity is a key function for savers and investors and
increasingly for corporate customers, whereas the provision of diversification
increasingly is being appreciated in personal and institutional financing. Holmstrom
and Tirole (2001) suggest that this liquidity should play a key role in asset pricing
theory.
Diamond (1984) offered the first coherent explanation for the existence of financial
Intermediaries, also the reasons why borrowers must be "monitored" because there
is an ex post information asymmetry in that lenders do not know how much the firm
has produced. Only the individual borrower observes the realized output of his
project, so contracts cannot be made contingent on the output. Consequently, a
lender is at a disadvantage because the borrower cannot honour ex ante promises
to pay unless there is an incentive to do so. Since monitoring is costly, it is efficient
to delegate the task to a specialized agent, the bank.
2.3 Empirical Literature
The empirical review is divided into two sections. The first section reviews literature
on the relationship between microfinance and financial sector development. The
second reviews the moderating influence of other macro-economic factors on the
performance of MFIs.
2.3.1 Microfinance and Financial Sector Development
Financial sector development is important because it fosters economic growth
(Levine, 2004). Jalilian and Kirkpatrick (2005) show that financial sector
development plays an important role in poverty reduction. Consequently, an
important part of development policy is concerned with developing financial markets
for the poor as a way to enhance economic growth (Demirgug-Kunt et al. 2008).
Indeed, formal financial institutions do not serve a significant fraction of the16
Page 25
population in developing countries. This is mainly due to market failures stemming
from imperfect information and informational asymmetries (Stiglitz and Weiss, 1981;
Barham et al., 1996).
The development and promotion of Microfinance Institutions (MFIs) has been
viewed as a promising development policy able to address the market failures in the
formal banking system. Therefore, in the last decade, microfinance has received
increased attention as a tool for poverty-reduction (Barr, 2005). Many MFI-initiatives
have been undertaken in order to serve the large number of people in developing
countries that do not have substantial access to financial services.
In the start-up period during the early eighties, MFIs were mainly funded with donor
money under an NGO status. Since the 1990s, however, the sector has been
undergoing a process towards formalization and commercialization. This means that
MFIs try to become independent from donor money forcing them to aim for financial
sustainability. In that process towards self sustainability, MFIs become more
formalized and often take another formal regulatory status (Robinson, 2001). Some
have transformed completely into banks, like BancoSol in Bolivia and Compartamos
in Mexico (Armendariz and Szafarz, 2009).
Due to this formalization process, modern MFIs are believed to serve a dual
objective, this is: both to reach the unbanked poor as well as to become self-
sustainable (Armendariz and Morduch, 2005; Hartarska, 2005). Consequently, an
increasing number of MFIs need external commercial funding in addition to revenues
from possible lending-activities once donors stop funding (de Crombrugghe et al.,
2008). Increasingly, commercial banks and international investors have become
interested in funding microfinance activities, as MFIs seem to be an interesting way
to diversify their portfolios (Krauss and Walter, 2008; Isem and Porteous, 2005).
This process has lead to a pressure on MFIs to perform better and to quantify their
double objective.
17
Page 26
The empirical relation between the development of the formal financial sector and
the microfinance sector was a priori unclear. Different arguments were made that
either predicted a positive or negative relation between performance of the
microfinance sector and the development of the formal financial sector.
With respect to the negative relation between development of the formal financial
sector and the microfinance sector, two arguments were made. First, one argued
that microfinance and the formal system are substitutes. In fact, MFIs were thought
of as one specific niche of the highly segmented financial sector focusing on the
poorer, non-served parts of the population (Christen et al., 2004; Richter, 2004). In
countries with well-developed financial systems, the part of the population that is
served by formal financial institutions is quite big. For example, in the rich countries
more than 80% of households have an account within financial institutions, while
that fraction diminishes to 20 to 40% of the households in developing ones
(Demirgug-Kunt et al., 2008). In countries where financial markets are more
developed the need for microfinance is less acute.
This argument is closely related to the market-failure theory of microfinance.
Namely, microfinance is seen as a solution to market failures in the formal banking
sector and solves it through the use of different lending methodologies. TIrole
(2006) argued that it is through group lending that microfinance solves the
informational asymmetries that hinder the formal financial sector. Armendariz and
Morduch (2000) show that next to group liability, MFIs have developed additional
methodologies and innovative contracts to overcome lending constraints. Thanks to
these alternative methodologies MFIs are able to serve clients considered too risky
by banks. MFIs thus concentrate on a clientele that is not served by banks.
A second and closely related argument predicting a negative relation between
microfinance and development of the formal banking sector relates to competition
between the two sectors (Hermes et al., 2009). Specifically, in well-developed
banking systems, commercial banks are more efficient and profit from scale18
Page 27
advantages and diversification. In that sense, commercial banks were potentially
seen to be very active and flexible in adapting credit contracts and serving different
groups of people. They could efficiently adapt their credit contracts towards poorer
sections of the population. This could lead to a crowding out-effect where the MFI
clientele substitutes its MFI-loans for commercial bank loans at lower interest rates.
Both arguments predicted that microfinance would be less developed where formal
financial system development was high, which would entail a negative relation
between MFI and the development of the formal financial system. On the other
hand, a number of arguments could be made that would predict a positive relation
between formal financial sector development and microfinance. These arguments
related to positive spillover effects between the formal banking system and
microfinance (Hermes et al., 2009). First, MFIs could benefit from increased credit
lines offered by the formal banking system. In that respect, the formal banking
sector could reinforce the development of the MFI-sector by providing them the
necessary external funding for expanding their activities (Isern and Porteous, 2005;
Hermes et al., 2009). Similarly, McIntosh and Wydeck (2005) showed that interest
rates are usually lower in well-developed banking systems due to competition. As a
result, MFIs could have access to cheaper loans with would enable them to reach
financial sustainability more easily. A second argument related to the more
developed regulatory framework in countries with well-established formal banking
system. This could also increase efficiency and performance of MFIs (Hermes et al.,
2009).
The previous discussion shows that there were a number of potential interactions
between microfinance and the formal financial sector development. This is the main
hypothesis that was tested empirically by relating a number of formal financial
sector development to MFI.
Aduda (2009) examined the depth of outreach and impact of micro-finance services
on poverty alleviation and women empowerment in Kenya. The Study employed a19
Page 28
cross-sectional impact assessment, which used both the treatment and control
groups. The Principal Components Analysis was used to isolate and measure the
poverty component embedded in the various poverty indicators and to create a
household specific poverty index. In addition two non-parametric tests, Kolmogorov
Smirnov and Mann-Whitney, were performed to assess the impact of micro-finance
services on women empowerment. The findings of the study confirm that micro
finance services have a positive impact on poverty alleviation in Kenya by helping
the poor people to increase their sources of income which is an essential path out of
poverty, hunger and deprivation. The micro-finance services have a positive impact
on the empowerment of women because the access to savings and credit gives
women a greater economic role in decision-making. The study, however, found that
a majority of the poor households in Kenya did not have access to micro-finance
services due to several factors, namely, physical and economic challenges, self
exclusion, sector risks, lack of awareness, negative publicity, cost structure of MFIs,
capacity constraints as well as environmental factors. The study recommended that
MFIs should intensify savings mobilization and establish strong partnerships with
commercial banks in order to obtain sufficient funds for lending to the poor. The
study also recommended the need for effective prudential supervision of MFIs by
the CBK to ensure full compliance with the Micro-finance Act (2006). The
Government could also implement stable macro-economic policies and develop
infrastructure in the rural areas to enhance the capacity of MFIs to alleviate poverty.
2.3.2 Macro-economic Environment and MFI Performance
The development of the microfinance sector has also attracted increased attention
from academics, trying to understand performance and development of MFIs. Within
this research field, one strand of literature searches for the determinants for MFI-
performance. Empirical research has mainly focused on institutional determinants
and governance matters explaining differences in performance. Although these
issues are very important, it seems that macro factors might also play a role (Ahlin
et al., 2008). While the role of the macro-economic environment has been studied in20
Page 29
depth in the formal financial literature, the relationship between MFI and the macro
environment has only recently received attention by a small but increasing number
of authors.
The channels through which macro-economic variables may influence the
performance of MFIs are multiple. Vanroose (2006) has done a first attempt to link
microfinance and the macro-economic environment for the Latin American region
through a literature study on the region. Honohan (2004) studied a number of
macro-economic variables that may explain the variation in the development of
microfinance markets on a global level. He found no more than weak correlations
with the variables he investigated but took only around 50 countries into account.
Vanroose (2008), in a later study that takes into account all developing countries,
identified macro-economic factors that may explain why the microfinance sector is
more developed in some countries while not in others. She studied the sector on an
aggregated country-level and found a positive influence of population density, GNI
and aid per capita on MFI-outreach.
Another part of the literature focuses on the performance of the individual MFI.
Gonzalez (2007) studied different measures of MFIs' financial performance but
concluded that macroeconomic developments do not influence them in a significant
manner. Krauss and Walter (2008) investigated whether changes in the global
capital markets influenced an MFI's portfolio and found no proof of that.
Nevertheless, they did find a significant exposure of MFI performance to changes in
the Gross Domestic Product. A possible explanation for the differences between
these studies is that they concentrated on other financial measures. Ahlin et al.
(2008), on their turn, investigated empirically the relationship between different sets
of macro-economic variables and the performance of MFIs and found that several
variables, like GDP growth and institutional design, are positively significant in
explaining differences in MFI performance.
r/
21
(
Page 30
In a very recent study, Hermes et al. (2009) focussed on the relationship between
MFI-efficiency and the development of the financial system and found that MFI-
efficiency is positively correlated with overall financial sector development. This
study is most closely related to the present paper, the main difference being the
performance-measures that were used to measure MFI and also the direction of
relationship. Hermes et al. (2009) looked at efficiency of the MFIs using stochastic
frontier analysis. While efficiency is without doubt an interesting aspect, the present
study looked at MFI in terms of both outreach and profitability. These two
performance-measures have been extensively used in the literature (Hartarska,
2005; Mersland and Strom 2008; Mersland and Strom, 2009), since they reflect the
dual purpose of MFIs: to reach the poorer segments of the population and reach
financial sustainability.
2.4 Summary of Literature
The previous discussion shows that while an increasing number of authors recognize
that the microfinance affects the macro-economic environment in which it is active,
the existing empirical evidence is scarce and largely inconclusive. The present paper
sought to resolve this by focusing on one important aspect of the impact: the
development of the formal financial system.
22
Page 31
CHAPTER THREE
RESEARCH METHODOLOGY
3.1 Introduction
This chapter presents the methods that were used to carry out the study. It contains
research design used in the study, the target population, data collection and analysis
methods and tools.
3.2 Research Design
The study is a longitudinal survey design. The method was chosen because it
allowed the collection of large amounts of data from a sizeable population in a
highly economical way (Saunders et. al, 2008). People perceive the survey design as
authoritative in general because it is easily understood.
3.3 Population
The target population for the study was all the 33 micro finance institutions that are
members of the Association of the Micro Finance Institutions (AMFI). This was
particularly important because the umbrella body maintained information about
these institutions. The study also focused on the banking industry in Kenya with 45
commercial banks registered by the Central Bank of Kenya. The stock market was
equally the focus of the study therefore focusing on the 58 listed companies at the
Nairobi Stock Exchange. The total population was therefore 136 institutions from
the banking, stock market and microfinance sectors. Being aware that some of the
banks are also listed at the Nairobi Stock Exchange, the analysis models were
designed and administered independent of each other. Given that the data was not
collected individually from these institutions, sampling was not performed as macro-
economic data was collected for the period of study.
3.4 Data Collection
The result of the research is highly dependent on the secondary sources. We have
used several research books, journals and articles as secondary sources for our
study. Internet sources were also used as a secondary source for our study. Since23
Page 32
the internet sources are less reliable, we have limited the use of those sources to
the web pages of prominent organizations like AMFI, World bank and IMF. Most of
the sources, we tried to use, are reliable and are acceptable almost everywhere.
Further, we have also used the annual reports of some of the MFIs in Kenya.
Secondary data was collected in this study. These were collected from the IMF, the
Central Bank of Kenya, the Kenya National Bureau of Statistics, the MFI websites
and premises, and from AMFI. The data period was from 2000-2010. In line with
previous studies focussing on the impact of MFI (Hartarska, 2005; Mersland and
Strpm, 2008) the study related MFI to the variables of interest in addition to a wide
set of control-variables. Specifically, the study related MFI impact to (a) variables
measuring formal financial sector development and (b) macro-economic controls.
3.5 Data Analysis
The parameters of the panel data regression model presented in (1) were estimated
using a multiple regression analysis using the SPSS version 19 software.
The model can be written as follows:
FSDt = a + bi(MFI)t + b2(MacroControls)t ......................(1)
Where
FSDt measures the formal financial sector development (FSD) in terms of the
size, access, efficiency, and stability of (a) the banking sector and (b)
the capital markets (equity and debt). These were the dependent
variables and were collected from the World Bank Website (Appendix 1).
MFIt measures the MFI performance through profitability and outreach.
Outreach is measured in terms of the (natural logarithm of) number of
24
Page 33
active borrowers (InNAB) as well as the (natural logarithm of) total loan
portfolio (InTLP). Profitability is measured in terms of operational
sustainability (OSS) defined as the ability of an institution to cover it
operational costs. Besides OSS the also looked at return on assets (ROA)
and return on equity (ROE). These variables were collected from MIX
market website database.
Controls the control variables were population density (POPDENS), foreign direct
investment (FDI), InGNI per capita (GNI) and inflation in line with
previous studies focusing on the impact of the macro-economic
environment on MFI-performance (Ahlin et al., 2008; Vanroose, 2008).
Time series data on financial sector development were the dependent variable from
2000-2010. Another time serious data for MFI formed the independent variable for
the same period. The following time series which is a model version from other
studies was used (Armendariz and Morduch, 2000):
Yt = do + OiYt-i + 02Yt-2 + ... + a 3Yt-p + € t . . . . . . . . . . . . . . . . . . . . . . . . . . . . . . . . . . (2)
Xt = Po + PiXt-1 + P2Xt-2 + ... + PpXt-p + € t . . . . . . . . . . . . . . . . . . . . . . . . . . . . . . . . . (3)
Where Y and X were MFI performance metrics (outreach and profitability) and FSD
metrics (banking and capital markets) for the period.
A trend analysis was performed for both variables. The results were interpreted
accordingly based on descriptive statistics (mean, std. dev, min, max) correlation
coefficients and p-values, and R2. The results are shown in tables and charts. T-tests
were performed to check for the significance of the relationships.
25
Page 34
CHAPTER FOUR
DATA ANALYSIS AND RESULTS
4.1 Introduction
This chapter presents the results of the study. The data analysis was carried out for
the period 2000-2010. This chapter is organized as follows. Section 4.2 presents the
descriptive analysis results together with trend analysis of some of the variables
relevant to the study. Section 4.3 presents the multivariate analysis results using a
combination of statistical methods. Section 4.4 summarizes the chapter.
4.2 Descriptive Analysis
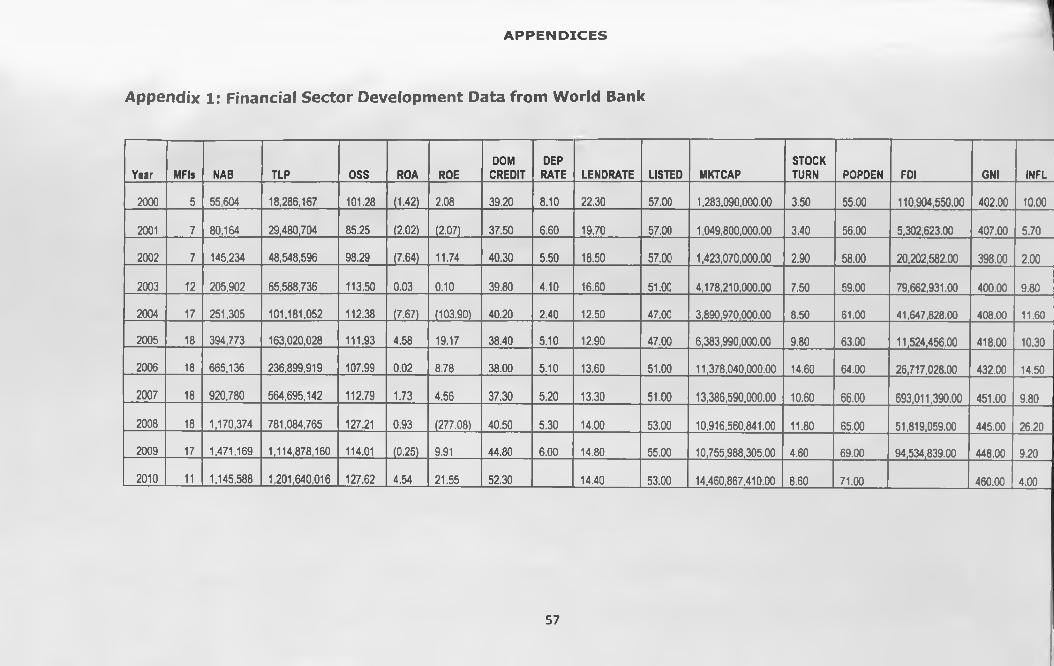
Figure 4:1 and table 4:1 below, shows the trend analysis on the number of
microfinance institutions in Kenya since 2000.
Table 4:1 Number of MFIs since 2000-2010
Year 2000 2001 2002 2003 2004 2005 2006 2007 2008 2009 2010
Number of MFIs 5 7 7 12 17 18 18 18 18 17 11
26
Page 35
As the chart shows, the number was lowest in 2000 (5 MFIs) and rose till 2005
(reaching 18 MFIs) and remaining the same then finally falling in 2009-2010 (to
stand at 11 MFIs). The number of MFIs registered with AMFI was 33 but data is only
available for the number shown in the trend graph below.
Figure 4:2 and table 4:2 below, show the results of the trend of number of active
borrowers (NAB) and total loan portfolio (TLP). As shown, there was a steep rise in
both the number of active borrowers and the total loan portfolio for the 1 1 year
period under review.
Table 4:2 Trend analysis of NA B/TLP for MFIs from 20C10-2010Year 2000 2001 2002 2003 2004 2005 2006 2007 2008 2009 2010
LnNAB 10.93 11.29 11.89 12.24 12.43 12.89 13.41 13.73 13.97 14.20 13.95
LnTLP 16.72 17.20 17.70 18.00 18.43 18.91 19.28 20.15 20.48 20.83 20.91
Figure 4:2 Trend analysis of NAB/TLP for MFIs from 2000-2010
------ LnNAB
------ LnTLP
* ■ f * £27
Page 36
Figure 4:3 and table 4:3 below, show the trend analysis of the operational self-
sufficiency of microfinance institutions in Kenya since 2000. As shown, all the MFIs
were self-sustainable for the entire period of study.
Table 4:3 Operational self-sustainability of MFIs _____ _____ _____Year 2000 2001 2002 2003 2004 2005 2006 2007 2008 2009 2010
OSS 101 .28 85.25 98.29 113.50 112.38 111.93 107.99 112.79 127.21 114.01 127.62 |
Figure 4:4 and table 4:4 below, show the results on the trend of return on assets for
the microfinance institutions in Kenya. It is noted that there was negative ROA for
the first five years and a positive ROA for the last 6 years except for in 2009.
Overall, the ROA performance is very poor.
Table 4:4 Trend analysis of return on assets for MFIs from 2000-2010Year 2000 2001 2002 2003 2004 2005 2006 2007 2008 2009 2010
ROA -1.42 -2.02 -7.64 0 .03 -7.67 4.58 0.02 1.73 0.93 -0.25 4.54
28
Page 37
:igure 4:4 Trend analysis of return on assets for MFIs from 2000-2010
Figure 4:5 and table 4:5 below, show the results on the trend of return on equity for
microfinance institutions in Kenya for the period under review. The results show that
ROE was negative for most of the period.
Table 4:5 Trend analysis of return on equity for MFIs from 2C100-20 10Year 2000 2001 2002 2003 2004 2005 2006 2007 2008 2009 2010
ROE 2.08 -2.07 11.74 0 .10 103.90 19.17 8.78 4.56 277.08 9.91 21.55
Figure 4:5 Trend analysis of return on equity for MFIs from 2000-201050.00
29
Page 38
Rgure 4:6 and table 4:6 below, show the results on the banking sector development
trend analysis. The results show that there was an upward trend in domestic credit
offered by commercial banks in Kenya. During the same period, the lending rate and
the deposit rate had a downward trend.
The stock market development trend is shown in figure 4:7 and table 4:7 below. As
shown, the number of local firms listed on the Nairobi Stock Exchange declined over
the period of analysis. The stock market capitalization remained almost flat for the
entire period of analysis while the stock return had an upward trend over the period.
Table 4:6 Banking sector development trend analysisYear 2000 2001 2002 2003 2004 2005 2006 2007 2008 2009 2010
CREDIT 39 .20 37.50 40.30 39.80 40.20 38 .40 38.00 37.30 40 .50 44.80 52 .30
DEPRATE 8 .10 6.60 5.50 4.10 2.40 5 .10 5.10 5.20 5.30 6.00
LENDRATE 22.30 19.70 18.50 16.60 12.50 12 .90 13.60 13.30 14.00 14.80 14.40
igure 4:6 Banking sector development trend analysis60.00 :
-CREDIT
-DEPRATE
-LENDRATE
30
Page 39
Table 4:7 Stock market development trend analysis
Year 2000 2001 2002 2003 2004 2005 2006 2007 2008 2009 2010
USTED 57 .00 57.00 57.00 51 .00 47.00 47 .00 51.00 51.00 53 .00 55.00 53.00
LnMKTCAP 20 .97 20.77 21.08 22.15 22.08 22.58 23.15 23.32 23.11 23.10 23.39
STOCKRET 3 .50 3.40 2.90 7 .50 8.50 9.80 14.60 10.60 11.80 4.60 8.60
Figure 4:7 Stock market development trend analysis
60.00
-------LISTED
-------LnMKTCAP
-------STOCKRET
The descriptive results in table 4:8 below, show the lowest and highest values (min
and max) for each of the variables used in the study. For instance, the operating
self-sustainability (OSS) ranged from 85%-127%. The average OSS was 110% with
a standard deviation of 12%. This means that most of the microfinance institutions
were sustainable. The ROA ranged from a low of -7.67 to a high of 4.58 with a
mean of -0.65. This means that the microfinance institutions performed very poor
over the period of study as measured by their ROA. The ROE also showed very poor
performance. This ranged from -277.08-21.55 with a mean of -27.74.31
Page 40
Table 4:8 Descriptive resultsN Minimum Maximum Mean Std. Deviation
LnNAB 1 1 10.93 14.20 12.8115 1.13955LnTLP 1 1 16.72 20.91 18.9645 1.48411OSS 1 1 85.25 127.62 110.2045 13.17151ROA 1 1 -7.67 4.58 -.6518 4.05131ROE 1 1 -277.08 21.55 -27.7418 89.59759CREDIT 1 1 37.30 52.30 40.7545 4.35003DEPRATE 1 1 .00 8.10 4.8545 2.14260LENDRATE 1 1 12.50 22.30 15.6909 3.19138LISTED 1 1 47.00 57.00 52.6364 3.66804LnMKTCAP 1 1 20.77 23.39 22.3375 .99951STOCKRET 1 1 2.90 14.60 7.8000 3.83927POPDEN 1 1 55.00 71.00 62.4545 5.18389LnFDI 1 1 .00 20.36 16.0375 5.47223LnGNI 1 1 5.99 6.13 6.0494 .05456INFLATION 1 1 2.00 26.20 10.2818 6.35355
4.3 Multivariate Analysis
The multivariate analysis involves the use of multiple regression analysis but before
this is done, it is important to test whether the data strictly conforms to the
conditions of the same. One of the conditions is normality of distribution. This is
tested using Shapiro-Wilk statistic and presented in table 4:9 below. The Shapiro-
Wilk statistic is interpreted because the sample is less than 50 in which case it is the
most appropriate one to test. From the results, none of the variables is significant
except for ROE, CREDIT, FDI and inflation. This means that the rest of the variables
are insignificant thus show a normal distribution. The significant variables are not
normally distributed. Further tests were then performed as outlined in the sections
that follow.
32
Page 41
Table 4;9 Tests of normality of distribution____________________Kolmogorov-Smirnov3__________ Shapiro-WilkStatistic df Sig. Statistic df Sig.
LnNAB .154 1 1 .200* .929 1 1 .396LnTLP .152 11 .200* .937 11 .490OSS .195 11 .200* .926 11 .374ROA .186 11 .200* .892 1 1 .149 -ROE .431 11 .000 .565 1 1 .000 -CREDIT .342 11 .001 .727 1 1 .001DEPRATE .273 11 .022 .900 1 1 .187LENDRATE .246 1 1 .061 .868 11 .073LISTED .156 11 .200* .897 1 1 .168LnMKTCAP .231 1 1 .103 .859 1 1 .056STOCKRET .161 11 .200* .939 1 1 .506POPDEN . 1 1 1 11 .200* .970 1 1 .889LnFDI .369 11 .000 .575 1 1 .000 -LnGNI .213 11 .177 .883 1 1 .114INFLATION .236 11 .088 .851 1 1 .044
a. Lilliefors Significance Correction*. This is a lower bound of the true significance.
The second test performed is to check the multicollinearity between the
independent variables. These results are presented in table 4:10 below. As shown,
there were high and significant correlations for NAB and TLP. OSS was highly
correlated with NAB and TLP. These correlations were significant at both 5% and 1
% levels. Thirdly, the Durbin-Watson test was performed in order to test serial
autocorrelation in the data. The test statistic was 2.946 which were high and
therefore there was serial autocorrelation. Fourthly, outliers were checked using the
standard deviations of residual statistics of predicted values. The standard deviation
exceeded the benchmark of 3 and thus it was concluded that there were outliers in
the sample. Given that most conditions for performing a Pearson regression analysis
33
Page 42
were not fully met, a decision was made to transform the data and then perform a
rank regression. The data was ranked using rank score and normal scores.
Table 4:10 Correlation matrix for independent variablesLnNAB LnTLP OSS ROA ROE
LnNAB PearsonCorrelation
LnTLPSig. (2-tailed)PearsonCorrelation
.987“
OSSSig. (2-tailed)PearsonCorrelation
.000.787“ .796“
ROASig. (2-tailed)PearsonCorrelation
.004
.510.003.533 .494
ROESig. (2-tailed) Pearson
, .109 -;240
.091-.235
.122-.422 .122
Correlation Sig. (2-tailed) .477 .487 .196 .721
**. Correlation is significant at both 0.05 and 0.01 levels (2-tailed).
A correlation analysis was also run for the dependent variables together with
independent variables in order to show the individual relationships between the
dependent and independent variables. These results are shown in table 4:11 below.
As shown, population density and FDI were significantly correlated with domestic
credit offered by commercial banks. It is also noted that OSS and FDI were
significantly correlated with deposit rate; NAB, TLP, OSS, and population density
were significantly correlated with lending rates; NAB, TLP, OSS, ROA, POPDEN, and
GNI were significantly correlated with stock market capitalization; and NAB and
inflation were significantly correlated with stock return.
34
Page 43
fable 4:11 Correlation between independent and dependent variablesCREDIT DEPRATE LENDRATE LISTED CAP STOCKRET
LnNAB Pearson Correlation .455 -.448 -.792" -.350 .957" .620*Sig. (2-tailed) .160 .167 .004 .292 .000 .042
LnTLP Pearson Correlation .554 -.481 -.733* -.274 .930” .536Sig. (2-tailed) .077 .134 .010 .415 .000 .089
oss Pearson Correlation .569 -.613* -.663* -.462 00 NJ 00 .583
Sig. (2-tailed) .068 .045 .026 .152 .002 .060ROA Pearson Correlation .288 -.166 -.299 -.218 .613’ .446
Sig. (2-tailed) .390 .625 .372 .519 .045 .169ROE Pearson Correlation .085 .030 .252 .133 -.175 -.332
Sig. (2-tailed) .804 .930 .456 .696 .608 .319POPDEN Pearson Correlation .645’ -.570 -.729* -.306 .922'* .502
Sig. (2-tailed) .032 .067 . .011 .360 .000 .116LnFDI Pearson Correlation -.840” .728* .092 -.049 -.237 -.025
Sig. (2-tailed) .001 .011 .787 .885 .482 .941LnGNI Pearson Correlation .523 -.372 -.578 -.124 .871" .508
Sig. (2-tailed) .099 .259 .062 .716 .000 .111INFLATION Pearson Correlation -.261 .148 -.363 -.297 .404 .625*
Sig. (2-tailed) .438 .665 .272 .375 .218 .040
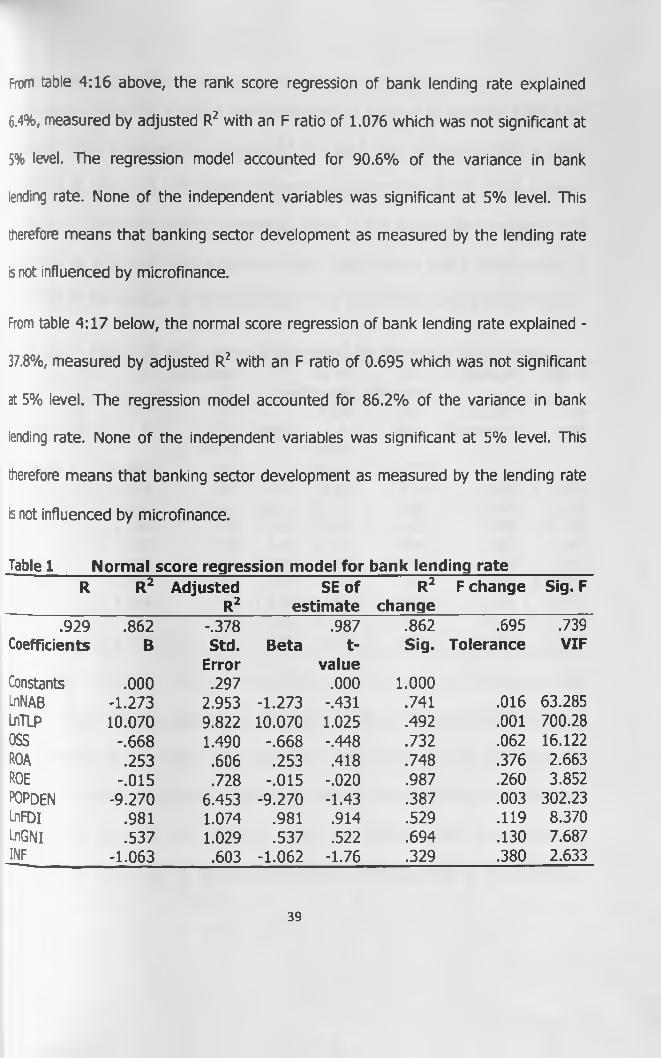
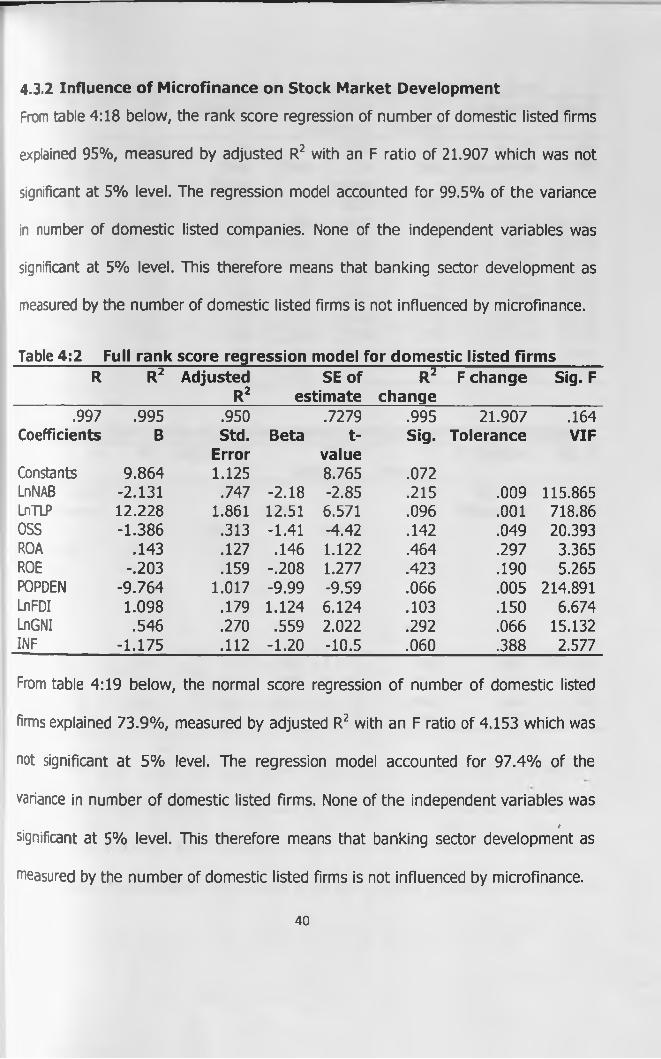
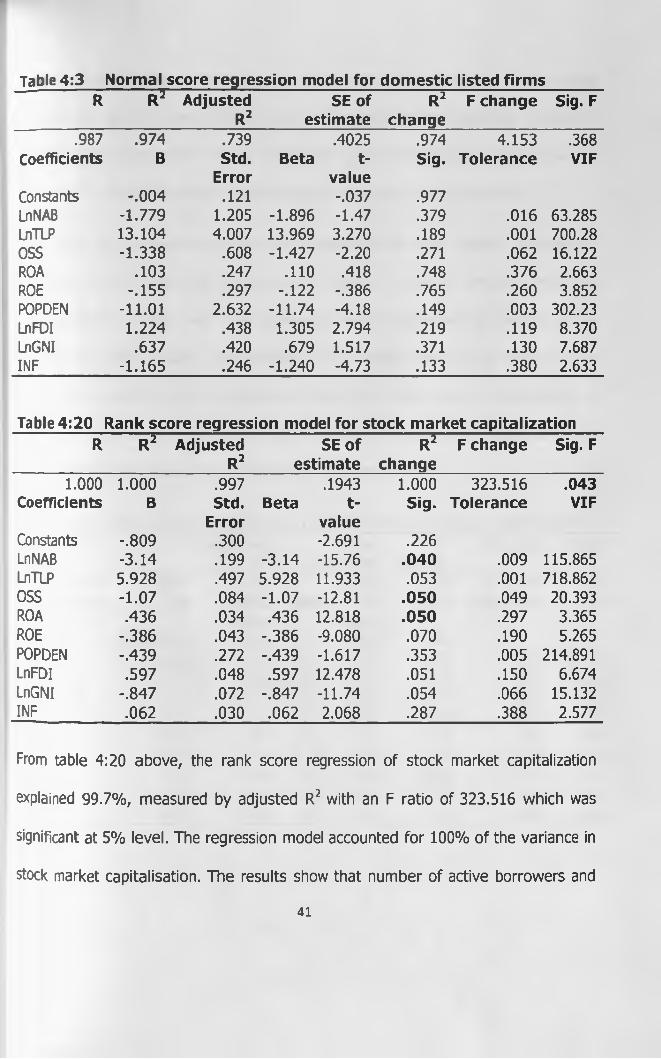
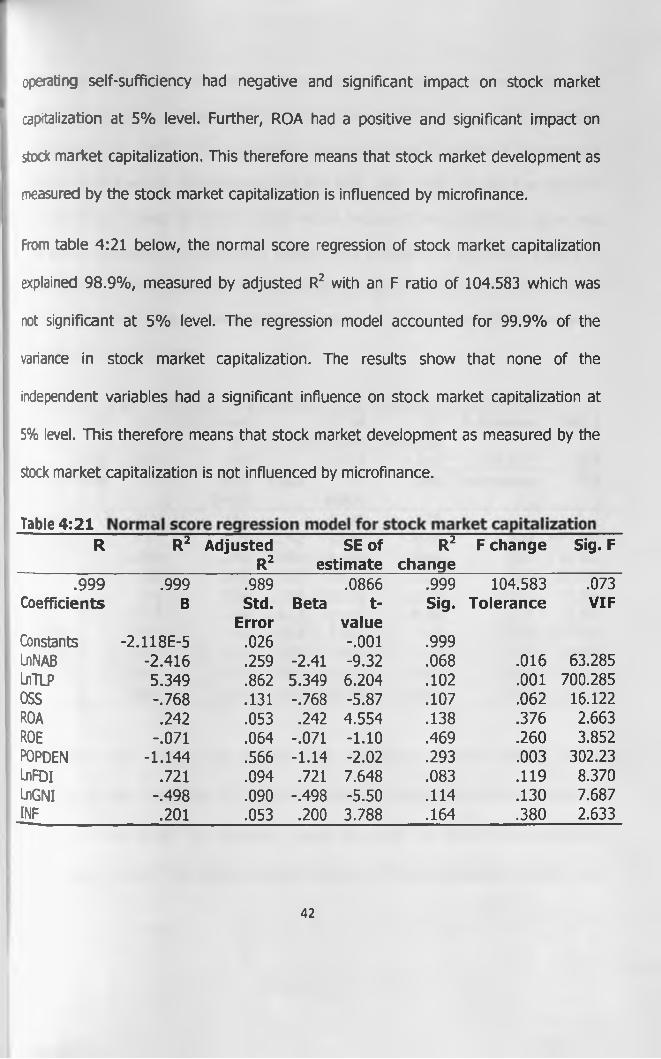
1.3.1 Influence of Microfinance on Banking Sector Development
rable 4:12 and 4:13 below, show the results on the impact of microfinance on
jomestic credit advanced by commercial banks in Kenya using rank score and
normal score regression models. From table 4:12, the ranked score regression of
jomestic credit explained 93.7%, measured by adjusted R2 with an F ratio of 6.716
'vhich was not significant at 5% level. The regression model accounted for 98.4% of
:he variance in domestic credit advanced by commercial banks. None of the
independent variables was significant at 5% level meaning that domestic credit as a
measure of banking sector development was not influenced by microfinance.
Hne tolerance values are a measure of the correlation between the predictor
variables and can vary between 0 and 1. The closer to zero the tolerance value is for
a variable, the stronger the relationship between this and the other predictor
variables. One should worry about variables that have a very low tolerance. VIF is
an alternative measure of collinearity (in fact it is the reciprocal of tolerance) in
which a large value indicates a strong relationship between predictor variables.
Page 44
Table 4:12 Full rank score regression model for domestic creditR R2 Adjusted
R2SE of
estimateR2
changeF change Sig. F
.992 .984 .937 1.338 .984 6.716 .291Coefficients B Std. Beta t- Sig. Tolerance VIF
Error valueConstants 1.931 2.059 .934 .522LnNAB .008 1.373 .008 .005 .996 .009 115.865LnTLP 4.036 3.420 4.036 1.180 .448 .001 718.862OSS 1.076 .576 1.076 1.867 .313 .049 20.393ROA -.675 .234 -.675 -2.886 .212 .297 3.365ROE .641 .293 .641 2.190 .273 .190 5.265ROPDBI -4.44 1.870 -4.44 -2.377 .254 .005 241.891_nFDI .031 .330 .031 .093 .941 .150 6.674_nGNI .148 .496 .148 .299 .815 .066 15.132INF -.141 .205 -.141 -.688 .616 .388 2.577
=rom table 4:13, the normal score regression of domestic credit explained 94.7%,
measured by adjusted R2 with an F ratio of 20.659 which was not significant at 5%
evel. The regression model accounted for 99.5% of the variance in domestic credit
advanced by commercial banks. None of the independent variables was significant
at 5% level meaning that domestic credit as a measure of banking sector
development was not influenced by microfinance.
Table 4:13 Normal score regression model for domestic creditR R2 Adjusted
R2SE of
estimateR2
changeF change Sig. F
.997 .995 .947 .1944 .995 20.659 .169Coefficients B Std. Beta t- Sig. Tolerance VIF
Error valueConstants 2.199E-5 .059 0.000 1.000LnNAB .41 .582 .412 .708 .608 .016 63.28LnTLP 3.78 1.93 3.78 1.95 .301 .001 700.28DSS 1.07 .294 1.07 3.65 .170 .062 16.12ROA -.60 .119 -.605 -5.06 .124 .376 2.633ROE .62 .144 .627 4.36 .143 .260 3.85POPDEN -4.64 1.27 -4.64 -3.65 .170 .003 302.23LnFDl -.07 .212 -.075 -.352 .784 .119 8.37LnGNl .16 .203 .164 .811 .566 .130 7.68INF -.20 .119 -.20 -1.75 .330 .380 2.63
36
Page 45
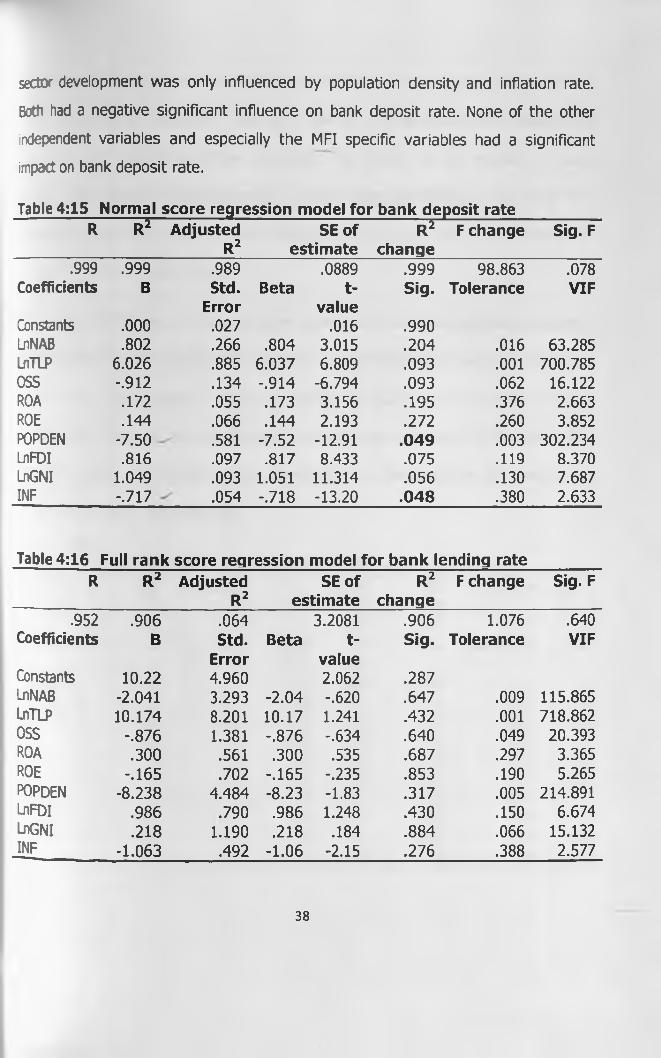
From table 4:14 below, the ranked score regression of bank deposit rate explained
99.4%, measured by adjusted R2 with an F ratio of 187.789 which was not
significant at 5% level. The regression model accounted for 99.9% of the variance
in deposit rate. Population density and inflation were negatively and significantly
correlated with deposit rate while gross national income was positively and
significantly correlated with deposit rate at 5%. None of the other independent
variables was significant at 5% level meaning that deposit rate as a measure of
banking sector development was only influenced by population density, inflation,
and GNI. MFI specific variables did not significantly influence bank deposit rate.
Table 4:14 Full rank score regression model for bank deposit rateR R2 Adjusted
R2SE of R2 F change
estimate changeSig. F
1.000 .999 .994 .2544 .999 187.789 .057Coefficients B Std. Beta t- Sig. Tolerance VIF
Error valueConstants 7.347 .393 19.438 .033LnNAB 1.638 .261 1.641 6.271 .101 .009 115.865LnTLP 3.987 .651 3.996 6.128 .103 .001 718.862OSS -.829 .110 -.831 -7.564 .084 .049 20.393ROA .154 .045 .154 3.461 .179 .297 3.365ROE .144 .056 .144 2.582 .235 .190 5.265POPDEN -6.54 .356 -6.56 -18.40 .035 .005 214.891LnFDI .702 .063 .704 11.207 .057 .150 6.674LnGNI 1.235 .094 1.238 13.088 .049 .066 15.132INF -.758 .039 -.758 -19.42 .033 .388 2.577
From table 4:15 below, the normal score regression of bank deposit rate explained
98.9%, measured by adjusted R2 with an F ratio of 98.863 which was not significant
at 5% level. The regression model accounted for 99.9% of the variance in bank
deposit rate. Of the independent variables, only population density and inflation
were significant at 5% level meaning that deposit rate as a measure of banking
37
Page 46
sector development was only influenced by population density and inflation rate.
Both had a negative significant influence on bank deposit rate. None of the other
independent variables and especially the MFI specific variables had a significant
impact on bank deposit rate.
Table 4:15 Normal score regression model for bank deposit rateR R2 Adjusted
R2SE of
estimateR2
changeF change Sig. F
.999 .999 .989 .0889 .999 98.863 .078Coefficients B Std. Beta t- Sig. Tolerance VIF
Error valueConstants .000 .027 .016 .990LnNAB .802 .266 .804 3.015 .204 .016 63.285LnTLP 6.026 .885 6.037 6.809 .093 .001 700.785OSS -.912 .134 -.914 -6.794 .093 .062 16.122ROA .172 .055 .173 3.156 .195 .376 2.663ROE .144 .066 .144 2.193 .272 .260 3.852POPDEN -7.50 .581 -7.52 -12.91 .049 .003 302.234LnFDI .816 .097 .817 8.433 .075 .119 8.370LnGNI 1.049 .093 1.051 11.314 .056 .130 7.687INF -.717 .054 -.718 -13.20 .048 .380 2.633
Table 4:16 Full rank score regression model for bank lending rateR R2 Adjusted SE of
R2 estimateR2
changeF change Sig. F
.952 .906 .064 3.2081 .906 1.076 .640Coefficients B Std. Beta t- Sig. Tolerance VIF
Error valueConstants 10.22 4.960 2.062 .287LnNAB -2.041 3.293 -2.04 -.620 .647 .009 115.865LnTLP 10.174 8.201 10.17 1.241 .432 .001 718.862OSS -.876 1.381 -.876 -.634 .640 .049 20.393ROA .300 .561 .300 .535 .687 .297 3.365ROE -.165 .702 -.165 -.235 .853 .190 5.265POPDEN -8.238 4.484 -8.23 -1.83 .317 .005 214.891LnFDI .986 .790 .986 1.248 .430 .150 6.674LnGNI .218 1.190 .218 .184 .884 .066 15.132INF -1.063 .492 -1.06 -2.15 .276 .388 2.577
38
Page 47
From table 4:16 above, the rank score regression of bank lending rate explained
6.4%, measured by adjusted R2 with an F ratio of 1.076 which was not significant at
5% level. The regression model accounted for 90.6% of the variance in bank
lending rate. None of the independent variables was significant at 5% level. This
therefore means that banking sector development as measured by the lending rate
is not influenced by microfinance.
From table 4:17 below, the normal score regression of bank lending rate explained -
37.8%, measured by adjusted R2 with an F ratio of 0.695 which was not significant
at 5% level. The regression model accounted for 86.2% of the variance in bank
lending rate. None of the independent variables was significant at 5% level. This
therefore means that banking sector development as measured by the lending rate
is not influenced by microfinance.
Table 1 Normal score regression model for bank lending rateR R2 Adjusted
R2SE of
estimateR2
changeF change Sig. F
.929 .862 -.378 .987 .862 .695 .739Coefficients B Std. Beta t- Sig. Tolerance VIF
Error valueConstants .000 .297 .000 1.000LnNAB -1.273 2.953 -1.273 -.431 .741 .016 63.285LnTLP 10.070 9.822 10.070 1.025 .492 .001 700.28OSS -.668 1.490 -.668 -.448 .732 .062 16.122ROA .253 .606 .253 .418 .748 .376 2.663ROE -.015 .728 -.015 -.020 .987 .260 3.852POPDEN -9.270 6.453 -9.270 -1.43 .387 .003 302.23LnFDl .981 1.074 .981 .914 .529 .119 8.370LnGNl .537 1.029 .537 .522 .694 .130 7.687INF -1.063 .603 -1.062 -1.76 .329 .380 2.633
39
Page 48
4.3.2 Influence of Microfinance on Stock Market Development
From table 4:18 below, the rank score regression of number of domestic listed firms
explained 95%, measured by adjusted R2 with an F ratio of 21.907 which was not
significant at 5% level. The regression model accounted for 99.5% of the variance
in number of domestic listed companies. None of the independent variables was
significant at 5% level. This therefore means that banking sector development as
measured by the number of domestic listed firms is not influenced by microfinance.
Table 4:2 Full rank score regression model for domestic listed firmsR R2 Adjusted
R2SE of
estimateR2
changeF change Sig. F
.997 .995 .950 .7279 .995 21.907 .164Coefficients B Std. Beta t- Sig. Tolerance VIF
Error valueConstants 9.864 1.125 8.765 .072LnNAB -2.131 .747 -2.18 -2.85 .215 .009 115.865LnTLP 12.228 1.861 12.51 6.571 .096 .001 718.86OSS -1.386 .313 -1.41 -4.42 .142 .049 20.393ROA .143 .127 .146 1.122 .464 .297 3.365ROE -.203 .159 -.208 1.277 .423 .190 5.265POPDEN -9.764 1.017 -9.99 -9.59 .066 .005 214.891LnFDI 1.098 .179 1.124 6.124 .103 .150 6.674LnGNI .546 .270 .559 2.022 .292 .066 15.132INF -1.175 .112 - 1.20 -10.5 .060 .388 2.577
From table 4:19 below, the normal score regression of number of domestic listed
firms explained 73.9%, measured by adjusted R2 with an F ratio of 4.153 which was
not significant at 5% level. The regression model accounted for 97.4% of the
variance in number of domestic listed firms. None of the independent variables wasr
significant at 5% level. This therefore means that banking sector development as
measured by the number of domestic listed firms is not influenced by microfinance.
40
Page 49
Table 4:3 Normal score regression model for domestic listed firmsR R2 Adjusted
R2SE of
estimateR2
changeF change Sig. F
.987 .974 .739 .4025 .974 4.153 .368Coefficients B Std. Beta t- Sig. Tolerance VIF
Error valueConstants -.004 .121 -.037 .977LnNAB -1.779 1.205 -1.896 -1.47 .379 .016 63.285LnTLP 13.104 4.007 13.969 3.270 .189 .001 700.28OSS -1.338 .608 -1.427 -2.20 .271 .062 16.122ROA .103 .247 .110 .418 .748 .376 2.663ROE -.155 .297 -.122 -.386 .765 .260 3.852POPDEN -11 .0 1 2.632 -11.74 -4.18 .149 .003 302.23LnFDI 1.224 .438 1.305 2.794 .219 .119 8.370LnGNI .637 .420 .679 1.517 .371 .130 7.687INF -1.165 .246 -1.240 -4.73 .133 .380 2.633
Table 4:20 Rank score regression model for stock market capitalizationR R2 Adjusted SE of
R2 estimateR2
changeF change Sig. F
1.000 1.000 .997 .1943 1.000 323.516 .043Coefficients B Std. Beta t- Sig. Tolerance VIF
Error valueConstants -.809 .300 -2.691 .226LnNAB -3.14 .199 -3.14 -15.76 .040 .009 115.865LnTLP 5.928 .497 5.928 11.933 .053 .001 718.862OSS -1.07 .084 -1.07 -12.81 .050 .049 20.393ROA .436 .034 .436 12.818 .050 .297 3.365ROE -.386 .043 -.386 -9.080 .070 .190 5.265POPDEN -.439 .272 -.439 -1.617 .353 .005 214.891LnFDI .597 .048 .597 12.478 .051 .150 6.674LnGNI -.847 .072 -.847 -11.74 .054 .066 15.132INF .062 .030 .062 2.068 .287 .388 2.577
From table 4:20 above, the rank score regression of stock market capitalization
explained 99.7%, measured by adjusted R2 with an F ratio of 323.516 which was
significant at 5% level. The regression model accounted for 100% of the variance in
stock market capitalisation. The results show that number of active borrowers and
41
Page 50
operating self-sufficiency had negative and significant impact on stock market
capitalization at 5% level. Further, ROA had a positive and significant impact on
stock market capitalization. This therefore means that stock market development as
measured by the stock market capitalization is influenced by microfinance.
From table 4:21 below, the normal score regression of stock market capitalization
explained 98.9%, measured by adjusted R2 with an F ratio of 104.583 which was
not significant at 5% level. The regression model accounted for 99.9% of the
variance in stock market capitalization. The results show that none of the
independent variables had a significant influence on stock market capitalization at
5% level. This therefore means that stock market development as measured by the
stock market capitalization is not influenced by microfinance.
Table 4:21R R2 Adjusted
R2SE of
estimateR2
changeF change Sig. F
.999 .999 .989 .0866 .999 104.583 .073Coefficients B Std. Beta t- Sig. Tolerance VIF
Error valueConstants -2.118E-5 .026 -.001 .999LnNAB -2.416 .259 -2.41 -9.32 .068 .016 63.285LnTLP 5.349 .862 5.349 6.204 .102 .001 700.285OSS -.768 .131 -.768 -5.87 .107 .062 16.122ROA .242 .053 .242 4.554 .138 .376 2.663ROE -.071 .064 -.071 -1.10 .469 .260 3.852POPDEN -1.144 .566 -1.14 -2.02 .293 .003 302.23LnFDI .721 .094 .721 7.648 .083 .119 8.370LnGNI -.498 .090 -.498 -5.50 .114 .130 7.687INF .201 .053 .200 3.788 .164 .380 2.633
42
Page 51
From table 4:22 below, the rank score regression of stock market return explained
99.9%, measured by adjusted R2 with an F ratio of 1124.944 which was significant
at 5% level (p = 0.023). The regression model accounted for 100% of the variance
in stock market return. The results show that NAB, OSS, ROE, and GNI had negative
and significant impact on stock market return because their significance score was
less than 0.05 while TLP, ROA, and inflation had positive and significant impact on
stock market return. These correlations were significant at 5% level. This therefore
means that stock market development as measured by the stock market return is
influenced by microfinance.
Table 4:22 Full rank score regression model for stock market returnR R2 Adjusted
R2SE of
estimateR2
changeF change Sig. F
1.000 1.000 .999 .10422 1.000 1124.944 .023Coefficients B Std. Beta t- Sig. Tolerance VIF
Error valueConstants -.198 .161 -1.226 .436LnNAB -2.42 .107 -2.42 -22.69 .028 .009 115.865LnTLP 3.850 .266 3.850 14.449 .044 .001 718.862OSS -1.07 .045 -1.07 -23.94 .027 .049 20.393ROA .536 .018 .536 29.375 .022 .297 3.365ROE -.513 .023 -.513 -22.49 .028 .190 5.265POPDEN .554 .146 .554 3.802 .164 .005 214.891LnFDI .300 .026 .300 11.681 .054 .150 6.674LnGNI -.801 .039 -.801 -20.70 .031 .066 15.132INF .610 .016 .608 38.129 .017 .388 2.577
From table 4:23 below, the normal score regression of stock market return
explained 90.2%, measured by adjusted R2 with an F ratio of 11.24 which was not
significant at 5% level. The regression model accounted for 99% of the variance in
stock market return. The results showed that none of the independent variables had
43
Page 52
a significant influence on stock market return at 5% level. This therefore means that
stock market development as measured by the stock market return is not influenced
by microfinance.
Table 4:23 Normal score regression model for stock market returnR R2 Adjusted
R2SE of
estimateR2
changeF change Sig. F
.995 .990 .902 .263 .990 11.240 .228Coefficients B Std. Beta t- Sig. Tolerance VIF
Error valueConstants -8.583E-5 .079 -.001 .999LnNAB -1.851 .787 -1.85 -2.35 .256 .016 63.285LnTLP 3.177 2.618 3.177 1.213 .439 .001 700.28OSS -.874 .397 -.874 -2.19 .272 .062 16.122ROA .333 .161 .333 2.064 .287 .376 2.663ROE -.219 .194 -.219 - 1.12 .462 .260 3.852POPDEN .137 1.720 .137 .080 .949 .003 302.23LnFDI .394 .286 .394 1.378 .400 .119 8.370LnGNI -.444 .274 -.444 -1.61 .352 .130 7.687INF .813 .161 .812 5.055 .124 .380 2.633
4.4 Chapter Summary
A summary of the results on ranked and normal OLS regression are shown in table
4:24 below.
Table 4:24 Summary of ranked and normal OLS regression results_______Banking sector development_________________Stock market development
Domestic credit Deposit rate Lending rate Listed firms Capitalisation Stock returnR N R N R N R N R N R N
Table 5 6 7 8 9 10 1 12 13 14 1 16No. 1 5NAB X XTIP XOSS X XROA X XROE XPOPDEN
X X
FDICM X XINF X X X
44
Page 53
As shown using 'x' marks, deposit rate was significantly influenced by population
density, GNI, and inflation when the ranked score model was used while it was
significantly influenced by population density and inflation when normal score model
was used. These were the only significant influences on banking sector
development.
As regards the stock market development, the results showed that capitalisation was
significantly influenced by number of active borrowers, operational sufficiency and
return on assets using the ranked score model. Further, stock market return was
significantly influenced by number active borrowers, total loan portfolio, operational
sufficiency, return on assets, return on equity, GNI and inflation using the ranked
score model. The positive effects are shown in bold while the negative effects are
un-bolded.
It is also important to note that microfinance had a significant impact on stock
market capitalization and stock market return (stock market development) yet no
such direct effect was noted on the banking sector development.
The findings from this regression analyses which set out to determine the impacts of
MFIs on financial sector development, therefore show that MFIs, as measured by
their profitability and outreach metrics of number of active borrowers, total loan
portfolio and operational sustainability, have a significant impact on stock market
development and capitalization only. A synopsis of the steps followed to arrive at
that result involved collection of secondary data on financial sector performance
over an eleven year period from various different sources. The data, which is
summarized in appendix 1 , was then analyzed using multiple regression to arrive at
the outcome described above.
45
Page 54
CHAPTER FIVE
SUMMARY, CONCLUSION AND RECOMMENDATIONS
5.1 Introduction
This chapter presents the summary and discussion of findings in section 5.2,
conclusions of the study in section 5.3, recommendations for policy and practice in
section 5.4, limitations of the study in section 5.5 and suggestions for further
research in section 5.6.
5.2 Summary and Discussion of Findings
The study sought to assess the impact of microfinance on financial sector
development in Kenya. Using data from World Bank and MIX market websites, data
was analysed and results presented in chapter four using descriptive and
multivariate analyses.
The results showed that bank deposit rate was negatively and significantly
influenced by population density and inflation while it was positively influenced by
GNI when the ranked score model was used. When the normal score model as used,
it was noted that bank deposit rate was negatively and significantly influenced by
population density and inflation.
The study found that stock market capitalization was negatively and significantly
influenced by the number of active borrowers and operational sufficiency while it
was positively and significantly influenced by return on assets when the ranked
score model was used.
46
Page 55
The study also found that stock market return was negatively and significantly
influenced by the number active borrowers, operational sufficiency, return on equity,
and GNI. On the other hand, stock market return was positively and significantly
influenced by total loan portfolio, return on assets, and inflation. These results were
true for the ranked score model.
5.3 Conclusions
The study concludes that microfinance has had a significant influence on stock
market development and not on banking sector development. This effect is more
pronounced on stock market capitalization and stock market return. Thus
microfinance has a partial influence on financial sector development in Kenya.
On the banking sector development, only population density, gross national income
and inflation influence the deposit rates. The domestic credit advanced by banks and
the lending rates are not influenced by the microfinance. The lack of influence of
microfinance on domestic credit can be attributed to the fact that the domestic
credit offered by commercial banks has continued to rise over the years despite the
existence of microfinance institutions. The lack of influence on lending rate is
attributed to the growth in domestic credit which has kept the lending rates almost
constant.
47
Page 56
There was no effect of microfinance on the number of listed domestic firms. This
can be attributed to the fact that the number of domestic firms listed on the NSE
has remained almost constant and thereby not much variance to enable a significant
impact from microfinance growth.
5.4 Recommendations
The study makes a number of recommendations based on the findings of the study.
First, the study recommends that there is need for policies to be put up that will
enhance the impact of microfinance on the financial sector development. As it
stands, it seems that this role has not been well played by the microfinance in
Kenya. Chief among the reasons for this is the low profitability of these institutions
as most operate negative ROA, OSS, and ROEs. Policies that can improve
sustainability of these institutions would be beneficial.
There is also need for improvement in the outreach of microfinance institutions
increasing the number of loans extended to the clients. But given the high interest
rates on such loans, it has been hard for the loans to penetrate a large population.
If the rates of borrowing such loans would be reduced, say to about 12% p.a, the
loans would increase and thereby the effect would be more pronounced on the
financial sector development. Currently, the microfinance loans attract an interest of
about 18%.
48
Page 57
5.5 Limitations of the study
There are a number of limitations that this study experienced in the course of
achieving the ultimate goal. First, the study had intended to use number of ATMs
per 100,000 people for banking sector development as an independent variable but
it was impossible given that such data for Kenya was only available for year 2009
from the World Bank website. The study therefore opted for other measures of
banking sector development.
Secondly, the effect of microfinance was analysed for the period 2000-2010 using
six dependent variables for financial sector development as opposed to a single
measure of the same. This way, the results of the impact relate to specific financial
sector development and not FSD as a whole.
Most of the models used in the study were not fit as the F ratios failed significance
tests. But the few models that were significant explained majority of the variance.
The inclusion of more control variables would improve the significance of some of
the models.
5.6 Suggestions for Further Research
There is need for more research on the effect of microfinance on financial sector
development. This study should be performed with the inclusion of more
independent variables and a different set of dependent variables in order to test the
same.
49
Page 58
The use of a longer time series data would be beneficial in improving the quality of
data especially the normality of distribution in order to enable the use of Pearson's
regression analysis without having to transform the data before analysis.
A study should also be done by separating the period of analysis into two: a period
before microfinance and a period of microfinance in order to determine whether the
financial sector (bank and capital market) has performed differently in terms of the
two periods.
50
Page 59
REFERENCES
Aduda, J.O. (2009). The Impact of Micro-Finance Services On Poverty Alleviation: An
Empirical Assessment of Selected Households and Micro-Finance Institutions
in Kenya. Unpublished PhD Thesis, University of Dar es Salaam.
Ahlin, C., J. Lin and Maio, M. (2008) Where does Microfinance Flourish? Microfinance
Institutions' Performance in Macroeconomic Context, Unpublished Working Paper, Michigan State University, Michigan.
Allen F 81 Santomero A M (1998). The Theory Of Financial Intermediation, Journal Of
Banking And Finance 21, 1461-1485.
Armendariz, B. and Morduch, J. (2000) Beyond Group Lending. Economics of
Transition, 8(2), pp. 401-420.
Armendariz, B. and Morduch, J. (2005) The Economics of Microfinance (Boston: MIT
Press).
Armendariz, B. and Szafarz, A. (2009) On Mission Drift of Microfinance Institutions.
CEB Working Papers Series 09/015, Universite Libre de Bruxelles, Brussels.
Armendariz, B. and Vanroose, A. (2009) Uncovering Microfinance Myths: Does
Country-Wide Age Matter? Reflets et Perspectives de la Vie Economique,
48(3), pp. 7-17.
Arrow, K.J.& Debreu, G. 1954. Existence of an Equilibrium for a Competitive
Economy. Econometrical 22: 265-290.
Barham, B.L., S. Boucher, S. and Carter, M.R. (1996) Credit Constraints, Credit
Unions and Small-scale Producers in Guatemala. World Development, 24(5),
pp. 793-806.
Barr, M. (2005) Microfinance and Financial Development. Michigan Journal of
International Law, 26, pp. 271-296.
51
Page 60
Benston, G.J.& Smith Jr., C.W. (1976). A Transactions Cost Approach To The Theory
O f Financial Intermediation, Journal Of Finance 31, 215 - 231.
Campbell, T.S. & Kracaw, W.A. (1980). Information Production, Market Signalling,
And The Theory Of Financial Intermediation, Journal Of Finance 35, 863 -
882.
Christen R.P., Rosenberg, R. and Jayadeva, V. (2004) Financial Institutions with a
"Double Bottom Line": Implications for the Future Development of
Microfinance. CGAP Occasional Papers, No. 8., Consultative Group to Assist
the Poor, the World Bank.
Coase, R.H. (1937). The Nature Of The Firm, Economica 4, 386-405.
Cull, R., Demirguc-Kunt, A. and Morduch, J. (2007) Financial Performance and
Outreach: A Global Analysis of Leading Microbanks. Economic Journal,
517(17), pp. 107-133.
de Crombrugghe, A., Tenikue, M. and Sureda, J. (2008) Performance Analysis for a
Sample of Microfinance Institutions in India. Annals of Public and Cooperative
Economics, 79(2), pp. 269-299.
Demirguc-Kunt, A., Beck., T and Honohan, P. (2008) Finance for All? Policies and
Pitfalls in Expanding Access. World Bank Policy Research Report, World Bank,
Washington DC.
Diamond, D.W. (1984). Financial Intermediation And Delegated Monitoring, Review
O f Economic Studies 51, 393 - 414.
Diamond, D.W., & Dybvig, P. (1983). Bank Runs, Deposit Insurance, And Liquidity,
Journal Of Political Economy 91, 401 - 419.
Fama, E.F. (1980). Banking In The Theory Of Finance, Journal Of Monetary
Economics 10, 10-19.
52
Page 61
Fischer, S. (1983). A Framework For Monetary And Banking Analysis, Economic
Journal 93, 1 - 16.
Gonzalez, A. (2007) Resilience of Microfinance Institutions to Macroeconomic
Events. MIX Discussion Paper, No. 1, The MIX.
Guttentag, J.M. & Lindsay, R. (1968). The Uniqueness O f Commercial Banks, Journal
Of Political Economy 71, 991 - 1014.
Hartarska, V. (2005) Governance and Performance of Microfinance Institutions in
Central and Eastern Europe and the Newly Independent States. World
Development, 33(10), pp. 1627-1643.
Hartarska, V. and Nadolnyak, D. (2007) An Impact Analysis of Microfinance in
Bosnia and Herzegovina. http://ssrn.com/abstract= 1105052.
Hellwig, M. (1991). Banking, Financial Intermediation And Corporate Finance, In: A.
Giovannini And C. Mayer (Eds.), European Financial Integration, Cambridge:
Cambridge University Press.
Hermes, N., Lensink, R. and Meesters, A. (2009) Financial Development and the
Efficiency of Microfinance Institutions. Working Paper, Groningen Universiteit,
http://ssrn.com/abstract= 1396202.
Hitchins, R., Elliott, D. & Gibson, A. (2005). Making business service markets work
the rural poor - a review of experience. In Developing service markets in
rural areas. Small Enterprise Development: an international journal of
microfinance and business development. Vol. 16. Number 2. Hampshire:
ITDG.
Honohan, P. (2004) Financial Sector Policy and the Poor: Selected Findings and
Issues. Working Paper, No. 43, World Bank, Washintong D.C.
53
Page 62
Honohan, P. (2004). Financial sector policy and the poor: Selected findings and
issues. WP 43, Washington D.C.: The World Bank.
Isem, J. and Porteous, D. (2005) Commercial Banks and Microfinance: Evolving
Models of Success. CGAP Focus Note, no. 28, Consultative Group to Assist the
Poor, The World Bank.
Jalilian, H. and Kirkpatrick, C. (2005) Does Financial Development Contribute to
Poverty Reduction? Journal of Development Studies, 41(4), pp. 636-656.
Kindleberger, C.P. (1993). A Financial History Of Western Europe, New York And
Oxford: Oxford University Press (2nd Ed.).
Krauss, N. and Walter, I. (2008) Can Microfinance Reduce Portfolio Volatility?
Working Paper, http://ssrn.com/abstract=943786.
Levine, R. (2004) Finance and Growth: Theory and Evidence. NBER Working Paper
Series, No. 10766, National Bureau for Economic Research.
Mankiw, N.G. (1986). The Allocation of Credit And Financial Collapse, Quarterly
Journal Of Economics 101, 455 - 470.
McIntosh, C. and Wydeck, B. (2005) Competition and Microfinance. Journal of
Development Economics, 78(2), pp. 271-298.
Mersland, R. and Strom, R. (2008) Performance and Trade-Offs in Microfinance
Organisations- Does Ownership Matter? Journal of International
Development, 20, pp. 598-612.
Mersland, R. and Strom, R. (2009) Performance and Governance in Microfinance.
Journal of Banking and Finance, Vol. 33, no. 4, pp. 662-669.
Merton, R.C. (1995b). Financial Innovation And The Management And Regulation Of
Financial Institutions, Journal Of Banking And Finance 19, 461 -481 .
54
Page 63
Morduch, J. (1999) The Microfinance Promisse. Journal of Economic Literature,
37(4), pp. 1569-1614.
Morduch, J. (2000) The Microfinance Shism. World Development , 26(4), pp. 783-
790.
Pralahad, C.K. (2004).The fortune at the bottom of the pyramid: Enabling dignity
and choice through markets. Pennsylvania: Wharton School. In Developing
Service Markets in rural areas. Crossfire. Small Enterprise Development: an
international journal of microfinance and business development. Vol.16.
Number 2. Hampshire: ITDG.
Pyle, D.H. (1971). On The Theory Of Financial Intermediation, Journal Of Finance
26, 737 - 747.
Richter, P. (2004) The Integration of the Microfinance Sector in the Financial Sector
in Developing Countries. The Role that Apex Mechanisms Play in Uganda.
Paper Presented at WIDER Conference, Finland.
Robinson, M. (20031) The Microfinance Revolution: Sustainable Finance for the
Poor, (Washington: World Bank and Open Society Institute).
Rosengard, J.K. (August, 2001). Kinks in the links: Financial intermediation for
Africa's Poor. African Economic Policy Discussion Paper. 84. Boston: John F.
Kennedy School of Government, Harvard University.
Scholtens, B., 8i Van Wensveen, D.M.N (2003). A Critique On The Theory Of
Financial Intermediation, Journal Of Banking And Finance 24, 1243-1251.
Stiglitz, J.E. and Weiss, A. (1981) Credit Rationing in Markets with Imperfect
Information. American Economic Review, 71(2), pp. 393^419.
Tirole, J. (2006) The Theory of Corporate Finance (Princeton: Princeton University
Press).
55
Page 64
Tobin, J. (1963). Commercial Banks As Creators Of "Money", In W.L. Smith, R.L.
Teigen (Eds.), Readings In Money, National Income And Stabilization Policy,
Homewood, III: Richard D. Irwin.
Towey, R.E. (1974). Money Creation And The Theory Of The Banking Firm, Journal
Of Finance 29, 57 - 72.
Vanroose, A. (2006) The Uneven Development of Microfinance: A Latin-American
Case Study. CEB.
Vanroose, A. (2008) What Macro Factors Make Microfinance Institutions Reach Out?
Savings and Development. 32(3), pp. 153-174.
Walras, Leon; 1926; Elements Of Pure Economics Or The Theory Of Social Wealth;
Translated By William Jaffe; 2nd Ed.; 1987; Philadelphia; Orion Press.
World Bank Development Reports retrieved from:
http://web.worldbank.org/WBSITE/EXTERNAL/DATASTATISTICS/0„contentM
DK:21725423~pagePK:64133150~piPK:64133175~theSitePK:239419,00.html
56
Page 65
APPENDICES !Appendix 1: Financial Sector Development Data from World Bank
Year MFIs NAB TLP OSS ROA ROEDOM
CREDITDEP
RATE LENDRATE LISTED MKTCAPSTOCKTURN POPDEN FDI GNI INFL
2000 5 55,604 18,286,167 101.28 (1.42) 2.08 39.20 8.10 22.30 57.00 1,283,090,000.00 3.50 55.00 110,904.550.00 402.00 10.00
2001 7 80,164 29,480,704 85.25 (2.02) (2.07) 37.50 6.60 19.70 57.00 1,049,800,000.00 3.40 56.00 5,302,623.00 407.00 5.70
2002 7 145,234 48,548,596 98.29 (7-64) 11.74 40.30 5.50 18.50 57.00 1,423,070,000.00 2.90 58.00 20,202,582.00 398.00 2.00
2003 12 205,902 65,588,736 113.50 0.03 0.10 39.80 4.10 16.60 51.0C 4,178,210,000.00 7.50 59.00 79,662,931.00 400.00 9.80
2004 17 251,305 101,181,052 112.38 (7.67) (103.90) 40.20 2.40 12.50 47.00 3,890,970,000.00 8.50 61.00 41,647,828.00 408.00 11.60
2005 18 394,773 163,020,028 111.93 4.58 19.17 38.40 5.10 12.90 47.00 6,383,990,000.00 9.80 63.00 11,524,456.00 418.00 10.30
2006 18 665,136 236,899,919 107.99 0.02 8.78 38.00 5.10 13.60 51.00 11,378,040,000.00 14.60 64.00 26,717,028.00 432.00 14.50
2007 18 920,780 564,695,142 112.79 1.73 4.56 37.30 5.20 13.30 51.00 13,386,590,000.00 10.60 66.00 693,011,390.00 451.00 9.80
2008 18 1,170,374 781,084,765 127.21 0.93 (277.08) 40.50 5.30 14.00 53.00 10,916,560,841.00 11.80 65.00 51,819,059.00 445.00 26.20
2009 17 1,471,169 1,114,878,160 114.01 (0-25) 9.91 44.80 6.00 14.80 55.00 10,755,988,305.00 4.60 69.00 94,534,839.00 448.00 9.20
2010 11 1,145,588 1,201,640,016 127.62 4.54 21.55 52.30 14.40 53.00 14,460,867,410.00 8.60 71.00 460.00 4.00
57