The Impact of Motor Axon Misdirection and Attrition onBehavioral Deficit Following Experimental Nerve InjuriesJacob Daniel de Villiers Alant1*, Ferry Senjaya1, Aleksandra Ivanovic2, Joanne Forden2, AntosShakhbazau2, Rajiv Midha1
1 Department of Clinical Neurosciences, Hotchkiss Brain Institute, University of Calgary, Calgary, Alberta, Canada, 2 Department of Neuroscience, HotchkissBrain Institute, University of Calgary, Calgary, Alberta, Canada
Abstract
Peripheral nerve transection and neuroma-in-continuity injuries are associated with permanent functional deficits,often despite successful end-organ reinnervation. Axonal misdirection with non-specific reinnervation, frustratedregeneration and axonal attrition are believed to be among the anatomical substrates that underlie the poorfunctional recovery associated with these devastating injuries. Yet, functional deficits associated with axonalmisdirection in experimental neuroma-in-continuity injuries have not yet been studied. We hypothesized thatexperimental neuroma-in-continuity injuries would result in motor axon misdirection and attrition with proportionalpersistent functional deficits. The femoral nerve misdirection model was exploited to assess major motor pathwaymisdirection and axonal attrition over a spectrum of experimental nerve injuries, with neuroma-in-continuity injuriessimulated by the combination of compression and traction forces in 42 male rats. Sciatic nerve injuries wereemployed in an additional 42 rats, to evaluate the contribution of axonal misdirection to locomotor deficits by a ladderrung task up to 12 weeks. Retrograde motor neuron labeling techniques were utilized to determine the degree ofaxonal misdirection and attrition. Characteristic histological neuroma-in-continuity features were demonstrated in theneuroma-in-continuity groups and poor functional recovery was seen despite successful nerve regeneration andmuscle reinnervation. Good positive and negative correlations were observed respectively between axonalmisdirection (p<.0001, r2=.67), motor neuron counts (attrition) (p<.0001, r2=.69) and final functional deficits. Wedemonstrate prominent motor axon misdirection and attrition in neuroma-in-continuity and transection injuries ofmixed motor nerves that contribute to the long-term functional deficits. Although widely accepted in theory, to ourknowledge, this is the first experimental evidence to convincingly demonstrate these correlations with data inclusiveof the neuroma-in-continuity spectrum. This work emphasizes the need to focus on strategies that promote bothrobust and accurate nerve regeneration to optimize functional recovery. It also demonstrates that clinically relevantneuroma-in-continuity injuries can now also be subjected to experimental investigation.
Citation: Alant JDdV, Senjaya F, Ivanovic A, Forden J, Shakhbazau A, et al. (2013) The Impact of Motor Axon Misdirection and Attrition on BehavioralDeficit Following Experimental Nerve Injuries. PLoS ONE 8(11): e82546. doi:10.1371/journal.pone.0082546
Editor: David R Borchelt, University of Florida, United States of America
Received August 28, 2013; Accepted November 2, 2013; Published November 25, 2013
Funding: The authors thank the AANS/CNS Joint Section for Spine and Peripheral Nerve for the Kline Award (http://www.spinesection.org/fellowships_awards.php?id=3) and the Plastic Surgery Foundation/ (http://www.thepsf.org/x365.xml?keyword=&investigator=alant&year=&institution=&location=&fundingmechanism=&focusarea=) American Association for Peripheral Nerve (http://www.peripheralnerve.org/fellowships/fellowships.html) for funding provided in partial support of this project. The funders had no role in study design, datacollection and analysis, decision to publish, or preparation of the manuscript.
Competing interests: The authors have declared that no competing interests exist.
Axonal misdirection is believed to play a significant role inpoor functional recovery seen after severe nerve injuries [1–3].Although widely accepted, this relationship is not yetestablished by experimental evidence to demonstrate apositive correlation between axonal misdirection and behavioraldeficit following sub-transection injuries [4].
Axonal misdirection is strictly not expected to follow pureaxonotmetic (Sunderland Grade 2 or crush) injuries in which
full functional recovery usually occurs [5,6]. This is thought tobe because of preservation of endoneurial connective tissueintegrity, which helps axons to regenerate accurately andefficiently to the original targets. In contrast, unrepairedtransection injuries (Sunderland Grade 5) are not expected torecover any significant function, although rodents are known tobe able to regenerate axons across substantial transectiongaps [7,8]. Unrepaired transection injuries should represent theextreme of axonal misdirection, provided that the regenerationgap is bridged.
PLOS ONE | www.plosone.org 1 November 2013 | Volume 8 | Issue 11 | e82546
In order to effectively investigate the relationship betweenaxonal misdirection and functional deficit, the gap inexperimental data between minimal and extreme nerve injuriesneeded to be bridged. These intermediate sub-transection(Sunderland Grade: 3 - endoneurial and 4: - endo- andperineurial disruption) injuries that result in neuroma-in-continuity (NIC) formation are the most challenging clinicallyand have previously been elusive to experimental investigationbecause of the lack of an appropriate animal model. Recently aclinically relevant traumatic NIC model was presented thatshowed some promise to bridge this gap [9]. Although sciaticnerve NIC injuries were associated with functional deficitsdiscernable from crush injuries, this model was notmechanistically validated by the unequivocal demonstration ofquantitative data to support the histological and functionalfindings.
We hypothesized that experimental NIC injuries would resultin motor axon misdirection and attrition with persistentfunctional deficits. We show how the NIC, femoral and sciaticnerve injury models were exploited to demonstrate 1) axonalmisdirection and attrition of motor neurons with motor pathwayprojections in NIC injuries, similar to transection injuries; 2) forthe first time, a direct correlation between the degree of motoraxon misdirection and behavioral deficit, with inclusion of theNIC injury spectrum; 3) a negative correlation betweenfunctional recovery and the degree of attrition of motor neuronsprojecting into motor pathways. We hereby demonstrate howthis small animal NIC model (with some refinement), can helpto expose otherwise elusive substrates of nervous systeminjuries to experimental investigation and possible therapeuticmanipulation.
Materials and Methods
Ethics StatementMale Lewis rats were used in these experiments (Charles
River Laboratories International Inc., St-Constant, QC,Canada). The study protocol was approved by the University ofCalgary Animal Care Committee and adhered strictly to theCanadian Council on Animal Care guidelines (protocolM08124).
General animal careAll efforts were made to minimize suffering and animals were
maintained in a temperature and humidity controlledenvironment with standard rat chow (Purina, Mississauga, ON,Canada), water ad libitum and a 12:12h light:dark cycle.Surgical procedures were performed under inhalationanesthetic (Isoflurane, Pharmaceutical Partners of CanadaInc., Richmond Hill, ON, Canada) using standard microsurgicaland aseptic technique and an operating microscope.Buprenorphine (0.03mg/kg) subcutaneous injections followedby jello with buprenorphine were used for peri- and post-operative analgesia. Surgical procedures were well tolerated byall animals, with no complications observed. Animals weresacrificed at study termination, under deep inhalationanesthesia with intra-peritoneal Somnitol (Bimeda-MTC,
Cambridge, ON, Canada) followed by trans-cardiac perfusionwith saline and 2% paraformaldehyde.
Instruments and nerve characteristicsA malleus nipper (MN) (16149-11, Fine Science Tools Inc.,
North Vancouver, BC, Canada) was modified to exert uniformcompression and an adjustable stop mounted to the handles toenable instrument calibration with a thin load cell (Figure S1;Text S1). It has been suggested that the addition of traction toa compression force would aid the reproduction of NIC injuries[9]. We employed traction by applying 3-second compression(with the malleus nipper) in combination with simultaneous50g-traction with a spring scale (100x1g, AMW-PEN100,American Weigh Sales Inc., Norcross, GA, USA) hookedaround the nerve, pulling orthogonal to the native nerve course.During pilot experiments this technique produced clearhistological features of uniform NIC formation in sciatic andfemoral nerves at 5 days (Figure S2). With threshold datacollected during pilot experiments, sub-transection settings onthe MN were selected with the aim to reproduce NIC injuries ingroups of animals by using the “tight” nerve diameter range oftarget nerves in these experimental groups (Figure S1; TextS1).
Femoral nerve experimentsSelective and variable disruption of the internal nerve
architecture of a nerve would potentially result in proportionalaxonal misdirection and attrition. We first set out to investigateto what degree we could induce misdirection within an injurednerve without disruption of its gross epineurial continuity. Weapplied the newly developed NIC injury model to the femoralnerve misdirection model, which is favorably suited andestablished to investigate axonal misdirection [10]. The rodentfemoral nerve terminates in a motor (quadriceps) and acutaneous division (saphenous and thigh skin) of similar size[10]. Following a more proximal injury, the motor neurons withaxons that are misdirected into the cutaneous division can beback labeled by various techniques to estimate the degree ofmisdirection [11].
42 rats, weighing 250-300g were randomized into one ofseven groups of six rats each for left femoral nerve surgeries(Figure 1). At 28 days, fast blue (FB) (Polysciences Inc.,Warrington, PA, USA) and 1,1'-dioctadecyl-3,3,3',3'-tetramethyl-indocarbo-cyanine perchlorate (Di-I) (Invitrogen,Molecular Probes, Eugene, OR, USA) were respectivelyapplied distally, to the main motor (FB) and cutaneous (Di-I)divisions of the nerves for retrograde labeling of spinal cordmotor neurons. Distal motor division nerve segments were alsoharvested at this time for histomorphometry. 13 days laterspinal cords and femoral nerves were harvested for longitudinalcryostat sectioning, counting of fluorescently labeled neuronsand histological evaluation of injury zones.
For all the injury groups the femoral nerve was exposed inthe groin up to the origin of the iliacus nerve by division of theinguinal ligament. The target injury site was marked with amesoneurial 9.0 nylon (Ethilon, Johnson & Johnson Medical,Markham, ON, Canada) suture, 7-7.5mm proximal to the
Axonal Misdirection and Functional Deficits
PLOS ONE | www.plosone.org 2 November 2013 | Volume 8 | Issue 11 | e82546
femoral nerve division point, and the “tight” nerve diametermeasured at this site with electronic calipers.
In the Shamf (“f” denoting femoral nerve experiments) group,wounds were closed after the marking suture placement. Crushinjuries were included as established axonotmetic injuries forcomparison [12]. Ideally no misdirection or long-term functionaldeficit should result from these injuries, although misdirectionand extrafascicular regeneration have been previouslydescribed in “crush” injuries [13,14]. Simple 30-second Crushf
injuries were made just proximal to the marking suture withjeweler’s forceps (Dumont #5, Fine Surgical Tools Inc., NorthVancouver, BC, Canada). In the Transectionf group, markingsutures were placed at 7 and 8mm (1mm apart) proximal to thefemoral division point and the femoral nerve sharplytransected, midway between the sutures (Figure 1). The endswere left to retract in situ and the wounds closed. This was to
simulate unrepaired Sunderland Grade 5 injuries, as the mostsevere category of peripheral nerve injury.
Femoral nerve diameters of the above groups were used toselect an appropriate sub-transection setting (3690g)(representative of this cohort of animals) on the MN using dataof pilot experiments (Figure S3; Text S1). Three injuryparadigms were used with the aim to reproduce NIC injuries(Figure 1). For the MNf group, a single 3-second injury wasmade just proximal to the single marking suture (no traction).The spring scale was hooked around the femoral nerve toapply 50g of traction, when a 3-second MN injury (same 3690gsetting) was made just proximal to the suture in the MN+50gf
group. Traction was released after the 3-second injury. For the(MN+50g)x2f group (“double” femoral NIC-injury group), twomarking sutures were placed (7 and 8mm proximal to divisionpoint), and the above procedure repeated, first the proximal
Figure 1. Experimental groups. Representative pictures of injury zones (arrows) are shown for each of the femoral and sciaticnerve experimental groups, proximal ends to the left. SHAM – nerve exposure and suture marking only; CRUSH – simple 30-second jeweler’s forceps crush; MN – single 3-second compression using sub-transection force; MN+50g – single MN compressioncombined with 50g traction force; (MN+50g)x2 – two MN+50g injuries made in tandem; TRANSECTION – sharp transection withoutrepair; TRANSECTION+REPAIR – intra-tubular repair of the transected femoral nerves; NEGATIVE CONTROL – transection,capping and back-reflection of sciatic nerve ends as negative control.doi: 10.1371/journal.pone.0082546.g001
Axonal Misdirection and Functional Deficits
PLOS ONE | www.plosone.org 3 November 2013 | Volume 8 | Issue 11 | e82546
then the distal injury, with brief release of the traction betweeninjuries. This group was included in an attempt to maximizedisruption of the internal nerve architecture at the selectedforce setting. The Transection+Repairf group was included tosimulate immediate direct coaptation of Grade 5 injuries as a“gold standard” therapeutic strategy for reference. Here thenerve was transected at 7.5mm as above (without markingsutures). For improved ease and security of the repair, nerveends were approximated within a 3mm long silicone tube with9.0 nylon (0.64mm internal diameter, Silastic LaboratoryTubing, Dow Corning Corporation, Midland, MI, USA). Themean “tight” nerve diameter of the femoral nerve at the targetinjury site as measured at the initial surgery was 0.54mm(range 0.46 - 0.6mm).
Retrograde labeling, specimen processing andmicroscopy (femoral nerve experiments). At 28 days,femoral nerves were re-exposed distal to the inguinal ligament.Femoral nerve motor division nerve segments (1-2mm) wereharvested just distal to the point where the nerves weretransected for FB application (see below). These segmentswere fixed in 2.5% glutaraldehyde, post fixed in osmiumtetroxide, Epon resin-embedded, 1µm semi-thin transversesections cut (LKB 8800 Ultratome III, Bromma, Stockholm,Sweden) and stained with toluidine blue forhistomorphometrical analysis. Five fields of view per sectionwere photographed at high power light microscopy (400x;Olympus BX51) for analysis. Images were digitized with aWacom Intuos3 digitizing tablet (Vancouver, WA, USA) andanalyzed using Image Pro Plus software (Media Cybernetics,Bethesda, MD, USA). Axon and myelin measurements wereused to calculate the average G-ratios (axon diameter/fiberdiameter) and percentage of neural tissue (fiber area/intrafascicular area) for each nerve.
The distal motor and cutaneous divisions were “capped” withsmall silicone caps (3mm long, 0.64 mm ID), carefully prefilledwith a small amount of FB or Di-I crystals, respectively, andsecured with 9.0 nylon [15].
Femoral nerve injury zones were harvested immediately priorto perfusion (28+13= 41 days post injury), fixed in 10%formalin, cryoprotected in 30% sucrose-phosphate bufferedsaline and then embedded in optimal cutting temperature(OCT) compound (Sakura Fine Technical Co., Torrance, CA,USA). The distance between marking-sutures in theTransectionf group were recorded after careful exploration ofthe injury zones. Serial 8µm cryotome (Leica CM1900; LeicaMicrosystems Inc., Richmond Hill, ON, Canada) longitudinalsections were cut at -18°C and mounted onto Superfrost Plusslides (Fisher Scientific, Ottawa, ON, Canada). Selectedsections were double stained for NF (NF200, 1:600 dilution;Sigma-Aldrich) and rhodamine phalloidin (Invitrogen, LifeTechnologies Inc., Burlington, ON, Canada) (f-actin stain tohighlight perineurium) according to supplier protocols. Theexaminer was blinded to the experimental group allocation untilsections were examined and injury zones photographed with afluorescence microscope (Olympus BX51, Olympus AmericaInc., Center Valley, PA, USA) using appropriate filters.
13 days after tracer application and just after harvesting ofthe femoral nerve injury zones, the animals were perfused.
Lumbar spinal cords (T12 to conus) were harvested,cryoprotected in paraformaldehyde and sucrose solution andembedded in OCT for longitudinal (coronal) 45µm cryostatsectioning. All sections through the ventral grey horns werecollected and mounted on glass slides for counting of thelabeled motor neurons. With the fluorescent microscope andappropriate filters, pictomicrographs were taken for counting oftotal (the sum of all labeled neurons counted on all the slides ofeach spinal cord) FB, total Di-I and double labeled motorneurons (visible on superimposed pictures) by a blindedobserver. Double labeled neurons were included in both FBand Di-I counts. Two spinal cord specimens were damagedduring cutting so that not all consecutive sections could beassessed and these two were excluded from analysis, oneeach in the following groups: (MN+50g)x2f and Transection+Repairf.
Sciatic nerve experimentsAlthough functional recovery following mouse femoral nerve
injuries has been successfully assessed before, the sciaticnerve model is most widely employed for behavioral outcomemeasures in rodents [16–18]. We therefore returned to thewell-established sciatic nerve model to assess the relativeimpact that different degrees of nerve injury (and theassociated misdirection and attrition investigated in the simplerfemoral nerve model) have on integrated functional recovery.Assessment of axonal misdirection is however morechallenging in the sciatic nerve model. We employed a motorneuron sampling technique to provide a conservativemisdirection assessment (Text S1). This allowed us toinvestigate the correlation between axonal misdirection (andattrition) and functional recovery within an establishedbehavioral assessment model.
42 rats, weighing 300-350g, were randomized into one ofseven similar groups of six rats each for right sciatic nervesurgeries (Figure 1). Skilled locomotion with horizontal ladderrung data was collected at baseline and serially up to 12weeks. After 12 weeks, FB and Di-I were respectively applieddistally, to the medial gastrocnemius (MG) and sural nerves forretrograde labeling of spinal cord motor neurons. 13 days laterspinal cords were harvested and processed for counting offluorescently labeled neurons and right tibialis anterior muscleswere harvested for wet muscle weight.
For all the sciatic nerve injury groups the right sciatic nervewas exposed from where it emerges over the external obturatormuscle from the sciatic notch, to the trifurcation above thepopliteal fossa. The target injury site was marked with amesoneurial 9.0 nylon suture, 9.5- 10.5mm proximal to thesciatic nerve trifurcation point, and the “tight” nerve diametermeasured at this site.
In the Shams (“s” denoting sciatic nerve experiments) surgerygroup, wounds were closed after the marking sutureplacement. Simple 30-second Crushs injuries were made justproximal to the marking suture with jeweler’s forceps. In theTransections group, marking sutures were placed at 9.5 and10.5mm (1mm apart) proximal to the sciatic trifurcation and thenerve sharply transected midway between the sutures (Figure1). The ends were left to retract in situ and the wounds closed.
Axonal Misdirection and Functional Deficits
PLOS ONE | www.plosone.org 4 November 2013 | Volume 8 | Issue 11 | e82546
The Negative Controls group was added mainly for thebehavioral component of the study. Here the nerve wastransected at 10mm as above and the ends capped with tight-fitting 3-mm long silicone tubes (0.64mm ID, one end pre-sealed with silicone) and the distal stump reflected to asubcutaneous location, to deter spontaneous regeneration.
Sciatic nerve diameters of these groups were used to selectthe setting of 4860g on the MN for the three NIC groups(Figure S3). In the MNs group, a single 3-second injury wasmade just proximal to a marking suture at 10mm (no traction).The spring scale was hooked around the sciatic nerve to apply50g of traction, when a 3-second MN injury was made justproximal to the marking suture in the MN+50gs group. Tractionwas released after the 3-second injury. In the (MN+50g)x2s
group, two marking sutures were again used (at 9 and 10mmproximal to the trifurcation), and the above procedure repeated,first the proximal then the distal injury, with brief release of thetraction between the injuries. The mean “tight” nerve diameterof the sciatic nerve at the target injury site as measured at theinitial surgery was 0.91mm (range 0.78 - 1.01mm).
Retrograde labeling, specimen processing andmicroscopy (sciatic nerve experiments). After the 12-weekskilled locomotion assessment, MG and sural nerves wereexposed in the popliteal fossa. FB and Di-I was applied to theright MG and sural nerves respectively, by capping the severednerves with small, prefilled silicone caps (2.5 mm long, 0.51mm ID).
13 days after tracer application and just after harvest andweighing of the right tibialis anterior muscles, the animals wereperfused and the lumbar (T12- conus) spinal cords harvested.The distance between marking-sutures in the Transections
group were also recorded after careful exploration of the injuryzones. A midline reference pin was placed at the L5/L6 dorsalrootlet junction and cords embedded, cut, mounted andphotographed as with the femoral experiments describedabove. For each spinal cord, digital pictures of serial sectionswere positioned along the same longitudinal axis (midline ofspinal cord) with the pinholes aligned on superimposedpictures (Adobe Photoshop Elements 8, Adobe SystemsIncorporated, San Jose, CA, USA). For each animal, the mostcaudally labeled cell among all the sections was used toidentify the caudal reference. Using the picture compilations ofthe six animals in the Shams group, the maximum rostro-caudal extent of the MG and sural nerve motor neuron poolswere determined and used as reference boundaries for allother groups (Figure 2). While blinded, all blue (MG) and yellow(sural) labeled motor neurons were counted on each section(and added together for each spinal cord) with an overlayreference grid and scored as either “in-” or “out-” side thereference MG or sural longitudinal boundaries. No attempt wasmade to correct for double counted motor neurons. The relativepercentage of motor neurons with misdirected axonalprojections was calculated for MG and sural samples(%misdirection MG = FB out/FB total x 100; %misdirectionsural = Di-I out/Di-I total x 100). The average percentagemisdirection for each animal and group was also calculated asthe average between the misdirection results of the MG andsural nerve sampling techniques.
Behavior (sciatic nerve experiments). The horizontalladder rung task has been successfully used previously toassess return of skilled locomotor behavior following hind limbnerve injuries in rats [9,15,19]. Animals were trained to cross ahorizontally placed ladder prior to surgical intervention. Theapparatus consists of sidewalls made of clear plexiglass (1mlong, 20cm high) and metal rungs (3mm diameter), which areinserted 1cm from the bottom of the plexiglass and can bespaced 1cm or more apart. During testing, an irregular patternof the rungs (1-3cm apart) was changed from trial to trial inorder to prevent the animals from learning the spacing pattern.Five satisfactory runs were used for each animal and timepoint, with a satisfactory run consisting of the animal travellingacross the beam uninterrupted at a constant velocity. A mirrorwas placed at a 45° angle below the ladder so that the ratscould be video-recorded with a simultaneous lateral and aventral view. Steps with the right hind limbs were scored as acorrect or an incorrect (total miss or deep slip) step [19]. A slipratio (%) was calculated as the number of right hind limb slipsper total number of right hind limb steps. Recordings wereanalyzed frame-by-frame by a trained observer, blinded to theexperimental conditions. Data were analyzed for baseline andweeks 2, 6, 10 and 12 following surgery.
Statistical analysisData were analyzed with GraphPad Prism 4 (GraphPad
Software, San Diego, CA, USA) software using one-wayANOVA and post hoc Tukey’s HSD test to compare resultsbetween groups. For behavioral data, repeated measuresANOVA with post hoc Tukey’s HSD test were used for pairwisecomparisons where appropriate. Linear correlations (Pearson)were investigated between final functional outcome (12-weekslip ratio) and average percentage misdirection as well as thetotal number of motor neurons projecting into the main motor(MG) branch for all individual animals with paired results.Statistical significance was accepted at the level of p<0.05, withresults presented as the mean ± SEM.
Results
The “double” femoral NIC-injury group hadhistomorphometry similar to neurotmetic groups
Histology of the injury zones harvested at 41 days afterinjuries were assessed for signs of aberrant intra- andextrafascicular axonal regeneration by an observer blinded tothe group allocation. The rhodamine phalloidin f-actin stain wasuseful to delineate the perineurium in order to detect perineurialinfiltration and extrafascicular regeneration of NF strainedaxons. Although features of NIC were identified in all three NICinjury groups, this was not quantifiable with a validated method(Figure 3). The mean distance between the two markingsutures (initially 1mm apart) in the Transectionf group atharvest was 3.45mm (range 2.0 - 5.15mm).
Femoral nerve motor division segments that were harvesteddistal to the FB application site at 28 days that were suitable forhistomorphometrical evaluation, had similar G-ratios althoughstatistically significant differences (F(6, 28)=3.23, p=.015) wereshown comparing Shamf with Transectionf and Transection
Axonal Misdirection and Functional Deficits
PLOS ONE | www.plosone.org 5 November 2013 | Volume 8 | Issue 11 | e82546
Figure 2. Selective sciatic motor neuron labeling for assessment of relative axonal misdirection. For demonstrationpurposes, representative coronal cut hemi-cord examples (stacks of all spinal cord sections of a single animal from each group)show the disorganization of labeled neurons after more severe nerve injuries, compared to Shams (stack of all 6 sham cords used todefine the reference boundaries). FB (blue) or Di-I (yellow) labeled cells outside the reference bounds have axons misdirectedrespectively to the MG or sural nerves. Caudal sciatic pool boundaries were aligned to overlay the Shams group pool reference gridfor the determination of motor neurons with misdirected axons (500µm scale bar).doi: 10.1371/journal.pone.0082546.g002
Axonal Misdirection and Functional Deficits
PLOS ONE | www.plosone.org 6 November 2013 | Volume 8 | Issue 11 | e82546
Figure 3. Neuroma formation in femoral nerve NIC groups. Representative longitudinal femoral nerve sections of theexperimental NIC groups, with magnified areas demonstrating extrafascicular regeneration on the right. MNf injury zones showedthe least, and (MN+50g)x2f (proximal injury) the most prominent NIC features. Proximal ends to the left, NF 200 in green,Rhodamine Phalloidin (f-actin) in red (250µm scale bar).doi: 10.1371/journal.pone.0082546.g003
Axonal Misdirection and Functional Deficits
PLOS ONE | www.plosone.org 7 November 2013 | Volume 8 | Issue 11 | e82546
+Repairf groups (p<.05) (Table 1). Fiber diameters weresignificantly different between groups (F(6, 28)=17.19, p<.0001) with the Shamf group fibers larger than all other groups(p<.05). Crushf group fibers were also larger than (MN+50g)x2f, Transectionf and Transection+Repairf groups (p<.05) (Figure 4A). Percentage neural tissue (F(6, 28)=9.62, p<.0001) in the Shamf and Crushf groups were significantly largerthan the (MN+50g)x2f, Transectionf and Transection+Repairf
groups (p<.05) (Figure 4B).
Axonal attrition and misdirection in the “double”femoral NIC-injury group were also similar toneurotmetic injuries
After 13 days, successful Di-I and FB motor neuron labelingoccurred in all but three of 40 cords assessed (two of 42 weredamaged). One of the Shamf group demonstrated aberrant Di-Ilabeling, likely due to leakage at the application site. Di-Ilabeling was unsuccessful in another two animals(Transectionf; (MN+50g)x2f ) and these were excluded fromanalysis. The following group statistics were evaluated afterunblinding: FB counts (motor neurons back-labeled via axonsthat regenerated down the distal motor division), Di-I counts(motor neurons back-labeled via axons misdirected down thedistal cutaneous division), double label counts (motor neuronslabeled by both dyes due to collateral axonal sprouting andregeneration into both motor and cutaneous divisions), totalmotor neurons labeled (FB + Di-I minus double label) andmisdirection percentage (Di-I/Total x 100).
Total motor neurons labeled differed significantly betweengroups (F(6, 30)=3.57, p=.0087) (Table 1). As expected,practically only FB motor neurons were present in the Shamf
and Crushf groups, because no axonal misdirection should befound in these groups. The highest counts were found in theCrushf group, significantly more than in the (MN+50g)x2f andTransection+Repairf groups (p<.05) (Figure 5D). The FBcounts represent the relative attrition of motor neurons withaxons in the motor division of the femoral nerve. There werealso significant differences in FB counts between the groups(F(6, 30)=8.11, p<.0001) (Figure 5E). The lowest number of FBlabeled cells (most attrition) was found in the (MN+50g)x2f
group, similar to the Transectionf and Transection+Repairf
groups and significantly lower than the Shamf and Crushf
groups (p<.01).
The percentage axonal misdirection (Di-I/Total x 100)differed significantly between groups (F(6, 30)=13.22, p<.0001)(Figure 5F). Axonal misdirection was the highest in theTransectionf group and together with the (MN+50g)x2f group,had statistically significant differences from the Shamf, Crushf,MNf and MN+50gf groups (p<.05). The Transectionf group hadalso significantly more misdirection compared to theTransection+Repairf group (p<.05), supporting the advantageof nerve repair. Although relatively few double-labeled cellswere detected, groups also demonstrated some differences indouble-label counts (F(6, 30)=2.98, p=.02). The Transectiongroup had the most motor neurons with axonal processes inboth major distal femoral divisions (Table 1). This wassignificantly more than in Shamf, Crushf, MNf and MN+50gf
groups (p<.05). These results indicate that the doubleexperimental NIC injuries ((MN+50g)x2f) were similar tounrepaired Sunderland Grade 5 injuries (Transectionf) interms of axonal attrition in the motor division and majorpathway (motor to sensory) misdirection. The absence oftraction did not appear to make a difference in these femoralnerve experiments (MNf group), but inclusion of the (MN+50g)x2 group effectively captured more severe injuries.
Muscle weights of sciatic transections injuries suggestimpaired but partial reinnervation
In the femoral nerve experiments quadriceps muscles werenot weighed because these muscles were denervated by thelabeling technique. In the sciatic nerve experiments onlyselected muscles (plantar and MG) were denervated, which leftthe tibialis anterior muscle available for assessment. Asexpected, the tibialis anterior wet muscle weight demonstratedstatistically significant differences with heaviest muscles in theShams (1.03 ± 0.1g), and lowest in the Negative Controls (0.2± 0.02g) group (F(6, 35)=20.76, p<.0001) (Table 2). TheNegative Controls group was different from all other groups(p<.001) and the Transections group was different from all butthe MNs group (p<.05) on the post hoc Tukey’s test (Figure6A). The mean distance between the two marking sutures(initially 1mm apart) in the Transections group at the time ofmuscle harvest was 8.89mm (range 6.74 - 10.56mm).
PLOS ONE | www.plosone.org 8 November 2013 | Volume 8 | Issue 11 | e82546
Variable attrition and misdirection were found in sciaticNIC groups
All spinal cord specimens of the sciatic nerve experimentswere suitable for blinded evaluation of all the serial longitudinalsections. Very few double-labeled cells were detected. One ofthe Transections group cords had no visible FB or Di-I andmisdirection could not be calculated for this animal due to poorregeneration consistent with poor recovery in this animal (54%slip ratio at week 12; muscle weight 0.19g). Di-I labeling wastoo faint and inadequate for quantification in one animal fromthe Shams group.
Both the MG and smaller sural motor neuron pools were welldefined in the Shams group with an average number of 167,66± 6.16 (FB) and 90 ± 14.67 (Di-I) labeled cells counted,respectively. In the Crushs group, total counts were similar and
only a few cells were located outside the MG (1.17 of 169.83 ±10.73) and sural (0.5 of 82.5 ± 13.96) pool boundaries (Table2). Total FB labeled (MG nerve) motor neuron counts differedsignificantly between the groups (F(5, 30)=5.79, p=.0007)(Figure 6B). The three NIC injury groups had variable FBcounts, with means between that of the Crushs andTransections groups. The Transections group had the lowestnumber of FB labeled motor neurons (69.66 ± 15.77), differentfrom the Shams and Crushs groups (p<.01). No statisticallysignificant differences of total motor neurons labeled from thesural nerve (Di-I) were demonstrated between groups (F(5,29)=0.58, p=.71) (Table 2).
The average percentage misdirection were also significantlydifferent between groups (F(5, 64)=17.48, p<.0001) (Figure6C). Misdirection was variable and intermediate in the NIC
Figure 4. Femoral nerve motor division histomorphometry. Representative semi-thin transverse sections of the motor divisionof each femoral nerve group stained with toluidine blue. A) Fiber diameters in two NIC groups were not significantly different fromCrushf (n=6), unlike the (MN+50g)x2f (n=5), Transectionf (n=5) and Transection+Repairf (n=6) groups (*), although all were differentfrom Shamf (**). B) Percentage neural tissue in the (MN+50g)x2f group showed statistically significant differences compared to theShamf (n=6) and Crushf groups, similar to the Transectionf and Transection+Repairf groups. MNf (n=3); MN+50gf (n=4); 20µm scalebar (* and ** p<0.05).doi: 10.1371/journal.pone.0082546.g004
Axonal Misdirection and Functional Deficits
PLOS ONE | www.plosone.org 9 November 2013 | Volume 8 | Issue 11 | e82546
Figure 5. Femoral nerve motor neuron labeling results. Results of motor neuron labeling by FB (A) and Di-I (B) application tofemoral nerve motor and cutaneous divisions, respectively. Double-labeled motor neurons (C) are illustrated by the arrows (merge A+B). The total MN counts (FB + Di-I minus double label) represent the overall degree of attrition of motor neurons that regeneratedaxons beyond the injury zone. The total Crushf (n=6) group counts dominated over (MN+50g)x2f (n=4) and Transection+Repairf
(n=5) groups with statistical significance (D). FB cell counts of the Shamf (n=5) and Crushf groups showed statistically significantdifferences compared to the (MN+50g)x2f, Transectionf (n=5) and Transection+Repairf groups, indicating significant motor pathwayattrition in the latter groups (E). Percentage motor axons misdirected to the cutaneous division (= Di-I labeled/ Total count x100) wasthe highest in the Transectionf group and together with the (MN+50g)x2f group, had statistically significant differences from theShamf, Crushf, MNf (n=6) and MN+50gf (n=6) groups. The Transectionf group had also significantly more misdirection compared tothe Transection+Repairf group (F); 100µm scale bar (*p<0.05;**p<0.01).doi: 10.1371/journal.pone.0082546.g005
Axonal Misdirection and Functional Deficits
PLOS ONE | www.plosone.org 10 November 2013 | Volume 8 | Issue 11 | e82546
groups, but only the MN+50gs group showed statisticallysignificant differences from the Shams and Crushs groups onthe post hoc Tukey’s test (p<.01) (Table 2). Transections
group cords demonstrated the greatest degree of disruption ofthe MG and sural pool organization (Figure 2). TheTransections group also had the highest misdirection (30.57 ±6.5% to MG and 54.2 ± 7.11% to sural) with averagemisdirection different from all other groups (42.39 ± 6.01%; p<.001). As expected, no FB or Di-I was visible in any of theNegative Controls spinal cords.
NIC injuries had variable recovery, but unrepairedtransection injuries did not recover significant function
To assess the integrated motor and sensory behavioralrecovery of the injured right hind limbs, ladder rung slip ratios(%) were calculated as the number of right hind limb slips pertotal number of right hind limb steps at baseline, weeks 2, 6, 10and 12 (Figure 7A). Consistent with previous reports, thebaseline slip ratio was 4.43% with no significant differencesbetween the groups (F(6, 35)=1.87, p=.50)[15]. At week 2, slipratios were significantly different (F(6, 35)=25.43, p<.0001), asall six groups with nerve injuries made more errors than theShams group. By week 6, the Crushs group slip ratios hadreturned to pre-injury baseline and Shams group performance.The Negative Controls and Transections groups showed nosignificant recovery in slip ratio following the injuries (F(3,5)=0.62, p=.61 and F(3, 5)=1.07, p=.39 respectively).Statistically significant differences between groups werepresent at weeks 6 (F(6, 35)=9.82, p<.0001), 10 (F(6,35)=9.19, p<.0001) and 12 (F(6, 35)=12.18, p<.0001). Theindividual animal deficits in all three NIC injury groups werehighly variable but group performance recovered to slip ratiosintermediate between that of Crushs and Transections groups.The MNs group differed significantly from Transections andNegative Controls groups at week 6 and from Transections atweek 12 (p<.05). Slip ratios of the MN+50gs group wassignificantly different from Transections at week 12 (p<.05).The (MN+50g)x2s group differed with statistical significancefrom Negative Controls at weeks 10 and 12 (p<.05; p<.01),and from Transections at week 12 (p<.001). At the final 12-week assessment, there was still no statistically significant
difference between slip ratios of the Negative Controls andTransections groups (Table 2).
Behavioral outcomes correlated well with axonalregeneration and misdirection
We successfully bridged the gap between minimal (crush)and extreme (transection) injuries with intermediate andvariable NIC injuries. This made us more confident to assessthe linear correlations between final functional outcome andretrograde labeling. There was a clear linear correlationbetween the individual animal paired 12-week slip ratios andaverage misdirection data (r(33)=.82, p <.0001) with r2=.67(Figure 7B). Individual animal 12-week slip ratios also showeda strong negative correlation with the total number of motorneurons projecting into the major motor nerve (MG) sampled(r(39)=-0.83, p<.0001) with r2=.69. The combined effect ofthese two factors (both dependent on injury severity) shouldyield a better correlation with functional outcome. Indeed, thefinal functional deficit correlates better with the misdirection/regeneration quotient (MRQ) (= Average misdirection (%)/ MGmotor neurons (n); r2=.76), which combines the relativecontribution of both these factors (Figure 7C).
Discussion
Revisiting nerve injury classificationBased on our findings, we propose that the spectrum of
chronic functional deficit between axonotmetic and neurotmeticinjuries is strongly related to the degree of disruption of theintrafascicular architecture (Figure 8). This may be focal orcumulate over a distance, depending on the injury mechanism,and lead to proportional axonal attrition and misdirection asmajor determinants of functional recovery. The originalcomposition of the nerve and associated axotomy anddenervation effects related to the location of the injury furthercompounds to limit functional recovery [20–22]. Although lossof perineurial integrity (according to the Sunderlandclassification) may be associated with more severe injuries,disruption of this layer per se has not been confirmed to be astrong independent determinant of functional recovery followingperipheral nerve injuries. For this reason we prefer to groupSunderland Grade 3 and 4 injuries together in the spectrum of
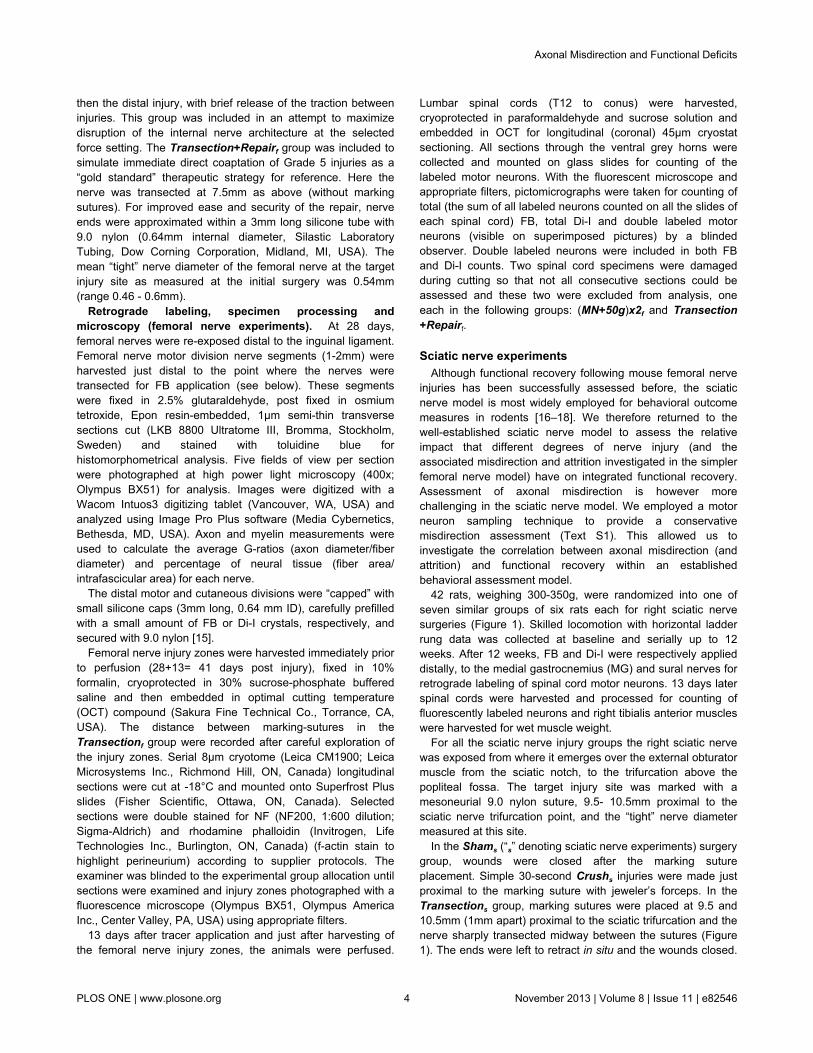
Table 2. Sciatic nerve experiment muscle weight, retrograde labeling and final functional results.
PLOS ONE | www.plosone.org 11 November 2013 | Volume 8 | Issue 11 | e82546
Figure 6. Sciatic experiment muscle weight and motor neuron labeling results. Tibialis anterior muscle weights demonstratedno significant differences between the NIC groups or from Crushs and Shams groups. Transections and Negative Controls groupsshowed statistically significant differences from other groups (A) (n=6 per group). Statistically significant attrition of motor neuronswith axons that regenerated into the MG nerve was demonstrated in the Transections group, compared to Shams and Crushs groups(B) (n=6 per group). Relative percentage of axonal misdirection to the MG and sural nerves were calculated by dividing the countedcells “out”-side the reference boundaries by the “total” counts (e.g. %misdirection to sural = Di-I-out/Di-I-total x100). Transections
(n=5) injuries demonstrated the most misdirection and the same trend was found among the NIC injury groups with MG and suralnerve assessments. Average of MG and sural results shown (C) (n=6 per other groups). (*p<0.05,**p<0.001).doi: 10.1371/journal.pone.0082546.g006
Axonal Misdirection and Functional Deficits
PLOS ONE | www.plosone.org 12 November 2013 | Volume 8 | Issue 11 | e82546
Figure 7. Behavioral results and correlations with axonal misdirection and attrition. In sciatic nerve groups, skilledlocomotion was assessed with the ladder-rung task by determining injured limb slip ratios up to 12 weeks. The Crushs grouprecovered to baseline, but the Transections and Negative Controls groups showed no significant recovery. Despite variable deficitsranging from minimal to extreme in the NIC injury groups, the MNs and (MN+50g)x2s groups still demonstrated statisticallysignificant differences from Crushs at 12 weeks (A) (n=6 per group). More significant than the group results, were the goodcorrelation between individual animal final functional outcomes and the average percentage of misdirection (r2= 0.67) and FBlabeled motor neuron count (attrition of motor neurons with axons to MG nerve) (r2= 0.69) respectively (B). A better correlation wasfound between the final functional deficit and the misdirection/regeneration quotient (MRQ = Average misdirection (%)/ MG motorneurons (n); r2=.76), which combines the relative contribution of both these factors (C).doi: 10.1371/journal.pone.0082546.g007
Axonal Misdirection and Functional Deficits
PLOS ONE | www.plosone.org 13 November 2013 | Volume 8 | Issue 11 | e82546
NIC injuries. This spectrum will also accommodate theSunderland mixed and Mackinnon grade 6 injuries in continuity,and given this our experimental model has considerable clinicalrelevance [6,23]. For an excellent review on the potentialmechanisms behind axonal misdirection, we refer the reader toa paper by Allodi et al [29].
Experimental NIC injuries remain elusiveDespite the employment of three injury paradigms, the
recreation of NIC injuries with uniform functional deficitsremains challenging. There are apparently additionaluncontrolled factors that affect the injury severity, as minorinfluences may have a dramatic effect at the steep part of thecurve (Figure 8). This significantly mimics what is seenclinically, where we are still unable to determine the degree ofnerve injury (in-continuity injuries beyond axotomy) withoutintentional deferral for 3-6 months, to await signs ofregeneration. For lack of superior alternatives, this approach isstill the standard of practice, despite the recognized detrimentaleffects of prolonged axotomy and deneravation [20–22].
The addition of traction to the compression force is notessential to recreate experimental NIC injuries. Force settingswere selected based on the data available at the time toestimate the “NIC window” between crush and transection withcompression force application (Text S1). This “NIC window”was estimated based only on the influence of nerve size oninjury thresholds. We have since determined that (notsurprisingly) nerve size is not the only determinant of the injurythresholds (Figure S3). With the double injuries ((MN
Figure 8. The applied force to severity of nerve injuryrelationship demonstrating the NIC spectrum and NICwindow. Based on the data presented, we propose that thedegree of functional deficit that follows traumatic peripheralnerve injuries is dependent on the disruption of the internalnerve architecture of a particular nerve. Sunderland grade 3and 4 injuries are replaced by the NIC spectrum. Minorvariations of force on the hypothetical steep slope within theNIC window may have a dramatic effect on the injury severityand resultant functional recovery.doi: 10.1371/journal.pone.0082546.g008
+50g)x2)f), we have shown that this NIC model is capable ofexerting a potential range of injury severity, resulting in attritionand misdirection similar to that of Sunderland Grade 5 injuriesin the femoral nerve experiments. We were however unable toreplicate the distinction between the outcome of the NIC injuryparadigms seen in the femoral nerve experiments, in the sciaticnerves. In fact, the double sciatic injury group ((MN+50g)x2s)appear to have performed better than the other two NICgroups. This supports the notion that there are additionaluncontrolled intrinsic differences between these nerves.Nevertheless, the variability of the injuries made it possible toassess correlations with more confidence.
The rats in the Transectionf group successfully regeneratedtransected femoral nerve fibers across an average distance of3.45mm without any form of repair and performed similar to theTransection+Repairf group in most aspects. This emphasizesthe resilience of these animals, compared to humans, in whichlittle if any spontaneous distal reinnervation is expected withoutsome form of repair [6,7]. However, only a relatively small gapneeded to be bridged. Intersestingly, the only advantage thatthe Transection+Repairf group showed above Transectionf inthis study was a significant decrease in axonal misdirection,which correlated strongly with functional recovery in the secondpart of this study. We therefore speculate that additionalfunctional outcome measures for the femoral nerveexperiments would likely have demonstrated some additionalbenefit in the Transection+Repairf over the Transectionf
group.
Assessment of axonal misdirection can be challengingOur neuron counts (not corrected for double counting)
compare well to other published reports, although they aremainly intended for inter-group comparison, not to reflect theabsolute numbers [24,25]. For both femoral and sciaticexperiments, the labeling results are presented as the relativeproportions of motor neurons with incorrectly directed axons.Some motor division projections may still be along sensory(e.g. proprioceptive) pathways and technically also incorrect.Therefore, in the femoral nerve experiments, all the FB-labeledmotor neurons cannot be assumed to have correctly directedaxons, but the Di-I labeled neurons certainly have misdirectedprojections. Similarly, many of the “in” counts of the sciaticexperiments may represent motor neurons of overlapping(foreign) pools.
Misdirection onto the sural nerve was more apparent than inthe MG sample. This may be because the sural nerve motorneuron pool rostral boundary is more caudal in the sciatic pool,which would increase the likelihood of detecting motor neuronswith axons misdirected into this nerve with the methods used.The sural nerve is also primarily a sensory nerve with smallerproportion of motor axons compared to the MG nerve [26]. Ifinitial regeneration is random, a comparatively greaterproportion of motor axons may be directed into this nerve, withless apparent attrition [27]. As we used the sural and MGnerves as convenient samples to assess relative misdirection,and because the results of the two showed the same trend, weused the average results of the two samples for furthercorrelations. Similar to the femoral nerve experiments, we
Axonal Misdirection and Functional Deficits
PLOS ONE | www.plosone.org 14 November 2013 | Volume 8 | Issue 11 | e82546
regarded the attrition of motor neurons with projections into themajor motor (MG) nerve assessed, to give the bestrepresentation of the fate of efferent axons in the sciaticexperiments.
Functional deficit and correlationsA recovery period of 4 weeks has been shown to be
sufficient to assess misdirection in the femoral nerve model[25]. A period of 12 weeks was allowed in the sciatic nerveexperiments to ensure that functional recovery has plateaued[14,28]. We only used one functional outcome measure, as theladder rung task is a sensitive test that provides reliable resultsin our hands. Others have confirmed that it is one of severalskilled locomotion tasks that provide excellent resolution ofintegrated motor and sensory recovery of hind limb functionfollowing sciatic nerve injuries [18]. However, confirmation ofour results with additional outcome measures is needed tosupport our findings. Interestingly, the Transections groupshowed no functional recovery with the measure we used,concordant with the Sunderland classification, despitesignificant recovery of muscle mass after spontaneous bridgingof an average 8.8mm gap in five of six animals. Thisemphasizes the detrimental effect of axonal misdirection onfunctional recovery in mixed motor nerve injuries, despitesuccessful muscle reinnervation.
Brushart comprehensively reviewed the literature forexperimental outcome measures that correlate with measuresof functional recovery and found the evidence for directcorrelation lacking [4]. Wikholm et al. provided data to suggesta good correlation between the degree of axonal misdirectionand functional recovery (Sciatic Functional Index) followingrepair of experimental sciatic nerve injuries, although such acorrelation was not presented in their paper [28]. After commonperoneal nerve transection and repair, Wasserschaffdemonstrated good correlation between disturbance of thetibialis anterior pool topography, cell count and incoordinationbetween tibialis anterior and MG EMG activity in walking mice[30]. Direct functional analysis was not performed in that study.Valero-Cabré and Navarro have demonstrated similarcorrelations between surrogate misdirection estimations (byCMAP amplitude) with walking track outcomes by using sciaticnerve transection injuries with different repair strategies [8].The results used in these correlations for the most part, do notbridge the gap between minimal and maximal deficits [4]. Thechoice of functional outcome measures may also be critical, ascomplex compensatory behavioral changes may mask theeffect of axonal misdirection [31,32].
To our knowledge, this is the first time more direct motoraxon misdirection and attrition estimations were correlated tofunctional outcome after clinically relevant experimentalperipheral nerve injuries that includes the neuroma-in-continuity injury spectrum. This work emphasizes the need tocontinue to focus on strategies that promote both robust andaccurate nerve regeneration to optimize functional recovery
and we anticipate that this NIC model will prove to be of valueto more investigators striving to remedy peripheral nerveinjuries.
Supporting Information
Figure S1. Instrument modification and calibration.Modified malleus nipper (MN): An adjustable stop was added tothe handles of the MN for force adjustment and tip serrationswere filed down for uniform force distribution (A). The MN wascalibrated with a load cell to estimate the force for eachinstrument setting (B). The uneven and incomplete cut (arrows)of an unmodified MN on parafilm (C). The clean parafilm cut ofthe modified MN (D).(TIF)
Figure S2. Early signs of NIC in femoral nerve. Alongitudinal section of a femoral nerve injury zone 5 days afterMN+50g injury with NF 200 in green to demonstrate the axonalprofiles and Rhodamine Phalloidin that highlights the f-actin inyellow to help define the perineurium (white arrows) and smallbloodvessels (bold white arrows) (A). Magnification of the boxin A for more detail of the neurofilament stained axons (B).Regenerating axons in the interfascicular and extrafascicularcompartments are pointed out with red arrows in correspondingareas in A, B, C and D (C and D at higher magnification fromboxes in B). 250µm scale bar.(TIF)
Figure S3. Transection thresholds and predicted NICwindows. Average transection threshold pressure variessignificantly depending on the target nerve (A). The predictedNIC windows between the upper crush and lower transectionthresholds (shaded green) for the femoral (B) and sciatic (C)nerves were estimated with the available data. A single forcesetting was selected for the MN to cover the size range of thefemoral or sciatic nerves (fem: femoral; CP: commonperoneal).(TIF)
Text S1. Additional findings are reported here to supportthe methods employed and aid other investigators whomay want to employ this model.(DOC)
Author Contributions
Conceived and designed the experiments: JA AI RM.Performed the experiments: JA AI AS. Analyzed the data: JAFS AI JF RM. Contributed reagents/materials/analysis tools: JARM. Wrote the manuscript: JA. Revised the article critically forimportant intellectual content: JA FS AI JF AS RM.
Axonal Misdirection and Functional Deficits
PLOS ONE | www.plosone.org 15 November 2013 | Volume 8 | Issue 11 | e82546
References
1. Brushart TM, Tarlov EC, Mesulam MM (1983) Specificity of musclereinnervation after epineurial and individual fascicular suture of the ratsciatic nerve. J Hand Surg Am 8: 248-253. doi:10.1016/S0363-5023(83)80152-X. PubMed: 6348148.
2. Madison RD, Robinson GA, Chadaram SR (2007) The specificity ofmotor neurone regeneration (preferential reinnervation). Acta Physiol(Oxf) 189: 201-206. doi:10.1111/j.1748-1716.2006.01657.x. PubMed:17250570.
3. Valls-Sole J, Castillo CD, Casanova-Molla J, Costa J (2011) Clinicalconsequences of reinnervation disorders after focal peripheral nervelesions. Clin Neurophysiol 122: 219-228. doi:10.1016/j.clinph.2010.06.024. PubMed: 20656551.
4. Brushart TM (2011) Outcomes of experimental nerve repair andgrafting. In: Nerve repair. New York: Oxford University Press. pp.159-195.
5. Seddon HJ (1943) Three types of nerve injury. Brain 66: 237-288. doi:10.1093/brain/66.4.237.
6. Sunderland S (1951) A classification of peripheral nerve injuriesproducing loss of function. Brain 74: 491-516. doi:10.1093/brain/74.4.491. PubMed: 14895767.
7. Tada K, Ohshita S, Yonenobu K, Ono K, Satoh K et al. (1979)Experimental study of spinal nerve repair after plexus brachialis injuryin newborn rats: A horseradish peroxidase study. Exp Neurol 65:301-314. doi:10.1016/0014-4886(79)90100-6. PubMed: 477790.
8. Valero-Cabré A, Navarro X (2002) Functional impact of axonalmisdirection after peripheral nerve injuries followed by graft or tuberepair. J Neurotrauma 18: 1475-1485.
9. Alant JD, Kemp SW, Khu KJ, Kumar R, Webb AA et al. (2002)Traumatic Neuroma in Continuity Injury Model in Rodents. JNeurotrauma 29: 1691-1703.
10. Brushart TME (1988) Preferential reinnervation of motor nerves byregenerating motor axons. J Neurosci 8: 1026-1031. PubMed:3346713.
11. Brushart TM (2011) Determining experimental outcome. In: Nerverepair. New York: Oxford University Press. pp. 135-158.
12. Bridge PM, Ball DJ, Mackinnon SE, Nakao Y, Brandt K et al. (1994)Nerve crush injuries - a model for axonotmesis. Exp Neurol 127:284-290. doi:10.1006/exnr.1994.1104. PubMed: 8033968.
13. Spencer PS (1974) The traumatic neuroma and proximal stump. BullHosp Joint Dis 35: 85-102. PubMed: 4441727.
14. de Ruiter GCW, Malessy MJA, Alaid AO, Spinner RJ, Engelstad JK etal. (2008) Misdirection of regenerating motor axons after nerve injuryand repair in the rat sciatic nerve model. Exp Neurol 211: 339–350. doi:10.1016/j.expneurol.2007.12.023. PubMed: 18448099.
15. Kemp SW, Alant J, Walsh SK, Webb AA, Midha R (2010) Behaviouraland anatomical analysis of selective tibial nerve branch transfer to thedeep peroneal nerve in the rat. Eur J Neurosci 31: 1074-1090. doi:10.1111/j.1460-9568.2010.07130.x. PubMed: 20377620.
16. Irintchev A, Simova O, Eberhardt KA, Morellini F, Schachner M (2005)Impacts of lesion severity and tyrosine kinase receptor B deficiency onfunctional outcome of femoral nerve injury assessed by a novel single-
17. Tos P, Ronchi G, Papalia I, Sallen V, Legagneux J et al. (2009)methods and protocols in peripheral nerve regeneration experimentalresearch: part 1-experimental models chapter 4. Int Rev Neurobiol 87:47-79 doi:10.1016/S0074-7742(09)87004-9. PubMed: 19682633.
18. Wood MD, Kemp SWP, Weber C, Borschel GH, Gordon T (2011)Outcome measures of peripheral nerve regeneration. Ann Anat 193:321-333. doi:10.1016/j.aanat.2011.04.008. PubMed: 21640570.
19. Metz GA, Whishaw IQ (2002) Cortical and subcortical lesions impairskilled walking in the ladder rung walking test: a new task to evaluatefore- and hindlimb stepping, placing, and co-ordination. J NeurosciMethods 115: 169-179. doi:10.1016/S0165-0270(02)00012-2. PubMed:11992668.
20. Fu SY, Gordon T (1995) Contributing factors to poor functionalrecovery after delayed nerve repair: prolonged axotomy. J Neurosci 15:3876-3885. PubMed: 7751952.
21. Fu SY, Gordon T (1995) Contributing factors to poor functionalrecovery after delayed nerve repair: prolonged denervation. J Neurosci15: 3886-3895. PubMed: 7751953.
22. Furey MJ, Midha R, Xu QG, Belkas J, Gordon T (2007) Prolongedtarget deprivation reduces the capacity of injured motoneurons toregenerate. Neurosurgery 60: 723-732. PubMed: 17415210.
23. Mackinnon SE (1989) New directions in peripheral nerve surgery. AnnPlast Surg 22: 257-273. doi:10.1097/00000637-198903000-00013.PubMed: 2660716.
24. Swett JE, Wikholm RP, Blanks RHI, Swett AL, Conley LC (1986)Motoneurons of the rat sciatic nerve. Exp Neurol 93: 227-252. doi:10.1016/0014-4886(86)90161-5. PubMed: 3732460.
25. Madison RD, Archibald SJ, Brushart TM (1996) Reinnervation accuracyof the rat femoral nerve by motor and sensory neurons. J Neurosci 16:5698-5703. PubMed: 8795625.
26. Schmalbruch H (1986) Fiber composition of the rat sciatic nerve. AnatRec 215: 71-81. doi:10.1002/ar.1092150111. PubMed: 3706794.
27. Brushart TM (2011) Specificity in nerve regeneration. In: Nerve repair.New York: Oxford University Press. pp. 353-373.
28. Wikholm RP, Swett JE, Torigoe Y, Blanks R (1988) Repair of severedperipheral nerve: A superior anatomic functional recovery with a new“reconnection”. Technique - Otolaryngol Head Neck Surg 99: 353-361.
29. Allodi I, Udina E, Navarro X (2012) Specificity of peripheral nerveregeneration: Interactions at the axon level. Prog Neurobiol 98: 16-37.doi:10.1016/j.pneurobio.2012.05.005. PubMed: 22609046.
30. Wasserschaff M (1990) Coordination of reinnervated muscle andreorganization of spinal cord motoneurons after nerve transection inmice. Brain Res 515: 241-246. doi:10.1016/0006-8993(90)90602-8.PubMed: 2357563.
31. Hamilton SK, Hinkle ML, Nicolini J, Rambo LN, Rexwinkle AM et al.(2011) Misdirection of Regenerating Axons and Functional RecoveryFollowing Sciatic Nerve Injury in Rats. J Comp Neurol 519: 21-33. doi:10.1002/cne.22446. PubMed: 21120925.
32. Sabatier MJ, To BN, Nicolini J, English AW (2011) Effect of AxonMisdirection on Recovery of Electromyographic Activity and Kinematicsafter Peripheral Nerve. Injury - Cells Tissues Organs 193: 298-309. doi:10.1159/000323677.
Axonal Misdirection and Functional Deficits
PLOS ONE | www.plosone.org 16 November 2013 | Volume 8 | Issue 11 | e82546