THE IMPACT OF MULTINATIONAL BANKS ON DEVELOPMENT FINANCE Christian E. Weller Center for European Integration Studies University of Bonn Walter-Flex-Str.3 53111 Bonn GERMANY E-mail: [email protected]and Mark J. Scher Department of Social and Economic Affairs United Nations Two United Nations Plaza New York NY 10017 Abstract Financial market recommendations for less industrialized economies, particularly in the wake of the recent financial crises, have included a push for more international financial competition. The entry of multinational banks (MNBs) into developing economies is supposed to create more market discipline for domestic banks, thus making them more efficient, and enhancing financial stability. Using data from the BIS and the IMF, we look at the impact of MNBs on credit supply and on financial stability in less industrialized economies. MNBs focus their activities predominantly on serving MNCs, and on providing services that domestic banks cannot offer to domestic corporations, and high net worth individual. This increased competition in certain low risk market segments entices domestic banks to lower their credit exposure in the early stages of international financial competition. However, as MNBs continue to operate and to grow their market shares in less industrialized economies, domestic banks become more confident with the new competitive situation, eventually increasing their loans, especially to the enterprise sector. Both consequences of increased international financial competition - early credit crunches, and later credit growth - can have real implications in the form of lowered business investment or financial instabilities, unless adequate regulatory and supervisory structures are installed. Acknowledgements We are grateful to the participants of the Expert Group Meeting on Development and the Financial Sector: Effectiveness, Equity and Vulnerability at the U.N., and of the Research Seminar at the Center for European Integration Studies for stimulating and inspiring discussions of earlier drafts. We are particularly indebted to Adrian Tschoegl, Ken Kletzer, Barry Hermann, Rob Scott, and Robert MacCulloch for their helpful comments and suggestions on earlier versions
Transcript
THE IMPACT OF MULTINATIONAL BANKS ON DEVELOPMENT FINANCE
Christian E. WellerCenter for European Integration Studies
Mark J. ScherDepartment of Social and Economic Affairs
United NationsTwo United Nations Plaza
New York NY 10017
Abstract
Financial market recommendations for less industrialized economies, particularly in the wake ofthe recent financial crises, have included a push for more international financial competition. Theentry of multinational banks (MNBs) into developing economies is supposed to create moremarket discipline for domestic banks, thus making them more efficient, and enhancing financialstability. Using data from the BIS and the IMF, we look at the impact of MNBs on creditsupply and on financial stability in less industrialized economies. MNBs focus their activitiespredominantly on serving MNCs, and on providing services that domestic banks cannot offer todomestic corporations, and high net worth individual. This increased competition in certain lowrisk market segments entices domestic banks to lower their credit exposure in the early stages ofinternational financial competition. However, as MNBs continue to operate and to grow theirmarket shares in less industrialized economies, domestic banks become more confident with thenew competitive situation, eventually increasing their loans, especially to the enterprise sector.Both consequences of increased international financial competition - early credit crunches, andlater credit growth - can have real implications in the form of lowered business investment orfinancial instabilities, unless adequate regulatory and supervisory structures are installed.
AcknowledgementsWe are grateful to the participants of the Expert Group Meeting on Development and theFinancial Sector: Effectiveness, Equity and Vulnerability at the U.N., and of the ResearchSeminar at the Center for European Integration Studies for stimulating and inspiring discussionsof earlier drafts. We are particularly indebted to Adrian Tschoegl, Ken Kletzer, Barry Hermann,Rob Scott, and Robert MacCulloch for their helpful comments and suggestions on earlier versions
of this paper. All remaining errors are our sole responsibility.
2
I. Introduction
Financial policy recommendations for developing economies, particularly in the wake of
the recent financial crises, have included a push for more international financial competition. By
the end of the 1997, one of the most comprehensive agreements on trade in financial services,
which covers multinational banks (MNBs), the General Agreement on Trade in Services (GATS)
has been negotiated at the WTO. Consequently, while both international and multinational
banking have grown in recent decades, banks in industrialized economies have increasingly
emphasized lending within over cross-border lending to less industrialized economies. By mid-
1998, banks in BIS member countries lent a total of $850 billion abroad, whereas loans of their
branches and subsidiaries amounted to $242 billion. Not surprising, then, MNB activities in less
industrialized economies have grown on average by double or even triple digit rates in all areas of
the world since the mid-1980's, leading to a sizable market share for MNBs such as a share close
to 20% of banking market assets in Chile and Argentina.
The impact of MNBs on credit supply and financial stability in less industrialized
economies is contested. Proponents of more financial competition assert that MNB entry
increases market discipline, the efficiency of domestic banks, and thereby financial
intermediation, and the supply of credit (Fry, 1995; BIS, 1988). Greater efficiency in loan
allocation should stabilize the banking system as banks become better at evaluating borrowers.
Others, however, argue that a growing MNB presence may indeed induce domestic banks to lend
more, but for riskier projects as they become less prudent in their activities under mounting
competitive pressures (Demirgüc-Kunt and Detragiache, 1998). In this view, expanding loan
3
exposure of domestic banks leading to greater financial instabilities ensue from more speculative
financing in the wake of greater international financial competition. Thirdly, the opposite
argument, namely that domestic banks tend to lend less if they are facing more international
competition as one would expect with an Ainfant industry@, has also been put forth (Weller,
1999c). By virtue of a reduced credit exposure, banks in less industrialized economies should
become more stable as the most stable banks are the ones that do not lend.
With international agreements, such as GATS, in place to pave the way for even greater
MNB presence in less industrialized economies, understanding their exact impact on credit
supply and financial stability is obviously not only an academic undertaking. Should the impact
of international financial competition be to raise the amount of credit by making domestic banks
more efficient, more international barriers to the movement of MNBs should fall. However, if the
impact of international financial competition is to reduce the amount of credit available for
investments, or to increase the amount for speculative financing, policymakers might want to
proceed cautiously with further reductions in capital movements.
To understand the impact of a growing MNB presence on less industrialized economies,
we provide first some background on MNBs, on the determinants of MNB presence, and on
their activities in section II. Then, we continue by discussing the effects of MNB presence on
credit supply and financial stability in section III. Finally, a few concluding remarks follow in
section IV.
II. Background
II.1 The Recent Growth of MNBs
4
MNBs are understood here as banks, which establish operations in more than one
country. Hence, MNBs are also sometimes referred to as foreign banks or are comprised in the
general category of foreign direct investment (FDI) in financial services. In contrast, international
banks are banks, which operate across international borders, but which do not establish a
physical presence in other countries. MNB operations can come in different forms, namely as
branch offices, as subsidiaries, as joint ventures, or as strategic partnerships. Branch offices, for
instance, are an integral part of the mother company, that is, they have no capital of their own.
Subsidiaries, however, are their own corporate entities, which are fully owned by the mother
company, but chartered in the host economy. Similarly, joint ventures are separate corporate
entities owned jointly by more than one mother company. For instance, Dresdner Bank and
Banque National de Paris have been establishing a number of joint ventures in emerging
economies over the past few years. Finally, MNBs may establish a strategic partnership by
buying a majority stake of an already existing domestic bank. The main difference between the
various operational forms of MNBs is their regulatory treatment, as banks, which are domestic
corporate entities may receive a different treatment than banks which are not, similar to banks
which are majority foreign owned compared to banks, which have only a minority foreign
ownership share.
Most research on MNBs are hampered by their limited scope as they tend not to include
more than two or three countries, and are mainly focused on the US, Japan or other Asian
economies. So far, consistent data across countries has been lacking which would allow for a
comparison of MNB presence. The BIS= Consolidated International Banking Statistics is
5
therefore an improvement as it includes semi-annual data on international as well as multinational
bank developments for a total of 184 countries and territories from 1985 to the present1. What is,
however, gained in compatibility across countries has to be traded off against the drawback that
the BIS provides only aggregated data for each economy without distinguishing by originating
economies. Similarly, the data does not allow a distinction between the aforementioned different
forms of MNB operations. Thus, while our study offers a comprehensive view of a large sample
of emerging economies, its scope in investigating the determinants of MNB presence or its
impact on host economies is limited by the aggregated nature of the data.
Figures compiled from the BIS= Consolidated International Banking Statistics highlight
the growth in MNBs (table 1). By the end of 1998, 107 of 167 emerging economies and
territories reported MNB operations. The largest recipient of MNB credit is Latin America.
Further, while Asia has experienced a steady continuous growth of MNB loans between 1985 to
1997, this trend holds for the Middle East and Africa only for the 1990's2. Their growth rates
pale, though, compared to those in Latin America and in Eastern Europe (table 2). Not only has
MNB credit grown rapidly, it is also expanding faster than MNB deposit taking, thereby making
MNBs mostly net importers of capital (table 1).
By the end of 1998, international loans to less industrialized countries amounted to $706
billion, while MNB loans totaled about one third of that with $239 billion, with MNBs closing in
(table 2). While MNB loans have grown faster than international bank credit in all areas, MNB
1Developed economies and offshore banking centers are not included.
2MNB loans and deposits from the BIS exclude foreign currency loans. Thus, where foreign
6
loans still remain small on average, below 10% in Eastern Europe and the Middle East, below
20% in Asia and Africa, and at around 22% in Latin America. The ratio of MNB credit to
international bank credit is highest in Latin America with $143 billion in MNB credit to $288
billion in international bank loans by the end of 1998. In contrast, in the Middle East there are
only $ 8 billion in MNB loans and $63 billion in international bank credit.
currency loans are allowe, the loan figures are understating the actual size of MNB operations.
II.2 The Determinants of MNB Presence
7
While the numbers reveal a growing interest of MNBs in less industrialized economies,
the question remains as to whether the recent growth in MNB operations can be attributed to
some of the same factors found in earlier studies3. Most earlier research is based upon an
application of the theory of multinational corporations (MNCs) to banking (Dunning, 1979;
Gray and Gray, 1980). Based on this framework, which allows for the inclusion of economic
factors beyond the firm specifics, earlier research has found a number of motivational factors for
the entry of MNBs. Among these determining factors some host economy characteristics have
been found to be significant, such as current account balances (Terrell, 1979; Goldberg and
1999), the presence of other MNBs (Ball and Tschoegl, 1982; Engwall and Wallenstäl, 1988;
Jacobsen and Tschoegl, 1998; Guillen and Tschoegl, 1999), real economic growth (Sabi, 1988,
1994), or country risk (Sabi 1988, 1994). Similarly, some characteristics of the originating
economy seem to matter for MNBs to expand operations abroad, such as the market size of the
originating economy (Terrell, 1979; Khoury, 1979), or saturated home markets (Guillen and
Tschoegl, 1999). Finally, firm level characteristics appear to play a significant role, too, such as
an MNB=s knowledge of international operations and of the host economy (Ball and Tschoegl,
3 Multilateral agreements, such as GATS, have made it easier for MNBs to move abroad. Agreater ability to internationalize operations, however, should not be conflated with a greater
8
1982; Ursacki and Vertinsky, 1992), or its reserve ratio (Terrell, 1979; Goldberg and Saunders,
1981).
Using a similar data as ours, Weller and Scher (1999) have analyzed the determinants of
MNB presence. Their results show that host country characteristics, such as real per capita GDP
growth, population, size of the banking sector or current account balances are not significant in
determining MNB presence, but that lower asset prices, a ready market and competition with
other MNBs may matter more than economic fundamentals in attracting MNBs.
II.3 Activities of MNBs
The activities MNBs engage in, follow from some of the determinants of their presence.
Generally, MNB activities are more limited in their scope than the activities of local banks, and
they tend to remain more restricted. In the early stages of MNB operations in a host economy,
their operations are limited by a few factors, such as small capital base, insufficient physical and
human capital, and unfamiliarity with the host economy. Over time, all these hurdles may be
overcome, but in most cases, this leads MNBs to only expand in market segments, where they
are already active, with the possible exception of strategic partnerships.
willingness of MNBs to do so, as this depends on economic factors as well as regulatory aspects.
The market segments served by MNBs are areas where MNBs have a clear competitive
advantage. One of the main reasons for MNBs to enter a new economy is to provide services to
MNCs which are already their customers in other parts of the world. Further, MNBs provide
services that other banks are either less familiar with or that they cannot provide. Such services
include foreign currency loans, acceptances and guarantees related to international trade, or
9
syndicated loans (Brainard, 1990; Euh and Baker, 1990). Due to the nature of these services, large
domestic corporations become MNB clients, whereas SMEs are less likely to require these
services. Finally, MNBs offer their services to high net worth individuals to attract new deposits
and to provide consumer finances. Such retail banking services include brokerage services, savings
products, mortgages, credit cards or consumer loans (Brainard, 1990).
The evidence suggests that in most cases, MNBs have rarely expanded their activities
beyond these market segments. For instance, when competition in traditional MNB market
segments increased in Korea in the 1980's, some MNBs shut down their operations, while others
expanded their activities where competition were not as fierce, in this case services to high net
worth individuals, customized financing packages for corporate clients, or foreign currency loans
(Brainard, 1990; Euh and Baker, 1990).
Market segments which have so far been largely ignored by MNBs are only getting a
second look lately, and then only thanks to the fact that MNBs have increasingly obtained
minority or majority market shares of domestic banks. For instance, since 1995 Banco Santander
SA, Banco Bilbao Vizcaya SA, and Banco Central Hispano have bought large shares of almost 30
large banks in more than ten countries in Latin America, predominantly in order to offer banking
services to formerly underbanked markets, such as SMEs and lower income individuals (WSJ,
September 10, 1997; Guillen and Tschoegl, 1999).
The evidence on MNB activities confirms some of the findings on the determinants of
MNB presence. In particular, MNBs appear to serve mainly three market segments, namely
MNCs, large domestic corporations and high net worth individuals, thus supporting the finding
10
that FDI flows are a significant determinant for MNB presence. The evidence further suggests
that MNBs occasionally expand their activities beyond these three market segments, particularly
if they obtain minority or majority shares in domestic banks.
III. Multinational Banks, Finance Constraints and Financial Stability
What is the impact of MNB entry and MNB operations on the domestic economy in less
industrialized countries? In the previous section, we found that MNBs focus their activities on
three market segments, which raises the question whether this concentration of MNBs has any
effect on the behavior of domestic banks? Does it force them to become more efficient to
compete with MNBs? Or does it leave them with less premium clients, and therefore more
exposed to default risk? How does this impact the supply of credit and financial stability?
Based on the financial liberalization (FL) framework, it is often recommended that more
foreign entrants will enhance the efficiency of domestic banks. In McKinnon=s (1973) and
Shaw=s (1973) discussion to address the apparent excess demand for credit in less industrialized
economies, a number of measures to deregulate financial markets are proposed, among them the
elimination of market entry restrictions. MNB entry is particularly welcome, since it supposedly
introduces market discipline, and imports foreign expertise, banking know-how and bank capital.
However, the standard FL view of international competition ignores the crucial value of
information for financial firms. If borrowers and lenders do not have perfect information about
each other, borrowers cannot obtain the necessary amount of finance for their investments
(Stiglitz and Weiss, 1982; Gertler, 1988; Bernanke 1993). With respect to the effect of
international financial competition on banks, a number of different outcomes are now possible
11
that can effect the supply of credit, and possibly the stability of the domestic banking system.
The effect of a greater MNB presence on domestic banks= credit supply depends on a
bank's net worth. If a bank's net worth stays above a safety threshold the bank will not increase
its loans unless its net worth grows, but once its net worth falls below that safety threshold the
bank will increase its loans, particularly for high risk high projects, as it stands to lose little or
nothing. The dilemma, though, is that financial competition further limits banks= ability to raise
their net worth, and hence they may restrict their loans if their net worth is above their safety
threshold.
In liberalizing economies, domestic banks are newcomers to an unregulated market
environment, and hence should be seen as an infant banking industry with large capital needs.
New capital is necessary to compete, especially with MNBs, whereas the presence of MNBs
limits the options to raise new capital. Specifically, more competition lowers interest rate
spreads and retained earnings, and thus the most important source for new capital. In one of the
most comprehensive study on the profitability of domestic banks and MNBs the authors find
that @an increase in the share of foreign banks leads to a lower profitability of domestic banks@
(Claessens, Demirgüc-Kunt, and Huizinga, 1998). Thus, earlier findings by Terrell (1986) are
supported, who found that banks in economies, which allow MNB entry, have lower gross
interest margins, lower pre-tax profits, and lower operating costs. This limits the ability of
domestic banks to raise their capital as other sources, such as public capital injections or equity
issues are not readily available.
When faced with more competition and less access to capital, domestic banks may reduce
12
their lending as long as their net worth remains above their safety threshold. Without a reduction
in lending, greater competition and less access to capital should rise the chance of bank failure.
This risk can be contained by emphasizing less risky loans over riskier ones, or by reducing
lending overall. Credit to MNCs, for instance, or to large domestic corporations, is clearly less
risky than to others, such as to rural producers, to small and medium-sized enterprises (SMEs),
or to start-up companies. However, MNBs possess already a competitive advantage in serving
less risky market segments, such as MNCs, due to their reputation or their international
orientation. By virtue of their competitive disadvantages, domestic banks are then left more
exposed to riskier market segments than without international competition. Consequently, few
alternatives remain for sufficiently capitalized domestic banks to reduce their risk than to reduce
their loans.
Credit decreases in connection with more international competition have been observed in
Korea (Euh and Baker, 1990), or Poland (Weller, 1999c). In particular, the fear that some sectors
are more affected than others led Korean policy makers to require that MNBs lend 35% of their
loans to SMEs (Euh and Baker, 1990). Similar lending requirements have not been introduced in
Hungary where the majority of the country=s banks are foreign owned, real credit has declined
by 35% from 1989 to 1994, and the financial constraints of some Hungarian borrowers are a
growing concern (Anderson and Kegels, 1998; Abel, Szekely and Siklos, 1998). Finally, the case
of Poland is the only one for which MNB presence has been linked to credit supply (Weller,
1999). It is found that both newly created and privatized Polish banks reduce their loans in
response to a growing MNB presence, thereby also lowering total credit in Poland.
13
With a decline of enterprise credit by domestic banks in the face of greater MNB
presence, it is noteworthy that less loans by domestic banks only result in an overall credit
decline if MNBs are not compensating for this decrease. MNBs focus their activities on serving
MNC clients, large domestic corporations, and high net worth individuals. Further, MNBs are
unlikely to enter more market segments, where domestic banks are reducing their loans due to
MNBs= lack of country specific knowledge. Thus, as MNB operations are unlikely to
compensate for the reluctance of domestic banks, and as domestic banks comprise the majority of
the banking sector in most less industrialized economies (table 2), total enterprise credit may fall.
Up to now, we have focussed on the possibility that MNB entry leads to a credit
contraction. Alternatively, MNB entry may also result in a credit expansion, possibly for
unsustainable, speculative purposes. While it is argued that more international competition forces
banks to become more efficient, a destabilizing role of MNB entry has lately been suspected
(BIS, 1997; Kaminsky and Reinhart, 1996; Demirguc-Kunt and Detragiache, 1998). The BIS
(1997:13) argues, for instance, that @financial institutions ... often lack the experience to manage
risks, and in the face of stronger competition, institutions will tend to be pushed towards riskier
investments@. Though, why banks that are stable without MNB competition become more prone
to risk taking with it is so far unclear. MNB entry may destabilize domestic banks due to
competitive pressures, due to poor capitalization of domestic banks, or due to Aderegulation
euphoria@.
Obviously, MNB entry raises the number of banks, and thus the competitive pressures
for domestic banks. To maintain their market share, domestic banks may extend credit to
14
borrowers or projects of lesser quality, thus increasing automatically the default risk in their
portfolios (Darity and Horn, 1988). While such a behavior is conceivable in the early stages of
international financial competition, it appears unreasonable once MNBs have achieved a sizable
market share. Domestic banks, which have less capital or know-how than MNBs should reduce
their credit and risk exposure - as long as their net worth is above their safety threshold.
Domestic banks, which are plagued by low or even negative net worth may extend their
loans to riskier market segments once international competition heats up, regardless of
competitive pressures. Such banks simply stand to lose little or nothing in the case of a bank
failure because they are de facto bankrupt. The mechanism that may push banks with relatively
low net worth into seeking out high risk, high return projects is the same that induces lower
lending by better capitalized banks, namely a decline in retained earnings. Banks= franchise value
declines with lower profitability, and thus should lessen the expectations of poorly capitalized
banks to improve their situation without increasing their portfolio risk.
Finally, financial instabilities could arise from Aderegulation euphoria@. That is, banks
may become overly optimistic about borrower quality, and subsequently extend their loans to
include less credit worthy projects. MNB entry is part of FL, as are the elimination of interest
rate ceilings, the reduction of lending restrictions, capital account liberalization, and domestic
deregulation. Previously credit constrained sectors may now receive funding because higher real
interest rates promise more profits to banks. More credit might in turn increase investment, both
for productive and speculative projects. These real and financial expansions should attract
overseas investors, which may lead to an appreciation, attracting even more capital. However,
15
rather than a stable equilibrium, changes in economic fundamentals may merely produce periods
of tranquility (Minsky, 1986). The initial boom may already lay the foundation for later
instabilities. For instance, internal liberalization may aid short-term speculative finance, thereby
raising the chance of borrower default. Similarly, a continuously overvalued currency hurts
exporters, and may lead to a deterioration in the current account balance. Hence, real and financial
sectors may ultimately grow apart. Borrower default rise, and currency depreciation and bank
instabilities follow suit.
The role of MNBs in a destabilizing cycle may be that it increases the optimism among
lenders, and thereby fuels an unsustainable credit expansion. The presence of overseas capital
may be seen by domestic banks as a Astamp of approval@ for the economic success of an
economy. In other words, domestic investors may interpret more financial service FDI as a signal
of sound economic fundamentals, thereby inducing them to lend more than they otherwise would.
The entry of MNBs can impact the credit supply in either direction as more international
financial competition may induce a credit contraction, and increase the propensity for banks to
engage in more risky projects. The implications of this dual effect are that while credit
contractions may dominate in the early stages of FL, credit expansion may become dominant over
time as MNBs grow and as banks and regulators become more confident with the new situation.
The entry of MNBs can impact both credit supply and financial stability in either
direction. On the one hand, domestic banks may want to reduce their risk exposure by lowering
their loan exposure, on the other hand, domestic banks may want to raise their expected revenue
streams by lending more for riskier activities. The implication of our discussion is that while
16
credit contractions may dominate in the early stages of FL, credit expansion may become
dominant over time as banks and regulators become more confident with the new situation.
III.1 Empirical Analysis
The figures in table 2 indicate that credit contractions continue after MNB entry. The
measures used here are enterprise credit - the sum of credit to private and public enterprises - and
total credit. After MNB entry credit growth relative to GDP tends to be higher, except for Latin
America, where credit declines at about 5%. Moreover, in the Middle East and Eastern Europe
total credit relative to GDP is still shrinking after the entry of MNBs, at -1.62% and -0.62%,
respectively. Further, even though total credit is growing in Africa, it is one out of two areas, the
other being Latin America, where enterprise credit is shrinking, while MNBs are present.
While the credit supply seems to be improving in the presence of MNBs, the issue
remains whether MNB presence can be linked to the credit supply. In 24 out of 88 countries,
total credit is positively correlated with MNB presence. However, in 19 out of 88 countries, the
credit supply is negatively correlated with MNB presence. Hence, we cannot infer any
conclusions from the simple descriptive statistics about the connection between MNB presence
and credit supply.
Part of the reason for the conflicting evidence may be that while MNB presence may
initially result in less credit supply, it may also induce riskier loans in later periods. Thus, we
should be able to observe a growth in the likelihood of banking crises, the longer MNBs are
present in less industrialized economies. The data set is therefore split, so that we can get a sense
on the link between MNB presence and crises. A year is qualified as a crisis year if its banking
17
system is showing either significant problems or experiences a crisis (Garcia, Lindgren and Saal,
1996). There are 95 different events that are classified as banking crises up to 1996, during the
majority of which, 52, MNBs have been present. Thus, observations are classified as occurring
when MNBs are present, or when MNBs are not present. Further, MNBs are considered present
either if there is any MNB credit, or if MNBs have at least a 1%, a 2%, or a 3% credit market
share. The chance of a crisis is then calculated for the first five years, the second five years, and
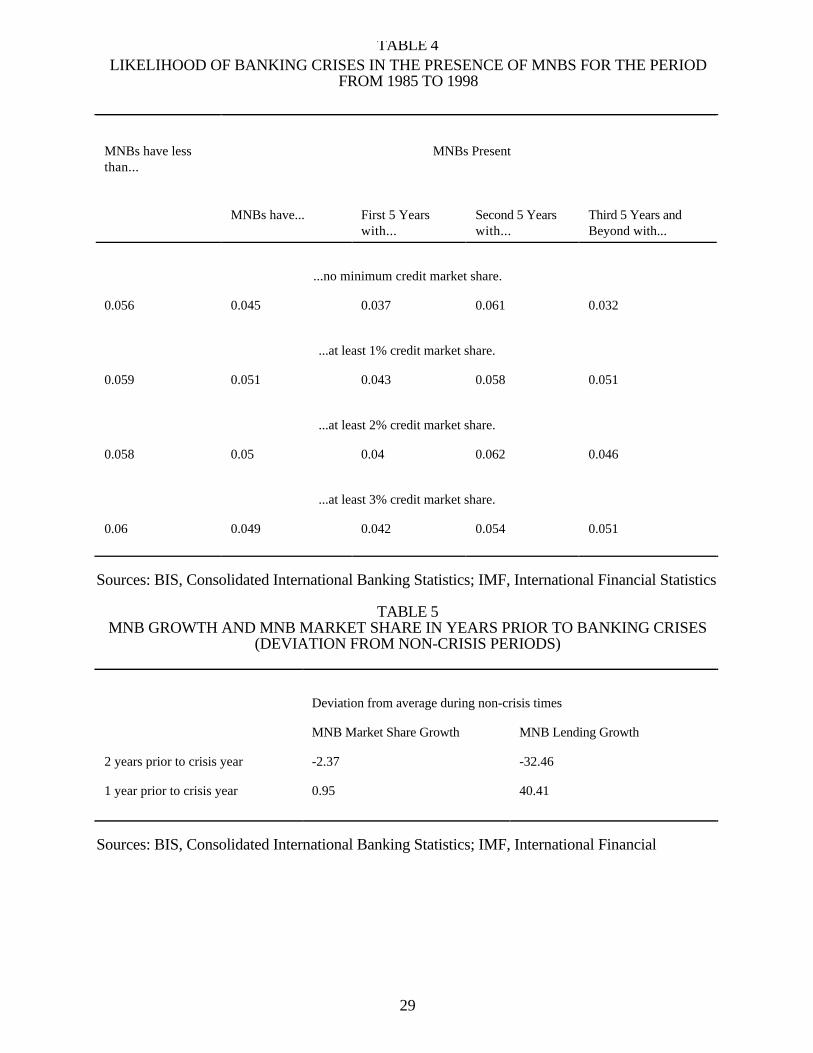
any years beyond the first ten years of MNB presence. Table 4 shows that MNB presence is
loosely connected with the occurrence of a crisis. While the probability of a bank crisis hovers
around 4% for the first 5 years of MNB presence, it increases to 6% for the second 5 years,
before it declines to 4-5% for the years after the first ten years. In other words, there is some
reason to suspect that the presence of MNBs may have initially a stabilizing impact on domestic
financial systems, while international financial competition may become destabilizing over time.
We can also find some support for MNB growth as part of a Aderegulation euphoria@. In
particular, MNB presence grows above average in the year leading up to a crisis (table 5)4. While
the growth rate of MNB loans is on average 32.46 percentage points below their mean during
tranquil periods two years prior to a crisis, it is 40.41 percentage points higher one year prior to
a crisis. Further, MNB credit market share grows above its tranquil period average in the year
just before a crisis, which indicates that MNBs are expanding their loans faster than domestic
4The figures in table 5 are calculated by first defining the two years prior to a crisis year, theactual crisis year, and the two years after a crisis as crisis periods. Then, the average for the non-crisis periods is taken. Finally, the difference of a variable and its mean during non-crisis periodsis calculated. The mean of this difference for the crisis periods is reported in table 5.
18
banks.
The fact that MNBs are expanding their loans faster than domestic banks prior to a crisis
may raise the overall default risk, thus increasing the chance of a crisis (Kaminsky and Reinhart,
1996; Demirgüc-Kunt and Detragiache, 1998). The main link between more credit and instability
are overly optimistic expectations resulting in the expansion of credit to market segments of
lower quality. Such optimistic expectations may be aided by a growing MNB presence, possibly
because domestic lenders see the activities of MNBs as Astamp of approval@ for the
performance of the domestic economy. Thus, while MNBs may initially raise stability by
inducing banks to reduce credit, they may also help to raise lenders= expectations and to foster
imprudent lending practices.
III.2 Regression Analysis
So far, the figures indicate no clear link between MNBs and credit supply, while there is
some indication that less industrialized economies may become more unstable the longer MNBs
are present, and the more they grow. To investigate the impact of MNBs on credit supply and
on stability, we use a credit supply function derived from a standard credit supply model under
credit rationing (Greenwald and Stiglitz, 1990).The estimation equation, then, looks as follows:
itititit
itititit
GDPCreditEnterprise
bGDP
MNBCreditb
GDPMNBCredit
b
PopulationGdp
bGDP
Depositsb
GDPlBankCapita
baGDP
CreditEnterprise
+√↵��
�+√
↵�
��+√
↵�
��+
√√↵
����
+√
↵�
��+√
↵�
��+=
−−
−
161
2
54
1321
(1)
where Enterprise Credit is the credit supply to private and public firms, Bank Capital is the total
bank capital, Deposits are all bank deposits, GDP is nominal GDP, Gdp is real GDP, Population
19
is the current population, MNB Credit is the credit lent out by all MNBs, and ε is the error term.
As our argument pertains to commercial loans by domestic banks, our dependent variable
is enterprise credit i.e., the sum of bank credit to private and public enterprises, relative to GDP.
We include its lagged value as explanatory variable, which allows us to control for omitted
variables. Later, we reestimate the regression using total credit as the dependent variable. As most
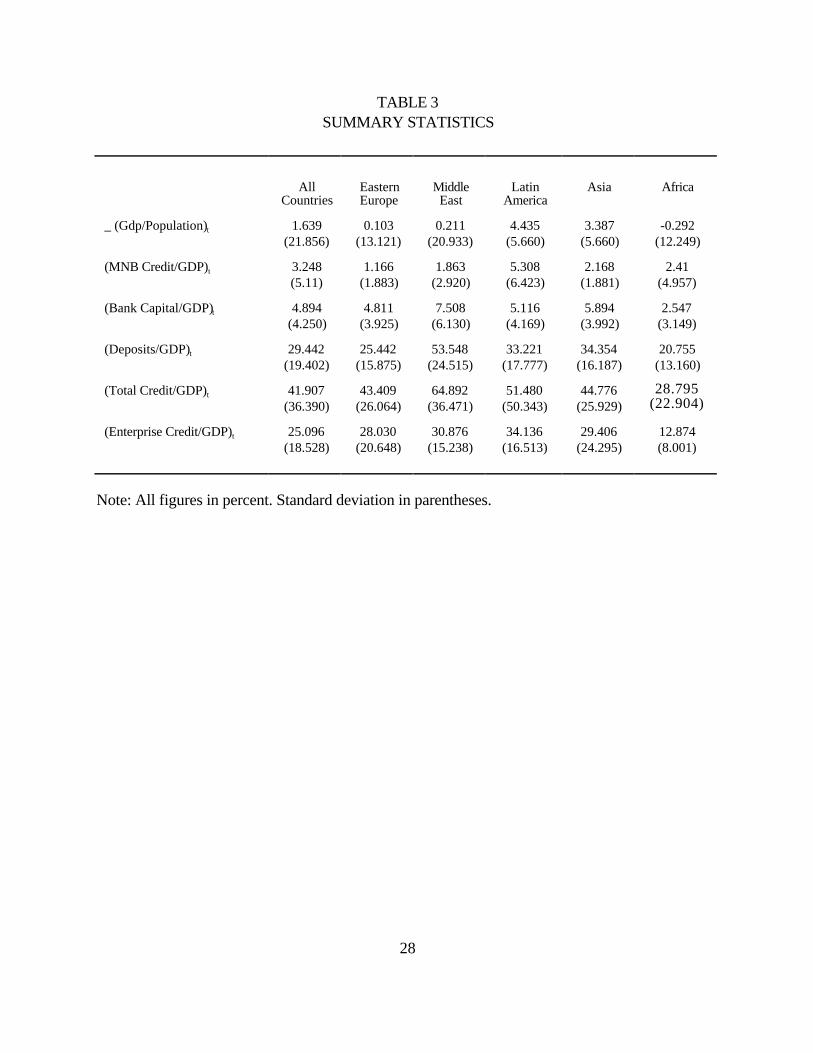
credit is enterprise credit (table 3), the effect of international financial competition on enterprise
credit may be large enough to have a significant impact on the total credit supply.
In its basic form, bank credit is supposed to depend on a bank=s capital, its deposit base,
and on the performance of its borrowers in the previous period. Consequently, we expect that
the credit supply depends positively on changes in bank capital and deposits, and on increases in
real per capita GDP. Due to the fact that the data set comprises aggregate data, the deposit
variable also controls for changes in a country=s monetary stance, and real per capita GDP
growth accounts for the performance of each economy=s real sector. Further, to model the
ambiguous effect that MNB presence may have on credit supply, we include both a linear and a
quadratic term for MNB presence. With a growing MNB presence, domestic lenders=
expectations may become more optimistic as greater MNB activity may be perceived as Astamp
of approval@ for the performance of the local economy. Thus, we would expect MNB presence
to affect credit supply negatively when MNBs are small, and increasingly more positively as
MNBs grow.
To analyze the impact of MNB presence on credit supply in less industrialized
20
economies, we begin by estimating the regression using least squares with dummy variables to
control for country fixed effects. Since deposits may be endogenously related to the credit
supply, we estimate the regression by using two stage least squares, where the lagged value of
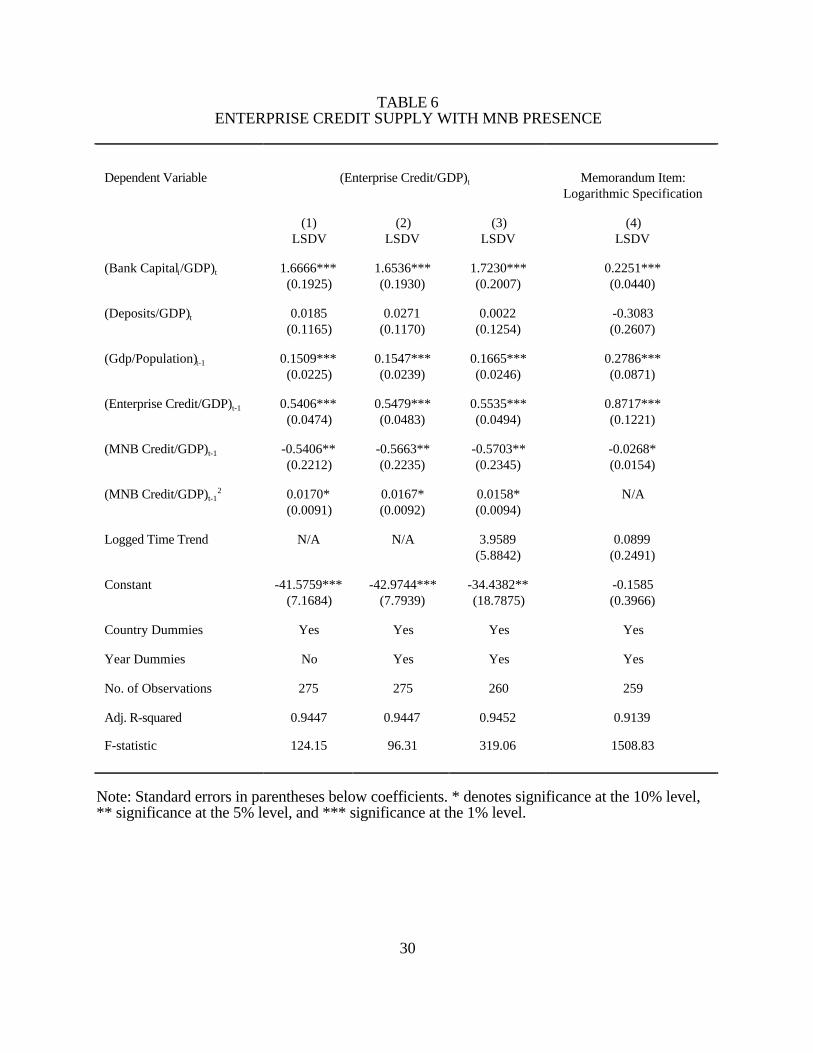
deposits serves as instrument. The results in regression (1) in table 6 show that all variables have
either the expected sign or are insignificant. Most importantly for our purposes, the MNB
variables are both significant with the right sign, suggesting that MNBs lower the supply of
credit as long as they are small, and eventually have a positive influence on the supply of credit
to enterprises. Thus, enterprise credit reaches its lowest point when MNB credit is equal to
15.9% of GDP. Looking at it differently, if MNB presence is at its average of 3.25% of GDP
(table 3) and increases by 2 percentage points relative to GDP, the supply of enterprise credit
declines by 1.01 percentage points relative to GDP. Only if MNB presence grows beyond 15.9%
of GDP, which is the case for 10 countries out of 112, does its impact on the supply of
enterprise credit turn positive.
Recently, a number of multilateral agreements have made it easier for MNBs to expand
their activities into less industrialized economies. For instance, the completion of the Uruguay
round on the General Agreement on Tariffs and Trade (GATT) in 1994, and the subsequent
ratification of the GATS in 1997 lower barriers to MNB entry. To account for such global
changes, we add time fixed effects, with the results in regression (2) of table 6 showing our
estimates unchanged, both with respect to significance and size of the explanatory variables.
Aside from changes over time that affect all economies, countries may undergo shifts in
their policies regarding MNBs at times separate from changes in other economies. Such individual
21
policy changes, often in the form of more financial liberalization, are not captured by time fixed
effects, and may only be partially accounted for by the inclusion of deposits and real per capita
GDP growth in the regression. Hence, we add a time trend for each country individually, starting
with the year when MNB credit is first reported. As such a trend measures a country=s response
to international financial competition, and presumably other related liberalization measures, it
seems only reasonable to assume that as institutions become more adept to the new, more
competitive environment, their responses become gradually less pronounced. In other words,
such a trend may not be in a linear form, but rather a logged form. Adding this logged time trend
to the previous regressions, provides us with regression (3) of table 6. The regression results
show, that the previous estimates are robust, still indicating a U-shaped response to MNB loans,
with the strongest negative impact when MNB credit amounts to 18.1% of GDP in the previous
period.
Another way of test the robustness of the results is to reestimate the equation employing
a logarithmic specification. Obviously, the squared term of international financial competition
disappears in this specification, which shows again an overall negative response in enterprise
credit to MNB credit. Also, all other results reappear in this specification. However, using
Theil=s (1972) residual variance criterion on the larger residual sum of squares for the logarithmic
model and the smaller residual sum of squares for the levels model, we obtain a test value of 2.08,
which is F distributed with 210 degrees of freedom in both the numerator and the denominator
suggesting that the levels model is the more appropriate specification at the 1% level.
Given that there is a negative effect of MNB loans on the supply of enterprise credit, the
22
issue arises whether this translates into an overall decline of credit. Similar to our proceeding with
respect to enterprise credit, we estimate the impact of MNB presence on the supply of total
credit in regressions (1) through (4) in table 7. Our results show only a negative response to
MNB credit, indicating that for each increase of MNB credit relative to GDP in the previous
period to the tune of one standard deviation results in a decline of total credit by 3.13 percentage
points relative to GDP, when country and time fixed effects as well as country specific trends are
accounted for5. Put differently, the negative response in enterprise credit to MNB credit seems
to be strong enough to lower total credit, while the positive impact of larger MNB market shares
on the supply of enterprise credit does not appear to translate into more total credit.
Considering that in the majority of economies the impact of MNB loans has been to
lower the amount of either enterprise credit or total credit, it is hard to see how international
financial competition could result directly in more fragile banking systems. On the contrary,
because of their overall negative impact on the credit exposure of domestic banks, MNBs may
help to stabilize the local banking systems, at least so far. The fact that we observe an increasing
likelihood of banking crises the longer MNBs are present in less industrialized economies, may
therefore be simply correlated to other macro economic trends, such as unsustainable
overvaluations, large international short-term debt positions, or persistent current account
deficits.
Aside from helping to stabilize domestic banks systems, there may be other implications
5Calculating Theil=s residual variance criterion to compare the two specifications we obtain an F-distributed test statistic of 6.18 with 392 d.f. in the numerator and 401 d.f. in the denominator.
23
of a less credit. For instance, the supply of credit may have a positive impact on growth in less
industrialized economies (Calvo and Corricelli, 1993; Odedokun, 1996), which suggests that a
growing MNB presence in most less industrialized economies may put a damper on growth. This
possible negative impact on growth may be attributable to the negative impact of declining credit
on business investment, which depends positively on a sufficient supply of bank credit.
Thus, the levels specification is again the more appropriate one at the 1% level.
The question is whether all firms are likely to experience finance constraints to the same
degree. Domestic banks can reduce their loans to all their borrowers at the same rate, or they can
reduce their loans to some more than others. Given that loans to some borrowers are less costly,
and often also less risky, it is likely that domestic banks will reduce these loans to a lesser degree
than more costly loans. Arguably, loans to smaller borrowers are more costly and often riskier,
when compared with loans to MNCs or large domestic corporations. Hence, SMEs, or start-up
companies are more likely to experience finance constraints than larger, more established firms.
This seems to have been the case in Hungary, for example, where by 1995, most domestic banks
have been foreign owned, and where finance constraints for SMEs and start-up companies have
been recognized recently (Anderson and Kegels, 1998; Abel, Siklos, and Szekely, 1998).
IV. Conclusion
In this paper, we study the impact of MNB presence on credit supply and financial
stability in less industrialized economies. We find that domestic banks lower their total credit
exposure by reducing their commercial loans in response to increased competition, particularly in
serving MNCs, domestic corporations, or high net worth individuals. The limited evidence that is
24
available suggests that SMEs and start-up companies may be particularly affected by growing
finance constraints in the face of a larger MNB presence. Further, as banks reduce their credit
exposure to lower their risk exposure in the face of more international financial competition, they
are also increasing the stability of the domestic banking system.
As the overall impact of MNB presence seems to be to lower enterprise credit and total
credit, other reasons to permit MNB entry need to be compelling enough to compensate for its
drawbacks. For instance, earlier research indicates that MNBs follow MNCs into less
industrialized economies. It is therefore conceivable, that MNBs aid MNC operations, and that
they lead to more FDI growth in the long run. As much as MNCs are desirable partners in
economic development this connection between MNBs and MNCs should be weighed against the
possibly dampening effect on business investment. Further, in the wake of the recent financial
crises, FDI flows, and among them FDI in financial services, may be considered more stable than
short term portfolio flows. As far as less industrialized economies depend on international capital
for their development, MNB entry may hence offer a desirable alternative to portfolio
investment.
Before weighing different policy options, one aspect should be kept in mind. In some
cases, the growth rate of MNBs has been so rapid that within a short time span MNBs have
gained a sizable market share, and sometimes even a majority share of the domestic banking
sector. Considering that MNB entry is not only a matter of domestic banking development, but
also of international trade, implementing financial policy measures, which may affect MNBs,
may be complicated by bilateral or multilateral agreements, such as GATS, especially in financial
25
markets where MNBs play a major role. As the latest multilateral agreements, in particular the
GATS, have meant greater mobility for MNBs, their presence is likely to grow further in the near
future, which makes especially smaller economies more vulnerable to adverse decisions in trade
disputes if they want to implement restrictions on MNB activities (Brown, 1999).
While there may be compelling reasons to attract MNBs into less industrialized
economies, policymakers may want to consider regulatory actions that help to lower the adverse
effects of MNB entry. For instance, recent studies on MNB presence suggest that MNBs, which
have entered joint ventures or strategic partnerships with domestic banks are more likely to serve
typically finance constrained market segments, such as start-up companies or SMEs. Hence,
encouraging or requiring such partnerships - as far as this can be achieved in accordance with
international agreements - may help to lower the drawbacks of MNB entry.
26
TABLE 1SUMMARY STATISTICS FOR MULTINATIONAL BANKS BY YEAR AND GEOGRAPHICAL AREA
Year Total MNB Lending (Mn. US$) Net Imports (MNB Loans- MNB Deposits) (Mn. US$)
Average Growth of Total Credit/GDP (%)a -2.28 -0.62 1.57 -5.05 -2.18 -1.67 0.16 2.51 -0.81 0.02
Sources: BIS, Consolidated International Banking Statistics; IMF, International Financial Statistics.
Notes: a all averages are GDP weighted averages.b averages calculated only if MNB lending is present in the same period.c MNB loan growth rates are calculated after loans are re-converted into domestic currency.
28
TABLE 3SUMMARY STATISTICS
AllCountries
EasternEurope
MiddleEast
LatinAmerica
Asia Africa
_ (Gdp/Population)t 1.639(21.856)
0.103(13.121)
0.211(20.933)
4.435(5.660)
3.387(5.660)
-0.292(12.249)
(MNB Credit/GDP)t 3.248(5.11)
1.166(1.883)
1.863(2.920)
5.308(6.423)
2.168(1.881)
2.41(4.957)
(Bank Capital/GDP)t 4.894(4.250)
4.811(3.925)
7.508(6.130)
5.116(4.169)
5.894(3.992)
2.547(3.149)
(Deposits/GDP)t 29.442(19.402)
25.442(15.875)
53.548(24.515)
33.221(17.777)
34.354(16.187)
20.755(13.160)
(Total Credit/GDP)t 41.907(36.390)
43.409(26.064)
64.892(36.471)
51.480(50.343)
44.776(25.929)
28.795(22.904)
(Enterprise Credit/GDP)t 25.096(18.528)
28.030(20.648)
30.876(15.238)
34.136(16.513)
29.406(24.295)
12.874(8.001)
Note: All figures in percent. Standard deviation in parentheses.
29
TABLE 4LIKELIHOOD OF BANKING CRISES IN THE PRESENCE OF MNBS FOR THE PERIOD
FROM 1985 TO 1998
MNBs have lessthan...
MNBs Present
MNBs have... First 5 Yearswith...
Second 5 Yearswith...
Third 5 Years andBeyond with...
...no minimum credit market share.
0.056 0.045 0.037 0.061 0.032
...at least 1% credit market share.
0.059 0.051 0.043 0.058 0.051
...at least 2% credit market share.
0.058 0.05 0.04 0.062 0.046
...at least 3% credit market share.
0.06 0.049 0.042 0.054 0.051
Sources: BIS, Consolidated International Banking Statistics; IMF, International Financial Statistics
TABLE 5MNB GROWTH AND MNB MARKET SHARE IN YEARS PRIOR TO BANKING CRISES
(DEVIATION FROM NON-CRISIS PERIODS)
Deviation from average during non-crisis times
MNB Market Share Growth MNB Lending Growth
2 years prior to crisis year -2.37 -32.46
1 year prior to crisis year 0.95 40.41
Sources: BIS, Consolidated International Banking Statistics; IMF, International Financial
Note: Standard errors in parentheses below coefficients. * denotes significance at the 10% level,** significance at the 5% level, and *** significance at the 1% level.
Note: Standard errors in parentheses below coefficients. * denotes significance at the 10% level,** significance at the 5% level, and *** significance at the 1% level.
Sources: BIS, Consolidated International Banking Statistics; IMF, International FinancialStatistics; Lindgren, Garcia and Saal, 1996.
35
B. References:
Aliber, Robert, 1984, International Banking: A Survey, Journal of Money, Credit and Banking,November: 661-712.
Balino, Tomas and V. Sundararajan, 1991, Banking Crises: Cases and Issues, Washington DC:International Monetary Fund.
Balino, Tomas, 1991, The Argentine Banking Crisis of 1980, in T. Balino and V. Sundararajan,eds., Banking Crises: Cases and Issues, Washington DC: International Monetary Fund.
Ball, Clifford and Adrian Tschoegl, 1982, The Decision to Establish a Foreign Branch orSubsidiary: A Speculation of Binary Classification Procedures, Journal of Financial andQuantitative Analysis, September:411-424.
Bank for International Settlements (BIS), 1997, Financial Stability in Emerging MarketEconomies, Report of the Working Party on Financial Stability in Emerging Market Economies,Basle: Bank for International Settlements.
Bank for International Settlements, 1997, Financial Stability in Emerging Market Economies,Report of the Working Party on Financial Stability in Emerging Market Economies, Basle: Bankfor International Settlements.
Bown, Chad P., 1999, The Economics of Trade Disputes, the GATT=s Article XXIII and theWTO=s Dispute Settlement Understanding, unpublished manuscript, Brandeis University.
Brainard, Lawrence J., 1990, Capital Markets in Korea and Taiwan: Emerging Opportunities forForeign Banks, Journal of Asian Economics 1, No. 1: 173-177, 1990.
Business Week, 1983, How Foreign Banks Still Get Rich in Brazil, August 22, 1983.
Claessens, Stijn, A. Demirgüc-Kunt, and H, Huizinga, 1998, How Does Foreign Entry Affect theDomestic Banking Market?, Policy Research Working Paper #1918, Washington DC: WorldBank.
Cypher, James, 1996, Mexico: Financial Fragility or Structural Crisis?, Journal of EconomicIssues 30, 2: 451-461.
Darity, William, Jr. and Bobbie L. Horn, 1988, The Loan Pushers: The Role of CommercialBanks in the International Debt Crisis, Cambridge, MA: Harper and Row, Ballinger.
36
Demirgüc-Kunt, Asli and Enrica Detragiache, 1998, Financial Liberalization and FinancialFragility, Policy Research Working Paper #1917, Washington DC: World Bank.Dunning, John, 1980, Toward an Eclectic Theory of International Production: Some EmpiricalTests, Journal of International Business Studies, Spring/Summer:9-31.
Eichengreen, Barry, Andrew K. Rose, and Charles Wyplosz, 1995, Exchange Market Mayhem:The Antecedents and Aftermath of Speculative Attacks, Economic Policy, October 1995:251-312.
Euh, Yoon-Dae and James C. Baker, 1990, The Korean Banking System and Foreign Influence,London and New York: Routledge
Faruqi, Shakil, 1994, Financial Sector Reforms, Economic Growth, and Stability, WashingtonDC: World Bank.
Fieleke, Norman, 1977, The Growth of U.S. Banking Abroad: An Analytical Survey, FederalReserve Bank of Boston, Conference Series, Key Issues in International Banking, 18: 9-40.
Goldberg, L.G., and A. Saunders, 1980, The Causes of U.S. Banks Expansion Overseas: TheCase of Great Britain, Journal of Money, Credit and Banking, November: 630-643.
Goldberg, L.G. and A. Saunders, 1981, Determinants of Foreign Banking Activity in the US,Journal of Banking and Finance, 5:678-684.
Gray, J., and P. Gray, 1981, The Multinational Bank: A Financial MNC?, Journal of Bankingand Finance, March: 33-63.
Grubel, G.H., 1977, A Theory of Multinational Banking, Banco Nazional del Lavoro: QuarterlyReview, December: 349-363.
Kaminsky, Graciela and Carmen M. Reinhart, 1996, The Twin Crises: The Causes of Bankingand Balance-of-Payments Problems, International Finance Discussion Papers #544, WashingtonDC: Board of Governors of the Federal Reserve System.
Khoury, Sarkis, 1980, Dynamics of International Banking, New York: Praeger Publishers.
Khoury, Sarkis, 1979, International Banking: A Special Look at Foreign Banks in the U.S.,Journal of International Business Studies, Winter:36-52.
Khoury, Sarkis, and Robert Piroge, 1983, An Economic Analysis of the Demand for Trade Loansfrom Multinational Banks, Business Economics, September: 40-45.
37
Kim, Taehoo, 1990, Internationalization of Banking: With Special Reference to the Case of Korea,Journal of Economic Development 15, 1:63-82, June 1990.
Kim, In Kie, 1982, Foreign Banks and Monetary Policy, Journal of Economic Development, 175-194, July 1982
Lindgren, Carl-Johan, Gillian Garcia, and Matthew Saal, 1996, Bank Soundness andMacroeconomic Policy, Washington DC: International Monetary Fund.
Minsky, Hyman P., 1986, Stabilizing an Unstable Economy, New Haven: Yale University Press.
Nascimento, Jean-Claude, 1991, Crisis in the Financial Sector and the Authorities= Reaction: ThePhilippines, in T. Balino and V. Sundararajan, eds., Banking Crises: Cases and Issues,Washington DC: International Monetary Fund.
Odle, Maurice, 1981, Multinational Banks and Underdevelopment, New York: Pergamon.
Perez-Campanero, Juan and Alfredo Leone, 1991, Liberalization and Financial Crises in Uruguay,1974-87, in T. Balino and V. Sundararajan, eds., Banking Crises: Cases and Issues, WashingtonDC: International Monetary Fund.
Sabi, Manijeh, 1996, Comparative Analysis of Foreign and Domestic Bank Operations inHungary, Journal of Comparative Economics 22:176-188.
Sabi, Manijeh, 1994, Motivational Factors for the Establishment of U.S. Banks in DevelopingCountries, Social and Economic Studies 43 (2):91-105
Sabi, Manijeh, 1988, An Application of the Theory of Foreign Direct Investment toMultinational Banking in LDCs, Journal of International Business Studies 19: 443-447.
Sabirin, Syahril, 1991, Indonesia=s Financial Reforms: Challenges in the 1990s for Its Bankingand Financial Markets, Journal of Asian Economics 2, 2: 383-397, 1991.
Shea, Jia-Dong, 1994, @Taiwan: Development and Structural Change of the Financial System.@ InH.T. Patrick and Y.Ch. Park, Eds., The Financial Development of Japan, Korea, and Taiwan,New York: Oxford University Press, 1994
38
Sheng, Andrew, 1996, Bank Restructuring: Lessons from the 1980s, Washington DC: WorldBank
Terrell, Henry, 1979, U.S. Banks in Japan and Japanese Banks in the U.S.: An EmpiricalComparison, Federal Reserve Bank of San Francisco, Economic Review, Summer:18-30.
Terrell, Henry, 1986, The Role of Foreign Banks in Domestic Banking Markets, in H. Cheng, ed.,Financial Policy and Reform in Pacific-Rim Countries, Lexington MA: Lexington Books.
Tschoegl, Adrian, 1987, International Retail Banking as a Strategy: An Assessment, Journal ofInternational Business Studies 19 (2): 67-88.
UNCTC, 1982, The Regulation of Transnational Banks in Developing Countries, New York;UNCTC.
UNCTC, 1981, Transnational Banks: Operations, Strategies and Their Effects in DevelopingCountries, New York: UNCTC.
Velasco, Andres, 1991, Liberalization, Crisis, Intervention: The Chilean Financial System, 1975-85, in T. Balino and V. Sundararajan, eds., Banking Crises: Cases and Issues, Washington DC:International Monetary Fund.
Wall Street Journal (WSJ), 1991, Foreign Banks in South Korea, November 29, 1991.
Wall Street Journal (WSJ), 1997, Foreign Banks Target the Little Guy in L.A., October 09, 1997.
Wall Street Journal (WSJ), 1992, Foreign Banks Post 37% Rise in Earnings in South Korea for'91, April 06, 1992.
Wall Street Journal (WSJ), 1995, Foreign Banks Profit in Korea, January 30, 1995.
Weller, Christian, 1999, Financial Liberalization, Multinational Banks and Declining Real Credit:The Case of Poland, forthcoming in International Review of Applied Economics.
Weller, Christian, and Mark Scher, 1999, Multinational Banks and Development Finance, Centerfor European Integration Studies Working Paper, forthcoming.
Yang, Ya-Hwei, 1994, @Taiwan: Development and Structural Change of the Banking System@. InH. T. Patrick and Y. Ch. Park, Eds., The Financial Development of Japan, Korea, and Taiwan,New York: Oxford University Press.