Page 1
1
THE IMPACT OF ORGANISATIONAL CULTURE ON
ORGANISATIONAL PERFORMANCE IN NIGERIAN BANKS.
OBIAGELI OBIJIAKU
A DISSERTATION PROPOSAL SUBMITTED IN
PARTIAL FULFILMENT FOR A MASTER OF SCIENCE IN
MANAGEMENT
National College of Ireland
Submitted to the National College of Ireland on 21st August 2019
Page 2
2
Abstract
Purpose
The purpose of this dissertation is to investigate the impact of organizational culture on
organizational performance in Nigerian Banks.
Findings
Based on the hypothesis formulated for the research, three findings were made. First, that
Leadership has a significant impact on Culture formation. Second, that the presence of
Organizational Culture serves as a significant means in generating sustained Competitive
Advantage. Thirdly, that Organizational Culture significantly impacts Organizational
Performance.
Research Limitations
The methodological design and approach are some of the limitations of this study such as the
sample size, methods for data analysis, research instrument. Also, the time constraints imposed on
the project was another limitation as the researcher was compelled to work within the time limits
given. This may have affected the richness of the results as more responses could have been
collected and analyzed, to make the findings more robust and accurate.
Practical Implications
Managers need to be more deliberate in the type of leadership behaviors they exhibit, in order to
encourage the development of cultures that create an enabling environment for organizational
effectiveness and profitability. Also, there will be an increased need for organizations to develop
strong cultures in the pursuance of significant business performance and in the long run, the
development of competitive advantage.
Page 3
3
Originality/value
This study contributes to the discussion on the interplay between the concepts of organizational
culture, leadership and organizational performance/competitive advantage. Furthermore, its
findings reinforce existing studies, with useful insights for academic practitioners and
organizations alike.
Key Words
Organizational Culture, Leadership, Competitive Advantage, Organizational Performance
Page 4
4
Submission of Thesis and Dissertation
National College of Ireland
Research Students Declaration For
(Thesis/Author Declaration Form)
Name: Obiageli Loretta Obijiaku
Student Number: 17161436
Degree for which thesis is submitted: Master of Science in Management
Material submitted for the award
a) I declare that the work has been composed by myself.
b) I declare that all verbatim extracts contained in the thesis have been distinguished by
quotation marks and the sources of information specifically acknowledged.
c) My thesis will be included in electronic format in the College Institutional Repository
TRAP (thesis reports and projects).
d) I declare that no material contained in the thesis has been used in any other submission for
an academic award.
Signature of research student: ________________________
Date: 21st August 2019
Page 5
5
Acknowledgments
Words are not enough to describe how grateful I am to the Almighty Creator, the King of Heaven
and Earth. Your grace kept me going whenever I felt like giving up. All glory belongs to you,
Lord!
To my Supervisor, Elaine Rossiter, I say a big Thank you, for making this process an “almost”
easy one, with your golden comments, advice and support. Every one-on-one session with you
was very helpful as they gave me the much-needed clarity and direction, which guided me
throughout the dissertation process.
To all the lecturers at the School of Business especially Philip McGovern, Fabian Armendariz,
Dave Cormack and Paul Hanly, I say a huge Thank you for the relentless effort in ensuring that
the modules and assignments were well understood. My good results at the end of this master’s
program is a testimony of your knowledge, creativity and engaging coursework. Keep up the good
work!
To my Siblings, who sponsored me for this master’s program, I am forever grateful for this rare
opportunity to further my education. I worked very hard to make you all proud and I’m very glad
that my labors were not in vain. I love you all!
To Chuks Ire-Okoli, thank you for being that voice of encouragement when I doubted myself. You
made me see the greatness in me. You are very much appreciated. Thank you!
Page 6
6
Contents Abstract ........................................................................................................................................... 2
Submission of Thesis and Dissertation ........................................................................................... 4
Acknowledgments ........................................................................................................................... 5
1.0 Introduction ............................................................................................................................... 9
1.1 Background of study ........................................................................................................... 9
1.2 Statement of Problem ....................................................................................................... 11
1.3 Research Objectives and Questions ................................................................................. 12
1.4 Research Value/Contribution .......................................................................................... 12
1.5 Research Design and Context .......................................................................................... 12
1.6 Structure of Thesis ............................................................................................................ 13
2.0 Literature review ..................................................................................................................... 15
2.1 Introduction ..................................................................................................................... 15
2.2 Conceptual Review .......................................................................................................... 15
2.2.1 Culture ...................................................................................................................... 15
2.2.2 Organizational Culture ............................................................................................ 16
2.2.3 Organizational Culture: The role of the leadership ............................................. 17
2.2.4 Organizational Culture: a source of competitive advantage ............................... 19
2.2.5 Organizational Performance ..................................................................................... 21
2.3 Theoretical review: Dynamic Capabilities theory .......................................................... 23
2.4 Empirical Review of Organizational Culture and Organizational Performance ....... 24
2.5 Conclusion: Summary of Gaps ........................................................................................ 27
3.0 Methodology ......................................................................................................................... 28
3.1 Introduction .................................................................................................................... 28
3.2 Research philosophy ......................................................................................................... 28
Page 7
7
3.3 Research Approach ......................................................................................................... 30
3.4 Research Design: Survey design .................................................................................... 30
3.4.1 The Role of Surveys in Investigating the Linkage between Organizational Culture
and Performance ................................................................................................................. 30
3.5 Population and Sampling methods ................................................................................ 31
3.5.1 Population Size ........................................................................................................... 31
3.5.2 Sample Size Determination ..................................................................................... 32
3.5.3 Sampling Technique ................................................................................................ 34
3.6 Data Collection ............................................................................................................... 34
3.6.1 Research Instrument .................................................................................................. 34
3.6.2 Pilot study ................................................................................................................ 36
3.6.3 Validity of research instrument .............................................................................. 36
3.6.4 Reliability of research instrument .......................................................................... 37
3.7 Data Analysis ................................................................................................................... 38
3.7.1 Research Hypothesis .................................................................................................. 38
3.7.2 Model Specification .................................................................................................... 39
3.8 Ethical Considerations .................................................................................................... 39
3.9 Research Limitations ...................................................................................................... 40
4.0 Data Presentation and Analysis ........................................................................................... 41
4.1 Introduction ....................................................................................................................... 41
4.2 Presentation and Analysis of Questionnaire ................................................................... 41
4.3 Analysis of the questionnaire items represented in percentages and mean scores ... 43
4.3.1 Questionnaire items addressing Organizational Culture construct ...................... 44
4.3.2 Questionnaire items addressing the Leadership construct .................................. 46
4.3.3 Questionnaire items addressing the Organizational performance construct ..... 48
Page 8
8
4.3.4 Questionnaire items addressing the Competitive advantage construct .............. 50
4.4 Research Hypothesis: Results ..................................................................................... 53
4.4.1 Hypothesis One ........................................................................................................ 53
4.4.2 Hypothesis Two .......................................................................................................... 54
4.4.3 Hypothesis Three ........................................................................................................ 56
Summary of Results ................................................................................................................ 57
5.0 Discussion, Practical Implications and Limitation ................................................................. 59
5.1 Discussion of Findings .................................................................................................... 59
5.2 Practical Implications ....................................................................................................... 61
5.3 Limitations ....................................................................................................................... 62
6.0 Conclusion, Recommendation and Future Research Possibilities ........................................ 63
7.0 References ............................................................................................................................... 65
8.0 Appendices .............................................................................................................................. 76
Appendix one: Cover letter for online survey ...................................................................... 76
Appendix two: Email Cover letter ......................................................................................... 77
Appendix three: Research Questionnaire ............................................................................. 78
Appendix Four: Reliability Test Results ............................................................................... 83
Appendix Five: Analysis results from Demgraphic information of the Respondents and
Questionnaire Items .............................................................................................................. 100
Page 9
9
1.0 Introduction
1.1 Background of study
The purpose of this dissertation is to examine how organizational culture will impact
organizational performance in the context of Nigerian banks located in the western part of the
country, precisely Lagos state. For many decades, the topic on Organizational culture has featured
prominently in the discussion amongst scholars in the field of organizational behavior and design
(Shi and Wang, 2011; Uddin and Hossain, 2012). The dynamics of culture within the
organizational context has been deemed to be quite vast and varied, leading to the rise of certain
themes that seek to achieve a more in-depth investigation into the nature of organizational culture
(Schneider, Ehrhart and Macey, 2013). For this research, the themes on i) Organizational culture
and Organizational performance/competitive advantage and ii) Organizational culture and
leadership will be focused on to carve out a discussion from the numerous empirical studies that
exist on the construct.
Organizational culture has been identified as a key factor in the development of superior business
performance (Szymańska, 2016). The role of organizational culture in encouraging organizational
competitiveness, multiplicity, mergers, acquisitions, internal cohesiveness and different
workforce improvements have made it a crucial requirement for advancing corporate survival,
development and advancement. Culture is that element that differentiates an organization from
other organizations with regards to innovation, change management, risk appetite,
consistency and decisiveness (Yilmaz and Ergun, 2008). The culture of each organization is
represented by the values, beliefs, customs and traditions of its members. Schein (2010) postulated
that organizational culture is much more vital today with the advent of the data age, which has
become a formidable force to reckon with and is further amplified by the prevalence of
technological advancements greater than what was achievable in the past.
On the other hand, organizational performance can be described as the results realized in the
achievement of the objectives of a firm (Wei, Liu and Herndon 2011). Organizational performance
reflects organization’s success and is considered as one of the basic notions in management
(Amin, 2017). The link between organizational culture and performance has been determined, and
an ample amount of available evidences corroborates the connection between an organization's
culture and its performance (Mariama-Zakari and Owusu-Ansah, 2013). The culture of an
Page 10
10
organization cannot be disregarded when considering some concepts that include stakeholder
management, risk appetite, governance, etc. To a large extent, the performance of an organization
is largely affected by its culture. Expanded profitability and effectiveness is accomplished when
the guiding principle of the organization are emphatically accepted by substantial number of
individuals in the association since they are focused on the goals and aspirations of the
organization, which is reflected in the way they promote the extraordinary traits of the
organization (Oparanma, 2010).
The link between leadership and organizational culture has also garnered increasing attention
(Hopkins and Scott, 2016; Xie, 2019), as scholars have argued that the benefits of culture cannot
be harnessed just by its mere existence but by the instrumentality of leaders who ensure that the
employees are aligned with the company’s values in the pursuance of its performance goals and
objectives. Therefore, this shows that leadership and culture are connected (Ogbonna and Harris,
2000; Mohelska and Sokolova, 2015), as superior performance is dependent on the existence of a
culture that embodies certain unique traits and characteristics that encourages productivity and
efficiency, with the presence of leadership to reinforce the espoused values (Block, 2003; Schein,
2010) which drives organizational effectiveness, thereby generating sustainable competitive
advantage (Bogdanowicz, 2014).
The proponents of the dynamic capability theory (Teece, Pisano and Shuen, 1997; Teece, 2007)
argue that the presence of unique capabilities that are dynamic in nature are necessary for the
development of sustainable competitive advantage in the rapidly changing business environment.
These dynamic capabilities have also been identified as a firm’s ability to combine, recombine and
utilize internal and external competencies such as organizational and managerial processes, to
achieve sustainable sources of competitive advantage. By organizational and managerial
processes, this means “the way things are done in the firm, or what might be referred to as its
patterns of current practice and learning” (Teece, Pisano and Shuen, 1997, pp. 518).
Organizational culture, which embodies organizational and managerial processes, has been
identified as a dynamic capability (Barney, 1986 & 2011), which can generate significant
economic returns and sustained competitive advantage.
Page 11
11
1.2 Statement of Problem
In the course of the most recent two decades, there have been remarkable changes in the
characteristics of financial institutions in Africa, because of the entrance of new forceful rivals
into the already competitive market as well as the increased financial maturity of customers and
the more noteworthy and increasingly proficient utilization of data innovation (Rhine and
Christen, 2008 cited in Mariama-Zakari and Owusu-Ansah, 2013). In the absence of strict
regulations, there has been heightened competition amongst banks, which has caused the more
fragile banks to become incompetent and powerless against the rising tide of competition in the
marketplace. To increase competitive advantage for better performance, numerous organizations
have rebuilt, consolidated, benchmarked, re-designed and executed quality administration
programs which has yielded aggressive results and benefits. Despite these targeted efforts,
organizations are yet to enjoy superior performance (Davidson, 2003; Zheng and McLean, 2010).
Ogbor (2012) has also argued that many organizations in Nigeria, especially in the banking sector,
are plagued with problems of productivity. According to the researcher, there are several reasons
for this which includes: an unclear vision, lack of direction, unfavorable societal conditions, high
level of bureaucracy, lack of creativity, poor vertical correspondence, weak collaboration between
cross-functional units, lack of cooperation, inferior idea and knowledge management. Also, the
decline in global oil price of 2014 severely affected the Nigerian banking sector (Idris and Nayan,
2016), leading to revenue deficits, decrease in bank deposits, staff lay-offs and reduction in the
volume of transactions (Osuma, Babajide, Ikpefan, Nwuba and Jegede, 2019). An investigation
into the consistency of certain organizations in the area of financial performance have revealed
that these institutions credit their prosperity to the unique cultural identity of their firms
(Omoregbe and Umemezia, 2017). As Barney (1986; 2011) postulated in his study, it could be
assumed that the banks that have successfully developed a core set of values over the years would
be able to stay afloat during such a volatile period, thereby remaining competitive and generating
excellent business performance. Therefore, the purpose of this research is to examine how
organizational culture will impact on organizational performance in the context of Nigerian banks
located in the western part of the country, precisely Lagos state.
Page 12
12
1.3 Research Objectives and Questions
This research work: ‘The impact of organizational culture on organizational performance in
Nigerian Banks” seeks to investigate how the firm’s culture may affect organizational
effectiveness. Also, an attempt will made to discover how leadership may impact on the
development of culture as well as how organizational culture may promote not only significant
organizational performance but sustainable competitive advantage in the long run. For the purpose
of attaining these objectives, the following sub-research questions will guide the study;
1. To what extent does leadership affect organizational culture formation?
2. Can the presence of culture provide a means of generating sustained competitive
advantage?
3. Does organizational culture affect organizational performance?
1.4 Research Value/Contribution
This study will contribute to the discussion on the interplay between the concepts of organizational
culture, leadership and organizational performance/competitive advantage. Also, in the context of
Nigerian Banks, few studies have investigated this interplay and so, by conducting this study, the
existing researches will be further enriched, with valuable insights for researchers and managers
alike.
1.5 Research Design and Context
For the purpose of this research, data will be gathered using quantitative approach by employing
a survey research design to obtain data that will assist the researcher in vividly describing and
interpreting the impact of organizational culture on the performance of banks in Lagos state,
Nigeria. This approach was adopted since it supports the nature of the research problem, which
seeks to determine the relationship between variables (Saunders, Lewis and Thornhill, 2019). The
study will also adopt convenience sampling in selecting banks based on easy accessibility and
proximity for the researcher. After the primary data has been successfully collected, the researcher
will adopt descriptive and inferential analysis for the purpose of analyzing the data. According
to Creswell (2019), these methods of analysis are suitable for organizing data into meaningful
Page 13
13
formats and formulating findings based on what the data depicts. Ethical considerations will also
be taken note of to ensure confidentiality and informed consent from the participants.
1.6 Structure of Thesis
Chapter One: Introduction
This chapter provides a background to the study as well as the research problem. The research
objectives are provided, including three sub-questions that seek to guide the course of the study
and followed by the research value and design.
Chapter Two: Literature review
This chapter provides a review of the relevant existing literature on organizational culture and two
themes prevalent in the discourse on the concept, as well as review of the literatures on
organizational performance, Dynamic Capability theory and the organizational culture-
performance link.
Chapter Three: Methodology
This chapter will address the research design selected, population size, Sampling technique, Data
collection and analysis methods as well as the ethical considerations that will be applied.
Chapter Four: Data presentation and Analysis
This chapter will contain an analysis of the primary data collected using the research instrument
as well as the key findings derived from testing the hypotheses.
Chapter Five: Discussion, Practical implications and Limitations
This chapter will provide a discussion of the research findings to address any possible links found
regarding the literatures reviewed and if the research objectives and sub-questions were achieved.
Also, the practical implications and limitations of the study would be addressed.
Page 14
14
Chapter Six: Conclusions and Recommendations
This chapter will provide a conclusion on the research problem, recommendations as well as
suggestions for future research.
Page 15
15
2.0 Literature review
2.1 Introduction
This section will examine the existing literature concerning the relationship between
organizational culture and organizational performance. The literature review has been
structured in the following sections; the first section covers the conceptual review; the second
section covers the theoretical framework on organizational culture and performance while the third
section comprises of the empirical review on the relationship between organizational culture and
organizational performance.
2.2 Conceptual Review
This segment gives a summary of concepts utilized in the report. They include culture,
organizational culture, organizational culture and leadership, organizational culture as a source of
competitive advantage, organizational performance and measures of financial and non-financial
performance.
2.2.1 Culture
The concept of culture has been subject to various definitions and interpretations. Parsons
and Shils (1952) defined culture as a system of values, norms and symbols that control the
processes and actions people undergo in decision-making. They also argue that culture shapes the
way people interrelate with one another. Similarly, Trompenaars and Hampden-turner (2004)
defined culture as a collective system of meanings which influences what people focus on, how
they behave and what they consider as value. These shared systems of meanings vary from one
culture to another-that is, people from different cultures will have unique & diverse perspectives
and ideas of what culture means to them. Furthermore, the meaning that people confer on an
organization and its formation, processes and policies will be culturally defined (Trompenaars,
1994).
From the viewpoint of these authors, it could be deduced that the elements of culture are intangible
and one that has significant effect on human behavior. Hofstede’s perspective on culture takes a
relatively different approach by defining the concept as the “collective programming of the mind
Page 16
16
that distinguishes the members of one group or category of people from others” (Hofstede,
Hofstede and Minkov, 2005, p.6). According to the author, the programming of the mind begins
during the first ten years of childhood and is significantly influenced by the social groups present
at that time as well as the external environment (Hofstede, 2011). This idea was based on a research
carried out in the 1900’s and published in Cultures and Organization: Software of the mind, using
IBM employees from 50 subsidiaries to examine cultural differences among countries (Shi and
Wang, 2011). His results showed similarities in organizational practices (organizational culture)
amongst the employees, which are learned when a person joins an organization as well as some
marked differences in organizational values, which he termed “national culture”. The disparity
present in the results is evidenced by his argument that the term “culture” cannot be used to
collectively examine culture in an organizational setting or in a national context, since values
(national culture) are developed at the early stages of youth and remains firmly rooted in the mind
(Hofstede, Hofstede and Minkov, 2005; Minkov, 2018).
However, this research is based on organizational culture and its impact on performance in an
organizational context. And so, the construct of organizational culture is most relevant for that
purpose and will be focused on & discussed in the next paragraph.
2.2.2 Organizational Culture
Organizational culture has been defined by various scholars (Peter and Waterman, 1982; Schein,
1983; Cooke and Rousseau, 1988; Hofstede, Neuijen, Ohayv and Sanders, 1990; Van den berg
and Wilderom, 2004; Schein, 2010; Khan, Usoro, Majewski and Kuofie, 2010; Amin, 2017).
The two main approaches that have been observed in the many definitions of organizational culture
are; the value approach and work practice approach (Khan et al, 2010). It has been argued by
scholars that organizational Culture has at its core; a system of shared values that significantly
influences behavior in the workplace (Peter and Waterman, 1982; Khan et al, 2010; Schneider,
Ehrhart and Macey, 2013; Amin, 2017). Organizational culture has been termed as a shared system
of values, beliefs and basic assumptions that have been developed and accepted by a given group
before it is taught to new members as the proven way of solving internal and external problems
(Schein, 1983; Schein, 2010). Cooke and Rousseau (1988) defined the construct of organizational
culture as the shared values and beliefs that directs the behavioral patterns of members in a
Page 17
17
given unit. Therefore, these authors agree that organizational culture is made up of some unique
elements which reinforces behavioral patterns amongst members in a group.
Proponents of the work-practice approach emphasize that practices performed by employees in the
day-to-day running of an organization is the core of organizational culture. Van Den Berg
and Wilderom (2004) defined organizational culture as collective perceptions of work practices
that exist within units in an organization. In the same vein, Hofstede, Hofstede and Minkov (2005)
termed organizational culture as a system of shared work-practices influenced by symbols, heroes
and rituals which carry meanings that can only be interpreted by the members in a given work
environment. Furthermore, Hofstede (2011) strongly emphasized that value is not an element of
organizational culture; as they are developed in the first ten years of a person’s life before he or
she enters a work setting. Nevertheless, Van Den Berg and Wilderom (2004) disagrees with this
argument as they insist that the development of values do not only occur at the early stages of life
but also …”derived from the existing practices within an organization, department, or work unit’
(2004, p.571).
From the above, it shows that there is no consensus about the definition on organizational culture.
However, there is general agreement that organizational culture includes elements such as values,
beliefs, assumptions and practices, which is commonly accepted and guides actions within units
in an organization.
2.2.3 Organizational Culture: The role of the leadership
Just as scholars have made attempts to discover and determine a common measurement of
organizational culture and a unified definition of the construct, other topics on organizational
theory has been examined. Notable amongst them are the topics on leadership and organizational
culture, with the view to investigate the possibility of a positive relationship between the two
concepts (Ogbonna and Harris, 2000). Earlier studies on organizational culture and leadership
have concluded that a strong link between the founder of organizations and their corporate culture
exist due to their ability to influence and shape organizational culture (e.g. Schein, 1983; Hofstede,
1990; Robbins, 1990, Trice and Beyer, 1993; Bass and Avolio; 1993).
Schein (1983) examined the role of the founder in the creation of organizational culture and
concluded that the personality and cultural experiences of the founder strongly determines the
Page 18
18
culture that would be imbibed by the followers, since the founder brings in his own assumptions
and initiates the process of corporate culture development by imposing the type of organization
values and beliefs which should be adopted . However, he reasoned that these assumptions would
have to tested and validated by the followers before they are accepted as the right way to respond
to internal and external problems (Schein, 2010). Hofstede (1990) supports the Schein (1983)’s
argument by reiterating the significance of the effect which founders and leaders can have on the
process of culture formulation, as their values undoubtedly become members’ organizational
practices.
Recent studies on the link between leadership and culture have also concluded that a strong and
positive relationship exists between the concepts (e.g. Ogbonna and Harris, 2000;
Berson, Oreg and Dvir, 2008; Simosi and Xenikou, 2010);(Acar, 2012); (Steers and Shim,
2013);(Warrick, 2017); Gil, Rodrigo-Moya, Morcillo-bellido (2018); (Hazana Abdullah,
Shamsuddin and Wahab, 2019).
According to Ogbonna and Harris (2000), leadership can influence the development of cultural
traits such as innovation and creativity, which in turn leads to organizational effectiveness. In
addition, he suggested that problems pertaining to organizational culture formation can be resolved
if more attention is directed to the type of leadership that exist in any given organization. In the
same vein, (Gil et al., 2018) agrees that leadership can significantly influence the development of
values and systems which can encourage the creation of an innovative culture. They further
maintained that an innovation-oriented culture would generate channels and opportunities for
empowerment and growth with organizations. Similarly, (Acar, 2012) empirically examined the
relationship between organizational culture and leadership with results that confirmed leadership
as crucial for the development of a strong culture which can help to facilitate work conditions that
foster work effectiveness.
Therefore, it could be deduced that leadership can promote the formation of certain cultural
elements within an organization. However, some scholars have also proposed that a positive link
exist between leadership and culture albeit with a different approach. This approach asserts that
certain leadership behavioral patterns are determinants of organizational culture. After conducting
a study on the impact of leadership on organizational culture in 32 business units of a Greek service
Page 19
19
organization, (Simosi and Xenikou, 2010) ‘s results established that leaders ,who arouse feelings
of motivation and creativity amongst their followers, are able to create a platform for the
development of an organizational culture that promotes positive work values. Interestingly, (Acar,
2012) supports this argument as he maintained that some certain cultural traits can only be formed
with leadership styles that promote inspirational motivation, contingent rewards and concern for
individuals. (Steers and Shim, 2013) focused their study on two global automobile brands in
examining the effect of leadership behavior on organizational culture. Their results espoused that
leaders who develop close relations with their subordinates and set up reward systems can
influence, to a large extent, the development of work cultures which echo the key values of the
business.
While different factors can have an impact on organizational culture, work culture largely mirror
their leaders, as they perform key roles in fostering, creating and sustaining cultures (Warrick,
2017). From the above, there is general agreement that concept of leadership and organizational
culture are intertwined, as the shared values, beliefs, norms and assumptions of members in a
given unit are the products of leadership influences.
2.2.4 Organizational Culture: a source of competitive advantage
The concept of leadership has indeed featured prominently in numerous organizational culture
research, as it has been established that leaders can shape the process of organizational culture
formation by inculcating their own bias, assumptions and experiences. Another theme that has also
been widely researched on is culture and its potential as a source of competitive advantage
(Schneider, Ehrhart and Macey, 2013). Because today’s business environment is characterized by
uncertainties, incessant changes and rapid technological revolutions, corporations have become
conscious of the importance of developing competitive competencies through flexible and
innovative work cultures as well as the development of new leadership practices that can provide
continuity in the midst of these disruptions in the business world (Block, 2003). According to
Warrick (2017), organizational culture is a key element that can determine a firm’s survival in the
face of intense competition in the global marketplace. “Culture is a focus for competitive
advantage when it is different from other cultures and the elements that constitute it are difficult
to imitate” (Ployhart, 2012 cited in Schneider, Ehrhart and Macey, 2013, pp 380).
Page 20
20
In his article, which examined the link between organizational culture and sustained competitive
advantage, (Barney, 1986) argued that a culture which possesses a strong set of core managerial
values can create an environment where creativity and innovativeness can thrive. This, in turn,
would translate into sustained competitive advantage. He further clarified that effective leadership
practices are also needed to fully exploit such a competitive edge for the generation of superior
organizational effectiveness. More importantly, (Barney, 2011) added that for an organization’s
culture to deliver sustained competitive advantages, the attributes of ‘Valuable’, ‘Rare’ and
‘Imperfectly imitable’ must be present.
A good number of studies have investigated the significance of organizational culture in the
generation of competitive advantage, with results that highlighted the role played by organizational
culture in the development of competitive advantage (e.g. Ogbonna and Harris, 2000; Klein, 2008;
(Bogdanowicz, 2014); Abdullah, Shamsuddin and Wahab, 2014; (Mohelska and Sokolova, 2015);
(Szymańska, 2016); (Warrick, 2017); (Naranjo-Valencia, Jimenez-Jimenez and Sanz-Valle,
2017); (Byrne, Dwyer and Doyle, 2019).
Ogbonna and Harris (2000)’s study supports (Barney, 2011)’s view that creative and innovative
cultures can create the right conditions for the growth and sustenance of competitive advantage,
which leads to superior financial performance. (Bogdanowicz, 2014) also maintained that an
organizational culture with distinct cultural traits can develop competitive competencies to
withstand competition in the marketplace. However, the author further argued that these benefits
can only be reaped when an alignment between the company’s strategy and its culture is
established. In contrast to the latter, Klein (2008) disputes that an alignment between strategy and
culture is paramount to the creation of sustained competitive advantage. By citing the downfall of
the American energy company, Enron, the author argued that a culture which creates an
atmosphere that enables trust, unity, commitment and discourages fear, is more critical and
instrumental in the development of competitive advantage. Firms with values that encourage
customer-orientation, innovation and employee productivity possess flexible structures and
models that enable them to anticipate changes and outperform their competitors (Abdullah et al.,
2014); (Szymańska, 2016) and Byrne, Dwyer and Doyle, 2019).
Page 21
21
2.2.5 Organizational Performance
Organizational performance can be judged as one of the main concepts in management and around
which most managerial tasks are centered on. Organizational performance can be described as the
summation of achievements realized by a business or departmental unit (Amin, 2017). These
successes involve an organizational goal that is achieved within a given period such as a precise
point in time or for an extended period (Lee and Huang, 2012). The concept of organizational
performance is associated with the growth and development of an organization (Ahmed and
Shafiq, 2014). Organizational performance can be described as the extent at which an employee
accomplishes the goals and aspirations of an organization (Cascio, 2006). Organizational
performance determines the degree of effectiveness and efficiency against the stipulated
performance indicators of an organization (Rogers, 2016).
2.2.5.1 Measures of Financial Performance
Financial units of measurement are helpful pointers of financial performance and wellbeing. These
measurements are compiled from the budget summaries (Statement of Financial position,
Comprehensive Income Statement and Statement of Cash flows) of organizations. Also, these
units of measurement are utilized in investigating patterns within a specific industry. They can
likewise be utilized in correlation of results with contenders and industry benchmarks
(Muhammad, 2011).
• Profitability Ratios
Profit can be described as the distinction between incomes and costs over some undefined time
frame. According to Muhammad (2011), financial leaders ought to persistently assess the
effectiveness of the organization regarding profit generation to guarantee its survival and
development. Profitability ratios depict what the firm is procuring on its sales activities, resources
or value.
• Solvency Ratios
According to Prentice (2016), solvency ratios evaluates the financial dependability of a firm and
how effectively the firm can fulfil its short and long-term responsibilities. Solvency ratios that are
Page 22
22
utilized in appraising a firm’s financial performance include: quick ratio, current ratio, current
liabilities to net worth ratio, total liabilities to net worth ratio and fixed asset to net worth ratio.
2.2.5.2 Measure of Non-Financial Performance
The non-financial units of measurements have become more popularized with the works of Kaplan
and Norton (2005). Chenhall (2006) argues that these non-financial units of measurements are
more widely used by the Just in Time (JIT) and Total Quality Management (TQM) systems of
administration. The non-financial performance measures can be further categorized into other
factors, which encompasses the various elements of an organization. These are;
• Objective non-financial indicators
1.Organizational-oriented indicators
These include output level, equipment efficiency, level of material utilization, internal
organizational effectiveness, product lifecycle, quantity of defective products and organic products
as well as efficiency of new product design.
2.Employee-oriented indicators
These include fulfilment of the workers, dimension of workers' abilities, level of workers'
empowerment, dimension of employee training, employee turnover, level of truancy etc.
3.Customer-oriented indicators
These indicators include level of market share, total time period for processing customers’ order,
delivery speed, total time period taken to address customers’ queries, product flexibility, degree
of customer satisfaction, level of customer attraction and retention.
• Subjective non-financial indicators
These include long-term outlook of the firm, effective skills and knowledge acquisition,
willingness to distribute valuable information throughout the organization, level of cooperation
amongst various departments in the organization, mental wellbeing of employees, leadership style
and level of loyalty in an organization.
Page 23
23
2.3 Theoretical review: Dynamic Capabilities theory
In order to facilitate a well-grounded appreciation of organizational culture and its dynamics in an
organizational setting, this section will provide an overview of the Dynamic Capabilities theory,
upon which this research is based. Teece, Pisano and Shuen (1997)’s research work on Dynamic
Capabilities and Strategic Management, was an important reference on the discussion of what
constitutes competitive resources and capabilities in an organization (Bleady and Ali, 2018). The
Dynamic capabilities theory has also been subject to varying definitions in an attempt
to effectively capture what comprises sources of competitive advantages that can improve a firm’s
chances at surviving in the ever-changing business environment.
According to Teece et al (1997), Dynamic Capabilities is defined as “the firm’s ability to integrate,
build and reconfigure internal and external competencies to address rapidly changing
environments” (1997, pp 516). Dynamic Capabilities allow corporations to develop and assign
resources that sustain efficient business performance (Teece et al, 1997, (Eisenhardt and Martin,
2000; Teece, 2007). Similarly, (Eisenhardt and Martin, 2000) defines Dynamic Capabilities as
organizational practices that integrate, reconfigure, acquire and distribute resources in the quest
for competitive advantages that would help to create flexibility in responding to market changes.
Dynamic capabilities constitutes a system of resources which enterprises can integrate,
reconfigure, remodel and assign for the purposes of achieving competitive advantage (Ludwig and
Pemberton, 2011 cited in (Bleady and Ali, 2018). It is a set of configurable resources which a firm
can utilize for the process of adapting in the business environment characterized by changes
(Simon, Stockport, Smith, Klobas and Sohal, 2015).
From the definition above, it is generally agreed that for a resource to be dynamically capable of
responding to market changes, it must be readily configurable, adaptive, and transferable in order
to respond adequately and timely to external conditions that may affect business’s performance.
Furthermore, the Dynamic Capabilities framework establishes that maintaining superior business
performance in a market characterized by technological changes can only be possible by refining
internal organizational and managerial policies and procedures. In addition, (Teece, 2007) argues
that the high-flyers in the marketplace are those firms that have developed flexible structures and
processes, coupled with effective management control, which allow them to deploy resources in
order to achieve new sources of competitive advantage.
Page 24
24
The Dynamic Capabilities theory, which is an extension of the resource-based view theory
(Eisenhardt and Martin, 2000; Bleady and Ali, 2018), suggest that competitive advantage of firms
relies on the functionality of organizational and managerial processes, supported by their pool of
tangible and intangible resources (Shuen and Sieber, 2009). Dynamic capabilities, which are a
source of competitive advantage, consist of these organizational and managerial processes, which
are further comprised of three core elements; coordination/integration, learning and reconfiguring
(Teece et al, 1997; Teece, 2007). Out of these elements, ‘Learning’ resonates well with the
elements of organizational culture defined by (Schein, 2010) as the shared system of values, beliefs
and basic assumptions that have been developed and accepted by a given group before it is taught
to new members as the proven way of solving internal and external problems . Learning is a
process that is “intrinsically social and collective and occur due to joint contributions to the
understanding of complex problems” (Teece, 2007, pp. 520). Furthermore, this learning process
can be described as organizational practices/patterns of interaction that exposes effective answers
to peculiar problems. In other words, firms can develop competitive advantage through this
process as it helps to generate solutions and strategies to tackle challenges that may hinder
competitive survival.
From the above, it could been implicitly assumed that organizational culture is a component of
the dynamic capabilities framework, which is further supported by (Barney, 2011)’s view that
organizational culture can be a source of competitive advantage provided they meet the conditions
of being valuable, rare and imperfectly imitable.
2.4 Empirical Review of Organizational Culture and Organizational Performance
Although the term ‘Organizational Culture’ has been a topic of debate for many years; with various
arguments bordering on how the construct should be measured and whether it should be linked to
organizational effectiveness, there has been an increasing number of evidences put forward which
establishes that organizational culture impacts significantly on organizational performance
(Schneider, Ehrhart and Macey, 2013). Some of these studies confirm that a direct and positive
link exists between organizational culture and performance (e.g. (Acar, 2012; Murphy et al.,
Page 25
25
2013; Kipsang, Mutiso and Mbaraka, 2015; Ofori and Sokro, 2015; Laforet,
2017; Omoregbe and Umemezia, 2017; Polychroniou and Trivellas, 2017) while others argue
against such a direct link by emphasizing the link between the two constructs are moderated by
such variables as employee commitment, employee productivity and motivation (e.g. Uddin and
Hossain, 2012; Boyce, Nieminen, Gillespie, Ryan and Denison, 2015; Nikpour, 2017; Matthew.J,
2019).
According to (Murphy et al., 2013), culture within an organization is deeply ingrained and unique;
with the ability to foster cooperation and coordination. Based on this, the authors argue that
increased levels of cooperation and coordination within units can lead to improved organizational
performance. (Ofori and Sokro, 2015) believe that companies with a core set of values perform
better than their counterparts in the marketplace. This view is supported by the work of Peter and
Waterman (1982) who established that performance within an organization relies on the extent to
which the values are generally accepted. The result of their study further supported this view; as
it was established that firms, with values that promote respect, innovation, cooperation, teamwork,
etc. enjoyed increased performance. From these authors, it can be understood that organizational
culture has different attributes which influence organizational performance in a positive way.
Organizational culture practices have been positively linked to increased performance. According
to (Omoregbe and Umemezia, 2017), good leadership practices, continual employee training
programs and effective work processes can impact performance on overall performance in an
organization. In their empirical research, the authors analyzed primary data sourced from some
selected firms in the Nigerian banking sector, after which they concluded that a positive link exits
between organizational culture and performance. The findings of (Laforet, 2017) agrees with
(Omoregbe and Umemezia, 2017) as the author posits that organization culture practices
represents organizational behavior, which influences the formulation and attainment of its aims
and objectives while shaping the decision-making process. In addition, the author established that
organizational culture consists of leadership and management styles, common vision,
organizational design and coordination. The key variables from the questionnaire were tested using
factor analysis and from this, the results supported the prevalent argument that that organizational
culture significantly impacts brand and business performance. Furthermore, the author highlighted
Page 26
26
the instrumentality of the C.E.O in providing the vision and guidance necessary for harnessing the
potential benefits offered by the presence of culture in an organization.
There are a number of theoretical models that propose various culture types (Wallach, 1983;
Cameron and Freeman, 1991; Deshpande, Farley and Webster, 1993; Cameron and Quinn, 1999).
By using the culture typology model proposed by Cameron and Quinn, (Acar, 2012) ‘s research
results indicated that out of the four types of culture; Clan and Adhocracy cultures had positive
impact on organizational performance. The author clarified this argument by stating that Clan and
Adhocracy cultures foster creativity, oneness, cooperation and innovation which creates an
enabling environment for organizational effectiveness. In the same vein, (Pinho et al., 2014)
examined this positive relationship by testing some performance variables on the four culture types
proposed by (Deshpande et al., 1993)’s model. Their result seemed to differ relatively from that
of (Acar, 2012), although they reached the same conclusion. Here, the performance variables
tested positive against all the culture types namely; Clan, Market, Adhocracy and Hierarchy. In
other words, organizational culture unequivocally drives superior business performance, which
can generate competitive advantage. However, a limitation of this study is that its results cannot
be generalized for other sectors, as the research focused mainly on non-profit health organizations.
According to Deal and Kennedy (2000), a strong culture is a key factor in superior organizational
performance and lasting competitive advantage. This view was supported by (Kipsang et al.,
2015; Polychroniou and Trivellas, 2017) as their researches confirmed that a strong and balanced
culture has a positive relationship with performance variables such as fiscal growth, market
position and innovative performance. In contrast to this, (Matthew, 2019)’s
findings challenges the notion that strong cultures are directly linked to organizational
effectiveness, due to differentiation and fragmentation of cultural values in some Indian software
companies. However, a major limitation to this study is that the results cannot be generalized for
other sectors or regions. In addition, the author maintained that the culture and performance link
is an indirect one and fails to be an all-sufficient ingredient for financial performance.
Nevertheless, it was accepted that organizational culture is a dynamic capability that promotes
learning and knowledge-sharing (Teece, 2007), which helps to attract and maintain the right talent
and skills that facilitate organizational effectiveness (Matthew, 2019). Relatively, other scholars
(e.g. (Uddin and Hossain, 2012; Boyce et al., 2015; Nikpour, 2017) have also argued that the
Page 27
27
relationship between corporate culture and performance is an indirect phenomenon as the link is
mediated by organization variables such as employee commitment and employee productivity.
2.5 Conclusion: Summary of Gaps
In summary, the concept of organizational culture has been widely researched with varying
definitions on what the construct entails. Even as there is the absence of a widely accepted view
on the topic, there is general agreement that organizational culture comprises of a shared vision,
core values and underlying assumptions that guides behavior within units and sub-units in an
organization. Also, there has been certain themes prevalent in the discussion and measurement of
organizational construct. Prominent amongst them is the impact of leadership on culture formation
as well as arguments bordering on culture as a source of competitive advantage. Equally important
is the discussion on organizational culture and the numerous attempts that have been made by
scholars to establish positive links between the two constructs. Therefore, this study will adopt the
Dynamic Capabilities theory for the purpose of determining how organizational culture and its
various aspects may contribute towards superior organizational performance and consequently
generating sustained competitive advantage.
However, from the existing literature reviewed so far, it is acknowledged that organizational
culture is largely shaped by the founders/leaders within the firm, who are instrumental in
promoting the cultural values and reinforcing certain organizational behaviors. The findings in the
literature reviewed widely supported a significant relationship between organizational culture and
organizational performance. In contributing to the existing research on the constructs, this study
will further investigate this possible relationship between the two constructs amongst Nigerian
banks precisely located in the western part of the country, Lagos. Specifically, the research sub-
questions which would guide this study include;
1. To what extent does leadership affect organizational culture formation?
2. Can the presence of culture provide a means to generating sustained competitive
advantage?
3. Does organizational culture affect organizational performance?
Page 28
28
3.0 Methodology
3.1 Introduction
This chapter presents the methodological underpinnings and research methods adopted for the
purpose of achieving the research aim and objectives which emanated from the literature review
as given above. In this methodology chapter, the researcher will develop and identify the rationale
for decisions made in relation to the research philosophy, research approach and design as well as
a discussion on the population and sampling methods, data collection, presentation and analysis
and finally, an outline on the ethical considerations guiding the research and a view on the
limitations which characterizes the study.
3.2 Research philosophy
Research philosophy can be defined as “a system of beliefs and assumptions about the
development of knowledge” (Saunders, Lewis and Thornhill, 2019, pp. 130). These assumptions,
which make up certain research philosophies, determine the choice of methodology, research
approach as well as data collection, analysis and interpretation measures. It is important to note
that all research studies are reinforced by a philosophical outline, with epistemological and
ontological positions (Quinlan, Babin, Carr, Griffin and Zikmund, 2019). Therefore, the
philosophical framework, which was employed based on the nature of this study, is positivism.
Epistemological debates amongst social science scholars have given rise to various schools of
thoughts on what knowledge is and how it is developed and studied (Creswell, 2003). Out of these,
the two main schools of thought that have dominated this discourse are Positivism and
Interpretivism-Constructivist (Tuli, 2010). Although, these epistemological positions believe that
human behavior is consistent and with a definite flow, they employ contrasting viewpoints in
explaining social reality. Positivist researchers argue that human behavior and social reality can
be studied objectively through observations which then subsequently results into laws of cause
and effect that govern general forms of human activity (Johnson and Onwuegbuzie, 2004).
Furthermore, they posit that these are discovered using quantitative procedures, which show how
variables shape and determine social outcomes. Alternatively, proponents of the interpretivist-
constructivist school of thought argue that social realities are not defined or governed by any
Page 29
29
established set of laws but by humans through social interaction (Johnson and Onwuegbuzie, 2004;
Tuli, 2010). Researchers who adopt this school of thought deploy qualitative research methods to
explore, explain and define human behavior.
Researchers who seek to classify and evaluate the causes that influence outcomes, through careful
observations represented in numeric methods, usually adopt the positivist framework (Creswell,
2003; Creswell, 2019). Given that the main research problem of this study is to explore the impact
of organizational culture on organizational performance, the positivist philosophical framework
was chosen since the different elements of this research fits within the framework. In addition, the
selection of this framework also indicates that quantitative methods were used to test the
hypotheses developed and to investigate the relationship and interaction between the variables of
organizational culture, leadership, performance and sustained competitive advantage.
Figure 1: The Foundation of Research (Tuli, 2010).
Page 30
30
3.3 Research Approach
The three main approaches in research are; quantitative, qualitative and mixed methods (Tobi and
Kampen, 2018). According to Creswell (2019), the choice of any research approach is determined
by the nature of the research problem to be addressed, as well as the philosophical background
within which the research work is positioned. The epistemological and ontological perspectives
contained in the positivist paradigm dictate the use of a research methodology that allows the
researcher to be objective; without any kind of bias when justifying their hypotheses (Johnson and
Onwuegbuzie, 2004) and which allows the researcher to test the relationship between variables
(Hoe and Hoare, 2012). Since, the positivist framework reinforces quantitative methodology (Tuli,
2010), this approach was adopted by the researcher but more importantly because the researcher
believes that it is important for the research findings to be free from any bias in order to generate
confidence that the results are rigorous and accurate (Holden and Lynch, 2004).
3.4 Research Design: Survey design
The main research problem of this cross-sectional study is to investigate the possibility of a
positive link between organizational culture and organizational performance in banks located in
Lagos, Nigeria. For this purpose, quantitative data would have to be collected from the sample
population in order to capture the opinions and attitudes of the research participants to achieve the
research objectives (Rahi, 2017; Creswell, 2019). Since the survey design is associated with
quantitative research approach, the researcher selected this method for the purpose of gathering
data, using questionnaires as an instrument, in order to answer the research sub-questions.
3.4.1 The Role of Surveys in Investigating the Linkage between Organizational Culture and
Performance
Studies on the relationship between organizational culture and performance has featured
prominently in the field of organizational studies, with the earliest discourse dating back to the
1950’s and led by the erudite scholar, Jacques Elliot in his research titled ‘The Changing Culture
of a Factory’ (Denison, Nieminen and Kotrba, 2014). Since then, studies on the Culture-
performance link has become widespread with various scientific approaches employed in
measuring the two constructs with conclusions that associate superior organizational effectiveness
Page 31
31
to the presence of a strong corporate culture (e.g. Simosi and Xenikou, 2010; Murphy et al.,
2013; Bogdanowicz, 2014; Ofori and Sokro, 2015; Szymańska, 2016; Hazana Abdullah,
Shamsuddin and Wahab, 2019). Coupled with this, the use of the different research approaches
has also evolved rapidly, as more researches have adopted quantitative research methods, with
surveys serving as the basis for quantitative evaluations due to the fact that it is more economical
and efficient in providing normative data on organizational culture and its impact on performance
(Sackmann, 2011; Denison et al, 2014).
In the view of the above, the researcher was confident that the choice of a survey design for this
cross-sectional study was the best option, for not only has this tool being tested as an effective
methodology for research by scholars ,but it has also been proved to facilitate the collection of
data from a large sample population in an efficient and cost-effective way.
3.5 Population and Sampling methods
3.5.1 Population Size
The population of any study would include all the individuals, organizations or units that are
applicable to the purpose of the study (Quinlan,2011). Given that the research aim is focused on
the Nigerian banking sector, the relevant population would comprise of all the employees working
within the Nigerian banking sector. In terms of population size, the National Bureau of Statistics
(2019) reports the total staff strength in Q1,2019 as 105,017. These include both senior, executive,
junior and contract staff. According to (Hartnell et al., 2016), previous studies on organizational
culture and performance have made the error of focusing only on the Senior management for data
collection, thereby causing the data to be too limited in acting as the basis for culture-performance
assessment. Hence, the researcher acknowledged the importance of examining all organizational
members represented in the different levels of management to provide a more robust assessment
of the research problem at hand.
Page 32
32
Figure 2: Staff Strength in the Nigerian Banking Sector (National Bureau of Statistics, 2019).
3.5.2 Sample Size Determination
The need to determine a sample size is crucial because it is impossible to gather data from the
entire population and by focusing on the selected sample size, the data collection process can be
more realistic, less time-consuming and less expensive (Quinlan et al, 2019). The sample size for
this research project was derived using the Taro Yamane statistical formula as adopted by (Ezirim,
2010) in their study on the impact of organizational culture on performance in the Nigerian oil and
gas sector.
The Taro Yamane formula is presented as follows;
n= N1+Ne2
Page 33
33
Where n is the sample size
n
is the population size
e is the sampling error
The total number of employees in Nigerian banks as at Q1 in 2019 is one hundred and five
thousand, seventeen. This implies that N= 105,017, e= 0.05 (i.e. 95% confidence level). Therefore,
the sample size was computed mathematically below as:
n= 1050171+105017 (0.052)
n=398.48
[Equation]= 400
Thus, four hundred employees made up of the senior, executive, junior and contract level staff
were used for this study. For the sake of the questionnaire, these employees were categorized
as top-level management, middle-level management and working-level employees. Also, the
researcher had no preferences in terms of age and sex of the sample size. According to (Lenth,
2010; Berger, Bayarri and Pericchi, 2014), larger sample sizes facilitates higher degree of
accuracy in research findings and reduces the likelihood of sampling errors. However, in survey
researches, response rates are rarely up to a 100% (Taherdoost, 2018). With this challenge in mind,
the researcher decided that the large sample size given above would help to compensate for any
non-response that may affect the results negatively.
Page 34
34
3.5.3 Sampling Technique
The research participants for this project would be made up of senior, middle and low-level staff
members of the Nigerian banking sector. According to the Central Bank of Nigeria (2019), there
are twenty-one banks currently under its supervision. With the determined sample size of 400
employees, the researcher used convenience sampling to decide the selection of banks as well as
the number of questionnaires to be administered per bank. Since convenience sampling allows for
the selection of research participants based on easy accessibility and availability (Quinlan, 2011),
the researcher deemed this technique as appropriate, efficient and less costly to employ.
3.6 Data Collection
3.6.1 Research Instrument
It has been established from the previous sections in this chapter that the researcher adopted the
positivist paradigm which further determined the use of quantitative research approach. Therefore,
the research instrument utilized for the purpose of data collection was the questionnaire, which is
widely used in large survey researches (Quinlan et al, 2019), to capture the experiences, behaviors
and beliefs of the research participants. According to (Rowley, 2014; Creswell, 2019),
questionnaires may be distributed by post, face to face, by email, via an online platform such as
Checkbox, SurveyMonkey, or by telephone. Therefore, for the purpose of this study, the
researcher collected data from the respondents through a combination of Email/Online based
questionnaires. However, there are other reliable platforms which are less expensive and easy to
access such as Google Form, which the researcher adopted for the purpose of hosting the
questionnaires before it was sent via email as an embedded link to the respondents that were
already selected via convenience sampling technique.
The rationale for selecting the questionnaire as a research instrument over structured interviews
was due to the researcher’s desire to maintain strict adherence to the epistemological
underpinnings of the Positivist paradigm, which allows researchers to remain detached and
independent from their study without imposing personal biases or influences over the results of
the research at hand (Tuli, 2010). By adopting the Online-Email questionnaire distribution
approach, the researcher was able to administer and collect data without direct contact with the
potential respondents.
Page 35
35
3.6.1.1 Questionnaire development and characteristics
The generation of the item scale was carried out through careful reflection on the research
questions and objectives as well as from the different gaps identified in the literature review
chapter. The questionnaire contained 44 items (See Appendix 3) and had two sections namely;
Section A and Section B. Section A was designed to capture demographic information of the
respondents such as their age, sex, educational qualifications, management level, department or
unit and number of working experiences in the organization. Section B contained items that
addressed the variables of Culture, Leadership, Performance and Sustained competitive advantage.
In addition, the Seven-point Likert scale as recommended by (Rahi, 2017) was adopted in order
to measure and capture the precise attitudes and feelings of the respondents. More importantly, the
Seven-point Likert scale has been deemed as the most appropriate for electronic surveys as data
generated is more accurate and reliable than other Likert-type scales (Rahi, Alnaser and Ghani,
2019). The Seven-point Likert scale used in this research are as follows;
Strongly Disagree (SD), Disagree (D), Partially Disagree (PD), Undecided (U), Partially
Agree (PA), Agree (A) and Strongly Agree (SA).
According to (Saunders, Lewis and Thornhill, 2019), open ended questions can be beneficial in
gaining deeper perceptions as it allows the participants to express their views with their own
words. However, the risk associated with such type of questions is that respondents may not be
patient enough to write down their thoughts thereby causing a low response rate. The researcher,
in ensuring that a high response rate was achieved, generated more close-ended questions which
has been proven to be more effective in collecting significant amount of data from respondents
and better suited for survey researches with large sample sizes (Rowley, 2014).
3.6.1.2 Questionnaire design principles
High non-response rates can be detrimental to the attainment of the research goals, which is
common in mail/postal and online survey (Babin et al, 2019). In order to reduce the chances of
such ill-fated occurrence, the researcher took the following measures;
• The questions were structured in a short, precise and clear manner, with no offensive
connotations.
Page 36
36
• The questions were arranged under sub-sections with a brief explanation about what each
section entailed.
• The questionnaire had a short introductory piece which included the title of the research
project, purpose of the research, what it entailed as well as confidentiality pact to gain their
trust and support.
• Friendly reminders were sent each week after the initial questionnaire administration, as
this has been proven to influence higher response rates if done sensibly (Creswell, 2019).
3.6.2 Pilot study
The pilot study of this research work was conducted as a matter of importance since the
questionnaire was newly constructed and hasn’t been used in previous studies. (Creswell, 2019)
suggested that a preliminary pilot is needed for the purpose of confirming if the questions
sufficiently captures the attitudes, beliefs and experiences of the participants. Therefore, this
exercise involved administering the research instrument to 10% of the selected sample to assure
validity and reliability of the research instrument. Therefore, 40 employees of one of the banks
will be used for the pilot study, which represents 10% of 398.48 which was approximated from
39.6 to 40. Similar respondents separate from the target respondents may also be included in a
pilot study (Quinlan, 2011, Rowley, 2014) and so, colleagues and friends from other sectors would
be recruited to partake in the exercise to help identify any possible errors present in the research
instrument.
3.6.3 Validity of research instrument
The validity of a research instrument can be determined if it gauges precisely what it is intended
to quantify (Creswell and Miller, 2000). According to Quinlan (2011), “measurement validity
refers to the degree to which the data collection methods can accomplish what it is that they are
designed to accomplish” (Quinlan, 2011, pp. 335). In planning the survey, the researcher will be
guided by the need to draw the accurate reactions from the respondents. To determine the accuracy
of responses from candidates, the researcher employed content validity method where the
Page 37
37
questionnaire items were reviewed by the supervisor and colleagues for screening and
endorsement to guarantee content legitimacy.
3.6.4 Reliability of research instrument
According to (Bonett and Wright, 2015), Cronbach’s alpha is a common tool used in assessing the
internal reliability of the research instrument. This exercise is especially crucial for this research
as items contained in the questionnaire were developed by the researcher and has not been used in
any other study. The researcher applied the Cronbach Alpha method to test the consistency of the
responses from the 40 employees selected for the pilot study. If the findings are reliable, this will
allow the researcher to test the findings again and possibly obtain the same results. Results are
expressed between 0-1. However, to test for reliability of the research instrument, this result must
test above 0.7 which shows 70% reliability.
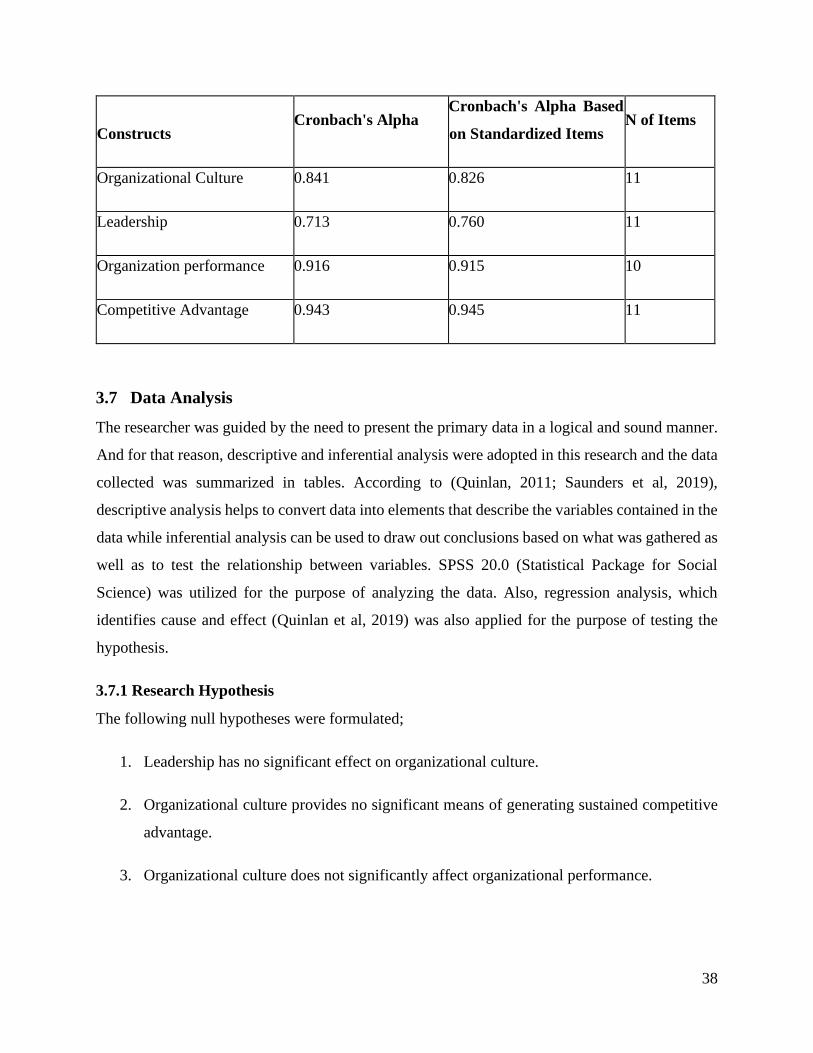
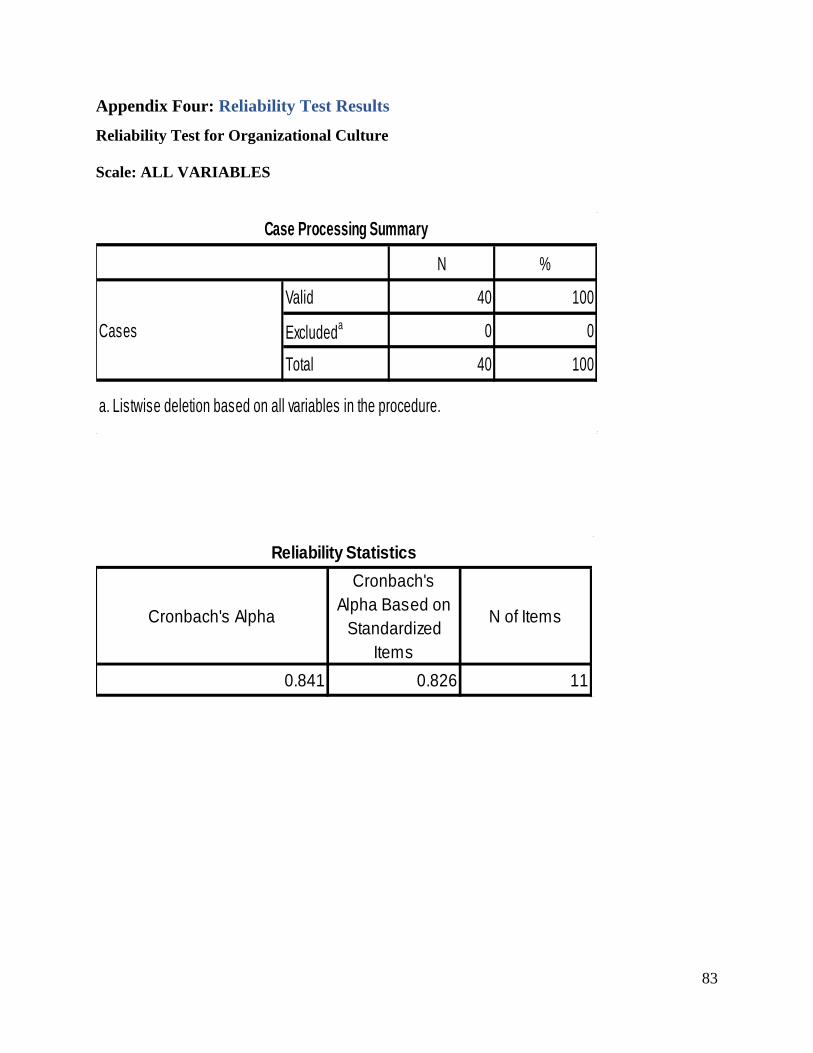
3.6.4.1 Reliability Statistics: Result
As mentioned in the previous section, a pilot study was conducted for the purpose of confirming
if the questions sufficiently capture the attitudes, beliefs and experiences of the participants. The
40 responses collected were tested using the Cronbach Alpha method and the table below shows
the reliability test for the questionnaire items contained in the research instrument. The
measurement scales for this instrument produced a Cronbach alpha of 0.841, 0.713, 0.916 and
0.943 for such constructs
as Organization Culture, Leadership, Organization Performance and Competitive Advantage res
pectively. From this result, it was evident that the instrument for this study met the above criteria
with α figures above 0.7, which suggest an excellent internal consistency of these constructs and
their individual observed variables.
Page 38
38
Constructs Cronbach's Alpha
Cronbach's Alpha Based
on Standardized Items N of Items
Organizational Culture 0.841 0.826 11
Leadership 0.713 0.760 11
Organization performance 0.916 0.915 10
Competitive Advantage 0.943 0.945 11
3.7 Data Analysis
The researcher was guided by the need to present the primary data in a logical and sound manner.
And for that reason, descriptive and inferential analysis were adopted in this research and the data
collected was summarized in tables. According to (Quinlan, 2011; Saunders et al, 2019),
descriptive analysis helps to convert data into elements that describe the variables contained in the
data while inferential analysis can be used to draw out conclusions based on what was gathered as
well as to test the relationship between variables. SPSS 20.0 (Statistical Package for Social
Science) was utilized for the purpose of analyzing the data. Also, regression analysis, which
identifies cause and effect (Quinlan et al, 2019) was also applied for the purpose of testing the
hypothesis.
3.7.1 Research Hypothesis
The following null hypotheses were formulated;
1. Leadership has no significant effect on organizational culture.
2. Organizational culture provides no significant means of generating sustained competitive
advantage.
3. Organizational culture does not significantly affect organizational performance.
Page 39
39
3.7.2 Model Specification
The specified regression model for this research work was;
i. Hypothesis 1:
OC = 𝛼1 + 𝛼2LD + 𝜀
ii. Hypothesis 2:
CA = 𝛽1 + 𝛽2OC + 𝜀
iii. Hypothesis 3:
OP = 𝛾1 + 𝛾2OC + 𝜀
Where OC = Organizational Culture, LD = Leadership, CA = Competitive Advantage, OP =
Organizational Performance. Also, 𝛼1, 𝛼2, 𝛽1, 𝛽2, 𝛾1 and 𝛾2 are the regression constants while ε is
purely a white noise phenomenon which assumed to capture the influence of other exogenous
factors that are capable of influencing the dependent variable.
3.8 Ethical Considerations
The study undertaken by the researcher required access to data that touched on a sensitive aspect
of banking and its management. According to (Hammersley and Traianou, 2012, p 2), the main
ethical principles amongst others include “minimizing harm, respecting autonomy,
protecting privacy, offering reciprocity and treating people equitably”. For the purpose
of this study, the researcher decided that commercial confidentiality and informed consent
would constitute the key ethical principles that would be considered. Concerning issues on
confidentiality, the use of the collected data was limited only to the purpose of the present
study only. The respondents were also informed of the purpose of the study and how the data
will be handled. Although this need may never arise, the participants were informed that, in a case
where the provided information would be required for other research purposes; their approval
will be sought. The researcher also took measures to ensure that the participants’ identities were
protected. The data collected were securely stored within the SPSS software. Coupled with that,
the respondents were also protected through Google Form’s privacy policy, that only allowed the
Page 40
40
analysis of the collected data after the identities of the respondents have been
anonymized. Concerning informed consent, the action of an individual who clicked on the
questionnaire link, after reading the requirements of the survey, indicated the acceptance and
willingness of that respondent in participating in the exercise.
3.9 Research Limitations
Over the years, the number of studies on the organizational culture and performance link has
increased rapidly and through the use of survey methodologies, scholars have reached conclusions
that assert the presence of a positive relationship between the two constructs either directly or
indirectly (Denison et al, 2014). However, as with every other research work, these studies were
characterized by limitations, of which this current study was no different. Firstly, this research
work was a cross-sectional study since it was carried out over a short period of time without the
consideration of any subsequent string of events or occurrences (Levin, 2006). However, it has
been argued that cross-sectional measurements of organizational culture and performance link are
not as robust as that of longitudinal assessments, as the former does not have the ability to indicate
the exact nature of the relationship between the two constructs (Van Den Berg and Wilderom,
2004). Secondly, the questionnaire design was another form of limitation as the researcher
assumed it was very likely that the items may not have structured properly in order to capture
precisely the desired responses for the purpose of investigating the research problem at hand in an
effective manner. Finally, the time constraints imposed on the project was another limitation as
the researcher was compelled to work within the time limits given. This may have affected the
richness of the results as more responses could have been collected and analyzed, to make the
findings more robust and accurate.
The next chapter provides an analysis of the data collected with the questionnaire research
instrument, which would then lead to a presentation of the research findings.
Page 41
41
4.0 Data Presentation and Analysis
4.1 Introduction
This chapter provides the presentation and analysis of data collected from the survey conducted
for the purpose of the research. As mentioned in the previous chapters, the aim of this research
project is to investigate the impact of organizational culture on organizational performance in
banks located in Nigeria, precisely Lagos state. Based on the survey design adopted, the research
instrument used for data collection was the questionnaire, which had 44 items. Out of the
determined sample size of 400, 160 respondents participated in the survey, which constituted a
40% response rate.
This chapter provides an analysis of data obtained from the respondents, which is presented using
descriptive and inferential analysis. By using descriptive analysis, the data obtained was
summarized in percentages and one sample t-test while the three hypotheses were tested using the
regression statistics. It is also structured into three sections; the first section presents the
distribution of respondents’ socio-demographic characteristics; the second section covers
the descriptive analysis of the research constructs; while the third section contains the results
derived from testing the hypotheses.
4.2 Presentation and Analysis of Questionnaire
Table 1 below shows that majority of the respondents in this survey were males as compared
to females, for a total of 57.5% of males and 42.5% percentage of females participated in
the survey. These figures suggest that both genders were adequately represented. The age
distribution of the respondents shows that 1.9% of the respondents were within 18 – 20
years, 45.0% of the respondents were within the age range of 21-30 years, 41.3% were within the
age range of 31-40 years, 1.3% in the age range of 41-50 while the remaining 10.6% were above
50 years. It was therefore deduced that employees in the banking industries are very young and
economically active. From the above Table 1, majority of the respondents fell under the category
of B.sc and M.sc level of studies taking a percentage of 48.1% and 42.5% respectively,
5.6% were categorized in the ND/HND level of study while 3.8 were Ph.D. holders. Hence, it
was assumed that the survey population were literate and expected to provide an objective
assessment of the issues raised in the research instrument. In other words, valid
information was likely to be extracted from these set of respondents.
Page 42
42
Table 1: Respondents’ Socio-Demographic Information
Variables Response Label Frequency Percentages
Gender
Male 92 57.5
Female 68 42.5
Age (In years)
18-20 3 1.9
21-30 72 45.0
31-40 66 41.3
41-50 2 1.3
Above 50 17 10.6
Level of education
ND/HND 9 5.6
B.sc 77 48.1
M.sc 68 42.5
PhD 6 3.8
Working experience (In
years)
Less than 1 3 1.9
1-10 107 66.9
11-20 50 31.3
Management Level
Top-Level Management 33 20.6
Page 43
43
Middle-Level
Management
59 36.9
Working-Level employees 68 42.5
Department
Information technology 31 19.4
Human resource 19 11.9
Marketing/Sales 40 25.0
Finance 22 13.8
Operations 19 11.9
Others 29 18.1
Source: Researcher’s Field Survey, 2019.
Furthermore, the above table shows that majority of the respondents had worked for about 1 – 10
years, thereby taking a percentage of 66.9%, 31.3% had worked for 11-20 years while the
remaining 1.9% of them had worked for less than a year. These figures imply that majority of the
respondents had accumulated significant years of experience in the banking sector. Thus, it
was deduced that these set of respondents were expected to provide relevant and valid information
for the subject matter of study, as they were assumed to have an in-depth understanding of the
issues raised in the subject matter. Finally, table 1 revealed that 42.5% of the
respondents were working-level employees, 36.9% were middle management staffs, while the top
management staffs was a percentage of 20.6%. Also, table 1 shows that 19.4% of the
respondents were working in the information technology department, 11.9% were under the
HumanResourcedepartment, 25.0% for marketing/sales department, 13.8% for finance departme
nt,11.9% for operations department while the remaining 18.1% were accounted to other
departments.
4.3 Analysis of the questionnaire items represented in percentages and mean scores
The questionnaire items are summarized using the percentages and mean score. As regards the
tables below, the calibrations are as follows: 1= Strongly Disagree, 2 = Disagree, 3 = Partially
Page 44
44
Disagree, 4=Undecided, 5= Partially Agree, 6=Agree and 7= Strongly Agree. Any mean score
below ‘4’ implies a Partially Disagree, Disagree, or Strongly Disagree which means that the
respondents do not agree with the statement, while any mean score above ‘4’ implies Partially
Agree, Agree, or Strongly Agree; meaning that the respondents agree with the statement.
In addition, the one sample test statistics and test of significance was also performed on the
questionnaire items on each construct in order to ascertain the overall response and to draw a
conclusion based on the mean score derived. It must be reiterated that any mean score below or
above 4 means that the respondents either disagree or agree with the statements. The purpose of
conducting a one sample t-test is to establish whether the sample drawn came from a population
with a specific mean.
4.3.1 Questionnaire items addressing Organizational Culture construct
The results derived from analysing the questionnaire items as shown in table 1a below is presented
using percentages and mean scores. It is evident from the result that the mean score for all the
variables is rated above ‘4’ which is the stipulated benchmark for accepting the statement. In
summary, the result shows that Nigerian banks are flexible in operating procedures and policies;
employees are given the freedom to work independently; that management encourages innovative
approaches towards business operations and initiatives; that the organization believes success
depends on a clear system of rules being in place and respected; that employees treat each other
based on fairness and respect; that there is high priority placed on the enforcement of the rules,
obligations, and values of the organization; that employees are given clear instructions and support
in performing tasks and duties; that senior managers follow and enforce high ethical standards
and practices; that most staff members adhere strictly to the organizational code of ethics; that
management and staff members do not accept gratification of any kind from satisfied customers
and that exploiting one's personal power or influence is not tolerated.
Page 45
45
Table 1a: Distribution of mean scores and percentages on the Organizational
Culture construct
Variables
Scale Level
Mean
Std. Dev
SD D PD U PA A SA
% % % % % % %
My organization is flexible in its
operating policies and procedures.
5.6 21.3 6.9 3.8 13.8 31.9 16.9 4.6188 1.99960
In my organization, employees are
given the freedom to work
independently
1.9 7.5 2.5 1.3 13.8 49.4 23.8 5.6063 1.47557
My organization encourages
innovative approaches towards
business operations and initiatives.
2.5 16.9 8.1 1.3 5.0 35.6 30.6 5.1875 1.95608
My organization believes success
depends on a clear system of rules
being in place and respected.
3.1 14.4 6.3 3.1 18.1 31.3 23.8 5.0750 1.83107
In my organization, employees treat
each other based on fairness and
respect.
2.5 10.6 3.1 1.9 20.0 39.4 22.5 5.3438 1.64086
There is high priority placed on the
enforcement of the rules,
obligations and values of
the organization
.6 9.4 11.3 2.5 15.6 41.9 18.8 5.2375 1.59594
In my organization, employees are
given clear instructions and support
in performing tasks and duties.
2.5 13.8 4.4 1.9 13.1 37.5 26.9 5.2938 1.79306
Senior managers at
my organization follow and enforce
high ethical standards and
practices.
4.4 11.9 5.0 1.3 14.4 36.3 26.9 5.2563 1.83689
Most staff members adhere strictly
to organizational code of ethics
9.4 8.1 5.6 3.1 17.5 44.4 11.9 4.9188 1.84960
Page 46
46
Management and staff members do
not accept gratification of any kind
from satisfied customers
11.9 15.0 9.4 6.3 8.8 29.4 19.4 4.5063 2.13092
In my organization, exploiting one's
personal power or influence is not
tolerated
5.6 15.0 9.4 5.0 13.1 33.8 18.1 4.7875 1.92758
Source: Researcher’s Field Survey, 2019.
4.3.1.1 One Sample Test Statistics and Test of Significance
The result of the one sample t-test performed on the organizational culture construct is presented
in table 1b, with the result showing that respondents agree to the existence of a positive culture in
Nigerian banks.
Table 1b: One sample Statistics and one sample test for Organizational Culture
One-Sample Statistics
N Mean Std. Deviation Std. Error Mean
Organizational Culture 160 5.0756 1.17142 .09261
One-Sample Test
Test Value = 4
t df
Sig.(2-
tailed)
Mean
Difference
95% Confidence Interval
of the Difference
Lower Upper
Organizational Culture 11.614 159 .000 1.07557 .8927 1.2585
4.3.2 Questionnaire items addressing the Leadership construct
The results derived from analysing the questionnaire items as shown in table 2a below is presented
using percentages and mean scores. It is evident from the result that the mean score for all the
variables is rated above ‘4’ which the stipulated benchmark for accepting the statement. In
summary, the result shows that the top management in Nigerian banks include employees in
critical decision-making processes; that managers encourage employees to generate new ideas and
Page 47
47
strategies that would promote organizational growth; that the management enforce rules on the
employees; that the management show faith in the capacity of employees to succeed; that the
managers show acceptance and positive regard for others; that the managers are polite and
considerate; that employees are allowed to have direct influence on their work; that the superiors
set goals that are ambitious but realistic; that the needs of employees are considered when major
decisions are made about them; that the managers provide support whenever it is needed and that
the managers clarify goals, expectations and work methods
Table 2a: Distribution of mean scores and percentages on the Leadership construct
Variables
Scale Level
Mean
Std. Dev
SD D PD U PA A SA
% % % % % % %
In my organization, the top
management include employees in
critical decision-making processes.
18.1 15.0 11.3 2.5 16.9 26.3 10.0 4.0375 2.11876
Managers encourage employees to
generate new ideas and strategies
that would
promote organizational growth.
3.1 13.8 7.5 .6 8.8 39.4 26.9 5.2375 1.86489
In my organization, the
management enforce rules on the
employees.
3.1 23.1 6.9 4.4 14.4 36.3 11.9 4.6000 1.89737
The Management show faith in the
capacity of employees to succeed.
1.9 2.5 6.9 2.5 15.0 52.5 18.8 5.5875 1.32886
I show acceptance and positive
regard for others.
.6 .6 1.3 0.0 13.8 56.9 26.9 6.0375 .88230
I am polite and considerate. 0.0 .6 .6 .6 16.9 49.4 31.9 6.0938 .81493
Employees at my organization are
allowed to have direct influence on
their work.
.6 6.3 9.4 4.4 20.0 43.8 15.6 5.3063 1.43626
My superiors set goals that are
ambitious but realistic.
10.0 12.5 3.8 1.3 13.1 40.6 18.8 4.9188 2.01557
Page 48
48
The needs of employees are
considered when major decisions
are made about them.
7.5 13.1 8.8 2.5 16.3 40.6 11.3 4.7375 1.88835
I provide support whenever it is
needed.
0.0 0.0 2.5 0.0 13.8 57.5 26.3 6.0500 .79146
I clarify goals, expectations and
work methods
0.0 0.0 1.9 3.8 15.6 62.5 16.3 5.8750 .79107
Source: Researcher’s Field Survey, 2019.
4.3.2.1 One Sample Test Statistics and Test of Significance
The result of the one sample t-test performed on the leadership construct is presented in table 2b
below, with the result showing that respondents agree to the existence of progressive leadership
practices in Nigerian banks.
Table 2b: One sample Statistics and one sample test for Leadership
One-Sample Statistics
N Mean Std. Deviation Std. Error Mean
Leadership 160 5.3165 .88598 .07004
One-Sample Test
Test Value = 4
t df Sig. (2-tailed)
Mean
Difference
95% Confidence Interval of the
Difference
Lower Upper
Leadership 18.795 159 .000 1.31648 1.1781 1.4548
4.3.3 Questionnaire items addressing the Organizational performance construct
The results gotten from analysing the questionnaire items as shown in table 3a below is presented
using the percentages and mean scores. It is evident from the result that the mean score for all the
variables is rated above ‘4’ which is the stipulated benchmark for accepting the statement. In
summary, the result shows that Nigerian banks possess tangible and intangible assets that have
Page 49
49
enhanced its profitability; that there is a timely achievement of set goals by the organization; that
new product development has improved over the last three years; that there is an increased level
of successful and innovative products and services; that there has been improved effectiveness in
the organization’s operations; that there has been an increase in customer base; that the banks have
been able to meet and surpass our revenue target in the last two years; that there has been improved
profitability over the last two to three years; that there has been increased growth in market share
and that revenue has improved significantly.
Table 3a: Distribution of mean scores and percentages on
the Organization performance construct
Variables
Scale Level
Mean
Std. Dev
SD D PD U PA A SA
% % % % % % %
My organization possesses tangible
and intangible assets that has
enhanced its profitability.
1.3 1.9 3.1 3.1 10.0 44.4 36.3 5.9688 1.22048
There is a timely achievement of set
goals by the organization.
0.0 8.8 4.4 1.9 20.0 53.8 11.3 5.3938 1.35097
In my organization, new product
development has improved over the
last three years.
.6 6.3 3.1 5.6 14.4 52.5 17.5 5.5438 1.33575
There is an increased level of
successful and innovative products
and services provided by
my organization.
1.3 6.9 5.0 6.3 12.5 53.1 15.0 5.4125 1.43359
There has been improved
effectiveness in
the organization’s operations.
1.9 6.3 4.4 3.8 15.0 56.9 11.9 5.4188 1.39844
In my organization, there has been an
increase in our customer base.
0.0 5.6 3.8 3.8 10.6 60.6 15.6 5.6375 1.23618
We have been able to meet and
surpass our revenue target in the last
two years.
.6 9.4 5.0 8.1 15.0 49.4 12.5 5.2563 1.47195
Page 50
50
There has been improved
profitability over the last two to three
years
.6 10.0 2.5 7.5 10.6 54.4 14.4 5.3813 1.47034
In my organization, there has been
increased growth in market share.
1.3 8.1 1.9 10.0 11.3 56.3 11.3 5.3563 1.41576
Our revenue has improved
significantly.
1.3 6.9 3.8 10.0 10.0 53.8 14.4 5.3938 1.42792
Source: Researcher’s Field Survey, 2019.
4.3.3.1 One Sample Test Statistics and Test of Significance
The result of the one sample t-test performed on the organizational performance construct is
presented in table 3b below, with the result showing that respondents agree to the existence of
significant organizational performance in Nigerian banks.
Table 3b: One sample Statistics and one sample test for Organizational Performance
One-Sample Statistics
N Mean Std. Deviation Std. Error Mean
Organizational Performance 160 5.4763 1.15413 .09124
One-Sample Test
Test Value = 4
t Df
Sig. (2-
tailed)
Mean
Difference
95% Confidence Interval
of the Difference
Lower Upper
Organizational Performance 16.180 159 .000 1.47625 1.2960 1.6565
4.3.4 Questionnaire items addressing the Competitive advantage construct
The results derived from analysing the questionnaire items as shown in table 4a below is presented
using percentages and mean scores. It is evident from the result that the mean score for all the
variables is rated above ‘4’ which is the stipulated benchmark for accepting the statement. In
Page 51
51
summary, the result shows that Nigerian banks are lucrative for investment due to the high ethical
standards & practices maintained by top management; that its tangible and intangible assets protect
it from unfavorable competition from its rivals; that their overall financial rating has increased
over the years; that their values have contributed to the attraction and retention of customers; that
their products and services are succeeding thereby increasing competitive advantage in the
marketplace; that they respond promptly to market changes; that the teamwork and unique skills
of employees have contributed to the success of the organization; that the level of customer
satisfaction has increased in the last two years; that there is an increase in customer referrals to our
products and services; that their customer base has increased in the last one year and that their
products and services are highly rated.
Table 4a: Distribution of mean scores and percentages on the Competitive
Advantage construct
Variables
Scale Level
Mean
Std.
Dev SD D PD U PA A SA
% % % % % % %
Investors perceive our organization as
lucrative for investment due to the high
ethical standards & practices maintained
by top management.
3.8 12.5 3.8 11.3 11.9 36.3 20.6 5.0625 1.78635
My organization’s tangible and intangible
assets protects it from unfavorable
competition from its rivals.
1.9 6.9 4.4 10.6 8.8 43.8 23.8 5.4375 1.55279
My organization’s overall financial rating
has increased over the years.
1.3 8.1 1.3 7.5 11.3 54.4 16.3 5.4750 1.42727
My organization’s values have contributed
to the attraction and retention of
customers.
1.3 11.3 6.9 6.9 10.0 46.3 17.5 5.2188 1.63942
My organization’s products and services
are succeeding, thereby increasing
competitive advantage in the marketplace.
.6 6.3 4.4 5.0 13.1 55.0 15.6 5.5125 1.34579
My organization responds promptly to
market changes.
1.9 8.1 2.5 6.9 12.5 50.6 17.5 5.4188 1.49831
Page 52
52
The Teamwork and unique skills of
employees has contributed to the success
of the organization
0.0 1.3 .6 1.3 9.4 38.1 49.4 6.3063 .89721
The level of customer satisfaction has
increased in the last two years.
.6 8.1 1.9 6.9 11.9 55.6 15.0 5.4813 1.38260
There is an increase in customer referrals
to our products and services.
1.3 5.0 3.1 10.6 9.4 55.0 15.6 5.4938 1.35050
Our customer base has increased in the last
one year.
.6 8.8 3.1 4.4 9.4 60.0 13.8 5.4813 1.40963
Customers rate our products and services
highly.
.6 8.1 1.9 4.4 11.3 58.1 15.6 5.5438 1.36832
Source: Researcher’s Field Survey, 2019.
4.3.4.1 One Sample Test Statistics and Test of Significance
The result of the one sample t-test performed on the competitive advantage construct is presented
in table 4b below, with the result showing that respondents agree to the existence of strong
competitive advantage in Nigerian banks.
Table 4b: One sample Statistics and one sample test for Competitive Advantage
One-Sample Statistics
N Mean Std. Deviation Std. Error Mean
Competitive Advantage 160 5.4938 1.19690 .09462
One-Sample Test
Test Value = 4
t df
Sig. (2-
tailed)
Mean
Difference
95% Confidence Interval of
the Difference
Lower Upper
Competitive
Advantage 15.786 159 .000 1.49375 1.3069 1.6806
Page 53
53
4.4 Research Hypothesis: Results
4.4.1 Hypothesis One
H0: Leadership has no significant effect on organizational culture formation.
H1: Leadership has a significant effect on organizational culture formation.
Table 1 below presents the results of the regression analysis for leadership as a predictor
in organizational culture formation. The results in Table 1 show that the correlation coefficient
(0.846**) indicates a positive and statistically significant relationship between the predictor
(leadership) and the response variable (organizational culture formation). The R-squared statistic,
as explained by the fitted model, implies that about 71.6% of the total variation in the measure
of organizational culture formation, is explained by the variations in leadership. The ANOVA
results are statistically significant, with F-value of 397.543 and p < 0.05. The regression
coefficient, t statistic, and p-value for the model show
that leadership (β =1.118, t=19.938, p <0.05) exerts a positive and statistically significant effect
on organizational culture formation. Therefore, the null hypothesis is rejected, and hence it can be
concluded that Leadership has a significant effect on organizational culture formation.
Table 1: Regression Result for Leadership vs. Organizational Culture Formation
Model Summary
Model R R Square Adjusted R Square
Std. Error of the
Estimate
1 .846a .716 .714 .62669
a. Predictors: (Constant), Leadership
ANOVAa
Model Sum of Squares df Mean Square F Sig.
1 Regression 156.132 1 156.132 397.543 .000b
Residual 62.053 158 .393
Total 218.185 159
Page 54
54
a. Dependent Variable: Organizational Culture Formation
b. Predictors: (Constant), Leadership
Coefficientsa
Model
Unstandardized Coefficients
Standardized
Coefficients
T Sig. B Std. Error Beta
1 (Constant) -.871 .302 -2.880 .005
Leadership 1.118 .056 .846 19.938 .000
a. Dependent Variable: Organizational Culture Formation
4.4.2 Hypothesis Two
H0: Organizational culture provides no significant means of generating sustained competitive
advantage.
H1: Organizational culture provides a significant means of generating sustained competitive
advantage.
Table 2 below presents the results of the regression analysis for organizational culture as a
predictor of competitive advantage. The results in Table 2 show that the correlation coefficient
(0.646**) indicates a positive and statistically significant relationship between the predictor
(organizational culture) and the response variable (competitive advantage). The R-squared
statistic, as explained by the fitted model, implies that about 41.7% of the total variation in measure
of competitive advantage, is explained by the variations in organizational culture. The ANOVA
results are statistically significant, with F-value of 112.982 and p < 0.05. The regression
coefficient, t statistic, and p-value for the model show that organizational
culture (β =0.660, t=10.629, p <0.05) exerts a positive and statistically significant effect
on competitive advantage. Therefore, the null hypothesis is rejected, and hence, it can be
concluded that the presence of Organizational culture provides a significant means of generating
sustained competitive advantage.
Page 55
55
Table 2: Regression Result for Organizational Culture vs. Competitive Advantage
Model Summary
Model R R Square Adjusted R Square
Std. Error of the
Estimate
1 .646a .417 .413 .91683
a. Predictors: (Constant), Organizational Culture
ANOVAa
Model Sum of Squares df Mean Square F Sig.
1 Regression 94.969 1 94.969 112.982 .000b
Residual 132.810 158 .841
Total 227.779 159
a. Dependent Variable: Competitive Advantage
b. Predictors: (Constant), Organizational Culture
Coefficientsa
Model
Unstandardized
Coefficients
Standardized
Coefficients
t Sig. B Std. Error Beta
1 (Constant) 2.145 .323 6.636 .000
Organizational Culture .660 .062 .646 10.629 .000
a. Dependent Variable: Competitive Advantage
Page 56
56
4.4.3 Hypothesis Three
H0: Organizational culture has no significant effect on organizational performance.
H1: Organizational culture has a significant effect on organizational performance.
Table 3 below presents the results of the regression analysis for organizational culture as a
predictor of organizational performance. The results in Table 3 show that the correlation
coefficient (0.571**) indicates a positive and statistically significant relationship between the
predictor (organizational culture) and the response variable (organizational performance). The R-
squared statistic, as explained by the fitted model, implies that about 32.5% of the total variation
in measure of organizational performance, is explained by the variations in organizational culture.
The ANOVA results are statistically significant, with F-value of 76.246 and p < 0.05. The
regression coefficient, t statistic, and p-value for the model show that organizational
culture (β =0.562, t=8.732, p <0.05) exerts a positive and statistically significant effect
on organizational performance. Therefore, the null hypothesis is rejected, and hence it can be
concluded that Organizational culture has a significant effect on organizational performance.
Table 3: Regression Result for Organizational Culture vs. Organizational Performance
Model Summary
Model R R Square Adjusted R Square
Std. Error of the
Estimate
1 .571a .325 .321 .95086
a. Predictors: (Constant), Organizational Culture
ANOVAa
Model Sum of Squares df Mean Square F Sig.
1 Regression 68.937 1 68.937 76.246 .000b
Residual 142.853 158 .904
Total 211.790 159
Page 57
57
a. Dependent Variable: Organizational Performance
b. Predictors: (Constant), Organizational Culture
Coefficientsa
Model
Unstandardized
Coefficients
Standardized
Coefficients
t Sig. B Std. Error Beta
1 (Constant) 2.623 .335 7.824 .000
Organizational Culture .562 .064 .571 8.732 .000
a. Dependent Variable: Organizational Performance
Summary of Results
In the analysis of the questionnaire items on Organizational culture, the results demonstrate that
the bank employees agree to the presence of an enabling culture that promotes an environment for
innovativeness, cohesiveness and fair treatment. This is in line with what was suggested in the
literature that the presence of a culture with traits such as innovation and creativity can be
fundamental in the generation of organizational effectiveness (Ogbonna and Harris, 2000; Martins
and Terblanche, 2003; Szymańska, 2016; Naranjo-Valencia, Jimenez-Jimenez and Sanz-Valle,
2017).
For Leadership, the results establish that the respondents accede to the notion that their superiors
demonstrate progressive leadership practices by generating a sense of inclusiveness
and belonging as well as encouraging employees to be innovative and entrepreneurial in nature.
This finding is significant because it suggests that the presence of transformative leadership
practices encourages the development of cultural traits which influences superior organizational
effectiveness and productivity (Schönborn, 2010; Simosi and Xenikou, 2010; Acar, 2012).
For the items addressing Organizational performance and Competitive advantage, the results
reveal that employees believe that their organization enjoys significant business performance as
well as a good competitive edge in the marketplace. Likewise, this finding confirms literature
which suggests that organizational culture consists of leadership and management styles which
Page 58
58
positively impact organizational culture as well as the development of competitive advantage in
the long run (Moheno, 2013; Omoregbe and Umemezia, 2017).
The results of the hypotheses, which were tested using regression analysis demonstrates that;
i. Leadership has a significant effect on organizational culture formation in Nigerian banks
ii. Organizational culture provides a significant means of generating sustained competitive
advantage in Nigerian banks
iii. Organizational culture has a significant effect on organizational performance in Nigerian
banks.
From the above findings, it has been identified that there exist significant correlations to the key
arguments presented in the literature review chapter of this research project, which suggest the
following; that leadership can promote the formation of certain cultural elements within an
organization; that culture can create the right conditions for the growth and sustenance of
competitive advantage; and that organizational culture unequivocally drives superior business
performance.
The next chapter provides a full discussion of the findings as well as a presentation of the practical
implications and limitations of this study.
Page 59
59
5.0 Discussion, Practical Implications and Limitation
The purpose of this dissertation is to examine the impact of organizational culture on
organizational performance in banks located in Lagos state, Nigeria. For the goal of the attaining
this research aim, three sub-objectives were developed which sought to discover i) the extent to
which the formation of organizational culture is influenced by leadership ii) if the presence of
culture provides a means to generating sustained competitive advantage and iii) if organizational
culture affects organizational performance. These sub-objectives were formulated into null
hypotheses which includes that i) Leadership has no significant effect on organizational culture ii)
Organizational culture provides no significant means of generating competitive advantage and that
iii) Organizational culture does not significantly affect organizational performance. Following
data collection and analysis, three findings were made which caused the previous null hypotheses
to be rejected. In the next section, these findings will be discussed in full as well as a linkage to
the previous literatures reviewed will be attempted. Furthermore, the next two sections will
provide a brief discussion on the implications of the research findings on existing studies bothering
on the Culture-performance link as well as the limitations present in the overall study.
5.1 Discussion of Findings
There were three findings made following analysis of the data collected and analyzed during the
study. First, this study confirmed that Leadership has a significant influence on the formation of
organizational culture. This indicates that the respondents who demonstrated progressive
leadership behaviors have high likelihoods of creating an enabling atmosphere for the
development of cultural traits which include innovativeness, cohesiveness, productivity,
individuality, creativity and inclusion. Furthermore, this finding supports earlier and recent studies
on the link between culture and leadership, with conclusions that assert the presence of a strong
and positive relationship between the two concepts (Schein, 1983; Hofstede, 1990; Ogbonna and
Harris, 2000; Berson, Oreg and Dvir, 2008; Simosi and Xenikou, 2010);(Acar, 2012); (Steers and
Shim, 2013);(Warrick, 2017); Gil, Rodrigo-Moya, Morcillo-bellido (2018); (Hazana Abdullah,
Shamsuddin and Wahab, 2019). According to Ogbonna and Harris (2000), leadership can
influence the development of cultural traits such as innovation and creativity, which in turn leads
to organizational effectiveness. Similarly, (Gil et al., 2018) agrees that leadership can significantly
Page 60
60
influence the development of values and systems which can encourage the creation of an
innovative culture that generates channels and opportunities for empowerment and growth with
organizations. This finding also establishes that leadership is instrumental in the development of
a strong culture given that progressive leadership traits can help to facilitate conditions that foster
work effectiveness (Acar, 2012).
The second finding of this research supports extant literature on the role played by organizational
culture in the development of competitive advantage, with various scholars maintaining that the
presence of a strong culture is key in the development of competitive competencies which are
critical for organizations to possess for survival in today’s volatile business environment (Block,
2003; Barney, 2011; Schneider, Erhart and Macey, 2013 and Warrick, 2017). The finding
establishes that Organizational culture provides a significant means to generating sustained
competitive advantage. From the results, most of the respondents attribute the presence of cultural
traits such as innovation, creativity, sound ethics to the development of a competitive advantage
which has generated increased business product innovation and profitability as well as the
attraction and retention of customers and investors alike.
In addition, the study lends credence to the dynamic capability theory, upon which this research is
based. This theory posits that an organization’s ability to integrate, assemble and configure its
resources and competencies (which may include tangible and intangible assets) in response to
rapidly changing environments is a dynamic capability that is crucial in the development of
competitive advantage (Teece et al, 1997; (Teece, 2007). Dynamic capabilities include
organizational culture, company assets, and core competences, which are impossible to imitate
and transfer, thus creating a competitive edge in the actualization of business goals (Teece, 2007;
Barney, 2011).
Finally, the third finding showed a significant relationship between organizational culture and
organizational performance. The results presented in section 4.4.3 (Table 3) indicate that the
respondents are positive that certain elements present in their culture have enhanced profitability
due to the increased level of successful and innovative products and services, sound business ethics
that have led to the attraction and retention of customers and investors as well as the development
of teamwork encouraged by a culture that promoted feelings of oneness and belonging, which
Page 61
61
contributed to organizational effectiveness. This finding also supports empirical evidences which
maintains that organizational culture positively impacts organizational performance and thus,
generating organizational efficiency (Uddin and Hossain, 2012; Murphy et al., 2013; Boyce et al.,
2015; Kipsang, Mutiso and Mbaraka, 2015; Ofori and Sokro, 2015; Laforet, 2017; Nikpour,
2017; Omoregbe and Umemezia, 2017; Matthew.J, 2019). . According to
(Omoregbe and Umemezia, 2017), good leadership practices, continual employee training
programs and effective work processes can impact overall performance in an organization. In the
same vein, (Laforet, 2017), in his study, established that organizational culture consists of
leadership and management styles, common vision, organizational design and coordination which
significantly impacts brand and business performance. The author further stressed the
instrumentality of the C.E.O in providing the vision and guidance necessary for harnessing the
potential benefits offered by the presence of culture in an organization.
5.2 Practical Implications
This research on the impact of Organizational culture on Organizational performance proposes a
few practical implications. Firstly, it emphasizes the instrumentality of leaders in the shaping of
culture and therefore calls upon managers to be deliberate in the leadership styles which they
choose to exhibit, as this study has proven that progressive leadership behaviors stimulates the
development and assimilation of certain traits into the organization’s culture, which encourage
creativity, innovativeness, entrepreneurial behaviors amongst employees, teamwork, fair
treatment and thus, superior organizational performance.
Secondly, this study implies that, in the nearest future, organizations would have to rely seriously
on the presence of a strong culture in the pursuance of significant business performance and in the
long run, the development of competitive advantage. Furthermore, managers may soon have to
invest more time and resources towards building strong cultures that are valuable rare and
imperfectly imitable, in order to stay ahead of competition and survive in the volatile business
environment.
Overall, a strong theme that emerged, based on the findings, is the notion that culture is the “life-
force” of an organization as it determines that way employees interact, function and perform their
tasks, which inadvertently would influence organizational performance (Cooke and Rousseau,
Page 62
62
1988; Ofori and Sokro, 2015; Hopkins and Scott, 2016). Furthermore, the importance of
organizational culture is also amplified in view of recent world events such as increased
globalization, Brexit etc., which has led to the rise in more diversified workforces from different
world nationalities. The presence of a dominant culture, which forms the common pattern of
beliefs, values and behaviors can help in harmonizing an organization’s diverse pool of employees,
thereby avoiding the common challenges associated with having such diversified work forces,
which in turn creates avenues and opportunities for organizational effectiveness and efficiency.
5.3 Limitations
As mentioned in third chapter of this dissertation, the key limitations of the study are that firstly,
this research work was a cross-sectional study since it was carried out over a short period of time
without the consideration of any subsequent string of events or occurrences (Levin, 2006).
Secondly, the questionnaire design is another limitation as it is likely that the items may not have
structured properly in order to capture precisely the desired responses for the purpose of
investigating the research problem at hand in an effective manner. Finally, the time constraints
imposed on the project was another limitation as the researcher was compelled to work within the
time limits given. This may have affected the richness of the results as more responses could have
been collected and analyzed, to make the findings more robust and accurate.
In addition, the study sought to investigate the impact of organizational culture and organizational
performance in the Nigerian banking sector. This means that the findings of this research are
limited only to Nigerian banks and are not applicable to other sectors, not only in Nigeria but in
other sectors globally. Another limitation to the findings of this research can be identified in the
fact that not all participants responded to the survey, for out of the sample size of 400, only 160
completed questionnaires were collected. Although (Rowley, 2014) suggested that a 25% response
rate is valid for a sample size of 400, it is still difficult to determine if the results derived are a true
reflection of the perceived impact of culture on organizational performance, and if these results
are 100% credible.
Page 63
63
6.0 Conclusion, Recommendation and Future Research Possibilities
Overall, the findings in this primary research are broadly found to be in line with existing
literatures which argue that the presence of a strong and unifying culture can be instrumental in
the actualization of organizational goals which generates effectiveness and profitability, therefore
resulting in superior business performance and competitive advantage in the long run. The
significance of this study can be identified in the support it lends to the existing empirical studies
on the impact of organizational culture on organizational performance which asserts a significant
relationship between the two concepts. This study sought to investigate the possibility of a positive
link between organizational culture and organizational performance in Nigerian banks. In
answering the central research question, three sub-questions were devised in order to determine
the extent to which leadership affects culture formation, how culture can provide a means to
generating sustained competitive advantage as well as to examine the impact of organizational
culture on organizational performance.
From the data collected and analyzed, three major findings were made, which further strengthens
the arguments made by other researchers on the interrelation between culture and leadership,
culture and competitive advantage, as well as culture and performance. It is also crucial to note
that these findings complement each other in that they not only clearly highlight the
instrumentality of leaders in the way culture is shaped as well as the traits it would possess, but
also that good leadership is critical in harnessing the benefits of culture which can generate
superior business performance as well as a means of sustained competitive advantage in the long
run.
An important conclusion to this study is that organizational culture is a predominant factor that
can promote organizational efficiency and profitability, if the traits dominant in the culture are
those that encourage innovation, creativity, cohesiveness, fair treatment, individuality, teamwork
and a sense of belonging. In addition, the findings of this study have demonstrated the different
dynamics involved in the correlation between corporate culture and performance, which may serve
as pointers to why some certain organizations are more successful and profitable than others.
Page 64
64
In view of the above conclusions, this study recommends that management should be mindful of
the leadership characteristics they exhibit, as it has been proven that the culture of an organization
is a reflection of the examples they set, which ultimately determines if the culture established is
one that would facilitate business productivity and profitability. Another recommendation is that
management should re-evaluate their present culture for the purpose of identifying certain traits
that are detrimental while seeking ways to eliminate them and to inculcate into their culture more
positive elements that could help in creating the right environment for organizational success.
An area that emerged from this research, which warrants further study by academic scholars, is
about investigating the intricate mechanisms involved in the development of a positive type of
culture to better inform academic practitioners and managers in the corporate field on the definite
steps to take in the creation of a culture that stimulates good business performance. Finally, as
regards the limitations of this study, which were identified in the previous chapters, future research
should focus on examining the culture-performance link in other sectors asides the banking sector
as well as incorporating larger sample sizes with a higher response rate in order to obtain findings
that are more infallible, which could possibly serve as a blueprint for organizations and individuals
interested in gaining knowledge on how to attain exceptional levels of business performance.
Page 65
65
7.0 References
Abdullah, N.H., Shamsuddin, A., Wahab, E. and Hamid, N. A. (2014) ‘The Relationship between
Organizational Culture and Product Innovativeness’, Social and Behavioral Sciences. Elsevier
B.V., 129, pp. 140–147. doi: 10.1016/j.sbspro.2014.03.659.
Acar, A. Z. (2012) ‘Organizational Culture, Leadership Styles and Organizational Commitment in
Turkish Logistics Industry’, Procedia - Social and Behavioral Sciences, 58, pp. 217–226. doi:
10.1016/j.sbspro.2012.09.995.
Ahmed, M. and Shafiq, S. (2014) ‘The Impact of Organizational Culture on Organizational
Performance: A Case Study of Telecom Sector’, Global Journal of Management & Business
Research, 14(3), pp. 21–30.
Amin, N. (2017) ‘The impact of Organizational Culture on Organizational Performance: The
Mediating Role of Employee’s Organizational Commitment’, International Journal of
Organizational Leadership, 2017(6), pp. 65-72.
Barney, J.B. (1986) ‘Organizational Culture: Can It Be a Source of Sustained Competitive
Advantage?’, Academy of Management Review, 11(3), pp. 656-665.
Barney, J. B. (2011) ‘Organizational Culture: Can It Be a Source of Sustained Competitive
Advantage?’, Academy of Management Review, 11(3), pp. 656–665. doi:
10.5465/amr.1986.4306261.#
Bass, B.M. and Avolio, B.J. (1993), “Transformational leadership and organizational culture”,
Public Administration Quarterly, Vol. 17 No. 1, pp. 112-21.
Berger, J., Bayarri, M. J. and Pericchi, L. R. (2014) ‘The Effective Sample Size’, Econometric
Reviews, 33(1–4), pp. 197–217. doi: 10.1080/07474938.2013.807157.
Berson, Y., Oreg, S. and Dvir, T. (2008) ‘CEO Values, Organizational Culture and Firm
Outcomes’, Journal of Organizational Behaviour, 29, pp. 615–33.
Page 66
66
Bleady, A. and Ali, A. . (2018) ‘Dynamic Capabilties Theory: Pinning Down A Shifting Concept’,
Academy of Accounting and Financial Studies, 22(2), pp. 1–17.
Block, L. (2003) ‘The leadership-culture connection: an exploratory investigation’, Leadership &
Organization Development Journal, 24(6), pp. 318–334. doi: 10.1108/01437730310494293.
Bogdanowicz, M. (2014) ‘Organizational Culture as a Source of Competitive Advantage: a Case
Study of Telecommunication Company in Poland’, International Journal of Contemporary
Managment, 2014(Numer 13(3)), pp. 53–66. Available at:
http://www.ejournals.eu/ijcm/2014/13(3)/art/5227print/.
Bonett, D. G. and Wright, T. A. (2015) ‘Cronbach’s alpha reliability: Interval estimation,
hypothesis testing, and sample size planning’, Journal of Organizational Behavior, 36(1), pp. 3–
15. doi: 10.1002/job.1960.
Boyce, A.S., Nieminen, L.R.G., Gillespie, M.A., Ryan, A.M. and Denison, D.R. (2015) ‘Which
comes first, organisational culture or performance? A longitudinal study of causal priority with
automobile dealerships’, Journal of Organisational Behaviour, Wiley Online Library.
Byrne, J., Dwyer, T. and Doyle, D. (2019) ‘Understanding the layers of a market-oriented
organisational culture’, The Irish Journal of Management, 37(1), pp. 16–30. doi: 10.2478/ijm-
2018-0002.
Cascio, W. F. (2006) Managing Human Resources: Productivity, Quality of life, Profits. 8th
Edition. Denver: McGraw-Hill Irwin.
Cameron, K. and Freeman, S. (1991) 'Culture, congruence, strength and type: relationship to
effectiveness', Research in Organizational Change and Development, Vol. 5, pp. 23-58.
Cameron, K.S. and Quinn, R.E. (1999) 'Diagnosing and changing organizational culture. MA:
Addison-Wesley.
Central Bank of Nigeria (2019) Supervision. Available at www.cbn.gov.ng [Accessed 4 July
2019].
Page 67
67
Chenhall, R.H. (2005) ‘Integrative Strategic Performance Measurement System, Strategic
Alignment of Manufacturing, Learning and Strategic Outcomes: An Exploratory Study’,
Accounting, Organizations and Society, 30(5), pp. 395-422.
Cooke, R.A. and Rousseau, D.M. (1988) ‘Behavioural Norms and Expectations: A Quantitative
Approach to the Assessment of Organizational Culture’, Group and Organisational Studies, 13(3),
pp. 245-273.
Creswell, J.W (2003) Research Design. 2nd Edn. London: Sage Publishing.
Creswell, J.W (2019) Research Design: Qualitative, Quantitative and Mixed Methods
Approaches. 4th edn. London: Sage Publishing.
Creswell, J.W. and Miller, D.L. (2000) ‘Determining Validity in Qualitative Inquiry’, Theory into
Practice, 39(3), pp. 124-130.
Davidson, M. G. (2003) ‘The Relationship Between Organizational Culture and Financial
Performance in a South African Investment Bank. Unpublished MSc Thesis. South Africa:
University of South Africa.
Denison, D., Nieminen, L.R.G. and Kotrba, L. (2014) ‘Diagnosing Organisational Culture: A
Conceptual and Empirical Review of Culture Effectiveness Surveys’, European Journal of Work
and Organisational Psychology, pp. 1–64. doi: doi:10.1080/1359432X.2012.713173.
Deshpande´, R., Farley, J.U. and Webster, F. J. (1993) 'Corporate culture, customer orientation
and innovativeness in Japanese firm: a quadrad analysis', Journal of Marketing, Vol. 57(1), pp.
23-27.
Ezirim, E. and Nwibere, N. (2010) ‘Organizational Culture and Performance : the Nigerian
Experience’, International Journal of Business and Public Administration, 7(1), pp. 40–57.
Eisenhardt, K. M. and Martin, J. A. (2000) ‘DYNAMIC CAPABILITIES : WHAT ARE THEY ?’,
1121, pp. 1105–1121.
Gil, A.J., Rodrigo-Moya, B. and Morcillo-Bellido, J. (2018) ‘The Effect of Leadership in the
Page 68
68
Development of Innovation Capacity’, Leadership and Organization Developmental Journal,
39(6), pp. 694-711.
Hammersley, M. and Traianoa, A. (2012) Ethics and Educational Research. Available at:
www.bera.ac.uk [Accessed 14 August 2019].
Hartnell, C.A., Kinicki, A.J., Lambert, L.S., Fugate, M. and Doyle, P. (2016) ‘Do similarities or
differences between CEO leadership and organizational culture have a more positive effect on firm
performance? A test of competing predictions’, Journal of Applied Psychology, 101(6), pp. 846–
861. doi: 10.1037/apl0000083.
Hazana Abdullah, N., Shamsuddin, A. and Wahab, E. (2019) ‘Does organizational culture mediate
the relationship between transformational leadership and organizational commitment’,
International Journal of Organizational Leadership, 4(1), pp. 18–32. doi:
10.33844/ijol.2015.60344.
Hoe, J. and Hoare, Z. (2012) ‘Understanding quantitative research: part 1’, Nursing Standard,
27(15–17), pp. 52–57. Available at: http://ehis.ebscohost.com.ezproxy.endeavour.edu.au/.
Hofstede, G. (2011). Dimensionalizing Cultures: The Hofstede Model in Context. Online
Readings in Psychology and Culture, 2(1). https://doi.org/10.9707/2307-0919.1014
Hofstede, G., Neuijen, B., Ohayv, D.D. and Sanders, G. (1990), “Measuring organizational
cultures”, Administrative Science Quarterly, Vol. 35, pp. 286-316.
Hofstede, G., Hofstede, G. J. and Minkov, M. (2005) Intercultural Cooperation and Its Importance
for Survival. Available at: http://testrain.info/download/Software of mind.pdf.
Holden, M.T. and Lynch, P. (2004) ‘Choosing the Appropriate Methodology: Understanding
Research Philosophy’, The Marketing Review, 4(4), pp. 397–409. doi:
doi:10.1362/1469347042772428.
Hopkins, W. E. and Scott, S. G. (2016) ‘Values-based leadership effectiveness in culturally diverse
workplaces’, Cross Cultural and Strategic Management, 23(2), pp. 363–385. doi: 10.1108/CCSM-
11-2014-0125.
Page 69
69
Idris, I.T. and Nayan, S. (2016) ‘The Joint Effects of Oil Price Volatility and Environmental Risks
on Non-performing Loans: Evidence from Panel Data of Organization of the Petroleum Exporting
Countries’, International Journal of Energy Economics and Policy, 6(3), pp. 522-528.
Johnson, R. B. and Onwuegbuzie, A. J. (2004) ‘Mixed Methods Research: A Research Paradigm
Whose Time Has Come’, Educational Researcher, 33(7), pp. 14–26. doi:
10.3102/0013189X033007014.
Kaplan, R. S. and Norton, D. P. (2005) ‘The Balanced Scorecard: Measures that Drive
Performance’, Harvard Business Review, 83(7/8), pp. 172-180.
Khan, I.U., Usoro, A. and Majewski, G. (2010) 'An Organizational Culture Model for Comparative
Studies: A Conceptual View', International Journal of Global Business, 3(1), pp. 53-82.
Kipsang, S., Mutiso, J. and Mbaraka, R. (2015) ‘The Interdependency of Organizational Culture:
The Linkage with Change and Organisational Performance”, International Journal of Advances in
Management and Economics, 4(6), pp. 78-85.
Laforet, S. (2017) ‘Effects of organisational culture on brand portfolio performance’, 23(1).
Lee, Y. J. and Huang, C. L. (2012) ‘The Relationship between Balanced Scorecard, Intellectual
Capital, Organizational Commitment and Organizational Performance: Verifying a Mediated
Moderation Model’, American Journal of Business and Management, 1(3), pp. 140–153.
Lenth, R. V (2010) ‘Some practical guideleines for effective sample size calculation’, The
American Statistician, 55(3), pp. 187–194.
Levin, K. A. (2006) ‘Study design III: Cross-sectional studies’, Evidence-Based Dentistry, 7(1),
pp. 24–25. doi: 10.1038/sj.ebd.6400375.
Mariama-Zakari, K.P and Owusu-Ansah, W. (2013) ‘Organizational Culture and Organisational
Performance: Empirical Evidence from the Banking Industry in Ghana’, International Journal of
Business, Humanities and Technology, 3(1), pp 95-105.
Page 70
70
Martins, E. C. and Terblanche, F. (2003) Building organisational culture that stimulates creativity
and innovation, European Journal of Innovation Management. doi:
10.1108/14601060310456337.
Matthew.J (2019) ‘Employee Relations : The International Journal Article information ’:, The
International Journal, 41(3), pp. 538–551. Available at: https://doi.org/10.1108/ER-09-2017-
0219.
Minkov, M. (2018) ‘A revision of Hofstede’s model of national culture: old evidence and new data
from 56 countries’, Cross Cultural and Strategic Management, 25(2), pp. 231–256. doi:
10.1108/CCSM-03-2017-0033.
Mohelska, H. and Sokolova, M. (2015) ‘Organisational Culture and Leadership – Joint Vessels?’,
Procedia - Social and Behavioral Sciences. Elsevier B.V., 171, pp. 1011–1016. doi:
10.1016/j.sbspro.2015.01.223.
Moheno, M. J. (2013) ‘Organizational Culture: A Competitive Advantage’, Human Resources, pp.
1–10. Available at:
https://www.researchgate.net/profile/Jessica_Mendoza4/publication/260869640_Organizational_
Culture_A_Competitive_Advantage_Direccion_Estrategica/links/0deec53287f1191329000000/
Organizational-Culture-A-Competitive-Advantage-Direccion-Estrategica.pdf.
Muhammad, U.K. (2011) ‘Post-Merger Profitability: A Case of Royal Bank of Scotland (RBS)’,
International Journal of Business and Social Science, 2(5), pp. 157-162.
Murphy, P.J., Cooke, R.A. and Lopez, Y. (2013) ‘Firm Culture and Performance: Intensity’s
Effects and Limits’, Management Decision, 51(3), pp. 661-679.
Naranjo-Valencia, J. C., Jimenez-Jimenez, D. and Sanz-Valle, R. (2017) ‘Impact of Organisational
Culture on New Product Success: an Empirical Study of Spanish Firms’, European Management
Review, 14(4), pp. 377–390. doi: 10.1111/emre.12116.
National Bureau of Statistics (2019) Selected Banking Sector Data: Sectorial Breakdown of
Credits, ePayment Channels and Staff Strength (Q1 2019). Available at www.nigerianstat.gov.ng
[Accessed 4 July, 2019].
Page 71
71
Nikpour, A. (2017) ‘The impact of organizational culture on organizational performance : The
mediating role of employee ’ s organizational commitment’, 6, pp. 65–72.
Ofori, D.F. and Sokro, E. (2015) ‘Examining the Impact of Organisational Values on Corporate
Performance in Selected Ghanaian’, Global Management Journal, pp. 52–66.
Ogbonna, E. and Harris, L. (2000) ‘Managing Organizational Culture: Insights from the
Hospitality Industry’, Human Resource Management Journal, 12(1), pp. 22-53.
Ogbor, J.O. (2012) Corporate and corporate responsibility. 2nd Edition. New York: Crown
Educational Publishers.
Omoregbe, O. and Umemezia, E. (2017) ‘ORGANIZATIONAL CULTURE AND EMPLOYEE
PERFORMANCE IN’, 6(08), pp. 10–22.
Omorodion, O. and Umemezia, E. (2017) ‘Organizational Culture and Employee Performance in
the Nigerian Banking Sector’, European Journal of Business and Social Sciences, 6(8), pp. 10 –
22.
Oparanma, O.A. (2010) ‘The Organizational Culture and Corporate Performance in Nigeria’,
International Journal of African Studies, 3(4), pp. 34-40.
Parsons, T., & Shils, E. (1952). Toward a general theory of action. Cambridge, MA: Harvard
University Press
Peters, T.J. and Waterman, R.H. (1982) In search of excellence. New York: Harper and Row.
Pinho, J.C., Rodrigues, A.P. and Dibb, S. (2014) ‘The Role of Corporate Culture, Market
Orientation and Organizational Commitment in Organizational Performance: The case of Non-
profit Organizations’, Journal of Management Development, 33(4), pp. 339-374.
Polychroniou, P. and Trivellas, P. (2017) ‘The impact of strong and balanced organizational
cultures on fi rm performance’, International Journal of Quality and Service Sciences, 10(1), pp.
Page 72
72
16–35. doi: 10.1108/IJQSS-09-2016-0065.
Prentice, C.R. (2016) ‘Why So Many Measures of Non-profit Financial Performance? Analysing
and Improving the Use of Financial Measures in Non-profit Research’, Non-profit and Voluntary
Sector Quarterly, 45(4), pp. 715-740.
Quinlan, C., Babin, B., Carr, J.C, Griffin, M. and Zikmund, W.G. (2019) Business Research
Methods. 2nd edn. Andover: Cengage Learning.
Quinlan, C. (2011) Business Research Methods. Andover: Cengage Learning.
Rahi, S. (2017) ‘Research Design and Methods: A Systematic Review of Research Paradigms,
Sampling Issues and Instruments Development’, International Journal of Economics &
Management Sciences, 06(02). doi: 10.4172/2162-6359.1000403.
Rahi, S., Alnaser, F.M.I. and Ghani, M.A. (2019) 'Socio-economic Problems of Sustainable
Development, International Scientific Conference on Economic and Social Development, pp.
1135-1189.
Robbins, S. P. and Sanghi, S. (1990) Organizational Behaviour. New Delhi: Pearson Education
Inc.
Rogers, M. (2016) ‘Bureaucratic Structures and Organizational Performance: A Comparative
Study of Kampala Capital City Authority and National Planning Authority’, Journal of Public
Administration and Policy, 9(1), pp. 1-16.
Rowley, J. (2014) ‘Designing and using research questionnaires’, Management Research Review,
37(3), pp. 308–330.
Sackmann, S. A. (2011) ‘Culture and performance’ In Ashkanasy,N, Wilderom,C. and Peterson,
The handbook of organizational culture and climate. 2nd edn. CA: Sage Publications.
Saunders, M., Lewis, P. and Thornhill, A. (2019) Research Methods for Business Students"
Chapter 4: Understanding research philosophy and approaches to theory development, Research
Page 73
73
methods for business sudents. Available at:
https://www.researchgate.net/publication/330760964_Research_Methods_for_Business_Student
s_Chapter_4_Understanding_research_philosophy_and_approaches_to_theory_development.
Schein, E. H. (1983) ‘The Role of the Founder in Creating Organizational Culture’,
Organizational Dynamics, 12(1), pp. 13–28.
Schein, E.H. (2010) Organizational culture and leadership. 4th edition. San Francisco: Jossey-
Bass.
Schneider, B., Ehrhart, M.G. and Macey, W.H. (2013) ‘Organisational Culture and Climate’, The
Annual Review of Psychology, 64, pp. 361-388.
Schönborn, G. (2010) ‘Value Performance’, Zeitschrift für Psychologie / Journal of Psychology,
218(4), pp. 234–242. doi: 10.1027/0044-3409/a000033.
Shi, X. and Wang, J. (2011) ‘Interpreting Hofstede Model and GLOBE Model: Which Way to Go
for Cross-Cultural Research?’, International Journal of Business and Management, 6(5), pp. 93–
99. doi: 10.5539/ijbm.v6n5p93.
Shuen, A. and Sieber, A. (2009) ‘Orchestrating the New Dynamic Capabilities’, Expert Insight,
4(3), pp. 58–65.
Simon, A., Bartle, C., Stockport, G., Smith, B., Klobas, J.E. & Sohal, A. (2015) 'Business leaders’
views on the importance of strategic and dynamic capabilities for successful financial and non-
financial business performance', International Journal of Productivity and Performance
Management, 64(7), pp. 908-931.
Simosi, M. and Xenikou, A. (2010) ‘The role of organizational culture in the relationship between
leadership and organizational commitment: An empirical study in a Greek organization’,
International Journal of Human Resource Management, 21(10), pp. 1598–1616. doi:
10.1080/09585192.2010.500485.
Steers, R. M. and Shim, W. S. (2013) ‘Strong leaders , strong cultures : Global management
lessons from Toyota and Hyundai’, pp. 217–219.
Page 74
74
Szymańska, K. (2016) ‘Organisational culture as a part in the development of open innovation -
the perspective of small and medium-sized enterprises’, Management, 20(1), pp. 142–154. doi:
10.1515/manment-2015-0030.
Taherdoost, H. (2018) ‘Sampling Methods in Research Methodology; How to Choose a Sampling
Technique for Research’, SSRN Electronic Journal, (September). doi: 10.2139/ssrn.3205035.
Teece, D.J., Gary P. Pisano, and Amy Shuen. (1997). Dynamic capabilities and strategic
management. Strategic Management Journal. 18 (7), 509-533.
Teece, D.J. (2007) ‘EXPLICATING DYNAMIC CAPABILITIES : THE NATURE AND
MICROFOUNDATIONS OF ( SUSTAINABLE ) ENTERPRISE PERFORMANCE’, Strategic
Management Journal, 28(August), pp. 1319–1350. doi: 10.1002/smj.
Tobi, H. and Kampen, J. K. (2018) ‘Research design: the methodology for interdisciplinary
research framework’, Quality and Quantity. Springer Netherlands, 52(3), pp. 1209–1225. doi:
10.1007/s11135-017-0513-8.
Trice, H. & Beyer, J. (1993), The Cultures of Work Organizations, Prentice Hall, New Jersey.
Trompenaars, F. (1994) Riding the Waves of Culture: Understanding Cultural Diversity in
Business. N/A. London: Nicholas Brealey Publishing.
Trompenaars, F., Hampden-Turner, C. (2004), Managing people across cultures. Capstone,
Chichester.
Tuli, F. (2010) ‘The Basis of Distinction between Qualitative and Quantitative Research in Social
Science: Reflection on Ontological, Epistemological and Methological Perspectives.’, Ethiopian
Journal of Education and Science, 6(1), pp. 97–108. doi: 10.1136/bmj.2.2487.628-d.
Uddin, M.J., Luva, H.R & Hossian, S.M (2013). Impact of Organizational Culture on Employee
Performance and Productivity: A Case Study of Telecommunication Sector in Bangladesh.
International Journal of Business and Management; Vol. 8, No. 2; 2013.
Page 75
75
Van Den Berg, P. T. and Wilderom, C. P. M. (2004) ‘Defining, measuring, and comparing
organisational cultures’, Applied Psychology, 53(4), pp. 570–582. doi: 10.1111/j.1464-
0597.2004.00189.x.
Wallach, E. (1983) ‘Individuals and organizations: The cultural match’, Training and
Development Journal, 37(2), pp. 29–36.
Warrick, D. D. (2017) ‘What leaders need to know about organization culture’, Business Horizons.
‘Kelley School of Business, Indiana University’. doi: 10.1016/j.bushor.2017.01.011.
Wei L., Liu J. and Herndon N.C. (2011) ‘SHRM and Product Innovation: Testing the Moderating
Effects of Organizational Culture and Structure in Chinese Firms’, The International Journal of
Human Resource Management, 22 (1), pp. 19–33.
Xie, L. (2019) Article information : Emerald insight. doi: https://doi.org/10.1108/EJTD-06-2018-
0056.
Yilmaz, C. and Ergun, E. (2008) ‘Organizational Culture and Firm Effectiveness: An Examination
of Relative Effects of Culture Traits and the Balanced Culture Hypothesis in an Emerging
Economy’, Journal of World Business, 43, pp. 290–306.
Zheng, W. and McLean, G. N. (2010) ‘Linking Organizational Culture, Structure, Strategy, and
Organizational Effectiveness: Mediating Role of Knowledge Management’, Journal of Business
Research, 63, pp. 763–771.
Page 76
76
8.0 Appendices
Appendix one: Cover letter for online survey
Page 77
77
Appendix two: Email Cover letter
Dear Sir/Madam,
I hope this mail meets you well.
I am a master’s student at the National College of Ireland located in Dublin, Ireland, and I’m
here to solicit your help and support with my research project. This research seeks to investigate
the impact of organizational culture on organizational performance in Nigerian banks. To
achieve this, I would need you to answer a series of close-ended questions, which would serve as
the key source of data analyzed for the attainment of the research objectives.
The link below will direct you straight to the online survey, which would take less than 10
minutes to complete. Your well-thought out answers to the questions is very critical to the
quality of the overall research results. Please take note that your identities are hidden, the
collected data would be securely stored within an SPSS software and your consent will be sought
out in the event where the collected data would be used for other research purposes.
Here’s the link: https://docs.google.com/forms/d/e/1FAIpQLSdGLPT-
56tVdOlMJDV9GF6TlHQCDWLs3HA_l5XpBBQs4_vroA/viewform?embedded=true
If you have any queries, please do not hesitate to contact me or call on +3534569682.
Thanking you in anticipation of your help.
Regards,
Loretta Obijiaku.
Page 78
78
Appendix three: Research Questionnaire
QUESTIONNAIRE
Please tick (√) in the boxes provided for the most appropriate answers.
SECTION A: DEMOGRAPHIC DATA
1 Gender
Male
Female
2 Age (In years)
18-20
21-30
31-40
Above 40
3 Level of education
ND/HND
B.sc
M.sc
PhD
4. Working experience (In years)
Less than 1
1-5
6 - 10
11- 15
Above 15
Page 79
79
5. Management Level
Top-level management
Middle-level management
Working-level Employees
6. Department
Information Technology
Marketing/Sales
Customer care
Human resources
Finance
Operations
Others
SECTION B: Please indicate (tick one in each case) the extent to which you agree or disagree
with the following statements using the Likert scale below: Strongly Disagree (SD), Disagree
(D), Partially Disagree (PD), Undecided (U), Partially Agree (PA), Agree (A) and Strongly
Agree (SA)
• Organizational Culture
Item SD D PD U PA A SA
1 My organization is flexible in operating its
procedures and policies.
2 In my organization, employees are given
the freedom to work independently.
3 My organization encourages innovative
approaches towards business operations
and initiatives.
5 My organization believes success depends
on a clear system of rules being in place
and respected.
6 In my organization, employees treat each
other based on fairness and respect
Page 80
80
7 There is high priority placed on the
enforcement of the rules, obligations and
values at my organization
8 In my organization, employees are given
clear instructions and support in performing
tasks and duties
9 Senior managers at my organization follow
and enforce high ethical standards and
practices
10 Most staff members adhere strictly to
organizational code of ethics.
11 Management and staff members do not
accept gratification of any kind from
satisfied customers
• Leadership
Item SD D PD U PA A SA
1 In my organization, exploiting one’s personal
power or influence is not tolerated
2 In my organization, the top management include
employees in critical decision-making
processes.
3 My superiors encourage employees to generate
new ideas and strategies that would promote
organizational growth.
4 In my organization, the management enforce
rules on the employees
5 The management show faith in the capability of
employees to succeed.
6 I show acceptance and positive regard for
others.
7 I am polite and considerate.
8 Employees in my organization are allowed to
have direct influence on their work.
9 My superiors set goals that are ambitious but
realistic
Page 81
81
10 The needs of employees are considered when
major decisions are made about them
11 I provide support whenever it is needed
12 I clarify expectations, goals, and work methods
• Organization performance
Item SD D PD U PA A SA
1 My organization possesses tangible and
intangible assets that has enhanced its
profitability.
2 There is a timely achievement of set goals by the
organization.
3 In my organization, new product development
has improved over the last three years.
4 There is an increased level of successful and
innovative products and services provided by
my organization
5 There has been improved effectiveness in the
organization’s operations
6 In my organization, there has been increase in
our customer base.
7 We have been able to meet and surpass our
revenue target in the last two years
8 There has been improved profitability over the
last two or three years.
9 In my organization, there has been increased
growth in market share.
10 Our revenue has improved significantly.
• Competitive Advantage
Item SD D PD U PA A SA
1 Investors perceive our organization as lucrative
for investment due to the high ethical standards
Page 82
82
and practices maintained by the top
management.
2 My organization’s tangible and intangible assets
protects it from unfavorable competition from
its rivals.
3 The company’s overall financial rating has
increased over the years.
4 My organization’s values has contributed to the
attraction and retention of customers
5 My organization’s products and services are
succeeding thereby increasing competitive
advantage in the marketplace.
6 My organization responds promptly to market
changes.
7 The Teamwork and unique skills of employees
has contributed to the success of the
organization
8 The level of customer satisfaction has increased
in the last two years
9 There is an increase in customer referrals to our
products and services.
10 Our customer base has increased in the last one
year
11 Customers rate our products and services highly
Page 83
83
Appendix Four: Reliability Test Results
Reliability Test for Organizational Culture
Scale: ALL VARIABLES
N %
Valid 40 100
Excludeda 0 0
Total 40 100
Case Processing Summary
Cases
a. Listwise deletion based on all variables in the procedure.
Cronbach's Alpha
Cronbach's
Alpha Based on
Standardized
Items
N of Items
0.841 0.826 11
Reliability Statistics
Page 84
84
Item Statistics
Mean Std. Deviation N
My organisation is flexible in its
operating policies and
procedures.
4.525 1.85344 40
In my organisation, employees
are given the freedom to work
independently
5.45 1.56811 40
My organisation encourages
innovative approaches towards
business operations and
initiatives.
5.325 1.9267 40
My organisation believes
success depends on a clear
system of rules being in place
and respected.
5.45 1.35779 40
In my organisation, employees
treat each other based on
fairness and respect.
4.925 1.93996 40
There is high priority placed on
the enforcement of the rules,
obligations and values of the
organisation
5.35 1.56156 40
In my organisation, employees
are given clear instructions and
support in performing tasks
and duties.
5.15 1.86121 40
Senior managers at my
organisation follow and enforce
high ethical standards and
practices.
4.55 1.96051 40
Most staff members adhere
strictly to organisational code of
ethics
4.425 1.97273 40
Management and staff
members do not accept
gratification of any kind from
satisfied customers
3.95 2.0872 40
In my organisation, exploiting
one's personal power or
influence is not tolerated
4.2 1.98972 40
Item Statistics
Page 85
85
Inter-Item Correlation Matrix
My
organisa
tion is
flexible
in its
operatin
g
policies
and
procedur
es.
In my
organisati
on,
employee
s are
given the
freedom to
work
independe
ntly
My
organisat
ion
encourag
es
innovativ
e
approach
es
towards
business
operation
s and
initiatives
.
My
organis
ation
believes
success
depend
s on a
clear
system
of rules
being in
place
and
respecte
d.
In my
organis
ation,
employ
ees
treat
each
other
based
on
fairnes
s and
respect
.
There is
high
priority
placed
on the
enforce
ment of
the
rules,
obligatio
ns and
values of
the
organisa
tion
In my
organis
ation,
employ
ees are
given
clear
instructi
ons and
support
in
performi
ng
tasks
and
duties.
Senior
manage
rs at my
organis
ation
follow
and
enforce
high
ethical
standar
ds and
practice
s.
Most
staff
memb
ers
adhere
strictly
to
organis
ational
code of
ethics
Managem
ent and
staff
members
do not
accept
gratificati
on of any
kind from
satisfied
customer
s
In my
organisa
tion,
exploitin
g one's
personal
power or
influence
is not
tolerated
My organisation is
flexible in its
operating policies
and procedures.
1 0.19 0.288 -0.025 0.268 0.015 0.096 0.271 0.414 0.252 0.437
In my organisation,
employees are
given the freedom
to work
independently
0.19 1 0.544 -0.314 -0.014 -0.275 -0.033 -0.141 -0.188 -0.103 -0.112
My organisation
encourages
innovative
approaches
towards business
operations and
initiatives.
0.288 0.544 1 -0.293 0.446 -0.124 0.429 0.277 0.212 0.266 0.304
My organisation
believes success
depends on a
clear system of
rules being in
place and
respected.
-0.025 -0.314 -0.293 1 0.033 0.565 0.206 0.271 0.233 0.307 0.213
In my organisation,
employees treat
each other based
on fairness and
respect.
0.268 -0.014 0.446 0.033 1 0.288 0.827 0.436 0.705 0.569 0.569
There is high
priority placed on
the enforcement of
the rules,
obligations and
values of the
organisation
0.015 -0.275 -0.124 0.565 0.288 1 0.281 0.43 0.533 0.43 0.464
In my organisation,
employees are
given clear
instructions and
support in
performing tasks
and duties.
0.096 -0.033 0.429 0.206 0.827 0.281 1 0.518 0.59 0.53 0.559
Senior managers
at my organisation
follow and enforce
high ethical
standards and
practices.
0.271 -0.141 0.277 0.271 0.436 0.43 0.518 1 0.707 0.652 0.582
Most staff
members adhere
strictly to
organisational
code of ethics
0.414 -0.188 0.212 0.233 0.705 0.533 0.59 0.707 1 0.703 0.69
Management and
staff members do
not accept
gratification of any
kind from satisfied
customers
0.252 -0.103 0.266 0.307 0.569 0.43 0.53 0.652 0.703 1 0.589
In my organisation,
exploiting one's
personal power or
influence is not
tolerated
0.437 -0.112 0.304 0.213 0.569 0.464 0.559 0.582 0.69 0.589 1
Inter-Item Correlation Matrix
Page 86
86
Item-Total Statistics
Scale Mean if
Item Deleted
Scale Variance if
Item Deleted
Corrected Item-
Total Correlation
Squared
Multiple
Correlation
Cronbach's
Alpha if Item
Deleted
My organisation is
flexible in its
operating policies
and procedures.
48.775 138.64 0.364 0.461 0.841
In my organisation,
employees are
given the freedom
to work
independently
47.85 157.464 -0.05 0.46 0.866
My organisation
encourages
innovative
approaches
towards business
operations and
initiatives.
47.975 136.589 0.392 0.619 0.839
My organisation
believes success
depends on a
clear system of
rules being in
place and
respected.
47.85 149.926 0.186 0.516 0.849
In my organisation,
employees treat
each other based
on fairness and
respect.
48.375 123.42 0.714 0.831 0.81
There is high
priority placed on
the enforcement of
the rules,
obligations and
values of the
organisation
47.95 140.151 0.416 0.577 0.836
In my organisation,
employees are
given clear
instructions and
support in
performing tasks
and duties.
48.15 125.926 0.684 0.802 0.814
Senior managers
at my organisation
follow and enforce
high ethical
standards and
practices.
48.75 124.397 0.68 0.649 0.813
Most staff
members adhere
strictly to
organisational
code of ethics
48.875 119.651 0.797 0.806 0.802
Management and
staff members do
not accept
gratification of any
kind from satisfied
customers
49.35 120.9 0.712 0.598 0.81
In my organisation,
exploiting one's
personal power or
influence is not
tolerated
49.1 121.733 0.735 0.622 0.808
Item-Total Statistics
Page 87
87
Reliability Test for Leadership
Scale: ALL VARIABLES
Mean Variance Std. Deviation N of Items
53.3 157.959 12.56817 11
Scale Statistics
N %
Valid 40 100
Excludeda 0 0
Total 40 100
a. Listwise deletion based on all variables in the procedure.
Case Processing Summary
Cases
Cronbach's Alpha
Cronbach's
Alpha Based on
Standardized
Items
N of Items
0.713 0.76 11
Reliability Statistics
Page 88
88
Mean Std. Deviation N
In my organisation, the top
management include
employees in critical decision-
making processes.
3.75 2.20431 40
Managers encourage
employees to generate new
ideas and strategies that would
promote organisational growth.
5.175 1.90663 40
In my organisation, the
management enforce rules on
the employees.
4.7 1.85638 40
The Management show faith in
the capacity of employees to
succeed.
5.325 1.68534 40
I show acceptance and positive
regard for others.6.15 1.12204 40
I am polite and considerate. 6.2 0.93918 40
Employees at my organisation
are allowed to have direct
influence on their work.
5.225 1.44093 40
My superiors set goals that are
ambitious but realistic.4.25 2.29548 40
The needs of employees are
considered when major
decisions are made about
them.
3.925 2.09257 40
I provide support whenever it is
needed.6.225 0.83166 40
I clarify goals, expectations and
work methods6.05 0.8458 40
Item Statistics
Page 89
89
Inter-Item Correlation Matrix
In my
organisation, the
top management
include
employees in
critical decision-
making
processes.
Managers
encourage
employees to
generate new
ideas and
strategies that
would promote
organisational
growth.
In my
organisation, the
management
enforce rules on
the employees.
The
Managemen
t show faith
in the
capacity of
employees
to succeed.
I show
acceptance and
positive regard
for others.
I am polite
and
considerate.
Employees
at my
organisation
are allowed
to have
direct
influence on
their work.
My
superiors
set goals
that are
ambitious
but
realistic.
The needs
of
employees
are
considered
when
major
decisions
are made
about
them.
I provide
support
whenever
it is
needed.
I clarify
goals,
expectations
and work
methods
In my organisation, the top
management include
employees in critical
decision-making
1 0.114 -0.044 -0.005 -0.016 0.087 -0.119 0.347 0.202 -0.052 0.089
Managers encourage
employees to generate
new ideas and strategies
that would promote
organisational growth.
0.114 1 -0.369 0.564 0.347 0.324 0.387 0.207 0.254 0.282 0.233
In my organisation, the
management enforce rules
on the employees.
-0.044 -0.369 1 -0.025 0.108 -0.082 0.15 0.06 0.04 -0.154 -0.284
The Management show
faith in the capacity of
employees to succeed.
-0.005 0.564 -0.025 1 0.191 0.233 0.56 0.442 0.363 0.184 0.132
I show acceptance and
positive regard for others.-0.016 0.347 0.108 0.191 1 0.774 0.185 0.164 0.343 0.403 0.289
I am polite and considerate. 0.087 0.324 -0.082 0.233 0.774 1 0.155 0.44 0.478 0.597 0.536
Employees at my
organisation are allowed to
have direct influence on
their work.
-0.119 0.387 0.15 0.56 0.185 0.155 1 0.215 0.099 -0.043 -0.052
My superiors set goals that
are ambitious but realistic.0.347 0.207 0.06 0.442 0.164 0.44 0.215 1 0.73 0.373 0.495
The needs of employees
are considered when major
decisions are made about
them.
0.202 0.254 0.04 0.363 0.343 0.478 0.099 0.73 1 0.275 0.321
I provide support whenever
it is needed.-0.052 0.282 -0.154 0.184 0.403 0.597 -0.043 0.373 0.275 1 0.749
I clarify goals, expectations
and work methods0.089 0.233 -0.284 0.132 0.289 0.536 -0.052 0.495 0.321 0.749 1
Inter-Item Correlation Matrix
Page 90
90
Item-Total Statistics
Scale Mean if
Item Deleted
Scale Variance if
Item Deleted
Corrected Item-
Total Correlation
Squared
Multiple
Correlation
Cronbach's
Alpha if Item
Deleted
In my organisation, the top
management include
employees in critical
decision-making
processes.
53.225 75.051 0.147 0.301 0.738
Managers encourage
employees to generate
new ideas and strategies
that would promote
organisational growth.
51.8 69.651 0.384 0.599 0.69
In my organisation, the
management enforce rules
on the employees.
52.275 84.769 -0.079 0.446 0.762
The Management show
faith in the capacity of
employees to succeed.
51.65 68.182 0.521 0.569 0.668
I show acceptance and
positive regard for others.50.825 75.687 0.439 0.73 0.688
I am polite and
considerate.50.775 75.051 0.589 0.777 0.679
Employees at my
organisation are allowed to
have direct influence on
their work.
51.75 75.731 0.307 0.481 0.701
My superiors set goals that
are ambitious but realistic.52.725 56.461 0.689 0.77 0.623
The needs of employees
are considered when major
decisions are made about
them.
53.05 61.177 0.61 0.636 0.645
I provide support whenever
it is needed.50.75 79.064 0.389 0.67 0.698
I clarify goals, expectations
and work methods50.925 78.84 0.397 0.68 0.698
Item-Total Statistics
Page 91
91
Reliability Test for Organizational Performance
Scale: ALL VARIABLES
Mean Variance Std. Deviation N of Items
56.975 85.512 9.24728 11
Scale Statistics
N %
Valid 40 100
Excludeda 0 0
Total 40 100
Case Processing Summary
Cases
a. Listwise deletion based on all variables in
the procedure.
Cronbach'
s Alpha
Cronbach'
s Alpha
Based on
Standardiz
ed Items
N of Items
0.916 0.915 10
Reliability Statistics
Page 92
92
Item Statistics
Mean Std. Deviation N
My organisation
possesses tangible and
intangible assets that has
enhanced its profitability.
5.7 1.2237 40
There is a timely
achievement of set goals
by the organisation.
5.125 1.41761 40
In my organisation, new
product development has
improved over the last
three years.
5.575 1.48302 40
There is an increased
level of successful and
innovative products and
services provided by my
organisation.
5.2 1.65173 40
There has been improved
effectiveness in the
organisation's operations.
5.15 1.42415 40
In my organisation, there
has been an increase in
our customer base.
5.275 1.41399 40
We have been able to
meet and surpass our
revenue target in the last
two years.
4.725 1.53569 40
There has been improved
profitability over the last
two to three years
4.975 1.38652 40
In my organisation, there
has been increased
growth in market share.
4.925 1.47435 40
Our revenue has
improved significantly.4.9 1.54919 40
Item Statistics
Page 93
93
Inter-Item Correlation Matrix
My
organisation
possesses
tangible and
intangible
assets that
has enhanced
its profitability.
There is a timely
achievement of
set goals by the
organisation.
In my
organisation,
new product
development
has improved
over the last
three years.
There is an
increased
level of
successful
and
innovative
products and
services
provided by
my
organisation.
There has
been
improved
effectiveness
in the
organisation's
operations.
In my
organisation
, there has
been an
increase in
our
customer
base.
We have
been able to
meet and
surpass our
revenue
target in the
last two
years.
There has
been
improved
profitability
over the
last two to
three
years
In my
organisati
on, there
has been
increased
growth in
market
share.
Our revenue
has
improved
significantly.
My organisation
possesses tangible and
intangible assets that has
enhanced its profitability.
1 0.406 0.62 0.487 0.527 0.286 0.405 0.404 0.343 0.457
There is a timely
achievement of set goals
by the organisation.
0.406 1 0.306 0.361 0.498 0.225 0.358 0.276 0.09 0.216
In my organisation, new
product development has
improved over the last
three years.
0.62 0.306 1 0.821 0.517 0.338 0.477 0.543 0.583 0.617
There is an increased
level of successful and
innovative products and
services provided by my
organisation.
0.487 0.361 0.821 1 0.75 0.426 0.507 0.461 0.596 0.679
There has been improved
effectiveness in the
organisation's operations.
0.527 0.498 0.517 0.75 1 0.501 0.547 0.443 0.567 0.611
In my organisation, there
has been an increase in
our customer base.
0.286 0.225 0.338 0.426 0.501 1 0.638 0.579 0.625 0.692
We have been able to
meet and surpass our
revenue target in the last
two years.
0.405 0.358 0.477 0.507 0.547 0.638 1 0.779 0.727 0.775
There has been improved
profitability over the last
two to three years
0.404 0.276 0.543 0.461 0.443 0.579 0.779 1 0.689 0.787
In my organisation, there
has been increased
growth in market share.
0.343 0.09 0.583 0.596 0.567 0.625 0.727 0.689 1 0.805
Our revenue has
improved significantly.0.457 0.216 0.617 0.679 0.611 0.692 0.775 0.787 0.805 1
Inter-Item Correlation Matrix
Page 94
94
Item-Total Statistics
Scale Mean if
Item Deleted
Scale Variance
if Item Deleted
Corrected Item-
Total
Correlation
Squared
Multiple
Correlation
Cronbach's
Alpha if Item
Deleted
My organisation
possesses tangible and
intangible assets that has
enhanced its profitability.
45.85 105.772 0.569 0.559 0.914
There is a timely
achievement of set goals
by the organisation.
46.425 108.302 0.382 0.45 0.924
In my organisation, new
product development has
improved over the last
three years.
45.975 98.435 0.712 0.836 0.907
There is an increased
level of successful and
innovative products and
services provided by my
organisation.
46.35 94.592 0.755 0.869 0.904
There has been improved
effectiveness in the
organisation's operations.
46.4 98.759 0.735 0.759 0.905
In my organisation, there
has been an increase in
our customer base.
46.275 101.589 0.631 0.54 0.911
We have been able to
meet and surpass our
revenue target in the last
two years.
46.825 95.943 0.774 0.74 0.903
There has been improved
profitability over the last
two to three years
46.575 99.328 0.736 0.741 0.905
In my organisation, there
has been increased
growth in market share.
46.625 97.574 0.75 0.756 0.904
Our revenue has
improved significantly.46.65 93.721 0.849 0.838 0.898
Item-Total Statistics
Page 95
95
Reliability Test for Competitve Advantage
Scale: ALL VARIABLES
Mean Variance Std. Deviation N of Items
51.55 121.587 11.02666 10
Scale Statistics
N %
Valid 40 100
Excludeda 0 0
Total 40 100
a. Listwise deletion based on all variables in the procedure.
Case Processing Summary
Cases
Cronbach's Alpha
Cronbach's
Alpha Based
on
Standardized
Items
N of Items
0.943 0.945 11
Reliability Statistics
Page 96
96
Item Statistics
Mean Std. Deviation N
Investors perceive our organisation
as lucrative for investment due to
the high ethical standards &
practices maintained by top
management.
4.375 1.76414 40
My organisation's tangible and
intangible assets protects it from
unfavorable competition from its
rivals.
4.925 1.67006 40
My organisation's overall financial
rating has increased over the
years.
5 1.6641 40
My organisation's values has
contributed to the attraction and
retention of customers.
4.35 1.86121 40
My organisation's products and
services are succeeding thereby
increasing competitive advantage
in the marketplace.
4.95 1.60048 40
My organisation responds promptly
to market changes.4.775 1.96752 40
The Teamwork and unique skills of
employees has contributed to the
success of the organisation
6.225 0.8912 40
The level of customer satisfaction
has increased in the last two
years.
4.975 1.40489 40
There is an increase in customer
referrals to our products and
services.
5.025 1.3679 40
Our customer base has increased
in the last one year.5 1.5359 40
Customers rate our products and
services highly.4.95 1.56811 40
Page 97
97
Inter-Item Correlation Matrix
Investors
perceive our
organisation
as lucrative for
investment due
to the high
ethical
standards &
practices
maintained by
top
management.
My
organisation's
tangible and
intangible
assets protects
it from
unfavorable
competition
from its rivals.
My
organisation's
overall financial
rating has
increased over
the years.
My
organisation's
values has
contributed to
the attraction
and retention of
customers.
My
organisation's
products and
services are
succeeding
thereby
increasing
competitive
advantage in
the
marketplace.
My
organisation
responds
promptly to
market
changes.
The
Teamwork
and unique
skills of
employees
has
contributed to
the success
of the
organisation
The level of
customer
satisfaction
has
increased in
the last two
years.
There is an
increase in
customer
referrals to
our
products
and
services.
Our
customer
base has
increased
in the last
one year.
Customers
rate our
products and
services
highly.
Investors perceive our organisation
as lucrative for investment due to
the high ethical standards &
practices maintained by top
management.
1 0.558 0.716 0.896 0.561 0.609 0.304 0.511 0.57 0.52 0.665
My organisation's tangible and
intangible assets protects it from
unfavorable competition from its
rivals.
0.558 1 0.766 0.495 0.632 0.65 0.494 0.567 0.719 0.68 0.713
My organisation's overall financial
rating has increased over the
years.
0.716 0.766 1 0.662 0.751 0.822 0.64 0.746 0.743 0.702 0.816
My organisation's values has
contributed to the attraction and
retention of customers.
0.896 0.495 0.662 1 0.488 0.484 0.23 0.455 0.52 0.529 0.568
My organisation's products and
services are succeeding thereby
increasing competitive advantage
in the marketplace.
0.561 0.632 0.751 0.488 1 0.542 0.44 0.627 0.61 0.574 0.653
My organisation responds promptly
to market changes.0.609 0.65 0.822 0.484 0.542 1 0.629 0.675 0.688 0.543 0.777
The Teamwork and unique skills of
employees has contributed to the
success of the organisation
0.304 0.494 0.64 0.23 0.44 0.629 1 0.414 0.395 0.431 0.54
The level of customer satisfaction
has increased in the last two
years.
0.511 0.567 0.746 0.455 0.627 0.675 0.414 1 0.841 0.63 0.826
There is an increase in customer
referrals to our products and
services.
0.57 0.719 0.743 0.52 0.61 0.688 0.395 0.841 1 0.635 0.79
Our customer base has increased
in the last one year.0.52 0.68 0.702 0.529 0.574 0.543 0.431 0.63 0.635 1 0.575
Customers rate our products and
services highly.0.665 0.713 0.816 0.568 0.653 0.777 0.54 0.826 0.79 0.575 1
Inter-Item Correlation Matrix
Page 98
98
Item-Total Statistics
Scale Mean if
Item Deleted
Scale Variance
if Item Deleted
Corrected Item-
Total
Correlation
Squared Multiple
Correlation
Cronbach's
Alpha if Item
Deleted
Investors perceive our organisation
as lucrative for investment due to
the high ethical standards &
practices maintained by top
management.
50.175 160.302 0.75 0.858 0.938
My organisation's tangible and
intangible assets protects it from
unfavorable competition from its
rivals.
49.625 161.215 0.776 0.75 0.937
My organisation's overall financial
rating has increased over the
years.
49.55 155.587 0.929 0.894 0.931
My organisation's values has
contributed to the attraction and
retention of customers.
50.2 161.805 0.668 0.838 0.942
My organisation's products and
services are succeeding thereby
increasing competitive advantage
in the marketplace.
49.6 164.656 0.723 0.62 0.939
My organisation responds promptly
to market changes.49.775 154.487 0.788 0.769 0.937
The Teamwork and unique skills of
employees has contributed to the
success of the organisation
48.325 182.892 0.549 0.547 0.946
The level of customer satisfaction
has increased in the last two
years.
49.575 166.712 0.778 0.851 0.937
There is an increase in customer
referrals to our products and
services.
49.525 166.358 0.813 0.806 0.936
Our customer base has increased
in the last one year.49.55 166.203 0.716 0.625 0.94
Customers rate our products and
services highly.49.6 160.092 0.866 0.842 0.934
Item-Total Statistics
Page 99
99
Mean Variance Std. Deviation N of Items
54.55 196.921 14.03284 11
Scale Statistics
Page 100
100
Appendix Five: Analysis results from Demgraphic information of the Respondents
and Questionnaire Items
Frequency Table
Gender
Frequency Percent Valid Percent
Cumulative
Percent
Valid Male 92 57.5 57.5 57.5
Female 68 42.5 42.5 100.0
Total 160 100.0 100.0
Age (In years)
Frequency Percent Valid Percent
Cumulative
Percent
Valid 18-20 3 1.9 1.9 1.9
21-30 72 45.0 45.0 46.9
31-40 66 41.3 41.3 88.1
41-50 2 1.3 1.3 89.4
Above 50 17 10.6 10.6 100.0
Total 160 100.0 100.0
Level of education
Frequency Percent Valid Percent
Cumulative
Percent
Valid ND/HND 9 5.6 5.6 5.6
B.sc 77 48.1 48.1 53.8
M.sc 68 42.5 42.5 96.3
PhD 6 3.8 3.8 100.0
Total 160 100.0 100.0
Working experience (In years)
Frequency Percent Valid Percent
Cumulative
Percent
Valid Less than 1 3 1.9 1.9 1.9
1-10 107 66.9 66.9 68.8
11-20 50 31.3 31.3 100.0
Page 101
101
Total 160 100.0 100.0
Management Level
Frequency Percent Valid Percent
Cumulative
Percent
Valid Top-Level Management 33 20.6 20.6 20.6
Middle-Level Management 59 36.9 36.9 57.5
Working-Level Employees 68 42.5 42.5 100.0
Total 160 100.0 100.0
Department
Frequency Percent Valid Percent
Cumulative
Percent
Valid Information technology 31 19.4 19.4 19.4
Human resource 19 11.9 11.9 31.3
Marketing/Sales 40 25.0 25.0 56.3
Finance 22 13.8 13.8 70.0
Operations 19 11.9 11.9 81.9
Others 29 18.1 18.1 100.0
Total 160 100.0 100.0
My organization is flexible in its operating policies and procedures.
Frequency Percent Valid Percent
Cumulative
Percent
Valid Strongly Disagree 9 5.6 5.6 5.6
Disagree 34 21.3 21.3 26.9
Partially Disagree 11 6.9 6.9 33.8
Undecided 6 3.8 3.8 37.5
Partially Agree 22 13.8 13.8 51.3
Agree 51 31.9 31.9 83.1
Strongly Agree 27 16.9 16.9 100.0
Total 160 100.0 100.0
In my organization, employees are given the freedom to work independently
Frequency Percent Valid Percent
Cumulative
Percent
Valid Strongly Disagree 3 1.9 1.9 1.9
Page 102
102
Disagree 12 7.5 7.5 9.4
Partially Disagree 4 2.5 2.5 11.9
Undecided 2 1.3 1.3 13.1
Partially Agree 22 13.8 13.8 26.9
Agree 79 49.4 49.4 76.3
Strongly Agree 38 23.8 23.8 100.0
Total 160 100.0 100.0
My organization encourages innovative approaches towards business operations
and initiatives.
Frequency Percent Valid Percent
Cumulative
Percent
Valid Strongly Disagree 4 2.5 2.5 2.5
Disagree 27 16.9 16.9 19.4
Partially Disagree 13 8.1 8.1 27.5
Undecided 2 1.3 1.3 28.8
Partially Agree 8 5.0 5.0 33.8
Agree 57 35.6 35.6 69.4
Strongly Agree 49 30.6 30.6 100.0
Total 160 100.0 100.0
My organization believes success depends on a clear system of rules being in
place and respected.
Frequency Percent Valid Percent
Cumulative
Percent
Valid Strongly Disagree 5 3.1 3.1 3.1
Disagree 23 14.4 14.4 17.5
Partially Disagree 10 6.3 6.3 23.8
Undecided 5 3.1 3.1 26.9
Partially Agree 29 18.1 18.1 45.0
Agree 50 31.3 31.3 76.3
Strongly Agree 38 23.8 23.8 100.0
Total 160 100.0 100.0
In my organization, employees treat each other based on fairness and respect.
Frequency Percent Valid Percent
Cumulative
Percent
Valid Strongly Disagree 4 2.5 2.5 2.5
Disagree 17 10.6 10.6 13.1
Page 103
103
Partially Disagree 5 3.1 3.1 16.3
Undecided 3 1.9 1.9 18.1
Partially Agree 32 20.0 20.0 38.1
Agree 63 39.4 39.4 77.5
Strongly Agree 36 22.5 22.5 100.0
Total 160 100.0 100.0
There is high priority placed on the enforcement of the rules, obligations and
values of the organization
Frequency Percent Valid Percent
Cumulative
Percent
Valid Strongly Disagree 1 .6 .6 .6
Disagree 15 9.4 9.4 10.0
Partially Disagree 18 11.3 11.3 21.3
Undecided 4 2.5 2.5 23.8
Partially Agree 25 15.6 15.6 39.4
Agree 67 41.9 41.9 81.3
Strongly Agree 30 18.8 18.8 100.0
Total 160 100.0 100.0
In my organization, employees are given clear instructions and support in
performing tasks and duties.
Frequency Percent Valid Percent
Cumulative
Percent
Valid Strongly Disagree 4 2.5 2.5 2.5
Disagree 22 13.8 13.8 16.3
Partially Disagree 7 4.4 4.4 20.6
Undecided 3 1.9 1.9 22.5
Partially Agree 21 13.1 13.1 35.6
Agree 60 37.5 37.5 73.1
Strongly Agree 43 26.9 26.9 100.0
Total 160 100.0 100.0
Senior managers at my organization follow and enforce high ethical standards
and practices.
Frequency Percent Valid Percent
Cumulative
Percent
Valid Strongly Disagree 7 4.4 4.4 4.4
Disagree 19 11.9 11.9 16.3
Page 104
104
Partially Disagree 8 5.0 5.0 21.3
Undecided 2 1.3 1.3 22.5
Partially Agree 23 14.4 14.4 36.9
Agree 58 36.3 36.3 73.1
Strongly Agree 43 26.9 26.9 100.0
Total 160 100.0 100.0
Most staff members adhere strictly to organizational code of ethics
Frequency Percent Valid Percent
Cumulative
Percent
Valid Strongly Disagree 15 9.4 9.4 9.4
Disagree 13 8.1 8.1 17.5
Partially Disagree 9 5.6 5.6 23.1
Undecided 5 3.1 3.1 26.3
Partially Agree 28 17.5 17.5 43.8
Agree 71 44.4 44.4 88.1
Strongly Agree 19 11.9 11.9 100.0
Total 160 100.0 100.0
Management and staff members do not accept gratification of any kind from
satisfied customers
Frequency Percent Valid Percent
Cumulative
Percent
Valid Strongly Disagree 19 11.9 11.9 11.9
Disagree 24 15.0 15.0 26.9
Partially Disagree 15 9.4 9.4 36.3
Undecided 10 6.3 6.3 42.5
Partially Agree 14 8.8 8.8 51.3
Agree 47 29.4 29.4 80.6
Strongly Agree 31 19.4 19.4 100.0
Total 160 100.0 100.0
In my organization, exploiting one's personal power or influence is not tolerated
Frequency Percent Valid Percent
Cumulative
Percent
Valid Strongly Disagree 9 5.6 5.6 5.6
Disagree 24 15.0 15.0 20.6
Partially Disagree 15 9.4 9.4 30.0
Page 105
105
Undecided 8 5.0 5.0 35.0
Partially Agree 21 13.1 13.1 48.1
Agree 54 33.8 33.8 81.9
Strongly Agree 29 18.1 18.1 100.0
Total 160 100.0 100.0
In my organization, the top management include employees in critical decision-
making processes.
Frequency Percent Valid Percent
Cumulative
Percent
Valid Strongly Disagree 29 18.1 18.1 18.1
Disagree 24 15.0 15.0 33.1
Partially Disagree 18 11.3 11.3 44.4
Undecided 4 2.5 2.5 46.9
Partially Agree 27 16.9 16.9 63.8
Agree 42 26.3 26.3 90.0
Strongly Agree 16 10.0 10.0 100.0
Total 160 100.0 100.0
Managers encourage employees to generate new ideas and strategies that would
promote organizational growth.
Frequency Percent Valid Percent
Cumulative
Percent
Valid Strongly Disagree 5 3.1 3.1 3.1
Disagree 22 13.8 13.8 16.9
Partially Disagree 12 7.5 7.5 24.4
Undecided 1 .6 .6 25.0
Partially Agree 14 8.8 8.8 33.8
Agree 63 39.4 39.4 73.1
Strongly Agree 43 26.9 26.9 100.0
Total 160 100.0 100.0
In my organization, the management enforce rules on the employees.
Frequency Percent Valid Percent
Cumulative
Percent
Valid Strongly Disagree 5 3.1 3.1 3.1
Disagree 37 23.1 23.1 26.3
Partially Disagree 11 6.9 6.9 33.1
Undecided 7 4.4 4.4 37.5
Page 106
106
Partially Agree 23 14.4 14.4 51.9
Agree 58 36.3 36.3 88.1
Strongly Agree 19 11.9 11.9 100.0
Total 160 100.0 100.0
The Management show faith in the capacity of employees to succeed.
Frequency Percent Valid Percent
Cumulative
Percent
Valid Strongly Disagree 3 1.9 1.9 1.9
Disagree 4 2.5 2.5 4.4
Partially Disagree 11 6.9 6.9 11.3
Undecided 4 2.5 2.5 13.8
Partially Agree 24 15.0 15.0 28.8
Agree 84 52.5 52.5 81.3
Strongly Agree 30 18.8 18.8 100.0
Total 160 100.0 100.0
I show acceptance and positive regard for others.
Frequency Percent Valid Percent
Cumulative
Percent
Valid Strongly Disagree 1 .6 .6 .6
Disagree 1 .6 .6 1.3
Partially Disagree 2 1.3 1.3 2.5
Partially Agree 22 13.8 13.8 16.3
Agree 91 56.9 56.9 73.1
Strongly Agree 43 26.9 26.9 100.0
Total 160 100.0 100.0
I am polite and considerate.
Frequency Percent Valid Percent
Cumulative
Percent
Valid Disagree 1 .6 .6 .6
Partially Disagree 1 .6 .6 1.3
Undecided 1 .6 .6 1.9
Partially Agree 27 16.9 16.9 18.8
Agree 79 49.4 49.4 68.1
Strongly Agree 51 31.9 31.9 100.0
Total 160 100.0 100.0
Page 107
107
Employees at my organization are allowed to have direct influence on their work.
Frequency Percent Valid Percent
Cumulative
Percent
Valid Strongly Disagree 1 .6 .6 .6
Disagree 10 6.3 6.3 6.9
Partially Disagree 15 9.4 9.4 16.3
Undecided 7 4.4 4.4 20.6
Partially Agree 32 20.0 20.0 40.6
Agree 70 43.8 43.8 84.4
Strongly Agree 25 15.6 15.6 100.0
Total 160 100.0 100.0
My superiors set goals that are ambitious but realistic.
Frequency Percent Valid Percent
Cumulative
Percent
Valid Strongly Disagree 16 10.0 10.0 10.0
Disagree 20 12.5 12.5 22.5
Partially Disagree 6 3.8 3.8 26.3
Undecided 2 1.3 1.3 27.5
Partially Agree 21 13.1 13.1 40.6
Agree 65 40.6 40.6 81.3
Strongly Agree 30 18.8 18.8 100.0
Total 160 100.0 100.0
The needs of employees are considered when major decisions are made about
them.
Frequency Percent Valid Percent
Cumulative
Percent
Valid Strongly Disagree 12 7.5 7.5 7.5
Disagree 21 13.1 13.1 20.6
Partially Disagree 14 8.8 8.8 29.4
Undecided 4 2.5 2.5 31.9
Partially Agree 26 16.3 16.3 48.1
Agree 65 40.6 40.6 88.8
Strongly Agree 18 11.3 11.3 100.0
Total 160 100.0 100.0
Page 108
108
I provide support whenever it is needed.
Frequency Percent Valid Percent
Cumulative
Percent
Valid Partially Disagree 4 2.5 2.5 2.5
Partially Agree 22 13.8 13.8 16.3
Agree 92 57.5 57.5 73.8
Strongly Agree 42 26.3 26.3 100.0
Total 160 100.0 100.0
I clarify goals, expectations and work methods
Frequency Percent Valid Percent
Cumulative
Percent
Valid Partially Disagree 3 1.9 1.9 1.9
Undecided 6 3.8 3.8 5.6
Partially Agree 25 15.6 15.6 21.3
Agree 100 62.5 62.5 83.8
Strongly Agree 26 16.3 16.3 100.0
Total 160 100.0 100.0
My organization possesses tangible and intangible assets that has enhanced its
profitability.
Frequency Percent Valid Percent
Cumulative
Percent
Valid Strongly Disagree 2 1.3 1.3 1.3
Disagree 3 1.9 1.9 3.1
Partially Disagree 5 3.1 3.1 6.3
Undecided 5 3.1 3.1 9.4
Partially Agree 16 10.0 10.0 19.4
Agree 71 44.4 44.4 63.8
Strongly Agree 58 36.3 36.3 100.0
Total 160 100.0 100.0
There is a timely achievement of set goals by the organization.
Frequency Percent Valid Percent
Cumulative
Percent
Valid Disagree 14 8.8 8.8 8.8
Partially Disagree 7 4.4 4.4 13.1
Undecided 3 1.9 1.9 15.0
Partially Agree 32 20.0 20.0 35.0
Page 109
109
Agree 86 53.8 53.8 88.8
Strongly Agree 18 11.3 11.3 100.0
Total 160 100.0 100.0
In my organization, new product development has improved over the last three
years.
Frequency Percent Valid Percent
Cumulative
Percent
Valid Strongly Disagree 1 .6 .6 .6
Disagree 10 6.3 6.3 6.9
Partially Disagree 5 3.1 3.1 10.0
Undecided 9 5.6 5.6 15.6
Partially Agree 23 14.4 14.4 30.0
Agree 84 52.5 52.5 82.5
Strongly Agree 28 17.5 17.5 100.0
Total 160 100.0 100.0
There is an increased level of successful and innovative products and services
provided by my organization.
Frequency Percent Valid Percent
Cumulative
Percent
Valid Strongly Disagree 2 1.3 1.3 1.3
Disagree 11 6.9 6.9 8.1
Partially Disagree 8 5.0 5.0 13.1
Undecided 10 6.3 6.3 19.4
Partially Agree 20 12.5 12.5 31.9
Agree 85 53.1 53.1 85.0
Strongly Agree 24 15.0 15.0 100.0
Total 160 100.0 100.0
There has been improved effectiveness in the organization’s operations.
Frequency Percent Valid Percent
Cumulative
Percent
Valid Strongly Disagree 3 1.9 1.9 1.9
Disagree 10 6.3 6.3 8.1
Partially Disagree 7 4.4 4.4 12.5
Page 110
110
Undecided 6 3.8 3.8 16.3
Partially Agree 24 15.0 15.0 31.3
Agree 91 56.9 56.9 88.1
Strongly Agree 19 11.9 11.9 100.0
Total 160 100.0 100.0
In my organization, there has been an increase in our customer base.
Frequency Percent Valid Percent
Cumulative
Percent
Valid Disagree 9 5.6 5.6 5.6
Partially Disagree 6 3.8 3.8 9.4
Undecided 6 3.8 3.8 13.1
Partially Agree 17 10.6 10.6 23.8
Agree 97 60.6 60.6 84.4
Strongly Agree 25 15.6 15.6 100.0
Total 160 100.0 100.0
We have been able to meet and surpass our revenue target in the last two years.
Frequency Percent Valid Percent
Cumulative
Percent
Valid Strongly Disagree 1 .6 .6 .6
Disagree 15 9.4 9.4 10.0
Partially Disagree 8 5.0 5.0 15.0
Undecided 13 8.1 8.1 23.1
Partially Agree 24 15.0 15.0 38.1
Agree 79 49.4 49.4 87.5
Strongly Agree 20 12.5 12.5 100.0
Total 160 100.0 100.0
There has been improved profitability over the last two to three years
Frequency Percent Valid Percent
Cumulative
Percent
Valid Strongly Disagree 1 .6 .6 .6
Disagree 16 10.0 10.0 10.6
Partially Disagree 4 2.5 2.5 13.1
Undecided 12 7.5 7.5 20.6
Partially Agree 17 10.6 10.6 31.3
Agree 87 54.4 54.4 85.6
Strongly Agree 23 14.4 14.4 100.0
Page 111
111
Total 160 100.0 100.0
In my organization, there has been increased growth in market share.
Frequency Percent Valid Percent
Cumulative
Percent
Valid Strongly Disagree 2 1.3 1.3 1.3
Disagree 13 8.1 8.1 9.4
Partially Disagree 3 1.9 1.9 11.3
Undecided 16 10.0 10.0 21.3
Partially Agree 18 11.3 11.3 32.5
Agree 90 56.3 56.3 88.8
Strongly Agree 18 11.3 11.3 100.0
Total 160 100.0 100.0
Our revenue has improved significantly.
Frequency Percent Valid Percent
Cumulative
Percent
Valid Strongly Disagree 2 1.3 1.3 1.3
Disagree 11 6.9 6.9 8.1
Partially Disagree 6 3.8 3.8 11.9
Undecided 16 10.0 10.0 21.9
Partially Agree 16 10.0 10.0 31.9
Agree 86 53.8 53.8 85.6
Strongly Agree 23 14.4 14.4 100.0
Total 160 100.0 100.0
Investors perceive our organization as lucrative for investment due to the high
ethical standards & practices maintained by top management.
Frequency Percent Valid Percent
Cumulative
Percent
Valid Strongly Disagree 6 3.8 3.8 3.8
Disagree 20 12.5 12.5 16.3
Partially Disagree 6 3.8 3.8 20.0
Undecided 18 11.3 11.3 31.3
Partially Agree 19 11.9 11.9 43.1
Agree 58 36.3 36.3 79.4
Strongly Agree 33 20.6 20.6 100.0
Total 160 100.0 100.0
Page 112
112
My organization’s tangible and intangible assets protects it from unfavorable
competition from its rivals.
Frequency Percent Valid Percent
Cumulative
Percent
Valid Strongly Disagree 3 1.9 1.9 1.9
Disagree 11 6.9 6.9 8.8
Partially Disagree 7 4.4 4.4 13.1
Undecided 17 10.6 10.6 23.8
Partially Agree 14 8.8 8.8 32.5
Agree 70 43.8 43.8 76.3
Strongly Agree 38 23.8 23.8 100.0
Total 160 100.0 100.0
My organization’s overall financial rating has increased over the years.
Frequency Percent Valid Percent
Cumulative
Percent
Valid Strongly Disagree 2 1.3 1.3 1.3
Disagree 13 8.1 8.1 9.4
Partially Disagree 2 1.3 1.3 10.6
Undecided 12 7.5 7.5 18.1
Partially Agree 18 11.3 11.3 29.4
Agree 87 54.4 54.4 83.8
Strongly Agree 26 16.3 16.3 100.0
Total 160 100.0 100.0
My organization’s values has contributed to the attraction and retention of
customers.
Frequency Percent Valid Percent
Cumulative
Percent
Valid Strongly Disagree 2 1.3 1.3 1.3
Disagree 18 11.3 11.3 12.5
Partially Disagree 11 6.9 6.9 19.4
Undecided 11 6.9 6.9 26.3
Partially Agree 16 10.0 10.0 36.3
Agree 74 46.3 46.3 82.5
Strongly Agree 28 17.5 17.5 100.0
Total 160 100.0 100.0
Page 113
113
My organization’s products and services are succeeding thereby increasing
competitive advantage in the marketplace.
Frequency Percent Valid Percent
Cumulative
Percent
Valid Strongly Disagree 1 .6 .6 .6
Disagree 10 6.3 6.3 6.9
Partially Disagree 7 4.4 4.4 11.3
Undecided 8 5.0 5.0 16.3
Partially Agree 21 13.1 13.1 29.4
Agree 88 55.0 55.0 84.4
Strongly Agree 25 15.6 15.6 100.0
Total 160 100.0 100.0
My organization responds promptly to market changes.
Frequency Percent Valid Percent
Cumulative
Percent
Valid Strongly Disagree 3 1.9 1.9 1.9
Disagree 13 8.1 8.1 10.0
Partially Disagree 4 2.5 2.5 12.5
Undecided 11 6.9 6.9 19.4
Partially Agree 20 12.5 12.5 31.9
Agree 81 50.6 50.6 82.5
Strongly Agree 28 17.5 17.5 100.0
Total 160 100.0 100.0
The Teamwork and unique skills of employees has contributed to the success of
the organization
Frequency Percent Valid Percent
Cumulative
Percent
Valid Disagree 2 1.3 1.3 1.3
Partially Disagree 1 .6 .6 1.9
Undecided 2 1.3 1.3 3.1
Partially Agree 15 9.4 9.4 12.5
Agree 61 38.1 38.1 50.6
Strongly Agree 79 49.4 49.4 100.0
Total 160 100.0 100.0
Page 114
114
The level of customer satisfaction has increased in the last two years.
Frequency Percent Valid Percent
Cumulative
Percent
Valid Strongly Disagree 1 .6 .6 .6
Disagree 13 8.1 8.1 8.8
Partially Disagree 3 1.9 1.9 10.6
Undecided 11 6.9 6.9 17.5
Partially Agree 19 11.9 11.9 29.4
Agree 89 55.6 55.6 85.0
Strongly Agree 24 15.0 15.0 100.0
Total 160 100.0 100.0
There is an increase in customer referrals to our products and services.
Frequency Percent Valid Percent
Cumulative
Percent
Valid Strongly Disagree 2 1.3 1.3 1.3
Disagree 8 5.0 5.0 6.3
Partially Disagree 5 3.1 3.1 9.4
Undecided 17 10.6 10.6 20.0
Partially Agree 15 9.4 9.4 29.4
Agree 88 55.0 55.0 84.4
Strongly Agree 25 15.6 15.6 100.0
Total 160 100.0 100.0
Our customer base has increased in the last one year.
Frequency Percent Valid Percent
Cumulative
Percent
Valid Strongly Disagree 1 .6 .6 .6
Disagree 14 8.8 8.8 9.4
Partially Disagree 5 3.1 3.1 12.5
Undecided 7 4.4 4.4 16.9
Partially Agree 15 9.4 9.4 26.3
Agree 96 60.0 60.0 86.3
Strongly Agree 22 13.8 13.8 100.0
Total 160 100.0 100.0
Page 115
115
Customers rate our products and services highly.
Frequency Percent Valid Percent
Cumulative
Percent
Valid Strongly Disagree 1 .6 .6 .6
Disagree 13 8.1 8.1 8.8
Partially Disagree 3 1.9 1.9 10.6
Undecided 7 4.4 4.4 15.0
Partially Agree 18 11.3 11.3 26.3
Agree 93 58.1 58.1 84.4
Strongly Agree 25 15.6 15.6 100.0
Total 160 100.0 100.0
Descriptive Statistics
N Minimum Maximum Mean
Std.
Deviation
My organization is
flexible in its operating
policies and procedures.
160 1.00 7.00 4.6187 1.99960
In my organization,
employees are given the
freedom to work
independently
160 1.00 7.00 5.6063 1.47557
My organization
encourages innovative
approaches towards
business operations and
initiatives.
160 1.00 7.00 5.1875 1.95608
My organization
believes success
depends on a clear
system of rules being in
place and respected.
160 1.00 7.00 5.0750 1.83107
In my organization,
employees treat each
other based on fairness
and respect.
160 1.00 7.00 5.3438 1.64086
Page 116
116
There is high priority
placed on the
enforcement of the
rules, obligations and
values of the
organization
160 1.00 7.00 5.2375 1.59594
In my organization,
employees are given
clear instructions and
support in performing
tasks and duties.
160 1.00 7.00 5.2938 1.79306
Senior managers at my
organization follow and
enforce high ethical
standards and practices.
160 1.00 7.00 5.2563 1.83689
Most staff members
adhere strictly to
organizational code of
ethics
160 1.00 7.00 4.9187 1.84960
Management and staff
members do not accept
gratification of any kind
from satisfied customers
160 1.00 7.00 4.5062 2.13092
In my organization,
exploiting one's
personal power or
influence is not
tolerated
160 1.00 7.00 4.7875 1.92758
In my organization, the
top management include
employees in critical
decision-making
processes.
160 1.00 7.00 4.0375 2.11876
Managers encourage
employees to generate
new ideas and strategies
that would promote
organizational growth.
160 1.00 7.00 5.2375 1.86489
In my organization, the
management enforce
rules on the employees.
160 1.00 7.00 4.6000 1.89737
The Management show
faith in the capacity of
employees to succeed.
160 1.00 7.00 5.5875 1.32886
Page 117
117
I show acceptance and
positive regard for
others.
160 1.00 7.00 6.0375 .88230
I am polite and
considerate. 160 2.00 7.00 6.0938 .81493
Employees at my
organization are allowed
to have direct influence
on their work.
160 1.00 7.00 5.3063 1.43626
My superiors set goals
that are ambitious but
realistic.
160 1.00 7.00 4.9187 2.01557
The needs of employees
are considered when
major decisions are
made about them.
160 1.00 7.00 4.7375 1.88835
I provide support
whenever it is needed. 160 3.00 7.00 6.0500 .79146
I clarify goals,
expectations and work
methods
160 3.00 7.00 5.8750 .79107
My organization
possesses tangible and
intangible assets that
has enhanced its
profitability.
160 1.00 7.00 5.9688 1.22048
There is a timely
achievement of set goals
by the organization.
160 2.00 7.00 5.3938 1.35097
In my organization, new
product development
has improved over the
last three years.
160 1.00 7.00 5.5438 1.33575
There is an increased
level of successful and
innovative products and
services provided by my
organization.
160 1.00 7.00 5.4125 1.43359
There has been
improved effectiveness
in the organization’s
operations.
160 1.00 7.00 5.4187 1.39844
In my organization,
there has been an
increase in our customer
base.
160 2.00 7.00 5.6375 1.23618
Page 118
118
We have been able to
meet and surpass our
revenue target in the last
two years.
160 1.00 7.00 5.2563 1.47195
There has been
improved profitability
over the last two to
three years
160 1.00 7.00 5.3813 1.47034
In my organization,
there has been increased
growth in market share.
160 1.00 7.00 5.3563 1.41576
Our revenue has
improved significantly. 160 1.00 7.00 5.3938 1.42792
Investors perceive our
organization as lucrative
for investment due to
the high ethical
standards & practices
maintained by top
management.
160 1.00 7.00 5.0625 1.78635
My organization’s
tangible and intangible
assets protects it from
unfavorable competition
from its rivals.
160 1.00 7.00 5.4375 1.55279
My organization’s
overall financial rating
has increased over the
years.
160 1.00 7.00 5.4750 1.42727
My organization’s
values has contributed
to the attraction and
retention of customers.
160 1.00 7.00 5.2188 1.63942
My organization’s
products and services
are succeeding thereby
increasing competitive
advantage in the
marketplace.
160 1.00 7.00 5.5125 1.34579
My organization
responds promptly to
market changes.
160 1.00 7.00 5.4187 1.49831
Page 119
119
The Teamwork and
unique skills of
employees has
contributed to the
success of the
organization
160 2.00 7.00 6.3062 .89721
The level of customer
satisfaction has
increased in the last two
years.
160 1.00 7.00 5.4812 1.38260
There is an increase in
customer referrals to our
products and services.
160 1.00 7.00 5.4938 1.35050
Our customer base has
increased in the last one
year.
160 1.00 7.00 5.4812 1.40963
Customers rate our
products and services
highly.
160 1.00 7.00 5.5437 1.36832
Valid N (listwise) 160
Model Summary
Model R R Square
Adjusted R
Square
Std. Error of
the Estimate
1 .846a .716 .714 .62669
a. Predictors: (Constant), Leadership
ANOVAa
Model
Sum of
Squares df Mean Square F Sig.
1 Regression 156.132 1 156.132 397.543 .000b
Residual 62.053 158 .393
Total 218.185 159
a. Dependent Variable: Organizational Culture
b. Predictors: (Constant), Leadership
Page 120
120
Coefficientsa
Model
Unstandardized
Coefficients
Standardized
Coefficients
t Sig. B Std. Error Beta
1 (Constant) -.871 .302 -2.880 .005
Leadership 1.118 .056 .846 19.938 .000
a. Dependent Variable: Organizational Culture
Model Summary
Model R R Square
Adjusted R
Square
Std. Error of
the Estimate
1 .646a .417 .413 .91683
a. Predictors: (Constant), Organizational Culture
ANOVAa
Model
Sum of
Squares df Mean Square F Sig.
1 Regression 94.969 1 94.969 112.982 .000b
Residual 132.810 158 .841
Total 227.779 159
a. Dependent Variable: Competitive Advantage
b. Predictors: (Constant), Organizational Culture
Coefficientsa
Model
Unstandardized
Coefficients
Standardized
Coefficients
t Sig. B Std. Error Beta
1 (Constant) 2.145 .323 6.636 .000
Organizational
Culture .660 .062 .646 10.629 .000
a. Dependent Variable: Competitive Advantage