Page 1
THE IMPACT OF PERSONALITY, INFORMAL ROLES, AND TEAM INFORMAL
ROLE CONFIGURATION ON TEAM EFFECTIVENESS
A Thesis
Submitted to the Faculty
of
Purdue University
by
David E. Caughlin
In Partial Fulfillment of the
Requirements for the Degree
of
Master of Science
August 2010
Purdue University
Indianapolis, Indiana
Page 2
ii
ACKNOWLEDGMENTS
I would like to thank Dennis Devine, John Hazer, and Leslie Ashburn-Nardo for
serving on my committee and providing ongoing support during every phase of this
project, the office staff of the department for scheduling experiment rooms and lending
keys when needed, and Sarah Pinto for her assistance running participant sessions.
Page 3
iii
TABLE OF CONTENTS
Page
LIST OF TABLES ............................................................................................................. iv
LIST OF FIGURES .............................................................................................................v
ABSTRACT ....................................................................................................................... vi
CHAPTER 1. INTRODUCTION ........................................................................................1
1.1. Conceptual Framework .............................................................................................2
1.2. Previous Theory and Research ..................................................................................4
1.3. Present Study ..........................................................................................................20
CHAPTER 2. METHOD ...................................................................................................26
2.1. Participants ..............................................................................................................26
2.2. Design .....................................................................................................................26
2.3. Task .........................................................................................................................27
2.4. Measures .................................................................................................................28
2.5. Procedure ................................................................................................................34
2.6. Statistical Analyses .................................................................................................36
CHAPTER 3. RESULTS ...................................................................................................42
3.1. Preliminary Analyses ..............................................................................................42
3.2. Hypothesis Tests .....................................................................................................45
3.3. Follow-Up Analyses ...............................................................................................48
CHAPTER 4. DISCUSSION .............................................................................................51
4.1. Contributions...........................................................................................................53
4.2. Limitations and Future Research ............................................................................59
4.3. Conclusion ..............................................................................................................62
LIST OF REFERENCES ...................................................................................................64
TABLES ............................................................................................................................71
FIGURES ...........................................................................................................................82
APPENDICES
Appendix A ....................................................................................................................87
Appendix B ..................................................................................................................145
Appendix C ..................................................................................................................163
Appendix D ..................................................................................................................179
Appendix E ..................................................................................................................180
Page 4
iv
LIST OF TABLES
Table Page
Table 1 ...............................................................................................................................71
Table 2 ...............................................................................................................................72
Table 3 ...............................................................................................................................73
Table 4 ...............................................................................................................................74
Table 5 ...............................................................................................................................75
Table 6 ...............................................................................................................................76
Table 7 ...............................................................................................................................77
Table 8 ...............................................................................................................................78
Table 9 ...............................................................................................................................79
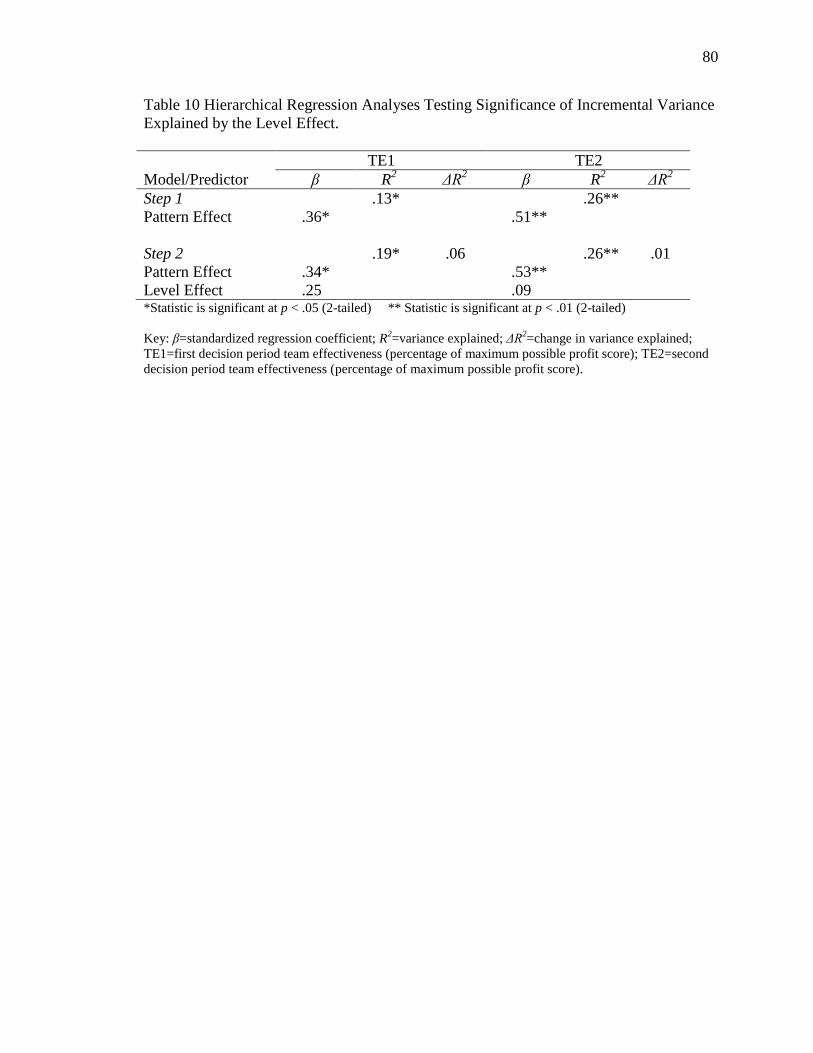
Table 10 .............................................................................................................................80
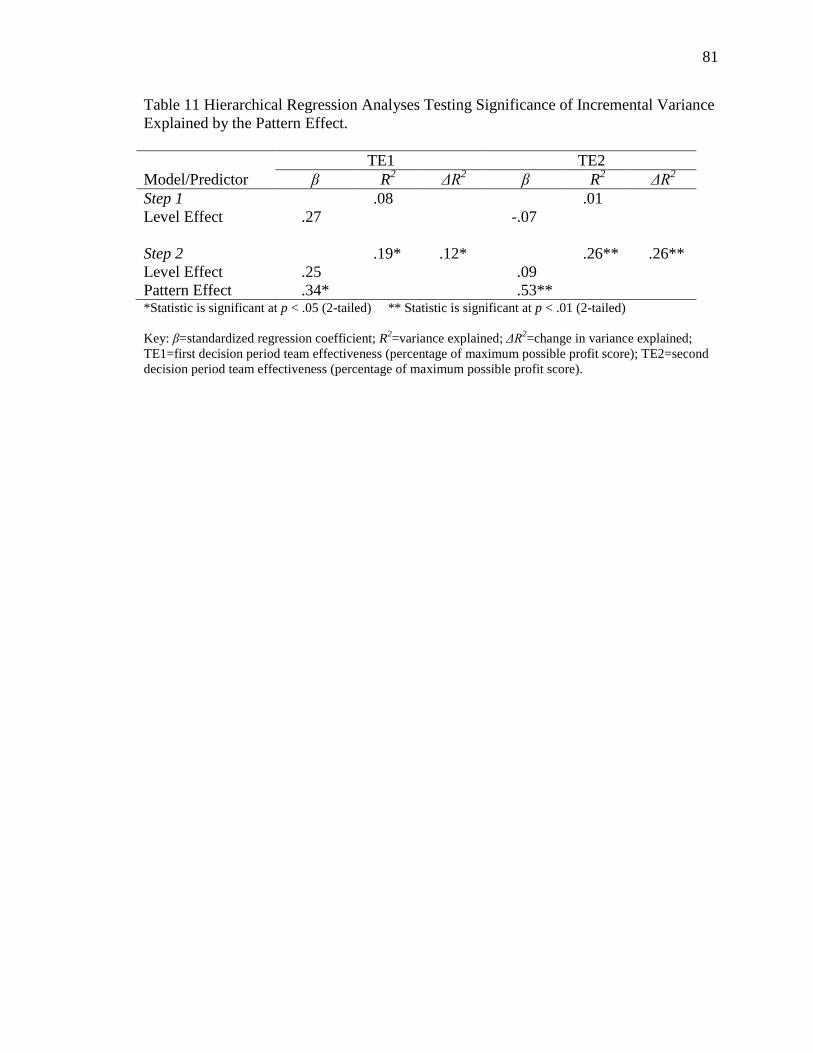
Table 11 .............................................................................................................................81
Page 5
v
LIST OF FIGURES
Figure Page
Figure 1 ..............................................................................................................................82
Figure 2 ..............................................................................................................................83
Figure 3 ..............................................................................................................................84
Figure 4 ..............................................................................................................................85
Figure 5 ..............................................................................................................................86
Page 6
vi
ABSTRACT
Caughlin, David E. M.S., Purdue University, August 2010. The Impact of Personality,
Informal Roles, and Team Informal Role Configuration on Team Effectiveness. Major
Professor: Dennis J. Devine.
As organizations use more and more work teams, selecting and assembling
effective teams is becoming increasingly important. Past research and theory has
demonstrated that informal roles serve as a critical linking mechanism between
individual-level characteristics such as personality and team-level effectiveness. The
present study builds upon this area of research and theory by testing the individual-level
link between personality and informal roles and the team-level link between team
informal role configuration and team effectiveness. These links were tested using a
sample of 152 undergraduate students participating in 38 teams of four. The teams
engaged in an information-sharing business simulation where the goal was to generate the
highest possible profits across two simulated business years. At the individual level, the
Big Five personality dimension Agreeableness positively and significantly correlated
with the adoption of the Communicator role, while the relationship between
Conscientiousness and the Contractor role approached significance. With regard to the
team level, a positive relationship was found between the number of Completer roles
performed within a team and the level of team effectiveness for the first simulated
Page 7
vii
business year, and the relationship between the total number of informal roles performed
within a team and team effectiveness in the first simulated year was found to be
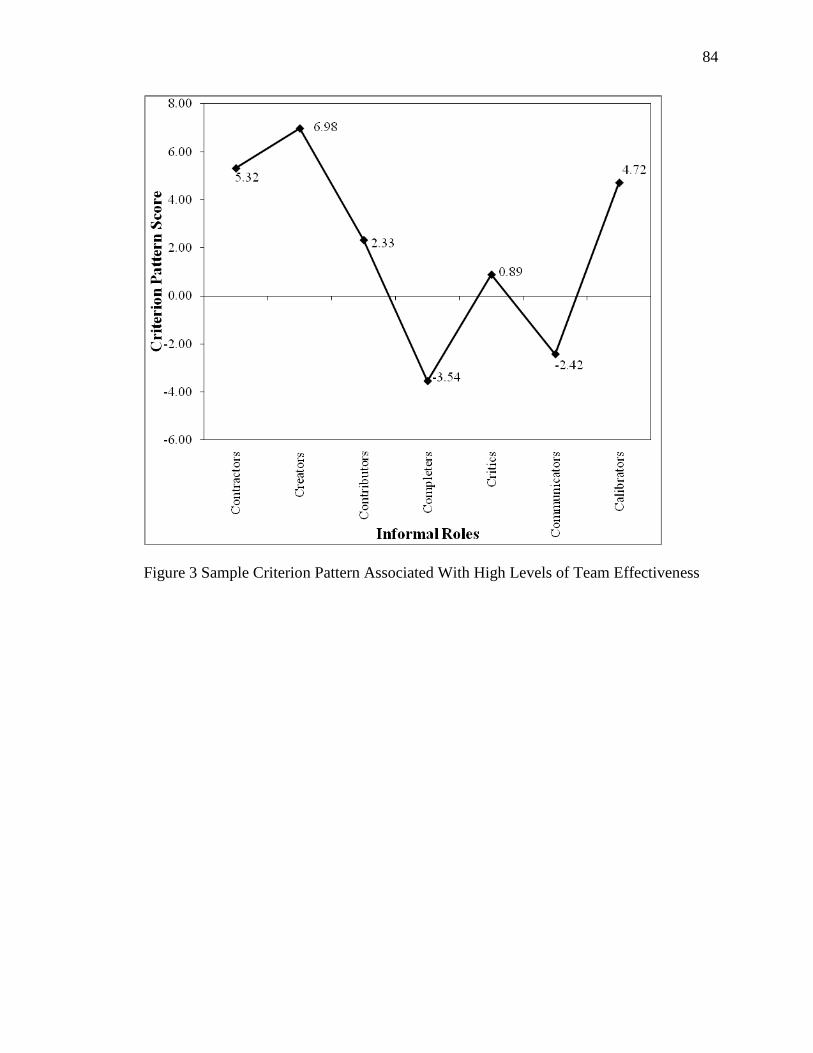
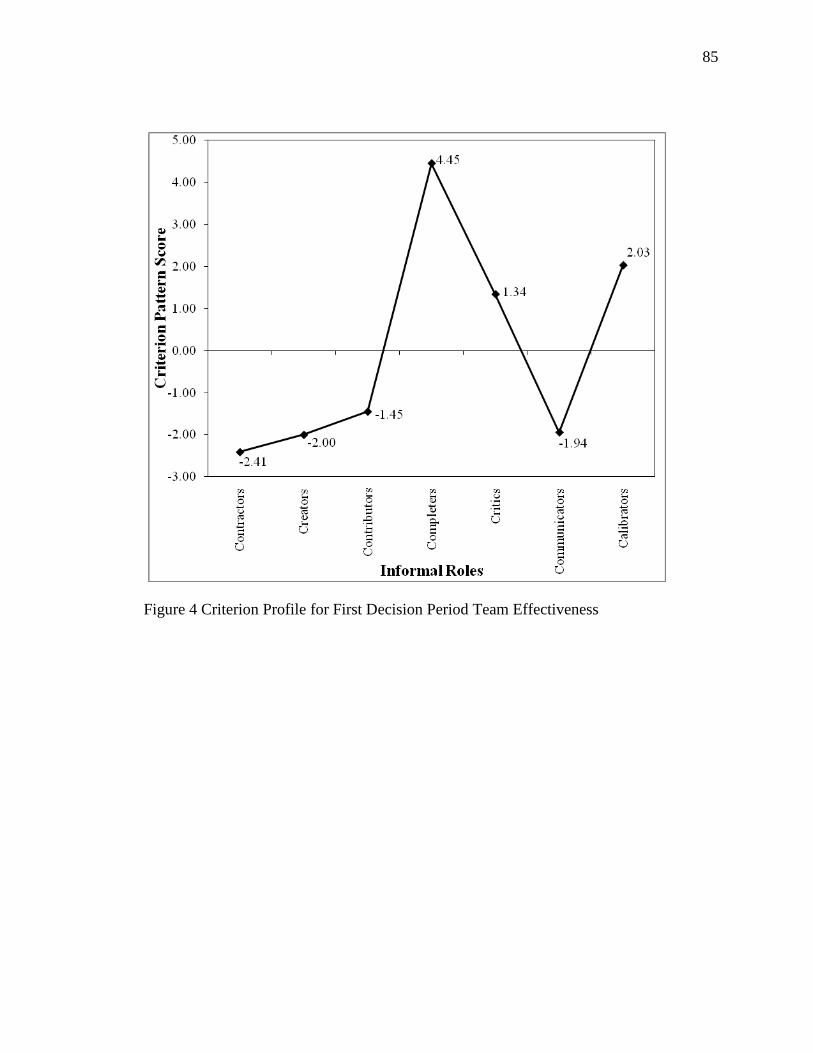
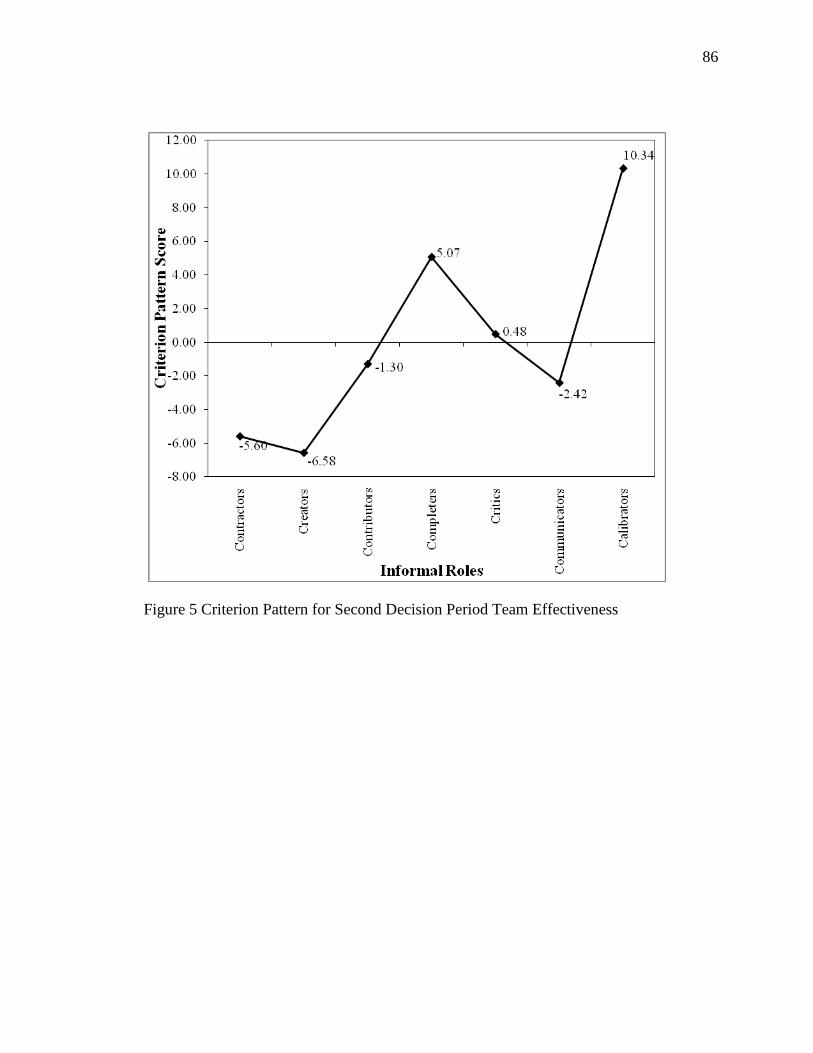
marginally significant. Using a criterion profile analysis approach, two criterion patterns
were identified in which optimal informal role configuration patterns yielded high levels
of team effectiveness. Overall, results from this study lend some support to the
demonstrated links between personality and informal roles and informal role
configuration and team effectiveness, which have important implications for
organizational selection and employee development.
Page 8
1
CHAPTER 1. INTRODUCTION
The term team refers to an interdependent collection of individuals working
together toward a shared and valued goal, objective, or mission (Hackman, 1987).
Estimates suggest that nearly half of all organizations in the United States employ at least
one or more work teams (Devine, Clayton, Philips, Dunford, & Melner, 1999). Typically,
these teams are used to accomplish tasks, meet goals, and achieve objectives (Ilgen,
Major Hollenbeck, & Sego, 1993). Teams are made up of individuals, and as these
individuals work together, they engage in behaviors that may or may not contribute to
their team‘s effectiveness. As such, there is value in investigating and identifying
behaviors that contribute to team effectiveness.
Stewart, Fulmer, and Barrick (2005) suggested informal roles serve as critical
linking mechanisms between individual characteristics (e.g., personality) and team
effectiveness, where informal roles (also referred to as team roles) are the behavioral
patterns and tendencies emerge (Forsyth, 1998; Mumford, Iddekinge, Morgeson, &
Campion, 2008; Stewart et al., 2005). At the team level, past research has demonstrated
links between a team‘s informal role configuration (i.e., the collection of all informal
roles represented within a team) and its effectiveness (e.g., Chong, 2007; Partington &
Harris, 1999; Stewart et al., 2005). At the individual level, links have been demonstrated
between an individual‘s personality and the adoption of informal roles (e.g., Blumberg,
Page 9
2
2001; Mumford et al., 2008; Stewart et al., 2005). The link between informal role
configuration and team effectiveness, however, has only been tested with roles from two
taxonomies, despite the development of several other informal role taxonomies. Further,
additional empirical support of this link could be of great practical significance. To the
extent that the informal role configuration to team effectiveness link is significant,
informal roles could be measured and developed in both new teams and existing teams to
implement and identify configurations that are likely to increase team effectiveness.
Therefore, for both theoretical and applied reasons, this area of research is
underdeveloped and in need of further investigation.
Also of practical importance is the ability to predict team members‘ adoption of
informal roles. As indicated above, one potential predictor of informal roles is
personality, which refers to a person‘s characteristic patterns of thought and behavior
(Funder, 2001). Because personality remains relatively stable across situations, one‘s
personality should influence the adoption of situation-dependent behavior clusters such as
informal roles (Stewart et al., 2005). As such, assessing a person‘s personality may prove
to be an effective way of predicting the informal roles the person will perform. In
summary, the present study will investigate if personality can be used by organizations to
develop teams in which, in terms of team effectiveness, an optimal set of informal roles is
fulfilled by team members.
1.1. Conceptual Framework
For the purposes of the present study, I have adapted the general conceptual
model presented by Stewart et al. (2005) as it addresses informal roles from a multiple
Page 10
3
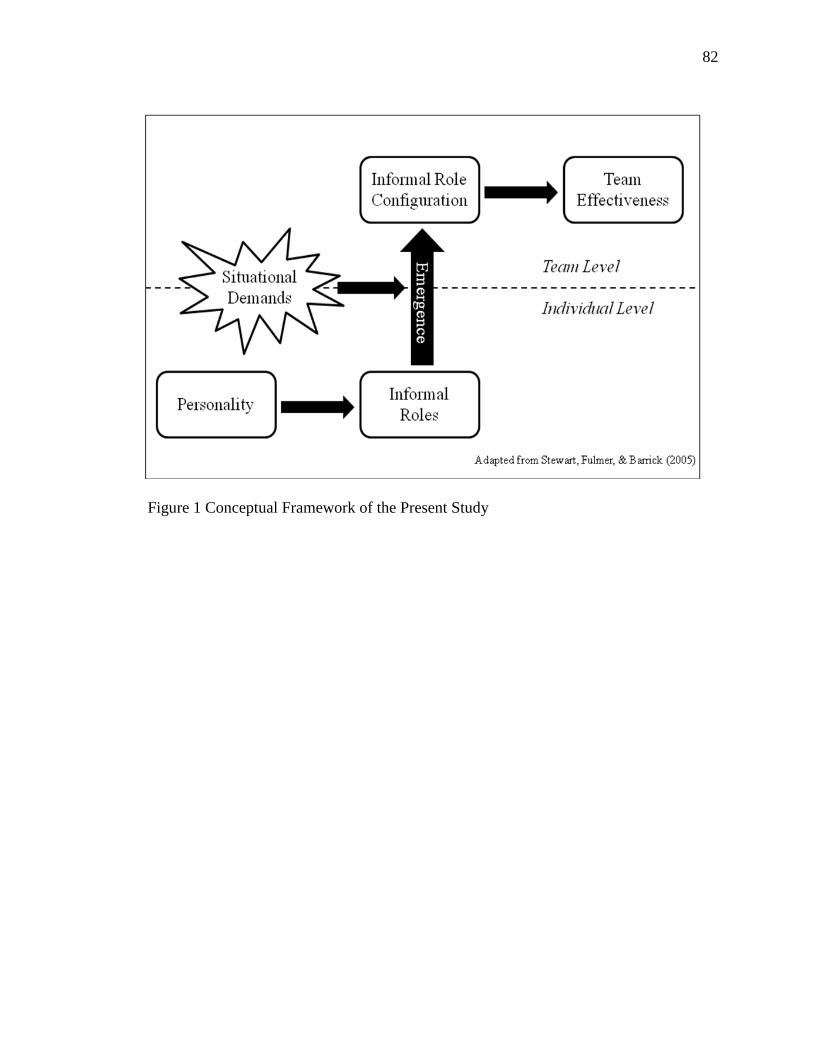
levels of analysis perspective. The model (see Figure 1) consists of four constructs linked
by arrows indicating theoretical relationships. The theoretical linkages exist in this order:
(a) personality, (b) informal roles, (c) informal role configuration, and (d) team
effectiveness. Further, it identifies constructs existing at the individual level of analysis as
well as the team level. At the individual level, the model indicates that the nature of an
individual‘s personality should influence the informal roles that he/she adopts. At the
team level, a team‘s informal role configuration is theorized to influence its degree of
team effectiveness. Between levels of analysis, situational demands represent cross-level
phenomena and, accordingly, exert influence on the emergence of individual-level
informal roles to team-level informal role configuration. Therefore, in summary, informal
roles and informal role configuration serve as linking mechanisms between personality
and team effectiveness.
The following literature review is organized into two parts in accordance with the
conceptual model. The first part investigates the team-level link between informal role
configuration and team-effectiveness by reviewing the literatures of informal roles,
informal role configuration, and team effectiveness as well as research assessing the
relationship between informal role configuration and team effectiveness. The second part
investigates the individual-level link between personality and informal roles by first
reviewing the personality literature and then reviewing research that has explored the
relationship between personality and informal roles.
Page 11
4
1.2. Previous Theory and Research
Informal Roles
Roles may be divided into two types: (a) formal and (b) informal (Hare, 1994). A
formal role corresponds to a person‘s officially designated status, position, or title within
the team and entails clusters of behaviors related to his or her official duties and
responsibilities (Hare, 1994). For example, organizations often officially appoint a person
to fill the role of team leader, and that decision is formally communicated to team
members. Therefore, a formal role corresponds to those behaviors a person is supposed to
perform. In contrast, an informal role represents a person‘s actual behavior patterns as
opposed to the duties and responsibilities that he or she is supposed to perform (Hare,
1994). In other words, formal roles prescribe how team members should behave, whereas
informal roles reflect how team members do behave.
Informal roles emerge in response to team member interactions in a specific team
context (Katz & Kahn, 1978; Stewart et al., 2005). The manner in which team members
interact is influenced by individual characteristics (e.g., personality) and situational
demands (e.g., the nature of a team‘s task, the formal roles already in place). An informal
role refers to the context-specific pattern of related behaviors that a team member adopts
as a result of team interaction (Mumford et al., 2008; Stewart et al., 2005).
In general, an individual‘s performance of an informal role may be conceptualized
in two ways. The first conceptualization views informal roles as continuous variables,
and accordingly, the extent to which an individual performs an informal role varies along
a continuum. With regard to the second conceptualization, informal roles are conceived
Page 12
5
as dichotomous phenomena, and as a result, an individual either performs an informal
role or does not. For the purposes of the present study, informal roles are conceptualized
as dichotomous phenomena.
Informal Roles Taxonomies
In order to classify and organize related behaviors into distinct informal roles,
researchers and practitioners alike have developed a variety of taxonomies for informal
roles. Over the past 60 years, a number of informal role taxonomies and related measures
have been introduced (e.g., Bales, 1950; Belbin, 1981, 1993; Benne & Sheats, 1948;
Dubrin, 1995; McCann & Margerison, 1995). Benne and Sheats (1948) offered one of the
first, and their taxonomy consists of 27 informal roles grouped into three broad role
categories: (a) task, (b) building and maintenance, and (c) individual. The task role
category includes 12 informal roles, where people filling these roles tend to facilitate and
coordinate the processes necessary for successful task completion. The building and
maintenance role category, on the other hand, includes seven informal roles, all of which
should directly contribute to a team‘s positive social interactions and indirectly contribute
to team task completion. The individual role category consists of eight roles that are
either self-serving or not in alignment with the team‘s goals and, consequently, tend to be
detrimental to team task success and result in ineffective social interactions. In other
words, roles in the individual category are dysfunctional, while those in the former two
categories are functional.
Two years after Benne and Sheats (1948), Bales (1950) published an informal
role taxonomy consisting of 12 key behaviors that are conceptually synonymous with
Page 13
6
informal roles. Like Benne and Sheats‘ taxonomy, Bales‘ taxonomy divides informal
roles into role categories. Bales‘ taxonomy, however, contains just two categories, task
and socioemotional, with six roles each. These two categories are defined similar to
Benne and Sheats‘ task and building and maintenance categories (respectively). Thus, in
his separate line of research, Bales arrived at a similar conclusion that informal roles may
be grouped into task or social categories; unlike Benne and Sheats, however, Bales did
not include dysfunctional roles as Benne and Sheats did with their individual category.
Belbin (1981, 1993) continued the emphasis on functional roles (i.e., roles
contributing to successful task completion and team interaction) when he developed his
own informal role taxonomy based on 9 years of observing managers in training courses.
His taxonomy originally included eight informal roles (Belbin, 1981), although it was
later expanded to nine (Belbin, 1993). In contrast to Benne and Sheats (1948) and Bales
(1950), Belbin did not group his roles into categories. Largely, Belbin‘s taxonomy has
received the most empirical attention relative to the aforementioned taxonomies when it
comes to assessing the link between informal role configuration and team effectiveness.
In addition to the more widely cited taxonomies of Benne and Sheats (1948),
Bales (1950), and Belbin (1981, 1993), other taxonomies have been developed over the
past three decades (e.g., Ancona & Caldwell, 1988, 1992; Barry, 1991; Davis, Millburn,
Murphy, & Woodhouse, 1992; Dubrin, 1995; McCann & Margerison, 1989, 1995;
Parker, 1994, 1996; Woodcock, 1989). In particular, Ancona and Caldwell‘s (1988,
1992) taxonomy has made a lasting and unique contribution to the conceptualization of
informal roles. In their taxonomy, they emphasized boundary-spanning roles that include
behaviors that span across team boundaries. Specifically, boundary-spanning roles
Page 14
7
consist of behaviors that have an external focus and bridge the gap between the team and
other teams or between the team and the organization. Consequently, people performing
such roles tend to act as inter-team liaisons.
In summary, multiple taxonomies exist in the literature. In general, the majority of
taxonomy developers have focused exclusively on functional informal roles (i.e., Ancona
& Caldwell, 1988, 1992; Bales, 1950; Barry, 1991; Belbin, 1981, 1993; Davis, Millburn,
Murphy, & Woodhouse, 1992; Dubrin, 1995; McCann & Margerison, 1989, 1995;
Parker, 1994, 1996; Woodcock, 1989), with the notable exception of Benne and Sheats
(1948). Further, Benne and Sheats and Bales (1950) independently arrived at task and
social (e.g., building and maintenance, socioemotional) role categories, while Ancona
and Caldwell (1988, 1992) introduced a new category consisting of boundary-spanning
roles. Finally, for the most part, the previously mentioned researchers developed their
taxonomies independent of one another. This approach yielded some unique
contributions to the literature as well some convergence in theory, but it also resulted in a
disjointed informal roles literature in need of integration.
Integrating Informal Role Taxonomies
As evidenced by the previous section, multiple informal role taxonomies exist and
some overlap substantially in terms of the behavior clusters assessed, but each also
introduces new role types. Recognizing the disjointed nature of the informal roles
literature, Mumford, Campion, and Morgeson (2006) developed an informal role
taxonomy that integrates over 120 roles from different taxonomies. Their integrated
taxonomy does not include dysfunctional roles (i.e., roles that are a detriment to team
Page 15
8
success), such as the roles falling in Benne and Sheats‘ (1948) individual role category,
because the goal was to include only those role that contribute to successful team
functioning.
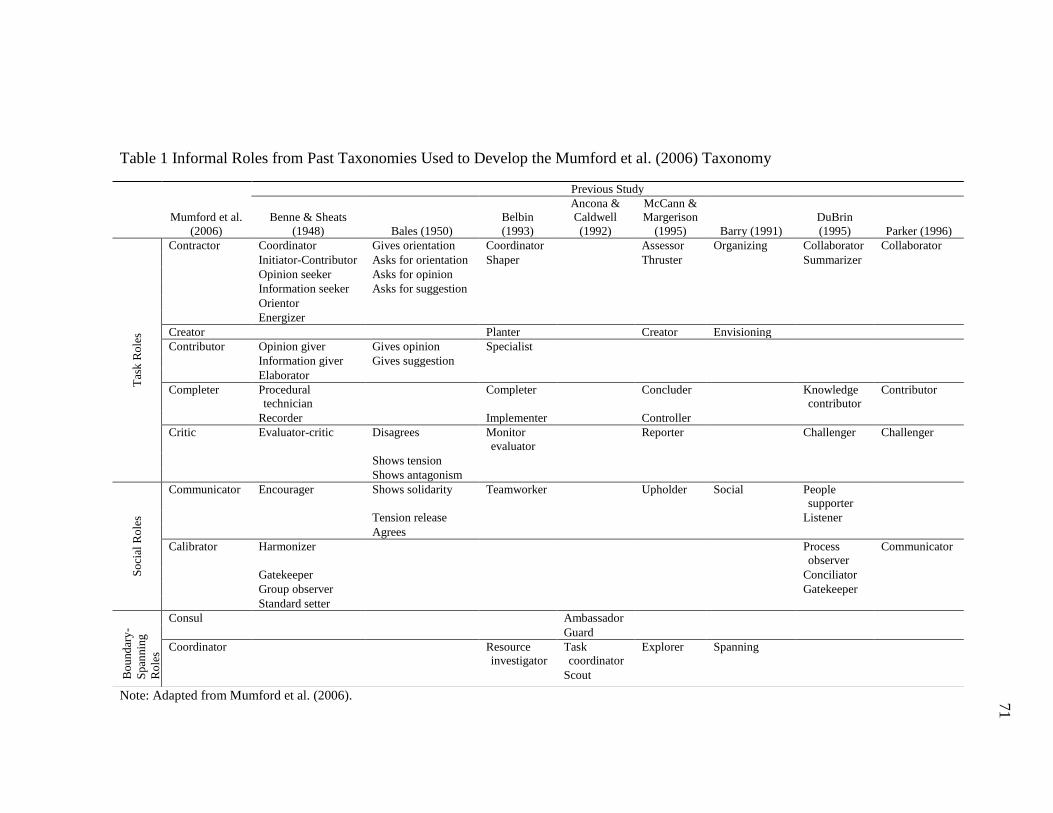
The Mumford et al. (2006) taxonomy integrates roles from previously published
taxonomies in an effort to bring unity to what they considered to be fragmented and
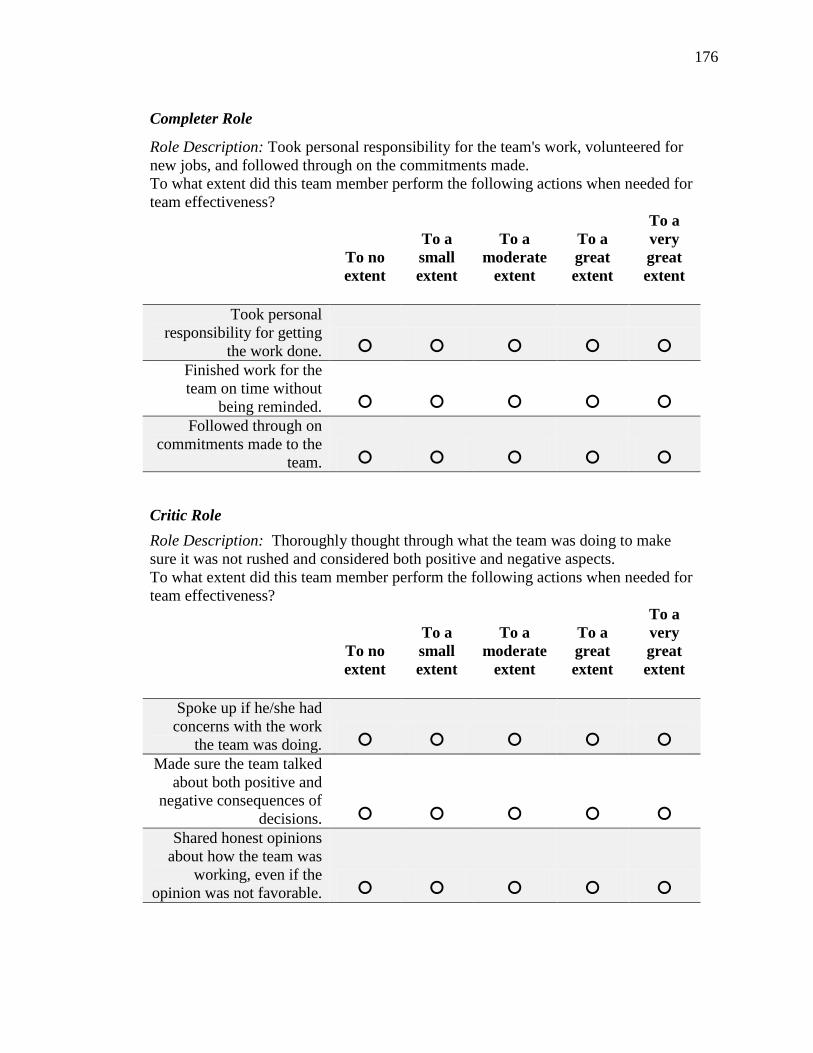
disjointed literature on informal roles. The 10 distinct roles in Mumford and colleagues‘
taxonomy were grouped into one of three role categories: (a) task, (b) social, and (c)
boundary-spanning. In a subsequent validation study, however, analysis of the 10-role
taxonomy demonstrated low convergent validity between the roles found within the
social role category (Mumford et al., 2008). Consequently, Mumford and colleagues
revised the taxonomy by eliminating one role, leaving nine informal roles embedded in
the three role categories. See Table 1 for a listing of Mumford et al.‘s informal role
taxonomy and the previous role taxonomies from which it was derived.
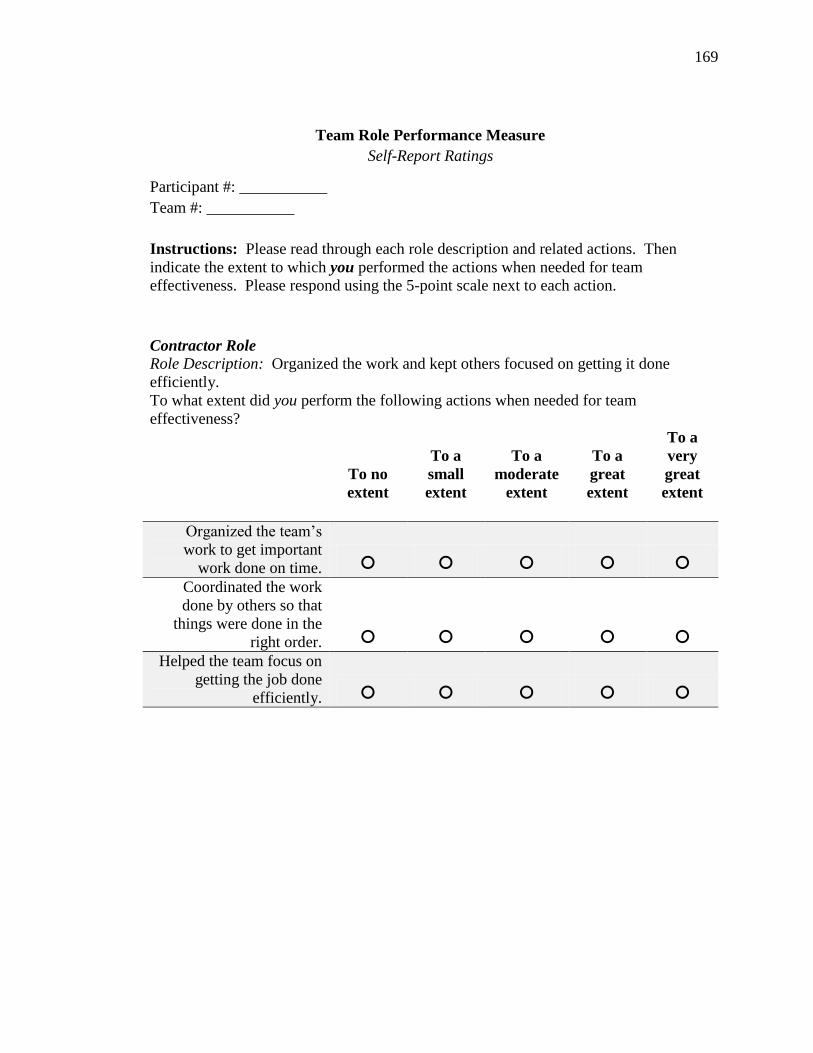
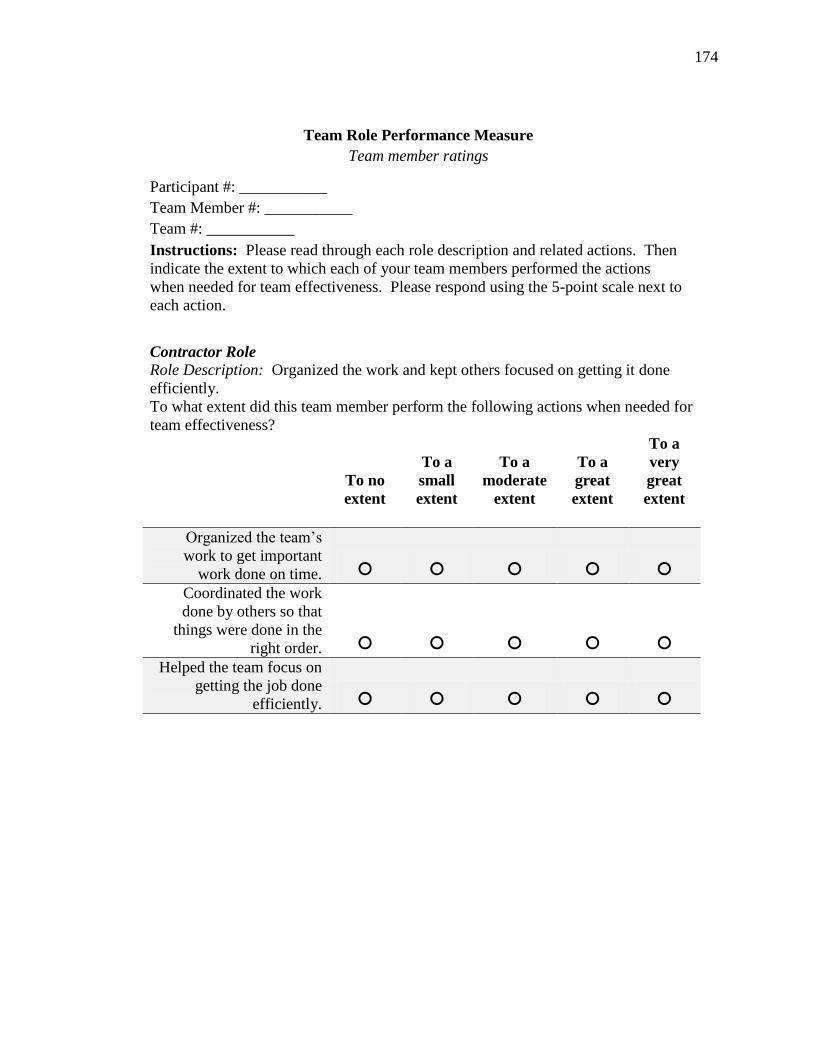
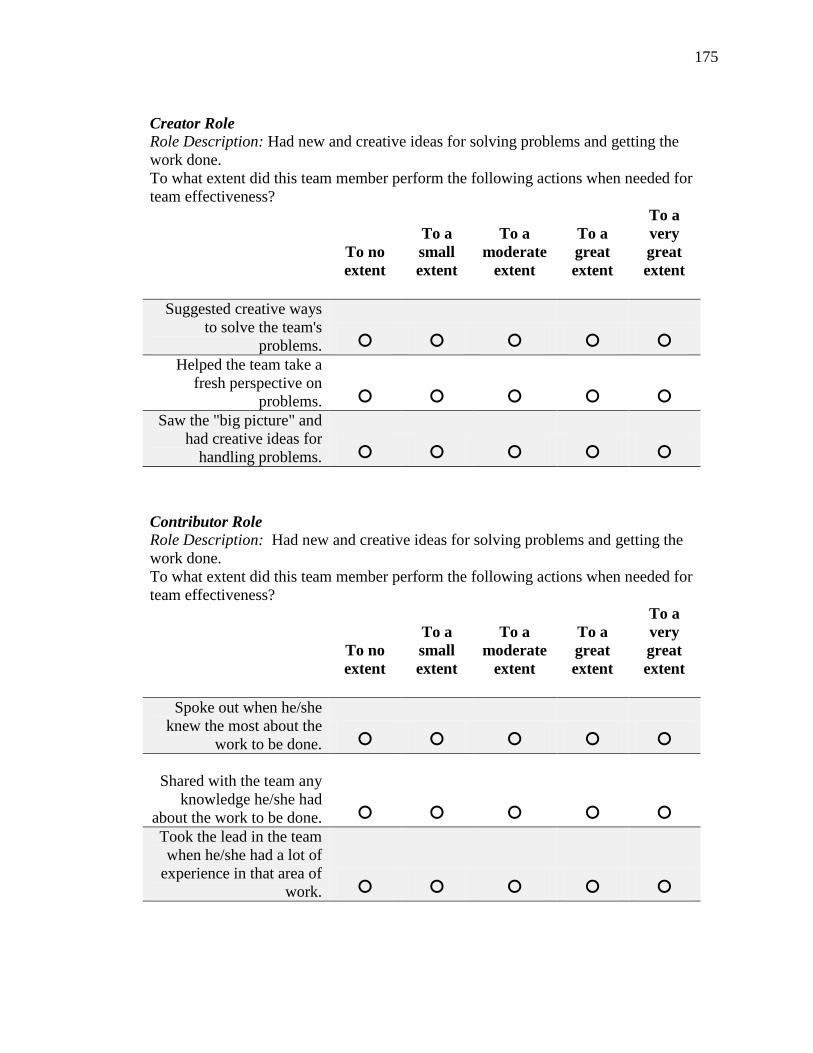
The task role category includes the informal roles of Contractor, Creator,
Contributor, Completer, and Critic. These roles feature behaviors directly associated with
accomplishing the team‘s task objectives. The Contractor refers to behaviors related to
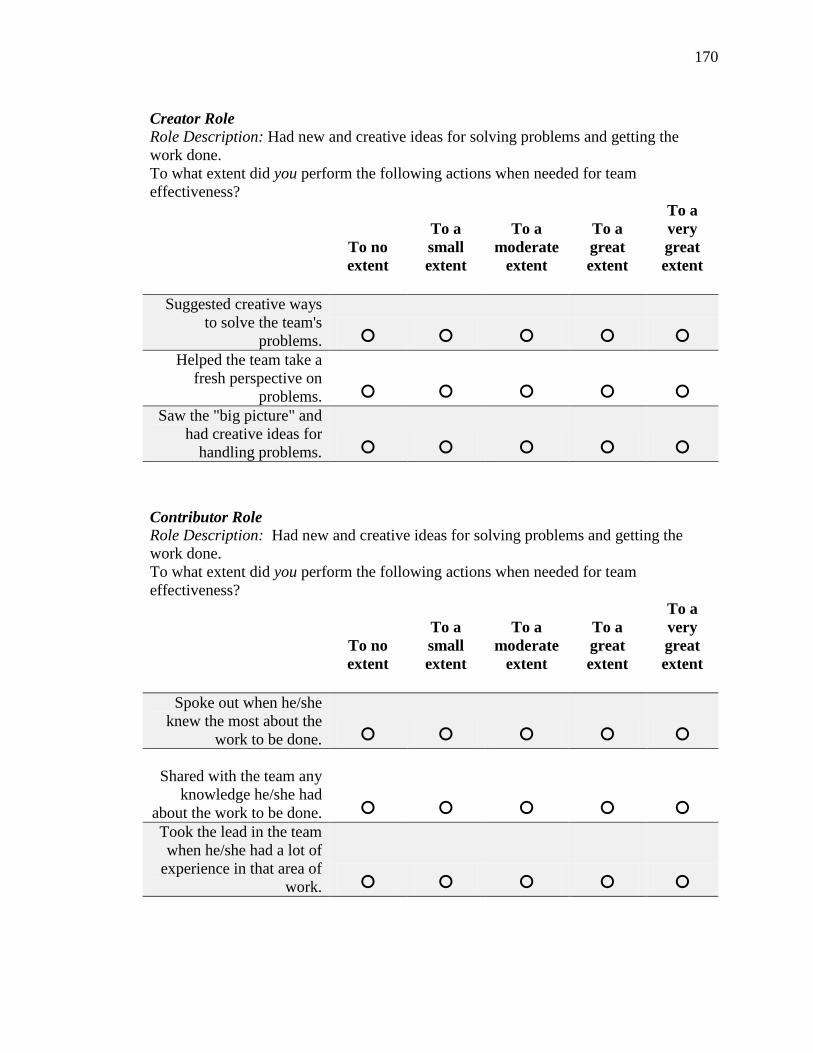
organizing and coordinating team activities. The Creator suggests original and/or
innovative solutions to the team‘s task-related problems and provides a fresh perspective
with regard to problem solving. The Contributor contributes unique information or
expertise to the team. The Completer, on the other hand, spearheads the individual-
oriented tasks in the team until completed. Finally, the Critic role covers those behaviors
associated with questioning and commenting on the manner in which the team chooses to
coordinate and organize information related to meeting objectives.
Page 16
9
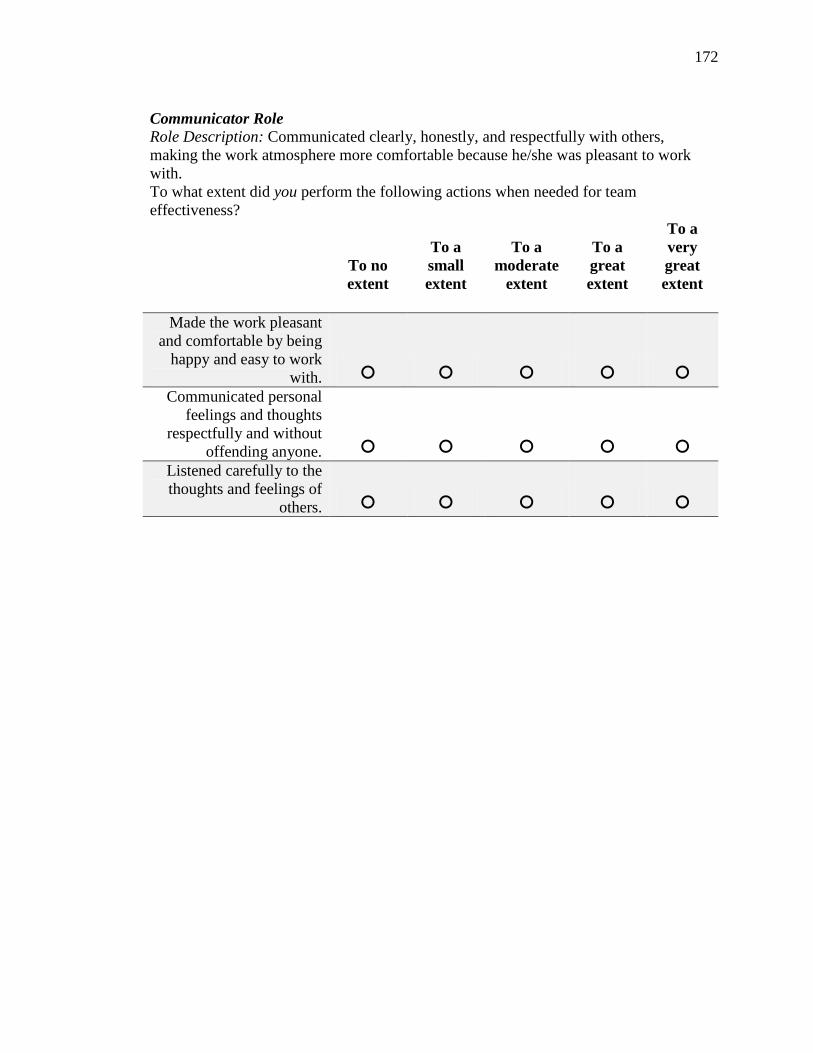
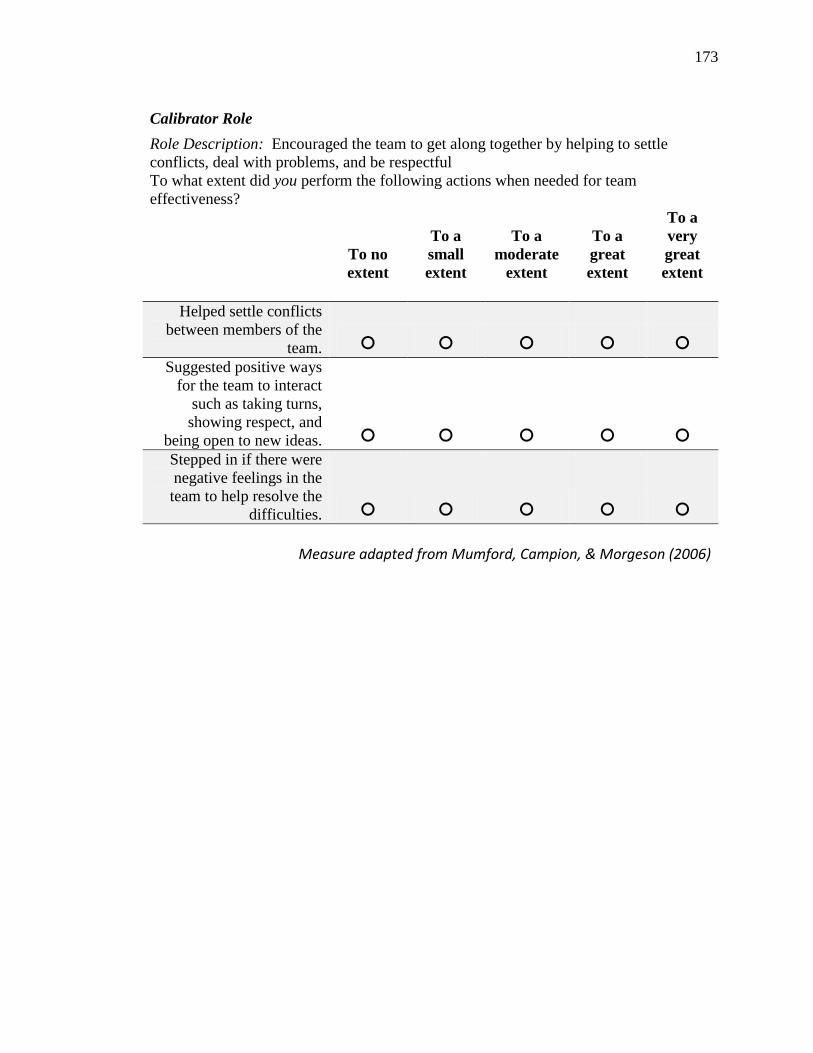
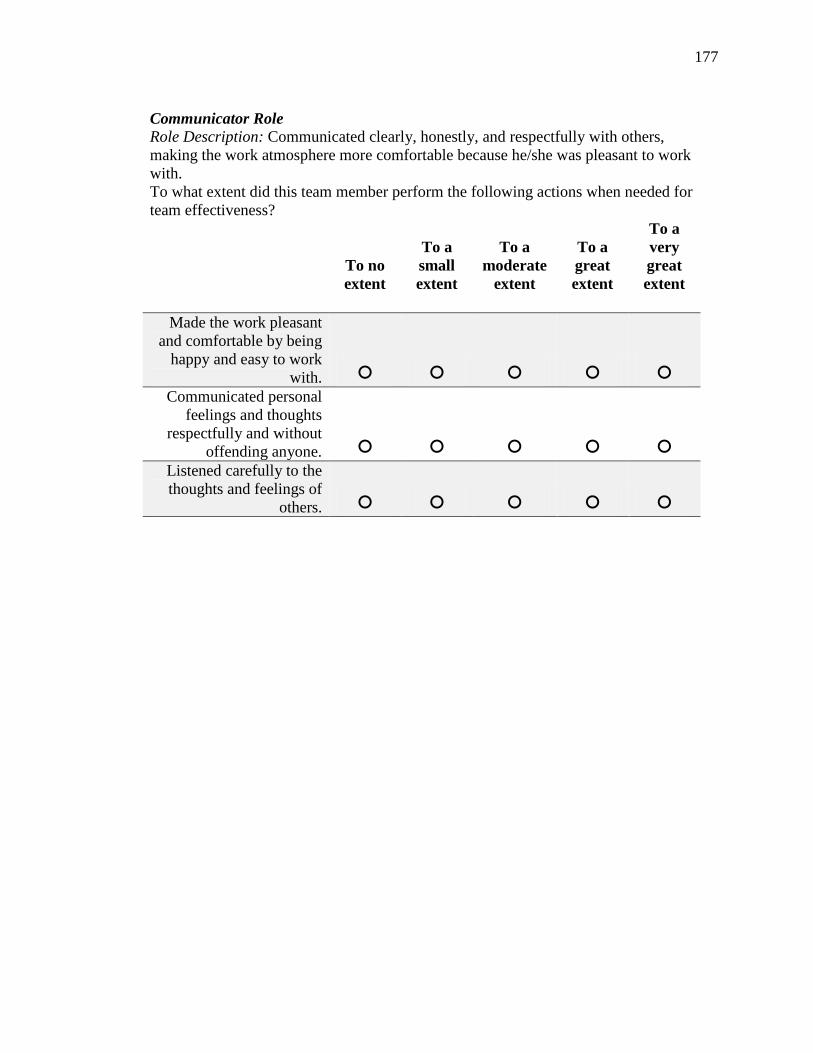
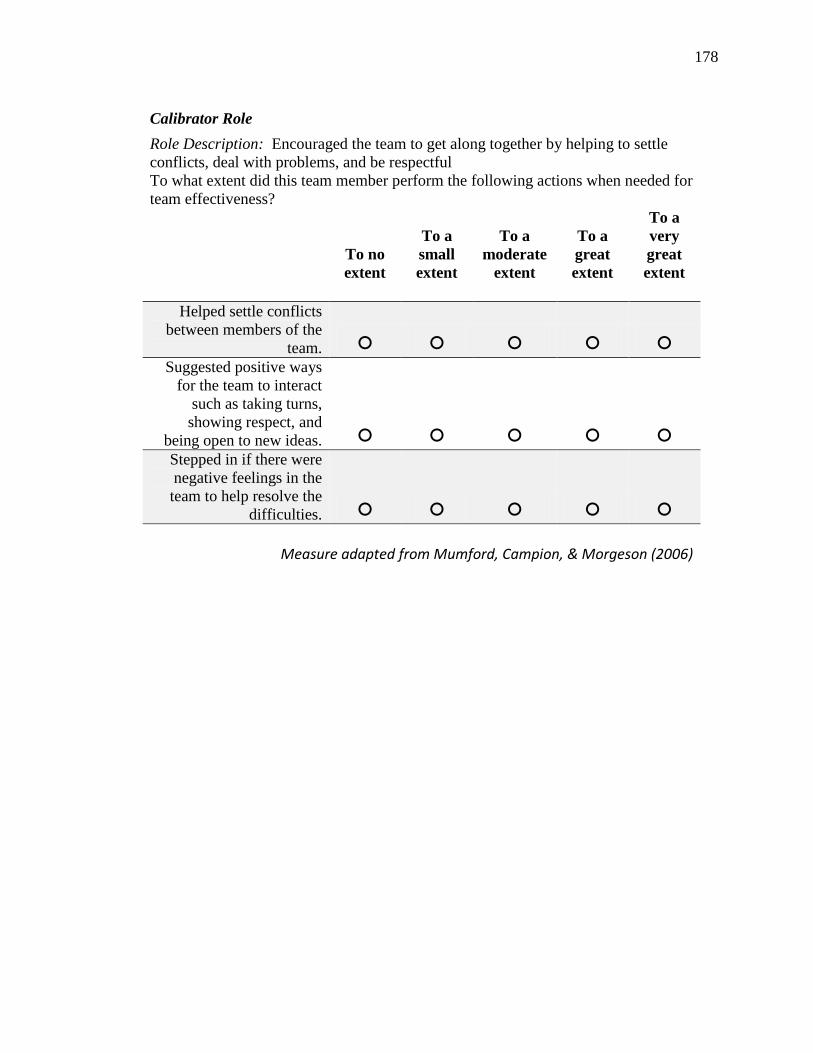
The second role category deals with the social roles and includes the
Communicator and Calibrator roles. These roles consist of contextual behaviors that
facilitate the team‘s socioemotional environment. That is, these behaviors support and
maintain the team‘s cohesion, morale, and mood. The Communicator makes interactions
pleasant and comfortable by being happy and easy to work with, listening carefully and
intently to the thoughts, feelings, and emotions of fellow team members, and striving to
communicate personal feelings and thoughts in a respectful manner. The Calibrator
performs behaviors that function to observe the team‘s social processes, make the team
aware of the social processes, and suggest changes to the observed social processes (e.g.,
settle conflicts, resolve negative feelings, suggest positive ways to interact).
The third and final category is called the boundary-spanning role category. This
category includes the informal roles of Consul and Coordinator, and these roles pertain to
behaviors that facilitate team functioning with the external environment (i.e., other teams,
the overarching organization, other organizations). The Consul interacts with those
external to the team in order to favorably market the team by sharing accomplishments
with non-team members, gaining support from important or influential non-team
members, and frequently updating non-team members with information about the team‘s
successes. The Coordinator interacts with non-team members to garner information,
ideas, and other resources that may improve team decision-making.
In summary, Mumford et al. (2006) integrated over 120 informal roles into a
single taxonomy that now consists of nine roles (Mumford et al., 2008) nested within
three role categories. The task role category includes the roles of Contractor, Creator,
Contributor, Completer, and Critic, while the social role category is made up of the
Page 17
10
Communicator and Calibrator roles. Finally, the boundary-spanning role category
includes the Consul and Coordinator. To measure the extent to which team members
perform each informal role, Mumford and colleagues developed a measure called the
Team Role Performance (TRP) test. For a detailed description of the TRP, please refer to
the Method section.
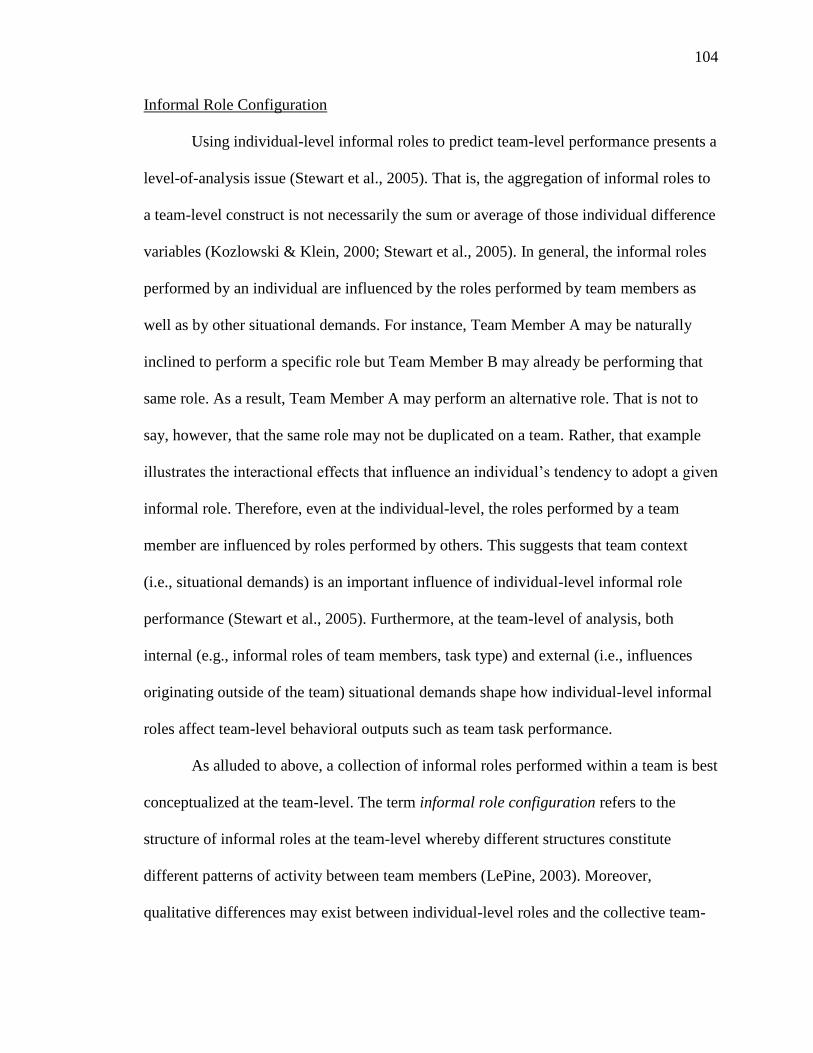
Informal Role Configuration
When considered at the team-level of analysis, a collection of informal roles
performed within a team is referred to as an informal role configuration (IRC), whereby
different structures constitute different patterns of activity between team members
(LePine, 2003; Stewart et al., 2005). In other words, at the individual level, an informal
role represents a cluster of related behaviors, and at the team level, an IRC is assumed to
represent standardized interaction patterns between informal roles performed.
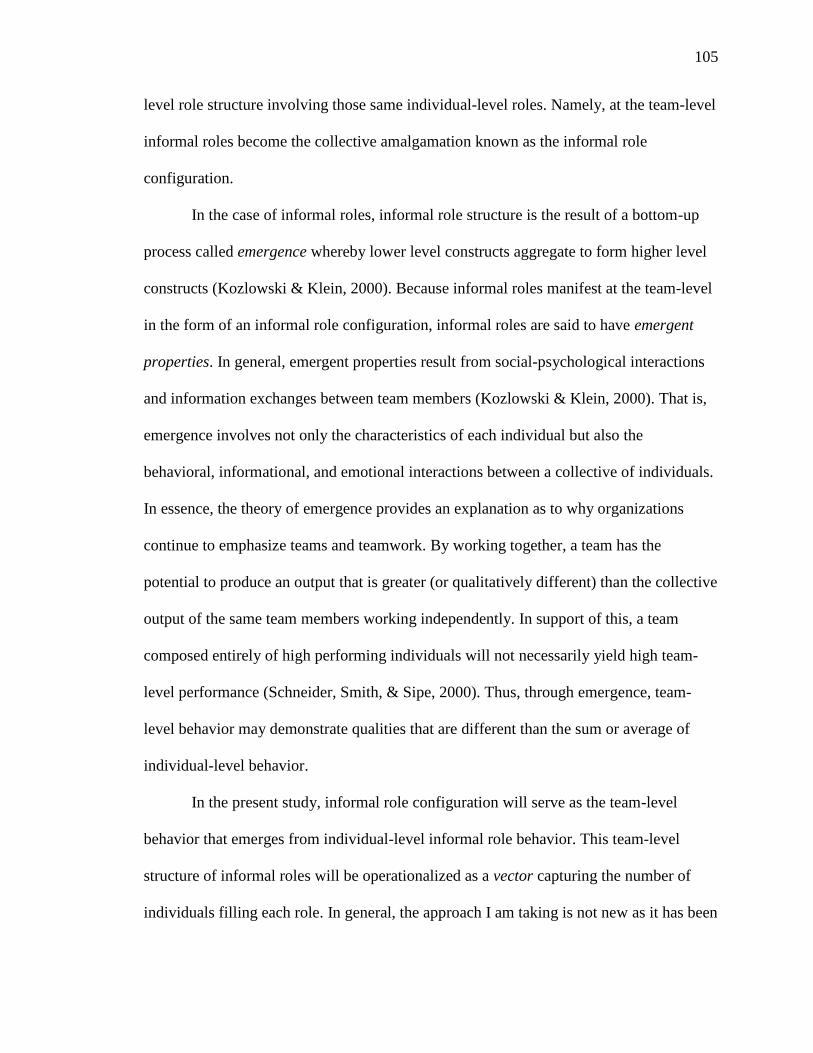
Past research and theory have approached IRC in different ways based on
different conceptualizations of individual-level informal roles. As mentioned previously,
informal roles may be conceptualized as continuous or dichotomous phenomena. With
respect to the first conceptualization, to aggregate continuous variables from the
individual level to team level, principles of multi-level theory (e.g., emergence) should be
applied (Kozlowski & Klein, 2000). Fully describing multi-level theory, however, would
require a detailed explanation that is beyond the scope of the present study. In short, these
principles stipulate that different statistical techniques (e.g., mean, skew, variance) should
be used to characterize aggregated team-level phenomena.
Page 18
11
As stated previously, the present study treats informal roles as dichotomous
phenomena. The underlying assumption of this conceptualization is that individuals
either perform or do not perform informal roles. A primary benefit of approaching
informal roles in this way is that team-level IRC are more easily interpretable because
they can be described in terms of the number individuals performing each type of role
within a team. In the present study, this team-level structure of informal roles is depicted
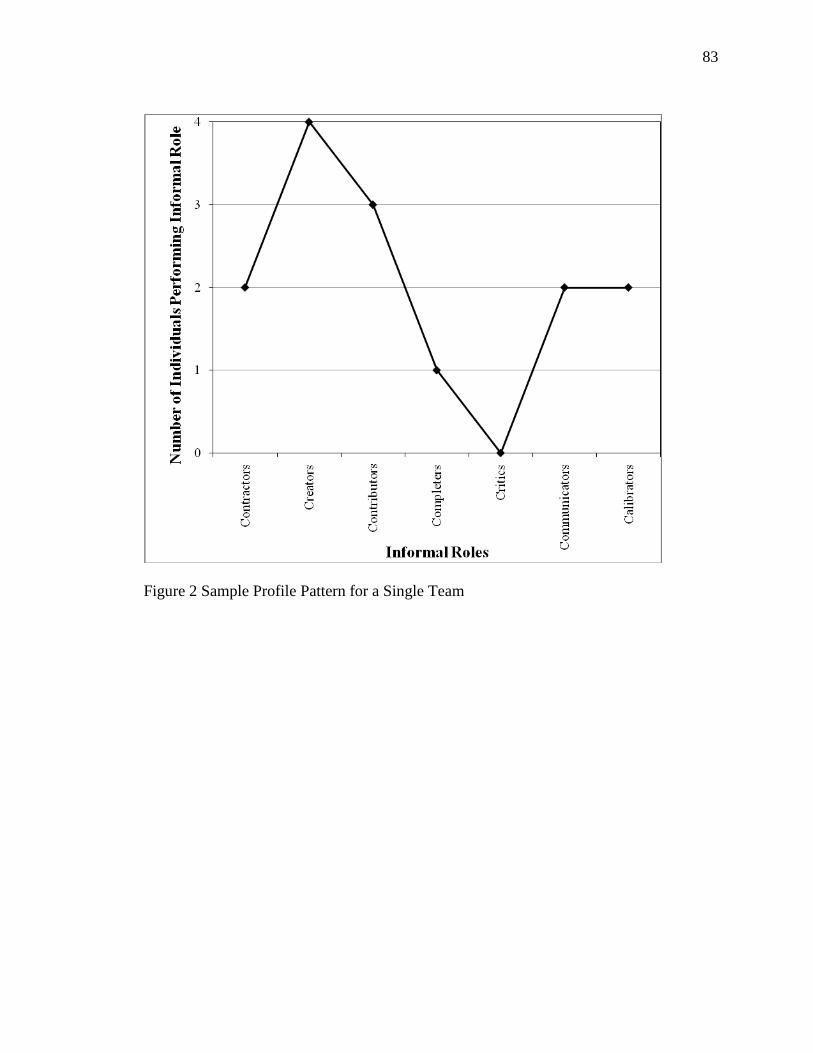
as an IRC vector that can be used to describe a number of different configurations. In this
context, a vector is a pattern or code that depicts the number of individuals performing
each informal role within a team. An example of a vector is 4102310, where the location
of each digit in the sequence corresponds to a specific informal role from a seven-role
taxonomy. In this example, the fifth digit corresponds to the Critic role and, accordingly,
indicates that three team members performed the role.
Past researchers have used different versions of vectors to test the relationship
between IRC and team effectiveness. For instance, Belbin (1981) proposed a theory of
team balance in which a team was considered balanced and assumed to be more effective
if each informal role was filled by at least one team member. Similarly, with respect to
Bales‘ (1950) taxonomy, imbalance was defined as teams having or possessing a
disproportionate number of task category roles in relation to social category roles or a
disproportionate number of social category roles in relation to task category roles;
consequently, imbalanced teams are assumed to be less effective. Bales‘
conceptualization, however, is limited to taxonomies where an equal number of informal
roles are associated with the task and social role categories. In Chong (2007), IRC vectors
were used to identify the total number of individuals adopting each role within a team.
Page 19
12
Thus, the IRC vector approach is not new, as it has been used by past researchers to both
describe a team‘s IRC and differentiate teams from one another based upon the
relationship between variations in IRC vectors and team effectiveness.
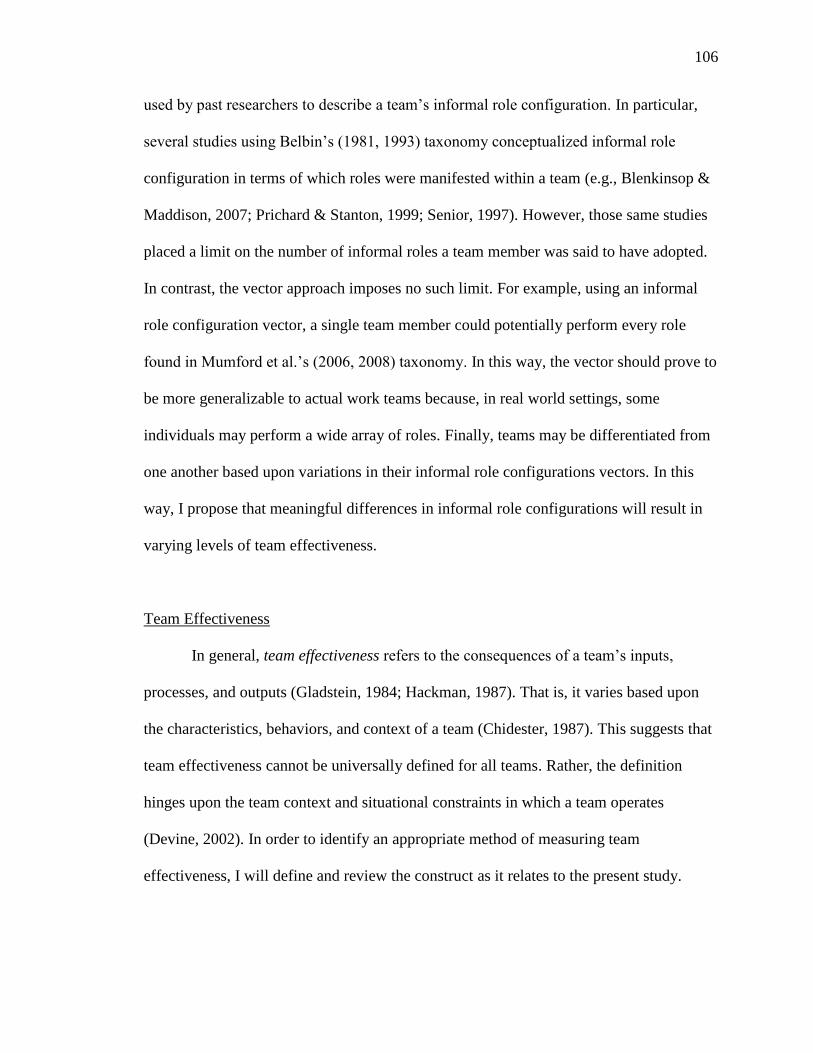
Link Between Informal Role Configuration and Team Effectiveness
The relationship between IRC and team effectiveness has been tested in only a
handful of studies (e.g., Prichard & Stanton, 1999; Senior, 1997; Stewart et al., 2005). In
the present study, the interest lies in those studies using the IRC approach described
above in which individual-level informal roles are operationalized dichotomously and
IRC are represented by vectors. Interestingly, studies using some variation of this
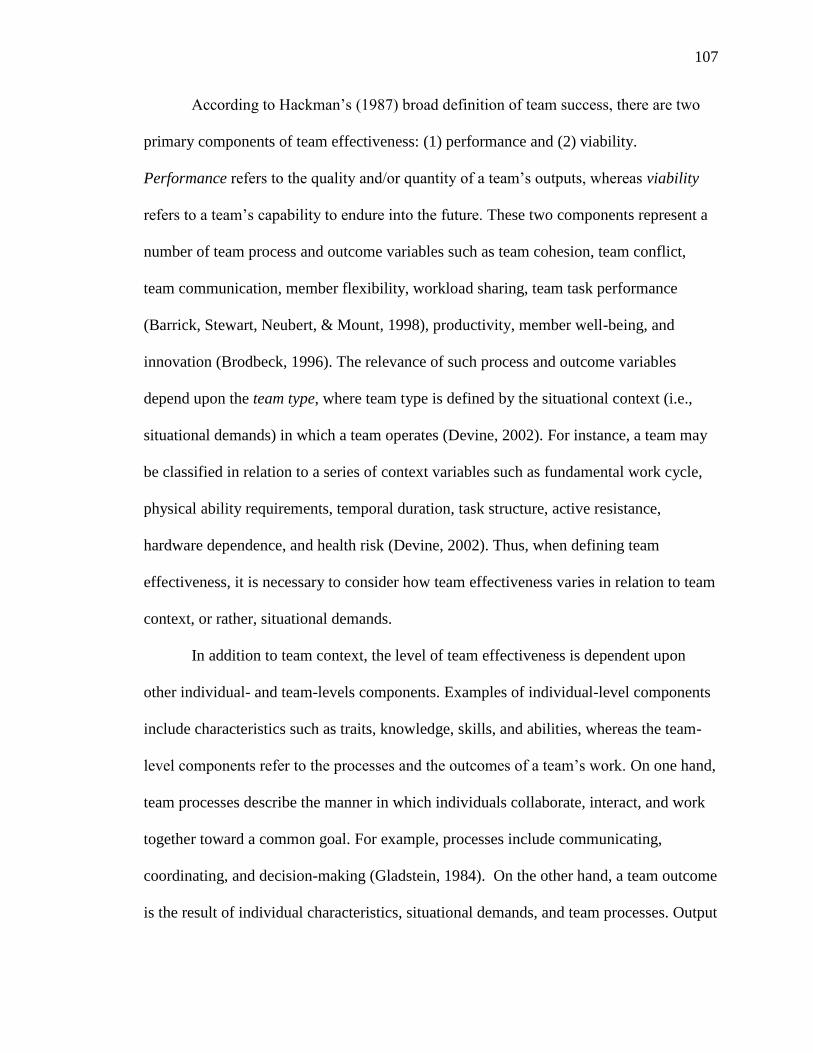
approach have all used informal roles from Belbin‘s (1981, 1993) taxonomy. Team
effectiveness is broadly defined as the two constructs of performance and viability
(Hackman, 1987; Sundstrom, de Meuse, & Futrell, 1990), where performance refers to
the quality and/or quantity of a team‘s outputs and viability refers to a team‘s capability
to endure into the future. The present study will focus exclusively on the empirical
evidence investigating the link between IRC and the performance subdimension of team
effectiveness.
In the empirical literature, the link between IRC and team effectiveness has been
investigated using two versions of the IRC vector approach described previously. The
first version is known as Belbin‘s (1981) team balance theory. Although variations of
Belbin‘s team balance theory exist, generally, balance is achieved when at least one
individual adopts every role in the taxonomy. Team balance may be coded
dichotomously as balanced and imbalanced or continuously as the number of roles within
Page 20
13
an IRC filled by at last one person. Studies such as Partington and Harris (1999),
Blenkinsop and Maddison (2007), and van der Water, Ahaus, and Rozier (2008) found no
support for the relationship between team balance and team effectiveness when using
Belbin‘s (1981, 1993) taxonomy. With that said, Blenkinsop and Maddison (2007) used a
sample of just seven teams and, as a result, had little chance of finding a significant
relationship, even if one truly existed, given their low statistical power.
On the other hand, Senior (1997) and Prichard and Stanton (1999) found support
for the relationship between team balance and team effectiveness, but both studies
suffered from notable methodological limitations. Using just 11 management teams,
Senior identified informal role performance using a self-report measure, and she
operationalized team effectiveness using a technique where each team defined its own
effectiveness criteria and rated itself along those criteria. Consequently, teams were not
rated based on the same criteria and a common source bias existed because the informal
role and team effectiveness measures were both self-report. With respect to Prichard and
Stanton, they too used a very small sample (i.e., 12 four-person teams). Moreover, they
operationalized team balance using just four of Belbin‘s nine roles (i.e., Coordinator,
Planter, Completer/Finisher, Teamworker), while imbalance was operationalized as
teams consisting of four people who each performed only the Shaper role. As such, the
significant difference in performance found between balanced and imbalanced teams
lacks some degree of generalizability, as it does not take into consideration other roles in
Belbin‘s taxonomy. In conclusion, the studies described above suggest, at most, weak
support for the relationship between team balance and team effectiveness.
Page 21
14
The second version of the IRC vector approach found in past research relates to
the main effects on team effectiveness exhibited by the number of individuals performing
a specific informal role. Using a sample of 43 MBA graduate student project teams,
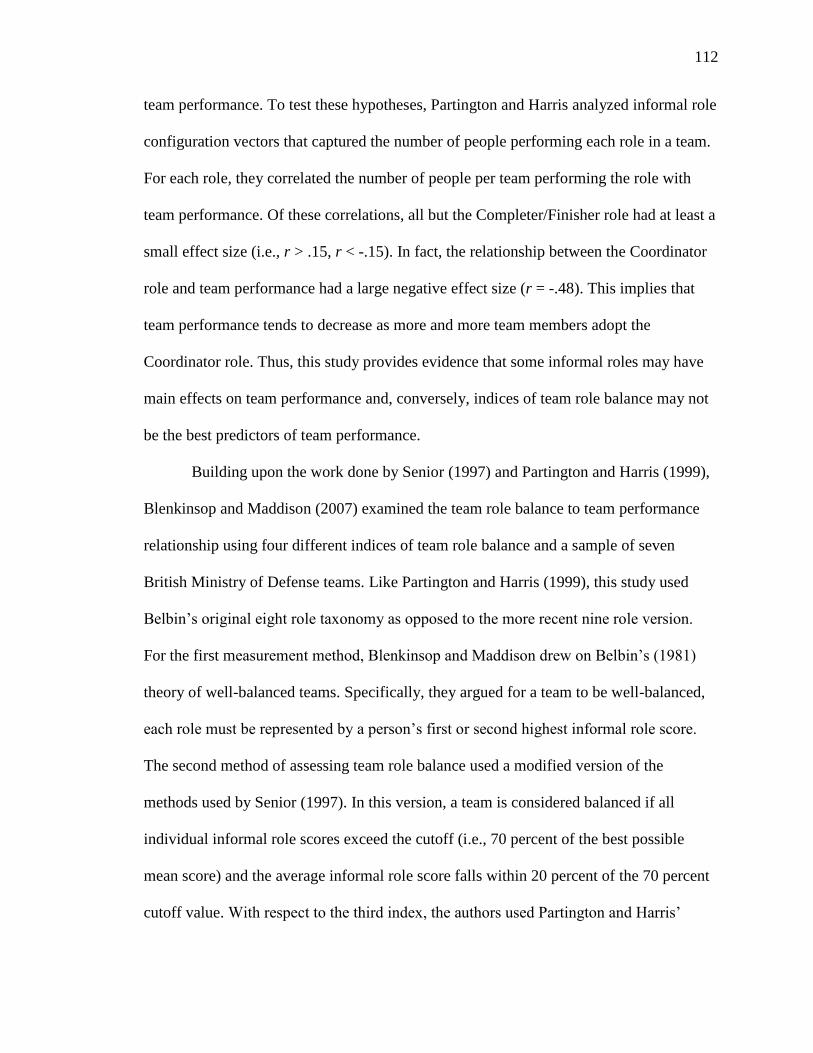
Partington and Harrison (1999) found a statistically significant relationship between the
number of individuals performing Belbin‘s (1981, 1993) Coordinator role and the level of
team effectiveness (r = -.48). The negative relationship suggests that team effectiveness
tended to decrease as more and more individuals adopted the Coordinator role, regardless
of the other roles performed. In a subsequent study, Chong (2007) used 342 management
students divided relatively evenly into 33 teams and found significant main effects on
team effectiveness for Belbin‘s Planter (r = .37), Shaper (r = .42), and Teamworker (r =
.36) roles. These positive relationships indicate that as the number of individuals
performing each of those roles increased, the level of team effectiveness tended to
increase as well.
In summary, several studies have investigated the empirical link between IRC and
team effectiveness. Of the studies reviewed, all used informal roles from Belbin‘s (1981,
1993) taxonomy (i.e., Blenkinsop & Maddison, 2007; Chong, 2007; Partington & Harris,
1999; Prichard & Stanton, 1999; Senior, 1997; van der Water et al., 2008). In addition,
these studies conceptualized IRC using two versions of the vector approach. Most
commonly, studies assessed IRC using some form of team balance based on Belbin‘s
(1981) original theory. The relationship between variations of team balance and team
effectiveness, however, received only limited support. In contrast, studies such as Chong
(2007) and Partington and Harris (1999) found support that the representation of certain
roles may exert main effects on team effectiveness, regardless of the other roles
Page 22
15
performed. To date, however, no study has used Mumford et al.‘s (2006) integrated
taxonomy to explore the IRC and team effectiveness link.
Personality
The term personality refers to an individual‘s characteristic patterns of thought,
emotion, and behavior (Funder, 2001), and theories of personality are primarily
concerned with the origins, antecedents, and outcomes of those characteristic patterns of
thought, emotion, and behavior. In relation to the present study, past studies have
explored the relationship between personality and the adoption of informal role behaviors
(e.g., Blumberg, 2001; Mumford et al., 2008; Stewart et al., 2005). In light of this, a goal
of the present study is to further investigate the link between personality and informal
roles. First, however, a review of the personality construct is provided.
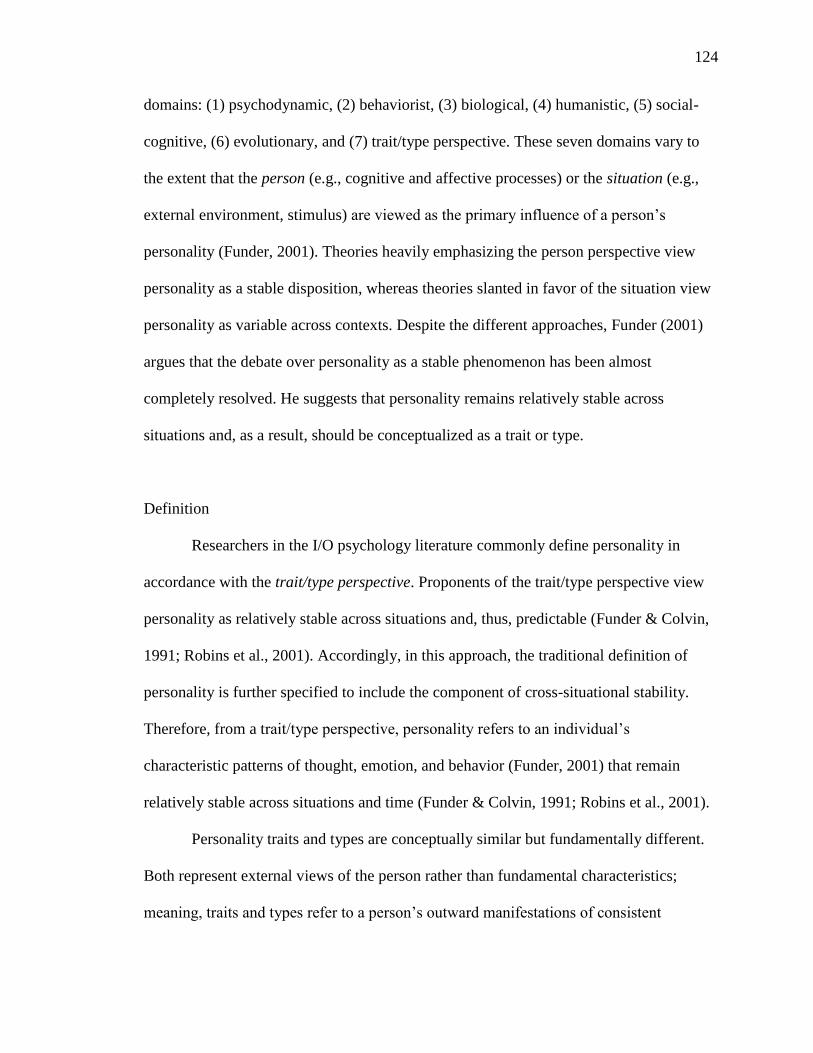
Researchers in the I/O psychology literature commonly adopt a trait/type
perspective, which views personality as relatively stable across situations and, thus,
predictable (Funder & Colvin, 1991; Robins, Fraley, Robert, & Trzesniewski, 2001).
Accordingly, the present study adheres to this perspective and defines personality as an
individual‘s characteristic patterns of thought, emotion, and behavior (Funder, 2001) that
remain relatively stable across situations and time (Funder & Colvin, 1991; Robins et al.,
2001). Different approaches to the trait/type perspective exist such as Leary‘s (1957)
interpersonal theory, but the Big Five approach is most common and has gained an
increasing amount of empirical attention over the past two decades. The Big Five
approach was developed based on work by researchers such as Allport and Odbert
(1936), Catell (1945), Norman (1993), and McCrae and Costa (1985, 1987). In this
Page 23
16
approach, personality traits (i.e., facets) are described as a series or a profile of individual
dimensions (Saucier & Goldberg, 2003). Specific to the present study, studies such as
Barrick, Stewart, Neubert, and Mount (1998) and Morgeson, Reider, and Campion (2005)
have investigated the Big Five in the context of work teams. For these reasons, the
present study operationalizes personality using the Big Five approach.
Each of the Big Five dimensions encompasses a number of core facets (Barrick &
Mount, 1991; Digman, 1990; McCrae & Costa, 1985, 1987). Furthermore, the
dimensions of the Big Five are assumed to be independent (McCrae & Costa, 1985). That
is, the extent to which a person possesses one dimension should not influence the extent
to which the same person possesses another. The first dimension, Agreeableness, refers to
an individual‘s behavioral tendency to be compassionate and cooperative, and core facets
include being likeable, friendly, and good-natured. A person high in Conscientiousness
tends to act respectfully and dutifully in a planned and courteous manner and, as a result,
may be described as achievement-oriented, responsible, and organized. Extraversion
refers to a person‘s tendency to seek interaction and stimulation from others. Core facets
of an extraverted person include sociability, assertiveness, talkativeness, and
ambitiousness. Emotional Stability is defined as a person‘s tendency to feel emotionally
calm and secure, yet it is often described by its negative pole called Emotional Instability
or Neuroticism. An emotionally instable person tends to experience relatively frequent
fluctuations in emotion, and core facets of this dimension include feelings of anger,
depression, anxiety, and vulnerability. Finally, Openness to Experience is a bit more
difficult to define but typically refers to an individual‘s appreciation of new and diverse
ideas, environments, situations, and people. As such, Openness to Experience includes
Page 24
17
core facets like being curious, imaginative, broad-minded, and intelligent. Together, these
five dimensions make up what is commonly referred to as the Big Five.
Link Between Personality and Informal Roles
The second goal of the current study is to investigate the link between personality
and informal roles. Past research has shown statistical relationships between personality
and individual behavior and performance (e.g., Barrick, Mount, & Judge, 2001; Tett,
Jackson, & Rothstein, 1991). As such, the extent to which an individual possesses a given
personality dimension may influence the informal role(s) he or she performs. In the
following paragraphs, a review is provided of three studies investigating the relationships
between the Big Five and informal role performance.
Using a sample of 207 undergraduate students, Blumberg (2001) calculated the
correlations between the Big Five personality dimensions and the task and social role
categories of the Bales (1950) taxonomy. Participants completed self-report measures for
the Big Five and informal roles. On one hand, the task role category correlated
significantly with Agreeableness (r = .23) and Conscientiousness (r = .41). On the other
hand, the social role category correlated significantly with Agreeableness (r = .45),
Conscientiousness (r = .24), Extraversion (r = .26), and Neuroticism (r = -.42). These
findings, however, may not represent the true relationships. First, a common source bias
occurred because two self-report measures were correlated with one another. Second,
participants were not instructed to reference a specific team context when completing the
informal roles measure; therefore, Blumberg did not operationalize informal roles in a
manner consistent with the present study‘s definition. As a result, the Blumberg study
Page 25
18
illustrates the importance of providing a specific team context when measuring informal
roles.
Stewart et al. (2005) also assessed the links between the Big Five dimensions and
informal roles. Study participants consisted of 220 executive MBA students organized in
45 teams, with each team consisting of 4-6 individuals working together throughout an 8-
month period. Like Blumberg, Stewart et al. used a self-report measure of the Big Five as
well as the task and social role categories of the Bales (1950) taxonomy; although,
Stewart et al. used team member ratings instead of self-report ratings, thus, avoiding
common source bias. With regard to significant findings, medium-sized positive
correlations were found between Agreeableness and the social role category (r = .25) and
Conscientiousness and the task role category (r = .25); meaning, individuals higher in
Agreeableness and Conscientiousness tended to perform behaviors associated with the
social and task role categories, respectively. In addition, a small positive relationship was
found between Emotional Stability and the task role category (r = .15), suggesting that an
emotionally stable person will tend to perform behaviors consistent with the task role
category. Finally, small negative relationships were found between the task role category
and the personality dimensions of Openness to Experience (r = -.16) and Extraversion (r
= -.13); these two relationships indicate that individuals high in Openness and
Extraversion tended not to perform behaviors consistent with the task role category.
Finally, Mumford et al. (2008) provided a specific team context when correlating
the Big Five with informal roles from the Mumford et al. (2006) taxonomy. Based upon a
sample of four- or five-member academic project teams drawn from 93 undergraduate
students, the authors assessed the extent to which participants performed informal roles
Page 26
19
consistent with task, social, and boundary-spanning role categories using team member
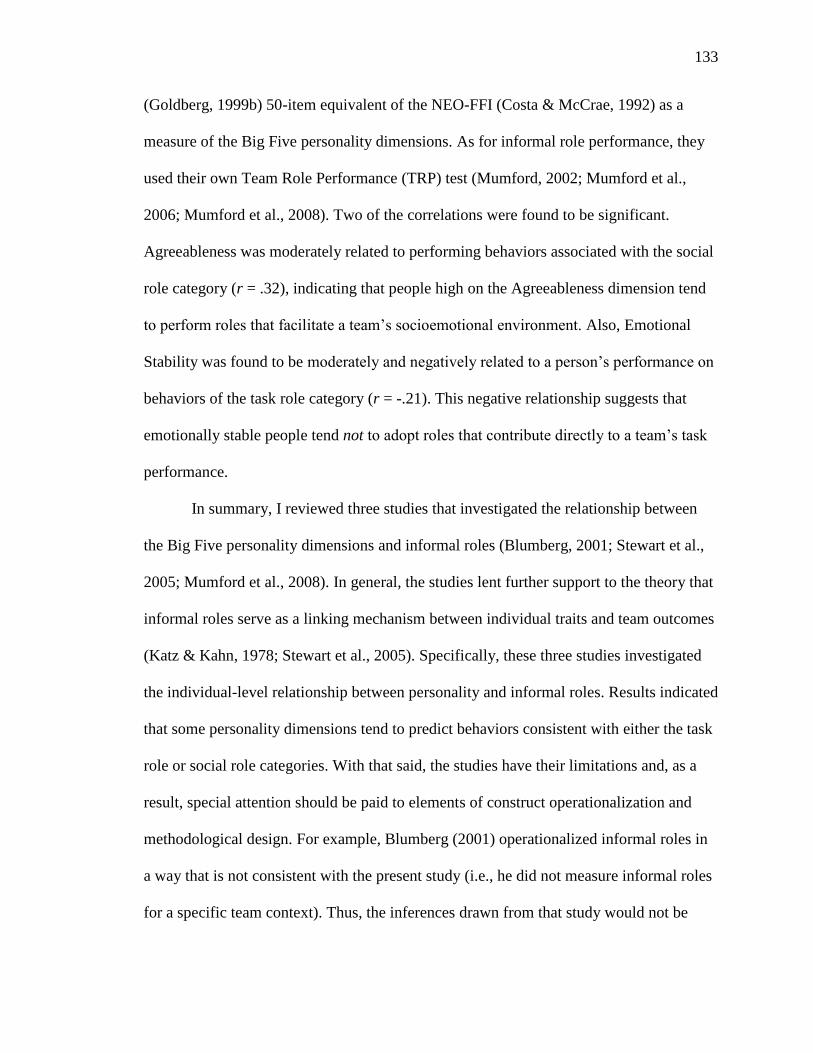
ratings. Two relationships were found to be statistically significant. As in Stewart et al.,
Agreeableness was moderately related to performing behaviors associated with the social
role category (r = .32), indicating that people high on the Agreeableness dimension
tended to perform roles that contribute to a team‘s positive socioemotional environment.
Contrary to Stewart et al., Emotional Stability was found to be moderately and negatively
related to a person‘s performance on behaviors of the task role category (r = -.21); thus,
Mumford et al.‘s effect size was of larger magnitude and in the opposite direction of
Stewart et al. This negative relationship suggests that emotionally stable people tended
not to adopt roles that contributed directly to a team‘s task performance.
In summary, three studies have investigated the link between the Big Five
personality dimensions and informal roles, but only Stewart et al. (2005) and Mumford et
al. (2008) operationalized informal roles in a manner consistent with the present study.
First, the latter two studies found Agreeableness to be positively and significantly related
to the social role category. Second, both studies found Emotional Stability to be
significantly related to the task role category, although the significant correlations were in
opposing directions. Third, Stewart et al. found the task role category to have a positive
significant relationship with Conscientiousness and negative significant relationships
with Openness to Experience and Extraversion. Finally, both Stewart et al. and Mumford
et al. correlated the Big Five with role categories (i.e., task and social) and not specific
informal roles. In light of the fourth and final conclusion, the present study adds value to
the extant literature by investigating the relationships between the Big Five and specific
informal roles (e.g., Creator, Critic) from the Mumford taxonomy (Mumford et al., 2006).
Page 27
20
1.3. Present Study
As described previously, the conceptual framework for the present study involves
the individual and team level of analysis (see Figure 1). At the team level, the goal of this
study is to investigate the link between IRC and team effectiveness, and at the individual
level the goal is to investigate the link between personality and informal roles. To do so,
personality, informal roles, and team effectiveness are operationalized using the Big Five,
Mumford et al.‘s (2006) taxonomy, and team task performance, respectively.
Furthermore, team size is held constant at four members per team. Finally, due to the
design of the present study, hypotheses related to the boundary-spanning roles of Consul
and Coordinator are not included.
Team-Level Hypotheses
Team-level hypotheses refer to the relationships between different
operationalizations of IRC and team effectiveness, and they are grouped into two
categories: (a) linear and (b) interaction. In addition to the priori hypotheses, inductive
and strictly exploratory follow-up analyses will be conducted for which no predictions
will be made. Specifically, the present study will identify an optimal IRC vector with
respect to team effectiveness. The technique for identifying an optimal IRC vector will be
described at length in the Statistical Analyses section.
The linear category consists of hypotheses in which one more or more informal
roles in an IRC correlate in a linear manner with team effectiveness. Past studies indicate
that main effects exist between specific informal roles and team effectiveness. That is, as
more individuals perform a particular informal role, team effectiveness increases in a
Page 28
21
linear and additive fashion, regardless of the other roles performed. For instance, Belbin‘s
(1981, 1993) Planter, Shaper, and Teamworker roles were found to share significant and
positive moderate-to-strong relationships with team effectiveness (Chong, 2007). Based
on Mumford et al.‘s (2006) integrative taxonomy (see Table 1), these three roles
correspond to Creator, Contractor, and Communicator, respectively. In another study,
however, Belbin‘s Coordinator role shared a strong negative relationship with team
effectiveness (Partington & Harris, 1999). Like Belbin‘s Shaper role, the Coordinator role
is conceptually synonymous with Mumford et al.‘s Contractor. Due to these conflicting
results with regard to the Contractor role, however, significant main effects are only
predicted for Mumford et al.‘s Creator and Communicator roles.
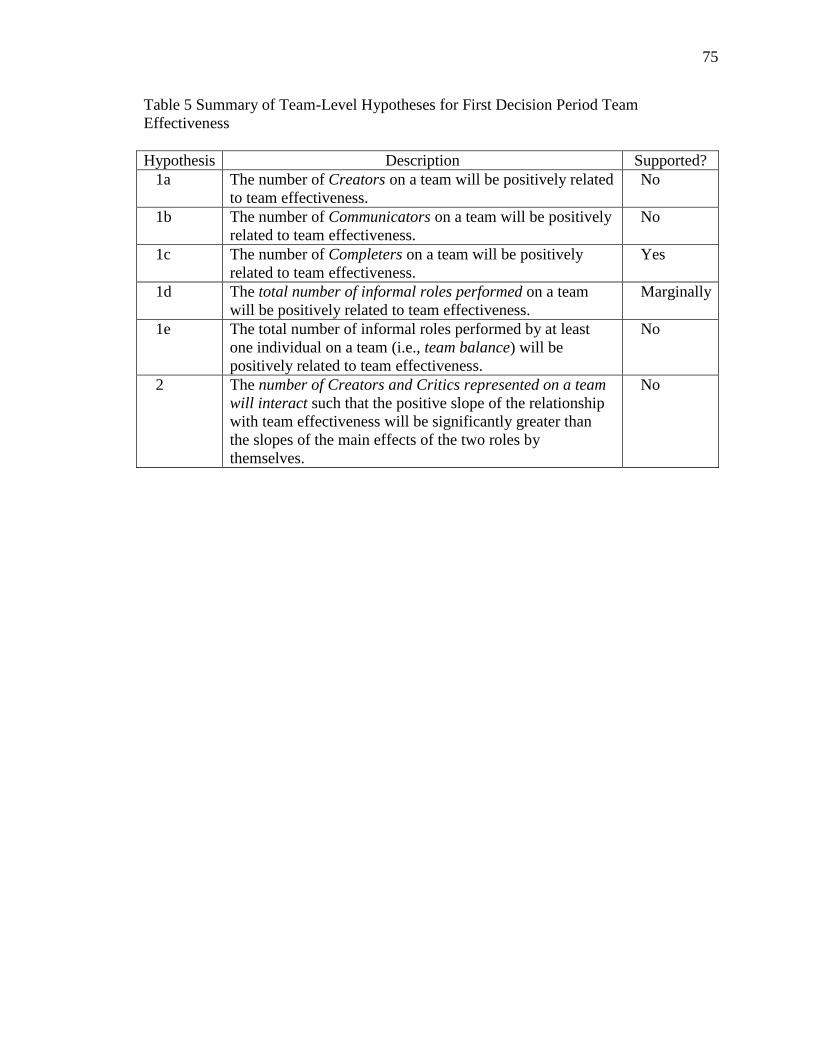
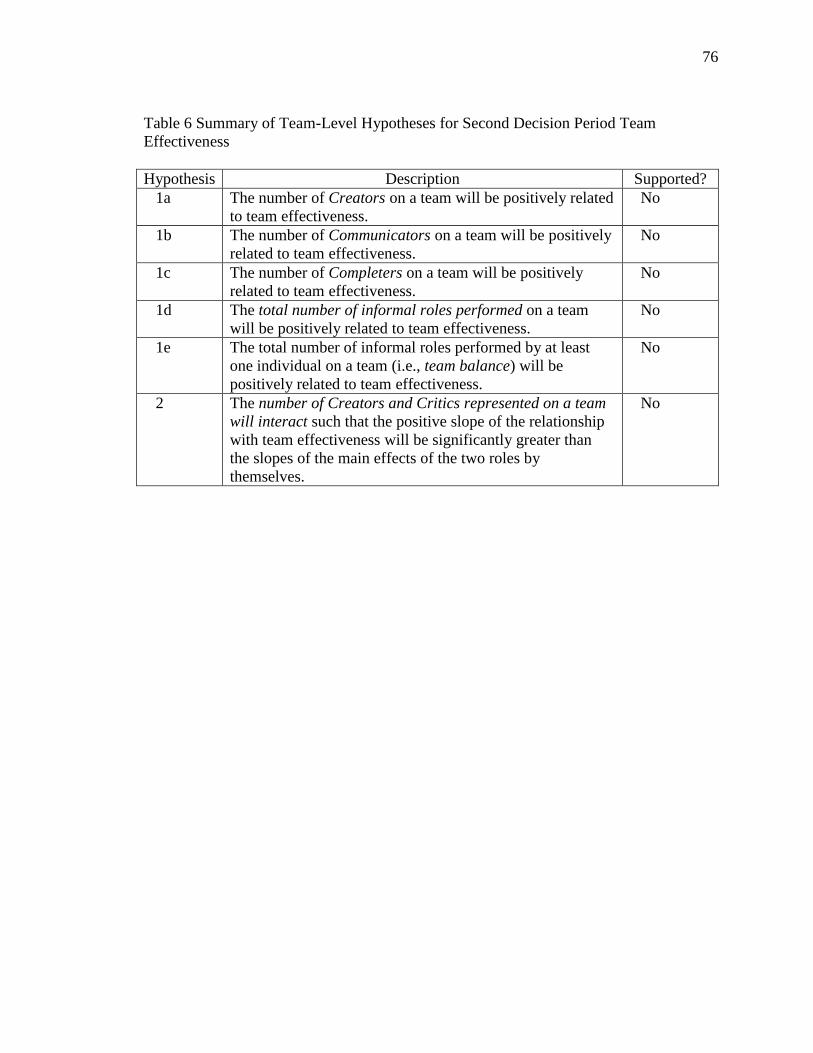
Hypothesis 1a: The number of Creators on a team will be positively related to
team effectiveness.
Hypothesis 1b: The number of Communicators on a team will be positively
related to team effectiveness.
Although past research has not found significant relationships between team
effectiveness and roles that are conceptually similar to Mumford et al.‘s (2006)
Completer role, I expect a relationship based on the following logic. Those performing
the Completer role take personal responsibility for completing different aspects of the
task and following through with those commitments. Furthermore, once critical task
information is shared, the Completer may work independently toward fulfilling
commitments. Consequently, as more team members adopt the Completer role, their
individual outputs should contribute directly toward successful task completion.
Page 29
22
Hypothesis 1c: The number of Completers on a team will be positively related to
team effectiveness.
When developing their integrative taxonomy, Mumford et al. (2006) included
only functional roles, or those thought to be beneficial to successful team functioning.
Therefore, it seems reasonable to expect that a team where every role is performed by
multiple individuals should be more effective than a team where every role is performed
by only one individual or zero individuals. Furthermore, the most effective team should
be that in which each team member performs all seven informal roles. Conversely, the
least effective team should be that in which the team members do not perform any
informal roles.
Hypothesis 1d: The total number of informal roles performed on a team will be
positively related to team effectiveness.
Belbin (1981) proposed the theory that balanced teams (i.e., teams with all roles
represented) would experience greater team effectiveness. Since then, other researchers
have tested Belbin‘s original theory as well as related variations, and most have found
little or no support for the relationship between balanced teams and team effectiveness
(i.e., Blenkinsop & Maddison, 2007; Partington & Harris, 1999; Senior, 1997; van der
Water et al., 2008). Despite this general lack of support, the present study revisits the
team balance theory. In the present study, however, the theory is tested using informal
roles from Mumford et al.‘s (2006) integrative and more comprehensive taxonomy.
Hypothesis 1e: The total number of informal roles performed by at least one
individual on a team will be positively related to team effectiveness.
Page 30
23
The interaction category of hypotheses refers to IRC in which the presence of two
particular roles results in an interaction effect. In other words, the relationship between
IRC and team effectiveness should contain a multiplicative effect when both roles are
represented. As an exploratory hypothesis, it is predicted that as more Creators provide
more unique decision alternatives, an increasing number of Critics should be needed to
evaluate those alternatives.
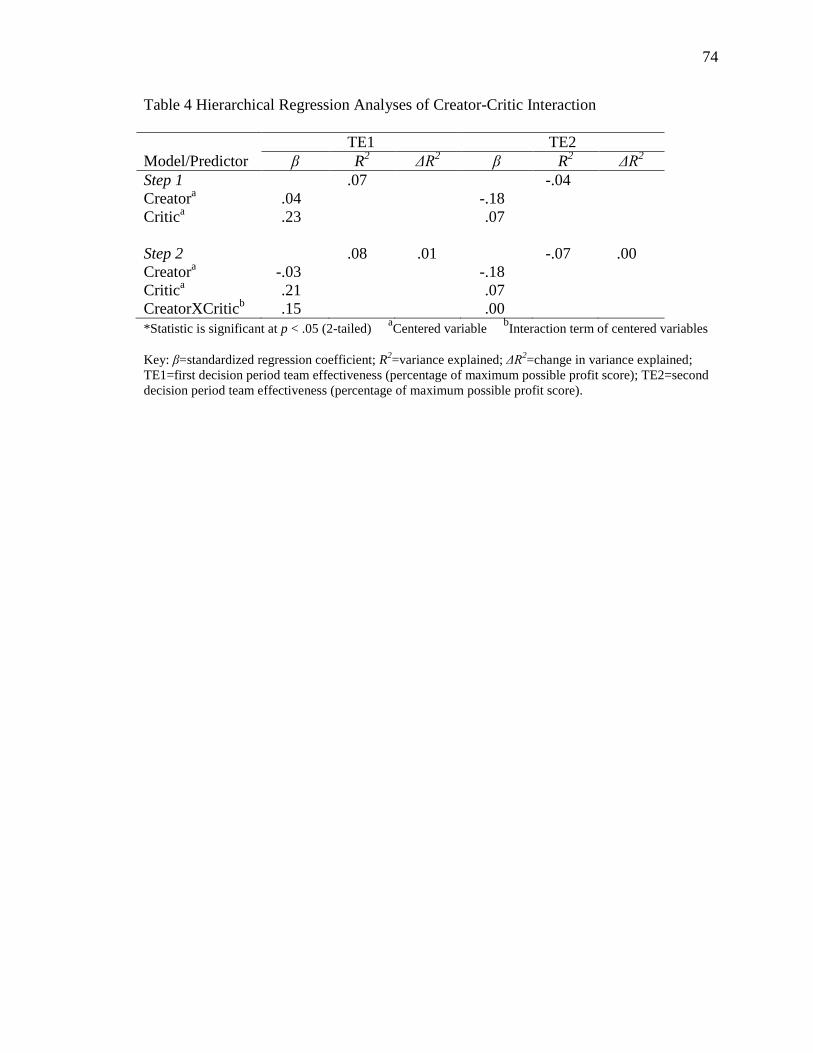
Hypothesis 2: The interaction between the number of Creators and Critics
represented on a team will demonstrate a stronger relationship with team effectiveness
than the main effects of the two roles such that the interaction will explain incremental
variance in team effectiveness over the two main effects.
Individual-Level Hypotheses
Individual-level hypotheses refer to the predicted relationships between each of
the Big Five dimensions and the adoption of specific informal roles. To begin with,
people high in Agreeableness exhibit behaviors that are compassionate and cooperative in
nature. In a similar manner, roles falling within the social role category (i.e.,
Communicator, Calibrator) involve compassionate and cooperative behaviors that
encourage a positive socioemotional environment within the team. Not surprisingly,
Stewart et al. (2005) and Mumford et al. (2008) found a statistically significant
relationship between Agreeableness and the social role category. As such, the following
hypotheses are proposed.
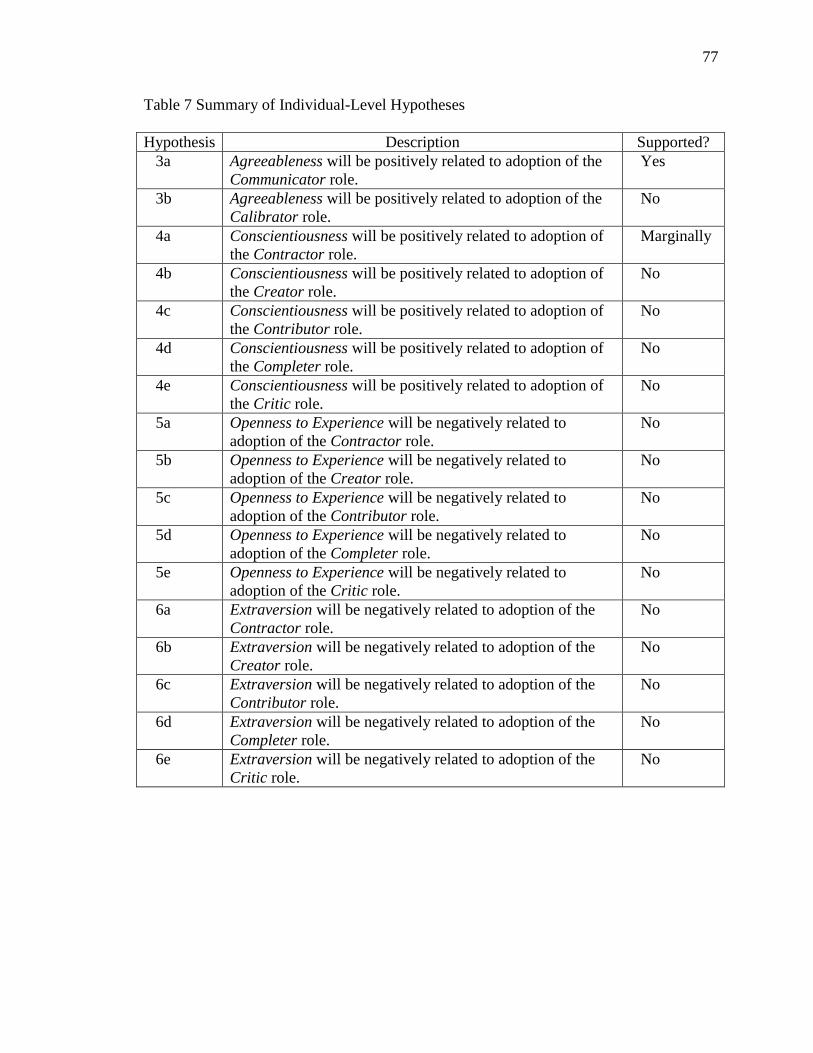
Hypotheses 3a-b: Agreeableness will be positively related to the adoption of the
following roles: (a) Communicator and (b) Calibrator.
Page 31
24
As evidenced by Stewart et al. (2005) and Mumford et al. (2008), the extent to
which individuals are emotionally stable tends to covary with the extent to which they
perform behaviors consistent with the task role category. However, Stewart et al. found a
negative relationship, whereas Mumford et al. found a positive relationship. Because of
this discrepancy, no hypotheses are offered for the relationship between Emotional
Stability and informal roles falling within the task role category (i.e., Contractor, Creator,
Contributor, Completer, Critic).
With regard to the Conscientiousness, Stewart et al. (2005) found that individuals
higher in this dimension tend to perform behaviors consistent with the task role category.
Because of this, individuals high in Conscientiousness should be more likely to perform
informal roles associated with the task role category.
Hypotheses 4a-e: Conscientiousness will be positively related to the adoption of
the following roles: (a) Contractor, (b) Creator, (c) Contributor, (d) Completer, and (e)
Critic.
Previous studies have found that Openness to Experience has a negative and
significant relationship with the task role category (Stewart et al., 2005). As such,
individuals high in Openness to Experience should be less likely to adopt informal roles
associated with the task role category.
Hypotheses 5a-e: Openness to Experience will be negatively related to the
adoption of the following roles: (a) Contractor, (b) Creator, (c) Contributor, (d)
Completer, and (e) Critic.
Stewart et al. (2008) found that individuals high in Extraversion perform task role
category behaviors to a lesser extent than those low in Extraversion. Therefore, it is
Page 32
25
proposed that Extraversion should be negatively related to informal roles associated with
the task role category.
Hypotheses 6a-e: Extraversion will be negatively related to adoption of the
following roles: (a) Contractor, (b) Creator, (c) Contributor, (d) Completer, and (e) Critic.
Page 33
26
CHAPTER 2. METHOD
2.1. Participants
Participants were recruited and sampled from the student population of Indiana
University – Purdue University Indianapolis. More specifically, the sample originally
consisted of 160 undergraduate students recruited from the university‘s Psychology
Department who were at least 18 years old at the time of the study. Most students
participated as part of an introductory psychology course requirement and received
course credit. After eliminating two teams, the final sample consisted of 152 students
divided into 38 four-person teams, and they were 22.2 years old on average, 71.1%
female, and 70.4% white. At the time of the study, participants had completed a mean of
50.2 college credit hours and had a mean cumulative GPA of 3.2 on a 4.0 scale. In
addition, 63.2% were employed at the time of participation and worked, on average, 22.0
hours per week. Finally, 77.0% of the sample had previous work team experience, while
2.6% had never been employed.
2.2. Design
In the present study, a correlational design was used and no variables were
manipulated. With regard to the team-level component, the informal role configuration
(IRC) variable was derived from each team‘s collection of informal roles, and team
Page 34
27
effectiveness was operationalized as a team‘s objective performance score calculated
from a decision-making task. The team task served as a vehicle allowing informal roles to
emerge. At the individual level of analysis, the link between personality and informal
roles was assessed. Specifically, the goal was to determine if certain Big Five personality
dimensions influence the adoption of certain informal roles.
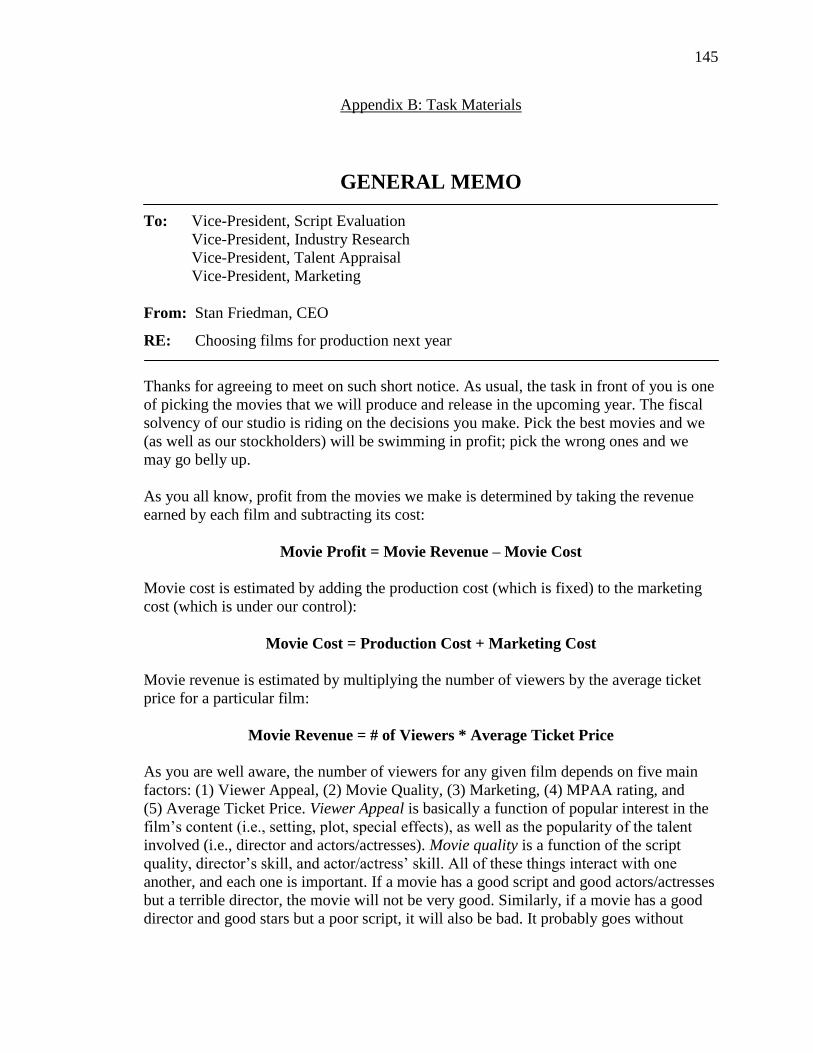
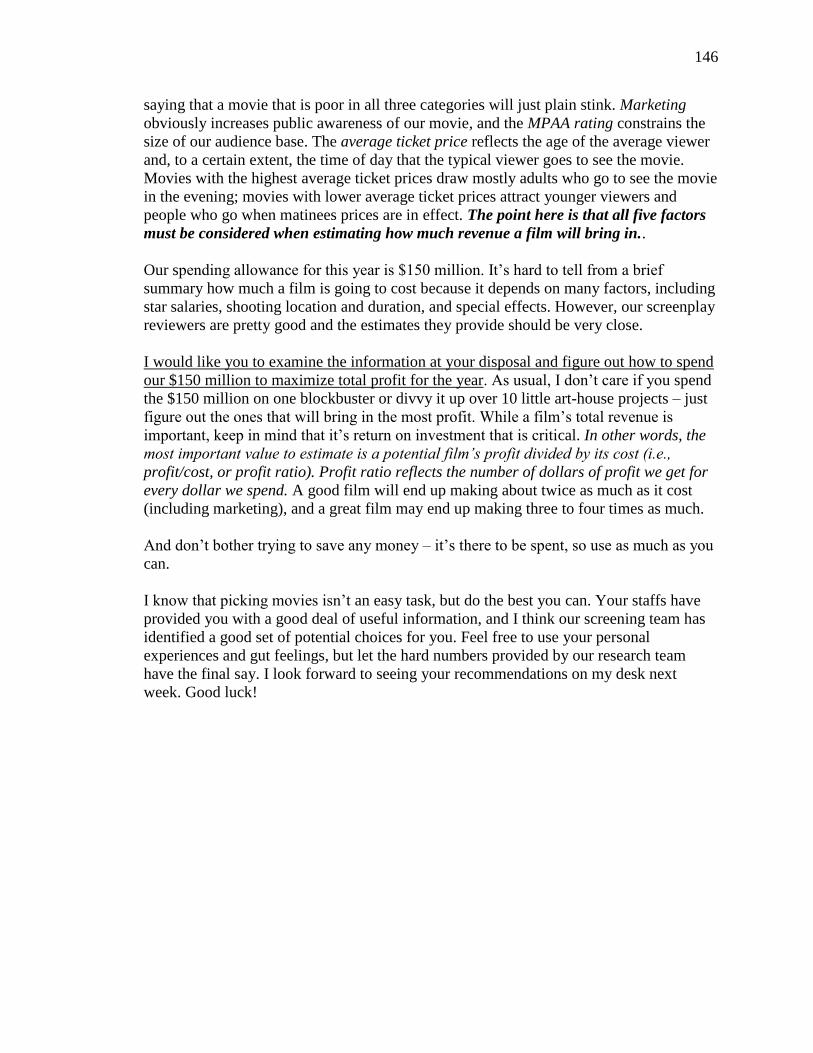
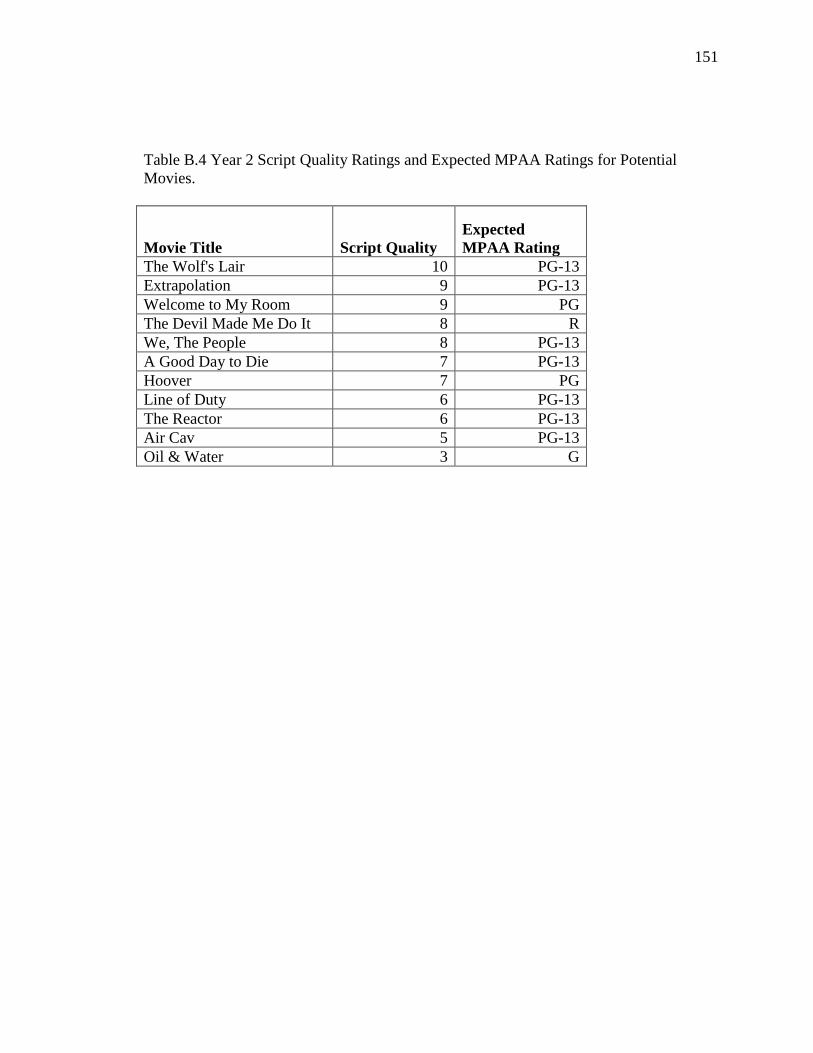
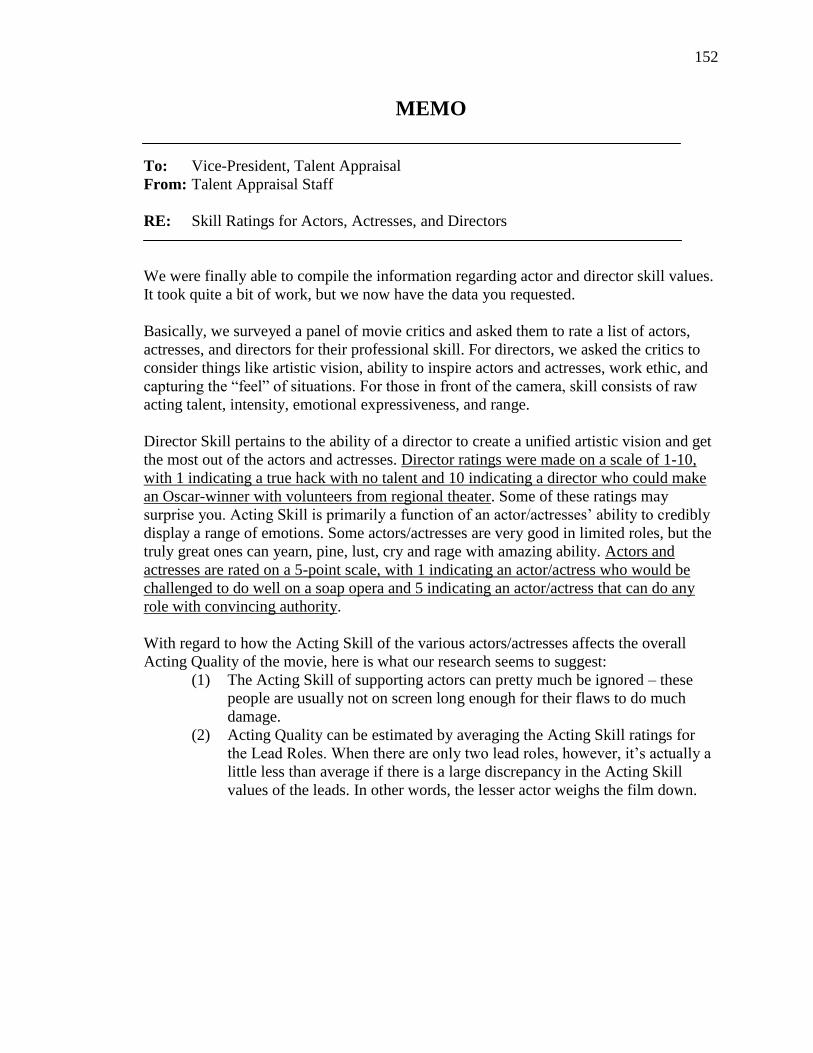
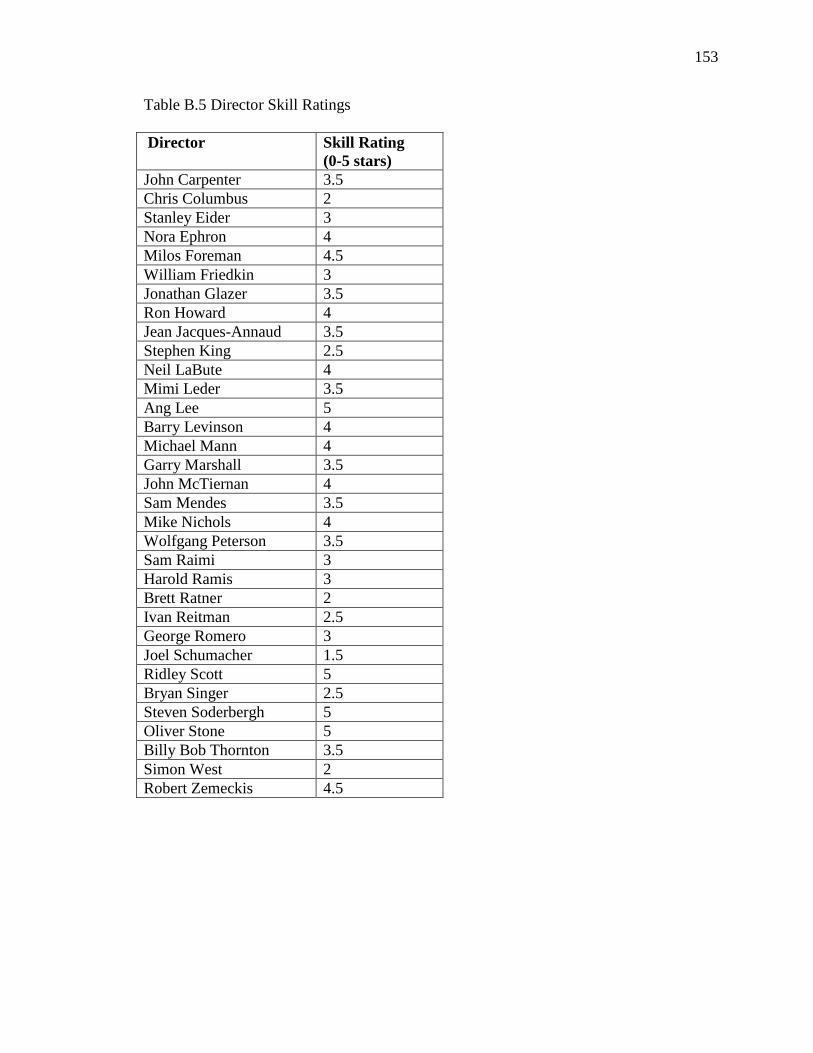
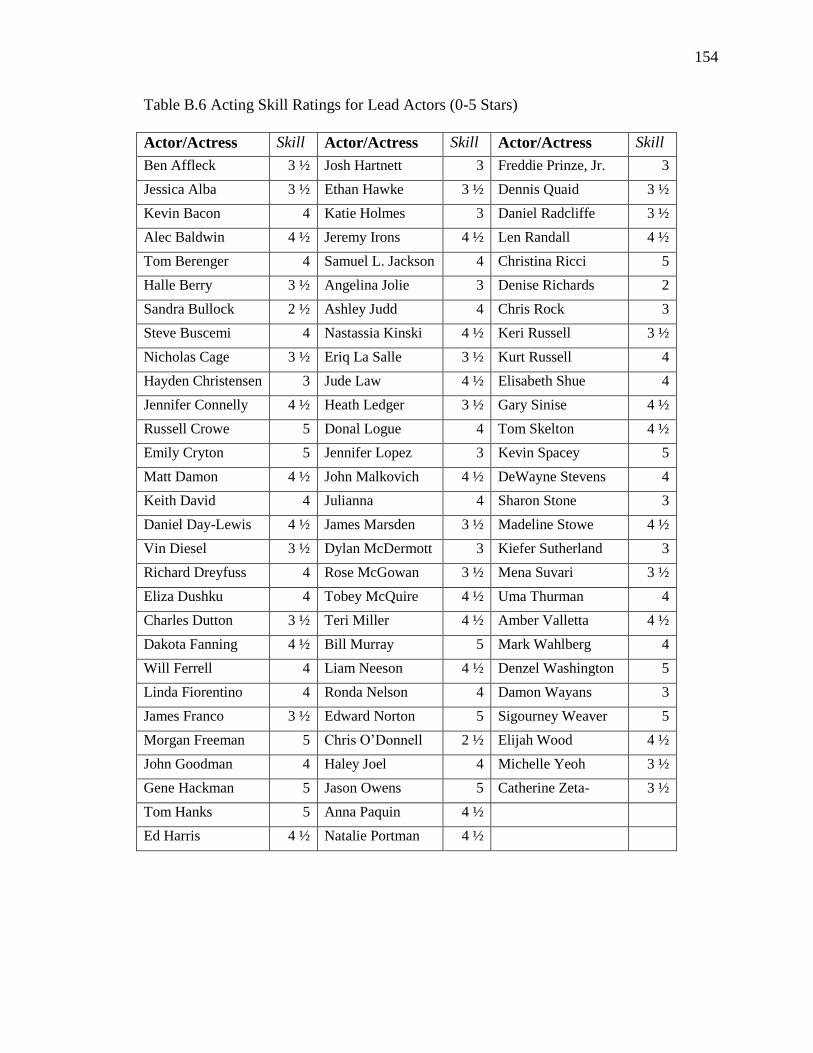
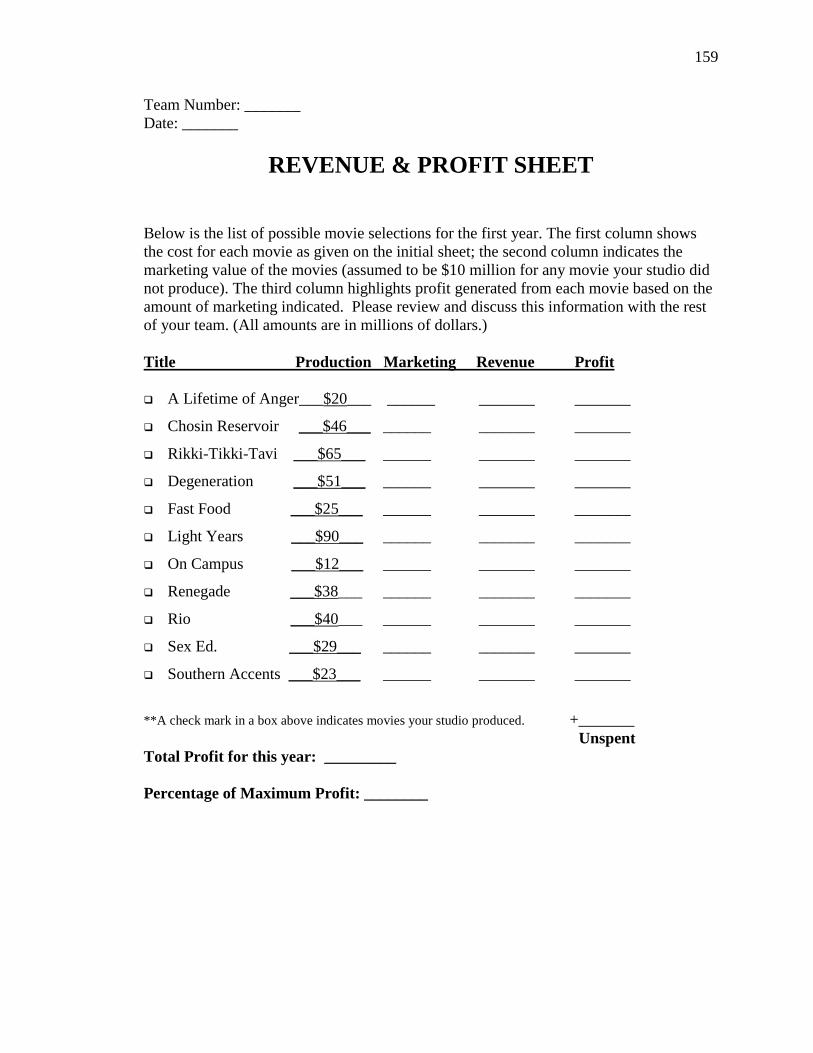
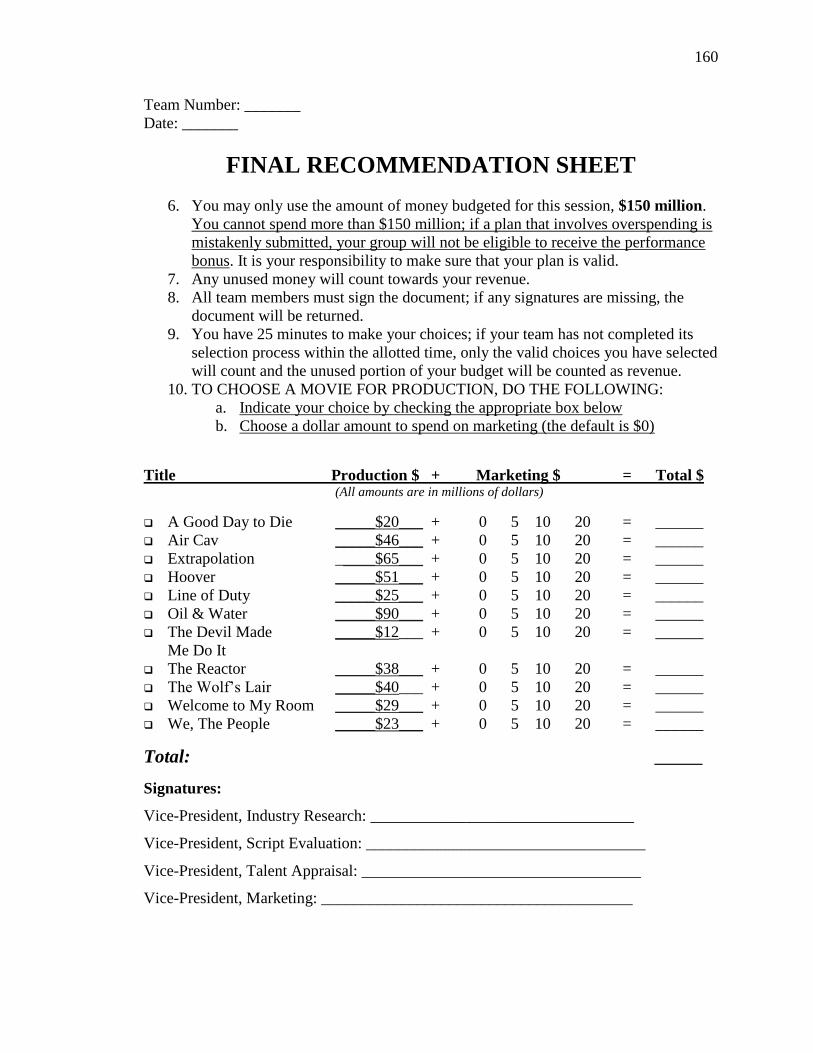
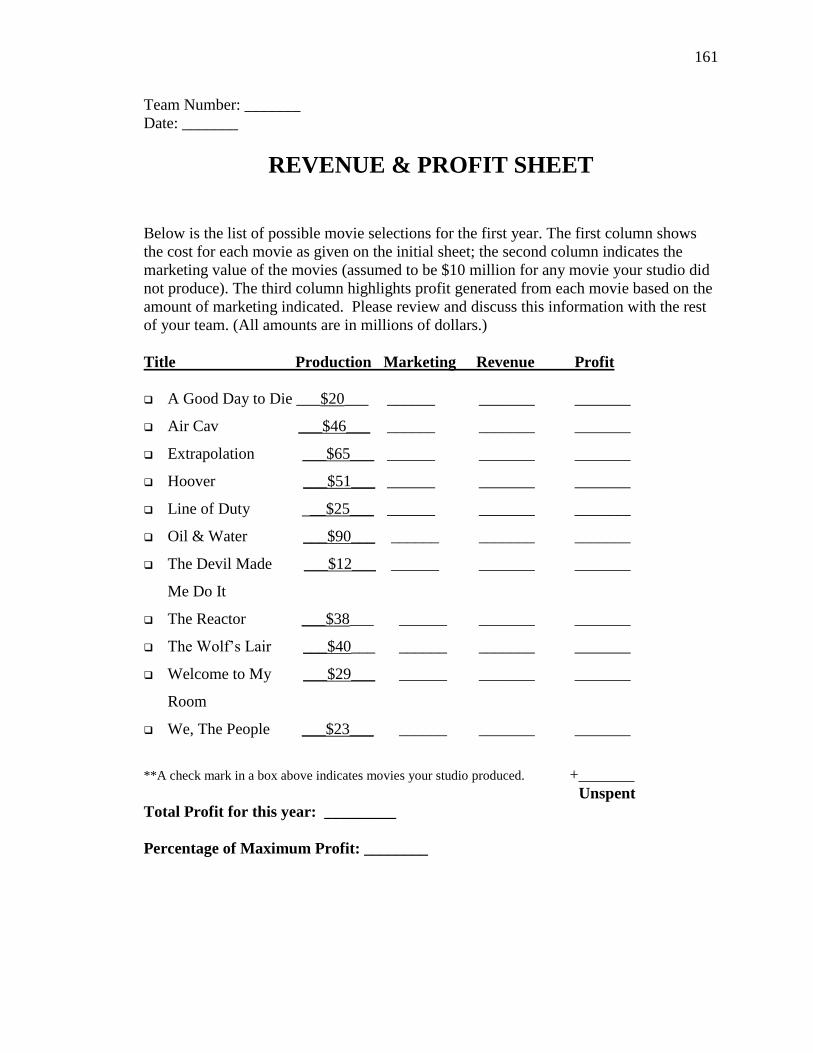
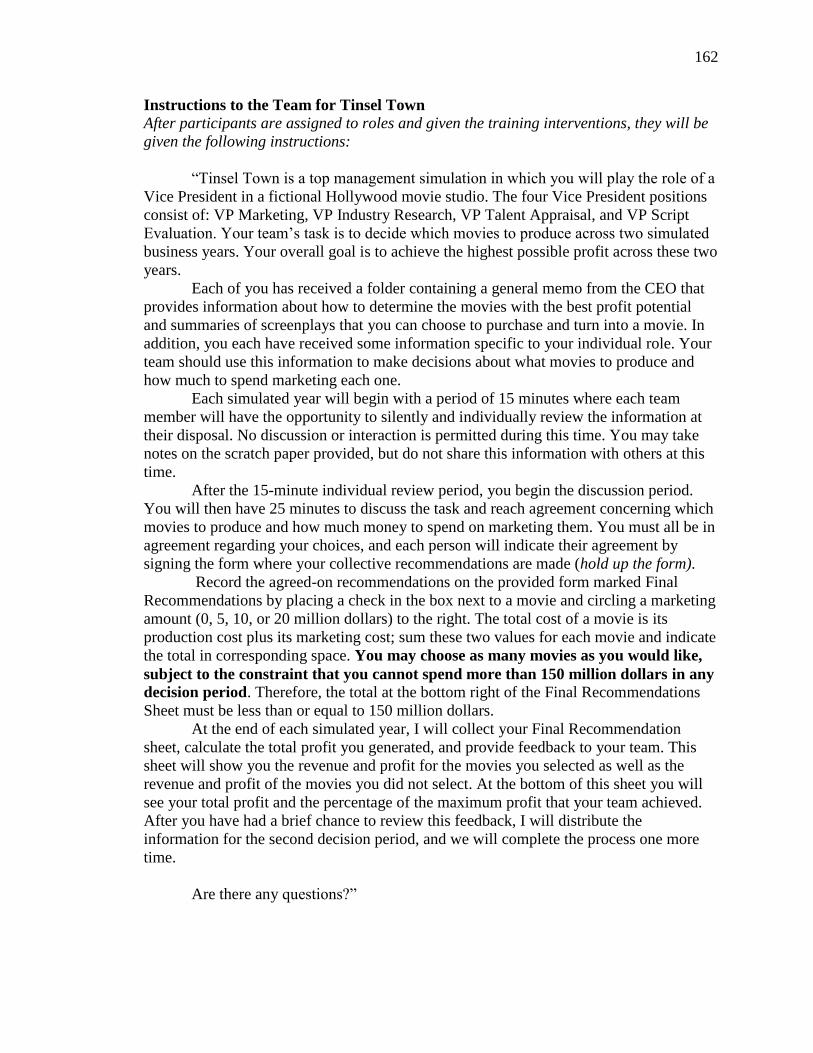
2.3. Task
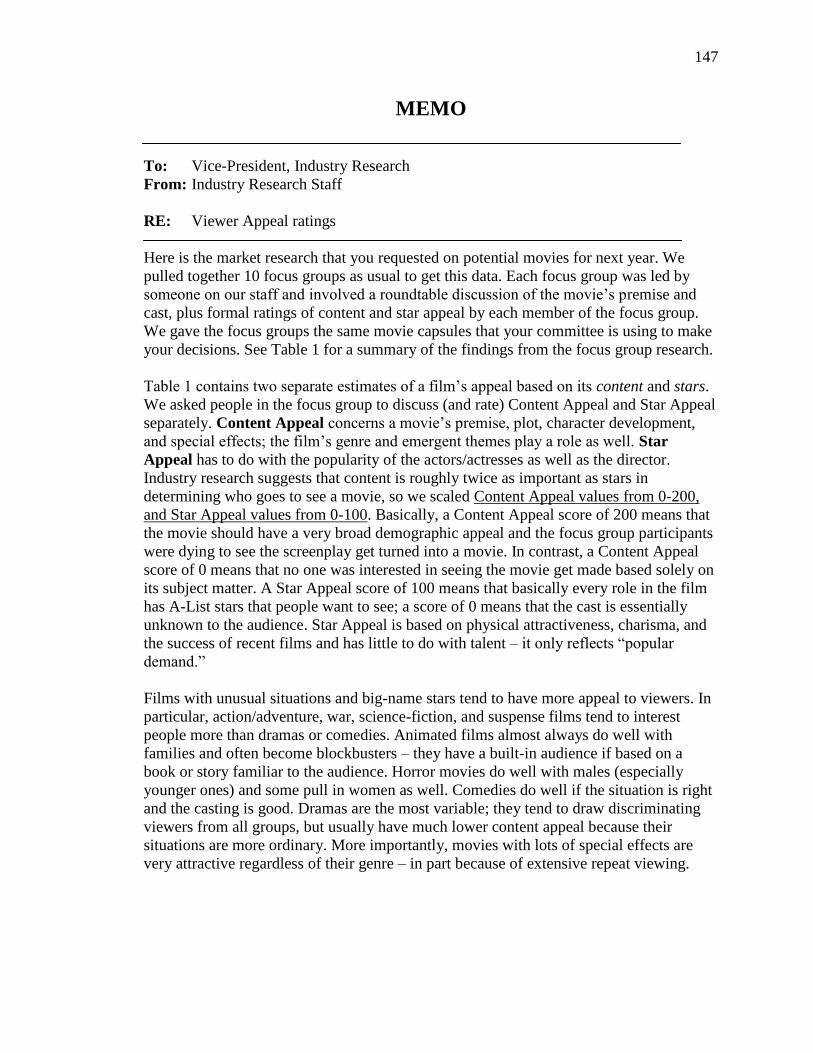
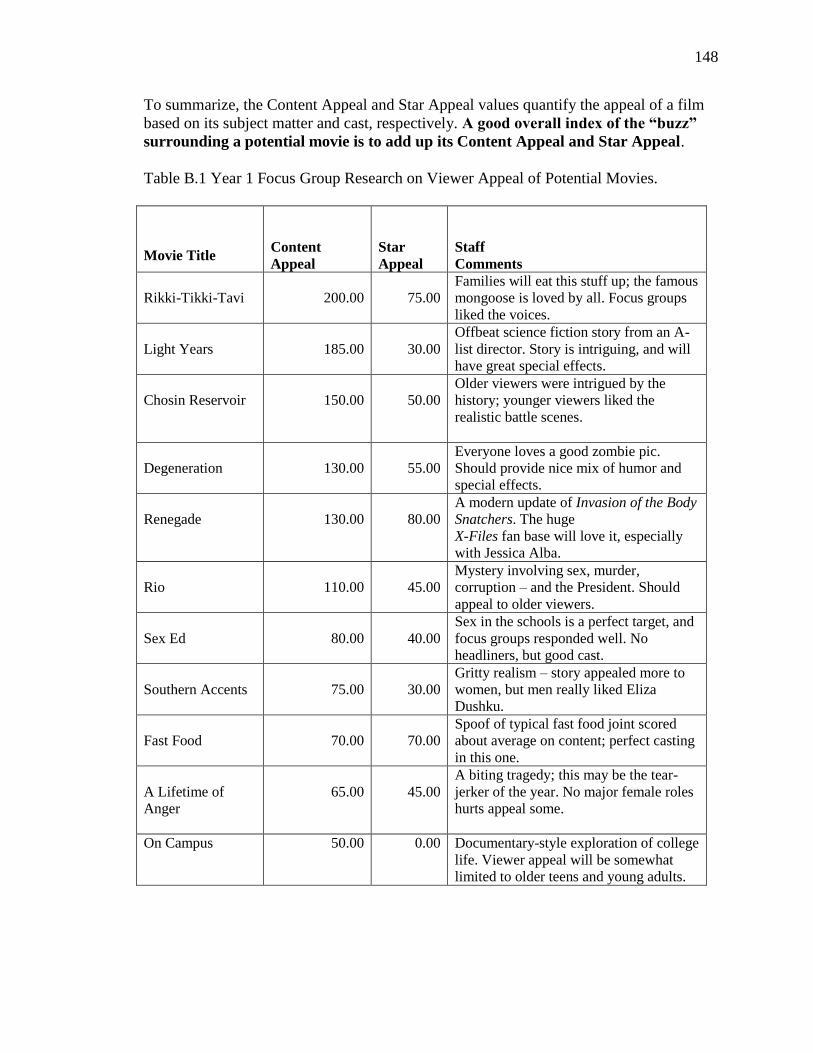
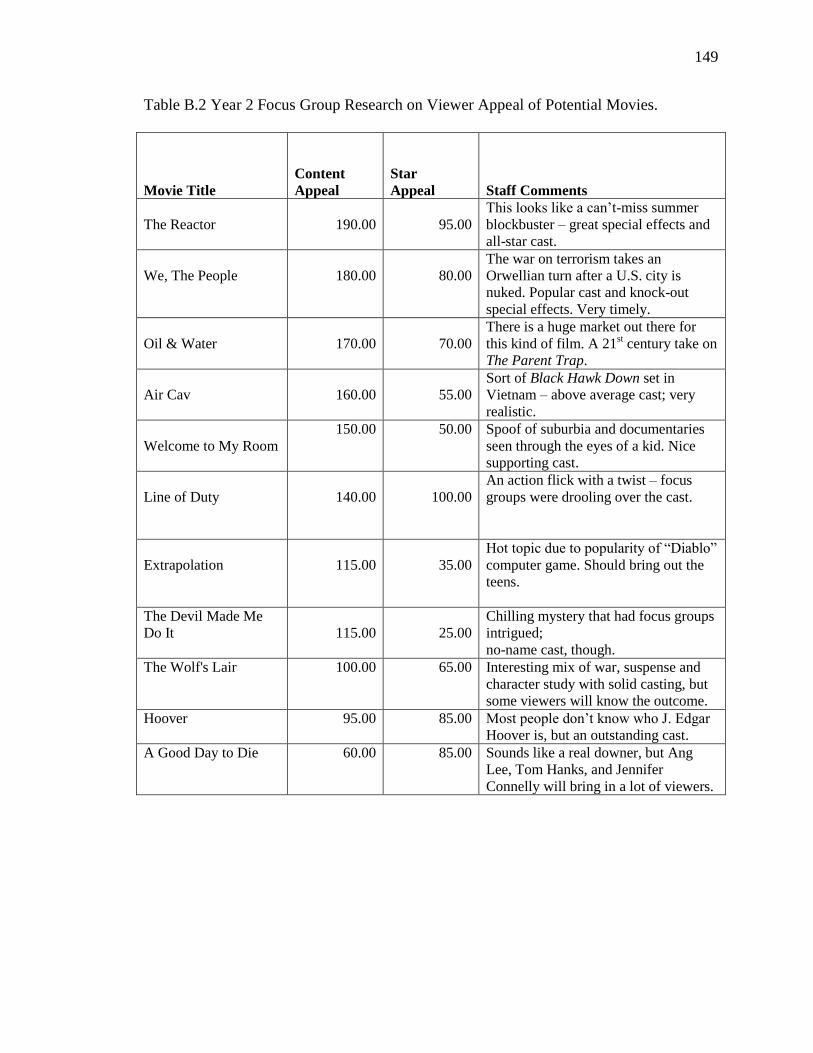
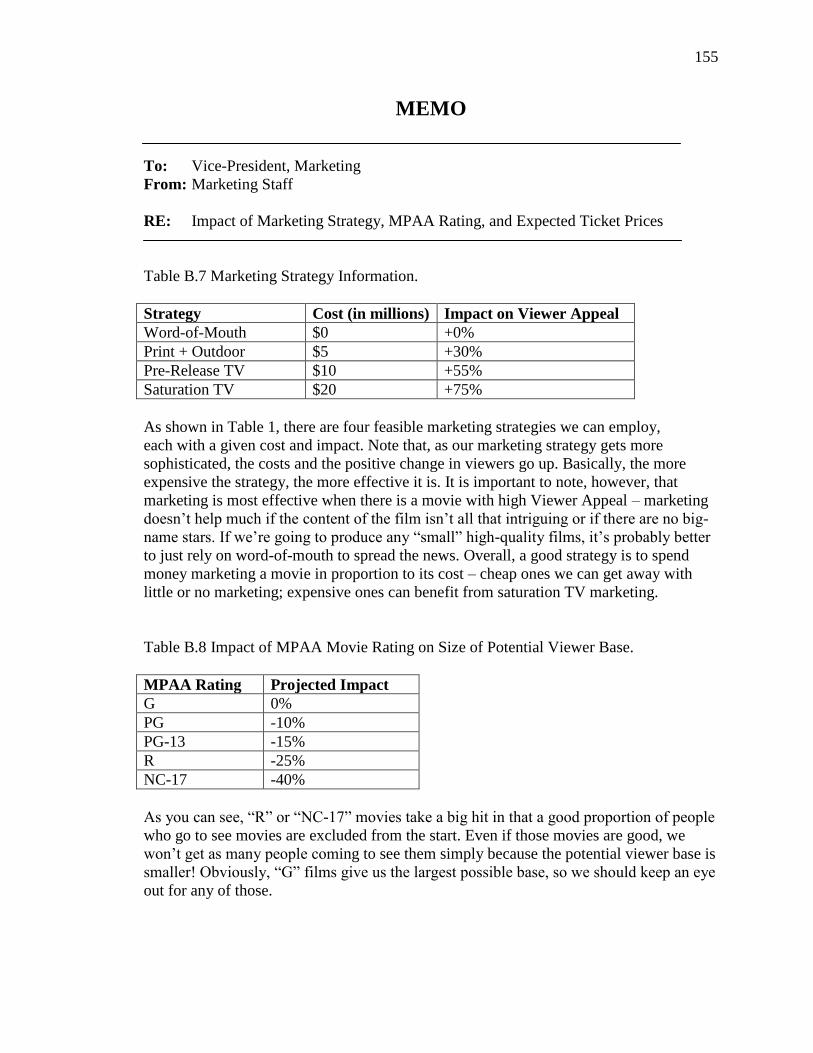
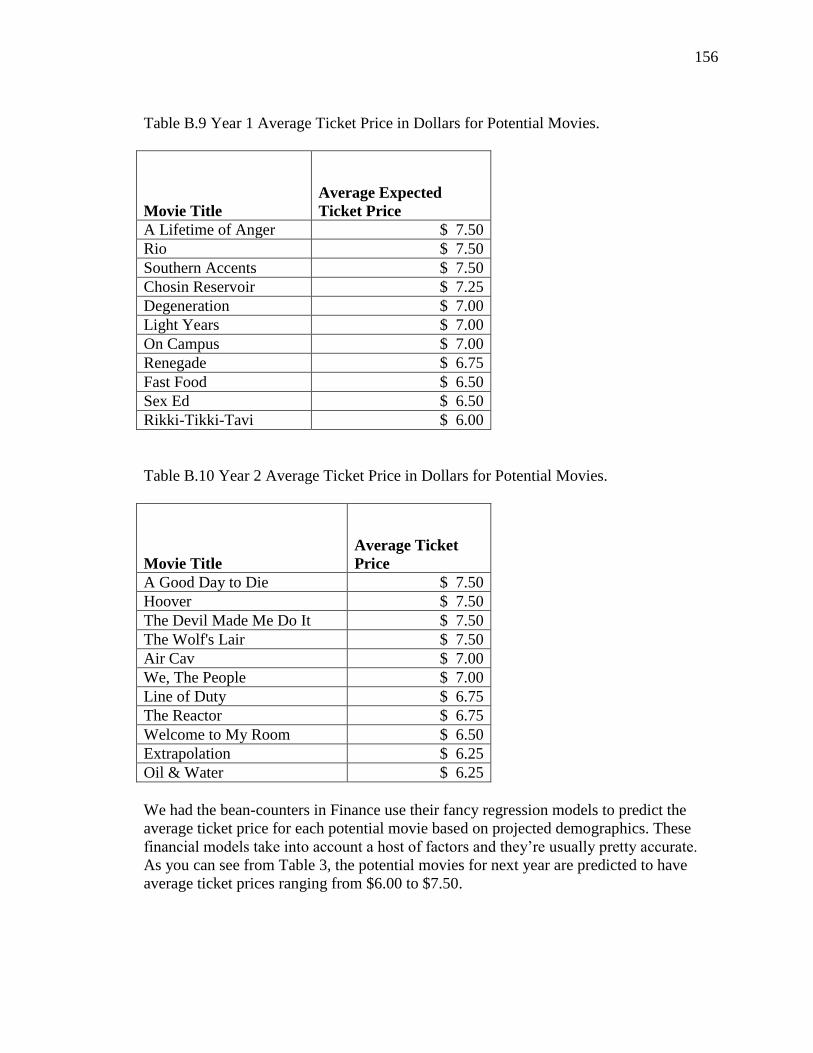
Tinsel Town (Devine et al., 2004) is a Hollywood film studio simulation where
participants play the part of executives in a top management team. Each management
team consists of four vice-presidents, representing the following four film studio
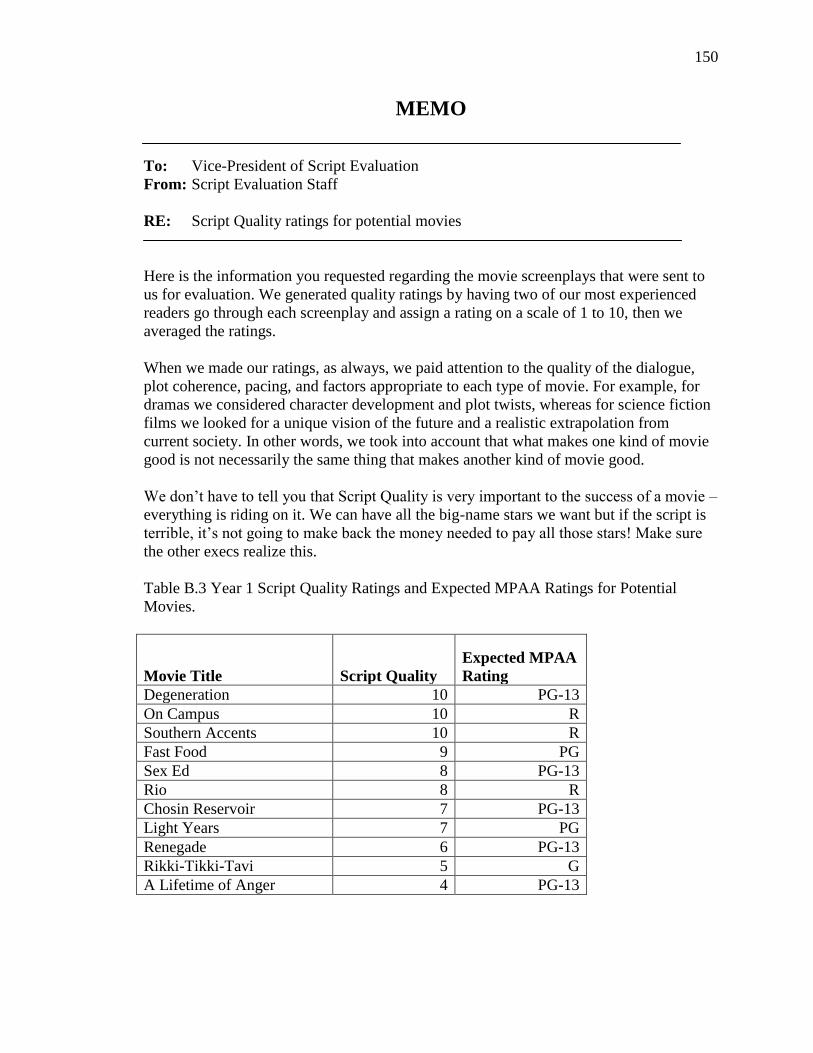
departments: (a) Marketing, (b) Industry Research, (c) Script Evaluation, and (d) Talent
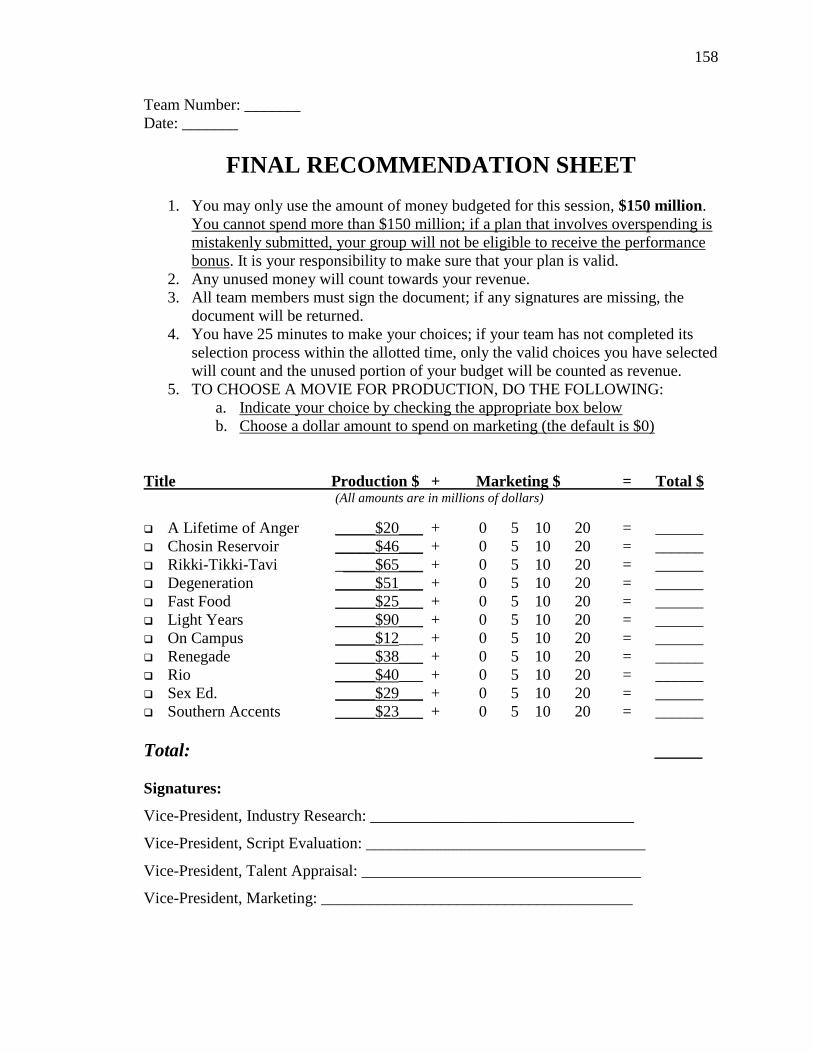
Appraisal. The goal for each team is to maximize total profit (i.e., revenue minus costs)
during two decision periods. In each decision period, teams review a set of 11 potential
films and collectively decide which film(s) to produce and how much to spend on
marketing, while operating under the constraint of a $150 million spending budget. The
11 films vary with respect to the cost to produce and how much revenue they generate at
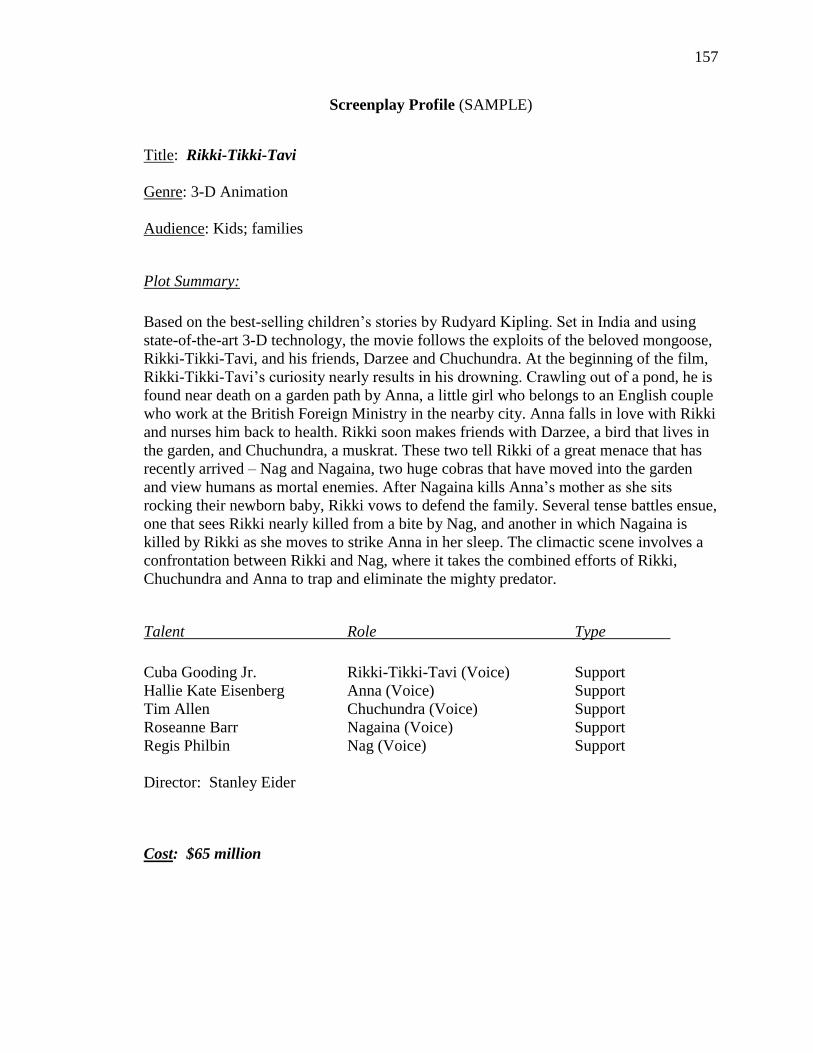
different marketing expenditure levels. To complete the task, all members are provided
with information for each film that includes a plot summary, a casting list of actors, and a
director. In addition, each vice-president receives critical information that is specific to
his/her department and not distributed to the other team members. Therefore, to
successfully perform the task, team members must engage in information sharing.
For the purposes of this study, teams completed two decision periods. Each
decision period lasted 25 minutes and represented a simulated year of production for the
Page 35
28
film company. During each decision period, team members collectively chose which
screenplays to produce and how much to spend marketing each film. Depending upon
how teams spent their $150 million budget, more than one film could be produced in a
decision period. Following each decision period, teams received performance feedback
regarding the total profits generated by the films produced. Teams also received a
percentage value that indicated how well a team‘s profit compared to the highest profit
possible for the decision period. For examples of Tinsel Town task materials, please refer
to Appendix B.
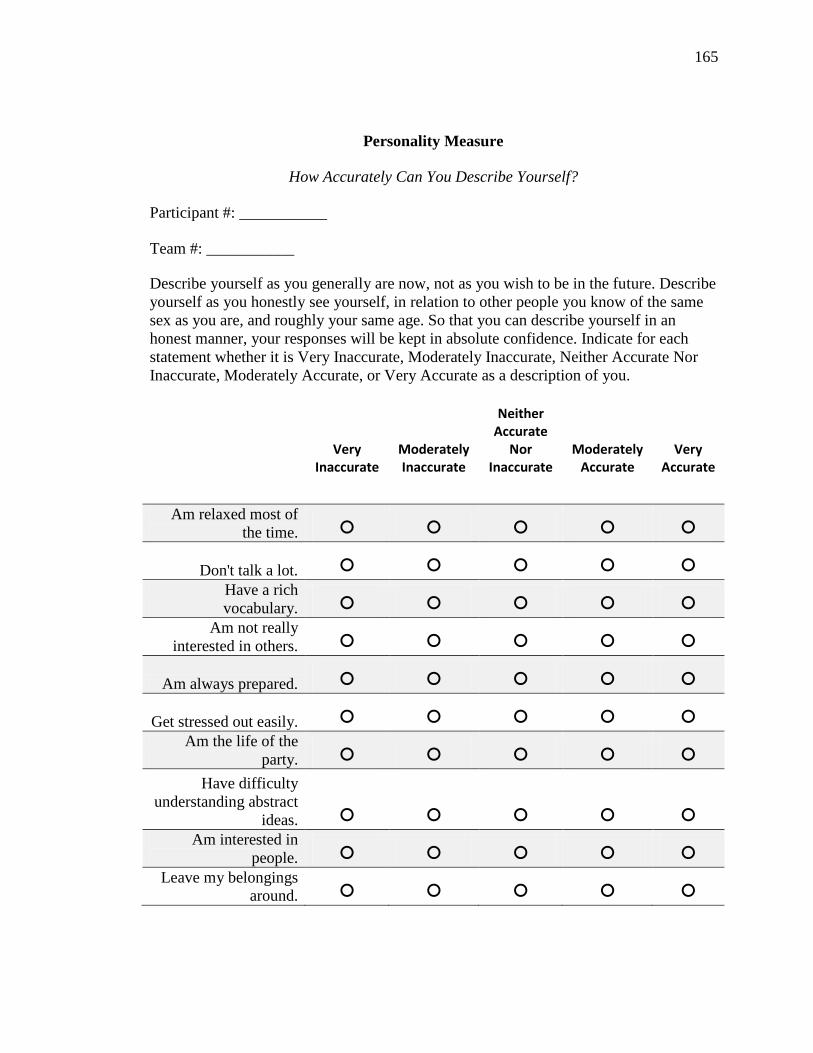
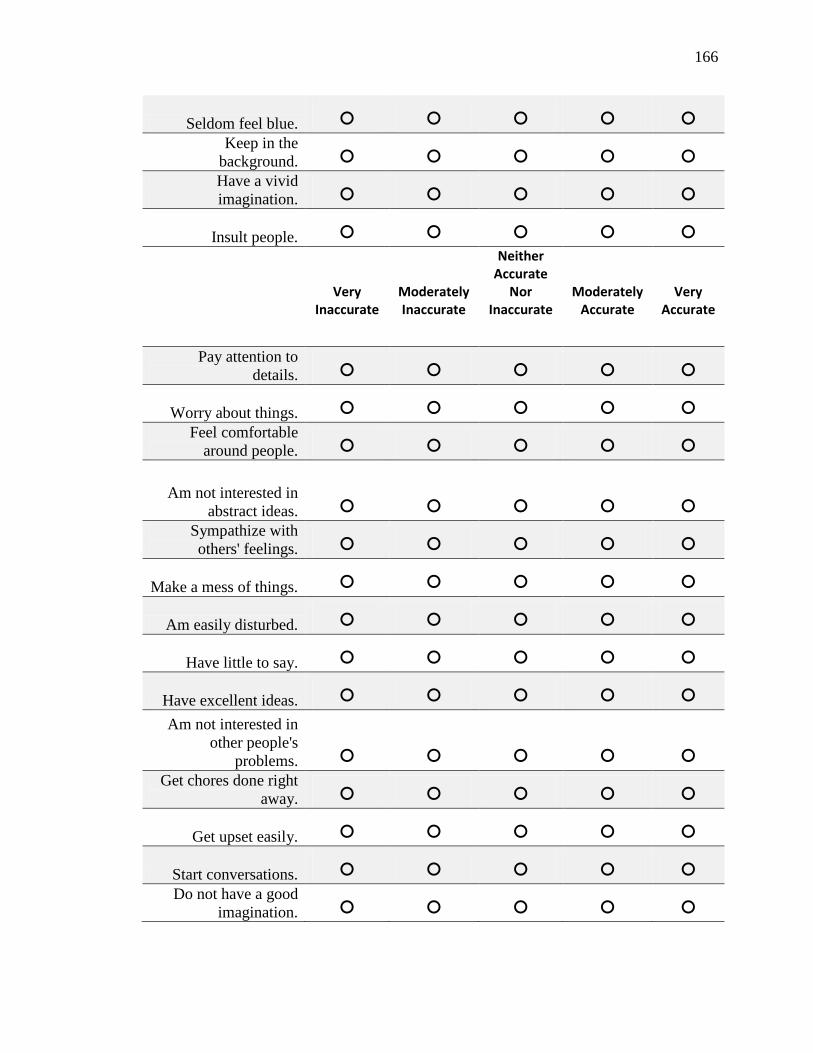
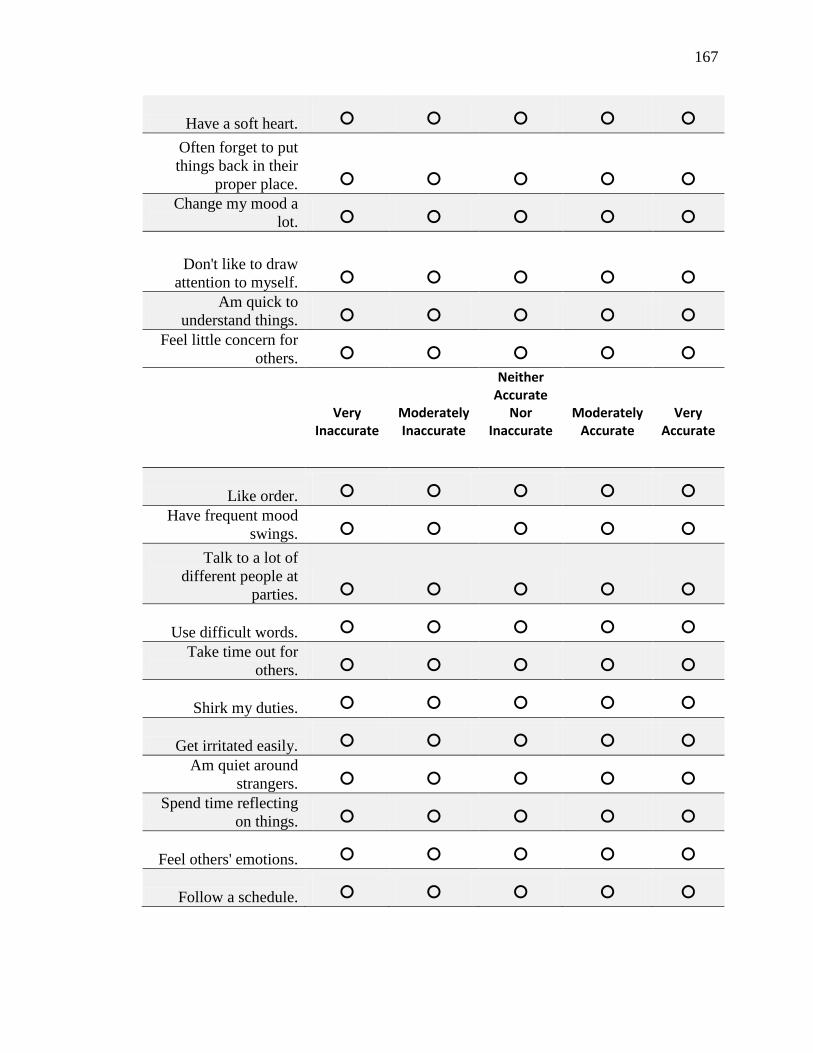
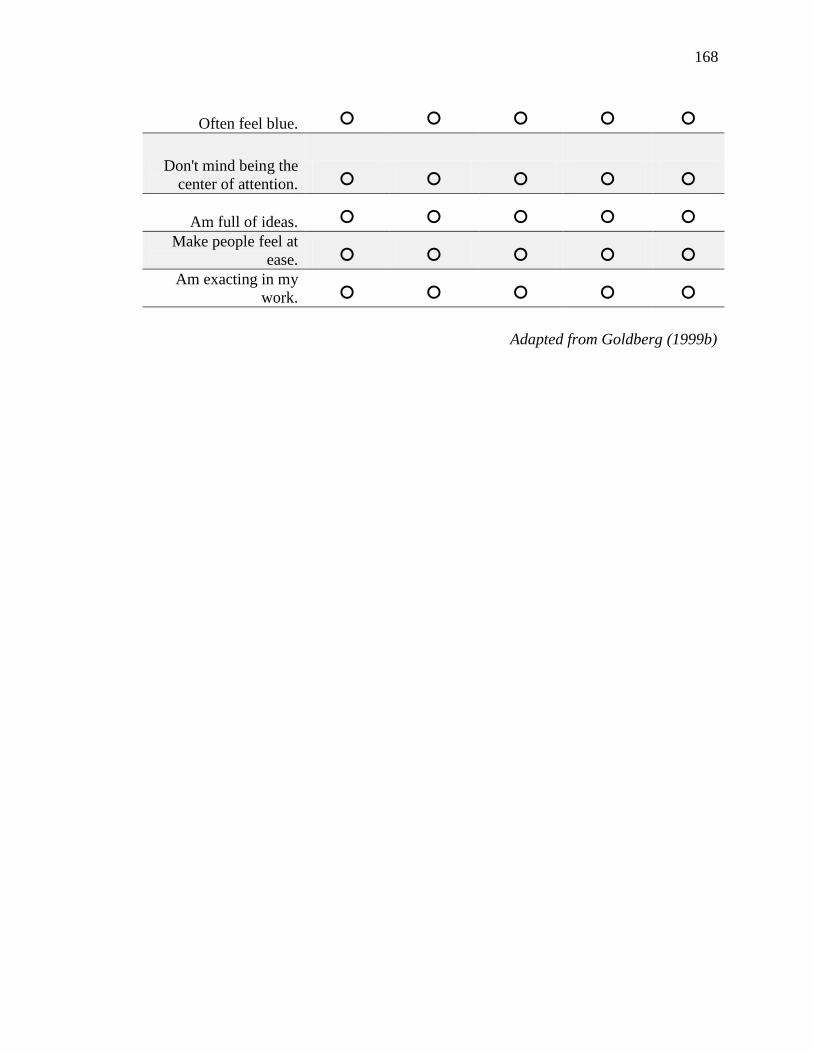
2.4. Measures
Personality
Personality was assessed using a measure of the Big Five obtained from the
International Personality Item Pool website (IPIP; Goldberg, 1999b). The IPIP website
(http://ipip.ori.org) contains a variety of public domain scales and measures that correlate
highly with previously published personality measures. For the present study, the Big
Five Factor Markers (BFFM) was used to assess the Big Five (see Appendix C). The
BFFM is IPIP‘s 50-item measure equivalent of the Trait Descriptive Adjectives
developed by Goldberg (1992), a measure of the Big Five. It is comprised of five scales
that correspond to each of the Big Five dimensions (i.e., Agreeableness,
Conscientiousness, Extraversion, Emotional Stability, Openness to Experience). Each
scale consists of 10 items that ask participants to rate the extent to which test takers view
the statement as accurate or inaccurate. Participants rate each item using a 5-point Likert-
Page 36
29
type response format with anchors ranging from (1) ―Very Inaccurate‖ to (5) ―Very
Accurate‖ with a neutral response of (3) ―Neither Accurate or Inaccurate.‖ Based on past
empirical studies, the IPIP website lists the following coefficient alpha reliability
estimates for each dimension of the BFFM: Agreeableness (.82), Conscientiousness (.79),
Extraversion (.87), Emotional Stability (.86), and Openness to Experience (.84). Based on
a sample of 152 participants in the present study, the corresponding coefficient alpha
reliability estimates were similar in magnitude to the IPIP values: Agreeableness (.81),
Conscientiousness (.83), Extraversion (.86), Emotional Stability (.84), and Openness to
Experience (.79).
Informal Roles
A modified version of Mumford et al.‘s (2006) Team Role Performance (TRP)
test was administered to assess informal role performance and to later dichotomously
code whether a participant performed each role. The modified version contains 21-items
as opposed to the 27 items found in the original version. The design of the present study
(i.e., participants did not interact with others outside of their team) did not warrant the use
of items pertaining to the boundary-spanning roles of Consul and Coordinator, so only
seven of the informal roles found in the updated 9-role Mumford et al. (2008) taxonomy
were assessed. Three-item scales were used to capture each of the seven remaining
informal roles. Each item consists of a behavior statement (e.g., ―Stepped in if there were
negative feelings in the team to help resolve the difficulties.‖) corresponding to a specific
informal role (e.g., Calibrator). Participants rated each item using a 5-point Likert-type
response format ranging from (1) ―to no extent‖ to (5) ―to a very great extent.‖ To
Page 37
30
calculate a score for an informal role, the ratings from the three-item subscale associated
with that role were averaged.
In order to assess the informal role performance of each participant, two sets of
TRP ratings were used. First, each participant completed the self-rating version of the
TRP (see Appendix C) and rated himself/herself on those same informal role behaviors.
Then, each participant completed the team member-rating version of the TRP (see
Appendix C) and rated the extent to which each of his/her three team members
demonstrated specific informal role behaviors. In this way, each team member received
four sets of ratings (i.e., one self-rating, three team member ratings) related to his/her
informal role performance. With regard to coefficient alpha reliability estimates for each
informal role self-rating scale, the results were as follows: Contractor (.84), Creator (.85),
Contributor (.76), Completer (.75), Critic (.72), Communicator (.83), and Calibrator (.82).
As for team member-ratings, the coefficient alpha reliability estimates were calculated for
each informal role by assessing a 9-item scale that consisted of 3-item scale ratings
completed by each of three team members for the target participant: Contractor (.84),
Creator (.82), Contributor (.82), Completer (.74), Critic (.80), Communicator (.74), and
Calibrator (.82).
Interrater agreement was also calculated to determine the extent to which raters
(i.e., one self, three team members) agreed regarding each participant‘s informal role
performance. First, interrater agreement was calculated for the three sets of team
member-ratings completed for each participant. Interrater agreement was estimated for
each team by calculating rwithin-group (rwg) coefficients using a uniform null distribution,
which assumes no systematic bias (James, Demaree, & Wolf, 1984). Each rwg coefficient
Page 38
31
indicates the percent reduction in observed variance relative to the variance that would
have occurred had participants responded at random. For instance, the rwg of .72 for the
Contractor indicates a 72% reduction. For the team member-ratings, the rwg averages
across 38 teams were as follows: Contractor (.72), Creator (.70), Contributor (.85),
Completer (.73), Critic (.51), Communicator (.89), and Calibrator (.66). Interrater
agreement was then calculated in the same manner using all four sets of ratings per
individual (i.e., one self, three team member). The resulting rwg averages were: Contractor
(.63), Creator (.67), Contributor (.88), Completer (.60), Critic (.72), Communicator (.45),
and Calibrator (.80). Thus, incorporating the self-rating in the computation only increased
the rwg average for the Contributor, Critic, and Calibrator roles, and the rwg for the
Communicator decreased considerably from .89 to .45.
To assign informal roles to individuals, the four sets of ratings (i.e., one self, three
team member) were combined for each individual. First, the average three-item scale
rating for each informal role was averaged across the four raters in order to create an
overall mean score for performance on that particular role. If the overall mean informal
role score met or exceeded 4.00 (i.e., ―to a great extent‖), that particular informal role
was coded as ―performed.‖ Conversely, if an overall informal role score fell below 4.00,
the role was coded as ―not performed.‖ For example, a hypothetical participant rated
herself on the three items associated with the Contractor scale, resulting in an average
scale rating of 3.33. Each of her three team members also rated her along the same three
items, resulting in average scale ratings of 5.00, 4.67, and 3.67. The overall informal role
score average across the four raters‘ average scale ratings was accordingly 4.17. Thus,
because 4.17 is greater than 4.00, the Contractor role was coded as ―performed‖ for the
Page 39
32
hypothetical participant. In this way, each individual received a set of seven
dichotomously coded informal role scores.
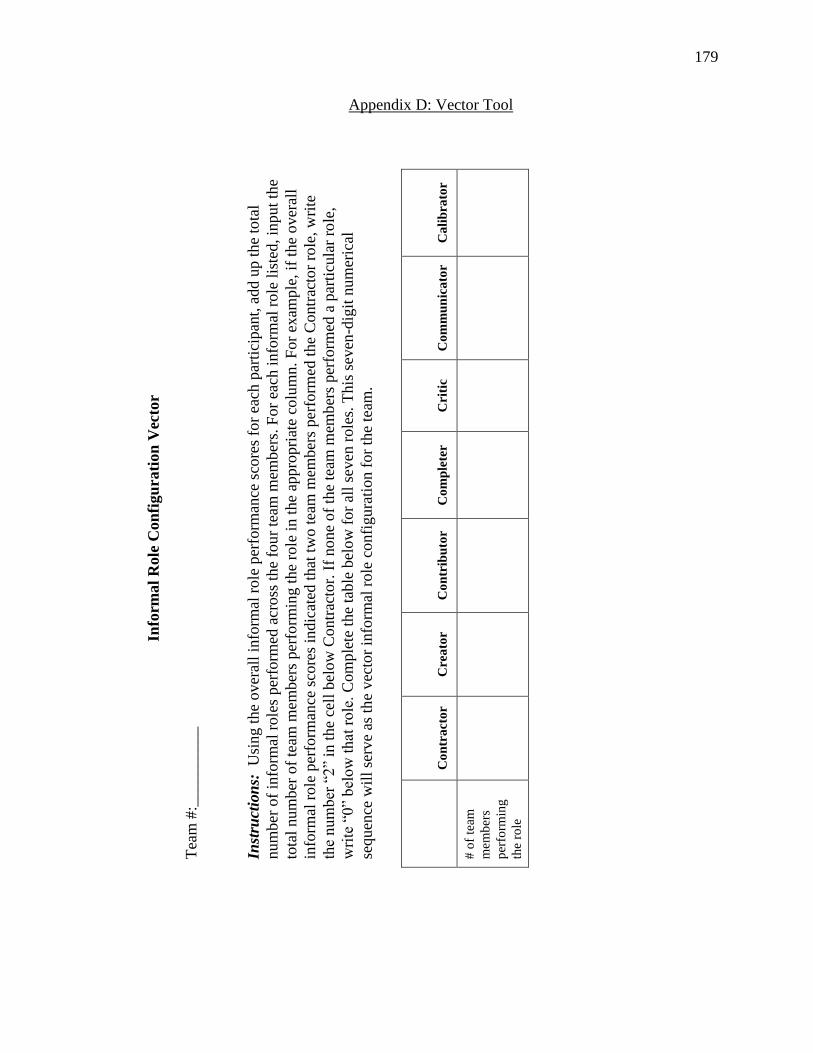
Informal Role Configuration
An IRC represents the number of individuals performing various roles within a
team. In the present study, vectors were used to operationalize IRC by identifying the
number of individuals performing each of seven roles within a team. Information for each
team‘s IRC vector was compiled in the tool found in Appendix D. Each vector consists of
a 7-digit numerical code to describe each team‘s role configuration. The code is read
from left to right where each digit‘s location in the sequence corresponds to a specific
informal role and the digit‘s numerical value represents the number of team members
performing the role. The order of the informal role sequence is as follows: (a) Contractor,
(b) Creator, (c) Contributor, (d) Completer, (e) Critic, (f) Communicator, and (g)
Calibrator. Because the present study holds team size constant at four members per team,
vectors can range from 0000000 (i.e., no one on the team performed any of the seven
roles) to 4444444 (i.e., all four team members each performed all seven roles). The
primary advantage of vectors is that, at a glance, they identify all roles performed, the
number of individuals performing each role, and all roles not performed. Further, as in
the case with the team balance hypothesis (Hypothesis 1e), vectors can be used to
determine roles performed by at least one team member.
Page 40
33
Team Effectiveness
Team effectiveness was measured via a team‘s total profit for each decision
period. Specifically, team effectiveness was measured objectively using algorithms from
the Tinsel Town (Devine et al., 2004) simulation. The revenue generated by each film
(i.e., the product of the number of movie viewers and the average ticket price) was
dependent upon the marketing level selected. That is, teams chose to produce films at
specific marketing levels, and each marketing level had a revenue value associated with it
that was unknown to the participants. The profit for each movie produced was calculated
by subtracting the cost to produce a film (i.e., the sum of production costs and marketing
costs) from the revenue generated. To determine the total profit, the profits from each
film produced were summed within each of the two decision periods. Next, a profit score
for each decision period was calculated by dividing the total profit obtained by the
highest possible profit for the simulation (i.e., the profit generated by the ideal set of
films with the optimal marketing strategy). The resulting proportion was multiplied by
100 to yield a percentage called a team effectiveness score. This process generated two
team effectiveness scores — one for each decision period. As a final step, the team
effectiveness scores from the two decision periods were averaged to determine overall
team effectiveness.
Background Measures
In addition to the focal measures described above, demographic variables were
collected (see Appendix C). Information on gender, ethnicity, age, total college credit
hours completed, and cumulative university GPA was collected to characterize the
Page 41
34
composition of the sample. Given that the target population of this study is work teams,
participants were also asked how many hours per week they currently worked and if they
had work team experience. The purpose of collecting the background measures was to
characterize the nature of the sample for comparison purposes should future replications
or extensions of the present study be conducted.
2.5. Procedure
To participate in the study, the majority of student volunteers accessed the
Psychology Department‘s online student subject pool, while about 20% signed up by
accessing an online sign-up site created by the experimenter. With regard to the online
student subject pool, this study and others appeared on the website with a brief study
narrative describing the characteristics and time duration of the study. If interested,
students could choose to volunteer as a participant for a specific session in a specific
room on campus.
At their respective sessions, participants first received a personality measure and a
background measure and were instructed to complete both measures to the best of their
abilities. Upon completing the initial measures, participants were assigned participant and
team numbers and asked to write the numbers on the top of their personality and
background measures. The experimenter then divided the participants into four-person
teams and separated the teams by placing them in different private rooms.
Once in their rooms, teams were then read the instructions for the Tinsel Town
(Devine et al., 2004) task (see Appendix B) and the four folders were randomly
distributed containing information specific to each vice-president position. Teams then
Page 42
35
commenced a 15-minute silent study period in which each participant privately reviewed
the information in his/her folder. After the 15-minute silent period ended, participants
were given 25 minutes to decide which films they wished to produce and how much to
spend marketing each one. When 5 minutes remained in the first decision period, if teams
had not finished, teams were given a verbal warning of the time remaining. About 25% of
teams completed the task by the 5-minute warning. After the teams completed the first
decision period, the experimenter calculated the percentage of total possible profit that
each team achieved and the percentage of the total profit relative to the total possible for
the decision period. Then, teams were given 5 minutes to review their performance
feedback.
For the second decision period, each team member was assigned the same vice-
president position as the first decision period, and four new folders were handed out to
team members containing information on 11 new films. In addition, participants were
told that they could use the information provided in the folder from the first decision
period. Participants were then given another 15-minute silent period to privately review
the information in their folders. Once the silent period ended, teams began a second 25-
minute decision period. Like the first period, teams received a verbal warning with 5
minutes remaining if they had not yet completed the task. After the end of the second
decision period, the experimenter once again provided performance feedback.
After reviewing the performance feedback for 5 minutes, the modified TRP
(Mumford et al., 2006) self-report rating measure and three team member-rating
measures were distributed to each team member. In front of each participant, the
experimenter placed a folded note card with the participant‘s identification number. Each
Page 43
36
participant was instructed to complete the self-report TRP as well as rate each of his/her
three team members using the team member TRP forms. The experimenter reminded
participants to identify team members through their participant numbers and not by name.
Upon completion of the measures, the experimenter passed out a final debriefing
statement (see Appendix E) that described the purpose of the study and provided the
name and contact information of the principal investigator and experimenter. In total,
each experiment session lasted approximately 2 hours.
2.6. Statistical Analyses
Prior to testing the hypothesized relationships, data were screened using a three-
step process. First, two team outliers on the team effectiveness variables were removed
from the team-level analyses. These teams were removed because their values fell below
the a priori cutoff value of 40% of the maximum overall profit for at least one of the
decision periods. It was assumed that scores below 40% were suggestive of random
guessing. Implementing the cutoff resulted in the removal of eight participants from the
individual-level analyses, which reduced the total sample of participants from 160 to 152
and the total number of teams from 40 to 38.
Next, as recommended by Roth, Switzer, and Switzer (1999), missing data were
imputed by substituting a person‘s mean response to other items from the same multiple-
item scale in which the missing data point occurred. For the personality measure, missing
data points were replaced with the average of an individual‘s ratings on the completed
items from the 10-item dimension subscale where the missing data point occurred. In
total for the personality measure, data were imputed for seven missing data points across
Page 44
37
five participants, where three participants had a single data point missing from one
subscale and two had a single data point missing from two separate subscales. For the
informal role measure, missing data points for an individual were replaced with the
average of the four raters‘ (i.e., one self, three team members) completed 3-item scale
ratings for the informal role scale in which the missing data point occurred. Data were
imputed for 17 total missing data points from five participants‘ informal role performance
data, where three participants had missing data points on a single scale, one had missing
data points on two scales, and one had missing data points on three scales. The
participants with missing data on the personality measure were not the same as those with
missing data on the informal roles measure.
Finally, continuous variables were tested for normality by comparing the
skewness and kurtosis values to the suggested limits of +/- 1.00 (Meyers, Gamst, &
Guarino, 2006). No transformations were made for individual-level continuous variables
(i.e., Big Five personality dimensions) because all values fell within the accepted limits.
As for the team-level continuous variables (i.e., number of individuals performing each
role, total roles performed, team balance, team effectiveness), the decision was made to
forgo data transformations for two reasons. First, only the variables associated with team
balance and the number of individuals performing the Calibrator role exceeded the
accepted skewness and/or kurtosis values by more than a margin of .20. Second, for ease
of subsequent data interpretation, transformations were avoided on those variables.
With regard to the statistical analyses, all hypotheses were tested for statistical
significance using two-tailed tests and alpha levels of p < .05. Results were considered to
approach significance if the test for significance was at or below the .10 level but greater
Page 45
38
than or equal to .05. Exact p-values were reported for all cases, except those less than .01;
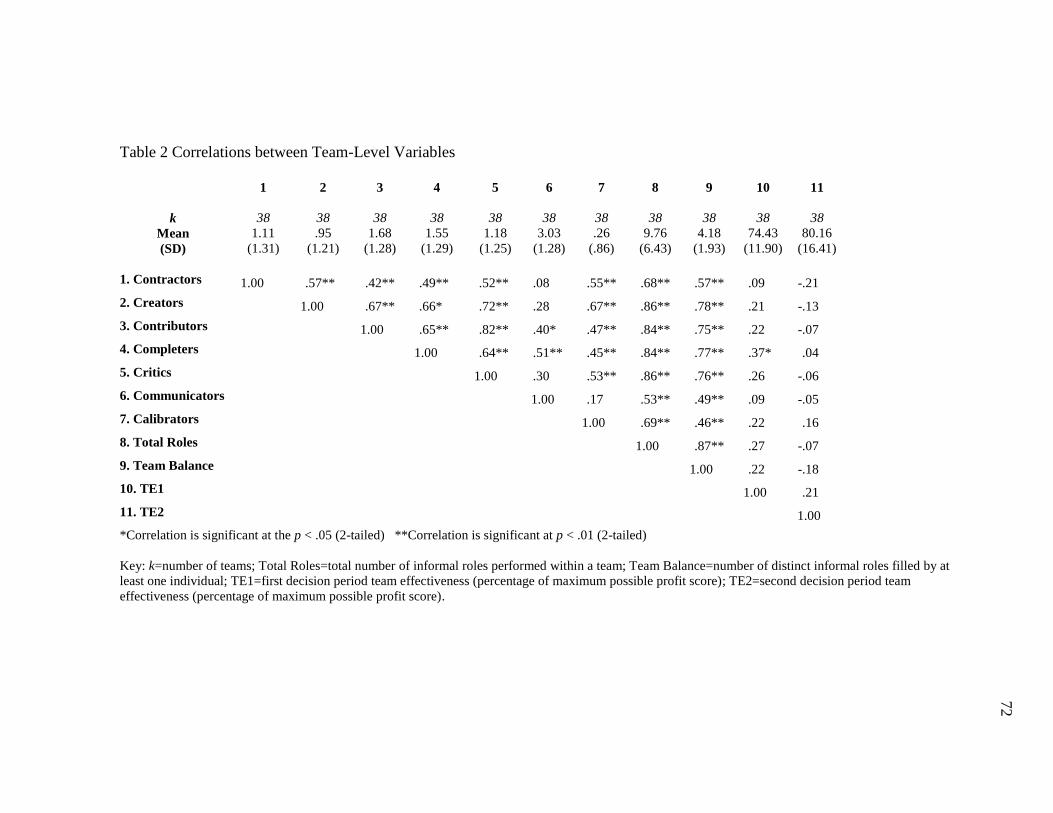
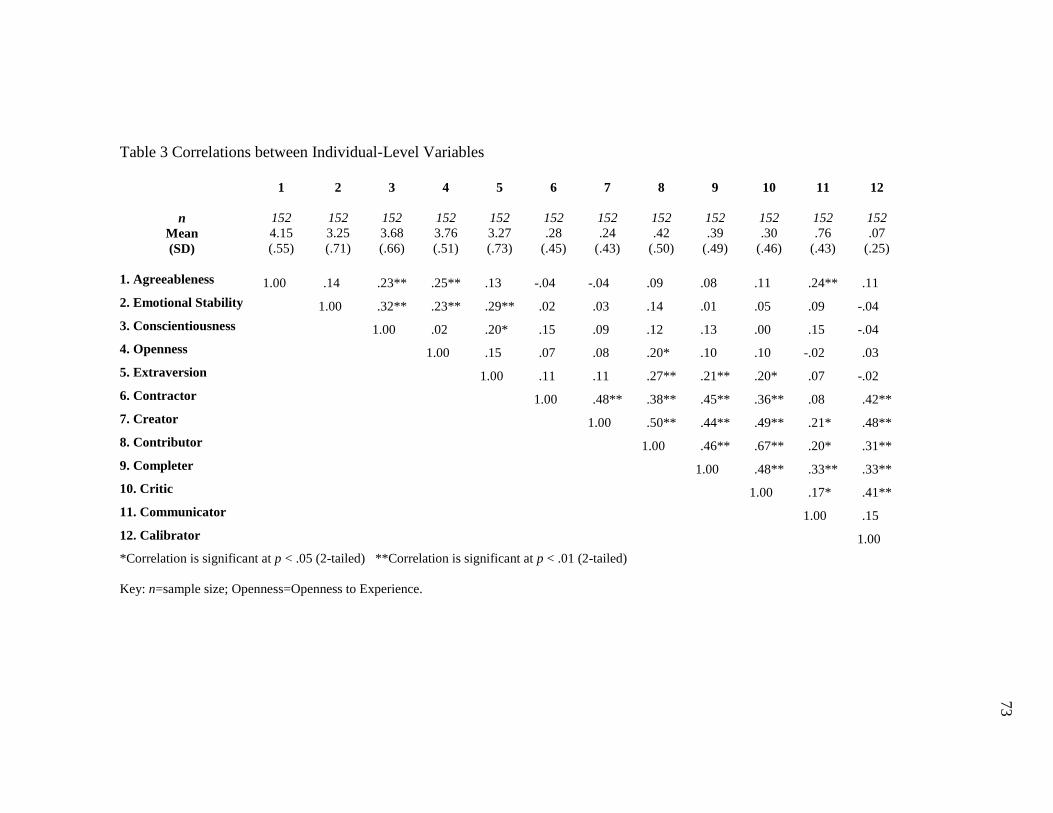
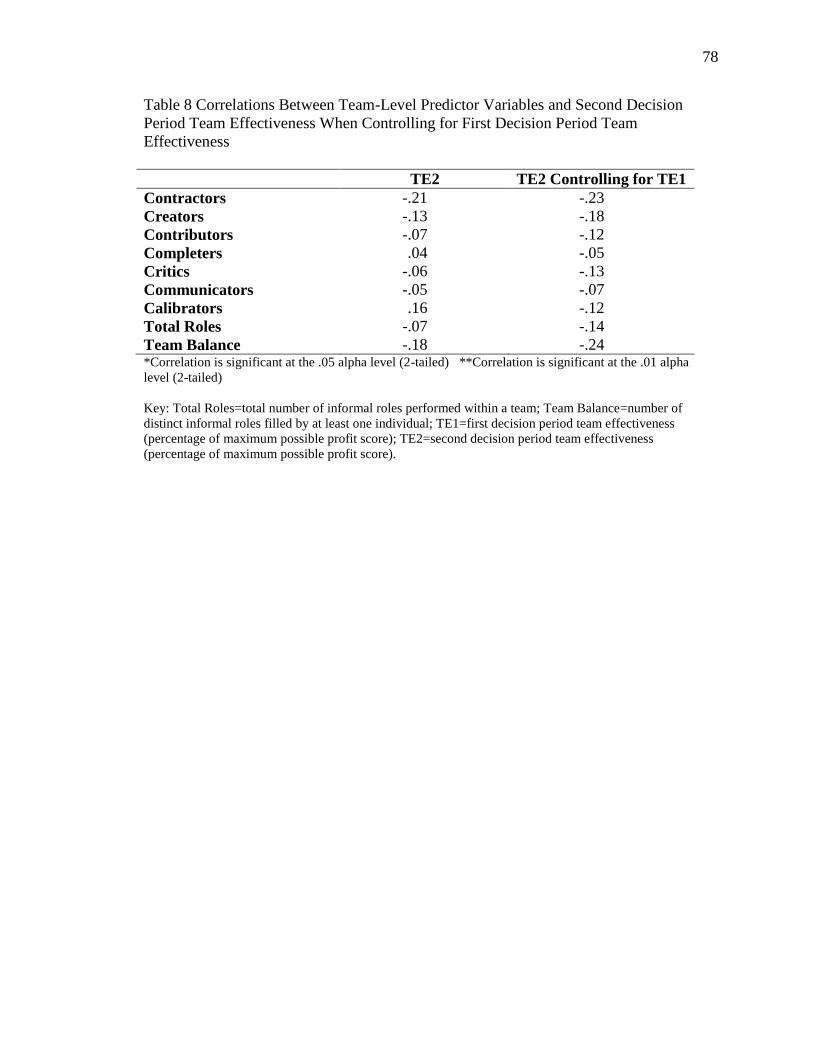
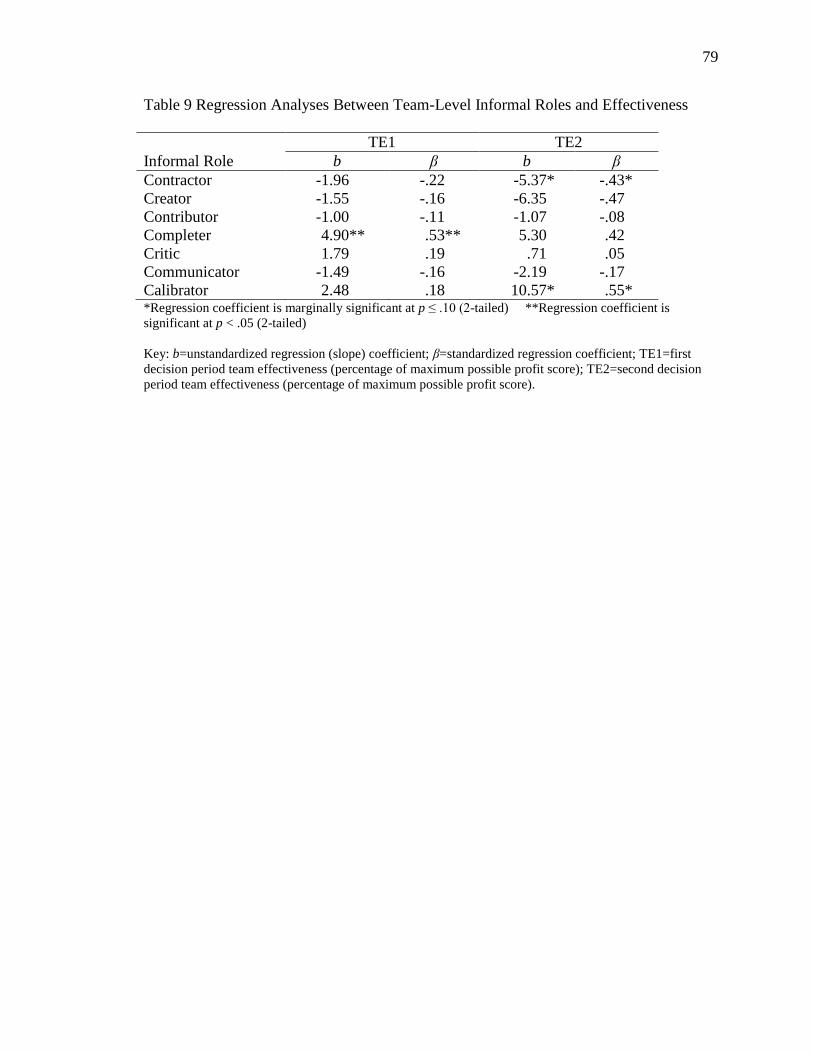
for those exceptions, p < .01 was reported. Next, the means, standard deviations, and
intercorrelations for focal individual-level and team-level variables were calculated. The
resulting intercorrelation between the first decision period and second decision period
team effectiveness scores (i.e., percentage of the maximum profits possible) was not
statistically significant (r = .21, p = .20). Because of the small nonsignificant relationship,
it was deemed inappropriate to calculate an overall mean team effectiveness. For this
reason, team-level hypotheses were tested separately for the team effectiveness scores
resulting from the first (i.e., TE1) and second (i.e., TE2) decision periods.
For the two team-level hypotheses categories (i.e., linear, interaction), different
operationalizations of IRC served as the independent variables and the TE1 and TE2
served as dependent variables. Linear category hypotheses were all tested using Pearson
correlations. The interaction category hypothesis (i.e., Hypothesis 2) was assessed using
hierarchical multiple regression. First, the two independent variables (i.e., Creator, Critic)
were centered and an interaction term was created from the two centered independent
variables. In step one, the two centered predictors were entered, and then in step two, the
centered interaction term was entered. To determine if the interaction was significant, the
second step of the regression was checked for a statistically significant increase in the
total variance explained.
To identify an optimal IRC vector in relation to TE1 and TE2, two criterion
profile analyses were conducted, one for each team effectiveness variable. There are two
underlying purposes of a criterion profile analysis: (a) to identify a pattern of predictor
scores corresponding to high criterion scores and (b) to determine the amount of variation
Page 46
39
in the criterion scores explained by the identified pattern of predictor scores (Davison &
Davenport, 2002). Before describing the steps in a criterion profile analysis, however, it
is important to distinguish between two important key terms. First, in the context of the
present study, a profile pattern refers to the number of individuals performing each role
in a single team‘s IRC vector (see Figure 2 for a sample profile pattern). A criterion
pattern, on the other hand, is an optimal configuration of informal roles associated with
high levels of team effectiveness (See Figure 3 for a sample criterion pattern). A criterion
pattern differs from a pattern profile in that its pattern is associated with high criterion
scores. Accordingly, the criterion pattern scores are symbolic of the relative weight or
importance of each informal role in relation to high team effectiveness.
To statistically derive an optimal criterion pattern, multiple regression was used.
First, each team effectiveness variable was regressed onto the seven informal role
variables representing the number of individuals performing each role within teams. This
process yielded seven unstandardized regression coefficients associated with each
informal role, where each team effectiveness variable included a unique set of
coefficients (see Table 9). Second, for each team effectiveness variable, the average of
the seven unstandardized regression coefficients was subtracted from each variable‘s
unstandardized regression coefficient to obtain a series of criterion pattern scores that
together represent criterion patterns (see Figure 4 and Figure 5).
Next, the level effect and pattern effect variables were created in order to test the
extent to which the criterion pattern explained variation in its respective team
effectiveness variable. On one hand, the level effect refers to the within-team average
number of individuals performing each of the seven informal roles. For instance, using
Page 47
40
the sample profile pattern from Figure 2, the level effect is equal to 2.00 (i.e., [2 + 4 + 3 +
1 + 0 + 2 + 2] / 7 = 2.00). The pattern effect, on the other hand, refers to the covariance
between the number of individuals performing each role in a single team (i.e., profile
pattern) and the corresponding criterion pattern scores associated with a particular team
effectiveness variable (i.e., TE1, TE2). In this way, a level effect and a pattern effect is
calculated for each team.
As a final step, two sets of hierarchical multiple regressions were conducted to
evaluate the relative amount of variance explained in each team effectiveness variable by
the level effect and corresponding pattern effect, where each set consisted of a regression
for TE1 and another for TE2. In the first set of hierarchical regressions, one of the team
effectiveness variables was entered as the dependent variable, the pattern effect was
entered in the first step, and the level effect was entered in the second step. The variance
explained in the first step indicated whether the pattern effect associated with the team
effectiveness variable explained a significant amount of variance in the team
effectiveness variable. The amount of incremental variance explained by the level effect
in the second step indicated the strength of the pattern effect. Ideally, the level effect
should not explain a significant amount of incremental variance in the team effectiveness
variable beyond that of the pattern effect entered in the first step. In the second set of
hierarchical regressions, one of the team effectiveness variables was entered as the
dependent variable, the level effect was entered in the first step, and the pattern effect
was entered in the second step. The purpose for these regressions was to determine
whether the pattern effect entered in step two explained incremental variance above the
variance explained by the level effect in step one. Like the first set of hierarchical
Page 48
41
regressions, the second set tested the strength of the pattern effect and, consequently, the
identified criterion pattern for each team effectiveness variable.
Lastly, the individual-level hypotheses were tested using point-biserial
correlations, where a specific Big Five dimension served as the independent variable and
a dichotomously coded informal role performance score served as the dependent variable.
Page 49
42
CHAPTER 3. RESULTS
3.1. Preliminary Analyses
Team-level intercorrelations, means, and standard deviations are presented in
Table 2. Individual-level intercorrelations, means, and standard deviations are presented
in Table 3. Correlations achieving statistical significance are marked with asterisks
indicating the level of significance.
With regard to the team level, the informal roles and team effectiveness variables
were examined for evidence of convergent and divergent validity. Correlations between
informal roles from the task role category (i.e., Contractor, Creator, Contributor,
Completer, Critic) were all statistically significant at p < .01 and ranged from r = .42 for
the number of Contractor and Contributor roles performed within a team to r = .82 for the
number of Contributors and Critics performed within a team. These strong and significant
correlations indicate convergent validity between informal roles from the task role
category. As for the social role category, the number of Communicator and Calibrator
roles within a team did not result in a significant correlation (r = .17, p = .32) and, thus,
little convergence was found between the two informal roles in this category. Finally, as
mentioned previously, the correlation between the first and second decision period team
effectiveness variables was lower than expected (r = .21, p = .20), indicating low
convergent validity.
Page 50
43
Concerning divergent validity, correlations between the Calibrator role from the
social role category and informal roles from the task role category were all significant at
p < .01, and they ranged from r = .45 for the number of Completer and Calibrator roles to
r = .67 for the number of Creator and Calibrator roles. Thus, the number of Calibrators
within a team showed more convergence with the number of informal roles from the task
role category than with the number of Communicator roles from the same social role
category. Similarly, with respect to the relationship between the Communicator role and
informal roles from the task role category, only the correlation between numbers of
Communicator and Contractor roles (r = .08, p = .64) failed to reach at least marginal
significance level of p ≤ 10.
Regarding the individual-level variables, the Big Five personality variables and
informal role performance variables were also assessed for convergent and divergent
validity. Between dimensions of the Big Five, 6 of the 10 possible unique
intercorrelations were found to be statistically significant, and the 10 positive
intercorrelations ranged in magnitude from r = .02 (p = .78) for the Conscientiousness
and Openness to Experience relationship to r = .32 (p < .01) for the Conscientiousness
and Emotional Stability relationship. Because the correlations were small to moderate in
magnitude, some evidence was found for divergent validity between dimensions.
Correlations between individual-level informal roles from the task role category
were all significant at p < .01 and ranged from r = .36 for the Contractor-Critic
relationship to r = .67 for the Contributor-Critic relationship. Thus, within the task role
category, convergence was found between informal roles. As for the social role category,
Page 51
44
the Communicator-Calibrator intercorrelation was nonsignificant (r = .15, p = .06), thus,
indicating little convergence between roles from this category.
The individual-level correlations between informal roles from the task and social
role categories were all significant, except the Contractor-Communicator relationship (r =
.08, p = .30). The significant intercorrelations ranged from r = .17 (p = .04) for the Critic-
Communicator relationship to r = .48 (p < .01) for the Creator-Calibrator relationship. As
such, informal roles from the task role category tended, for the most part, to demonstrate
some level of convergence with informal roles from the social role category.
In general, the means, variability, and ranges of team- and individual-level
variables were relatively normal. With that said, the number of Calibrator roles
performed within a team had a relatively small mean of .26 from a possible range of .00
to 4.00. Similarly at the individual level, the Calibrator role had a mean of .07 on a
dichotomous coding scheme, where .00 indicates the role was not performed and 1.00
indicates the role was performed. This signifies that the Calibrator role was rarely
performed by individuals and, consequently, the informal role rarely occurred within
IRC. As a result, the Calibrator role had relatively low variability at the individual level
(SD = .25) and at the team level (SD = .86) when compared with the other informal role
and IRC variables, respectively.
Page 52
45
3.2. Hypotheses Tests
Team-Level Hypotheses
The hypotheses in the linear category predicted linear relationships between one
or more informal roles in an IRC and team effectiveness. Hypotheses 1a and 1b predicted
significant main effects for the number of Creator and Communicator roles based on
prior research (Chong, 2007). As evidenced by Table 2, the relationships between the
Creator and the first decision period (TE1) and second decision period (TE2) team
effectiveness scores were both nonsignificant (r = .21, p = .21 and r = -.13, p = .43,
respectively). Similarly, the correlations between the Communicator and TE1 (r = .09, p
= .57) and TE2 (r = -.05, p = .78) failed to reach significance. Thus, Hypotheses 1a and
1b were not supported. Hypothesis 1c was an exploratory hypothesis in which a
significant, positive relationship was predicted between the number of Completer roles
performed and the level of team effectiveness. The correlation between Completer and
TE1 was medium-to-large in size and reached statistical significance (r = .37, p = .02);
however, the correlation between the Completer and TE2 failed to reach statistical
significance (r = .04, p =.83). Therefore, Hypothesis 1c received partial support. For
Hypothesis 1d, a significant positive relationship was predicted for the total number of
roles performed within a team and the level of team effectiveness. The association
between total roles performed and TE1 approached statistical significance (r = .27, p =
.10), while the relationship between the same independent variable and TE2 was
nonsignificant (r = -.07, p = .66). Finally, Hypothesis 1e predicted a significant, positive
relationship between the extent to which a team was balanced (i.e., the number of
Page 53
46
informal roles filled by at least one individual) and team effectiveness. The relationships
between team balance and TE1 (r = .22, p = .19) and TE2 (r = -.18, p = .28) failed to
reach significance and, thus, no support was found for Hypothesis 1e.
Hypothesis 2 predicted an interaction between the number of Creator and Critic
roles performed in relation to team effectiveness, such that the relationship would be
significantly stronger than the main effects of the two informal roles combined additively
(see Table 4). Specifically, the form of interaction between the Creator and Critic roles
was expected to have a larger positive slope in relation to team effectiveness than the
additive model of the main effects. This hypothesis was not supported as the interaction
term failed to explain significant incremental variance above that of the two main effects
when entered in the second step of the hierarchical regression for TE1 (ΔR2 = .01, p =
.48) and TE2 (ΔR2 = .00, p = 1.00). For a results summary of all team-level hypotheses,
please refer to Table 5 and Table 6.
Individual-Level Hypotheses
The individual-level hypotheses predicted significant relationships between
specific dimensions of the Big Five and informal roles (see Table 3). Hypotheses 3a and
3b predicted positive associations between the Big Five dimension of Agreeableness and
the informal roles of Communicator and Calibrator, respectively. The test of Hypothesis
3a resulted in a statistically significant medium-sized correlation between Agreeableness
and Communicator (r = .24, p < .01) and, therefore, it was supported. Hypothesis 3b was
not supported as it failed to reach significance (r = .11, p = .16).
Page 54
47
Hypotheses 4a through 4e predicted positive relationships between
Conscientiousness and the informal roles falling within the task role category (i.e.,
Contractor, Creator, Contributor, Completer, Critic). With regard to Hypothesis 4a, a
small correlation was found between Conscientiousness and the Contractor role that
approached statistical significance (r =.15, p = .10). The remaining hypothesized
relationships between Conscientiousness and the four corresponding informal roles were
as follows: Creator (r = .09, p = .28), Contributor (r = .12, p = .14), Completer (r = .13, p
= .12), and Critic (r = .00, p = .98). Therefore, Hypotheses 4b through 4e were not
supported.
For Hypotheses 5a through 5e, the Big Five dimension of Openness to
Experience was predicted to share a negative relationship with informal roles associated
with the task role category. All five hypotheses were not supported. In fact, Hypothesis
5c predicted a negative association between Openness to Experience and the Contributor
role, and contrary to the predicted direction of the relationship, a significant positive
correlation was found (r = .20, p = .02). The nonsignificant relationships between
Openness to Experience and the four remaining task roles were as follows: Contractor (r
= .07, p = .42), Creator (r = .08, p = .36), Completer (r = .10, p = .20), and Critic (r = .10,
p = .23).
Hypotheses 6a through 6e predicted Extraversion would be negatively related to a
person‘s adoption of informal roles associated with the task role category. Again, no
support was found for these five hypotheses. On one hand, Hypotheses 6a and 6b were
not supported because the relationships between Extraversion and the Contractor (r = .11,
p = .19) and Creator (r = .11, p = .19) roles failed to reach statistical significance. On the
Page 55
48
other hand, the tests for Hypotheses 6c, 6d, and 6e reached statistical significance —
albeit in the opposite direction as originally predicted. For Hypothesis 6c, 6d, and 6e,
Extraversion demonstrated a positive correlation between the following roles:
Contributor (r = .27, p < .01), Completer (r = .21, p < .01), and Critic (r = .20, p = .01).
For a results summary of all individual-level hypotheses, please refer to Table 7.
3.3. Follow-Up Analyses
Follow-up analyses were conducted for two purposes: (a) to address the low
correlation between TE1 and TE2, (b) to identify optimal IRC vectors for TE1 and TE2.
First, given the small nonsignificant intercorrelation between TE1 and TE2 (r = .21, p =
.20) and the possibility of a feedback effect between the two decision periods, the team-
level correlations between the IRC variables and TE2 were re-analyzed while controlling
for TE1. As indicated by Table 8, the correlations were all negative when the effects of
TE1 were controlled. In fact, all correlations were pulled further toward the negative
value of r = -1.00 when compared to the original TE2 variable. In contrast, all
correlations with TE1 were positive.
The second purpose of the follow-up analyses was to identify optimal IRC vectors
based on statistically derived criterion patterns for TE1 and TE2, respectively. To do so,
two criterion patterns (see Figure 4 and Figure 5) were derived from unstandardized
regression coefficients (see Table 9). Figure 4 displays the criterion pattern associated
with TE1 in which the criterion pattern score for a particular informal role indicates the
ideal relative frequency of that informal role in relation to the frequency of the other
informal roles. Thus, the criterion pattern for TE1 indicates that highly effective teams
Page 56
49
had a larger number of individuals performing the Completer role relative to other
informal roles because its criterion pattern score is by far the greatest (4.45). To a lesser
extent, the criterion pattern scores for the Critic and Calibrator roles (1.34 and 2.03,
respectively) indicate their positive impact on TE1. Conversely, negative criterion pattern
scores for the Contractor (-2.41), Creator (-2.00), Contributor (-1.45), and Communicator
(-1.94) roles suggest that larger frequencies of these informal roles were not associated
with higher levels of TE1. With regard to the criterion pattern for TE2 displayed in
Figure 5, the positive criterion pattern scores correspond to the same three informal roles
as the criterion pattern for TE1. However, for TE2 the criterion pattern score for the
Calibrator role is the largest (10.34) when compared to the Completer and Critic roles
(5.07 and .48, respectively). Thus, teams with larger numbers of individuals performing
the Calibrator role relative to other informal roles tended to achieve higher levels of TE2.
Next, to determine the adequacy of the two criterion patterns, two hierarchical
multiple regression statistical tests were conducted for TE1 and TE2. In the first
regression, it was necessary to determine whether the pattern effects explained a
significant amount of the variance in their respective team effectiveness variable (see first
step in Table 10). With respect to TE1, the level effect explained a significant portion of
TE1 variance (R2 = .13, p = .02). As for the pattern effect associated with TE2, the
criterion pattern also explained a significant amount of the variance in TE2 (R2 = .26, p <
.01). Next, it was investigated whether the level effect would add a significant amount of
incremental variance above the variance already explained by the pattern effect. Results
from each team effectiveness variable‘s respective hierarchical multiple regression (see
Table 10) revealed that when the level effect was entered in the second step, it did not
Page 57
50
explain significant incremental variance over the pattern effect entered in the first step for
TE1 (ΔR2 = .06, p = .12) and TE2 (ΔR
2 = .01, p = .56). Finally, it was tested whether the
pattern effect would add significant incremental variance over the level effect. Again, two
hierarchical multiple regressions were conducted for TE1 and TE2 (see Table 11). When
entered in the second step, the pattern effect explained a significant portion of additional
variance beyond the level effect entered in the first step for TE1 (ΔR2 = .12, p = .03) and
TE2 (R2 = .26, p < .01). Together, these three statistical tests lend further support to the
criterion-related validity of the optimal criterion patterns identified for TE1 and TE2;
although, the variance explained was considerably larger for the latter.
Page 58
51
CHAPTER 4. DISCUSSION
The primary goals of this study were to investigate the links between: (a) team-
level IRC and team effectiveness and (b) individual-level personality and informal roles.
With respect to the first goal, it was found that more individuals performing the
Completer role resulted in greater team effectiveness for the first of two decision-making
periods (i.e., support for Hypothesis 1c). In addition, the total number of informal roles
performed within a team was found to be positively and marginally associated with team
effectiveness in the first decision-making period (i.e., Hypothesis 1d). Support was not
found for any of the other predicted relationships, but follow-up analyses did reveal some
promising findings. By conducting follow-up exploratory analyses, two optimal criterion
patterns were identified that corresponded to high levels of their respective team
effectiveness variable. Each criterion pattern represented the ideal relative frequency of
each informal role within an IRC in relation to high levels of team effectiveness. In terms
of criterion-related and incremental validity, the two pattern effects explained significant
amounts of variance in their respective team effectiveness variable and, moreover, they
explained significant amounts of incremental variance beyond those of their
corresponding pattern effects (i.e., the mean number of individuals performing each role
within a team).
Page 59
52
With regard to the second goal of the present study, limited support was found
for the relationships between specific dimensions of the Big Five and the adoption of
informal roles. In terms of the hypothesized relationships, only an individual‘s level of
Agreeableness was found to be positively associated with the likelihood that he/she
adopted the Communicator role. In addition, a marginally significant positive relationship
was found between a person‘s level of Conscientiousness and his/her adoption of the
Contractor role. Contrary to Stewart et al.‘s (2005) findings, Openness to Experience
positively and significantly correlated with the Contributor role, whereas the
hypothesized relationship was in the opposite direction. Likewise, Extraversion
significantly correlated with the Contributor, Completer, and Critic roles — all of which
were of similar magnitude and in the positive direction instead of the hypothesized
negative direction.
Overall, the results of this study provided only limited support for the conceptual
model adapted from Stewart et al. (see Figure 1). At the team level, only one hypothesis
was supported, while marginal support was found for another; furthermore, this support
was limited to only the first decision period team effectiveness variable. Follow-up
analyses, however, identified two criterion patterns with relatively similar patterns that
each explained a significant amount of variance in its corresponding team effectiveness
variable. At the individual level, again, full support was found for only one hypothesis,
and marginal support was found for another. Four additional significant relationships
were found at the individual level despite being in the opposite direction of the original
hypotheses. Thus, despite the limited support for the hypothesized relationships, the study
did yield some promising findings with respect to Stewart et al.‘s conceptual model.
Page 60
53
4.1. Contributions
Theoretical Contributions to the Literature
The design and results of this study offer several unique contributions to the
existing literature. To begin with, past research has explored the proposed link between
IRC and team effectiveness (e.g., Blenkinsop & Maddison, 2007; Chong, 2007;
Partington & Harris, 1999; Prichard & Stanton, 1999; Senior, 1997; Stewart et al., 2005;
van der Water et al., 2008). The reviewed studies all used Belbin‘s (1981, 1993) informal
role taxonomy, while the present study was the first to use roles conceptualized in accord
with Mumford et al.‘s (2006) integrative taxonomy to investigate the link between IRC
and team effectiveness.
With regard to the link between IRC and team effectiveness, the present study
tested an IRC vector conceptualization inspired by Belbin‘s (1981, 1993) theory of
balanced teams. Past researchers have tested variations of Belbin‘s balanced team theory
that proposes successful teams will have one person filling each informal role, and most
have found limited to no support for the relationship between ―balanced‖ teams and team
effectiveness (i.e., Blenkinsop & Maddison, 2007; Partington & Harris, 1999; Senior,
1997; van der Water et al., 2008). Despite past null findings, the present study
investigated Belbin‘s theory of balance once more, however, this time using informal
roles from Mumford et al.‘s (2006) taxonomy. Consistent with prior findings, a
nonsignificant relationship was found between the number of informal roles adopted by
at least one individual and the level of team effectiveness achieved. Thus, even with a
new and integrative informal role taxonomy, Belbin‘s theory of balanced teams received
Page 61
54
no additional support. One possible explanation for the lack of support is as follows:
Because informal roles are context specific, some informal roles may provide more or
less benefit depending on the nature of a team‘s work and objectives. That is, a particular
informal role may be essential in some contexts and unnecessary others. Accordingly, the
concept of team ―balance‖ may vary from context to context as well and, therefore, it
should be defined within a specific context of interest and not overgeneralized.
In contrast to team balance, the total number of informal roles performed within a
team yielded a marginally significant relationship with team effectiveness in the first
decision period. Intuitively, this finding seems logical and expected given that Mumford
et al. (2006) made a conscious decision to include only functional roles in their integrated
taxonomy. The finding suggests that the behavior patterns associated with the roles may
have a linear and positive impact on team effectiveness. With that said, the lack of full
support for this relationship may be due to the varying degree of influence on team
effectiveness associated with specific informal roles from an IRC. Based on criterion-
related validities, the criterion profile analysis approach discussed in the following
paragraph may offer a better method for operationalizing IRC than simply summing the
total number of roles performed.
Another notable contribution of the present study stems from the follow-up
criterion profile analyses conducted. To date, no studies have used this exploratory
approach to identify optimal IRC vectors (i.e., criterion patterns) in relation to team
effectiveness. Because team effectiveness was assessed for two decision periods, a
criterion pattern was statistically derived for each. The multiple regression-based results,
confirmed that, in fact, an optimal team predictor pattern does exist for each criterion. In
Page 62
55
addition, both criterion patterns (see Figures 3 and 4) revealed similar shapes and
structures. For instance, in both criterion patterns, the Completer, Critic, and Calibrator
roles had criterion pattern scores greater than zero, while the remaining roles had
negative scores. Although criterion patterns scores do not indicate the specific number of
individuals that perform each role in highly effective teams, they do indicate the relative
frequency of informal roles performed within highly effect teams. Therefore, as
evidenced by the criterion pattern scores, the identified criterion patterns suggest that a
team should ideally contain multiple individuals performing the Completer, Critic, and
Calibrator roles and fewer individuals performing the remaining roles. With that said, the
identified criterion patterns should be cross-validated in other samples to determine their
generalizability across tasks (Davison & Davenport, 2002). As mentioned previously,
highly effective IRC likely vary from context to context.
In the present study, limited support was found for the notion that the number of
individuals adopting specific informal roles influences team effectiveness, regardless of
the other roles adopted within a team. Although the results failed to replicate the findings
of Chong (2007), a rather strong main effect for the Completer role was found in relation
to team effectiveness in the first decision period. As such, it appears that the cluster of
related behaviors associated with the Completer role is, to some extent, important to
achieve higher levels of team effectiveness. Of course, caution should be taken when
attempting to generalize this finding, as the significant relationship could be an artifact of
the nature of the decision-making task used. In addition, the relationship was only
significant in relation to the first decision period team effectiveness variables and not the
second.
Page 63
56
Like the theoretical team-level link, in terms of hypothesized relationships, the
present study contributed little support to the individual-level link between personality
and informal roles. However, the specific relationships tested are unique to this study.
Few studies have assessed the relationship between dimensions of the Big Five and
informal role performance (i.e., Blumberg, 2001; Mumford et al., 2008; Stewart et al.,
2005), and of these studies, none have addressed the relationship between the Big Five
and specific informal roles. Rather, past studies considered only role categories (e.g.,
task, social) and not the informal roles associated with them. Therefore, by assessing the
relationships between the Big Five dimensions and seven of Mumford et al.‘s informal
roles, the present study makes a valuable contribution to the literature. That is, testing the
relationships at a more specific level results in a more descriptive and specific account of
the informal role behavior clusters with which the Big Five dimensions tend to correlate.
With regard to the hypothesized relationships between the Big Five and informal
roles, one hypothesis was fully supported and another was marginally supported. The
association between a person‘s level of Agreeableness and his/her adoption of the
Communicator role was found to be significant in the expected direction. The
hypothesized relationship between Conscientiousness and the Contractor role, on the
other hand, only approached significance. Despite the nonsignficance of all other
hypothesized individual-level relationships, some unexpected relationships did emerge.
Although in the opposite direction as predicted, the relationships between Extraversion
and the Contributor, Completer, and Critic roles were all positive, significant, and small
to moderate in size. Similarly, Openness to Experience resulted in a small, positive, and
significant relationship as well as yielding a correlation in the opposite direction of the
Page 64
57
original hypothesis. In summary, the hypothesized relationships between the Big Five
and specific informal roles were largely unsupported but some unexpected relationships
were found. Therefore, more research is needed to investigate the individual link between
the Big Five and Mumford et al.‘s (2006) informal roles.
Practical Implications
The results of this study lend themselves to several practical applications related
to organizational selection and employee development. With respect to organizational
selection, the IRC of existing workplace teams could be assessed to identify teams with
IRC that mirror the optimal criterion patterns. However, because the criterion patterns in
the present study were identified in a specific context, it is not clear if the same criterion
patterns could be used to identify highly effective teams in other contexts. Therefore, I
suggest that organizations conduct their own analyses to determine criterion patterns that
reflect their own work contexts and team effectiveness criteria. In this way, organizations
could select teams with IRC that closely resemble an identified criterion pattern to carry
out their most important projects.
The results of the present study also yield practical implications for selecting
individuals for work teams. Although in the opposite direction of the predicted
relationship, individuals high in the personality dimension of Extraversion tended to
adopt the Completer role. Furthermore, teams consisting of more individuals performing
the Completer tended to have greater team effectiveness. Therefore, it may be wise for
organizations to select a larger number of team members high in Extraversion with the
expectation that such individuals will be more likely to adopt the Completer role. With
Page 65
58
that said, implementing such a practice should be done with caution because a specific
team decision-making context was used in the present study. As mentioned above, it
remains to be seen whether the results of the present study will generalize to other teams
working in different contexts and carrying out different tasks.
In terms of employee development, the findings of the present study have
potential applications for training. Although Mumford et al. (2006) described their
taxonomy roles as functional, findings from the present study indicate that greater
representation of some informal roles within IRC positively correlate with team
effectiveness. Namely, regardless of the other informal roles performed, the number of
individuals filling the Completer role demonstrated a moderate-to-large relationship with
a team‘s level of effectiveness in the first decision period. In support of this, both
criterion patterns identified in this study indicated that effective teams had IRC with more
Completers, Calibrators, and to a lesser extent, Critics. I suggest, however, that
organizations first define team effectiveness in accordance with their organizational
context and then conduct their own analyses to determine the specific informal roles or
the configuration of informal roles that are most likely to yield high levels of team
effectiveness. In doing so, organizations could train employees to focus on performing
behaviors associated with highly effective IRC. For example, if like the present study,
IRC consisting of more Completers, Calibrators, and Critics were found to coincide with
high team effectiveness, employees could be trained to engage in behaviors related to
those three roles. In fact, more attention and emphasis could be placed on those informal
role behaviors associated with higher criterion pattern scores. In this way, employees
Page 66
59
could perform critical behaviors with greater frequency relative to other less essential
behaviors.
4.2. Limitations and Future Research
As with any empirical study, limitations are inevitable, and the present study has
several notable ones. First, the relatively small sample size at the team level decreased the
power to detect significant findings should they have actually existed. This was
evidenced by the fact that some hypothesized relationships failed to reach statistical
significance even though the magnitude of the effect sizes were medium in magnitude.
With a larger sample, those relationships may have reached significance. Efforts were
made to maximize the total sample by sending reminder emails to increase participant
attendance and scheduling sessions in the evenings and on weekends to accommodate
those students with full-time work commitments. Unfortunately, low attendance rates
persisted throughout data collection, resulting in a less than desirable team-level sample
size.
The type of sample used in the current study served as an additional limitation.
Even though approximately 77% of the sample had prior work team experience, the
student participants may not have experienced the same level of motivation as they would
have in a real work context. Because there was no financial reward for performing well
(other than the simulated profits generated in the decision-making tasks), students may
have exerted less effort. Future research should consider conducting a similar study in a
field setting with real work teams. In addition, a similar lab study should be conducted
that offers a tangible reward to participants in order to increase motivation.
Page 67
60
Also of importance, the present study controlled for team type by limiting team
interactions to a single type of decision-making task. Therefore, when interpreting the
results, it is important to consider the context in which the team members interacted.
Similarly, some might argue that the Tinsel Town simulation does not demonstrate high
levels of fidelity with real world team decision-making scenarios and, as a result, the
results may lack certain degree of generalizability. With these limitations in mind, future
research should attempt to replicate the findings of the present study in a variety of
contexts in both lab and field settings.
Controlling for team size acted as a double-edged sword in the present study. On
one side, controlling team size should be considered a strength because it eliminated what
could have been a possible confound — variations in team size. On the other side,
controlling team size may have narrowed the scope of generalizability for the present
study. It is entirely possible that some findings will not generalize to teams with more
than or fewer than four members. Specifically, teams with more than four team members
may face different constraints when exchanging information and reaching decisions. For
instance, a large team size may complicate the decision-making process because more
sources of unique information are available. Consequently, compared to a four-person
team, different informal roles may be required to sift through and weigh the numerous
decision-making alternatives as well as quell the onset of displeasure as more and more
team members‘ ideas are rejected. Therefore, the findings of the present study should be
replicated with a variety of team sizes.
Another limitation of the present study stems from the relatively short amount of
time team members interacted with one another. The small window of interaction may
Page 68
61
not have afforded adequate time for team members to fully flesh out and adopt informal
roles. Compared to other informal roles, a relatively small number of individuals adopted
the Calibrator role. On one hand, this may indicate that there was not sufficient time for
the behaviors associated with the role to manifest. On the other hand, the simulation itself
may not have been conducive for such behaviors to emerge. Consequently, informal roles
should be studied in situations where teams perform longer duration tasks; or, some sort
of socioemotional conflict should be introduced into the simulation to ensure individuals
have reasons and opportunities to perform the Calibrator role.
With regard to the team member ratings of informal role performance, the level of
social cohesion amongst team members may have influenced the accuracy of their
ratings. Specifically, highly cohesive teams may have provided more lenient ratings for
their fellow team members and, thus, potentially skewing the results. At this point, the
relationship between social cohesion and rating accuracy is purely conjecture.
Nonetheless, I propose adding a measure of social cohesion to future replications of the
present study to test for such a relationship.
Also related to ratings of informal role performance, for certain roles, the within
team interrater agreement (rwg) fell below the conventional cutoff of .70 for averaging
ratings across raters (i.e., one self, three team member) for a particular target. The
Contractor, Creator, and Completer roles fell within the rwg range of .60 to .67, while the
rwg for the Communicator role was much lower at .45. These low interrater agreement
values may indicate that raters differed in how they interpreted the anchors of the five-
point frequency rating scale, or they may suggest that each rater recalled varying amounts
of the target‘s behaviors. Either way, informal role performance may not have been
Page 69
62
measured well. To address this issue, future research should videotape team interactions
and instruct trained raters to rate team members using the informal role measure. The
resulting ratings should then be compared with self and team member ratings to
determine whether meaningful differences exist.
Finally, the first and second decision period team effectiveness variables did not
significantly correlate. Based on the measurement similarities between the two variables,
it was expected that they would share a strong and significant intercorrelation. It is
possible that the feedback given between the first and second decision periods may have
yielded learning or motivation effects. To test this, follow-up analyses were conducted
that controlled for the effects of first decision period team effectiveness. The analyses
indicated that the differences between the IRC variables and two team effectiveness
variables became more pronounced when controlling for first decision period team
effectiveness. One possible explanation is as follows: After receiving feedback, teams
with high team effectiveness in the first decision period may have become collectively
unmotivated to match or exceed their score in the second decision period. Conversely,
teams receiving low team effectiveness feedback in the first decision may have become
more motivated to improve in the second decision period. Future research using Tinsel
Town is needed to investigate whether a feedback effect truly exists and, if so, what is the
nature of the effect (e.g., learning, motivational).
4.3. Conclusion
Based on the Stewart et al. (2005) conceptual model, the present study
investigated the team-level link between IRC and team effectiveness and the individual-
Page 70
63
level link between personality and the adoption of informal roles. Based on the
hypothesized relationships, limited support was found for the two links. However,
follow-up analyses at the team-level and closer examination of individual-level
intercorrelations yielded promising directions for future research. In particular, the
criterion patterns identified in the present study should be cross-validated in future
studies.
Page 71
LIST OF REFERENCES
Page 72
64
LIST OF REFERENCES
*Allport, G. W. (1937). Personality: A psychological interpretation. New York: Holt,
Rinehart, & Winston.
*Allport, G. W., & Odbert, H. S. (1936). Trait-names: A psycho-lexical study.
Psychological Monographs, 47.
Ancona, D. G., & Caldwell, D. F. (1988). Beyond task and maintenance: Defining
external functions in groups. Group and Organization Studies, 13, 468-494.
Ancona, D. G., & Caldwell, D. F. (1992). Bridging the boundary: External activity and
performance in organizational teams. Administrative Science Quarterly, 37, 634-
665.
*Aritzeta, A., Swailes, S., & Senior, B. (2007). Belbin‘s team role model: Development,
validity and applications for team building. Journal of Management Studies, 44,
96-118.
Bales, R. F. (1950). Interaction process analysis: A method for the study of small groups.
Cambridge, MA: Addison-Wesley.
*Bales, R. F., & Cohen, S. P. (1979). SYMLOG: A system for the multiple level
observation of groups. New York: Free Press.
Barrick, M. R., & Mount, M. K. (1991). The Big Five personality dimensions and job
performance: A meta-analysis. Personnel Psychology, 44, 1-26.
Barrick, M. R., Mount, M. K., & Judge, T. A. (2001). Personality and performance at the
beginning of the new millennium: What do we know and where do we go next?
International Journal of Selection and Assessment, 9, 9-30.
Barrick, M. R., Stewart, G. L., Neubert, M. J., & Mount, M. K. (1998). Relating member
ability and personality to work-team processes and team effectiveness. Journal of
Applied Psychology, 83, 377-391.
Barry, D. (1991). Managing the bossless team: Lessons in distributed leadership.
Organizational Dynamics, 20, 31-47.
Page 73
65
Belbin, R. M. (1981). Management Teams: Why They Succeed or Fail. London:
Heineman.
Belbin, R. M. (1993). Team Roles at Work. Oxford: Butterworth-Heinemann.
Benne, K. D., & Sheats, P. (1948). Functional roles of group members. Journal of Social
Issues, 4, 41-49.
Blenkinsop, N., & Maddison, A. (2007). Team roles and team performance in defence
acquisition. Journal of Management Development, 26, 667-682.
Blumberg, H. H. (2001). The common ground of natural language and social interaction
in personality description. Journal of Research in Personality, 35, 289-312.
*Brodbeck, F. (1996). Work group performance and effectiveness: Conceptual and
measurement issues. In M.A. West (Ed.), Handbook of work group psychology
(pp. 285-316). Chichester, UK: John Wiley.
*Broucek, W. G., & Randall, G. (1996). An assessment of the construct validity of the
Belbin Self Perception Inventory and Observer Assessments from the perspective
of the five factor model. Journal of Occupational and Organisational Psychology,
68, 81-99.
*Cattell, R. B. (1945). The description of personality: Principles and findings in a factor
analysis. American Journal of Psychology, 58, 69-90.
*Chidester, T. R. (1987). Selection for optimal crew performance: Relative impact of
selection and training. In R. S. Jensen (Ed.), Proceedings of the Fourth
International Symposium on aviation Psychology. Columbus, OH: The Ohio State
University.
Chong, E. (2007). Role balance and team development: A study of team role
characteristics underlying high and low performing teams. Journal of Behavioral
& Applied Management, 8, 202-217.
*Church, A. T., Reyes, J. A. S., Katigbak, M. S., & Grimm, S. D. (1997). Filipino
personality structure and the Big Five Model: A lexical approach. Journal of
Personality, 65, 477-528.
*Costa, P. T., & McCrae, R. R. (1992). NEO PI-R Professional Manual. Odessa, FL:
Psychological Assessment Resources.
Davis, J., Millburn, P., Murphy, T., & Woodhouse, M. (1992). Successful team building:
How to create teams that really work. London: Kogan Page Limited.
Page 74
66
Davison, M. L., & Davenport, E. C. (2002). Identifying criterion-related patterns of
predictor scores using multiple regression. Psychological Methods, 7, 468-484.
*Devine, D. J. (2002). A review and integration of classification systems relevant to
teams in organizations. Group Dynamics: Theory, Research, and Practice, 6, 291-
310.
Devine, D. J., Clayton, L. D., Philips, J. L., Dunford, B. B., & Melner, S. B. (1999).
Teams in organizations: Prevalence, characteristics, and effectiveness. Small
Group Research, 30, 678-711.
Devine, D. J., Habig, J. K., Martin, K. E., Bott, J. P., & Grayson, A. L. (2004). Tinsel
town: A top management simulation involving distributed expertise. Simulation &
Gaming, 35, 94-134.
Digman, J. M. (1990). Personality structure: Emergence of the five-factor model.
Annual Reviews in Psychology, 41, 417-440.
DuBrin, A. J. (1995). The breakthrough team player. New York: American Management
Association.
*Dulewicz, S. V. (1995). Personal competencies, personality and responsibilities of
middle-managers. Competency Journal, 1, 20-29.
*Fisher, T. A., Hunter, W. D. K., & Macrosson, S. G. (2001). A validation study of
Belbin‘s team roles. European Journal of Work and Organizational Psychology,
10, 121-144.
*Fiske, D. W. (1949). Consistency of the factorial structures of personality ratings from
different sources. Journal of Abnormal & Social Psychology, 44, 329-344.
Forsyth, D. R. (1998). Group Dynamics. Pacific Grove, CA: Brooks/Cole.
Funder, D. C. (2001). Personality. Annual Review of Psychology, 52, 197-221.
Funder, D. C., & Colvin, C. R. (1991). Explorations in behavioral consistency: Properties
of persons, situations, and behaviors. Journal of Personality and Social
Psychology, 60, 773-794.
*Furnham, A., Steele, H., & Pendleton, D. (1993). A psychometric assessment of the
Belbin Team-Role Self-Perception Inventory. Journal of Occupational and
Organizational Psychology, 66, 245-257.
*Gladstein, D. L. (1984). Groups in context: A model of task group effectiveness.
Administrative Science Quarterly, 29, 499-517.
Page 75
67
Goldberg, L. R. (1992). The development of markers for the Big-Five factor structure.
Psychological Assessment, 4, 26-42.
Goldberg, L. R. (1999b). International personality item pool: A scientific collaboratory
for the development of advanced measures of personality and other individual
differences. Retrieved from http://ipip.ori.org/ipip/.
*Guzzo, R. A., & Dickson, M. W. (1996). Teams in organizations: Recent research on
performance effectiveness. Annual Review of Psychology, 47, 307-338.
Hare, A. P. (1994). Types of roles in small groups: A bit of history and a current
perspective. Small Group Research, 25, 433-448.
Hackman, J. R. (1987). The design of work teams. In J. W. Lorsch (Ed.), Handbook of
organizational behavior (pp. 315-342). Englewood Cliffs, NJ: Prentice Hall.
*Hackman, J. R., & Morris, C. G. (1975). Group tasks, group interaction process, and
group performance effectiveness: A review and proposed integration. In L.
Berkowitz (Ed.), Advances in experimental social psychology (pp. 45-99). San
Diego: Academic Press.
*Higgs, M., Plewnia, U., & Ploch, J. (2005). Influence of team composition and task
complexity on team performance. Team Performance Management, 11, 227-250.
*Hofstee, W. K. B., Kiers, H. A., de Raad, B., Goldberg, L. R., & Ostendorf, F. (1997). A
comparison of Big-Five structures of personality traits in Dutch, English, and
German. European Journal of Personality, 11, 15-31.
Ilgen, D. R., Major, D. A., Hollenbeck, J. R., & Sego, D. J. (1993). Team research in the
1990s. In M. Chemers & R. Ayman (Eds.), Leadership, theory, and research:
Perspectives and directions (pp. 245-270). San Diego, CA: Academic Press.
James, L. R., Demaree, R. G., & Wolf, G. (1984). Estimating within-group interrater
reliability with and without response bias. Journal of Applied Psychology, 69, 85-
98.
*Jung, C. G. (1971). Psychological Types. (H.G. Baynes, Translated and revised by
R.F.C. Hull) Princeton University Press (Original work published 1923).
Katz, D., & Kahn, R. L. (1978). The social psychology of organizations (2nd
ed.). New
York: Wiley.
Page 76
68
Kozlowski, S. W. J., & Klein, K. J. (2000). A multilevel approach to theory and research
in organizations: Contextual, temporal, and emergent processes. In K. J. Klein &
S. W. J. Kozlowski (Eds.), Multilevel theory, research and methods in
organizations: Foundations, extensions, and new directions (pp. 3-90). San
Francisco, CA: Jossey-Bass.
Leary, T. (1957). Interpersonal diagnosis of personality. New York: Ronald Press.
LePine, J. A. (2003). Team adaptation and postchange performance: Effects of team
composition in terms of members‘ cognitive ability and personality. Journal of
Applied Psychology, 88, 27-39.
McCann, D., & Margerison, C. (1989). Managing high-performance teams. Training and
Development Journal, 43, 52-60.
McCann, D., & Margerison, C. (1995). Team management: Practical new approaches.
Chalford, England: Management Books 2000.
McCrae, R. R. & Costa, P. T. (1985). Updating Norman‘s ―adequate taxonomy‖:
Intelligence and personality dimensions in natural language and in questionnaire.
Journal of Personality and Social Psychology, 49, 710-721.
McCrae, R. R. & Costa, P. T. (1987). Validation of the five factor model of personality
across instruments and observers. Journal of Personality and Social Psychology,
52, 81-90.
*McGrath, J. E. (1964). Social psychology: A brief introduction. New York: Holt,
Rinehart, & Winston.
Meyers, L. S., Gamst, G., & Guarino, A. J. (2006). Applied multivariate research: Design
and interpretation. Thousand Oaks, CA: Sage Publications, Inc.
Morgeson, F. P., Reider, M. H., & Campion, M. A. (2005). Selecting individuals in team
settings: The importance of social skills, personality characteristics, and
teamwork knowledge. Personnel Psychology, 58, 583-611.
*Mumford, T. V. (2002). Team role knowledge and performance: Development of a team
role situational judgment test. Unpublished Dissertation from Purdue University.
Ann Arbor, MI: ProQuest Information and Learning Company.
Mumford, T. V., Campion, M. A., & Morgeson, F. P. (2006). Situational judgment test in
work teams: A team role typology. In J. A. Weekley & R. E. Ployhart (Eds.),
Situational judgment tests: Theory, measurement, and application (pp. 319-343).
Mahwah, NJ: Erlbaum.
Page 77
69
Mumford, T. V., Iddekinge, C. H., Morgeson, F. P., & Campion, M. A. (2008). Team
Role Test: Development and validation of a team role knowledge situational
judgment test. Journal of Applied Psychology, 93, 250-267.
*Myers, I. B. (1995). Gifts differing: Understanding personality type. Mountain View,
CA: Davies Black Publishing.
*Norman, W. T. (1963). Toward an adequate taxonomy of personality attributes:
Replicated factor structure in peer nomination of personality ratings. Journal of
Abnormal & Social Psychology, 66, 574-583.
Parker, G. M. (1994). Cross-functional teams. San Francisco: Jossey-Bass.
Parker, G. M. (1996). Team players and teamwork. San Francisco: Jossey-Bass.
Partington, D., & Harris, H. (1999). Team role balance and team performance: An
empirical study. Journal of Management Development, 18, 694-705.
Prichard, J. S., & Stanton, N. A. (1999). Testing Belbin‘s team role theory of effective
groups. Journal of Management Development, 18, 652-665.
Robins, R., Fraley, R. C., Robert, B. W., & Trzesniewski, K. H. (2001). A longitudinal
study of personality change in young adulthood. Journal of Personality, 69, 617-
640.
Roth, P. L., Switzer, F. S., & Switzer, D. M. (1999). Missing data in multiple item scales:
A Monte Carlo analysis of missing data techniques. Organizational Research
Methods, 2, 211-232.
*Salgado, J. F. (2003). Predicting job performance using FFM and non-FFM personality
measures. Journal of Occupational and Organizational Psychology, 76, 323-346.
*Saucier, G., Georgiades, S., Tsaousis, I., & Goldberg, L. R. (2005). The factor structure
of Greek personality adjectives. Journal of Personality and Social Psychology,
88, 856-875.
Saucier, G., & Goldberg, L. R. (2003). The structure of personality attributes. In M. R.
Barrick & A. M. Ryan (Eds.), Personality and work: Reconsidering the role of
personality in organizations (pp. 1-29). San Francisco: Jossey-Bass.
*Schneider, B., Smith, D. B., & Sipe, W. P. (2000). Personnel selection psychology:
Multilevel considerations. In Klein, K. J. & Kozlowski, S. W. J. (Eds.), Multilevel
theory research, and methods in organizations: Foundations, extensions, and new
directions (pp. 91-120). San Francisco: Jossey-Bass.
Page 78
70
Senior, B. (1997). Team roles and team performance: Is there ‗really‘ a link? Journal of
Occupational and Organizational Psychology, 70, 241-258.
*Steiner, I. D. (1972). Group process and productivity. New York: Academic Press.
Stewart, G. L., Fulmer, I. S., & Barrick, M. R. (2005). An exploration of member roles as
a multilevel linking mechanism for individual traits and team outcomes.
Personnel Psychology, 58, 343-365.
Sundstrum, E. de Meuse, K. P., & Futrell, D. (1990). Work teams: Applications and
effectiveness. American Psychologist, 45, 120-133.
*Swailes, S., & Aritzeta, A. (2006). Scale properties of the Team Role Self-Perception
Inventory. International Journal of Selection and Assessment, 14, 292-298.
*Swezey, R. W. & Salas, E. (1992). Guidelines for use in team-training development. In
R.W. Swezey & E. Salas (Eds.), Teams: Their training and performance (pp. 219-
245). Stamford, CT: Ablex.
*Ten Haaf, W., Bikker, H., & Adriaanse, D. J. (2002). Fundamentals of business
engineering and management: A systems approach to people and organizations
(pp. 486-515). Delft: DUP Science.
Tett, R. P., Jackson, D. N., & Rothstein, M. (1991). Personality measures as predictors of
job performance: A meta-analytic review. Personnel Psychology, 44, 703-742.
*Tupes, E. C., & Christal, R. C. (1961). Recurrent personality factors based on trait
ratings (Technical Report No. ASD-TR-61-97). Lackland Air Force Base, TX:
U.S. Air Force.
van der Water, H., Ahaus, K., & Rozier, R. Team roles, team balance and performance.
The Journal of Management Development, 27, 499-512.
Woodcock, M. (1989). Team development manual: Second edition. Hampshire, UK:
Gower Publishing.
*Asterisks denote references cited only in Appendix A: Proposal Introduction.
Page 80
71
Note: Adapted from Mumford et al. (2006).
Table 1 Informal Roles from Past Taxonomies Used to Develop the Mumford et al. (2006) Taxonomy
Previous Study
Mumford et al.
(2006)
Benne & Sheats
(1948) Bales (1950)
Belbin
(1993)
Ancona &
Caldwell
(1992)
McCann &
Margerison
(1995) Barry (1991)
DuBrin
(1995) Parker (1996)
Tas
k R
ole
s
Contractor Coordinator Gives orientation Coordinator Assessor Organizing Collaborator Collaborator
Initiator-Contributor Asks for orientation Shaper Thruster Summarizer
Opinion seeker Asks for opinion
Information seeker Asks for suggestion
Orientor
Energizer
Creator Planter Creator Envisioning
Contributor Opinion giver Gives opinion Specialist
Information giver Gives suggestion
Elaborator
Completer Procedural
technician
Completer Concluder Knowledge
contributor
Contributor
Recorder Implementer Controller
Critic Evaluator-critic Disagrees Monitor
evaluator
Reporter Challenger Challenger
Shows tension
Shows antagonism
So
cial
Ro
les
Communicator Encourager Shows solidarity Teamworker Upholder Social People
supporter
Tension release Listener
Agrees
Calibrator Harmonizer Process
observer
Communicator
Gatekeeper Conciliator
Group observer Gatekeeper
Standard setter
Bo
und
ary
-
Sp
annin
g
Ro
les
Consul Ambassador
Guard
Coordinator Resource
investigator
Task
coordinator
Explorer Spanning
Scout
Page 81
72
Table 2 Correlations between Team-Level Variables
1 2 3 4 5 6 7 8 9 10 11
k
Mean
(SD)
38
1.11
(1.31)
38
.95
(1.21)
38
1.68
(1.28)
38
1.55
(1.29)
38
1.18
(1.25)
38
3.03
(1.28)
38
.26
(.86)
38
9.76
(6.43)
38
4.18
(1.93)
38
74.43
(11.90)
38
80.16
(16.41)
1. Contractors 1.00 .57** .42** .49** .52** .08 .55** .68** .57** .09 -.21
2. Creators 1.00 .67** .66* .72** .28 .67** .86** .78** .21 -.13
3. Contributors 1.00 .65** .82** .40* .47** .84** .75** .22 -.07
4. Completers 1.00 .64** .51** .45** .84** .77** .37* .04
5. Critics 1.00 .30 .53** .86** .76** .26 -.06
6. Communicators 1.00 .17 .53** .49** .09 -.05
7. Calibrators 1.00 .69** .46** .22 .16
8. Total Roles 1.00 .87** .27 -.07
9. Team Balance 1.00 .22 -.18
10. TE1 1.00 .21
11. TE2 1.00
*Correlation is significant at the p < .05 (2-tailed) **Correlation is significant at p < .01 (2-tailed)
Key: k=number of teams; Total Roles=total number of informal roles performed within a team; Team Balance=number of distinct informal roles filled by at
least one individual; TE1=first decision period team effectiveness (percentage of maximum possible profit score); TE2=second decision period team
effectiveness (percentage of maximum possible profit score).
Page 82
73
Table 3 Correlations between Individual-Level Variables
1 2 3 4 5 6 7 8 9 10 11 12
n
Mean
(SD)
152
4.15
(.55)
152
3.25
(.71)
152
3.68
(.66)
152
3.76
(.51)
152
3.27
(.73)
152
.28
(.45)
152
.24
(.43)
152
.42
(.50)
152
.39
(.49)
152
.30
(.46)
152
.76
(.43)
152
.07
(.25)
1. Agreeableness 1.00 .14 .23** .25** .13 -.04 -.04 .09 .08 .11 .24** .11
2. Emotional Stability 1.00 .32** .23** .29** .02 .03 .14 .01 .05 .09 -.04
3. Conscientiousness 1.00 .02 .20* .15 .09 .12 .13 .00 .15 -.04
4. Openness 1.00 .15 .07 .08 .20* .10 .10 -.02 .03
5. Extraversion 1.00 .11 .11 .27** .21** .20* .07 -.02
6. Contractor 1.00 .48** .38** .45** .36** .08 .42**
7. Creator 1.00 .50** .44** .49** .21* .48**
8. Contributor 1.00 .46** .67** .20* .31**
9. Completer 1.00 .48** .33** .33**
10. Critic 1.00 .17* .41**
11. Communicator 1.00 .15
12. Calibrator 1.00
*Correlation is significant at p < .05 (2-tailed) **Correlation is significant at p < .01 (2-tailed)
Key: n=sample size; Openness=Openness to Experience.
Page 83
74
74
Table 4 Hierarchical Regression Analyses of Creator-Critic Interaction
TE1 TE2
Model/Predictor β R2 ΔR
2 β R
2 ΔR
2
Step 1 .07 -.04
Creatora .04 -.18
Critica .23 .07
Step 2 .08 .01 -.07 .00
Creatora -.03 -.18
Critica .21 .07
CreatorXCriticb .15 .00
*Statistic is significant at p < .05 (2-tailed) aCentered variable
bInteraction term of centered variables
Key: β=standardized regression coefficient; R2=variance explained; ΔR
2=change in variance explained;
TE1=first decision period team effectiveness (percentage of maximum possible profit score); TE2=second
decision period team effectiveness (percentage of maximum possible profit score).
Page 84
75
75
Table 5 Summary of Team-Level Hypotheses for First Decision Period Team
Effectiveness
Hypothesis Description Supported?
1a The number of Creators on a team will be positively related
to team effectiveness.
No
1b The number of Communicators on a team will be positively
related to team effectiveness.
No
1c The number of Completers on a team will be positively
related to team effectiveness.
Yes
1d The total number of informal roles performed on a team
will be positively related to team effectiveness.
Marginally
1e The total number of informal roles performed by at least
one individual on a team (i.e., team balance) will be
positively related to team effectiveness.
No
2 The number of Creators and Critics represented on a team
will interact such that the positive slope of the relationship
with team effectiveness will be significantly greater than
the slopes of the main effects of the two roles by
themselves.
No
Page 85
76
76
Table 6 Summary of Team-Level Hypotheses for Second Decision Period Team
Effectiveness
Hypothesis Description Supported?
1a The number of Creators on a team will be positively related
to team effectiveness.
No
1b The number of Communicators on a team will be positively
related to team effectiveness.
No
1c The number of Completers on a team will be positively
related to team effectiveness.
No
1d The total number of informal roles performed on a team
will be positively related to team effectiveness.
No
1e The total number of informal roles performed by at least
one individual on a team (i.e., team balance) will be
positively related to team effectiveness.
No
2 The number of Creators and Critics represented on a team
will interact such that the positive slope of the relationship
with team effectiveness will be significantly greater than
the slopes of the main effects of the two roles by
themselves.
No
Page 86
77
77
Table 7 Summary of Individual-Level Hypotheses
Hypothesis Description Supported?
3a Agreeableness will be positively related to adoption of the
Communicator role.
Yes
3b Agreeableness will be positively related to adoption of the
Calibrator role.
No
4a Conscientiousness will be positively related to adoption of
the Contractor role.
Marginally
4b Conscientiousness will be positively related to adoption of
the Creator role.
No
4c Conscientiousness will be positively related to adoption of
the Contributor role.
No
4d Conscientiousness will be positively related to adoption of
the Completer role.
No
4e Conscientiousness will be positively related to adoption of
the Critic role.
No
5a Openness to Experience will be negatively related to
adoption of the Contractor role.
No
5b Openness to Experience will be negatively related to
adoption of the Creator role.
No
5c Openness to Experience will be negatively related to
adoption of the Contributor role.
No
5d Openness to Experience will be negatively related to
adoption of the Completer role.
No
5e Openness to Experience will be negatively related to
adoption of the Critic role.
No
6a Extraversion will be negatively related to adoption of the
Contractor role.
No
6b Extraversion will be negatively related to adoption of the
Creator role.
No
6c Extraversion will be negatively related to adoption of the
Contributor role.
No
6d Extraversion will be negatively related to adoption of the
Completer role.
No
6e Extraversion will be negatively related to adoption of the
Critic role.
No
Page 87
78
78
Table 8 Correlations Between Team-Level Predictor Variables and Second Decision
Period Team Effectiveness When Controlling for First Decision Period Team
Effectiveness
TE2 TE2 Controlling for TE1
Contractors -.21 -.23
Creators -.13 -.18
Contributors -.07 -.12
Completers .04 -.05
Critics -.06 -.13
Communicators -.05 -.07
Calibrators .16 -.12
Total Roles -.07 -.14
Team Balance -.18 -.24 *Correlation is significant at the .05 alpha level (2-tailed) **Correlation is significant at the .01 alpha
level (2-tailed)
Key: Total Roles=total number of informal roles performed within a team; Team Balance=number of
distinct informal roles filled by at least one individual; TE1=first decision period team effectiveness
(percentage of maximum possible profit score); TE2=second decision period team effectiveness
(percentage of maximum possible profit score).
Page 88
79
79
Table 9 Regression Analyses Between Team-Level Informal Roles and Effectiveness
TE1 TE2
Informal Role b β b β
Contractor -1.96 -.22 -5.37* -.43*
Creator -1.55 -.16 -6.35 -.47
Contributor -1.00 -.11 -1.07 -.08
Completer 4.90** .53** 5.30 .42
Critic 1.79 .19 .71 .05
Communicator -1.49 -.16 -2.19 -.17
Calibrator 2.48 .18 10.57* .55* *Regression coefficient is marginally significant at p ≤ .10 (2-tailed) **Regression coefficient is
significant at p < .05 (2-tailed)
Key: b=unstandardized regression (slope) coefficient; β=standardized regression coefficient; TE1=first
decision period team effectiveness (percentage of maximum possible profit score); TE2=second decision
period team effectiveness (percentage of maximum possible profit score).
Page 89
80
80
Table 10 Hierarchical Regression Analyses Testing Significance of Incremental Variance
Explained by the Level Effect.
TE1 TE2
Model/Predictor β R2 ΔR
2 β R
2 ΔR
2
Step 1 .13* .26**
Pattern Effect .36* .51**
Step 2 .19* .06 .26** .01
Pattern Effect .34* .53**
Level Effect .25 .09 *Statistic is significant at p < .05 (2-tailed) ** Statistic is significant at p < .01 (2-tailed)
Key: β=standardized regression coefficient; R2=variance explained; ΔR
2=change in variance explained;
TE1=first decision period team effectiveness (percentage of maximum possible profit score); TE2=second
decision period team effectiveness (percentage of maximum possible profit score).
Page 90
81
81
Table 11 Hierarchical Regression Analyses Testing Significance of Incremental Variance
Explained by the Pattern Effect.
TE1 TE2
Model/Predictor β R2 ΔR
2 β R
2 ΔR
2
Step 1 .08 .01
Level Effect .27 -.07
Step 2 .19* .12* .26** .26**
Level Effect .25 .09
Pattern Effect .34* .53** *Statistic is significant at p < .05 (2-tailed) ** Statistic is significant at p < .01 (2-tailed)
Key: β=standardized regression coefficient; R2=variance explained; ΔR
2=change in variance explained;
TE1=first decision period team effectiveness (percentage of maximum possible profit score); TE2=second
decision period team effectiveness (percentage of maximum possible profit score).
Page 92
82
82
Figure 1 Conceptual Framework of the Present Study
Page 93
83
83
Figure 2 Sample Profile Pattern for a Single Team
Page 94
84
84
Figure 3 Sample Criterion Pattern Associated With High Levels of Team Effectiveness
Page 95
85
85
Figure 4 Criterion Profile for First Decision Period Team Effectiveness
Page 96
86
86
Figure 5 Criterion Pattern for Second Decision Period Team Effectiveness
Page 98
87
87
Appendix A: Proposal Introduction
Introduction
The nature of organizations continues to change throughout the world as
organizational structure and work-related tasks become increasingly complex. In order to
adapt, organizations use growing numbers of work teams to accomplish tasks, meet
goals, and achieve objectives (Ilgen, Major Hollenbeck, & Sego, 1993). The term team
refers to an interdependent collection of individuals working together toward a shared
and valued goal, objective, or mission (Hackman, 1987), and estimates suggest that
nearly half of all organizations in the United States employ at least one or more teams
(Devine, Clayton, Philips, Dunford, & Melner, 1999). Furthermore, past theory and
research indicate that, under certain circumstances, a team is capable of performance that
is greater than the sum of the individual efforts (Forsyth, 1998). For these reasons, there
has been a push to better understand the characteristics of effective teams.
One way to conceptualize team effectiveness is through an input-process-output
model, where team effectiveness hinges on inputs and processes that influence a team‘s
ability to successfully meet or exceed a collective goal, objective, or mission (Gladstein,
1984; Hackman, 1987; Hackman & Morris, 1975; McGrath, 1964). For example, inputs
such as situational demands, access to resources, and the configuration of individual
difference characteristics, all contribute to a team‘s effectiveness (Chidester, 1987). In
addition, team effectiveness depends upon processes such as decision-making and
communication as well as outputs such as task performance, innovation, and member
Page 99
88
88
satisfaction (Gladstein, 1984). Therefore, team effectiveness reflects both individual and
team inputs and team processes and their influence on team outputs.
Some researchers have suggested that a critical linking mechanism between
individual inputs and team outputs is informal roles (Stewart, Fulmer, & Barrick, 2005).
That is, the behavioral patterns and tendencies associated with informal roles are thought
to emerge because of dispositional traits and situational demands (Forsyth, 1998;
Mumford, Iddekinge, Morgeson, & Campion, 2008; Stewart et al., 2005). In addition,
research suggests that informal roles influence team processes and outputs (Guzzo &
Dickson, 1996). Therefore, it should be at the team-level that the configuration of
informal roles influences team-level processes and outputs such as cohesion and task
performance (Stewart et al., 2005).
The potential relationship between informal roles and team effectiveness has
important practical implications as well. A team‘s configuration of informal roles could
be used to predict team task performance and productivity and, as a result, organizations
could use knowledge about informal roles in decision-making. For example, an
organization could create teams with effective informal role configurations and disband
teams with ineffective configurations. In this way, an organization could maximize its
competitive advantage over other organizations.
Also of practical importance is being able to predict team members‘ adoption of
informal roles. One potential predictor of informal roles is personality which refers to a
person‘s characteristic patterns of thought and behavior (Funder, 2001). Evidence
suggests that some personality traits influence a person‘s tendency to adopt certain
informal roles (Blumberg, 2001; Stewart et al., 2005). The logic being, personality
Page 100
89
89
behavior remains relatively stable across situations and, therefore, should to some extent
influence situation-dependent behavior clusters such as informal roles. As such, assessing
a person‘s personality traits may prove to be an effective way of predicting the adoption
of informal roles.
In summary, theory suggests that informal roles may serve as a potential linking
mechanism between individual team inputs and team processes and outputs (Katz &
Kahn, 1978; Stewart et al., 2005). Specifically, stable dispositional inputs (e.g.,
personality) are expected to influence the adoption of situation-dependent informal roles
which should, collectively, influence team-level processes and outputs (e.g., team
effectiveness). The present study will further investigate the relationship between
informal roles and team effectiveness as well as the link between personality and
informal roles. The results of this study could have implications for Human Resource
selection techniques and team assembly and disassembly. In the following sections, I will
begin by presenting a framework that lays out the conceptual foundation of this study.
Following the framework, I will review the relevant literature, formulate hypotheses, and
describe the method I will use to test the hypotheses.
Conceptual Framework
Stewart, Fulmer, and Barrick (2005) presented a general model in which informal
roles serve as a linking mechanism between individual traits (i.e., personality) and team
outcomes. For the purposes of the present study, I have adapted their model (see
Appendix A) to serve as the guiding framework for the present study. The model consists
of four primary components: (1) Personality, (2) Informal Roles, (3) Informal Role
Page 101
90
90
Configuration, and (4) Team Effectiveness. Three arrows in Appendix A connect these
four components and, thus, represent the proposed relationships. A fourth arrow
intersects the linking arrow between informal roles and informal role configuration; this
arrow represents the moderating influence that situational demands exert on the emergent
processes. In addition to the components and linking arrows, the framework is separated
into two halves by a horizontal dashed-line. This dashed-line distinguishes individual-
level phenomena and team-level phenomena. Personality and informal roles sit beneath
the dashed-line and, accordingly, represent individual-level phenomena. On the other
hand, informal role configuration and team effectiveness represent team-level phenomena
given that they are positioned above the dashed line. Appendix B and Appendix C depict
the primary and secondary purposes, respectively, of the present study. As shown in
Appendix B, the primary purpose is to investigate the relationship between informal
roles, informal role configuration, and team effectiveness. The secondary purpose (see
Appendix C) is to investigate the relationship between personality and informal roles.
The structure of the following literature review is organized according to the
primary and secondary purposes of this study. I will begin with a review of the three
components diagrammed in Appendix B. First, I will provide an overview of informal
roles, informal role configuration, and team effectiveness. After defining the constructs, I
will review studies that have explored the empirical links between informal roles,
informal role configuration, and team effectiveness. Next, the emphasis will shift to the
secondary purpose of this study: investigating the relationship between personality and
informal roles (refer to Appendix C). In that section, I will define the construct of
Page 102
91
91
personality. Finally, I will review research that has explored the relationship between
personality and informal roles.
Previous Theory and Research
Informal Roles
As evidenced by Stewart et al.‘s (2005) framework (refer to Appendix A),
informal roles are key components of the present study‘s primary and secondary
purposes. In the following section, I will begin by clarifying the distinction between
formal and informal roles and provide a definition for informal roles. Finally, I will
review relevant informal role taxonomies and identify an integrated approach.
Definition
There are two types of team roles: (1) formal and (2) informal. A formal role
represents a cluster of a team member‘s official duties and responsibilities that he or she
is supposed to perform. As such, a formal role refers to a person‘s officially designated
status, position, or title within the team (Hare, 1994). For example, organizations often
officially appoint a person to fill the role of team leader, and that decision is formally
communicated to team members. In contrast, an informal role represents a team
member‘s actual behavior patterns as opposed to the duties and responsibilities that he or
she is supposed to perform (Hare, 1994). In other words, formal roles prescribe how team
members should behave, whereas informal roles describe how team members do behave.
Page 103
92
92
Informal roles emerge because of team member interactions in a specific team
context (Katz & Kahn, 1978; Stewart et al., 2005). That is, the manner in which team
members interact is influenced by individual characteristics (e.g., personality) and
situational demands (e.g., the nature of a team‘s task, the formal roles already in place).
Thus, an informal role refers to the context-specific pattern of related behaviors that a
team member adopts as a result of team interaction (Mumford et al., 2008; Stewart et al.,
2005). In order to classify and organize related behaviors into distinct informal roles,
researchers and practitioners alike have developed a variety of taxonomies for informal
roles on teams. In the following sections, I will review some of the more prominent
taxonomies in chronological order.
Benne and Sheats‘ Taxonomy
Over the past 60 years, several informal role taxonomies and measures have been
introduced (e.g., Bales, 1950; Belbin, 1981, 1993; Benne & Sheats, 1948; Dubrin, 1995;
McCann & Margerison, 1995). For instance, Benne and Sheats (1948) developed a
taxonomy based upon observations at the National Training Laboratory for Group
Development (NTL). The NTL itself was developed by the United States government to
further research related to team development and to create team training interventions.
From their observations at the NTL, Benne and Sheats argued that actual role behaviors
(i.e., informal role behaviors) had to be identified prior to training team members to enact
formal roles.
Benne and Sheats (1948) grouped informal roles into three categories: (1) task,
(2) building and maintenance, and (3) individual. The task role category includes those
Page 104
93
93
roles that directly contribute to team task completion. People filling such roles facilitate
and coordinate the processes necessary for task completion. This category consists of 12
informal roles with associated behavioral descriptions. Examples of task roles include:
the Coordinator (i.e., coordinates information, ideas, and activities in order to clarify
common themes), the Energizer (i.e., pushes the team to act or make quality decisions),
and the Information Seeker (i.e., asks for additional information and interpretations
regarding the suggestions made by others).
The building and maintenance role category, on the other hand, includes those
roles that directly contribute to a team‘s positive social interactions and indirectly
contribute to team task completion. That is, people in these roles contribute to a team‘s
social and emotional environment by encouraging cooperative and cohesive interpersonal
interactions. In turn, teams with greater cooperation and cohesiveness tend to interact in
ways that are conducive for task-related information sharing and communication.
Therefore, although building and maintenance roles do not directly impact team task
performance, they influence contextual interpersonal processes that indirectly contribute
to successful task completion. In total, there are seven roles that fall under this category.
Examples of those roles include the Follower (i.e., acts as an audience for proposed ideas
and follows the ideas of others), the Harmonizer (i.e., serves as a peacemaker and unites
members during disagreements), and the Encourager (i.e., commends and praises the
ideas and actions of others).
Finally, the individual role category consists of roles that are either self-serving or
not in alignment with the team‘s goals. This third category consists of eight underlying
roles, including the Blocker (i.e., disagrees and resists the ideas and initiatives of others;
Page 105
94
94
blocks team progress toward task completion), the Recognition Seeker (i.e., directs
attention away from the team; calls attention to oneself), and the Dominator (i.e., uses
authority and power to manipulate the team). As evidenced by the role descriptions, these
roles tend to be detriments to team task success and effective social interactions. In all,
the three role categories contain 27 informal roles.
Bales‘ Taxonomy
In a separate line of research, Bales (1950) developed an informal role taxonomy
to identify and code fundamental team behaviors for what is called the Interaction
Process Analysis (IPA). His taxonomy consists of 12 key behaviors (e.g., Gives
suggestions, Shows solidarity, Shows antagonism, Disagrees, etc.) divided evenly
between two role categories (i.e., task, socioemotional). Although referred to as key
behaviors, essentially they refer to clusters of behavior that are synonymous with the
definition of informal roles; accordingly, they will henceforth be referred to as such.
Unlike Benne and Sheats‘ (1948) roles, however, Bales‘ (1950) roles are not labeled with
descriptive role names (e.g., Harmonizer, Encourager); rather, they are each described by
a behavioral action statement that captures the nature of the underlying cluster of related
behaviors.
As mentioned above, six informal roles are related to the task role category and
another six informal roles are related to the socioemotional role category. In Bales‘
(1950) taxonomy, both role categories are assumed to be critical for effective team
functioning. Meaning, teams adopting a disproportionate number of task category roles
will likely begin to suffer interpersonally. Similarly, teams adopting too many
Page 106
95
95
socioemotional category roles will likely experience problems due to poor progression
toward successful task completion. Under this assumption, teams with balanced roles will
tend to experience less social- and task-related tensions.
Like the task role category of Benne and Sheats‘ (1948) taxonomy, Bales‘ (1950)
task role category includes those role behaviors that contribute directly to the task. The
six roles are as follows: (1) Gives suggestions, (2) Gives opinions, (3) Gives orientation,
(4) Asks for suggestions, (5) Asks for opinions, and (6) Asks for orientation. As
evidenced by the labels, the roles may be categorized by the extent to which they are
dominant or submissive, where dominant roles refer to those with the verb stem ―gives‖
and submissive roles include those with the stem ―asks.‖
With regard to the socioemotional role category, it was conceptualized in much
the same way as Benne and Sheats‘ (1948) building and maintenance role category.
Consequently, it includes those roles that are not directly task-related but, rather,
contribute to team social functioning. The six roles in this category are: (1) Shows
solidarity, (2) Shows tension release, (3) Agrees, (4) Shows antagonism, (5) Shows
tension, and (6) Disagrees. These roles may be classified by their positive or negative
valence. As such, the first three roles listed are all positive in nature in that they promote
effective social functioning. In contrast, the second three roles negatively impact a team‘s
socioemotional functioning.
After publishing the IPA (Bales, 1950), Bales and Cohen (1979) created the
System for Multiple Level Observation of Groups (SYMLOG). This new method for
measuring team roles introduced a more advanced coding system for categorizing
behaviors. In general, however, Bales and Cohen preserved the core characteristics of the
Page 107
96
96
original characteristics of the IPA. Most notably, SYMLOG categorizes role behaviors
along task and social role categories.
Belbin‘s Taxonomy
After nine years of observing managers in training courses, Belbin (1981, 1993)
developed his own informal role taxonomy (see Appendix D) that is based upon some of
Bales‘ (1950) taxonomy roles. Belbin‘s (1981) taxonomy originally included eight
informal roles, although it was later expanded to nine (Belbin, 1993). Further, he
proposed that each of his roles was necessary for team success. That is, effective teams
contain representatives who each enact a distinct role that is essential for team
functioning. In his words, a team is considered ―balanced‖ if every role is filled.
To assess informal role balance, Belbin constructed two measures of a person‘s
natural inclination to adopt a role (or multiple roles). The first method, the Belbin Team-
Role Self-Perception Inventory (BTRSPI), is a self-report measure of informal role
tendencies, and the second method, the Observer‘s Assessment Sheet (OAS), is an
observer checklist of a team member‘s informal role tendencies. One study found
significant correlations between the BTRSPI and OAS for eight of the nine roles
(Broucek & Randell, 1996); however, the sizes of some of the correlations were
disconcertingly low. For instance, the correlations between role scores from the two
measures were only r = .11 for the Coordinator role and r = .19 for the Specialist role. In
fact, the highest between-method correlation was r = .40 for the Shaper role.
With respect to the BTRSPI, several teams of researchers have investigated its
psychometric properties (e.g., Aritzeta, Swailes, & Senior, 2007; Dulewicz, 1995; Fisher,
Page 108
97
97
Hunter, & Macrosson, 2001; Furnham, Steele, & Pendleton, 1993; Swailes & Aritzeta,
2006). For example, Furnham and colleagues (1993) found the original measure, as well
as two variations, to have low coefficient alpha reliability estimates and poor factor
support for the taxonomy‘s roles. More recently, Aritzeta and colleagues (2007)
conducted a review of 43 empirical studies using the measure. The authors found that, in
general, evidence was conflicting with regard to the psychometric characteristics of the
inventory. Most notably, they found strong correlations between certain team roles (e.g.,
r = .58, r = .57) which are suggestive of low discriminant validity. In support of the
measure, however, Aritzeta and colleagues concluded the roles assessed by the measure
indicated relatively good convergent validity.
The design and content of the BTRSPI are also suggestive of the measure‘s
questionable construct validity. Most notably, the items do not instruct participants to
think of a specific team context in which they have participated. Rather, the items are
designed to assess a person‘s cross-situational informal role behavioral tendencies. For
instance, the following two items demonstrate such behavioral generalizations: (1) ―I gain
satisfaction in a job because I enjoy analyzing situations and weighing up all the possible
choices;‖ and (2) ―My characteristic approach to group work is that I contribute where I
know what I am talking about.‖ Phrases such as these refer to general tendencies as
opposed to inclinations in a specific team composed of specific people. In summary, the
way in which Belbin defines informal roles is conceptually similar to that of others, but
his measures do not specify a specific team context. Instead, they appear to measure
stable individual traits. Therefore, Belbin‘s measures of team role performance (i.e., OAS
and BTRSPI) demonstrate questionable psychometric properties.
Page 109
98
98
Other Informal Role Taxonomies
When compared to the taxonomies of Benne and Sheats (1948), Bales (1950), and
Belbin (1981, 1993), the following taxonomies have received relatively little empirical
attention (i.e., Ancona & Caldwell, 1988, 1992; Barry, 1991; Davis, Millburn, Murphy,
& Woodhouse, 1992; Dubrin, 1995; McCann & Margerison, 1989, 1995; Parker, 1994,
1996; Woodcock, 1989). Therefore, I will only highlight those taxonomies that have
made unique contributions to the conceptualization of informal roles. For instance,
Ancona and Caldwell (1988, 1992) emphasized boundary-spanning roles in modern
teams. As the name implies, these roles include behaviors that span across team
boundaries. Specifically, boundary-spanning roles include behaviors that have an external
focus; meaning, they bridge the gap between the team and other teams or between the
team and the organization. In that sense, people performing boundary-spanning roles
typically act as inter-team liaisons. Also of note, Barry (1991) developed a taxonomy that
identifies the emergence of leadership roles in teams where a formal leader has not
already been designated. His qualitative research tapped into an increasingly common
phenomenon in which teams are assembled and provided with little or no formal
structure. To date, however, there is no empirical evidence to support Barry‘s taxonomy.
In summary, most of these taxonomies have received very little if any empirical
attention. However, several have offered distinctive approaches to conceptualizing
informal roles and, thus, have added value to the literature. For this reason, Mumford and
colleagues (2006, 2008) included some of these taxonomies in their integrative informal
role taxonomy. The Mumford taxonomy will be reviewed in depth in the following
paragraphs.
Page 110
99
99
Integrating Informal Role Taxonomies
As evidenced by this review, multiple informal role taxonomies exist. Some
taxonomies overlap substantially in terms of the behavior clusters assessed, while still
others introduce new role types. Recognizing the lack of consensus, Mumford and
colleagues (Mumford, 2002; Mumford et al., 2006) developed an informal role taxonomy
that integrated the roles from different taxonomies. Specifically, they recognized the
importance of integrating internally focused roles (e.g., Bales, 1950; Benne & Sheats,
1948) and externally focused roles (e.g., Ancona & Caldwell, 1988, 1992) into a single
taxonomy. Internally focused roles refer to those roles whose behaviors occur entirely
between members of the team and, thus, are contained within the team. In contrast,
externally focused roles are commonly referred to as boundary-spanning roles in that they
interact with people external to the team in order to recruit information and resources that
help the team achieve its goals (Ancona & Caldwell, 1988).
Integrating the roles from different taxonomies required a multi-step process
(Mumford, 2002; Mumford et al., 2006). To begin with, Mumford and colleagues
reviewed the informal role literature and catalogued the roles across taxonomies. Next,
they listed all of the identified informal roles on individual note cards. This process
resulted in 120 note cards, each representing a role and its definition. During the third
step, the cards were sorted into homogenous groups using a q-sort methodology. To
conduct the q-sort, two researchers independently sorted the roles into functionally
homogenous groups; meaning, roles fulfilling the same behavioral function for the team
were grouped together into common categories. The sorting of the roles resulted in a
similar number of role categories for each researcher (i.e., 11 role categories versus 13
Page 111
100
100
role categories). Upon completing the q-sort, the two researchers discussed their
respective choices and attempted to reconcile any differences. After the discussion, it was
decided to merge three categories and split one category into two which resulted in
consensus on the resulting 11 categories. Between the two researchers, the level of
agreement on the placement of roles in the same category was high (Kappa = .80) in that
99 out of 120 roles (83%) were placed in the same category. In the end, the researchers
did not include dysfunctional roles (i.e., roles that are a detriment to team success), such
as the roles in Benne and Sheats‘ (1948) individual role category, because the goal was to
include only those role categories that contributed to successful team functioning.
Eliminating the dysfunctional role category reduced the total number of role categories
from 11 to 10.
As evidenced above, the Mumford taxonomy (Mumford, 2002; Mumford et al.,
2006) integrates roles from previously published taxonomies (e.g., Ancona & Caldwell,
1992; Bales, 1950; Barry, 1991; Belbin, 1993; Benne & Sheats, 1948; Dubrin, 1995;
McCann & Margerison, 1995; Parker, 1996). Using the informal roles associated with
various taxonomies, Mumford and colleagues identified 10 distinct roles underlying three
role categories: (1) task, (2) social, and (3) boundary-spanning. However, in a validation
study, analysis of the 10-role taxonomy demonstrated low convergent validity within the
social role category in that the correlations between the Cooperator, Communicator, and
Calibrator roles were close to zero or even negative (Mumford et al., 2008).
Consequently, Mumford and colleagues revised the taxonomy by eliminating the
Cooperator role, leaving nine informal roles embedded in the three role categories.
Page 112
101
101
The task role category includes the informal roles of Contractor, Creator,
Contributor, Completer, and Critic. These roles feature behaviors directly associated with
accomplishing the team‘s task objectives. For instance, the Contractor refers to behaviors
related to organizing and coordinating team activities. That is, the Contractor directs team
members to focus on completing the team task efficiently. In essence, the key function of
this role is to provide structure to the team‘s task-oriented behaviors. The Creator
suggests original and/or innovative solutions to the team‘s task-related problems and
provides a fresh perspective with regard to problem solving. In general, people filling this
role grasp the ―big picture‖ and think of creative solutions that help the team meet
collective objectives. Moreover, the Creator influences the approaches that a team takes
to successfully perform a task. As the name implies, the Contributor contributes unique
information or expertise to the team. This means that people performing this role tend to
speak out when they have specialized knowledge related to the team‘s task and, because
of this, they tend to emerge as task leaders when they have prior experience in a relevant
subject area. The Completer, on the other hand, spearheads the individual-oriented tasks
in the team until completed. Team members performing this role follow through on
commitments they made to the team and finish individual-oriented tasks on time and
without reminders. In general, the Completer takes responsibility for completing tasks.
Finally, the Critic role covers those behaviors associated with questioning and
commenting on the team‘s task structure and processes (i.e., the manner in which the
team chooses to coordinate and organize information related to meeting objectives). In a
sense, the Critic plays the part of the ―Devil‘s Advocate‖ in that he or she points out
shortcomings of a team‘s actions and decisions. Specifically, people performing this role
Page 113
102
102
speak out when they have concerns related to the team‘s work. They also make sure the
team discusses the pros and cons of each task-related decision. In summary, the Critic
shares opinions about the quality of a team‘s work processes and outputs, even if those
opinions are negative.
The second role category deals with the social roles. This category includes the
roles of Communicator and Calibrator. Roles in the social role category consist of
contextual behaviors that facilitate the team‘s socioemotional environment. That is, their
behaviors support and maintain the team‘s cohesion, morale, and mood. For instance, the
Communicator‘s primary function is to create a social environment conducive to
collaboration. Team members adopting this role make interactions pleasant and
comfortable by being happy and easy to work with. In addition, the Communicator tends
to listen carefully and intently to the thoughts, feelings, and emotions of fellow team
members. Finally, the Communicator strives to communicate personal feelings and
thoughts in a respectful manner. With social norms in mind, the Calibrator performs
behaviors that function to observe the team‘s social processes, make the team aware of
the social processes, and ultimately, suggest changes to the observed social processes. As
such, people in this role help settle conflicts between team members and intervene to
resolve difficulties when there are negative feelings. Additionally, the Calibrator suggests
positive ways for team members to interact (i.e., being open to new ideas, showing
respect, taking turns).
The third and final category is called the boundary-spanning role category. This
category includes the informal roles of Consul and Coordinator. Roles in the boundary-
spanning role category pertain to behaviors that facilitate team functioning with the
Page 114
103
103
external environment (i.e., other teams, the overarching organization, other
organizations). For instance, the Consul interacts with those external to the team in order
to favorably market the team. Behaviors consistent with this role include: sharing
accomplishments with non-team members, gaining support from important or influential
non-team members, and frequently updating non-team members with information about
the team‘s successes. Thus, the primary emphasis of this role is to favorably showcase the
team‘s processes and outputs. Like the Consul, the Coordinator interacts with people
outside of the team. More specifically, the Coordinator interacts with non-team members
to garner information, ideas, and other resources. People performing this role tend to seek
out and bring critical information back to the team that may improve decision-making. In
addition, people in this role interact with those external to the team to gain special
knowledge about the team‘s tasks, processes, and/or performance. Thus, the Coordinator
brings external resources back to the team that may improve team effectiveness.
In summary, Mumford and colleagues (Mumford, 2002; Mumford et al., 2006)
integrated over 120 informal roles into a single taxonomy. Today, their taxonomy
includes nine informal roles nested within three role categories (Mumford et al., 2008).
The task role category includes the roles of Contractor, Creator, Contributor, Completer,
and Critic, while the social role category is made up of the Communicator and Calibrator
roles. Finally, the boundary-spanning role category includes the Consul and Coordinator.
To measure the extent to which team members perform each informal role, the
researchers developed a measure called the Team Role Performance (TRP) test. For a
detailed description of the TRP, please refer to the Method section.
Page 115
104
104
Informal Role Configuration
Using individual-level informal roles to predict team-level performance presents a
level-of-analysis issue (Stewart et al., 2005). That is, the aggregation of informal roles to
a team-level construct is not necessarily the sum or average of those individual difference
variables (Kozlowski & Klein, 2000; Stewart et al., 2005). In general, the informal roles
performed by an individual are influenced by the roles performed by team members as
well as by other situational demands. For instance, Team Member A may be naturally
inclined to perform a specific role but Team Member B may already be performing that
same role. As a result, Team Member A may perform an alternative role. That is not to
say, however, that the same role may not be duplicated on a team. Rather, that example
illustrates the interactional effects that influence an individual‘s tendency to adopt a given
informal role. Therefore, even at the individual-level, the roles performed by a team
member are influenced by roles performed by others. This suggests that team context
(i.e., situational demands) is an important influence of individual-level informal role
performance (Stewart et al., 2005). Furthermore, at the team-level of analysis, both
internal (e.g., informal roles of team members, task type) and external (i.e., influences
originating outside of the team) situational demands shape how individual-level informal
roles affect team-level behavioral outputs such as team task performance.
As alluded to above, a collection of informal roles performed within a team is best
conceptualized at the team-level. The term informal role configuration refers to the
structure of informal roles at the team-level whereby different structures constitute
different patterns of activity between team members (LePine, 2003). Moreover,
qualitative differences may exist between individual-level roles and the collective team-
Page 116
105
105
level role structure involving those same individual-level roles. Namely, at the team-level
informal roles become the collective amalgamation known as the informal role
configuration.
In the case of informal roles, informal role structure is the result of a bottom-up
process called emergence whereby lower level constructs aggregate to form higher level
constructs (Kozlowski & Klein, 2000). Because informal roles manifest at the team-level
in the form of an informal role configuration, informal roles are said to have emergent
properties. In general, emergent properties result from social-psychological interactions
and information exchanges between team members (Kozlowski & Klein, 2000). That is,
emergence involves not only the characteristics of each individual but also the
behavioral, informational, and emotional interactions between a collective of individuals.
In essence, the theory of emergence provides an explanation as to why organizations
continue to emphasize teams and teamwork. By working together, a team has the
potential to produce an output that is greater (or qualitatively different) than the collective
output of the same team members working independently. In support of this, a team
composed entirely of high performing individuals will not necessarily yield high team-
level performance (Schneider, Smith, & Sipe, 2000). Thus, through emergence, team-
level behavior may demonstrate qualities that are different than the sum or average of
individual-level behavior.
In the present study, informal role configuration will serve as the team-level
behavior that emerges from individual-level informal role behavior. This team-level
structure of informal roles will be operationalized as a vector capturing the number of
individuals filling each role. In general, the approach I am taking is not new as it has been
Page 117
106
106
used by past researchers to describe a team‘s informal role configuration. In particular,
several studies using Belbin‘s (1981, 1993) taxonomy conceptualized informal role
configuration in terms of which roles were manifested within a team (e.g., Blenkinsop &
Maddison, 2007; Prichard & Stanton, 1999; Senior, 1997). However, those same studies
placed a limit on the number of informal roles a team member was said to have adopted.
In contrast, the vector approach imposes no such limit. For example, using an informal
role configuration vector, a single team member could potentially perform every role
found in Mumford et al.‘s (2006, 2008) taxonomy. In this way, the vector should prove to
be more generalizable to actual work teams because, in real world settings, some
individuals may perform a wide array of roles. Finally, teams may be differentiated from
one another based upon variations in their informal role configurations vectors. In this
way, I propose that meaningful differences in informal role configurations will result in
varying levels of team effectiveness.
Team Effectiveness
In general, team effectiveness refers to the consequences of a team‘s inputs,
processes, and outputs (Gladstein, 1984; Hackman, 1987). That is, it varies based upon
the characteristics, behaviors, and context of a team (Chidester, 1987). This suggests that
team effectiveness cannot be universally defined for all teams. Rather, the definition
hinges upon the team context and situational constraints in which a team operates
(Devine, 2002). In order to identify an appropriate method of measuring team
effectiveness, I will define and review the construct as it relates to the present study.
Page 118
107
107
According to Hackman‘s (1987) broad definition of team success, there are two
primary components of team effectiveness: (1) performance and (2) viability.
Performance refers to the quality and/or quantity of a team‘s outputs, whereas viability
refers to a team‘s capability to endure into the future. These two components represent a
number of team process and outcome variables such as team cohesion, team conflict,
team communication, member flexibility, workload sharing, team task performance
(Barrick, Stewart, Neubert, & Mount, 1998), productivity, member well-being, and
innovation (Brodbeck, 1996). The relevance of such process and outcome variables
depend upon the team type, where team type is defined by the situational context (i.e.,
situational demands) in which a team operates (Devine, 2002). For instance, a team may
be classified in relation to a series of context variables such as fundamental work cycle,
physical ability requirements, temporal duration, task structure, active resistance,
hardware dependence, and health risk (Devine, 2002). Thus, when defining team
effectiveness, it is necessary to consider how team effectiveness varies in relation to team
context, or rather, situational demands.
In addition to team context, the level of team effectiveness is dependent upon
other individual- and team-levels components. Examples of individual-level components
include characteristics such as traits, knowledge, skills, and abilities, whereas the team-
level components refer to the processes and the outcomes of a team‘s work. On one hand,
team processes describe the manner in which individuals collaborate, interact, and work
together toward a common goal. For example, processes include communicating,
coordinating, and decision-making (Gladstein, 1984). On the other hand, a team outcome
is the result of individual characteristics, situational demands, and team processes. Output
Page 119
108
108
variables include, for example, team member satisfaction, productivity, performance, and
innovation (Gladstein, 1984).
In the present study, informal roles should bridge the gap between the individual-
level characteristic of personality and team-level processes influenced by informal role
configuration. That is, informal roles should be influenced not only by individual
characteristics but also by team processes such as communication, coordination, and
decision-making. Accordingly, the informal roles adopted by team members should
impact the extent to which a team experiences negative processes such as social loafing
(i.e., feelings of low accountability of individual team members that reduces motivation
to perform) and dysfunctional team conflict (Steiner, 1972). Finally, the emergence of an
informal role configuration should influence team-level process behaviors that, in turn,
influence team outcomes. Thus, together the components of personality, situational
demands, informal roles, and informal role configuration should impact team
effectiveness.
Links Between Informal Roles, Role Configuration, and Team Effectiveness
The relationships between informal roles, team informal role configuration, and
team effectiveness have been tested in a handful of studies. Of those studies, the majority
used Belbin‘s (1981, 1993) BTRSPI to measure informal roles while another used Bales‘
(1950) taxonomy and SYMLOG Adjective Rating Form (Bales & Cohen, 1979). The
following section reviews past empirical attempts to assess the links between informal
roles, informal role configuration, and team effectiveness.
Page 120
109
109
Studies Using the Belbin Taxonomy
Senior (1997) investigated the informal role, informal role configuration, and
team effectiveness links using Belbin‘s (1981, 1993) taxonomy and her three primary
objectives for the study were: (1) determine an individual‘s ―natural‖ informal role; (2)
determine if a team‘s informal role configuration is balanced; and (3) evaluate the impact
of informal role configuration on team performance. Using 11 real management teams
from different organizations, the author first assessed the natural informal role for each
individual by using Belbin‘s cut-off score (i.e., 70 points or higher) on the composite
informal role score (i.e., combination of the Self-Perception Index and the Observer Scale
scores for each role). From there, she labeled a team as ―balanced‖ if it met one of two
conditions: (1) each of the nine roles had at least one person that met the 70 or above cut-
off; or (2) the average informal role scores across all nine roles were within 20% of each
other. The logic underlying the second condition was that: A team‘s informal role
configuration may lack certain natural roles which would suggest it is not balanced;
however, if the team‘s average role scores across roles are similar, then the team is
considered balanced.
In order to measure team performance, Senior created a predicted performance
rating based on the two measures of team balance and the appropriateness of the team
leader‘s roles in relation to the stage of team development (e.g., identifying needs,
making contacts, establishing the organization; Belbin, 1993). The appropriateness of the
team leader‘s roles for a particular stage of development relates to one of Belbin‘s (1993)
assumptions. In essence, Belbin asserts that certain roles are more relevant to specific
stages of team development. That is, he predicts that teams will perform better if the team
Page 121
110
110
leader scores highly on key stage roles and if the team, as a whole, scores highly on key
stage roles across team members. Because of Belbin‘s (1993) assumption, Senior‘s
(1997) predicted performance rating is based on the following four components: (1)
balance of the team members‘ strongest role scores, (2) balance of overall role averages,
(3) match of key stage roles to the leader‘s strongest role scores, and (4) match of key
stage roles to the strongest overall team average roles scores. Using that information, she
evaluated the 11 teams on those four components and arrived at a qualitative judgment of
predicted team performance ranging from ―poor‖ to ―very good.‖ Next, Senior measured
observed team performance. To do this, she interviewed participants and asked them to
identify characteristics that differentiate teams based on level of team performance. Using
Spearman‘s rank-order correlation, she found a significant positive relationship between
predicted and actual performance ratings but did not report the statistic in her article.
Since her predicted ratings of performance were based in part on team balance, she
concluded that balanced teams (i.e., well-configured, well-composed) will perform at
higher levels. Further, upon reviewing each team‘s measures of team balance (i.e.,
balance of team members‘ strongest roles, balance of overall role average), she observed
that some teams‘ observed performance was high even when only one criterion of team
balance was met. Thus, Senior concluded if the team had average role scores that were
balanced across members, then not all informal roles had to be naturally represented for a
team to be considered balanced.
In recognition of the team balance work of Senior (1997), Partington and Harris
(1999) conducted a study with 43 MBA graduate project teams, each consisting of
between six to eight individuals. The primary purpose of their study was to investigate
Page 122
111
111
the empirical link between team role balance and team performance. Similar to Senior
(1997), the researchers measured team member informal role preference using Belbin‘s
taxonomy. However, unlike Senior‘s study, they used the original Belbin Team Role
Self-Perception Inventory (BTRSPI; Belbin, 1981) measure. Further, Partington and
Harris provided team members with their BTRSPI scores and instructed them to formally
assign which team member would enact a particular role. Team members were permitted
to assign roles in any manner they pleased, and most groups did so in a way that they
thought would maximize their project team outputs.
Partington and Harris (1999) used an objective performance measure (i.e.,
maximum profits in a fixed-cost simulation) because they considered it to be more
generalizable to the performance outcome interests of real-world managers. In order to
assess the informal role balance of each team, they used three different team role balance
indices. The first index assumed that the aggregate informal role scores from all members
in a well-balanced team would be evenly spread across all eight informal roles. The
second assumed that, in a balanced team, at least one high or very high scoring individual
would perform each of the eight distinct informal roles. Finally, the third index assumed a
balanced team would only have a single individual scoring high or very high in each of
the eight informal roles. The correlations between the three team role balance index
scores and team performance were all non-significant. However, the authors also
explored the contribution made by the informal role representation (i.e., the number of
individuals scoring high to very high for each informal role) in relation to team
performance. That is, the exploratory hypotheses were not concerned with balance of
roles but, rather, on the impact that the representation of a particular role would have on
Page 123
112
112
team performance. To test these hypotheses, Partington and Harris analyzed informal role
configuration vectors that captured the number of people performing each role in a team.
For each role, they correlated the number of people per team performing the role with
team performance. Of these correlations, all but the Completer/Finisher role had at least a
small effect size (i.e., r > .15, r < -.15). In fact, the relationship between the Coordinator
role and team performance had a large negative effect size (r = -.48). This implies that
team performance tends to decrease as more and more team members adopt the
Coordinator role. Thus, this study provides evidence that some informal roles may have
main effects on team performance and, conversely, indices of team role balance may not
be the best predictors of team performance.
Building upon the work done by Senior (1997) and Partington and Harris (1999),
Blenkinsop and Maddison (2007) examined the team role balance to team performance
relationship using four different indices of team role balance and a sample of seven
British Ministry of Defense teams. Like Partington and Harris (1999), this study used
Belbin‘s original eight role taxonomy as opposed to the more recent nine role version.
For the first measurement method, Blenkinsop and Maddison drew on Belbin‘s (1981)
theory of well-balanced teams. Specifically, they argued for a team to be well-balanced,
each role must be represented by a person‘s first or second highest informal role score.
The second method of assessing team role balance used a modified version of the
methods used by Senior (1997). In this version, a team is considered balanced if all
individual informal role scores exceed the cutoff (i.e., 70 percent of the best possible
mean score) and the average informal role score falls within 20 percent of the 70 percent
cutoff value. With respect to the third index, the authors used Partington and Harris‘
Page 124
113
113
(1999) conceptualization of team role balance, which assumes that in a well-balanced
team the aggregate informal role scores from all members will be evenly spread across all
eight roles. Finally, the fourth index was also borrowed from Partington and Harris
(1999). There, the authors argued that, in a well-balanced team, at least one high or very
high scoring individual would perform each of the eight distinct informal roles. To
measure team performance, participants were first asked to identify characteristics that
differentiated teams based on level of performance. Team performance was measured
using the same scale anchors for all teams (i.e., very good performance, poor
performance, etc.); however, the performance standards for each scale anchor were
customized for each team based on the characteristics identified by participants. In terms
of results, Blenkinsop and Maddison (2007) did not find significant correlations between
any of the team role balance indices and team performance. The lack of significant
findings may have been due to inadequate power resulting from a very small sample size
(i.e., 7 teams), but in general, the lack of support for variations of team role balance
indices is consistent with the findings of Partington and Harris (1999).
Similar to the post-hoc analyses of Partington and Harris (1999), Chong (2007)
investigated the contribution each informal role makes toward the explanation of team
performance. He used a sample of 342 management students divided relatively evenly
into 33 teams. Using the nine-role BTRSPI (Belbin, 1993), the author collected measures
of informal role performance after teams had been randomly assembled 8 weeks prior.
Each individual‘s ―natural‖ (i.e., role scores of 70 and above) and ―secondary‖ (i.e., role
scores between 30 and 69) role scores from the BTRSPI were averaged across the team
for each role. Average role scores for a particular role exceeding the natural and
Page 125
114
114
secondary cutoff scores were counted toward the total number of represented roles and,
thus, teams were considered balanced if their role averages exceeded a score of 30 for
each role. The higher the number of represented roles, the more well-balanced a team was
considered. Given the nature of the management course design, Chong used an objective
measure of profits secured over the course of a class simulation. In order to ―facilitate
analysis by equalizing the effects of minor variations‖ (Chong, 2007; p. 207), the profit
scores for each team were categorized into four levels: (1) low, (2) low average, (3) high
average, and (4) high. Results indicated that the Planter (r = .37), Shaper (r = .42), and
Team Worker (r = .36) roles were significantly related to team performance rankings
suggesting that greater representation of those three roles within a team coincides with
greater team performance. In the context of Mumford and colleagues‘ (Mumford, 2002;
Mumford et al., 2006) integrated taxonomy the Planter, Shaper, and Team Worker
correspond to the Creator, Contractor, and Communicator, respectively. The Chong
(2007) study lends further support to the notion that certain informal roles may have main
effects on team effectiveness when represented in a team‘s informal role configuration
vector.
In another recent study, Van der Water, Ahaus, and Rozier (2008) assessed
informal role balance and its relation to various team performance measures with a
sample of 234 undergraduate MBA students randomly assembled into 39 groups. The
students were evaluated using Belbin‘s (1993) BTRSPI and OAS (i.e., observer checklist)
after a 4-week simulation game. To measure team role balance, the researchers used a
new index created by Ten Haaf, Bikker, and Adriaanse (2002). The Ten Haaf and
colleagues‘ index weights roles according to primary, secondary, and tertiary ―natural‖
Page 126
115
115
role performance classifications. To be considered a naturally performed role, the person
has to receive a score of at least 70 on the informal role measure. For individuals
performing more than one natural role, the highest natural role score is considered the
primary, the second highest is the secondary, and the third highest is the tertiary. If an
individual only naturally performs one role, then that role is considered the primary.
Weights are then applied to each classification level, where primary natural role
performance was rated as five times as important as tertiary role performance and
secondary roles were rated as three times as important as tertiary roles. For each team, the
weights are applied to the number of people per role classified as primary, secondary, and
tertiary with regard to their roles scores. In addition to the Ten Haaf et al. (2002) index of
team role balance, the researchers used the previously described team role balance
indices developed by Senior (1997) and Partington and Harris (1999).
With respect to team performance, the researchers defined it in terms of process
variables (e.g., communication, cohesion) and output variables (e.g., task performance)
that resulted from a management decision-making game simulation. Accordingly, they
measured performance in the following four ways: (1) simulated game report grade, (2)
performance index from the simulation, (3) effectiveness of internal communication, and
(4) effectiveness of external communication. The Ten Haaf et al. index of team role
balance and its relationship with the simulated game report grade (i.e., a graded
assignment in which the team wrote about the strategy, tactics, and learning experiences
of the simulation) yielded the study‘s only statistically significant finding (r = .28).
Senior‘s (1997) measure of team balance was not ultimately used because only 4 out of
39 teams would have been considered balanced using that method. The two Partington
Page 127
116
116
and Harris (1999) team balance measures were found to be non-significant for all four
performance measures. Thus, when comparing balanced teams versus unbalanced teams
in relation to all four constructs of team effectiveness, the researchers found that only the
Ten Haaf et al. index demonstrated significant differences between balanced and
unbalanced teams—and this was only for the simulated game report grade performance
measure. Therefore, the results offer limited support for the Ten Haaf et al. index.
Further, consistent with the findings of Partington and Harris (1999) and Blenkinsop and
Maddison (2007), other indices of team role balance did not significantly predict team
effectiveness.
Similar to Van de Water et al. (2008), Prichard and Stanton (1999) compared the
differences in performance between teams with balanced and unbalanced role
configurations. To do so, they followed Belbin‘s (1993) theory that eight roles could be
further generalized into four categories: (1) team leaders (i.e., Shaper, Coordinator), (2)
creative thinkers (i.e., Planter, Monitor Evaluator), (3) company workers (i.e,.
Implementer, Completer/Finisher), and (4) negotiators (i.e., Resource Investigator, Team
Worker). According to the theory, a team is considered balanced if someone represents a
role in each of the four categories. To test this, the researchers divided 48 volunteers from
a management recruitment assessment day into 12 teams consisting of four participants.
Six of the teams were classified as unbalanced and were made up of four individuals
scoring highly on the Shaper role. The reason being, Belbin proposed that a team full of
Shapers would be most unbalanced because Shapers tend to be outgoing and high-strung.
The remaining six teams were considered balanced because they were comprised of four
individuals holding a role in each of the four broad categories: (1) Coordinator, (2)
Page 128
117
117
Planter, (3) Completer/Finisher, and (4) Team Worker. In total, seven outcomes were
measured. The first dependent variable was each team‘s overall score on the ―Lost at
Sea‖ decision-making task where team scores were calculated as percentage of the
―expert‖ survivor‘s score (i.e., the percentage of the highest possible score). The
remaining six dependent variables (i.e., number of interactions, number of decisions
reached without consensus, number of planning proposals, number of information
summaries, number of builds on the ideas of others, number of ideas generated) were
measured by two independent observers who watched a videotaped recording of the team
interactions. Prichard and Stanton then used Mann-Whitney tests to determine if
significant performance differences existed between the balanced and unbalanced teams.
They found four of the seven comparisons involving the dependent measures to be
statistically significant: (1) scores on the ―Lost at Sea‖ decision-making task were
significantly higher for the balanced teams; (2) unbalanced teams composed entirely of
Shapers had significantly higher numbers of interpersonal interactions; (3) the all-Shaper
teams experienced significantly more failures to reach consensus than the balanced
teams; and (4) the number of planning proposals was significantly higher for the balanced
teams. Thus, when comparing a balanced four-person team to an unbalanced four-person
team of all Shapers, the balanced teams tended to score higher on more measures of team
effectiveness. However, this comparison was limited to balanced teams consisting of a
Coordinator, a Planter, a Completer/Finisher, and a Team Worker versus an unbalanced
team consisting of one specific role.
Higgs, Plewnia, and Ploch (2005) investigated the influence of team context on
the relationship between informal role configuration and team performance. Specifically,
Page 129
118
118
they designed a field study to investigate the impact of the team context variable of task
complexity. Their sample consisted of 270 employees working in 28 teams at an
automotive manufacturing organization. Each team was classified into one of five task
complexity categories depending upon the nature of work performed in their jobs. For
instance, all teams from the component engineering division were classified as having the
second most complex tasks. Trained raters then rated each category across four areas of
task complexity (i.e., application of processes, interaction of sub-tasks, typical type of
issues, typical type of outcomes) using a 5-point Likert-type scale. The ratings for each
task complexity area were first averaged for each team, and then the average team task
complexity ratings were averaged across all teams within a category. As a result, each
category of task complexity received a numerical rating of task complexity.
Higgs et al. (2005) used Belbin‘s (1981, 1993) theory of team role balance for
teams with fewer than eight members to operationalize informal role configuration. This
theory suggests grouping the eight roles into three behavioral focused categories (i.e.,
ideas, tasks, people) and two team environmental focused categories (i.e., internal,
external). Team performance, on the other hand, was operationalized using manager
ratings from a questionnaire consisting of six questions addressing different aspects of
team performance impressions (e.g., achievement of goals, customer satisfaction, crisis
management, etc.). Regression results indicated that low complexity teams tended to
perform worse when they had higher team role balance while the opposite was true for
high complexity teams. These findings suggest that teams with greater role diversity tend
to perform better on high complexity tasks than low complexity tasks. Thus, the
Page 130
119
119
complexity of the task could have important implications for the effectiveness of informal
role configurations.
Study Using Bales‘ Taxonomy
As evidenced by the previous section, several studies have analyzed the links
between informal roles, informal role configuration, and team effectiveness using
Belbin‘s (1981, 1993) role taxonomy. In contrast, the following section will review a
study that used Bales‘ (1950) taxonomy of informal roles as a means of investigating the
relationship between informal role configuration and team effectiveness. Stewart et al.
(2005) operationalized informal roles using Bales‘ task and social roles categories. In
their study, 220 executive MBA students were organized into 45 teams composed of
between four to six individuals who interacted for 8 months. To assess the informal roles
of each individual, team members completed the SYMLOG Adjective Rating Form
(Bales & Cohen, 1979), where each participant rated how frequently (i.e., ―never,‖
―rarely,‖ ―sometimes,‖ ―often,‖ ―always‖) certain descriptors reflected the behavior of
his/her fellow team members. The task and social roles dimensions were each calculated
by summing 18 behavioral descriptors.
Based on multi-level theory (Kozlowski & Klein, 2000), Stewart et al. (2005)
measured team-level informal role configuration via two forms of aggregation.
Specifically, they hypothesized that either the composition form or the compilation form
of emergence would predict how individual-level roles aggregate to the team-level and,
subsequently, influence team effectiveness. The composition form of emergence is
thought to take place when the characteristics of an emergent phenomena are more or less
Page 131
120
120
the same at both a lower-level and higher-level of analysis (Klein & Kozlowski, 2000).
For instance, Stewart and colleagues hypothesized that individual-level behaviors
associated with the social role category would be conceptually similar to the outcome
variable of team-level social cohesion; therefore, they predicted that a composition form
of emergence would explain the aggregation from the social role category behaviors to
team-level behavior that influence social cohesion. The researchers measured the
composition form of emergence by determining the summation of role-consistent
behaviors across all team members (i.e., role amplitude).
The compilation form of emergence, on the other hand, refers to the emergent
processes in which lower-level phenomena combine in a more complex manner to form a
higher-level phenomenon with qualitatively different characteristics than the sum or
average of the lower-level parts (Kozlowski & Klein, 2000). For example, Stewart et al.
(2005) hypothesized that task role category behaviors would be conceptually distinct
from team-level social cohesion; for this reason, they predicted that task role category
behaviors would aggregate to team-level social cohesion via the more complex form of
emergence called compilation. Further, the authors used two different methods to
measure the compilation form of aggregation. The first measure of compilation, role
dispersion, was calculated by determining the variance of rated role-consistency
behaviors across all team members. The second measure, role bloc, was calculated by
determining the skew of the distribution of individual informal role scores within a given
team. Team social cohesion and team performance served as outcome variables for the
study. Team social cohesion was assessed using a 10-item measure created by Rosenfeld
Page 132
121
121
and Gilbert (1989). Team performance was assessed by averaging the instructor
evaluation scores of two team projects.
The results of the Stewart et al. (2005) study suggest mixed support for the
authors‘ hypotheses. The predicted relationship between social role amplitude and team
social cohesion was significant (β = .65), indicating that for every one standard unit
increase in social role amplitude, team social cohesion increased by .65 standard units.
Similarly, the authors found support for the predicted relationship between task role
dispersion and team social cohesion (β = -.27) in that for every one standard unit increase
in task role dispersion, team cohesion tended to drop by -.27 standard units. In addition,
social role dispersion strongly influenced team performance (β = -.44); meaning, team
performance scores tended to decrease by .44 standard units for every one standard unit
increase in social role dispersion. Finally, the relationship between social role bloc and
team performance was significant (β = -.21), suggesting that for every one standard unit
increase in social role bloc, team performance tended to be reduced by .21 standard units.
As for Stewart et al.‘s (2005) other hypotheses, the predicted relationships
between task role amplitude and team performance as well as the relationship between
the skew of task roles and team task performance were all found to be statistically non-
significant. Overall, the results lend support to the notion that individual-level task and
social roles can be aggregated to form team-level constructs that predict different team
outcomes. Furthermore, evidence suggests that social roles aggregate to team-level social
cohesion measures via basic summation processes as well as via the within-team skew of
individual-level social roles. Moreover, it appears that performance increases as social
Page 133
122
122
roles are more and more consistent rather than if the overall level of role scores is low or
high.
Summary
Several studies have investigated the empirical link between informal roles,
informal role configuration, and team effectiveness. Of the studies reviewed, the vast
majority used Belbin‘s (1981, 1993) BTRSPI measure and/or OAS measure to calculate
informal role performance (i.e., Blenkinsop & Maddison, 2007; Chong, 2007; Higgs et
al., 2005; Partington & Harris, 1999; Prichard & Stanton, 1999; Senior, 1997; Van der
Water et al., 2008). Many of those same studies operationalized informal role
configuration using a vector approach called team role balance that captured the number
of people performing each role in a team. The relationship between variations of team
role balance and team effectiveness, however, received limited support. In contrast,
studies such as Chong (2007) and Partington and Harris (1999) found support that the
representation of certain roles may have main effects on team effectiveness. Through a
different approach, Stewart et al. (2005) operationalized informal role performance using
Bales‘ (1950) taxonomy and SYMLOG (Bales & Cohen, 1979) measure. Instead of using
informal role configuration vectors, Stewart and colleagues kept informal role scores as
continuous variables in order to calculate the skew, variance, and mean of teams‘
informal role scores. As such, they were primarily interested in testing the theory of
emergence and how it relates to role aggregation from the individual- to the team-levels.
Taken as a whole, evidence from the reviewed studies is suggestive of a relationship
between informal roles, informal role configuration, and team effectiveness. However, to
Page 134
123
123
date no study has used Mumford and colleague‘s (Mumford, 2002; Mumford et al., 2006)
integrated taxonomy to explore the relationship.
Personality
The term personality refers to an individual‘s characteristic patterns of thought,
emotion, and behavior (Funder, 2001). Theories of personality are primarily concerned
with the origins, antecedents, and outcomes of those characteristic patterns of thought,
emotion, and behavior. Furthermore, an underlying goal of personality theories is to
identify similarities and differences between individuals. In relation to the present study,
research findings have indicated that personality predicts individual-level performance
(Barrick, Mount, & Judge, 2001; Tett, Jackson, & Rothstein, 1991). Moreover, some
studies have explored the relationship between personality and informal role behaviors
(e.g., Blumberg, 2001; Stewart et al., 2005). In light of those findings, a secondary focus
of the present study will be to investigate further the link between personality and
informal roles (refer to Appendix C). In the remainder of this section, I will briefly
review theoretical approaches to personality as well as identify the best method of
conceptualizing the construct for the present study.
Theories of Personality
From the times of the ancient Greek physician Hippocrates to the present day, the
concept of personality continues to capture the attention of philosophers and
psychologists. Personality is seen as a fundamental tool for classifying, describing, and
differentiating people and, in general, there are at least seven major personality theory
Page 135
124
124
domains: (1) psychodynamic, (2) behaviorist, (3) biological, (4) humanistic, (5) social-
cognitive, (6) evolutionary, and (7) trait/type perspective. These seven domains vary to
the extent that the person (e.g., cognitive and affective processes) or the situation (e.g.,
external environment, stimulus) are viewed as the primary influence of a person‘s
personality (Funder, 2001). Theories heavily emphasizing the person perspective view
personality as a stable disposition, whereas theories slanted in favor of the situation view
personality as variable across contexts. Despite the different approaches, Funder (2001)
argues that the debate over personality as a stable phenomenon has been almost
completely resolved. He suggests that personality remains relatively stable across
situations and, as a result, should be conceptualized as a trait or type.
Definition
Researchers in the I/O psychology literature commonly define personality in
accordance with the trait/type perspective. Proponents of the trait/type perspective view
personality as relatively stable across situations and, thus, predictable (Funder & Colvin,
1991; Robins et al., 2001). Accordingly, in this approach, the traditional definition of
personality is further specified to include the component of cross-situational stability.
Therefore, from a trait/type perspective, personality refers to an individual‘s
characteristic patterns of thought, emotion, and behavior (Funder, 2001) that remain
relatively stable across situations and time (Funder & Colvin, 1991; Robins et al., 2001).
Personality traits and types are conceptually similar but fundamentally different.
Both represent external views of the person rather than fundamental characteristics;
meaning, traits and types refer to a person‘s outward manifestations of consistent
Page 136
125
125
behaviors. In terms of differences, a personality type is a qualitative, ―all-or-nothing‖
perspective while a personality trait is a quantitative, variable perspective (Funder, 2001).
Various type conceptualizations exist, and in general, each operates under the assumption
that personality types are dichotomous phenomena. As a result, an individual is
categorized as either having or not having a specific type. By operating under an all-or-
nothing assumption, personality type ignores the extent to which a person demonstrates
or does not demonstrate a particular type. That is, it ignores variations across the type.
Therefore, adhering to the type sub-perspective results in a loss of information regarding
a person‘s personality that, in turn, limits the extent to which one person may be
differentiated from another.
In contrast to a personality type, a personality trait varies along a continuum. As
such, no two individuals possess the exact same level of a particular trait. This implies
that every individual possesses a unique personality. Although two individuals may
possess similar amounts of a particular trait, they will not possess the exact same
amounts. Therefore, the trait perspective offers greater between-people discriminability
than the type perspective.
Different trait/type theories of personality exist in the I/O Psychology literature.
For instance, Carl Jung, an early pioneer of the type perspective, proposed that people
were either extraverted or introverted (Jung, 1971). Katherine Briggs and Isabel Meyers
further elaborated upon Jung‘s theory and developed the Myers-Briggs Type Indicator
(MBTI). They viewed personality types in relation to four dichotomous pairs: (1)
Extraversion/Introversion, (2) Sensing/Intuition, (3) Thinking/Feeling, and (4)
Judging/Perceiving (Myers, 1995). Leary (1957), on the other hand, developed what is
Page 137
126
126
known as Interpersonal Theory. He conceptualized personality traits in terms of dyadic
compatibility and proposed that the behavior of one individual either promotes or
suppresses the behavior of another individual.
More commonly, however, personality traits are described as a series or profile of
individual dimensions (Saucier & Goldberg, 2003). In fact, evidence suggests that using a
Five Factor Model (FFM) of personality to predict work behaviors and performance
yields higher validity coefficients than non-FFM approaches (Salgado, 2003). For that
reason, the FFM will serve as the theoretical basis of personality for the proposed study.
In the following paragraphs, I will describe how the FFM originated.
Lexical Approach
The FFM of personality is based upon the lexical approach. In every language,
there are many terms used to describe a person‘s thoughts, emotions, and behaviors (e.g.,
happy, angry, sad). The lexical approach suggests that the number of terms relating to a
particular concept is an indicator of its importance (Saucier & Goldberg, 2003).
Therefore, the purpose of this approach is to identify the underlying similarities between
those terms with similar meanings by reducing thousands of terms to conceptually similar
groupings called factors. Allport and Odbert‘s (1936) early work served as a stepping
stone toward the FFM. They catalogued nearly 18,000 thousand terms found in the
dictionary that referenced thoughts, emotions, and behaviors. Their intention was to
identify a few basic dimensions that could be used to describe an individual‘s personality.
From Allport and Odbert‘s (1936) extensive list of terms, Cattell (1945)
condensed the list into a more manageable form. Using factor analysis, he reduced the list
Page 138
127
127
of nearly 18,000 terms down to 35 underlying dimensions, where each dimension
represented a series of core traits. In a later study, Norman (1993) used factor analysis to
further reduce the 35 dimensions to five. Although other research before him yielded
results consistent with a FFM (e.g., Fiske, 1949; Tupes & Christal, 1961), Norman‘s five
factor labels (i.e., the ―Big Five‖) are used extensively today as a common reference to
the five dimensions—albeit with a few small changes. His factor labels are as follows: (1)
Extraversion/Surgency, (2) Agreeableness, (3) Conscientiousness, (4) Emotional
Stability, and (5) Culture. Although there is not unanimity on these labels, the
Extraversion/Surgency factor is, today, known simply as Extraversion while the Culture
factor is sometimes referred to as Openness to Experience or Intellect. Subsequent
researchers (Digman, 1990; McCrae & Costa, 1985, 1987) have used similar factor
analytic techniques that support the Big Five dimensions presented by Norman (1963).
Despite the similarities in factor structures within the English language, it is
important to note that the lexical approach to personality does not necessarily yield
universal dimensions across cultures and languages. For instance, studies of northern
European languages such as English, German, and Dutch have resulted in Big Five
dimensions that are structurally similar but not completely identical (Hoftsee, Kiers, de
Raad, Goldberg, & Ostentendorf, 1997). Other results indicate more pronounced
structural differences between studies of the Greek (Georgiades, Tsaousis, & Goldberg;
2005) and Filipino (Church, Reyes, Katigbak, & Grimm, 1997) languages. Thus, special
care must be taken when generalizing the factor structures that result from a lexical
approach.
Page 139
128
128
For the most part, the Big Five dimensions are assumed to be relatively
independent (McCrae & Costa, 1985). That is, the extent to which a person possesses one
dimension should not typically influence the extent to which the same person possesses
another. Furthermore, each of the five dimensions represents a number of core
characteristics (Barrick & Mount, 1991; Digman, 1990; McCrae & Costa, 1985, 1987).
The first dimension, Agreeableness, refers to an individual‘s behavioral tendency to be
compassionate and cooperative, and core characteristics include being cooperative,
likeable, friendly, and good-natured. A person high in Conscientiousness tends to act
respectfully and dutifully in a planned and courteous manner and, as a result, may be
described as achievement oriented, responsible, and organized. Extraversion, on the other
hand, refers to a person‘s tendency to seek interaction and stimulation from others. Core
characteristics of an extraverted person include: sociability, assertiveness, talkativeness,
and ambitiousness. Emotional Stability is defined as a person‘s tendency to feel
emotionally calm and secure. However, Emotional Stability is often described by its
negative pole called Emotional Instability or Neuroticism. An emotionally instable person
tends to experience relatively frequent fluctuations in emotion. Core characteristics of
Emotional Instability include feelings of anger, depression, anxiety, and vulnerability.
Finally, Openness to Experience is a bit more difficult to define but typically refers to an
individual‘s appreciation of new and diverse ideas, environments, situations, and people.
As such, Openness to Experience includes core characteristics like being curious,
imaginative, broad-minded, and intelligent. Together, these five dimensions make up
what is commonly referred to as the Big Five. In the following section, I will review
Page 140
129
129
studies that have investigated the empirical link between the Big Five dimensions of
personality and informal roles.
Link Between Personality and Informal Roles
The secondary purpose of the current study is to investigate the link between
personality and informal roles (see Appendix C). Recall that informal roles refer to an
individual‘s situation-specific patterns of similar behaviors that emerge during team
interaction (Forsyth, 1998; Mumford et al., 2008; Stewart et al., 2005). Past research has
shown that personality predicts individual behavior and performance (e.g., Barrick et al.,
2001; Tett, et al., 1991). As such, the extent to which an individual possesses a given
personality dimension may influence which informal roles he or she adopts. In the
following paragraphs, I will review three studies that have investigated the relationship
between the Big Five dimensions of personality and the adoption of informal roles.
In order to better understand the relationship between personality and team
interactions, Blumberg (2001) calculated the correlations between the Big Five, Big
Seven, and Bales‘ (1950, 1979) social and task role categories using a sample of 207
undergraduates. To measure personality, Blumberg used both the Big Five and the Big
Seven (i.e., the Big Five plus the dimensions of Positive Valence and Negative Valence).
He measured informal roles by instructing participants to complete the self-report
measure called SYMLOG Expect (Bales & Cohen, 1979), which directs participants to
indicate how they believe others would rate them along 12 of the behavioral dimensions.
The 12 ratings are then summed along the task role and the social role categories. The
resulting scores indicate the extent to which each individual performed behavior related
Page 141
130
130
to the two role categories. As described in the Informal Roles section, role categories are
the broad overarching categories that encompass informal roles. As the labels imply, the
task role category includes those informal role behaviors that pertain directly to the
team‘s task. The social role category includes those informal role behaviors that
indirectly contribute to task-related behaviors by facilitating the social and emotional
environment of the team.
In Blumberg‘s (2001) results, the task role category correlated significantly with
Agreeableness (r = .23) and Conscientiousness (r = .41). The social category role, on the
other hand, correlated significantly with Agreeableness (r = .45), Conscientiousness (r =
.24), Extraversion (r = .26), and Neuroticism (r = -.42). The additional Big Seven
dimensions of Positive Valence and Negative Valence did not correlate significantly with
either the task role category or the social role category. With respect to the significant
findings, it is possible that the correlation effect sizes are inflated because the study did
not require participants to reference a specific team setting when completing the informal
role measure. Consequently, the measure may have assessed stable behavioral tendencies
that are more consistent with the definition of personality when attempting to measure
informal role performance. As a result, the measured correlations were likely higher than
if the correlation between a stable construct and a situation-dependent construct had been
measured. Thus, the study illustrates the importance of providing a specific team context
when measuring informal roles.
As described previously, Stewart et al. (2005) provided support for the theory that
informal roles serve as linking mechanisms between individual traits and team outcomes.
Recall that in their team-level hypotheses, they assessed the relationship between
Page 142
131
131
informal role configuration and team effectiveness. However, in addition to the team-
level hypotheses, they predicted an individual‘s personality dimensions would correlate
significantly with the informal roles he or she adopted. To review, the study participants
were 220 executive MBA students organized in 45 teams, where each team consisted of
4-6 individuals working together throughout an 8-month period. The researchers used the
NEO-FFI (Costa & McCrae, 1992) self-report measure described previously to measure
personality and the SYMLOG Adjective Rating Form (Bales & Cohen, 1979) to measure
informal role performance. This measure differs from the SYMLOG Expect measure
used in the Blumberg (2001) study. Instead of asking participants to anticipate how others
would rate them, the SYMLOG Adjective Rating Form instructs participants to rate other
team members.
In terms of results, Stewart et al.‘s (2005) predictions received mix support.
Agreeableness and the social role category were found to be significantly correlated (r =
.25), suggesting Agreeableness was moderately related to performing the social role
category. The relationship between Conscientiousness and the task role category was also
significant (r = .25), suggesting there is a positive moderate relationship between a
person‘s level of Conscientiousness and the extent to which he or she performs the
behaviors associated with the task role category. Furthermore, the relationship between
Neuroticism (i.e., the negative pole of Emotional Stability) and the task role category (r =
-.15) was found to be significant as well, albeit small. This means that an emotionally
instable person will tend not to perform behaviors in the task role category. Finally, the
correlation between Openness to Experience and the task category role received mixed
support in that the zero-order correlation was significant (r = -.16), but the beta-
Page 143
132
132
coefficient was not significant in a regression analysis controlling for the effects of the
other personality variables.
During their post-hoc analyses, Stewart et al. (2005) noted two significant
unhypothesized correlations. First, Openness to Experience was slightly related to the
social role category (β = -.15), which indicates that for every one standard unit increase
on the Openness to Experience dimension, scores on the social role category tend to
decrease .15 standard units. Second, the relationship between Extraversion and the task
role category yielded a small, negative effect (r = -.13), suggesting that people with low
levels of Extraversion are more likely to perform behaviors in the task role category than
people with high levels of Extraversion.
In summary, the results of Stewart et al.‘s (2005) study provided some support for
their a priori hypotheses. The relationships between Agreeableness and the social role
category and Conscientiousness and the task role category yielded the largest effect sizes
of the hypothesized relationships (i.e., r = .25 for both). To a lesser extent, Extraversion
is related to the task role category. Finally, the hypothesized relationship between
Openness to Experience and the task role category receive mixed support. Appendix E
presents the correlations between each of the five personality dimensions and the two role
categories.
In contrast to Stewart et al. (2005), Mumford et al. (2008) did not directly
hypothesize that personality influences the adoption of informal roles. Nevertheless, they
presented correlations between the Big Five and task, social, and boundary-spanning role
categories (see Appendix F). Their data are based upon a sample of academic project
teams of 4-5 members drawn from 93 undergraduate students. The authors used the IPIP
Page 144
133
133
(Goldberg, 1999b) 50-item equivalent of the NEO-FFI (Costa & McCrae, 1992) as a
measure of the Big Five personality dimensions. As for informal role performance, they
used their own Team Role Performance (TRP) test (Mumford, 2002; Mumford et al.,
2006; Mumford et al., 2008). Two of the correlations were found to be significant.
Agreeableness was moderately related to performing behaviors associated with the social
role category (r = .32), indicating that people high on the Agreeableness dimension tend
to perform roles that facilitate a team‘s socioemotional environment. Also, Emotional
Stability was found to be moderately and negatively related to a person‘s performance on
behaviors of the task role category (r = -.21). This negative relationship suggests that
emotionally stable people tend not to adopt roles that contribute directly to a team‘s task
performance.
In summary, I reviewed three studies that investigated the relationship between
the Big Five personality dimensions and informal roles (Blumberg, 2001; Stewart et al.,
2005; Mumford et al., 2008). In general, the studies lent further support to the theory that
informal roles serve as a linking mechanism between individual traits and team outcomes
(Katz & Kahn, 1978; Stewart et al., 2005). Specifically, these three studies investigated
the individual-level relationship between personality and informal roles. Results indicated
that some personality dimensions tend to predict behaviors consistent with either the task
role or social role categories. With that said, the studies have their limitations and, as a
result, special attention should be paid to elements of construct operationalization and
methodological design. For example, Blumberg (2001) operationalized informal roles in
a way that is not consistent with the present study (i.e., he did not measure informal roles
for a specific team context). Thus, the inferences drawn from that study would not be
Page 145
134
134
valid in the context of the present study. The other two studies defined and
operationalized informal roles in a manner consistent with the present study, but both
used role categories (i.e., task, social) instead of specific informal roles. Because of this,
only general inferences can be drawn about the relationship between specific informal
roles and personality.
To pull together the overall findings across the Stewart et al. (2005) and Mumford
et al. (2008) studies, I conducted a bare-bones meta-analysis (i.e., summed weighted
effect size based on sample size). Three of the meta-analyzed effect sizes exceeded the
threshold of a small effect (i.e., r > .15, r < -.15). Across the two studies, there was a
positive, moderate effect between Agreeableness and the social role category (r = .28).
Small to moderate effects were found between Conscientiousness and the task role
category (r = .21) as well as between Emotional Stability and the task role category (r = -
.17). The results of the bare-bones meta-analysis have important implications for the
present study‘s hypotheses. Using these results as a guide, hypotheses developed for this
study will investigate the relationship between specific Big Five personality dimensions
and specific informal roles from the Mumford role taxonomy (Mumford, 2002; Mumford
et al., 2006).
Present Study
As described previously, the conceptual framework for the proposed study
involves two levels of analysis: the individual- and the team-level (refer to Appendix A).
The primary focus of this study is the team-level relationship between informal role
configuration and team effectiveness (refer to Appendix B), and the secondary focus is
Page 146
135
135
the individual-level relationships between personality and informal roles (refer to
Appendix C). In the following section, I will describe my predictions for both sets of
hypotheses.
Team-Level Hypotheses
In general, I hypothesize that differences in informal role configuration will
influence team effectiveness. That is, informal role configuration is hypothesized to
affect team processes (e.g., norms, communication, coordination, decision-making,
cohesion) that, in turn, affect team task performance. Therefore, the team-level
hypotheses refer to the relationship between informal role configuration and team
effectiveness. Furthermore, the hypotheses are grouped into four categories: (1) linear
relationships, (2) curvilinear relationships, (3) monotonic relationships, and (4)
interactions. The first three categories of hypotheses represent main effects whereas the
fourth represents interaction effects.
Linear
The following hypothesis category represents a traditional bivariate linear
relationship. It suggests that some informal roles may be additive and will, thus, provide
value to the team regardless of what other roles are performed. For a role to be
considered additive, people performing the role must directly influence successful task
completion. Further, the behaviors in such roles are additive in that each additional
person performing the role will provide incremental value to the team in terms of
Page 147
136
136
effectiveness. Therefore, I predict that team effectiveness will improve as more team
members adopt these role roles.
Those performing the Completer role take personal responsibility for completing
different aspects of the task and following through with those commitments.
Furthermore, once critical task information is shared, the Completer may work
independently toward fulfilling commitments. Consequently, as more team members
adopt the Completer role, their individual outputs should contribute directly toward
successful task completion. As such, I predict:
Hypothesis 1a: The number of Completers on a team will be positively related to
team effectiveness.
Contractors coordinate and organize team task activities in order to complete the
task on time, in the right order, and in an efficient manner. Thus, Contractors provide
useful structure to the team that aids in task completion. Teams with more people
performing such behaviors should perform better than teams with few to no people
performing them because people performing this role direct team activities toward
successful task completion. The underlying logic for this hypothesis is as follows: team
activity needs direction and focus (Swezey & Salas, 1992). Furthermore, Partington and
Harris (1999) used Belbin‘s (1981, 1993) role taxonomy to predict team effectiveness
and found a strong linear relationship between the number of Coordinators and the
outcome variable (r = .48). In another study, Chong (2007) found a moderate-strong
relationship between Belbin‘s Shaper role and team effectiveness (r = .42). When
integrating the various role taxonomies, Mumford and colleagues (2002, 2006) classified
Belbin‘s Coordinator and Shaper roles in the same conceptual category as what they later
Page 148
137
137
labeled the Contractor role. Therefore, given these previous findings and the underlying
logic, I predict:
Hypothesis1b: The number of Contractors on a team will be positively related to
team effectiveness.
Creators consider the ―big picture‖ and develop creative solutions to problems
and creative approaches to successful task completion. As such, Creators offer unique
decision-making alternatives and, thus, contribute to team effectiveness. Considering the
nature of the role, I predict that increasing numbers of decision alternatives and creative
approaches to problems will increase a team‘s capability to successfully complete a task.
In support of this prediction, Chong (2007) found the relationship between Belbin‘s
(1980, 1993) Planter role and team effectiveness to be moderately strong (r = .37). In
Mumford and colleague‘s (2002, 2006) integrated taxonomy, the behavior clusters
associated with the Planter were labeled as the Creator. For the aforementioned reasons, I
predict:
Hypothesis 1c: The number of Creators on a team will be positively related to
team effectiveness.
Curvilinear
The following hypothesis category represents curvilinear relationships between
informal role configuration and team effectiveness. The name of this category signifies
that an optimal amount of a specific role will result in the greatest team effectiveness.
Moreover, if such roles are underrepresented or overrepresented team effectiveness will
decline. Like the linear relationship hypothesis category, roles must meet two criteria to
Page 149
138
138
be included in this set of hypotheses. The first criterion is the same as the linear
relationship category in that the role must directly contribute to successful task
completion. To meet the second criterion, however, the role must at some level include
behaviors that ultimately diminish effectiveness. That is, the behaviors performed by
someone in the role will, in larger amounts, overwhelm the team or become the source of
conflict.
To some extent, Critics serve as ―Devil‘s Advocates‖ which means that they
openly critique potential problems. Specifically, Critics honestly discuss the pros and
cons of proposed decisions and, thus, guard against unquestioned consensus during team
decision-making as they prod the team to evaluate decisions. Teams with too many
Critics will address decision-making problems without providing alternatives. Therefore,
I predict that too many Critics will overwhelm a team with critiques without contributing
to alternative approaches to task completion. With that said, teams without a Critic will
not benefit from the positive aspects of behaviors associated with evaluation and critique.
For these reasons, I predict:
Hypothesis 2: Informal role configurations with one Critic will result in greater
team effectiveness when compared to teams with less than one or more than one Critic.
Monotonic
This hypothesis category consists of monotonic predictions. For some roles, I
hypothesize that teams will receive the same benefit with one team member performing
the role as they would with multiple team members performing the role. That is, the mere
presence of a role should result in greater team effectiveness compared to teams with no
Page 150
139
139
one adopting the role. I predict roles with a monotonic influence on team effectiveness
will be indirect contributors to task completion in that they should facilitate the social and
emotional environment of the team (i.e., social role category behaviors). Accordingly,
only a minimum threshold of social and emotional support should be needed to
encourage effective information sharing. As long as team members act civil to each other,
the team should be able to work toward successful task completion. Thus, to achieve
greater team effectiveness, I predict only one person will be needed to encourage a
positive social environment; however, more team members filling such roles will neither
diminish team effectiveness nor an incrementally increase it.
Calibrators reduce or eliminate team conflict by suggesting positive ways to
interact (e.g., taking turns, showing respect, being open to new ideas) and intervening
when there are social interaction difficulties. Therefore, in terms of effectiveness, teams
should be better when at least one Calibrator is represented. However, team effectiveness
should not linearly improve as more team members adopt the role; rather, the slope of the
relationship should plateau to zero once one Calibrator is present. The logic being, only a
threshold of cohesion and civility should be needed for a team to effectively share task-
related information and collaborate. Thus, only one person is needed to recommend ways
to interact more effectively.
Hypothesis 3a: Teams with at least one Calibrator will have greater team
effectiveness than teams without a Calibrator; however, team effectiveness will not
significantly improve when more than one Calibrators are represented.
Page 151
140
140
Communicators contribute to a pleasant work environment where communication
is encouraged and personal feelings and thoughts are respected. As such, teams with
Communicators represented should contribute to greater cohesion, which should allow
team members to work together more efficiently and effectively toward successful task
completion. Like teams with at least one Calibrator, teams with at least one
Communicator should perform better than teams without a Communicator. However, the
each additional Communicator should not increase or decrease team task performance.
The logic behind this hypothesis follows that of Hypothesis 3(a) in that only a threshold
of social cohesion and civility should be necessary for effective information sharing and
collaboration.
Hypothesis 3b: Teams with at least one Communicator will have greater team
effectiveness than teams without a Communicator; however, team effectiveness will not
significantly improve when more than one Communicators are represented.
Interaction
The final category of hypotheses refers to informal role configurations in which
the presence of two particular roles has an interaction effect. In other words, the
relationship between informal role configuration and team effectiveness should contain a
multiplicative effect when both roles are represented. As stated previously, I predict that
the relationship between the number of Critics and team effectiveness will be curvilinear.
However, I hypothesize that the curvilinear relationship will not hold true when greater
numbers of Creators are represented in a team‘s informal role configuration. As more
Page 152
141
141
Creators provide more unique decision alternatives, an increasing number of Critics will
be needed to evaluate those alternatives. Therefore, I predict:
Hypothesis 4: The number of Creators and Critics on a team will interact such that
the relationship with team effectiveness will increase linearly for each additional Creator
and Critic represented in a team.
Individual-Level Hypotheses
These hypotheses refer to the individual-level links between personality and
informal roles (see Appendix G for a visual representation of the hypothesized
relationships). As such, I hypothesize that the dispositional nature of the Big Five
personality dimensions will influence the adoption of situation-dependent informal roles
within a team. With regard to the following hypotheses, I predict specific dimensions of
the ―Big Five‖ will be related to the adoption of specific informal roles.
In general, Conscientiousness individuals tend to act respectfully and dutifully in
a planned and courteous manner. Because of this, individuals higher in Conscientiousness
should be more likely to perform the planning behaviors associated with the Contractor
role (e.g., organizing and coordinating team task activities) when compared to individuals
with lower levels of Conscientiousness. Furthermore, courteousness, a characteristic of
Conscientiousness, appears to be conceptually related to the behavior patterns of the
Completer role (e.g., following through on commitments, taking responsibility for task
completion). Therefore, I hypothesize that a person‘s level of Conscientiousness will
influence the likelihood that he or she performs the Completer role.
Page 153
142
142
Hypothesis 5a: One‘s level of Conscientiousness will be positively related to the
adoption of the Contractor role.
Hypothesis 5b: One‘s level of Conscientiousness will be positively related to the
adoption of the Completer role.
People high in Extraversion tend to seek interaction with others and, as a result,
will be more likely to speak out to other team members to make their position known.
Similarly, those performing the Contributor role speak out to make their task-relevant
knowledge or expertise known to the team, while those performing the Critic role speak
out to critique and evaluate team decisions. Conversely, people low in Extraversion
should be reluctant to speak out even if they have the requisite knowledge or have a
useful critique. Therefore, I predict that a person‘s level of Extraversion will influence
the likelihood that he or she performs the Contributor and Critic roles.
Hypothesis 5c: The level of Extraversion will be positively related to the adoption
of the Contributor role.
Hypothesis 5d: The level of Extraversion will be positively related to the adoption
of the Critic role.
As the name implies, individuals high in Openness to Experience are open to a
variety of experiences (e.g., situations, people, environments, ideas). In a similar fashion,
team members performing the Creator role should be open to new experiences because
they offer new ideas and solutions to the team. Furthermore, the creative ideas and
solutions offered by the Creator suggest evidence of intellect, which is another
characteristic of Openness to Experience. The Calibrator role, on the other hand, reduces
team conflict by proposing positive interventions such as encouraging openness to the
Page 154
143
143
ideas of others. For these reasons, I predict that a person‘s level of Openness to
Experience will influence the likelihood that he or she adopts the Creator and Calibrator
roles.
Hypothesis 5e: The level of Openness to Experience will be positively related to
the adoption of the Creator Role.
Hypothesis 5f: The level of Openness to Experience will be positively related to
the adoption of the Calibrator role.
Emotionally instable (i.e., the negative pole of Emotional Stability) individuals
tend to exhibit behaviors such as anger, depression, anxiety, and vulnerability. As a
result, team members with lower levels of Emotional Stability should be less likely to
perform the Communicator role, and team members with higher levels should be more
likely to perform the role. That is, it is likely be difficult to perform the behaviors
necessary to facilitate a positive social and emotional environment when a person has a
tendency to experience negative emotions. Thus, a person‘s level of Emotional Stability
should influence the likelihood that he or she performs the Communicator role.
Hypothesis 5g: The level of Emotional Stability will be positively related to the
adoption of the Communicator role.
People high in Agreeableness tend to perform behaviors that are compassionate
and cooperative in nature. Likewise, people performing the Communicator and Calibrator
roles tend to demonstrate compassionate and cooperative behaviors as they encourage a
positive socioemotional environment with the team. For these reasons, I hypothesize that
team members‘ level of Agreeableness will positively influence the probability that they
adopt the Communicator and Calibrator roles.
Page 155
144
144
Hypothesis 5h: The level of Agreeableness will be positively related to the
adoption of the Communicator role.
Hypothesis 5i: The level of Agreeableness will be positively related to the
adoption of the Calibrator role.
Page 156
145
145
Appendix B: Task Materials
GENERAL MEMO
To: Vice-President, Script Evaluation
Vice-President, Industry Research
Vice-President, Talent Appraisal
Vice-President, Marketing
From: Stan Friedman, CEO
RE: Choosing films for production next year
Thanks for agreeing to meet on such short notice. As usual, the task in front of you is one
of picking the movies that we will produce and release in the upcoming year. The fiscal
solvency of our studio is riding on the decisions you make. Pick the best movies and we
(as well as our stockholders) will be swimming in profit; pick the wrong ones and we
may go belly up.
As you all know, profit from the movies we make is determined by taking the revenue
earned by each film and subtracting its cost:
Movie Profit = Movie Revenue – Movie Cost
Movie cost is estimated by adding the production cost (which is fixed) to the marketing
cost (which is under our control):
Movie Cost = Production Cost + Marketing Cost
Movie revenue is estimated by multiplying the number of viewers by the average ticket
price for a particular film:
Movie Revenue = # of Viewers * Average Ticket Price
As you are well aware, the number of viewers for any given film depends on five main
factors: (1) Viewer Appeal, (2) Movie Quality, (3) Marketing, (4) MPAA rating, and
(5) Average Ticket Price. Viewer Appeal is basically a function of popular interest in the
film‘s content (i.e., setting, plot, special effects), as well as the popularity of the talent
involved (i.e., director and actors/actresses). Movie quality is a function of the script
quality, director‘s skill, and actor/actress‘ skill. All of these things interact with one
another, and each one is important. If a movie has a good script and good actors/actresses
but a terrible director, the movie will not be very good. Similarly, if a movie has a good
director and good stars but a poor script, it will also be bad. It probably goes without
Page 157
146
146
saying that a movie that is poor in all three categories will just plain stink. Marketing
obviously increases public awareness of our movie, and the MPAA rating constrains the
size of our audience base. The average ticket price reflects the age of the average viewer
and, to a certain extent, the time of day that the typical viewer goes to see the movie.
Movies with the highest average ticket prices draw mostly adults who go to see the movie
in the evening; movies with lower average ticket prices attract younger viewers and
people who go when matinees prices are in effect. The point here is that all five factors
must be considered when estimating how much revenue a film will bring in..
Our spending allowance for this year is $150 million. It‘s hard to tell from a brief
summary how much a film is going to cost because it depends on many factors, including
star salaries, shooting location and duration, and special effects. However, our screenplay
reviewers are pretty good and the estimates they provide should be very close.
I would like you to examine the information at your disposal and figure out how to spend
our $150 million to maximize total profit for the year. As usual, I don‘t care if you spend
the $150 million on one blockbuster or divvy it up over 10 little art-house projects – just
figure out the ones that will bring in the most profit. While a film‘s total revenue is
important, keep in mind that it‘s return on investment that is critical. In other words, the
most important value to estimate is a potential film’s profit divided by its cost (i.e.,
profit/cost, or profit ratio). Profit ratio reflects the number of dollars of profit we get for
every dollar we spend. A good film will end up making about twice as much as it cost
(including marketing), and a great film may end up making three to four times as much.
And don‘t bother trying to save any money – it‘s there to be spent, so use as much as you
can.
I know that picking movies isn‘t an easy task, but do the best you can. Your staffs have
provided you with a good deal of useful information, and I think our screening team has
identified a good set of potential choices for you. Feel free to use your personal
experiences and gut feelings, but let the hard numbers provided by our research team
have the final say. I look forward to seeing your recommendations on my desk next
week. Good luck!
Page 158
147
147
MEMO
To: Vice-President, Industry Research
From: Industry Research Staff
RE: Viewer Appeal ratings
Here is the market research that you requested on potential movies for next year. We
pulled together 10 focus groups as usual to get this data. Each focus group was led by
someone on our staff and involved a roundtable discussion of the movie‘s premise and
cast, plus formal ratings of content and star appeal by each member of the focus group.
We gave the focus groups the same movie capsules that your committee is using to make
your decisions. See Table 1 for a summary of the findings from the focus group research.
Table 1 contains two separate estimates of a film‘s appeal based on its content and stars.
We asked people in the focus group to discuss (and rate) Content Appeal and Star Appeal
separately. Content Appeal concerns a movie‘s premise, plot, character development,
and special effects; the film‘s genre and emergent themes play a role as well. Star
Appeal has to do with the popularity of the actors/actresses as well as the director.
Industry research suggests that content is roughly twice as important as stars in
determining who goes to see a movie, so we scaled Content Appeal values from 0-200,
and Star Appeal values from 0-100. Basically, a Content Appeal score of 200 means that
the movie should have a very broad demographic appeal and the focus group participants
were dying to see the screenplay get turned into a movie. In contrast, a Content Appeal
score of 0 means that no one was interested in seeing the movie get made based solely on
its subject matter. A Star Appeal score of 100 means that basically every role in the film
has A-List stars that people want to see; a score of 0 means that the cast is essentially
unknown to the audience. Star Appeal is based on physical attractiveness, charisma, and
the success of recent films and has little to do with talent – it only reflects ―popular
demand.‖
Films with unusual situations and big-name stars tend to have more appeal to viewers. In
particular, action/adventure, war, science-fiction, and suspense films tend to interest
people more than dramas or comedies. Animated films almost always do well with
families and often become blockbusters – they have a built-in audience if based on a
book or story familiar to the audience. Horror movies do well with males (especially
younger ones) and some pull in women as well. Comedies do well if the situation is right
and the casting is good. Dramas are the most variable; they tend to draw discriminating
viewers from all groups, but usually have much lower content appeal because their
situations are more ordinary. More importantly, movies with lots of special effects are
very attractive regardless of their genre – in part because of extensive repeat viewing.
Page 159
148
148
To summarize, the Content Appeal and Star Appeal values quantify the appeal of a film
based on its subject matter and cast, respectively. A good overall index of the “buzz”
surrounding a potential movie is to add up its Content Appeal and Star Appeal.
Table B.1 Year 1 Focus Group Research on Viewer Appeal of Potential Movies.
Movie Title Content
Appeal
Star
Appeal
Staff
Comments
Rikki-Tikki-Tavi
200.00
75.00
Families will eat this stuff up; the famous
mongoose is loved by all. Focus groups
liked the voices.
Light Years
185.00
30.00
Offbeat science fiction story from an A-
list director. Story is intriguing, and will
have great special effects.
Chosin Reservoir
150.00
50.00
Older viewers were intrigued by the
history; younger viewers liked the
realistic battle scenes.
Degeneration
130.00
55.00
Everyone loves a good zombie pic.
Should provide nice mix of humor and
special effects.
Renegade
130.00
80.00
A modern update of Invasion of the Body
Snatchers. The huge
X-Files fan base will love it, especially
with Jessica Alba.
Rio
110.00
45.00
Mystery involving sex, murder,
corruption – and the President. Should
appeal to older viewers.
Sex Ed
80.00
40.00
Sex in the schools is a perfect target, and
focus groups responded well. No
headliners, but good cast.
Southern Accents
75.00
30.00
Gritty realism – story appealed more to
women, but men really liked Eliza
Dushku.
Fast Food
70.00
70.00
Spoof of typical fast food joint scored
about average on content; perfect casting
in this one.
A Lifetime of
Anger
65.00
45.00
A biting tragedy; this may be the tear-
jerker of the year. No major female roles
hurts appeal some.
On Campus
50.00
0.00
Documentary-style exploration of college
life. Viewer appeal will be somewhat
limited to older teens and young adults.
Page 160
149
149
Table B.2 Year 2 Focus Group Research on Viewer Appeal of Potential Movies.
Movie Title
Content
Appeal
Star
Appeal Staff Comments
The Reactor
190.00
95.00
This looks like a can‘t-miss summer
blockbuster – great special effects and
all-star cast.
We, The People
180.00
80.00
The war on terrorism takes an
Orwellian turn after a U.S. city is
nuked. Popular cast and knock-out
special effects. Very timely.
Oil & Water
170.00
70.00
There is a huge market out there for
this kind of film. A 21st century take on
The Parent Trap.
Air Cav
160.00
55.00
Sort of Black Hawk Down set in
Vietnam – above average cast; very
realistic.
Welcome to My Room
150.00
50.00
Spoof of suburbia and documentaries
seen through the eyes of a kid. Nice
supporting cast.
Line of Duty
140.00
100.00
An action flick with a twist – focus
groups were drooling over the cast.
Extrapolation
115.00
35.00
Hot topic due to popularity of ―Diablo‖
computer game. Should bring out the
teens.
The Devil Made Me
Do It
115.00
25.00
Chilling mystery that had focus groups
intrigued;
no-name cast, though.
The Wolf's Lair
100.00
65.00
Interesting mix of war, suspense and
character study with solid casting, but
some viewers will know the outcome.
Hoover
95.00
85.00
Most people don‘t know who J. Edgar
Hoover is, but an outstanding cast.
A Good Day to Die
60.00
85.00
Sounds like a real downer, but Ang
Lee, Tom Hanks, and Jennifer
Connelly will bring in a lot of viewers.
Page 161
150
150
MEMO
To: Vice-President of Script Evaluation
From: Script Evaluation Staff
RE: Script Quality ratings for potential movies
Here is the information you requested regarding the movie screenplays that were sent to
us for evaluation. We generated quality ratings by having two of our most experienced
readers go through each screenplay and assign a rating on a scale of 1 to 10, then we
averaged the ratings.
When we made our ratings, as always, we paid attention to the quality of the dialogue,
plot coherence, pacing, and factors appropriate to each type of movie. For example, for
dramas we considered character development and plot twists, whereas for science fiction
films we looked for a unique vision of the future and a realistic extrapolation from
current society. In other words, we took into account that what makes one kind of movie
good is not necessarily the same thing that makes another kind of movie good.
We don‘t have to tell you that Script Quality is very important to the success of a movie –
everything is riding on it. We can have all the big-name stars we want but if the script is
terrible, it‘s not going to make back the money needed to pay all those stars! Make sure
the other execs realize this.
Table B.3 Year 1 Script Quality Ratings and Expected MPAA Ratings for Potential
Movies.
Movie Title Script Quality
Expected MPAA
Rating
Degeneration 10 PG-13
On Campus 10 R
Southern Accents 10 R
Fast Food 9 PG
Sex Ed 8 PG-13
Rio 8 R
Chosin Reservoir 7 PG-13
Light Years 7 PG
Renegade 6 PG-13
Rikki-Tikki-Tavi 5 G
A Lifetime of Anger 4 PG-13
Page 162
151
151
Table B.4 Year 2 Script Quality Ratings and Expected MPAA Ratings for Potential
Movies.
Movie Title Script Quality
Expected
MPAA Rating
The Wolf's Lair 10 PG-13
Extrapolation 9 PG-13
Welcome to My Room 9 PG
The Devil Made Me Do It 8 R
We, The People 8 PG-13
A Good Day to Die 7 PG-13
Hoover 7 PG
Line of Duty 6 PG-13
The Reactor 6 PG-13
Air Cav 5 PG-13
Oil & Water 3 G
Page 163
152
152
MEMO
To: Vice-President, Talent Appraisal
From: Talent Appraisal Staff
RE: Skill Ratings for Actors, Actresses, and Directors
We were finally able to compile the information regarding actor and director skill values.
It took quite a bit of work, but we now have the data you requested.
Basically, we surveyed a panel of movie critics and asked them to rate a list of actors,
actresses, and directors for their professional skill. For directors, we asked the critics to
consider things like artistic vision, ability to inspire actors and actresses, work ethic, and
capturing the ―feel‖ of situations. For those in front of the camera, skill consists of raw
acting talent, intensity, emotional expressiveness, and range.
Director Skill pertains to the ability of a director to create a unified artistic vision and get
the most out of the actors and actresses. Director ratings were made on a scale of 1-10,
with 1 indicating a true hack with no talent and 10 indicating a director who could make
an Oscar-winner with volunteers from regional theater. Some of these ratings may
surprise you. Acting Skill is primarily a function of an actor/actresses‘ ability to credibly
display a range of emotions. Some actors/actresses are very good in limited roles, but the
truly great ones can yearn, pine, lust, cry and rage with amazing ability. Actors and
actresses are rated on a 5-point scale, with 1 indicating an actor/actress who would be
challenged to do well on a soap opera and 5 indicating an actor/actress that can do any
role with convincing authority.
With regard to how the Acting Skill of the various actors/actresses affects the overall
Acting Quality of the movie, here is what our research seems to suggest:
(1) The Acting Skill of supporting actors can pretty much be ignored – these
people are usually not on screen long enough for their flaws to do much
damage.
(2) Acting Quality can be estimated by averaging the Acting Skill ratings for
the Lead Roles. When there are only two lead roles, however, it‘s actually a
little less than average if there is a large discrepancy in the Acting Skill
values of the leads. In other words, the lesser actor weighs the film down.
Page 164
153
153
Table B.5 Director Skill Ratings
Director Skill Rating
(0-5 stars)
John Carpenter 3.5
Chris Columbus 2
Stanley Eider 3
Nora Ephron 4
Milos Foreman 4.5
William Friedkin 3
Jonathan Glazer 3.5
Ron Howard 4
Jean Jacques-Annaud 3.5
Stephen King 2.5
Neil LaBute 4
Mimi Leder 3.5
Ang Lee 5
Barry Levinson 4
Michael Mann 4
Garry Marshall 3.5
John McTiernan 4
Sam Mendes 3.5
Mike Nichols 4
Wolfgang Peterson 3.5
Sam Raimi 3
Harold Ramis 3
Brett Ratner 2
Ivan Reitman 2.5
George Romero 3
Joel Schumacher 1.5
Ridley Scott 5
Bryan Singer 2.5
Steven Soderbergh 5
Oliver Stone 5
Billy Bob Thornton 3.5
Simon West 2
Robert Zemeckis 4.5
Page 165
154
154
Table B.6 Acting Skill Ratings for Lead Actors (0-5 Stars)
Actor/Actress Skill Actor/Actress Skill Actor/Actress Skill
Ben Affleck 3 ½ Josh Hartnett 3 Freddie Prinze, Jr. 3
Jessica Alba 3 ½ Ethan Hawke 3 ½ Dennis Quaid 3 ½
Kevin Bacon 4 Katie Holmes 3 Daniel Radcliffe 3 ½
Alec Baldwin 4 ½ Jeremy Irons 4 ½ Len Randall 4 ½
Tom Berenger 4 Samuel L. Jackson 4 Christina Ricci 5
Halle Berry 3 ½ Angelina Jolie 3 Denise Richards 2
Sandra Bullock 2 ½ Ashley Judd 4 Chris Rock 3
Steve Buscemi 4 Nastassia Kinski 4 ½ Keri Russell 3 ½
Nicholas Cage 3 ½ Eriq La Salle 3 ½ Kurt Russell 4
Hayden Christensen 3 Jude Law 4 ½ Elisabeth Shue 4
Jennifer Connelly 4 ½ Heath Ledger 3 ½ Gary Sinise 4 ½
Russell Crowe 5 Donal Logue 4 Tom Skelton 4 ½
Emily Cryton 5 Jennifer Lopez 3 Kevin Spacey 5
Matt Damon 4 ½ John Malkovich 4 ½ DeWayne Stevens 4
Keith David 4 Julianna
Margulies
4 Sharon Stone 3
Daniel Day-Lewis 4 ½ James Marsden 3 ½ Madeline Stowe 4 ½
Vin Diesel 3 ½ Dylan McDermott 3 Kiefer Sutherland 3
Richard Dreyfuss 4 Rose McGowan 3 ½ Mena Suvari 3 ½
Eliza Dushku 4 Tobey McQuire 4 ½ Uma Thurman 4
Charles Dutton 3 ½ Teri Miller 4 ½ Amber Valletta 4 ½
Dakota Fanning 4 ½ Bill Murray 5 Mark Wahlberg 4
Will Ferrell 4 Liam Neeson 4 ½ Denzel Washington 5
Linda Fiorentino 4 Ronda Nelson 4 Damon Wayans 3
James Franco 3 ½ Edward Norton 5 Sigourney Weaver 5
Morgan Freeman 5 Chris O‘Donnell 2 ½ Elijah Wood 4 ½
John Goodman 4 Haley Joel
Osment
4 Michelle Yeoh 3 ½
Gene Hackman 5 Jason Owens 5 Catherine Zeta-
Jones
3 ½
Tom Hanks 5 Anna Paquin 4 ½
Ed Harris 4 ½ Natalie Portman 4 ½
Page 166
155
155
MEMO
To: Vice-President, Marketing
From: Marketing Staff
RE: Impact of Marketing Strategy, MPAA Rating, and Expected Ticket Prices
Table B.7 Marketing Strategy Information.
Strategy Cost (in millions) Impact on Viewer Appeal
Word-of-Mouth $0 +0%
Print + Outdoor $5 +30%
Pre-Release TV $10 +55%
Saturation TV $20 +75%
As shown in Table 1, there are four feasible marketing strategies we can employ,
each with a given cost and impact. Note that, as our marketing strategy gets more
sophisticated, the costs and the positive change in viewers go up. Basically, the more
expensive the strategy, the more effective it is. It is important to note, however, that
marketing is most effective when there is a movie with high Viewer Appeal – marketing
doesn‘t help much if the content of the film isn‘t all that intriguing or if there are no big-
name stars. If we‘re going to produce any ―small‖ high-quality films, it‘s probably better
to just rely on word-of-mouth to spread the news. Overall, a good strategy is to spend
money marketing a movie in proportion to its cost – cheap ones we can get away with
little or no marketing; expensive ones can benefit from saturation TV marketing.
Table B.8 Impact of MPAA Movie Rating on Size of Potential Viewer Base.
MPAA Rating Projected Impact
G 0%
PG -10%
PG-13 -15%
R -25%
NC-17 -40%
As you can see, ―R‖ or ―NC-17‖ movies take a big hit in that a good proportion of people
who go to see movies are excluded from the start. Even if those movies are good, we
won‘t get as many people coming to see them simply because the potential viewer base is
smaller! Obviously, ―G‖ films give us the largest possible base, so we should keep an eye
out for any of those.
Page 167
156
156
Table B.9 Year 1 Average Ticket Price in Dollars for Potential Movies.
Movie Title
Average Expected
Ticket Price
A Lifetime of Anger $ 7.50
Rio $ 7.50
Southern Accents $ 7.50
Chosin Reservoir $ 7.25
Degeneration $ 7.00
Light Years $ 7.00
On Campus $ 7.00
Renegade $ 6.75
Fast Food $ 6.50
Sex Ed $ 6.50
Rikki-Tikki-Tavi $ 6.00
Table B.10 Year 2 Average Ticket Price in Dollars for Potential Movies.
Movie Title
Average Ticket
Price
A Good Day to Die $ 7.50
Hoover $ 7.50
The Devil Made Me Do It $ 7.50
The Wolf's Lair $ 7.50
Air Cav $ 7.00
We, The People $ 7.00
Line of Duty $ 6.75
The Reactor $ 6.75
Welcome to My Room $ 6.50
Extrapolation $ 6.25
Oil & Water $ 6.25
We had the bean-counters in Finance use their fancy regression models to predict the
average ticket price for each potential movie based on projected demographics. These
financial models take into account a host of factors and they‘re usually pretty accurate.
As you can see from Table 3, the potential movies for next year are predicted to have
average ticket prices ranging from $6.00 to $7.50.
Page 168
157
157
Screenplay Profile (SAMPLE)
Title: Rikki-Tikki-Tavi
Genre: 3-D Animation
Audience: Kids; families
Plot Summary:
Based on the best-selling children‘s stories by Rudyard Kipling. Set in India and using
state-of-the-art 3-D technology, the movie follows the exploits of the beloved mongoose,
Rikki-Tikki-Tavi, and his friends, Darzee and Chuchundra. At the beginning of the film,
Rikki-Tikki-Tavi‘s curiosity nearly results in his drowning. Crawling out of a pond, he is
found near death on a garden path by Anna, a little girl who belongs to an English couple
who work at the British Foreign Ministry in the nearby city. Anna falls in love with Rikki
and nurses him back to health. Rikki soon makes friends with Darzee, a bird that lives in
the garden, and Chuchundra, a muskrat. These two tell Rikki of a great menace that has
recently arrived – Nag and Nagaina, two huge cobras that have moved into the garden
and view humans as mortal enemies. After Nagaina kills Anna‘s mother as she sits
rocking their newborn baby, Rikki vows to defend the family. Several tense battles ensue,
one that sees Rikki nearly killed from a bite by Nag, and another in which Nagaina is
killed by Rikki as she moves to strike Anna in her sleep. The climactic scene involves a
confrontation between Rikki and Nag, where it takes the combined efforts of Rikki,
Chuchundra and Anna to trap and eliminate the mighty predator.
Talent Role Type
Cuba Gooding Jr. Rikki-Tikki-Tavi (Voice) Support
Hallie Kate Eisenberg Anna (Voice) Support
Tim Allen Chuchundra (Voice) Support
Roseanne Barr Nagaina (Voice) Support
Regis Philbin Nag (Voice) Support
Director: Stanley Eider
Cost: $65 million
Page 169
158
158
Team Number: _______
Date: _______
FINAL RECOMMENDATION SHEET
1. You may only use the amount of money budgeted for this session, $150 million.
You cannot spend more than $150 million; if a plan that involves overspending is
mistakenly submitted, your group will not be eligible to receive the performance
bonus. It is your responsibility to make sure that your plan is valid.
2. Any unused money will count towards your revenue.
3. All team members must sign the document; if any signatures are missing, the
document will be returned.
4. You have 25 minutes to make your choices; if your team has not completed its
selection process within the allotted time, only the valid choices you have selected
will count and the unused portion of your budget will be counted as revenue.
5. TO CHOOSE A MOVIE FOR PRODUCTION, DO THE FOLLOWING:
a. Indicate your choice by checking the appropriate box below
b. Choose a dollar amount to spend on marketing (the default is $0)
Title Production $ + Marketing $ = Total $ (All amounts are in millions of dollars)
A Lifetime of Anger _____$20___ + 0 5 10 20 = ______
Chosin Reservoir _____$46___ + 0 5 10 20 = ______
Rikki-Tikki-Tavi _____$65___ + 0 5 10 20 = ______
Degeneration _____$51___ + 0 5 10 20 = ______
Fast Food _____$25___ + 0 5 10 20 = ______
Light Years _____$90___ + 0 5 10 20 = ______
On Campus _____$12___ + 0 5 10 20 = ______
Renegade _____$38___ + 0 5 10 20 = ______
Rio _____$40___ + 0 5 10 20 = ______
Sex Ed. _____$29___ + 0 5 10 20 = ______
Southern Accents _____$23___ + 0 5 10 20 = ______
Total: ______
Signatures:
Vice-President, Industry Research: _________________________________
Vice-President, Script Evaluation: ___________________________________
Vice-President, Talent Appraisal: ___________________________________
Vice-President, Marketing: _______________________________________
Page 170
159
159
Team Number: _______
Date: _______
REVENUE & PROFIT SHEET
Below is the list of possible movie selections for the first year. The first column shows
the cost for each movie as given on the initial sheet; the second column indicates the
marketing value of the movies (assumed to be $10 million for any movie your studio did
not produce). The third column highlights profit generated from each movie based on the
amount of marketing indicated. Please review and discuss this information with the rest
of your team. (All amounts are in millions of dollars.)
Title Production Marketing Revenue Profit
A Lifetime of Anger___$20___ ______ _______ _______
Chosin Reservoir ___$46___ ______ _______ _______
Rikki-Tikki-Tavi ___$65___ ______ _______ _______
Degeneration ___$51___ ______ _______ _______
Fast Food ___$25___ ______ _______ _______
Light Years ___$90___ ______ _______ _______
On Campus ___$12___ ______ _______ _______
Renegade ___$38___ ______ _______ _______
Rio ___$40___ ______ _______ _______
Sex Ed. ___$29___ ______ _______ _______
Southern Accents ___$23___ ______ _______ _______
**A check mark in a box above indicates movies your studio produced. +_______
Unspent
Total Profit for this year: _________
Percentage of Maximum Profit: ________
Page 171
160
160
Team Number: _______
Date: _______
FINAL RECOMMENDATION SHEET
6. You may only use the amount of money budgeted for this session, $150 million.
You cannot spend more than $150 million; if a plan that involves overspending is
mistakenly submitted, your group will not be eligible to receive the performance
bonus. It is your responsibility to make sure that your plan is valid.
7. Any unused money will count towards your revenue.
8. All team members must sign the document; if any signatures are missing, the
document will be returned.
9. You have 25 minutes to make your choices; if your team has not completed its
selection process within the allotted time, only the valid choices you have selected
will count and the unused portion of your budget will be counted as revenue.
10. TO CHOOSE A MOVIE FOR PRODUCTION, DO THE FOLLOWING:
a. Indicate your choice by checking the appropriate box below
b. Choose a dollar amount to spend on marketing (the default is $0)
Title Production $ + Marketing $ = Total $ (All amounts are in millions of dollars)
A Good Day to Die _____$20___ + 0 5 10 20 = ______
Air Cav _____$46___ + 0 5 10 20 = ______
Extrapolation _____$65___ + 0 5 10 20 = ______
Hoover _____$51___ + 0 5 10 20 = ______
Line of Duty _____$25___ + 0 5 10 20 = ______
Oil & Water _____$90___ + 0 5 10 20 = ______
The Devil Made _____$12___ + 0 5 10 20 = ______
Me Do It
The Reactor _____$38___ + 0 5 10 20 = ______
The Wolf‘s Lair _____$40___ + 0 5 10 20 = ______
Welcome to My Room _____$29___ + 0 5 10 20 = ______
We, The People _____$23___ + 0 5 10 20 = ______
Total: ______
Signatures:
Vice-President, Industry Research: _________________________________
Vice-President, Script Evaluation: ___________________________________
Vice-President, Talent Appraisal: ___________________________________
Vice-President, Marketing: _______________________________________
Page 172
161
161
Team Number: _______
Date: _______
REVENUE & PROFIT SHEET
Below is the list of possible movie selections for the first year. The first column shows
the cost for each movie as given on the initial sheet; the second column indicates the
marketing value of the movies (assumed to be $10 million for any movie your studio did
not produce). The third column highlights profit generated from each movie based on the
amount of marketing indicated. Please review and discuss this information with the rest
of your team. (All amounts are in millions of dollars.)
Title Production Marketing Revenue Profit
A Good Day to Die ___$20___ ______ _______ _______
Air Cav ___$46___ ______ _______ _______
Extrapolation ___$65___ ______ _______ _______
Hoover ___$51___ ______ _______ _______
Line of Duty __$25___ ______ _______ _______
Oil & Water ___$90___ ______ _______ _______
The Devil Made ___$12___ ______ _______ _______
Me Do It
The Reactor ___$38___ ______ _______ _______
The Wolf‘s Lair ___$40___ ______ _______ _______
Welcome to My ___$29___ ______ _______ _______
Room
We, The People ___$23___ ______ _______ _______
**A check mark in a box above indicates movies your studio produced. +_______
Unspent
Total Profit for this year: _________
Percentage of Maximum Profit: ________
Page 173
162
162
Instructions to the Team for Tinsel Town
After participants are assigned to roles and given the training interventions, they will be
given the following instructions:
―Tinsel Town is a top management simulation in which you will play the role of a
Vice President in a fictional Hollywood movie studio. The four Vice President positions
consist of: VP Marketing, VP Industry Research, VP Talent Appraisal, and VP Script
Evaluation. Your team‘s task is to decide which movies to produce across two simulated
business years. Your overall goal is to achieve the highest possible profit across these two
years.
Each of you has received a folder containing a general memo from the CEO that
provides information about how to determine the movies with the best profit potential
and summaries of screenplays that you can choose to purchase and turn into a movie. In
addition, you each have received some information specific to your individual role. Your
team should use this information to make decisions about what movies to produce and
how much to spend marketing each one.
Each simulated year will begin with a period of 15 minutes where each team
member will have the opportunity to silently and individually review the information at
their disposal. No discussion or interaction is permitted during this time. You may take
notes on the scratch paper provided, but do not share this information with others at this
time.
After the 15-minute individual review period, you begin the discussion period.
You will then have 25 minutes to discuss the task and reach agreement concerning which
movies to produce and how much money to spend on marketing them. You must all be in
agreement regarding your choices, and each person will indicate their agreement by
signing the form where your collective recommendations are made (hold up the form).
Record the agreed-on recommendations on the provided form marked Final
Recommendations by placing a check in the box next to a movie and circling a marketing
amount (0, 5, 10, or 20 million dollars) to the right. The total cost of a movie is its
production cost plus its marketing cost; sum these two values for each movie and indicate
the total in corresponding space. You may choose as many movies as you would like,
subject to the constraint that you cannot spend more than 150 million dollars in any
decision period. Therefore, the total at the bottom right of the Final Recommendations
Sheet must be less than or equal to 150 million dollars.
At the end of each simulated year, I will collect your Final Recommendation
sheet, calculate the total profit you generated, and provide feedback to your team. This
sheet will show you the revenue and profit for the movies you selected as well as the
revenue and profit of the movies you did not select. At the bottom of this sheet you will
see your total profit and the percentage of the maximum profit that your team achieved.
After you have had a brief chance to review this feedback, I will distribute the
information for the second decision period, and we will complete the process one more
time.
Are there any questions?‖
Page 174
163
163
Appendix C: Measures
Background Measures
Participant #: ___________
Team #: ___________
Please respond to the following seven questions and answer them
honestly. Your responses will be kept confidential and will in no way
impact the determination of how well your team performs.
1. What is your gender?
○ Female
○ Male
2. Which of the following best describes your ethnicity?
○ Hispanic or Latino
○ White
○ Black or African American
○ Native Hawaiian or Other Pacific Islander
○ Asian
○ American Indian or Alaska Native
○ Two or More Races
3. In years, what is current age?
_______ years of age
4. How many credit hours have you completed?
_______ credit hours
5. What is your cumulative grade point average (GPA)?
_______
6. If you are currently employed, how many hours do you
typically work per week?
Page 175
164
164
_______ hours/week
_______ Check here if you are not currently employed.
7. During your employment history, have you ever been a
member of a work group or team?
○ Yes
○ No
○ I have never been employed.
Page 176
165
165
Personality Measure
How Accurately Can You Describe Yourself?
Participant #: ___________
Team #: ___________
Describe yourself as you generally are now, not as you wish to be in the future. Describe
yourself as you honestly see yourself, in relation to other people you know of the same
sex as you are, and roughly your same age. So that you can describe yourself in an
honest manner, your responses will be kept in absolute confidence. Indicate for each
statement whether it is Very Inaccurate, Moderately Inaccurate, Neither Accurate Nor
Inaccurate, Moderately Accurate, or Very Accurate as a description of you.
Very Inaccurate
Moderately Inaccurate
Neither Accurate
Nor Inaccurate
Moderately Accurate
Very Accurate
Am relaxed most of
the time. ○ ○ ○ ○ ○
Don't talk a lot. ○ ○ ○ ○ ○ Have a rich
vocabulary. ○ ○ ○ ○ ○ Am not really
interested in others. ○ ○ ○ ○ ○
Am always prepared. ○ ○ ○ ○ ○
Get stressed out easily. ○ ○ ○ ○ ○ Am the life of the
party. ○ ○ ○ ○ ○ Have difficulty
understanding abstract
ideas. ○ ○ ○ ○ ○ Am interested in
people. ○ ○ ○ ○ ○ Leave my belongings
around. ○ ○ ○ ○ ○
Page 177
166
166
Seldom feel blue. ○ ○ ○ ○ ○ Keep in the
background. ○ ○ ○ ○ ○ Have a vivid
imagination. ○ ○ ○ ○ ○
Insult people. ○ ○ ○ ○ ○
Very Inaccurate
Moderately Inaccurate
Neither Accurate
Nor Inaccurate
Moderately Accurate
Very Accurate
Pay attention to
details. ○ ○ ○ ○ ○
Worry about things. ○ ○ ○ ○ ○ Feel comfortable
around people. ○ ○ ○ ○ ○
Am not interested in
abstract ideas. ○ ○ ○ ○ ○ Sympathize with
others' feelings. ○ ○ ○ ○ ○
Make a mess of things. ○ ○ ○ ○ ○
Am easily disturbed. ○ ○ ○ ○ ○
Have little to say. ○ ○ ○ ○ ○
Have excellent ideas. ○ ○ ○ ○ ○ Am not interested in
other people's
problems. ○ ○ ○ ○ ○ Get chores done right
away. ○ ○ ○ ○ ○
Get upset easily. ○ ○ ○ ○ ○
Start conversations. ○ ○ ○ ○ ○ Do not have a good
imagination. ○ ○ ○ ○ ○
Page 178
167
167
Have a soft heart. ○ ○ ○ ○ ○ Often forget to put
things back in their
proper place. ○ ○ ○ ○ ○ Change my mood a
lot. ○ ○ ○ ○ ○
Don't like to draw
attention to myself. ○ ○ ○ ○ ○ Am quick to
understand things. ○ ○ ○ ○ ○ Feel little concern for
others. ○ ○ ○ ○ ○
Very Inaccurate
Moderately Inaccurate
Neither Accurate
Nor Inaccurate
Moderately Accurate
Very Accurate
Like order. ○ ○ ○ ○ ○ Have frequent mood
swings. ○ ○ ○ ○ ○ Talk to a lot of
different people at
parties. ○ ○ ○ ○ ○
Use difficult words. ○ ○ ○ ○ ○ Take time out for
others. ○ ○ ○ ○ ○
Shirk my duties. ○ ○ ○ ○ ○
Get irritated easily. ○ ○ ○ ○ ○ Am quiet around
strangers. ○ ○ ○ ○ ○ Spend time reflecting
on things. ○ ○ ○ ○ ○
Feel others' emotions. ○ ○ ○ ○ ○
Follow a schedule. ○ ○ ○ ○ ○
Page 179
168
168
Often feel blue. ○ ○ ○ ○ ○
Don't mind being the
center of attention. ○ ○ ○ ○ ○
Am full of ideas. ○ ○ ○ ○ ○ Make people feel at
ease. ○ ○ ○ ○ ○ Am exacting in my
work. ○ ○ ○ ○ ○
Adapted from Goldberg (1999b)
Page 180
169
169
Team Role Performance Measure
Self-Report Ratings
Participant #: ___________
Team #: ___________
Instructions: Please read through each role description and related actions. Then
indicate the extent to which you performed the actions when needed for team
effectiveness. Please respond using the 5-point scale next to each action.
Contractor Role
Role Description: Organized the work and kept others focused on getting it done
efficiently.
To what extent did you perform the following actions when needed for team
effectiveness?
To no
extent
To a
small
extent
To a
moderate
extent
To a
great
extent
To a
very
great
extent
Organized the team‘s
work to get important
work done on time. ○ ○ ○ ○ ○ Coordinated the work
done by others so that
things were done in the
right order. ○ ○ ○ ○ ○ Helped the team focus on
getting the job done
efficiently. ○ ○ ○ ○ ○
Page 181
170
170
Creator Role
Role Description: Had new and creative ideas for solving problems and getting the
work done.
To what extent did you perform the following actions when needed for team
effectiveness?
To no
extent
To a
small
extent
To a
moderate
extent
To a
great
extent
To a
very
great
extent
Suggested creative ways
to solve the team's
problems. ○ ○ ○ ○ ○ Helped the team take a
fresh perspective on
problems. ○ ○ ○ ○ ○ Saw the "big picture" and
had creative ideas for
handling problems. ○ ○ ○ ○ ○
Contributor Role
Role Description: Had new and creative ideas for solving problems and getting the
work done.
To what extent did you perform the following actions when needed for team
effectiveness?
To no
extent
To a
small
extent
To a
moderate
extent
To a
great
extent
To a
very
great
extent
Spoke out when he/she
knew the most about the
work to be done. ○ ○ ○ ○ ○
Shared with the team any
knowledge he/she had
about the work to be done. ○ ○ ○ ○ ○ Took the lead in the team
when he/she had a lot of
experience in that area of
work. ○ ○ ○ ○ ○
Page 182
171
171
Completer Role
Role Description: Took personal responsibility for the team's work, volunteered for
new jobs, and followed through on the commitments made.
To what extent did you perform the following actions when needed for team
effectiveness?
To no
extent
To a
small
extent
To a
moderate
extent
To a
great
extent
To a
very
great
extent
Took personal
responsibility for getting
the work done. ○ ○ ○ ○ ○ Finished work for the
team on time without
being reminded. ○ ○ ○ ○ ○ Followed through on
commitments made to the
team. ○ ○ ○ ○ ○
Critic Role
Role Description: Thoroughly thought through what the team was doing to make sure
it was not rushed and considered both positive and negative aspects.
To what extent did you perform the following actions when needed for team
effectiveness?
To no
extent
To a
small
extent
To a
moderate
extent
To a
great
extent
To a
very
great
extent
Spoke up if he/she had
concerns with the work
the team was doing. ○ ○ ○ ○ ○ Made sure the team talked
about both positive and
negative consequences of
decisions. ○ ○ ○ ○ ○ Shared honest opinions
about how the team was
working, even if the
opinion was not favorable. ○ ○ ○ ○ ○
Page 183
172
172
Communicator Role
Role Description: Communicated clearly, honestly, and respectfully with others,
making the work atmosphere more comfortable because he/she was pleasant to work
with.
To what extent did you perform the following actions when needed for team
effectiveness?
To no
extent
To a
small
extent
To a
moderate
extent
To a
great
extent
To a
very
great
extent
Made the work pleasant
and comfortable by being
happy and easy to work
with. ○ ○ ○ ○ ○ Communicated personal
feelings and thoughts
respectfully and without
offending anyone. ○ ○ ○ ○ ○ Listened carefully to the
thoughts and feelings of
others. ○ ○ ○ ○ ○
Page 184
173
173
Calibrator Role
Role Description: Encouraged the team to get along together by helping to settle
conflicts, deal with problems, and be respectful
To what extent did you perform the following actions when needed for team
effectiveness?
To no
extent
To a
small
extent
To a
moderate
extent
To a
great
extent
To a
very
great
extent
Helped settle conflicts
between members of the
team. ○ ○ ○ ○ ○ Suggested positive ways
for the team to interact
such as taking turns,
showing respect, and
being open to new ideas. ○ ○ ○ ○ ○ Stepped in if there were
negative feelings in the
team to help resolve the
difficulties. ○ ○ ○ ○ ○
Measure adapted from Mumford, Campion, & Morgeson (2006)
Page 185
174
174
Team Role Performance Measure
Team member ratings
Participant #: ___________
Team Member #: ___________
Team #: ___________
Instructions: Please read through each role description and related actions. Then
indicate the extent to which each of your team members performed the actions
when needed for team effectiveness. Please respond using the 5-point scale next to
each action.
Contractor Role
Role Description: Organized the work and kept others focused on getting it done
efficiently.
To what extent did this team member perform the following actions when needed for
team effectiveness?
To no
extent
To a
small
extent
To a
moderate
extent
To a
great
extent
To a
very
great
extent
Organized the team‘s
work to get important
work done on time. ○ ○ ○ ○ ○ Coordinated the work
done by others so that
things were done in the
right order. ○ ○ ○ ○ ○ Helped the team focus on
getting the job done
efficiently. ○ ○ ○ ○ ○
Page 186
175
175
Creator Role
Role Description: Had new and creative ideas for solving problems and getting the
work done.
To what extent did this team member perform the following actions when needed for
team effectiveness?
To no
extent
To a
small
extent
To a
moderate
extent
To a
great
extent
To a
very
great
extent
Suggested creative ways
to solve the team's
problems. ○ ○ ○ ○ ○ Helped the team take a
fresh perspective on
problems. ○ ○ ○ ○ ○ Saw the "big picture" and
had creative ideas for
handling problems. ○ ○ ○ ○ ○
Contributor Role
Role Description: Had new and creative ideas for solving problems and getting the
work done.
To what extent did this team member perform the following actions when needed for
team effectiveness?
To no
extent
To a
small
extent
To a
moderate
extent
To a
great
extent
To a
very
great
extent
Spoke out when he/she
knew the most about the
work to be done. ○ ○ ○ ○ ○
Shared with the team any
knowledge he/she had
about the work to be done. ○ ○ ○ ○ ○ Took the lead in the team
when he/she had a lot of
experience in that area of
work. ○ ○ ○ ○ ○
Page 187
176
176
Completer Role
Role Description: Took personal responsibility for the team's work, volunteered for
new jobs, and followed through on the commitments made.
To what extent did this team member perform the following actions when needed for
team effectiveness?
To no
extent
To a
small
extent
To a
moderate
extent
To a
great
extent
To a
very
great
extent
Took personal
responsibility for getting
the work done. ○ ○ ○ ○ ○ Finished work for the
team on time without
being reminded. ○ ○ ○ ○ ○ Followed through on
commitments made to the
team. ○ ○ ○ ○ ○
Critic Role
Role Description: Thoroughly thought through what the team was doing to make
sure it was not rushed and considered both positive and negative aspects.
To what extent did this team member perform the following actions when needed for
team effectiveness?
To no
extent
To a
small
extent
To a
moderate
extent
To a
great
extent
To a
very
great
extent
Spoke up if he/she had
concerns with the work
the team was doing. ○ ○ ○ ○ ○ Made sure the team talked
about both positive and
negative consequences of
decisions. ○ ○ ○ ○ ○ Shared honest opinions
about how the team was
working, even if the
opinion was not favorable. ○ ○ ○ ○ ○
Page 188
177
177
Communicator Role
Role Description: Communicated clearly, honestly, and respectfully with others,
making the work atmosphere more comfortable because he/she was pleasant to work
with.
To what extent did this team member perform the following actions when needed for
team effectiveness?
To no
extent
To a
small
extent
To a
moderate
extent
To a
great
extent
To a
very
great
extent
Made the work pleasant
and comfortable by being
happy and easy to work
with. ○ ○ ○ ○ ○ Communicated personal
feelings and thoughts
respectfully and without
offending anyone. ○ ○ ○ ○ ○ Listened carefully to the
thoughts and feelings of
others. ○ ○ ○ ○ ○
Page 189
178
178
Calibrator Role
Role Description: Encouraged the team to get along together by helping to settle
conflicts, deal with problems, and be respectful
To what extent did this team member perform the following actions when needed for
team effectiveness?
To no
extent
To a
small
extent
To a
moderate
extent
To a
great
extent
To a
very
great
extent
Helped settle conflicts
between members of the
team. ○ ○ ○ ○ ○ Suggested positive ways
for the team to interact
such as taking turns,
showing respect, and
being open to new ideas. ○ ○ ○ ○ ○ Stepped in if there were
negative feelings in the
team to help resolve the
difficulties. ○ ○ ○ ○ ○
Measure adapted from Mumford, Campion, & Morgeson (2006)
Page 190
179
179
Appendix D: Vector Tool
In
form
al
Role
Con
figu
rati
on
Vec
tor
Tea
m #
:__________
Inst
ruct
ion
s:
Usi
ng t
he
over
all
info
rmal
role
per
form
ance
sco
res
for
each
par
tici
pan
t, a
dd u
p t
he
tota
l
num
ber
of
info
rmal
role
s per
form
ed a
cross
the
fou
r te
am m
ember
s. F
or
each
info
rmal
role
lis
ted, in
put
the
tota
l num
ber
of
team
mem
ber
s per
form
ing t
he
role
in t
he
appro
pri
ate
colu
mn.
For
exam
ple
, if
the
over
all
info
rmal
role
per
form
ance
sco
res
indic
ated
that
tw
o t
eam
mem
ber
s per
form
ed t
he
Contr
acto
r ro
le, w
rite
the
num
ber
―2‖
in t
he
cell
bel
ow
Contr
acto
r. I
f no
ne
of
the
team
mem
ber
s per
form
ed a
par
ticu
lar
role
,
wri
te ―
0‖
bel
ow
that
role
. C
om
ple
te t
he
table
bel
ow
for
all
seven
role
s. T
his
sev
en-d
igit
num
eric
al
sequen
ce w
ill
serv
e as
th
e vec
tor
info
rmal
role
co
nfi
gura
tion f
or
the
team
.
Ca
lib
rato
r
Co
mm
un
ica
tor
Cri
tic
Co
mp
lete
r
Co
ntr
ibu
tor
Cre
ato
r
Co
ntr
act
or
# o
f te
am
mem
ber
s
per
form
ing
the
role
Page 191
180
180
Appendix E: Final Debriefing Form
THANK YOU FOR YOUR PARTICIPATION!
This document provides further insight into the study in which you just participated. Please
refrain from sharing these details with other students who may take part in this study in the
future. Thank you!
Study Purpose
As teams become more common in the workplace, there is growing push to understand what
makes teams effective or ineffective. In the present study, we are exploring the impact of
informal roles on team effectiveness, where informal roles represent the patterns of related
behaviors that individuals adopt within a team. In general, we predict that certain combinations of
informal roles will influence a team‘s decision-making effectiveness. Further, we hypothesize
that each person‘s personality will influence the informal role(s) that he/she adopts. In order to
test these relationships, we randomly placed you and your fellow participants into teams, where
you completed the Tinsel Town task. The purpose of Tinsel Town is to create an environment in
where each team members must effectively share information to make decisions. By working
together, you and your teammates may have performed patterns of behaviors consistent with
specific informal roles.
Expected Findings
We expect to find that certain personality traits will predict the informal roles team members
adopt. Further, we anticipate that the combination of the roles adopted will influence a team‘s
effectiveness.
Implications of Findings
The findings of this study could be used for both selecting applicants and training employees
within an organization. For instance, measuring an applicant‘s personality could potentially be
used to predict the informal role(s) he/she will adopt in a workplace team. In this way,
organizations could hire applicants who will likely ―mesh‖ well with their future teammates. In
addition, the findings of this study could be used to train teams to adopt those informal roles that
lead to effective team decision-making.
Relevant References
These articles can be found in the IUPUI University Library, or in full-text on the IUPUI
University Library website.
Mumford, T. V., Iddekinge, C. H., Morgeson, F.P., & Campion, M. A. (2008). Team Role Test:
Development and validation of a team role knowledge situational judgment test. Journal
of Applied Psychology, 93, 250-267.
Stewart, G. L., Fulmer, I. S., & Barrick, M. R. (2005). An exploration of member roles as a
multilevel linking mechanism for individual traits and team outcomes. Personnel
Psychology, 58, 343-365.
Questions?
If you have any further questions in the future, please contact one of the researchers:
Dennis Devine, (Associate Professor of Psychology at IUPUI), at [email protected] , 317-274-
6763, or David Caughlin, (Graduate Student at IUPUI), at [email protected] .