Finance and Economics Discussion Series Divisions of Research & Statistics and Monetary Affairs Federal Reserve Board, Washington, D.C. The Impact of Post Stress Tests Capital on Bank Lending William F. Bassett and Jose M. Berrospide 2018-087 Please cite this paper as: Bassett, William F., and Jose M. Berrospide (2018). “The Impact of Post Stress Tests Capital on Bank Lending,” Finance and Economics Discussion Se- ries 2018-087. Washington: Board of Governors of the Federal Reserve System, https://doi.org/10.17016/FEDS.2018.087. NOTE: Staff working papers in the Finance and Economics Discussion Series (FEDS) are preliminary materials circulated to stimulate discussion and critical comment. The analysis and conclusions set forth are those of the authors and do not indicate concurrence by other members of the research staff or the Board of Governors. References in publications to the Finance and Economics Discussion Series (other than acknowledgement) should be cleared with the author(s) to protect the tentative character of these papers.
Transcript
Finance and Economics Discussion SeriesDivisions of Research & Statistics and Monetary Affairs
Federal Reserve Board, Washington, D.C.
The Impact of Post Stress Tests Capital on Bank Lending
William F. Bassett and Jose M. Berrospide
2018-087
Please cite this paper as:Bassett, William F., and Jose M. Berrospide (2018). “The Impact of PostStress Tests Capital on Bank Lending,” Finance and Economics Discussion Se-ries 2018-087. Washington: Board of Governors of the Federal Reserve System,https://doi.org/10.17016/FEDS.2018.087.
NOTE: Staff working papers in the Finance and Economics Discussion Series (FEDS) are preliminarymaterials circulated to stimulate discussion and critical comment. The analysis and conclusions set forthare those of the authors and do not indicate concurrence by other members of the research staff or theBoard of Governors. References in publications to the Finance and Economics Discussion Series (other thanacknowledgement) should be cleared with the author(s) to protect the tentative character of these papers.
1
The Impact of Post-Stress Tests Capital on Bank Lending
William F. Bassett* Jose M. Berrospide*
Federal Reserve Board Federal Reserve Board
November 2018
Abstract
We investigate one channel through which the annual bank stress tests, as part of the Federal Reserve’s
Comprehensive Capital Analysis and Review (CCAR) review, could unexpectedly affect the provision of
bank credit. To quantify the impact of the stress tests on lending, we compare the capital implied by the
supervisory stress tests with the level of capital implied by the banks’ own models, a measure we call the
capital gap. We then study the impact of the capital gap on the loan growth of BHCs subject to supervisory
or bank-run stress tests. Consistent with previous results in the bank capital literature, we find evidence that
better capitalized banks have higher loan growth. The additional capital implied by the supervisory stress
tests (capital gap) does not appear to unduly restrict loan growth.
JEL Classification Codes: G21, G28
Keywords: bank capital, bank lending, regulatory capital, stress tests
______________________________
* Email: [email protected] and [email protected]. We thank Saleem Bahaj, Eliana Balla, Andrew Cohen, Sergio Correia, Beverly Hirtle, Lei Li, Ulas Misirli, Ralf Meisenzahl, Teodora Paligorova, Mihal Velikov, Liu Yang, Cindy Vojtech, and participants at the Federal Reserve Board, Bank of England, Federal Reserve Bank of Boston, Federal Reserve Bank of Richmond, IFABS 2017 annual meeting, and FDIC's Annual Bank Research Conference for valuable comments. The views expressed are our own and do not necessarily reflect those of the Federal Reserve Board.
2
1. Introduction
As the deep recession caused by the 2007-2009 financial crisis reinforced, allowing banks to operate
without sufficient capital to withstand periods of severe financial and economic stress can exacerbate
economic downturns and slow recovery from them. However, miscalibration of financial regulation can
also restrict credit to otherwise creditworthy borrowers or distort the distribution of credit through the
economy. As a result, the appropriate role and stringency of bank regulations worldwide continue to be
highly debated among academics, regulators, and banking industry representatives.
Stress testing has become a cornerstone approach to bank regulation and an important component
of the post-crisis regulatory reform in the United States (Tarullo, 2014). One of the primary advantages
of stress tests is that they provide a forward-looking measure of what may happen to income, credit
quality, and the level of capital in the banking system when the economy deteriorates (Hirtle, Kovner,
Vickery and Bhanot, 2016). U.S. banking organizations undoubtedly are more resilient and the U.S.
financial sector is more stable than before the financial crisis because of the strong stress-testing regime
(Hirtle and Lehnert, 2015). However, the banking industry and other stakeholders have claimed that the
stress testing exercises are altering credit availability in ways that are unintended by policymakers.1
One channel through which stress tests could affect credit availability is through the capital
requirements that are implicit in the quantitative part of the Federal Reserve’s annual Comprehensive
Capital Analysis and Review (CCAR). We study whether banks’ resultant use of higher capital is
restraining the provision of bank credit to a greater degree than expected, or changing the allocation of
loan growth in ways that are unwarranted. Of course, not all changes in the availability of credit in the
post-crisis regime would be unwelcome; for instance, stress-tested incentivizes banks to consider whether
their lending operations are sustainable through a severe downturn.
To quantify the effect of the additional capital required by the Federal Reserve’s stress tests, we
compare the minimum post-stress capital ratios implied by the Fed’s independent stress test models to the
ratios implied by the BHC’s own internally developed stress test models, both using the CCAR severely
adverse scenario. We call this difference the capital gap, which we interpret as the additional capital that
1 Some of these sources suggest that stress tests require banks to fund their assets with more capital than necessary to achieve financial stability goals, and thus point to the idea that banks could instead be using that extra capital to finance additional credit in the economy. These types of arguments may be misleading as they could suggest that excess capital, which otherwise could be used to extend more credit, is kept as idle cash in banks’ vaults. Capital requirements do not force banks to immobilize capital in their balance sheets. Instead, capital requirements ensure that banks finance new loans with sufficient capital to remain viable in a downturn (e.g., with 7 cents for each dollar of new loans), rather than with less stable sources of funding that could dry up and exacerbate a nascent crisis.
3
the bank needs to use in its funding structure in order to comply with the supervisory stress tests relative
to the capital levels that would be implied by its own models.2 Importantly, banks have limited ability to
manage this gap, because the Federal Reserve’s stress test models are not disclosed to them. We then
study the impact of the capital gap on the loan growth of BHCs across different loan categories.
Following theoretical and empirical literature that relates the level of bank capital to optimal
investment behavior by banks, we compare two hypotheses about the impact of the capital gap on banks’
loan growth and their lending standards. First, the risk mitigation hypothesis states that the additional
capital required by the stress tests causes banks to reduce their risk-taking activities, for instance by
tightening their lending standards or increasing their investments in safe securities. Second, the risk
facilitation hypothesis postulates that the higher capital buffers resulting from the stress tests make banks
safer and more resilient, which in turn lowers their marginal cost of funding and thus puts them in a better
position to take more risks, by loosening their lending standards or by increasing the share of loans on
their balance sheet.
The analysis consists of two approaches. First, we compare the impact of the capital gap on bank
loan growth. One comparison focuses on those banks subject to the supervisory stress tests (CCAR
banks) relative to the smaller regional banks that must run their own stress tests but are not subject to the
supervisory stress tests (non-CCAR banks).3 Supervisory stress tests tend to be more stringent than bank
stress tests and thus, on average, the capital gap is positive among CCAR banks. By construction, the
capital gap is zero for non-CCAR banks, because they are not subject to the supervisory exercise. This
variation in the capital gap measure identifies the lending implications of the supervisory stress tests in a
panel data framework. Furthermore, we test the robustness of this analysis by looking at different
subsamples of stress-tested banks. One subsample eliminates the largest and most complex banks as well
as the smaller regional banks, in order to focus on banks with more-comparable business models. That is,
the BHCs that mostly engage in traditional lending and deposit taking operations, and are closest to the
$50 billion size threshold for participation in the supervisory stress test exercise. A second robustness
check limits the sample to the CCAR banks only. In our second approach, we extend the analysis, and
further distinguish ourselves from the rest of this burgeoning literature, by examining the impact of the
2 For example, if the post-stress capital ratio (i.e., the capital ratio resulting from the most severe stress test scenario for the bank) is 9 percent under the bank's model and 8 percent under the Fed's model, the capital gap would be 1 percent. 3 The non-CCAR BHCs in our sample are the relatively large regional banks with assets between $10 billion and $50 billion. These BHCs are not subject to the Federal Reserve’s stress tests, but the Dodd-Frank Act mandates that they conduct their own annual company-run stress tests, submit their results to their primary federal banking regulator (Federal Deposit Insurance Corporation, Federal Reserve System, or Office of the Comptroller of the Currency) and make their results public (e.g. through their websites). Throughout the paper, we use the terms bank and BHC interchangeably.
4
capital gap on the level of bank lending standards across multiple loan categories using the responses in
the Senior Loan Officer Opinion Survey (SLOOS) for both groups, CCAR and non-CCAR banks.
We find no systematic evidence in favor of the risk mitigation hypothesis. In other words, we find
no evidence that the extra capital implied by the results of the supervisory stress tests may be unduly
constraining bank loan growth or causing banks to tighten their lending standards. In our first approach,
which compares the loan growth between CCAR and non-CCAR banks, we conclude that although loan
growth by CCAR banks has been slower than loan growth by non-CCAR banks, the difference in growth
for categories such as residential and commercial real estate loans and small business loans seems to be
driven by factors beyond the stress tests. These factors include loan demand (proxied by economic
conditions in banks’ primary markets), and other bank-specific characteristics such as increased post-
crisis risk aversion, differential credit quality of legacy portfolios, and funding models.
Our results are consistent with previous findings in the academic literature supporting the view
that more capital is associated with higher loan growth (Bernanke and Loan, 2000; Francis and Osborne,
2009; Berrospide and Edge, 2010; Carlson, Shan, Warusawitharana, 2013; Chu, Zhang, and Zhao, 2017).
Our paper differs from recent work analyzing specifically the impact of stress tests on banks’ lending and
risk taking. Acharya, Berger and Roman (2018) find that stress-tested banks reduce their credit supply to
manage their credit risk. These authors show that the negative effect seems stronger for riskier borrowers,
safer banks, banks that pass the stress tests, and the earlier stress tests. Pierret and Steri (2017) study the
risk-taking incentives of stress-tested banks and non-stress-tested banks and find that the higher capital
requirements implied by the stress tests encourage more prudent investments. Like these papers, we also
examine the lending implications of the supervisory stress tests. However, rather than looking at banks
that pass or fail the stress tests, or comparing bank lending before and after the implementation of the
stress tests, we examine the implications of the higher capital implied by the stress test relative to the
level of capital implied by the banks’ own stress tests. Another important difference with the
aforementioned papers is that we follow a broader approach by studying the lending implications of the
post-stress tests capital on more loan categories.
As we discuss below, before the financial crisis, CCAR banks were operating with historically
lower capital ratios than smaller non-CCAR banks. The implementation of the stress tests and other
reforms to capital requirements has led the CCAR banks to raise large amounts of capital. Consistent
with the risk facilitation hypothesis, our interpretation is that the higher capital buffers that result from the
new regulatory framework, which make banks safer and more resilient, altogether put banks in a better
position to lend more, at least across some loan categories. According to our results, higher capital buffers
have not restricted, but instead favored, the lending capacity of CCAR banks relative to other banks in the
5
same period. Beyond their crucial role in bank supervision and regulation, stress tests are also a key
forward-looking risk management tool for banks themselves, a benefit that should be compared with the
costs of administering the tests.
The remainder of the paper is organized as follows. Section 2 provides the background on stress
testing in the U.S, section 3 revises the related literature. Section 4 describes our empirical methodology
and section 5 presents our econometric results. Section 6 concludes.
2. Background on U.S. Supervisory Stress Tests
In the U.S., the stress-testing regime is an annual process that consists of two interrelated parts, the
Comprehensive Capital Analysis and Review (CCAR), established by the Federal Reserve in 2011, and
the Dodd-Frank Act Stress Tests (DFAST), which are required by the Dodd-Frank Act (DFA). CCAR is
an evaluation of capital planning processes at individual BHC’s with assets greater than $50 billion.4 It
includes both a qualitative review of the company’s internal models, risk management, and control
practices as well as a quantitative assessment of post-stress capital ratios. DFAST is a wholly quantitative
exercise in which the Federal Reserve uses its own independent suite of empirical models to project bank
income, expenses, loss provisions, and capital, over a nine-quarter planning horizon and under three
hypothetical scenarios: baseline, adverse, and severely adverse.5 The severely adverse scenario features a
deep recession in the U.S., characterized by a substantial increase in the unemployment rate, large
declines in asset prices, and increases in risk premia.
The main difference between DFAST and CCAR is that upon disclosure of results, no specific
supervisory actions are attached to DFAST beyond the requirement that BHCs consider the results in their
capital planning. However, in CCAR, the Federal Reserve may object to the BHC’s capital plan (e.g., a
BHC fails the stress test) on either quantitative or qualitative grounds, and thus may require changes in
the BHC’s planned capital distributions.6 Objections on quantitative grounds occur when a BHC’s post-
stress capital ratio falls below a minimum capital requirement (e.g., if CET1 capital ratio falls below 4.5
4 Beginning in 2017, most BHCs with assets between $50 billion and $250 billion were exempted from the qualitative portion of CCAR, but remained subject to its quantitative review and the DFAST exercise. 5 The Federal Reserve started conducting Dodd-Frank Act supervisory stress tests (DFAST) in 2013 on the 18 largest BHCs that were subject to the 2009 Supervisory Capital Assessment Program (SCAP). In 2017, 35 BHCs were subject to DFAST. That number will change in the coming years as intermediate holding companies (IHCs) of foreign banking organizations operating in the U.S. are incorporated and the Economic Growth, Regulatory Relief, and Consumer Protection Act of 2018 exempts institutions with less than $100 billion in assets from DFAST. 6 More specifically, the Federal Reserve could require the company to stop dividend payments and share repurchases entirely, or could permit these actions within certain bounds. In general, all BHCs that participate in CCAR receive extensive supervisory feedback on their capital planning processes, including identification of areas that require improvement (Hirtle and Lehnert, 2015).
6
percent). On qualitative grounds, objections occur, for example, when deficiencies are identified in a
BHC’s governance structure or its risk measurement and management system.
Another key difference between the CCAR quantitative exercise and DFAST is the assumptions
about capital distributions when calculating post-stress capital ratios. DFAST assumes that dividends
remain constant over the planning horizon and similar to their average over the previous year (share
repurchases and issuance are assumed to be zero) whereas CCAR uses the BHCs’ reported planned
capital distributions. In addition, the DFA mandates that all BHCs with assets greater than $10 billion
conduct company-run stress tests using the supervisory scenarios designed by the Federal Reserve and
report those results publicly.7 The comparison of the post-stress capital ratios in DFAST under the
severely adverse scenario resulting from the company-run models with those resulting from the
supervisory models is the key variable in this paper.
Our identification strategy is bolstered by the steps taken by the Federal Reserve to ensure that
the supervisory stress tests are independent of those run by the BHCs. The Federal Reserve releases short
descriptions of the key variables in their models, but does not reveal the full list of variables or the full
functional form of the models.8 Doing so could facilitate banks’ efforts at regulatory arbitrage and
encourage the development of a “model monoculture,” in which all banks converged to the same models
for purposes of “passing” the stress tests. Either development would pose significant risks to financial
stability. Moreover, the scenarios change each year to address emerging risks to financial stability, and
are released to the public only at the start of the stress testing cycle, after the effective date of bank
balance sheet data used in the stress tests. This process prevents banks from altering their balance sheets
just prior to the effective date for the stress tests in order to perform better on the tests.
The implementation of supervisory stress tests has significantly improved the resilience of the
financial sector. By requiring the largest and most complex BHCs to operate with sufficient capital to
weather financial and economic stress periods, and thus to continue functioning as viable financial
intermediaries in those circumstances, the supervisory stress tests have reduced systemic risks in the
financial system (Tarullo, 2014). As shown in Figure 1, the largest banks historically have funded their
balance sheets with less capital than smaller banks. But, this difference in capital has narrowed recently,
7 In addition to these scenarios, each BHC has to conduct a stress test based on its own scenarios, including at least one stress scenario and a baseline scenario. Individual BHCs then submit to their primary federal regulator and publicly release the results of their baseline scenario using their own planned capital actions and the results of their stress scenario(s) using any alternative capital actions (if applicable). 8 See, for example, Appendix B: Models to Project Net Income and Stressed Capital in the disclosure document, “Dodd-Frank Act Stress Tests 2017: Supervisory Stress Tests Methodology and Results,” Board of Governors of the Federal Reserve System, June 2017: https://www.federalreserve.gov/publications/files/2017-dfast-methodology-results-20170622.pdf.
7
as the banks subject to the supervisory stress tests (CCAR banks) have more than doubled their high-
quality capital (e.g., Common Equity Tier 1 capital) ratios over the past ten years, converging to the
capital levels maintained by smaller banks (non-CCAR banks).
Stress tests may also influence banks’ decisions about the quantity or type of credit that they
extend, and that could have unintended consequences. One possible unintended consequence is that the
persistent inclusion of certain major risks in the scenarios could lead to less efficient credit allocation
decisions, because in adjusting their balance sheet to reduce projected losses, banks may end up reducing
the credit supply, for example to sectors in which a large positive supply shock is supporting rapid debt
growth.9 This is a concern recently highlighted by banking industry representatives and other
policymakers, and is part of the motivation for our study.
Figure 2 shows the differences in loan growth between CCAR and non-CCAR banks over the
past 6 years. Recent loan growth at (large) CCAR banks has been slower than loan growth at their
(smaller) non-CCAR counterparts across different loan categories. Differences in loan growth are more
evident for commercial real estate (CRE), residential real estate (RRE) and small business loans, whereas
the lending path for commercial-and-industrial (C&I) and consumer loans look similar between the two
groups of banks.
Differences in loan growth since the end of the financial crisis may be explained by factors
beyond regulation and stress tests such as changes in business models, credit quality, risk aversion, and
different crisis experience. For example, given their complexity and interconnectedness, CCAR banks had
more fragile funding structures and vulnerable balance sheets, and faced significantly larger loan and
securities losses than non-CCAR banks during the financial crisis. Thus, even in the absence of new
regulations or heightened supervision, this crisis experience may have reshaped CCAR banks’ business
models and moderated their loan growth in the post-crisis period. Moreover, loan growth at smaller banks
often exceeds that of larger banks; these banks also had faster growth rates between 2001 and 2006
(Vojtech, 2017).
Beyond their crucial role in bank supervision and regulation, stress tests are also a key forward-
looking risk management tool for banks themselves. For instance, the stress tests incentivize banks to
consider the performance of their loans through a severe downturn, which helps ensure that banks
internalize the costs to the broader economy and financial system of poorly underwritten or unsustainable
9 As Liang (2017) points out, a current practice within the Fed’s stress tests that may prevent this unintended risk from materializing is that supervisory scenarios with salient risks vary over time. In addition, the Federal Reserve’s loss projections are usually based on very granular data that better incorporates the current riskiness of the banks’ business lines than the traditional standardized risk weights used in pre-crisis regulations.
8
credits. They also may encourage banks to undertake better risk measurement and management practices,
to keep well-organized data, and to maintain expertise in projecting revenues and losses under alternative
scenarios (Liang, 2017). However, banks note that stress tests are expensive to implement, and the
supervisory stress test is usually seen by banks as another (more binding) capital requirement.
3. Hypothesis Development and Related literature
3.1. Hypothesis Development
Previous research has examined the impact of capital requirements on bank risk-taking and lending. In
principle, supervisory stress tests are dynamic capital requirements that impose risk-sensitive capital
buffers on banks, accounting explicitly for expected deterioration in an adverse economic scenario. From
a theoretical perspective and assuming that capital is a higher cost source of funding than the bank would
otherwise employ, risk-sensitive capital requirements create stronger incentives for banks to limit risk-
taking activities. As a result, the higher capital required by the supervisory stress tests may lead banks to
tighten their lending standards and thus to restrict their credit supply relative to their behavior in a
regulatory regime that did not explicitly account for severe downturns. Thus, the stress tests lead to larger
buffers against losses than banks would maintain in their absence. Papers providing theoretical support to
the restricting effects of capital requirements on risk-taking and lending include Thakor (1996), Repullo
(2004), and Acharya, Mehran and Thakor (2016). We refer to this view as the risk mitigation hypothesis
of supervisory stress tests.
An alternative possibility is that banks that are incentivized to maintain large capital buffers may
expand their credit supply. In particular, higher capital buffers resulting from the need to account for
potential losses uncovered by the stress tests can make banks safer and more resilient, and thus put them
in a better position to take more risks, perhaps by loosening their lending standards and increasing their
lending. This may be the case if the additional capital (e.g., reduction in the probability of bank default)
leads to a reduction in the cost of funding the new marginal loans. This view, which we refer to as the
risk facilitation hypothesis of supervisory stress tests, is consistent with the theoretical frameworks in
Kim and Santomero (1988), Calem and Rob (1999), and more recently, Bahaj and Malherbe (2017).
These latter authors show that the relationship between lending and capital requirements follows a U-
shaped pattern, that is, once capital requirements move beyond a level that investors consider sufficiently
conservative, banks increase their allocations to risky assets (e.g., lending). This seems to be particularly
the case during a post-crisis period—that is, when banks have had enough time to remove their legacy of
bad loan portfolios and thus potential debt overhang issues are less severe.
9
These two hypotheses are largely analogous to the risk management hypothesis (reduction in
credit supply) and the moral hazard hypothesis (increase in credit supply) of stress tests, respectively, in
Acharya, Berger, and Roman (2017). In formulating their hypotheses, these authors discuss the different
potential channels set forth in previous research through which bank capital regulations impact bank risk-
taking and lending decisions. These channels are derived under the view that depending on how strong
their existing capital positions are, banks may have incentives to reduce or expand their lending in
response to changes in capital regulation. In contrast, in formulating our two opposing hypothesis, we
focus on the impact of the additional capital that banks employ as a result of the supervisory stress tests
on banks’ loan growth and their lending standards across different loan categories.
3.2 Other Related Literature
Our paper is related to the two strands of the empirical literature studying the relationship between bank
capital and lending. The first strand considers the impact of minimum capital requirements on bank credit
supply. Empirical work in this literature finds that increases in minimum capital requirements reduce
bank lending (Brinkmann and Horvitz 1995, Peek and Rosengreen 1997, Gambacorta and Mistrulli 2004,
Aiyar, Calomiris, and Wieladek 2014, Mésonnier and Monks 2015, and Berrospide and Edge, 2017). In
those papers, estimates of the impact of a one-percentage-point increase in capital requirements on loan
growth over a one-year horizon show reductions in lending ranging between 1 to 10 percentage points or
changes in interest rates faced by borrowers of between +3 and -15 basis points. The second strand
considers more generally the impact of bank capital on lending. Empirical papers in this strand of the
literature find a positive relationship between bank capital (and capital ratios) on lending, though the
estimates of the size of the effect are also less clear. For example, Bernanke and Lown (1999) find sizable
effects of capital on the lending of U.S. banks in the early 1990s, whereas Francis and Osborne (2009) for
U.K. banks and Berrospide and Edge (2010), and Carlson, Shan, and Warusawitharana (2013) for U.S.
banks find modest effects.
The positive impact of capital buffers on loan growth is consistent with a negative effect of higher
capital requirements, because increasing the capital requirements relative to existing capital ratios would
reduce the capital buffer of some institutions, all else equal. Thus, combining these strands of research,
the important financial stability implication is that banks with large buffers of capital relative to their
regulatory minimums are most likely to maintain credit supply through a downturn. Ensuring that banks
maintain a buffer over the regulatory minimum even during a protracted and severe downturn is precisely
the goal of the stress tests.
More recent empirical papers in this literature take advantage of the availability of loan-level data
from the largest U.S. BHCs that are collected for supervisory purposes. Calem, Correa, and Lee (2017)
10
study the impact of several prudential policies on the credit supply of U.S. banks, including the impact of
CCAR stress tests on the jumbo mortgage market. They find that the 2011 CCAR stress test exercise
reduced jumbo mortgage originations and approval rates, possibly due to the generally weak capital
positions at CCAR banks.
In a similar vein, Berrospide and Edge (2017) examine the impact of the U.S. post-crisis
regulatory reform on the lending of both BHCs subject to the higher capital requirements implied by the
Basel III capital standards and the largest BHCs subject to the CCAR stress tests. Using matched firm-
level data across the largest banks to separate the impact of credit supply shocks implied by the
supervisory stress tests from loan demand changes at the firm level, they find that the unanticipated
reduction in regulatory capital implied by the stress tests, made public for the first time in the 2012 CCAR
exercise, led to a significant reduction in C&I lending.10 Similarly, and using a separate analysis on
smaller banks subject to Basel III capital rules, they find that the reduction in capital buffers implicit in
the announcement of Basel III rules in June 2012 and July 2013 led to a reduction in lending across
multiple loan categories.
Our paper is related to recent work analyzing specifically the impact of stress tests on bank
lending. Using micro-level data from syndicated loan markets, Chu, Zhang, and Zhao (2017) find a
positive relationship between bank capital and lending. Our paper also examines the lending implications
of the Fed’s stress tests, but we examine the implications of the higher capital implied by the stress test
relative to the level of capital in the banks’ own stress tests. Another important difference with their paper
is that we follow a broader approach by studying the lending implications of stress tests on different loan
categories.
Our paper is also related to Flannery, Hirtle, and Kovner (2017). These authors study the impact
of stress tests disclosures on information production about both BHCs and the overall banking industry
and find that the disclosure of stress tests results consistently provides material information to investors,
particularly for highly leveraged and riskier BHCs. They also study the impact of the severity of stress
tests on asset and loan growth by comparing Federal Reserve’s estimated loan losses and the BHC’s own
estimated loan losses. However, their emphasis on loss estimates specific to the loan category overstates
the impact of the stress tests on economic capital allocations. The stress tests also account for revenue
generated by lending operations to offset expected losses, so firms should consider that offset in assigning
economic capital. Therefore, we focus more broadly on the changes in overall capital ratios. In addition,
we extend their results using data on lending standards across loan categories.
10 Unlike the unanticipated reduction in regulatory capital implied by the 2012 stress tests in Berrospide and Edge (2017), in this paper we use the difference between the minimum post-stress regulatory capital ratios in the Federal Reserve’s and the BHCs’ own stress tests exercises.
11
Another closely related work is a recent research note by The Clearing House (TCH), which
argues that the stress tests impose granular capital requirements that force banks to curtail and distort the
provision of credit, especially residential mortgages and small business loans. Our findings, however,
suggest that the larger capital implied by the stress tests has little impact on loan growth at stress tested
banks. Unlike the TCH note, we account for differences in risk characteristics of the loan portfolios, using
publically available data on delinquency rates. This omission on the TCH note could be particularly
problematic for their conclusion on residential mortgage lending, given that a number of banks still have
large amounts of delinquent legacy mortgages on their balance sheets that embed lessons about the
inherent riskiness of such lending. In addition, part of the reduction in residential mortgage lending may
be explained by other regulations introduced to prevent the type of risky mortgage lending that
precipitated the crisis.
4. Methodology
4.1 Regulatory capital ratios in the absence of stress tests
We assess the impact of stress tests on BHC lending by developing a counterfactual aimed at answering
the following question: “What would regulatory capital ratios look like in the absence of the supervisory
stress tests?” Because stress testing has become a best practice in risk management, we assume that large
banks would still be required by regulators to run their own stress tests and to use the results of those tests
in their risk management framework. Indeed, recent commentary from politicians and banking industry
representatives implies that banks do incorporate the capital ratios determined by their own models in
their decision-making frameworks.11 To maintain comparability, we use the results of the bank-run stress
tests using the Fed’s CCAR scenarios.
We construct the counterfactual by comparing the lowest capital ratio (Common Equity Tier 1 or
CET1 capital ratio) observed during the stress test horizon in the BHC’s own exercise to that observed in
the Fed’s supervisory stress test exercise.12 We call this difference the “capital gap”:
1 1 (1)
11 For example, during Chair Yellen’s Congressional Testimony on February 14, 2017, Senator Toomey argued that CCAR might be somewhat duplicative considering that banks do their own stress testing. 12 The stress test is conducted by forecasting quarterly revenues, expenses, changes in the amount of outstanding loans and losses on loans and other investments. Those are then used to compute the capital ratio at the end of each quarter; we use the minimum ratio observed over that period. Notice that the minimum capital ratios in both exercises are comparable as they are both intended to meet the DFA requirements. For example, in the Fed’s exercise and the BHC’s exercise, capital ratios are calculated using the same individual capital distribution assumptions (e.g., DFAST) under the same supervisory scenarios published by the Federal Reserve.
12
Figure 3 illustrates the calculation of the capital gap. We use information for Morgan Stanley in
the 2015 stress testing exercise. The bank started the exercise with a CET1 ratio of 15.2 percent (grey
bar). Using its own models with the Fed’s severely adverse scenario, Morgan Stanley estimates a post-
stress minimum capital ratio of 8.6 percent (green bar), that is, an implied maximum drop in CET1 of 6.6
percentage points. The minimum post-stress CET1 in the supervisory stress test exercise (that is, using the
Federal Reserve’s models with the Fed’s severely adverse scenario) is 6.3 percent (blue bar), implying a
more severe maximum drop in the capital ratio (8.9 percentage points). The capital gap is the difference
in post-stress minimum capital ratios, which in this example equals 2.3 percentage points (red bar).
The capital gap can be thought of as the capital buffer (e.g., extra capital) that each BHC must
employ as a result of the supervisory stress tests typically being more stringent than their own models. In
our view, constructed that way, the capital gap should be exogenous, as the banks do not know the exact
structure of the Federal Reserve’s stress test models or have advance notice of the supervisory severely
adverse scenario.
Figure 4 depicts the distribution of the CET1 gap for the CCAR banks between 2015 and 2017.
The capital gap, on average, is relatively small, about 0.7 percentage points. Notice also that the capital
gap is negative for some banks, which means that for these banks, the minimum capital in the Fed’s
exercise is larger, or equivalently, that banks project higher capital losses than the losses in the
supervisory stress tests.
The actual capital ratio (CET1) at the start of the stress test exercise can then be decomposed into
the capital ratio that the bank would employ in the absence of the Fed’s stress tests, i.e., the amount
suggested by their own models, and the capital gap. In the example above, Morgan Stanley’s starting
CET1 ratio of 15.2 percent in 2015 can be decomposed into the capital gap of 2.3 percent and the CET1
ratio suggested by its own model of 12.9 percent. The latter ratio (12.9 percent) is our counterfactual
capital ratio.
Figure 5 shows the counterfactual capital ratios for the average CCAR bank over time. In these
charts, the blue line is the actual capital ratio and the orange line is the counterfactual capital, that is, the
difference between the two is the capital gap. Thus, if banks were subject only to their own stress tests,
this counterfactual indicates that their capital ratios could have been much lower during earlier years,
though capital ratios have converged over time, and more so in 2017.13 As discussed before, non-CCAR
13 Studying the reasons for such convergence is beyond the scope of this paper. For that purpose, see Hirtle and Kovner (2014).
13
banks conduct their own company-run stress tests and are not subject to the supervisory stress tests.
Hence, the capital gap for these banks is zero.
Figure 6 presents evidence that the capital gap contributes to an increase in banks’ regulatory
capital after the implementation of stress tests. Immediately after the crisis, all banks quickly increased
their CET1 ratios. However, after 2012, banks with a large capital gap on average (blue line) continue to
build their regulatory capital ratios relative to banks with a small capital gap (orange line). For these later
banks, the CET1 ratio increased up to about 12 percent in 2013 and hovered around that level afterwards.
Next, we turn to the question of whether the capital gap is restricting bank lending.
4.2. Empirical analysis
We study the impact of supervisory stress tests on bank loan growth by exploiting the different
implementation of the stress tests across bank size categories. First, we compare the historic path of loan
growth of banks subject to the supervisory stress test exercise (CCAR banks) with banks not subject to
the exercise (non-CCAR banks, our control group). For this comparison, we consider both the full panel
of about 95 banks as well as a subsample of those banks that have more homogeneous business models
(BHCs with size between $20 and $200 billion). The analysis also covers multiple loan categories: total,
commercial and industrial (C&I), commercial real estate (CRE), residential real estate (RRE), small
business, and consumer loans.
By construction, non-CCAR banks have a capital gap of zero percent; they are free to employ
only as much of a buffer over regulatory minimums as they deem appropriate, and may or may not
incorporate their stress test results in that calculation. Because some of the CCAR banks have a negative
capital gap –that is, their own stress tests are more stringent than the supervisory tests for their portfolio–,
adding this large group of banks with a zero percent gap may add some statistical power to the tests.
However, because the number of such banks relative to the number of CCAR banks with a near-zero or
negative gap is large, the zero capital gap in that sample may be capturing many factors related to size,
including all of the differences in post-crisis regulation across banks with more than $50 billion in total
assets. Thus, the loan growth just within the CCAR banks serves as an additional test of whether banks
with a larger capital gap restrict their lending more than banks with smaller capital gaps. As in the larger
sample, the analysis covers multiple loan categories.
We start with a panel regression specification, which is common in the empirical literature on the
impact of bank capital on lending, given by:
∆ (2)
14
As explained in section 4.1, the actual Capital Ratio (CET1 ratio) in the expression above can be
decomposed as:
(3)
where Capital Ratio Adjusted is the capital ratio that the bank’s internal models would suggest in the
absence of the Fed’s stress tests (the counterfactual capital ratio) and the Capital Gap is defined by
equation (1).
Substituting (3) in (2), yields the following panel regression specification to estimate the impact of the
capital gap on bank lending:
∆ CapitalGap
(4)
In this specification, the dependent variable is the annual growth rate of loans of BHC i in year t,
expressed as a function of the Capital Ratio Adjusted and the Capital Gap, both measured at the
beginning of the stress test exercise. These two are the main variables of interest in our analysis. We
include the following lagged bank-specific controls in vector Xi, t-1: size (log of total assets), the ratio of
nonperforming loans to total loans (and, alternatively, the net charge-offs to total assets ratio), return on
assets (ROA), and the ratio of deposit liabilities to total assets. We also include measures of economic
activity at the state level, a set of BHC-specific variables constructed by weighting state-level economic
measures such as personal income growth, home price growth, and unemployment rates with bank deposit
shares in each of the 50 states in which the bank operates. Some bank controls in the loan-category
regressions, such as the nonperforming loan ratio (and net charge-offs ratio), are calculated for different
loan categories to help control for some loan-type-specific characteristics.
The full sample regression also includes both bank fixed effects (BHCi), to account for time-
invariant and unobserved heterogeneity across banks, and time fixed effects (T), to account for any other
macroeconomic changes that affect all banks equally and simultaneously. The smaller sample of CCAR
banks only is somewhat constrained by the number of observations, as it includes about 30 BHCs during
5 years (about 132 observations). For that reason, the specification still includes year fixed effects but not
firm fixed effects.
We expect a positive coefficient on the capital ratio, as suggested by previous findings in the
bank capital literature. According to the risk mitigation hypothesis, we would expect a negative
coefficient on the capital gap, consistent with the view that the extra capital implied by the stress tests
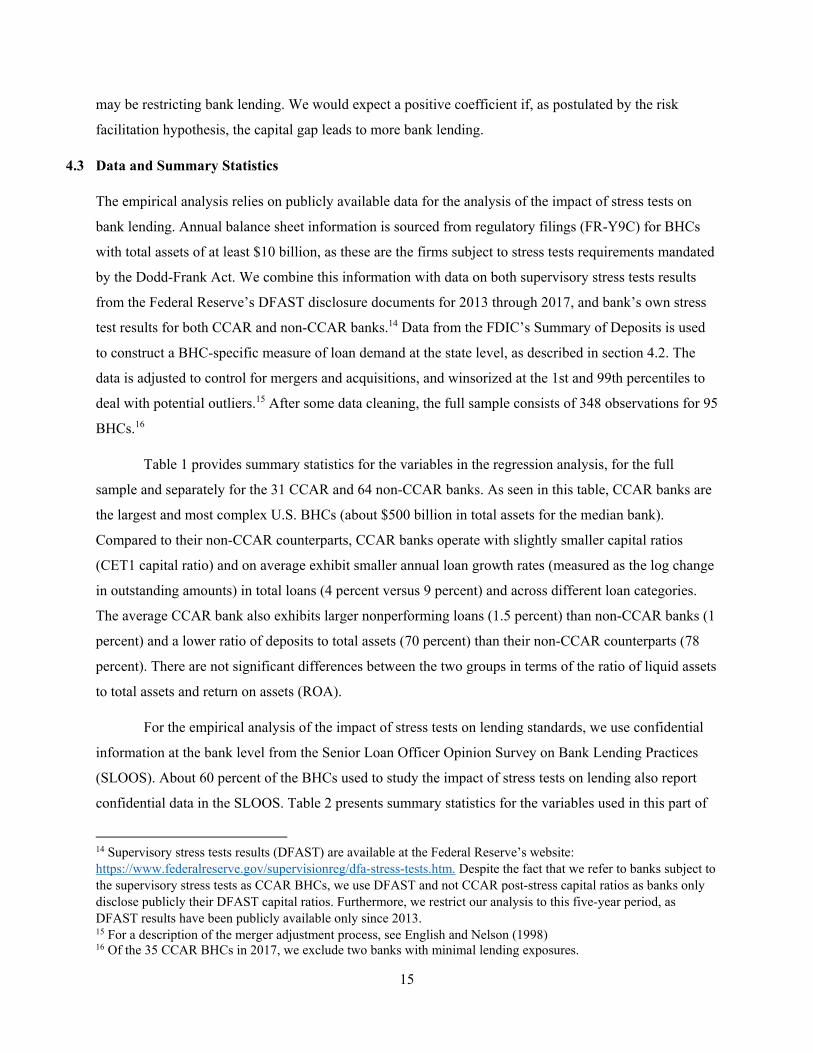
15
may be restricting bank lending. We would expect a positive coefficient if, as postulated by the risk
facilitation hypothesis, the capital gap leads to more bank lending.
4.3 Data and Summary Statistics
The empirical analysis relies on publicly available data for the analysis of the impact of stress tests on
bank lending. Annual balance sheet information is sourced from regulatory filings (FR-Y9C) for BHCs
with total assets of at least $10 billion, as these are the firms subject to stress tests requirements mandated
by the Dodd-Frank Act. We combine this information with data on both supervisory stress tests results
from the Federal Reserve’s DFAST disclosure documents for 2013 through 2017, and bank’s own stress
test results for both CCAR and non-CCAR banks.14 Data from the FDIC’s Summary of Deposits is used
to construct a BHC-specific measure of loan demand at the state level, as described in section 4.2. The
data is adjusted to control for mergers and acquisitions, and winsorized at the 1st and 99th percentiles to
deal with potential outliers.15 After some data cleaning, the full sample consists of 348 observations for 95
BHCs.16
Table 1 provides summary statistics for the variables in the regression analysis, for the full
sample and separately for the 31 CCAR and 64 non-CCAR banks. As seen in this table, CCAR banks are
the largest and most complex U.S. BHCs (about $500 billion in total assets for the median bank).
Compared to their non-CCAR counterparts, CCAR banks operate with slightly smaller capital ratios
(CET1 capital ratio) and on average exhibit smaller annual loan growth rates (measured as the log change
in outstanding amounts) in total loans (4 percent versus 9 percent) and across different loan categories.
The average CCAR bank also exhibits larger nonperforming loans (1.5 percent) than non-CCAR banks (1
percent) and a lower ratio of deposits to total assets (70 percent) than their non-CCAR counterparts (78
percent). There are not significant differences between the two groups in terms of the ratio of liquid assets
to total assets and return on assets (ROA).
For the empirical analysis of the impact of stress tests on lending standards, we use confidential
information at the bank level from the Senior Loan Officer Opinion Survey on Bank Lending Practices
(SLOOS). About 60 percent of the BHCs used to study the impact of stress tests on lending also report
confidential data in the SLOOS. Table 2 presents summary statistics for the variables used in this part of
14 Supervisory stress tests results (DFAST) are available at the Federal Reserve’s website: https://www.federalreserve.gov/supervisionreg/dfa-stress-tests.htm. Despite the fact that we refer to banks subject to the supervisory stress tests as CCAR BHCs, we use DFAST and not CCAR post-stress capital ratios as banks only disclose publicly their DFAST capital ratios. Furthermore, we restrict our analysis to this five-year period, as DFAST results have been publicly available only since 2013. 15 For a description of the merger adjustment process, see English and Nelson (1998) 16 Of the 35 CCAR BHCs in 2017, we exclude two banks with minimal lending exposures.
16
the analysis. The top panel of the table shows annual data on the level of lending standards. On net over
the sample period, banks have maintained tighter standards relative to the mid-point of the range from
2005 to present for commercial real estate loans, prime jumbo mortgages, and Home Equity Lines of
Credit (HELOC). However, standards have been easier than that midpoint for leveraged loans and small
business loans. The bottom panel in the table reports the average weighted quarterly changes in lending
standards and loan demand. These numbers indicate that on net 3.7 percent more bank-quarter responses
have indicated that standards have eased, and 5.2 percent more indicated that loan demand has
strengthened over the sample period.
4.4 Univariate Analysis
We start investigating the impact of stress tests on the lending of banks by comparing the annual loan
growth between 2013 and 2017 for different categories: commercial and industrial (C&I), commercial
real estate (CRE), residential real estate (RRE), small business, and consumer loans, for both CCAR and
non-CCAR banks. We also compare loan growth across different loan categories by splitting banks into
groups based on complexity measures and existing regulatory capital ratios.
Table 3 shows these results. The top left panel shows the comparison between the CCAR banks
and non-CCAR banks. Non-CCAR banks have slightly higher capital ratios than CCAR banks and the
growth rate of total loans for these banks almost doubles that of their CCAR counterparts, a statistically
significant difference. The non-CCAR banks also exhibit faster growth in each of the disaggregated loan
categories, consistent with Figure 2, but most of these differences in loan growth are not statistically
significant. Thus, the more highly capitalized regional banks exhibited faster loan growth.
The other three panels in Table 3 examine loan growth across different bank groups within the 31
CCAR banks. The top right panel compares the average growth rates of loans between the global
systemically important banks (GSIB) and the non-GSIB banks that are subject to CCAR. This
comparison is motivated by the higher capital requirements applied to GSIBs outside of the CCAR
process, in order to illuminate any differences that might arise from those policies independently of the
stress test regime. Indeed, GSIB banks have higher regulatory capital ratios than the non-GSIB banks and
lend more across all of the different categories of loans to nonfinancial businesses and households (core
loans), but slower growth in other loans (not shown). 17 The differences in growth rates across those loan
17 Other loans such as loans to depository and nondepository financial institutions, loans to foreign governments, and lease financial receivables are excluded. This helps explain the divergence between total loan growth and loan growth across all the loan categories we consider.
17
categories range between 3.2 and 8 percentage points and are statistically significant for C&I, CRE and
RRE loans.
The bottom left panel compares the average loan growth of CCAR banks grouped by whether or
not they are subject to the advanced approaches capital framework. The advanced approaches bank group
includes the GSIBs as well as a handful of other banks with total assets greater than $250 billion or
foreign assets greater than $10 billion. They are subject to stricter capital and liquidity regulation
compared to non-advanced approaches banks, and they exhibit higher capital ratios on average.
Advanced approaches banks also seem to lend more to the nonfinancial sector than smaller CCAR banks.
These banks exhibit significantly larger growth rates on C&I, CRE, and small business loans relative to
their non-advanced-approaches CCAR peers.
Finally, the bottom right panel compares the average loan growth of CCAR banks grouped not by
size but rather by high (above the median) versus low (below the median) CET1 capital ratios. Banks with
higher CET1 ratios have significantly larger growth in total loans, and the difference in loan growth is
particularly large for CRE and RRE loans. Thus, our univariate analysis suggests that more highly
capitalized banks experience faster loan growth independently of whether they are subject to CCAR.
5. Econometric Results
5.1 Comparing loan growth between CCAR and Non-CCAR banks
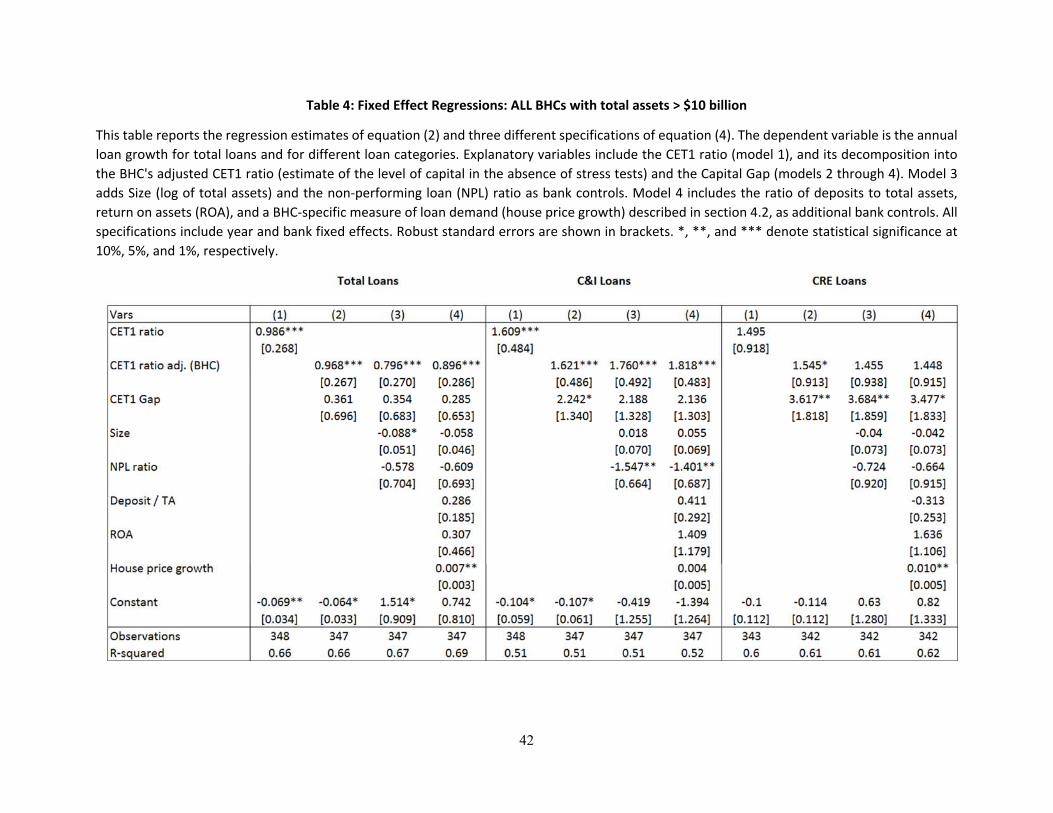
Table 4 presents our regression results for the full sample of banks that run stress tests, that is, for all
BHCs in our sample using specification (2) and three different extensions of specification (4), for total
loans and across different loan categories. As noted above, all specifications with this sample include year
and bank fixed effects. All explanatory variables enter the regression specification with a lag, that is, they
are measured as of December of the previous year of the stress test exercise. For each loan category,
column (1) includes the impact of the capital ratio (CET1 ratio) only. Column (2) uses the counterfactual
and decomposes the impact of the capital ratio into the adjusted CET1 ratio and the capital gap. As
discussed in section 4, the capital gap varies across CCAR banks and is zero for non-CCAR banks, and
thus captures the impact of the supervisory stress tests. Columns (3) and (4) add bank-specific controls to
the variables in Column (2): size, the non-performing loan ratio (90-day past due and non-accrual loans
over loans outstanding in the specific category), the deposits-to-assets ratio, return on assets (ROA), and
the BHC-specific loan demand control (weighted-average house price growth in states where the bank
maintains branches).
18
In specification (1), the CET1 capital ratio enters the regression with a positive sign and is
significant for almost all but one loan category. More importantly, in columns (2) through (4) the impact
of the capital gap is generally positive and statistically insignificant. The only exception is that the gap is
positive and strongly significant (at the 5 percent level) for CRE loans, even with all of the other controls
included, in column 4. The economic magnitude of that effect is large, with a 1 percentage point increase
in the capital gap associated with about a 3.5 percentage point increase in the growth rate of CRE loans.
Thus, the additional capital buffer resulting from differences between the bank and the Fed's stress tests is
not associated with any statistically significant reduction in lending, and may instead be spurring lending
in certain categories, such as CRE loans.
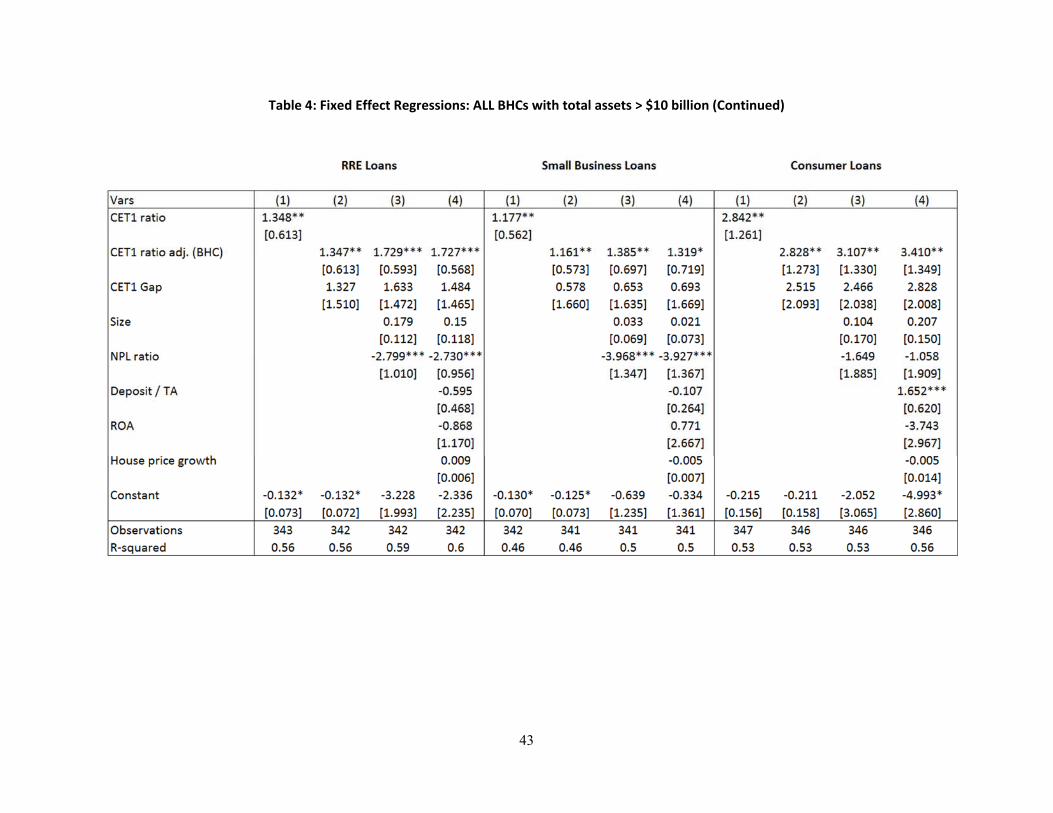
Loan growth rates also seem to be explained by factors beyond just the capital implications of the
stress tests. These factors, captured by bank and time fixed effects, and bank controls in our regression
analysis, include loan demand, risk aversion, credit quality, and funding sources. In particular, non-
performing loans has an economically meaningful and significant effect for several loan categories across
different specifications. In addition, the BHC-specific measure of state-level economic performance
(house price growth), and thus a proxy for loan demand, is positive (as expected) and statistically
significant for both total loans and CRE loans.
We interpret these results as empirical evidence against the risk mitigation hypothesis. These
results suggest that the capital implications of stress testing are not unduly restricting loan growth. This
evidence also confirms previous findings in the literature that BHCs with higher capital ratios, all else
equal, experience modestly higher loan growth across different loan categories. Using our estimates in
column (4) for total loans, a 1 percentage point increase in CET1 capital ratios (e.g., from 12 to 13
percent for the average banks) leads to a modest 1 percentage point increase in total annual loan growth
(e.g., from 6 to 7 percent for the average bank). The point estimate of the effect is a little bigger across
most of the disaggregated loan categories (between 1.3 and 1.8 percent), and significantly larger for
consumer loans (about 3 percentage points).
5.2.1 Similarly sized banks
One potential drawback in this analysis is that the CCAR and non-CCAR bank comparison may be less
relevant for the largest CCAR banks. In other words, the CCAR bank group includes the largest and most
complex banks (e.g., GSIB), whose size and business models are very different from those of the smaller
and less complex non-CCAR banks. In addition, the GSIB surcharge added to the Capital Conservation
Buffer (CCB) incentivizes those banks to fund assets with more capital than other banks irrespective of
their stress test results. In order to alleviate this concern, we extend the above analysis by looking only at
19
the subset of banks with assets between $20 billion and $200 billion that are more similar in size and
business models.18
Table 5 shows the regression results for this restricted sample of BHCs using specification (2)
and three different extensions of specification (4), across different loan categories. Unlike Table 4, and
given the smaller number of observations in the restricted sample, we only include year fixed effects. As
before, the coefficient on CET1 capital ratios is positive across all specifications though the statistical
significance for most loan categories is lower. However, using estimates in column (4), the coefficient on
the capital gap for this group of banks is mixed. As before, the capital gap is positive but statistically
insignificant for the categories of small business loans and consumer loans, and large, positive, and
significant for CRE loans. However, the coefficient is negative and insignificant for residential real estate
loans and for C&I loans. For total loans, the effect is negative and marginally significant, but
economically modest after including all other controls, with 1 percentage point decline in loan growth
associated with 1 percentage point higher capital gap. This result would be fully consistent with the goals
of the post-crisis reforms, which were to eliminate some of the competitive advantages large banks
enjoyed because of the perception that they were too-big-to-fail. One logical consequence of reducing
that subsidy would be slower loan growth at those banks, balanced by higher loan growth at other banks.
For this bank group, the loan growth across different loan categories seems to be more
consistently explained by bank controls such as size, nonperforming loans, deposits, and our control for
loan demand, likely in part due to the omission of bank fixed effects from the specification. These
findings confirm that other factors beyond the stress tests likely account for the slower loan growth at
CCAR banks relative to their non-CCAR counterparts.
In particular, the measure of credit quality—the non-performing loan ratio—is negative and
strongly significant for several loan categories, and it appears to be the most important determinant of the
annual growth of RRE loans.19 This finding is consistent with the conjecture in the introduction that RRE
growth is affected by each bank’s crisis experience. As shown in the left chart of Figure 7, delinquency
rates on mortgage loans remain elevated at CCAR banks, and that seems to discourage higher RRE loan
growth.20 Further, the negative and significant coefficient on size in total loans and CRE loans likely does
18 We repeat the analysis using other size thresholds such as $20 to $150 billion, $30 to $150, and $30 to $200 billion and obtain qualitatively similar results. 19 We obtain similar results if instead of the non-performing loan ratio we use the ratio of net charge-offs to total assets as an alternative measure of credit quality in our regression specification. 20 Beyond higher delinquency rates on mortgage loans, mortgage repurchases due to breaches of warranties and representations associated with mortgage securitization around the times of the financial crisis seem to add downward pressure on RRE loan growth. See Vojtech (2017).
20
not reflect a new relationship. For instance, as shown in the right chart of Figure 7, cumulative growth for
CRE loans also had been larger at non-CCAR banks (blue line) between 2001 and 2006.
5.2.2 Loan growth among CCAR banks
This section focuses only on CCAR banks to study whether supervisory stress tests restrain loan growth.
The main idea behind this analysis is that for banks subject to the supervisory stress tests, the difference
in minimum capital ratios between BHCs’ stress tests and the Fed’s stress tests more clearly convey
unique information about the severity of the stress tests on individual banks rather than a general effect
related to bank size. Thus, the coefficient is a cleaner estimate of the differential impact of the incentives
for greater capital accretion from stress tests on individual banks’ lending decisions.
Table 6 shows the regression results for the sample of 31 CCAR banks, again using specifications
(2) and three extensions of specification (4), across different loan categories. As in Table 5, given the
restricted number of observations for this sample, we only include year fixed effects.21 The positive and
significant coefficient on the CET1 ratio for total loans and for some loan categories such as C&I and
CRE, suggests, as before, that among the largest and most complex institutions, banks with higher capital
ratios tend to lend more. Using again the estimates in column (4), our results suggest that a 1-percentage-
point increase in the adjusted CET1 ratio for CCAR banks leads to about 0.4 percentage point higher
annual growth rate of total loans. The effect is larger for C&I and CRE loans (between 1 and 1.3
percentage points).
Interestingly, consistent with the risk facilitation hypothesis, the coefficient on the capital gap
(CET1 gap) is more uniformly positive for the sample of CCAR banks than for the broader sample across
the different loan categories though significant in only two of them. Using the estimates in column (4),
the coefficient on the capital gap is positive and significant for CRE loans. A 1 percentage point increase
in the capital gap boosts CRE loan growth by about 4 percentage points.
The results are also positive and statistically significant for consumer loans, with roughly the
same economic magnitude. Thus, even limiting the sample to just CCAR banks, we find that even when
supervisory stress tests results are more stringent than the BHC’s-own stress tests results, loan growth is
not affected adversely and instead seems to be higher for certain loan categories, all else equal. In
addition, among CCAR banks, bank-specific characteristics such as non-performing loans, deposits, and
ROA, which capture differences in bank risk aversion, credit quality, and funding sources seem important
21 It is possible that the yearly fixed effects are capturing some variation in the stress test framework from year to year, but for this to be an issue, the variation in scenario variables would have to have quite different implications within the bank’s models and the Fed’s supervisory models. We view such a dichotomy as unlikely.
21
explanatory variables for the annual growth rate of different loan categories, and may help explain the
unconditional differences in loan growth observed across bank groups.
Put together, our analysis provides evidence against the risk mitigation hypothesis, that is, we
find no support for the notion that funding loans with additional capital in order to satisfy the
requirements of supervisory stress tests is restricting bank lending. We also find only some evidence of
significant changes in the allocation of credit across loan categories.
5.3 Effect of Capital on Lending Standards
The generally nonnegative relationship between capital and loan growth estimated in the preceding
section could be spurious if banks that have greater lending opportunities were somehow correlated with
higher capital gaps, and the controls for loan demand were insufficient. In order to isolate more clearly
the effect of the capital gap on credit supply, this section investigates whether the stringency of the stress
tests affects loan growth through changes in lending standards. These changes reflect the policies that
banks use in their decisions to approve credit for households and business, such as credit score cutoffs,
documentation requirements, and guarantor requirements. Since 2010, the July edition of the Federal
Reserve’s SLOOS has included a set of questions in which banks are asked to provide, for a range of loan
categories, the current level of their lending standards relative to the midpoint of their range—considering
the tightest and easiest they have been—since 2005.
These responses take one of seven values: 1) easiest, 2) significantly easier than the midpoint, 3)
somewhat easier than the midpoint, 4) about at the midpoint, 5) somewhat tighter than the midpoint, 6)
significantly tighter than the midpoint, 7) tightest. Due to the relatively few responses in the tightest and
easiest baskets for most loan categories, categories 1 and 2 are combined, as are categories 6 and 7, for a
total of five categories. We use these ordinal responses as the dependent variable in a set of ordered logit
regressions and test for whether the capital gap affects the level of lending standards. The categories
change slightly from year to year, However, consistent series exist for 12 different loan categories,
including, non-investment-grade syndicated loans, small business loans, three types of commercial real
estate loans (construction and land development, backed by nonfarm, nonresidential properties, backed by
multifamily properties), prime jumbo residential mortgages, home equity loans and lines of credit, credit
cards (prime and subprime), auto loans (prime and subprime), and other consumer loans. In addition to
the CET 1 ratio and the capital gap, the regressions include bank and year fixed effects, the ratio of
nonperforming loans to total loans for the associated category.
The left panel of Table 7 reports the marginal effect of a 1 percentage point increase in the capital
gap on the probability of being in one of the five categories of lending-standard stringency defined above.
22
For most loan categories listed above, the effect of the capital gap on lending standards is not statistically
significant. However, for two categories of C&I loans—leveraged syndicated loans and small business
loans—a larger capital gap is associated with a significantly higher probability of having standards that
are easier than the midpoint since 2005, and a significantly lower probability of having standards that are
tighter than the midpoint. For instance, a 1 percentage point increase in the capital gap is associated with
a nearly 12 percentage point increase (the sum of the marginal effects on significantly easier and
somewhat easier) in the probability that the bank has maintained lending standards for those riskier types
of C&I loan customers over 2013 through 2017 that were easier than the midpoint of their range between
2005 to 2017.
These regressions can also reinforce the restraining effect of a legacy portfolio of nonperforming
loans on certain types of lending, especially residential mortgages and HELOC. As shown in the right
panel of the table, a larger ratio of nonperforming mortgage loans to total mortgage loans held by a bank
is associated with a higher probability of maintaining standards for jumbo mortgage loans and HELOC
that are tighter than the midpoint, and a lower probability of having standards for such loans that are
easier than the midpoint. A similarly strong effect is found for standards applied to small business loans.
The exercise can also be conducted for overall annual changes in lending standards using an
average of the index of the quarterly changes in standards across all loan categories, as in Bassett et al.
(2014). Both the levels and the changes in standards can convey important independent information
about the state of credit availability (Bassett and Rezende, 2015). We run a regression of the average
change in the index of standards over the year following the effective date of the stress tests on the capital
gap and other controls (bank and time fixed effects, the CET1 ratio, an analogous index of demand, and
ratio of total nonperforming loans to total loans). As shown in Table 8, a higher capital gap is associated
with a marginally significant easing in lending standards over the subsequent year. In specification (4),
which includes the reported average change in demand over the year, the capital gap is still positive, but
the effect is statistically insignificant. The result reinforces the importance of demand in explaining bank
lending.
In short, and in contrast to the risk mitigation hypothesis, we find no evidence that the extra
capital implied by the results of the supervisory stress tests (capital gap) is causing banks to tighten their
lending standards. If anything, the results seem to be consistent with the risk facilitation hypothesis and
suggest that relative to their non-CCAR counterparts, CCAR banks for whom the supervisory stress test
results are more stringent than their internal test results tend to ease their lending standards on some loan
categories.
23
5.4 Discussion
Our results are consistent with previous findings in the literature supporting the view that higher capital is
positively associated with stronger loan growth. Our interpretation is that the higher capital buffers that
result from the new regulatory framework, which make banks safer and more resilient, altogether do not
restrict lending and may put banks in a better position to lend more, at least for some loan categories.
We argue that the loan growth differences for loan categories such as RRE, CRE and small
business loans between CCAR and non-CCAR banks observed in the data seem to be explained by
factors beyond the stress tests. After we account for those factors (e.g., loan demand and bank specific
characteristics such as non-performing loans and funding sources), we do not find systematic evidence
that the capital calculations associated with the supervisory stress tests explain the differences in loan
growth. Our findings of the impact on lending standards are also consistent with little change in credit
availability as a result of stress testing. Banks with a higher capital gap were somewhat more likely to
have lending standards between 2013 and 2017 that were easier than the midpoint of their bank’s range
between 2005 and 2017.
We also conducted two additional robustness checks. First, we measure annual loan growth
across different loan categories in our regression specifications not as of December of the previous year
but at the quarter immediately after the disclosure of the stress tests results (e.g., March for DFAST 2013
through DFAST 2015, and June for DFAST 2016 and DFAST 2017), and obtain qualitatively similar
results.22 Second, we run our regressions using the change in the capital gap from the previous year—thus
increasing the likelihood that the change represents an unexpected shock to the bank’s capital position.
These results also are consistent with the main results.
Our finding that the capital gap does not restrict bank lending, and may actually spur lending
across certain loan categories, suggests that the higher capital implied by the supervisory stress tests (e.g.,
the capital gap) makes banks safer and more resilient. Consistent with the theory supporting the risk
facilitation hypothesis, one channel through which capital resilience increases banks’ lending capacity is
by lowering their funding costs, which puts them in a better position to take more risks, such as by
loosening their lending standards or increasing the share of loans on the balance sheet. Figure 8 provides
suggestive evidence that the banks with a large capital gap (which also continue to build their regulatory
capital) enjoy lower funding costs (measured by their interest expense ratio), not only during the early
post-crisis period, but also after the implementation of the stress tests in 2012.
22 Explanatory variables in that case enter our regression specifications measured as of the quarter end in which the stress test results are disclosed.
24
A typical concern in the approach we follow to identify the impact of capital regulation is the
potential endogeneity issue in our identification strategy. We partially alleviate endogeneity issues by
lagging our explanatory variables (e.g., using predetermined bank controls). One could argue that our
capital gap measure may still be endogenous to the extent that banks adjust their behavior and try to
mimic the stress testing exercise over time. Indeed, figure 5 shows the potential learning and convergence
of the post-stress capital ratios.
As mentioned above, we think that it is reasonable to interpret the capital gap as exogenous. The
capital gap depends on differences between the Federal Reserve’s models—which are not fully
disclosed—and the bank’s own models. Moreover, each year, the scenario includes an emphasis on
different “salient risks” which are determined by the Federal Reserve and not revealed to banks until after
the date for which stress test data are collected. Therefore, banks cannot adjust their portfolios in order to
improve their performance on the stress tests by minimizing exposure to the salient risks that were chosen
or by optimizing their portfolio to exploit specific modeling assumptions. Further, we believe the capital
gap captures unanticipated effects because convergence towards the Fed’s stress tests numbers may only
be achieved over time.
Another endogeneity concern arises from the possibility that the positive correlation between
bank capital (and the capital gap) and loan growth we observed in the data may be caused by shifts in loan
demand, which we may fail to identify using bank-level data. For example, strong demand may lead
banks to increase their lending and to look better capitalized at the same time if the strong lending driven
by higher loan demand comes with higher retained earnings that also increase banks’ capital positions.
We believe that our analysis across different loan categories and the use of year fixed effects somewhat
alleviates the endogeneity concern to the extent that shifts in loan demand are not perfectly correlated,
and thus are less likely to occur simultaneously across multiple loan categories. Using micro-level data on
corporate C&I loans that match the CCAR banks with their borrowers, and following an approach similar
to previous studies that use credit registry data to account for changes in loan demand, Berrospide and
Edge (2017) find strong positive effects of bank capital on lending. Similarly, using loan-level data from
syndicated loan markets Chu, Zhang, and Zhao (2017) find a positive relationship between bank capital
and lending. This empirical evidence conforms to our results and provides additional validation for the
identified effects in our study.
6. Concluding remarks
We study the impact of the Federal Reserve’s stress tests on the lending of U.S. BHCs. Motivated by
recent claims by various stakeholders, we address the question of whether the extra capital implied by the
25
annual supervisory stress tests may be causing an unwarranted reduction in bank credit, or changing the
allocation of loans in unintended ways. To quantify the impact of the supervisory stress tests, we
construct a measure of the extra capital implied by the supervisory stress tests relative to the banks’ own
models (capital gap).
We test two hypotheses about the impact of the higher share of assets funded by capital post
stress test on banks’ loan growth and their lending standards: (1) the risk mitigation hypothesis, according
to which the additional capital required by the stress tests causes banks to reduce their risk-taking
activities by tightening their lending standards and decreasing their credit supply; and (2) the risk
facilitation hypothesis, according to which the higher capital buffers resulting from the stress tests make
banks more resilient and thus put them in a better position to loosen their lending standards and take more
risks by increasing their lending.
We find no systematic evidence in favor of the risk mitigation hypothesis. Our results suggest that
the capital gap is not constraining bank loan growth or causing banks to tighten their lending standards.
Although loan growth at CCAR banks has been slower than loan growth at their non-CCAR counterparts,
growth differences observed in the data seem to be driven largely by credit quality, as captured by non-
performing loans, and by other factors beyond the stress tests such as loan demand. After controlling for
these factors, we find that the capital gap is not significantly negatively related to the growth of loans, and
in some loan categories and some specifications, the coefficient is actually positive. Furthermore,
consistent with previous results in the bank capital literature, we find that more capital is associated with
higher loan growth. We interpret our results as evidence in favor of the risk facilitation hypothesis. Our
findings suggest that the increased level of capital and the higher capital buffers brought by the post-crisis
regulatory reform, which make banks safer and more resilient, altogether put banks in a better position to
lend more, at least across some loan categories.
26
References
Acharya, V., Berger, A. and R. Roman (2018). “Lending Implications of U.S. Bank Stress Tests: Costs or
Benefits?” Journal of Financial Intermediation, Vol. 34, 58-90.
Acharya, V., Mehran, H. and A. V. Thakor (2016). “Caught between Scylla and Charybdis? Regulating
Bank Leverage When There Is Rent Seeking and Risk Shifting,” The Review of Corporate Finance
Studies, 5 (1) 36–75.
Aiyar, S., Calomiris, C.W., and T. Wieladek (2014). “Does Macro-Prudential Regulation Leak? Evidence
from a UK policy experiment,” Journal of Money, Credit, and Banking 46(1), 181-214
Bassett, W.F. and M. Rezende (2015). "Relation between Levels and Changes in Lending Standards
Reported by Banks in the Senior Loan Officer Opinion Survey on Bank Lending Practices," FEDS Notes
2015-01-16. Board of Governors of the Federal Reserve System.
Bassett, W. F., M. B. Chosak, J. C. Driscoll, and E. Zakrajsek (2014). "Changes in Bank Lending
Standards and the Macroeconomy," Journal of Monetary Economics, vol. 62, 23-40.
Bahaj, S. and F. Malherbe (2016). “A Positive Analysis of Bank Behaviour Under capital Requirements,”
CEPR Discussion Paper No. DP11607. Available at SSRN: https://ssrn.com/abstract=2865877
Bernanke, B., and C. Lown (1991). “The Credit Crunch.” Brookings Papers on Economic Activity 2, 205-
247.
Berrospide, J. M., and R. M. Edge (2010). “The Effects of Bank Capital on Lending: What Do We Know,
and What Does it Mean?” International Journal of Central Banking 6 (4), 5-54.
Berrospide, J. M., and R. M. Edge (2017). “The Effects of Bank Capital Requirements on Lending”.
Working Paper. https://www.aeaweb.org/conference/2017/preliminary/1773?page=3&per-page=50
Brinkmann, E. and Horvitz, P. (1995). “Risk-based capital standards and the credit crunch,” Journal of
Money, Credit, and Banking 27, 848-863.
Calem, P. and R. Rob (1999) “The impact of capital-based regulation on bank risk-taking” Journal of Financial Intermediation 8, 317-352.
Calem, P., Correa, R., and S.J. Lee (2016). “Prudential policies and their impact on credit in the U.S.,”
International Finance Discussion Papers 1186. Board of Governors of the Federal Reserve System.
Common Equity Tier 1 Capital Ratio (Tier 1 Common Equity Ratio before CET1 was reported)
FR Y‐9C For AA banks after 2014:Q1 and non‐AA banks after 2015:Q1 100*BCR0580/BCR1080 else, 100*BCR0730/BCR1080
CET1 Capital Gap
Difference in the minimum post‐stress capital ratios between the Fed’s and the Bank’s own stress tests under the severely adverse scenario
Publicly disclosed Stress Test Results
MinimumBANK ‐ MinimumFED
CET1 ratio adjusted
The actual CET1 ratios observed at the jump‐off point adjusted for the Bank’s capital gap
FR Y‐9C CET1ACTUAL – Capital Gap
Size
The log of total assets FR Y‐9C log(BHCK2170)
Non‐performing Loan Ratio
Ratio of non‐performing loans to total loans FR Y‐9C (BHCK5525 + BHCK5526)/( BHCK5369 + BHCKB528)
30
APPENDIX: Variable Definitions (continued)
Deposits/TA Ratio of deposits to total assets FR Y‐9C 100*(BHDM6636 + BHFN6636 + BHDM6631 + BHFN6631)/BHCK2170
Liq. Assets/TA
Ratio of liquid assets to total assets FR Y‐9C 100*(BHCK0081 + BHCK0395 + BHCK0397 + BHCK1754 + BHCK1773 + BHDMB987 + BHCKB989)/BHCK2170
ROA Measures return on assets as the ratio of annualized net income to average assets
FR Y‐9C 400*BHCK4340/BHCKA224 where the numerator is a quarterly flow
Interest Expense ratio
Ratio of annualized interest expense to total liabilities
FR Y‐9C 400*BHCK4073/BHCK2948 where the numerator is a quarterly flow
C&I Leveraged Loans
Responses to survey questions on the current level of lending standards for C&I leveraged loans relative to the tightest/easiest they have been since 2005
SLOOS Survey The responses take one of the following 5 values: (2) Easiest/Significantly easier than the midpoint, (3) Somewhat easier than the midpoint, (4) About at the midpoint, (5) Somewhat tighter than the midpoint, (6) significantly tighter than the midpoint/Tightest
C&I Small Loans
Responses to survey questions on the current level of lending standards for C&I small business loans relative to the tightest or easiest they have been since 2005
SLOOS Survey The responses take one of the following 5 values: (2) Easiest/Significantly easier than the midpoint, (3) Somewhat easier than the midpoint, (4) About at the midpoint, (5) Somewhat tighter than the midpoint, (6) significantly tighter than the midpoint/Tightest
Nonfarm, Nonresidential CRE
Responses to survey questions on the current level of lending standards for loans backed by nonfarm, nonresidential properties relative to the tightest or easiest they have been since 2005
SLOOS Survey The responses take one of the following 5 values: (2) Easiest/Significantly easier than the midpoint, (3) Somewhat easier than the midpoint, (4) About at the midpoint, (5) Somewhat tighter than the midpoint, (6) significantly tighter than the midpoint/Tightest
Prime Jumbo Mortgages
Responses to survey questions on the current level of lending standards for Prime Jumbo Real Estate Mortgages relative to the tightest or easiest they have been since 2005
SLOOS Survey The responses take one of the following 5 values: (2) Easiest/Significantly easier than the midpoint, (3) Somewhat easier than the midpoint, (4) About at the midpoint, (5) Somewhat tighter than the midpoint, (6) significantly tighter than the midpoint/Tightest
HELOC Responses to the survey questions on the current level of lending standards for Home Equity Loans and Lines of Credit relative to the tightest or easiest they have been since 2005
SLOOS Survey The responses take one of the following 5 values: (2) Easiest/Significantly easier than the midpoint, (3) Somewhat easier than the midpoint, (4) About at the midpoint, (5) Somewhat tighter than the midpoint, (6) significantly tighter than the midpoint/Tightest
Standards Index
Measures overall changes in lending standards using an index of the quarter changes in standards across all loan categories. 1=tighter; 5=easier
SLOOS Survey Taken from “Changes in Bank Lending Standards and the Macroeconomy” by Bassett et al. (2014)
Demand Index
Measures overall changes in demand for loans using an index of the quarter changes in demand across all loan categories. 1=weaker; 5=stronger
SLOOS Survey Taken from “Changes in Bank Lending Standards and the Macroeconomy” by Bassett et al. (2014)
31
Figure 1: CET1 capital ratio for CCAR and non‐CCAR banks
Figure 1 shows the evolution of the Common Equity Tier 1 (CET1) ratio for BHCs in our sample, by CCAR status, between 2002:Q1 and 2016:Q3.
Figure 2: Loan growth across different loan categories: CCAR and non‐CCAR banks
Figure 2 plots BHC’s cumulative loan growth for total loans and for different loan categories, by CCAR status,
between 2011:Q1 and 2017:Q4. Loan levels are normalized to 100 in 2011:Q1.
33
Figure 3: Initial and Post‐Stress minimum CET1 capital ratio in DFAST
Figure 3 plots the initial CET1 capital ratio and the post‐stress minimum ratios for Morgan Stanley in DFAST 2015. The figure compares the minimum ratio in the supervisory (Federal Reserve) stress test exercise and the minimum ratio in the BHC‐run stress test exercise. The capital gap (red bar) is defined as the difference between the two minimum capital ratios in the BHC’s own stress tests (green bar) and the supervisory stress tests (blue bar).
Morgan Stanley: Post‐stress minimum CET1 ratio in DFAST 2015Supervisory versus BHC‐run stress tests
Note: Drop in CET1 ratio: 6.6 8.9 2.3
34
Figure 4: Distribution of Capital Gap in DFAST 2015 ‐ 2017
Figure 4 shows the distribution of the capital gap for CCAR BHCs in DFAST 2015 through 2017. The capital gap is defined as the difference between post stress minimum capital ratios in the BHC’s own stress tests and the Federal Reserve’s stress tests.
35
Figure 5: Counterfactual: CCAR bank CET1 capital ratios with and without CCAR stress tests
Figure 5 plots the actual and counterfactual capital ratios (blue and orange lines, respectively) for the
average CCAR BHC between 2013 and 2017. The actual CET1 ratio incorporates the effect of the stress
tests. The counterfactual capital ratio is the CET1 ratio in the absence of the Fed’s stress tests. The capital
gap is the difference between the blue and the orange lines.
36
Figure 6: CET1 ratio by BHCs with large and small capital gap
Figure 6 plots the CET1 capital ratios for CCAR BHCs with large and small capital gap between 2013 and 2017 (blue and orange lines, respectively).
BHCs with large and small capital gaps are banks for which their 5‐year average capital gap is above or below the median capital gap.
37
Figure 7: Real Estate Loans at CCAR and non‐CCAR banks
Figure 7 plots the average delinquency rate on RRE loans (left chart) and the cumulative growth rate of CRE loans (right chart) for CCAR and non‐CCAR BHCs between 2000 and 2015.
38
Figure 8: Interest Expense ratio by BHCs with large and small capital gap
Figure 8 plots the interest expense ratio for CCAR BHCs with large and small capital gap between 2013 and 2017 (blue and orange lines, respectively). The interest expense ratio is the ratio of annualized interest expenses to total liabilities. BHCs with large and small capital gaps are banks for which their 5‐year average capital gap is above or below the median capital gap.
39
Table 1: Summary Statistics
This table reports summary statistics for the variables in our analysis. It includes the number of observations,
mean, median, standard deviation, minimum and maximum values for BHCs grouped as CCAR, Non‐CCAR, All.
40
Table 2: Summary Statistics for Regressions of Lending Standards on Capital
This table reports summary statistics for the variables in our regression analysis of lending standards. It includes
the number of observations, mean, standard deviation, minimum and maximum values for all BHCs in our
sample.
41
Table 3: Univariate Analysis
This table reports the differences in means of annual loan growth between 2013 and 2017, by loan types, for all BHCs by CCAR status, and for all
CCAR BHCs by GSIB status, complexity (advanced versus non‐advanced approaches), and amount of regulatory capital ratios (high versus low CET1
ratio). It shows the t‐test of the differences in means. *, **, and *** denotes significance at 10%, 5%, and 1%, respectively.
42
Table 4: Fixed Effect Regressions: ALL BHCs with total assets > $10 billion
This table reports the regression estimates of equation (2) and three different specifications of equation (4). The dependent variable is the annual
loan growth for total loans and for different loan categories. Explanatory variables include the CET1 ratio (model 1), and its decomposition into
the BHC's adjusted CET1 ratio (estimate of the level of capital in the absence of stress tests) and the Capital Gap (models 2 through 4). Model 3
adds Size (log of total assets) and the non‐performing loan (NPL) ratio as bank controls. Model 4 includes the ratio of deposits to total assets,
return on assets (ROA), and a BHC‐specific measure of loan demand (house price growth) described in section 4.2, as additional bank controls. All
specifications include year and bank fixed effects. Robust standard errors are shown in brackets. *, **, and *** denote statistical significance at
10%, 5%, and 1%, respectively.
43
Table 4: Fixed Effect Regressions: ALL BHCs with total assets > $10 billion (Continued)
44
Table 5: Pooled OLS Regressions with year fixed effects: BHCs with total assets between $20 and $200 billion
This table reports the regression estimates of equation (2) and 3 different specifications of equation (4), for a restricted subsample of BHCs. This
subsample eliminates the largest and most complex banks (with assets greater than $200 billion) as well as the smaller regional banks (with assets
less than $20 billion). The dependent variable is the annual loan growth for total loans and for different loan categories. Explanatory variables include
the CET1 ratio (model 1), and its decomposition into the BHC's adjusted CET1 ratio (estimate of the level of capital in the absence of stress tests) and
the Capital Gap (models 2 through 4). Model 3 adds Size (log of total assets) and the non‐performing loan (NPL) ratio as bank controls. Model 4
includes the ratio of deposits to total assets, return on assets (ROA), and a BHC‐specific measure of loan demand (house price growth) described in
section 4.2, as additional bank controls. All specifications include year fixed effects. Robust standard errors are shown in brackets. *, **, and ***
denote statistical significance at 10%, 5%, and 1%, respectively.
45
Table 5: Pooled OLS Regressions with year fixed effects: BHCs with total assets between $20 and $200 billion (Continued)
46
Table 6: Pooled OLS Regressions with year fixed effects: CCAR BHCs
This table reports the regression estimates of equation (2) and three different specifications of equation (4) for all CCAR BHCs. The dependent
variable is the annual loan growth for total loans and for different loan categories. Explanatory variables include the CET1 ratio (model 1), and its
decomposition into the BHC's adjusted CET1 ratio (estimate of the level of capital in the absence of stress tests) and the Capital Gap (models 2
through 4). Model 3 adds Size (log of total assets) and the non‐performing loan (NPL) ratio as bank controls. Model 4 includes the ratio of deposits
to total assets, return on assets (ROA), and a BHC‐specific measure of loan demand (house price growth) described in section 4.2, as additional
bank controls. All specifications include year fixed effects. Robust standard errors are shown in brackets. *, **, and *** denote statistical
significance at 10%, 5%, and 1%, respectively.
47
Table 6: Pooled OLS Regressions with year fixed effects: CCAR BHCs (Continued)
48
Table 7: Impact of capital ratios on levels of lending standards at different loan categories BHCs with total assets > $10 billion
This table reports the marginal effect of a 1 percentage point increase in the capital gap or associated ratio of nonperforming loans to total loans
in that category on the probability of a bank reporting that the level of standards was in the associated category. All specifications include bank
and time fixed effects, the ratio of nonperforming loans to total loans in loan category, and the reported loan demand measure in each loan
category. Standard errors are shown in brackets. The level of lending standards is defined relative to the midpoint of the range of standards since
2005. *, **, and *** denote statistical significance at 10%, 5%, and 1%, respectively.
49
Table 8: Impact of capital ratios on the average change in lending standards
BHCs with total assets > $10 billion
This table reports the effect of BHC's capital ratios and the capital gap on the average change in the index of lending standards over the year following the stress tests. Higher values of the index indicate easing of standards. All specifications include bank and time fixed effects, the ratio of nonperforming loans to total loans, and the reported loan demand measure. Standard errors are shown in brackets. *, **, and *** denote statistical significance at 10%, 5%, and 1%, respectively.