LBNL-3276E The Impact of Rate Design and Net Metering on the Bill Savings from Distributed PV for Residential Customers in California Naïm Darghouth, Galen Barbose, Ryan Wiser Environmental Energy Technologies Division April 2010 This work was supported by the Office of Energy Efficiency and Renewable Energy (Solar Energy Technologies Program) and the Office of Electricity Delivery and Energy Reliability (Permitting, Siting, and Analysis Division) of the U.S. Department of Energy under Contract No. DE-AC02-05CH11231. ERNEST ORLANDO LAWRENCE BERKELEY NATIONAL LABORATORY
Transcript
LBNL-3276E
The Impact of Rate Design and Net Metering on the Bill Savings from Distributed PV for Residential Customers in California
Naïm Darghouth, Galen Barbose, Ryan Wiser
Environmental Energy Technologies Division
April 2010
This work was supported by the Office of Energy Efficiency and Renewable Energy (Solar Energy Technologies Program) and the Office of Electricity Delivery and Energy Reliability (Permitting, Siting, and Analysis Division) of the U.S. Department of Energy under Contract No. DE-AC02-05CH11231.
ERNEST ORLANDO LAWRENCE BERKELEY NATIONAL LABORATORY
Disclaimer
This document was prepared as an account of work sponsored by the United States Government. While this document is believed to contain correct information, neither the United States Government nor any agency thereof, nor The Regents of the University of California, nor any of their employees, makes any warranty, express or implied, or assumes any legal responsibility for the accuracy, completeness, or usefulness of any information, apparatus, product, or process disclosed, or represents that its use would not infringe privately owned rights. Reference herein to any specific commercial product, process, or service by its trade name, trademark, manufacturer, or otherwise, does not necessarily constitute or imply its endorsement, recommendation, or favoring by the United States Government or any agency thereof, or The Regents of the University of California. The views and opinions of authors expressed herein do not necessarily state or reflect those of the United States Government or any agency thereof, or The Regents of the University of California. Ernest Orlando Lawrence Berkeley National Laboratory is an equal opportunity employer.
LBNL-3276E
The Impact of Rate Design and Net Metering on the Bill Savings from Distributed PV for Residential Customers in California
Prepared for the Office of Energy Efficiency and Renewable Energy
Solar Energy Technologies Program U.S. Department of Energy
and the
Office of Electricity Delivery and Energy Reliability
Permitting, Siting, and Analysis Division U.S. Department of Energy
Principal Authors
Naïm Darghouth, Galen Barbose, Ryan Wiser
Ernest Orlando Lawrence Berkeley National Laboratory 1 Cyclotron Road, MS 90R4000
Berkeley CA 94720-8136
April 2010
This work was supported by the Office of Energy Efficiency and Renewable Energy (Solar Energy Technologies Program) and the Office of Electricity Delivery and Energy Reliability (Permitting, Siting, and Analysis Division) of the U.S. Department of Energy under Contract No. DE-AC02-05CH11231.
Acknowledgements This work was supported by the Office of Energy Efficiency and Renewable Energy (Solar Energy Technologies Program) and the Office of Electricity Delivery and Energy Reliability (Permitting, Siting, and Analysis Division) of the U.S. Department of Energy under Contract No. DE-AC02-05CH11231. We would particularly like to thank Charlie Hemmeline and Larry Mansueti of the U.S. Department of Energy for their support of this work. We thank Tay Feder for his work on the initial phases of this project. For providing comments on an earlier draft, we thank Tom Beach (Crossborder Energy), Severin Borenstein (U.C. Berkeley), Susan Buller (PG&E), Sachu Constantine (CPUC), Elizabeth Doris (NREL), Kevin Fox (Keys & Fox, LLP), Mark Fulmer (MRW Associates), Wil Grady (SCE), Daniel Hopper (SCE), Tom Kimbis (Solar Foundation), Larry Mansueti (U.S. DOE), Andrew McAllister (California Center for Sustainable Energy), and Molly Sterkel (CPUC). Of course, any remaining omissions or inaccuracies are our own.
2. Data and Analysis Methods ...................................................................................................4
2.1. Utility Tariff Descriptions................................................................................................4 2.1.1. Current Residential Electricity Rates..........................................................................4 2.1.2. Current Net Metering Tariffs .....................................................................................6 2.1.3. The Market Price Referent .........................................................................................6
2.2. Customer Load Data........................................................................................................8 2.3. Simulated PV Generation Data ......................................................................................11 2.4. Utility Bill Calculations .................................................................................................14
2.4.1. Net Metering............................................................................................................14 2.4.2. Alternative PV Compensation Mechanisms .............................................................15
2.5. Value of Bill Savings Metric .........................................................................................18
3. Least-Cost Rate Selection with Net Metering ......................................................................19
3.1. Least-Cost Rate Choice across PV-to-Load Ratios.........................................................19 3.2. Impact of Customer Size and Usage Profile on Least-Cost Rate Option .........................21
4. Bill Savings under Current Retail Rates and Net Metering Rules .........................................24
4.1. Bill Savings under Base-Case Assumptions ...................................................................24 4.2. Net Metering Sensitivity Analyses.................................................................................26
4.2.1. Impact of Sub-Optimal Rate Choice on Bill Savings ................................................26 4.2.2. Impact of PV Panel Orientation on Bill Savings.......................................................28
4.3. Impact of Changes to SCE’s TOU Rates on the Bill Savings under Net Metering ..........29 4.4. Maximum PV Size to Exhaust Annual Bill Savings .......................................................30
5. Bill Savings under Alternative PV Compensation Mechanisms ...........................................32
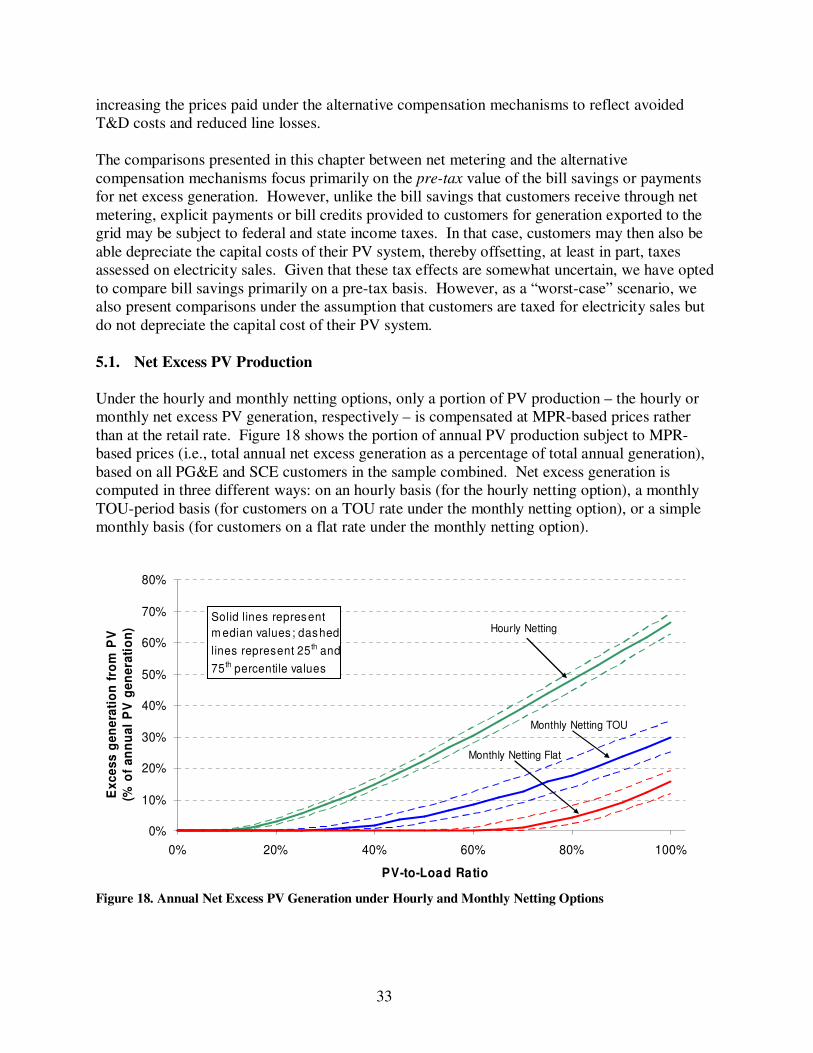
5.1. Net Excess PV Production .............................................................................................33 5.2. Least-Cost Rate Choice under Alternative Compensation Mechanisms ..........................34 5.3. Comparison of Bill Savings between Net Metering and Alternative Compensation
5.4. The Potential Bill Savings Impact of Accounting for Avoided T&D Costs and Reduced Line Losses ...................................................................................................................40
6. Conclusions and Policy Implications ...................................................................................43
Figure ES-1. Distribution in Bill Savings under Net Metering and Base-Case Assumptions ........x Figure ES-2. Variation in Bill Savings with Customer Gross Annual Consumption.....................x Figure ES-3. Difference in Bill Savings between Alternative PV Compensation Mechanisms and
Net Metering ..................................................................................................................... xiii Figure 1. Prices under Current PG&E and SCE Residential Retail Rates .....................................5 Figure 2. Distribution in Average Monthly Consumption across Customers in Data Sample........9 Figure 3. Customer Sample Distribution by Usage Tier .............................................................10 Figure 4. Customer Load Distribution by TOU Period...............................................................11 Figure 5. Distribution of PV Electricity Generation by Retail TOU Period ................................13 Figure 6. Distribution of PV Electricity Generation by MPR-TOD Period.................................13 Figure 7. Difference between COE on TOU and Flat Rate.........................................................20 Figure 8. Least-Cost Rate Choice at Varying PV-to-load Ratios................................................21 Figure 9. Least-Cost Rate Choice under Alternate PV Orientations ...........................................21 Figure 10. Customer Characteristics Associated with Least-Cost Rate Choice (PG&E) .............22 Figure 11. Customer Characteristics Associated with Least-Cost Rate Choice (SCE) ................23 Figure 12. Distribution in Bill Savings under Net Metering and Base-Case Assumptions ..........24 Figure 13. Variation in Bill Savings with Customer Gross Annual Consumption.......................25 Figure 14. Distribution in the Effect of Sub-Optimal Rate Selection on the Value of Bill Savings
............................................................................................................................................27 Figure 15. Difference in Bill Savings between Alternate and Base-Case PV Orientations..........28 Figure 16. Difference in Bill Savings between Current and Old SCE Rate Options....................30 Figure 17. PV System Size that Exhausts Annual Bill Savings ..................................................31 Figure 18. Annual Net Excess PV Generation under Hourly and Monthly Netting Options .......33 Figure 19. Least-Cost Rate Choice under Alternative PV Compensation Mechanisms...............34 Figure 20. Distribution in Bill Savings under the MPR-Based Feed-In Tariff and the Change in
Bill Savings Relative to Net Metering .................................................................................36 Figure 21. Distribution in Bill Savings under MPR-Based Hourly Netting and the Change in Bill
Savings Relative to Net Metering ........................................................................................37 Figure 22. Comparison of Bill Credits for Hourly Excess Generation under Net Metering and
MPR-Based Hourly Netting.................................................................................................38 Figure 23. Distribution in Bill Savings under MPR-Based Monthly Netting and the Change in
Bill Savings Relative to Net Metering .................................................................................39 Table 1. TOU Period Definitions.................................................................................................6 Table 2. 2009 Baseload MPR Prices ($/kWh)..............................................................................7 Table 3. MPR TOU Periods and TOD Adjustment Factors..........................................................8 Table 4. MPR-Based Prices for Monthly Excess PV Generation under the Monthly Netting
Option .................................................................................................................................17 Table 5. Reduction in the Median Loss of Bill Savings Relative to Net Metering if Avoided T&D
Costs and Line Losses Are Included in the Price for Net Excess Generation........................41 Table 6. Estimates of Avoided T&D Costs from Distributed PV ...............................................42
vii
Executive Summary
Net metering has become a widespread policy in the U.S. for supporting distributed photovoltaics (PV) adoption.1 Though specific design details vary, net metering allows customers with PV to reduce their electric bills by offsetting their consumption with PV generation, independent of the timing of the generation relative to consumption – in effect, compensating the PV generation at retail electricity rates (Rose et al. 2009). Though net metering has played an important role in jump-starting the PV market in the U.S., challenges to net metering policies have emerged in a number of states and contexts, and alternative compensation methods are under consideration. Moreover, one inherent feature of net metering is that the value of the utility bill savings it provides to customers with PV depends heavily on the structure of the underlying retail electricity rate, as well as on the characteristics of the customer and PV system. Consequently, the bill-savings value of net metering – and the impact of moving to alternative compensation mechanisms – can vary substantially from one customer to the next. For these reasons, it is important for policymakers and others that seek to support the development of distributed PV to understand both how the bill savings benefits of PV varies under net metering, and how the bill savings under net metering compares to savings associated with other possible compensation mechanisms.2 To advance this understanding, we analyze the bill savings from PV for residential customers of California’s two largest electric utilities, Pacific Gas and Electric (PG&E) and Southern California Edison (SCE).3 The analysis is based on hourly load data from a sample of 215 residential customers located in the service territories of the two utilities, matched with simulated hourly PV production for the same time period based on data from the nearest of 73 weather stations in the state. We focus on these two utilities, both because we had ready access to a sample of load data for their residential customers, and because their service territories are the largest markets for residential PV in the country. We first compute the bill savings for each customer based on existing net metering rules and retail electricity rates, and examine the underlying drivers for differences in the value of bill savings across customers and between utilities. For each customer, we calculate the bill savings with PV systems sized to meet varying percentages (25%, 50%, and 75%) of the customer’s annual consumption, which we refer to as the “PV-to-load ratio.”4 Bill savings are expressed in terms of the annual reduction in the customer’s utility bill per kWh generated by the PV system,
1 As of December 2009, 43 states and Washington DC required some or all utilities to offer net metering, and utilities in 3 additional states offered net metering voluntarily (DSIRE 2010). 2 We note that the customer economics of PV is just one of many issues and trade-offs that policy makers and state utility regulators consider with respect to rate design, net metering, and policies for supporting solar deployment. 3 Although the focus of this report is solely on residential customers, other studies have shown that the bill savings from net metered PV are lower for commercial customers in California than for residential customers (Energy and Environmental Economics 2010, Mills et al. 2008). It follows that the benefits of net metering for PV customers, relative to alternative forms of compensation, are likely higher for residential customers in California than for commercial customers. 4 Among the actual population of residential PV customers in California, the average PV-to-load ratio is approximately 56% for PG&E residential customers and 62% for SCE residential customers (DeBenedictis 2010).
viii
thus normalizing for differences in the size of each system. Currently, PG&E and SCE residential customers have a choice between an inclining block rate with five usage tiers and a time-of-use (TOU) rate that also includes usage tiers.5 We examine how differences in the specific rate structures between the utilities affects the value of the bill savings provided through net metering, and the related impact of customer load characteristics and PV panel orientation. We then compare the value of the bill savings under net metering to three potential alternative compensation mechanisms, each of which provides compensation for some or all PV production at prices based on the state’s Market Price Referent (MPR), with the corresponding time-of-delivery (TOD) adjustment factors.6 The three potential alternatives considered here are:
(1) An MPR-based feed-in tariff, under which the customer is credited for all PV generation at the MPR rate;
(2) Hourly netting, whereby PV production can offset up to 100% of customer usage within each hour, but any excess hourly production is credited at the applicable MPR rate; and
(3) Monthly netting, whereby PV production can offset up to 100% of customer usage within each month (or, for customers on a TOU rate, within each TOU period of each month), but any excess production is credited at an MPR-based rate.
The first two of these alternative compensation mechanisms are similar, though not identical, to compensation options currently offered through California’s small renewable generator feed-in tariff program.7 The third alternative is a variant of net metering that exists in a number of states, under which customers receive payment for monthly excess generation at an avoided cost based rate, rather than rolling the net excess generation forward to the following month and thereby receiving compensation at retail electricity prices. Although these three options are reasonable points of comparison to the existing net metering tariffs in California, they by no means represent the universe of possible alternatives, either in terms of pricing or structure. With respect to pricing, specifically, the MPR-based price paid for excess PV production under each of these alternatives reflects only avoided generation costs. Cost-benefit analyses of distributed PV often identify other benefits to utilities and ratepayers, including, though not limited to,
5 SCE currently has three residential TOU rates; however, two of these rates were closed to new customers on October 1, 2009 and were replaced by a new residential TOU rate. Our analysis focuses on the new TOU rate (TOU-D-T). 6 The MPR is a price established by the California Public Utilities Commission that is updated annually and is intended to represent the long-term market price of electricity (CPUC 2009). The MPR is used as a benchmark for assessing the above-market costs of contracts with renewable generators signed by the state’s investor-owned utilities for complying with California’s renewables portfolio standard (RPS). More recently, it has also become the basis for setting the contract price under California’s small renewable generator feed-in tariff program. To establish the MPR price for a specific renewable energy generator or contract, the MPR price is adjusted according to the time-of-delivery (TOD) period within which electricity is produced and the corresponding, utility-specific TOD adjustment factor. 7 California’s small renewable generator feed-in tariff program is available to certain solar and other renewable generation projects smaller than 1.5 MW. That program, which provides an alternative to net metering, provides customers with the option to either sell all electricity generated by their system under an MPR-based feed-in tariff or to use their renewable generator to first meet on-site load and sell only the excess generation to the utility under the feed-in tariff. Under the latter, “excess sales” option, excess generation may be computed on a sub-hourly basis. Within our analysis, however, the smallest time interval over which excess generation is computed is an hourly basis, as that is the time resolution of our source of simulated PV generation data.
ix
deferred transmission and distribution (T&D) capacity upgrades. As such, the MPR arguably represents a lower-bound on the value of distributed PV production to the utility and ratepayers. Although we do not comprehensively examine the range of other benefits of distributed PV, we do consider the potential impact of incorporating an adder that reflects avoided T&D costs into the alternative compensation mechanisms. Before proceeding, the boundaries and limitations of this analysis should be clearly acknowledged. First, the residential retail rates offered by PG&E and SCE are unique in several respects, and thus the specific findings presented in this report cannot be generalized to apply to other utilities and states. Second, the analysis is based on a sample of customers that, while geographically diverse, may not be statistically representative of the entire population of residential customers in either PG&E’s or SCE’s service territories, and may not be representative of the current population of residential customers with PV systems.8 As such, though our analysis is still valid in presenting the bill savings impacts of PV over a range of residential customer characteristics, it does not accurately reflect the bill savings received by the current population of residential customers in California with net-metered PV. Third, the analysis focuses exclusively on the value of the bill savings provided to customers with PV; it does not consider the overall cost-effectiveness of distributed PV for an individual customer, nor does it consider the value or cost-effectiveness of distributed PV from the perspective of the utility, non-participating ratepayers, or society-at-large. Finally, in comparing net metering to several alternative compensation mechanisms, we focus exclusively on the value of the bill savings or bill credits provided to customers through each compensation mechanism; net metering may provide other advantages and disadvantages (both financial and otherwise) relative to the alternative compensation mechanisms considered, but these are not covered in the analysis presented here.9 With these caveats in mind, key findings from the analysis are as follows: Bill savings under net metering are significantly greater for high-usage customers than for low-usage customers. Across the three PV-to-load ratios examined, the median bill savings per kWh of PV generation ranges from $0.19-$0.25/kWh for the PG&E customers in our sample, and from $0.20-$0.24/kWh for the SCE customers (see Figure ES-1). However, at each PV-to-load ratio, the distribution in bill savings across customers is wide. This variation is attributable primarily to differences in customer usage level – where bill savings are greatest for high-usage customers who are able to offset consumption in high-priced usage tiers (see Figure ES-2).10 For example, at a PV-to-load ratio of 50%, the value of bill savings among the PG&E customers in our sample rises from a low of approximately $0.12/kWh for low-usage customers in Tier 1 to $0.36-$0.46/kWh for high-usage customers in Tier 5. For SCE, the trend is noticeably less
8 The customers in our sample are, on average, larger than the overall population of residential customers, but smaller than the typical residential customer with PV. 9 For example, alternatives to net metering that entail explicit sales of electricity by the customer to the utility may be subject to income taxes, may give rise to federal regulatory compliance requirements, and could potentially interfere with common customer financing mechanisms like third-party power purchase agreements(PPAs)/leases and property-assessed clean energy (PACE) financing. 10 Customers in our sample are smaller than typical residential PV customers (DeBenedictis 2010); thus, the median bill savings of the customers in our sample likely understates the actual bill savings received by the actual population of residential PV customers of the two utilities.
x
pronounced, due primarily to the fact that SCE’s usage tiers are less steep than PG&E’s: at a 50% PV-to-load ratio, the bill savings for the SCE customers in our sample rises from approximately $0.14/kWh for customers in Tier 1 to $0.24-0.29/kWh for customers in Tier 5.
$0.00
$0.05
$0.10
$0.15
$0.20
$0.25
$0.30
$0.35
$0.40
$0.45
$0.50
25% 50% 75% 25% 50% 75%
PV-to-Load Ratio
Valu
e o
f B
ill
Savin
gs (
$/k
Wh
)
PG&E SCE
Note: Box plots identify
10th/25th/50th/75th/90th
percentile values
Figure ES-1. Distribution in Bill Savings under Net Metering and Base-Case Assumptions
PG&E
$0.00
$0.10
$0.20
$0.30
$0.40
$0.50
0% 100% 200% 300% 400% 500%
Valu
e o
f B
ill
Savin
gs (
$/k
Wh
)
25% PV-to-Load Ratio50% PV-to-Load Ratio75% PV-to-Load Ratio
Tier 1 Tier
3
Tier 4 Tier 5
Tie
r 2
SCE
0% 100% 200% 300% 400% 500%
Tier 1 Tier 4 Tier 5Tier
3Tie
r 2
Gross Annual Consumption as % of Baseline Figure ES-2. Variation in Bill Savings with Customer Gross Annual Consumption
• Under net metering, the bill savings per kWh produced by the PV system decline with PV system size. This phenomenon is also a consequence of the inclining usage tiers used within the utilities’ residential retail tariffs; as PV generation increases, the customer faces a
xi
progressively lower marginal price for its net consumption, and thus receives progressively lower incremental bill savings. This trend is illustrated in Figure ES-2 by the downward shift in the per-kWh bill savings for each customer, with each successive increase in the PV-to-load ratio. In the median case, an increase in the PV-to-load ratio from 25% to 75% results in a decline in the per-kWh value of bill savings from $0.25/kWh to $0.19/kWh for the PG&E customers in our sample, and from $0.24/kWh to $0.20/kWh for the SCE customers in our sample. However, the drop in per-kWh bill savings with increasing PV system size is greater for high-usage customers – especially for high-usage PG&E customers. For example, among the 10% of PG&E customers in our sample with the highest consumption, the per-kWh bill savings declines from $0.45/kWh to $0.33/kWh between a 25% and 75% PV-to-load ratio (see Figure ES-1). Among the SCE customers in our sample, the corresponding decline is from $0.29/kWh to $0.25/kWh.
• The utilities’ time-of-use rates become increasingly more attractive for net metered PV
customers as the size of the PV system increases. Both utilities offer residential customers the choice between an inclining block rate with five usage tiers (the default rate) and a time-of-use (TOU) rate with usage tiers. Throughout most of our analysis, we assume that customers choose the least-cost rate option, both before and after PV installation. With no PV system installed, virtually none of the PG&E customers in our sample would minimize their bill under the TOU rate, while 54% of the SCE customers would do so. This difference is partly attributable to the fact that SCE’s TOU rate has only one TOU period (the summer peak period) with prices higher than its default (non-TOU) rate, while PG&E’s TOU rate has two TOU periods (the summer peak and summer part-peak periods) with prices higher than its default rate. With an increasing PV-to-load ratio, the increased PV generation disproportionately displaces consumption during the summer peak TOU period, causing the TOU rate to become progressively more attractive. Thus, at a 75% PV-to-load ratio, 78% of the PG&E customers and 99% of the SCE customers in the sample would find the TOU rate to be least-cost.
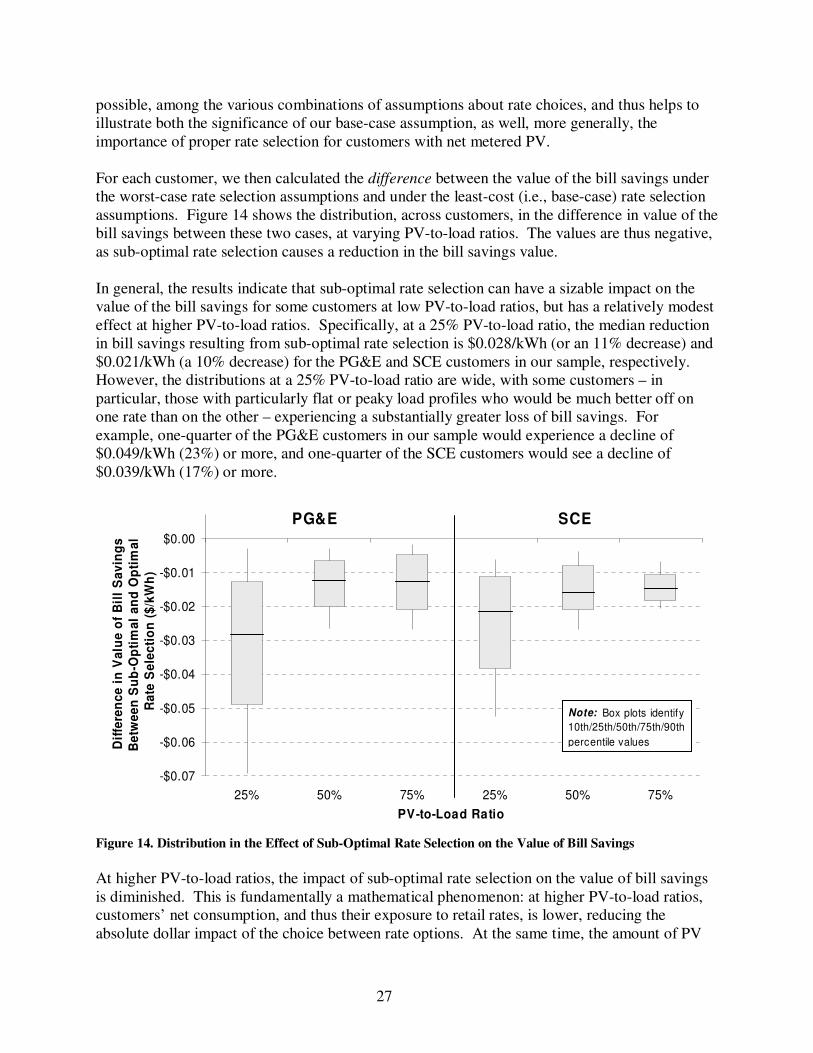
• Sub-optimal rate selection by customers generally leads to a reduction in bill savings of
less than 10%, but can have a much greater impact for some customers at a low PV-to-
load ratio. As a sensitivity analysis, we also examine a scenario under which customers make the sub-optimal (i.e., highest-cost) rate choice following installation of the PV system, and we compare the value of the bill savings between this scenario and our base-case scenario under which customers make the least-cost rate choice. Among the PG&E customers in our sample, the median loss in bill savings associated with sub-optimal rate choice ranges from about $0.013-$0.028/kWh (6-11%) depending on the PV-to-load ratio. For SCE customers the median loss in bill savings ranges from about $0.015-$0.021/kWh (7-10%). However, at a low PV-to-load ratio, some customers – particularly those with an especially flat or peaky load profile who would tend to be much better off on one rate vs. the other – may experience a much greater loss in bill savings as a result of sub-optimal rate selection. For example, at a 25% PV-to-load ratio, 25% of the PG&E customers in our sample would experience a loss in bill savings of at least $0.049/kWh or 23%, and 25% of the SCE customers would experience a loss in bill savings of at least $0.039/kWh or 17%, as a result of sub-optimal rate selection. At higher PV-to-load ratios, sub-optimal rate selection
xii
becomes less important for these customers, primarily because net consumption, and thus the customers’ exposure to retail rates, is lower.
• The per-kWh value of bill savings generally varies by less than 5% across the range of PV
panel orientations considered, while the amount of electricity generated varies by 10-11%. Throughout most of our analysis, we assume that PV systems are oriented south-facing at a 25° tilt. To test the effect of alternate PV orientations, we also calculated the value of the bill savings for PV systems at two alternate orientations: (1) panels facing at an azimuth of 240° (approximately west-southwest) with a 25° tilt, and (2) panels mounted flat, i.e., with zero tilt. In general, the difference in the per-kWh value of the bill savings associated with these various PV orientations is less than $0.01/kWh, or 5%. However, changes to PV panel orientation also affect the amount of electricity produced by the PV system, which in turn affects the total dollar amount of bill savings. In the median case, the west-southwest orientation results in 11% less PV electricity production than the base south-facing orientation, and the flat PV orientation results in 10% less electricity production.
• Under existing net metering rules and retail rate options, most customers would exhaust
their annual bill savings with a PV system sized to meet less than 100% of their annual load. Under existing net metering rules, customers are able to roll-over any excess bill credits from one month to the next, but at the end of the year, any remaining bill credits are forfeited by the customer.11 For each customer, we calculated the PV-to-load ratio at which point the customer’s annual bill savings are exhausted under existing net metering rules, assuming as before that customers select the least-cost rate option available. Within our sample, 86% of PG&E customers and 97% of SCE customers would exhaust their bill savings with PV systems sized to meet less than 100% of their annual usage. In the median case, the PG&E customers exhaust their bill savings at a PV-to-load ratio of 93%, and the SCE customers do so at a PV-to-load ratio of 92%. This reflects the fact that most of these customers are assumed to take service on a TOU rate (as that would be the least-cost of the available rate choices at a high PV-to-load ratio), and PV generation is more highly concentrated during the highest-priced TOU periods than is customer load.
• Bill savings for PV customers would be substantially lower under the MPR-based feed-in tariff than under net metering. Under the full MPR-based feed-in tariff considered in our analysis, the median pre-tax bill savings12 is approximately $0.12/kWh for the PG&E customers in the sample, and $0.13/kWh for the SCE customers. Across the PV-to-load ratios examined, this equates to a median reduction in bill savings, relative to net metering,
11 A recent law passed in California, Assembly Bill (AB) 920, alters this element of the net metering rules by requiring utilities to offer customers the choice either to receive compensation for net surplus electricity at the end of the year or to roll forward the net surplus electricity to be used as a credit against future electricity consumption. As of the writing of this report, revised tariffs implementing AB 920 had not yet been approved by the California Public Utilities Commission, and therefore the changes required by AB 920 are not reflected in our analysis. 12 For simplicity of terminology, we refer to the compensation provided through each of the three alternative compensation mechanisms as “bill savings”, though in fact, the MPR-based compensation could be provided in the form of an explicit payment separate from the utility bill, rather than as a bill credit. Also note that we focus here on the pre-tax value of the bill savings under each alternative compensation mechanism. For a discussion of the potential tax implications of these alternatives, and the impact on the relative value of the bill savings compared to net metering, refer to the main body of the report.
xiii
of $0.08-$0.13/kWh (or 40%-54%) for the PG&E customers in the sample, and $0.07-$0.11/kWh (34%-46%) for the SCE customers (see Figure ES-3). The ranges cited refer to variation across PV-to-load ratios, where the reduction in bill savings is greatest at low PV-to-load rations. Average prices under the feed-in tariff would thus need to be raised by those amounts in order to make the median customer in our sample financially indifferent between the feed-in tariff and net metering. However, as shown by the height of the box plots in Figure ES-3, the difference in bill savings between net metering and the MPR-based feed-in tariff varies significantly across customers, with a much larger reduction in bill savings occurring for high-usage customers, who benefit most from net metering. This is particularly true for PG&E customers, given the steeply inclining usage tiers of PG&E’s residential rates; as a result, one-quarter of the PG&E customers in our sample would experience a reduction in bill savings under the MPR-based feed-in tariff of at least $0.14-$0.23/kWh (55-67%), where this range refers to variation across the three PV-to-load ratios.
Figure ES-3. Difference in Bill Savings between Alternative PV Compensation Mechanisms and Net Metering
• Bill savings under the MPR-based hourly netting option would be modestly less than under
net metering. Under the hourly netting option, in which PV production can offset up to 100% of customer usage within each hour, but any excess hourly production is credited at the applicable MPR rate, customers of both utilities would also generally experience a reduction in bill savings relative to net metering (see Figure ES-3). However, the difference is significantly less than under the full MPR-based feed-in tariff, because the majority of PV generation offsets consumption, and because PV generation that is subject to MPR-based prices under hourly netting is generation that, under net metering, would primarily serve to offset usage within lower-priced usage tiers. For the PG&E customers in the sample, the median bill savings under MPR-based hourly netting ranges from $0.23/kWh at a 25% PV-to-load ratio to $0.17/kWh at a 75% PV-to-load ratio, equivalent to a median reduction in bill savings relative to net metering of $0.015/kWh (6%) to $0.024/kWh (11%) for a PV-to-load
xiv
ratio of 25% and 75%, respectively. For the SCE customers in the sample, the median bill savings under MPR-based hourly netting ranges from $0.23/kWh at a 25% PV-to-load ratio to $0.18/kWh at a 75% PV-to-load ratio, which represents a median reduction in bill savings relative to net metering of $0.016-$0.021/kWh (6%-11%) across PV-to-load ratios. In order to make customers financially indifferent between hourly netting and net metering, higher prices for hourly net excess generation would be required. For the PG&E customers in our sample, the price for hourly net excess generation would, in the median case, need to be approximately $0.07/kWh higher than the average MPR-based prices at a 25% PV-to-load ratio and $0.04/kWh higher at a 75% PV-to-load ratio, in order to make the residential customers with PV financially indifferent. Similarly, for the SCE customers in our sample, the price for hourly net excess generation would, in the median case, need to be $0.09/kWh higher than the average MPR-based prices at a 25% PV-to-load ratio and $0.04/kWh higher at a 75% PV-to-load ratio.
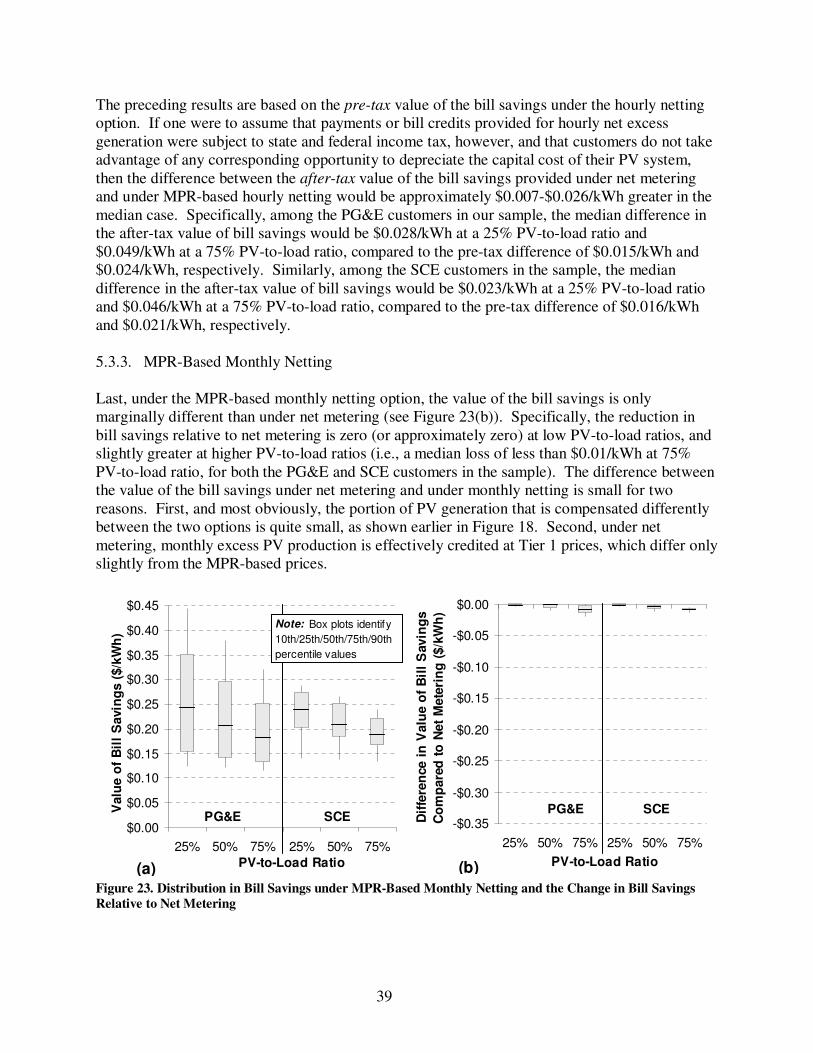
• Bill savings under the monthly netting option would be effectively indistinguishable from the savings under net metering. Under the monthly netting option, the median loss in bill savings for customers of both utilities is zero (or approximately zero) at a 25% PV-to-load ratio and less than $0.01/kWh at 50% and 75% PV-to-load ratios (see Figure ES-3). The difference between the value of the bill savings under net metering and monthly netting is small for two reasons. First, the portion of PV generation that is compensated differently between the two options is quite small. Second, under net metering, monthly excess PV production is credited at Tier 1 prices, which differ only slightly from MPR prices.
• Incorporating avoided T&D costs and reduced line losses into the alternative
compensation mechanisms would increase the value of the bill savings, though the bill
savings would still likely be less than under net metering. The alternative compensation mechanisms considered in this paper compensate PV generation at a price based on the state’s MPR, which is intended to represent the long-run market price of electricity. However, distributed PV may result in additional avoided costs – including, but not limited to, T&D capacity deferrals and reduced line losses – that could conceivably be incorporated into the price paid for PV generation under these compensation mechanisms. One inherent challenge to accounting for the value of T&D capacity deferrals, in particular, is that that value is highly idiosyncratic, depending on the specific location of each PV system, the quantity of PV installed, the point in time that it is installed, and its hourly generation profile relative to distribution circuit loading. In part as a result, cost-benefit analyses that have quantified the value of T&D capacity deferrals from distributed PV have estimated avoided costs ranging from $0.001/kWh (or less) to more than $0.10/kWh. Though that range is sizable, if an “average” T&D avoided cost adder of $0.01/kWh were added to the price paid under the alternative compensation mechanisms, it would reduce the median pre-tax difference in bill savings between net metering and the full MPR-based feed-in tariff by 8%-13% for the PG&E customers in our sample and by 9-15% for the SCE customers; and it would reduce the median difference in bill savings between net metering and the hourly
netting option by 13%-26% for the PG&E customers and by 10%-23% for the SCE customers, across the range of PV-to-load ratios examined. Reduced line losses represent an additional possible source of avoided costs from distributed PV, to the extent that the electricity generated is consumed onsite or nearby (e.g., within the same distribution feeder).
xv
If line losses are assumed to be 10%, accounting for reduced line losses would reduce the median pre-tax difference in bill savings between net metering and the full MPR-based feed-
in tariff by 9%-15% for the PG&E customers and by 11%-19% for the SCE customers; and it would reduce the median difference in bill savings between net metering and the hourly
netting option by 15%-29% for the PG&E customers and by 13%-30% for the SCE customers, across the range of PV-to-load ratios examined.
1
1. Introduction
Net metering has become a widespread policy in the U.S. for supporting distributed photovoltaics (PV) adoption.13 Though specific design details vary, net metering allows customers with PV to reduce their electric bills by offsetting their consumption with PV generation, independent of the timing of the generation relative to consumption – in effect, compensating the PV generation at retail electricity rates (Rose et al. 2009). Though net metering has played an important role in jump-starting the PV market in the U.S., challenges to net metering policies have emerged in a number of states and contexts, and alternative compensation methods are under consideration. Moreover, one inherent feature of net metering is that the value of the utility bill savings it provides to customers with PV depends heavily on the structure of the underlying retail electricity rate, as well as on the characteristics of the customer and PV system. Consequently, the bill-savings value of net metering – and the impact of moving to alternative compensation mechanisms – can vary substantially from one customer to the next. For these reasons, it is important for policymakers and others that seek to support the development of distributed PV to understand both how the bill savings benefits of PV vary under net metering, and how the bill savings under net metering compare to savings associated with other possible compensation mechanisms.14 To advance this understanding, we analyze the bill savings from PV for residential customers of California’s two largest electric utilities, Pacific Gas and Electric (PG&E) and Southern California Edison (SCE), based on actual hourly load data from 215 customers within the two utilities’ service territories.15 We focus on these two utilities, both because we had ready access to a sample of load data for their residential customers, and because their service territories are the largest markets for residential PV in the country. We first compute the bill savings based on current net metering rules and retail electricity rates, and then compare the value of the bill savings under net metering to three potential alterative compensation mechanisms, each of which credits some or all PV production at prices based on the state’s Market Price Referent (MPR).16 In the course of developing these comparisons, we also examine a number of critical underlying issues that influence the value of the bill savings under net metering, and thus also the value of net metering relative to alternative compensation mechanisms, including retail rate design, PV system size, PV orientation, and customer load characteristics.
13 As of December 2009, 43 states and Washington DC required some or all utilities to offer net metering, and utilities in 3 additional states offered net metering voluntarily (DSIRE 2010). 14 We note that the customer economics of PV is just one of many issues and trade-offs that policy makers and state utility regulators consider with respect to rate design, net metering, and policies for supporting solar deployment. 15 Although the focus of this report is solely on residential customers, other studies have shown that the bill savings from net metered PV is lower for commercial customers in California than for residential customers (Energy and Environmental Economics 2010, Mills et al. 2008). It follows that the benefits of net metering for PV customers, relative to alternative forms of compensation, are likely higher for residential customers in California than for commercial customers. 16 The MPR is the price used to evaluate wholesale contracts with renewable generators and is intended to represent long-run avoided generation supply costs, based on the cost of a combined-cycle natural gas fired generator.
2
This report follows the recent publication of a cost-effectiveness evaluation of net metering in California, prepared by Energy and Environmental Economics (E3) for the California Public Utilities Commission (Energy and Environmental Economics 2010). The E3 study and the present report both address the economics of net metering in California, but have a different scope and focus on a different set of questions. The E3 report is focused principally on evaluating the total costs and benefits of net metering to the utility and its ratepayers. In doing so, the E3 report estimates the net cost to the utility and its ratepayers of providing bill credits to net-metered customers for electricity exported to the grid (i.e., for the portion of onsite electricity generation that exceeds contemporaneous electricity consumption). In contrast, the present report estimates the value of the total bill savings for net-metered PV customers (not to the utility or its overall set of ratepayers), including both the bill credits received for electricity exported to the grid as well as the avoided bill charges for consumption that is contemporaneously offset by onsite generation. In addition, the E3 study has a broader scope, including in its analysis residential and non-residential net-metered customers of all three electric investor-owned utilities (IOUs) in California, as well as all types of net-metered generation. The present report focuses exclusively on residential customers of the two largest electric IOUs, and exclusively on net-metered PV systems. Other prior studies have also investigated aspects of the customer economics of PV under net metering and the relationship of the customer-economics of PV to retail rate structures. Of particular note, Borenstein (2007) calculated the bill savings for net-metered residential customers of PG&E and SCE with 2 kW PV systems, in order to determine whether mandatory TOU rates for PV customers would cause a reduction in bill savings. The present study relies on the same sample of customer load data (see Section 2.2) as used in Borenstein (2007), updating the analysis based on the current set of residential retail rates offered by PG&E and SCE, and extending the analysis by evaluating bill savings under varying PV system sizes and by comparing the value of the bill savings between net metering and several alternative compensation mechanisms. Other related studies include Hoff and Margolis (2004), Borenstein (2005), Borenstein (2008), and Bright Power Inc. et al. (2009), all of which show that net-metered time-of-use and/or real-time pricing rates can increase the value of PV generation to the customer. MRW and Associates (2007), meanwhile, evaluate which retail rate structures provide the greatest benefits to different classes of PV customers in California. Mills et al. (2007) investigate the impact of retail rate structure on the value of bill savings for commercial customers in California, focusing in part on the extent to which PV can reduce customer demand charges. VanGeet et al. (2008) calculate the rate impacts of demand charges and energy charges on the bills of commercial customers with PV systems in the city of San Diego. Finally, Cook and Cross (1999) estimate the costs and benefits of net metering in Maryland from the perspectives of participating customers, non-participants, and utility shareholders, based on a hypothetical net-metered PV customer. The boundaries and limitations of the analysis presented in this report should be clearly acknowledged. First, the current residential retail rates offered by PG&E and SCE are unique in several respects, and thus the specific findings presented in this report cannot be generalized to apply to other utilities or states. Second, the analysis is based on a sample of customers that,
3
while geographically diverse, may not be statistically representative of the entire population of residential customers in either PG&E’s or SCE’s service territories, and may not be representative of the current population of residential customers with PV systems. Third, the analysis focuses exclusively on the value of the bill savings provided to customers with PV; it does not consider the overall cost-effectiveness of distributed PV for an individual customer, nor does it consider the value or cost-effectiveness of distributed PV from the perspective of the utility, non-participating ratepayers, or society-at-large. Finally, in comparing net metering to several alternative compensation mechanisms, we focus exclusively on the value of the bill savings or bill credits provided to customers through each compensation mechanism; net metering may provide other advantages and disadvantages (both financial and otherwise) relative to the alternative compensation mechanisms considered, but these are not covered in the analysis presented here.17 The remainder of this report is organized as follows. Chapter 2 describes the data used within our analysis and the basic analytical framework used to calculate customer utility bills and the value of the bill savings from PV under net metering and under each of the alternative compensation mechanisms. Chapter 3 presents intermediate results showing how the least-cost rate, among the set of residential retail rates offered by each utility, varies with PV system size for customers with net metered PV systems. Chapter 4 describes the value of the bill savings from PV under net metering and the associated variability across customers, including several sensitivity analyses to explore how different rate choices and PV panel orientations impact the bill savings. Chapter 4 also presents two side-analyses examining, first, the effect of recent revisions to SCE’s residential time-of-use (TOU) rates on the bill savings from net metered PV, and second, the PV system size at which customers exhaust their annual bill savings under current net metering rules. Chapter 5 then examines three alternative compensation mechanisms for distributed PV, and compares the value of the bill savings between each of these alternatives and net metering. Finally, brief conclusions and policy implications are presented in Chapter 6.
17 As one set of examples, alternatives to net metering that entail explicit sales of electricity by the customer to the utility may be subject to income taxes, may give rise to federal regulatory compliance requirements, and could potentially interfere with common customer financing mechanisms like third-party power purchase agreements (PPAs)/leases and property assessed clean energy (PACE) financing.
4
2. Data and Analysis Methods
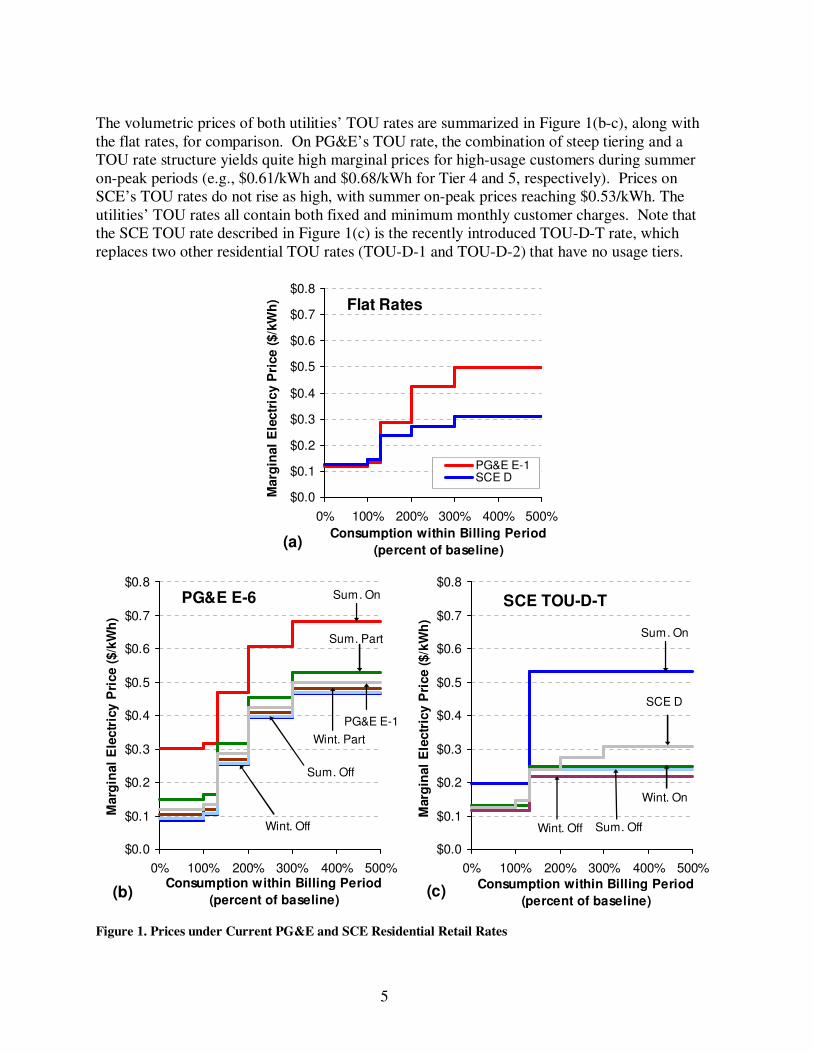
In this chapter, we describe the data used within our analysis and the basic analytical framework used to calculate customer utility bills and the value of the bill savings from PV. Key data inputs include: residential retail rate definitions and prices, net metering rules, MPR definitions and prices, customer load data, and simulated PV generation data. 2.1. Utility Tariff Descriptions 2.1.1. Current Residential Electricity Rates PG&E and SCE both offer residential customers the choice between a non-time-differentiated (i.e., “flat”) rate and a time-of-use (TOU) rate.18 The utilities’ flat rates are “inclining block” rates with five usage tiers and increasing volumetric charges for usage within each successive tier. The lowest tier is the baseline allotment, which varies according to the baseline region in which the customer is located and is designed to cover 50-60% of the average electricity consumption in the region.19 The other four tiers are defined as percentages of the baseline: specifically, Tier 2 is 100-130% of the baseline, Tier 3 is 130-200%, Tier 4 is 200-300%, and Tier 5 is greater than 300%. Figure 1(a) displays the tiered rate structure for PG&E’s and SCE’s flat rates, as of March 2010. As shown, prices for usage in the highest tiers of both utilities are considerably greater than in the baseline tier, but PG&E’s tiers are significantly steeper than SCE’s.20 Specifically, volumetric charges under PG&E’s flat rate rise from $0.12/kWh for usage in Tier 1 up to $0.50/kWh in Tier 5, while SCE’s rate rises from $0.13/kWh for usage in Tier 1 up to $0.31/kWh in Tier 5. Both utilities’ flat rates also specify a minimum monthly charge, and SCE’s flat rate also contains a fixed customer charge. Under the utilities’ residential TOU rates, volumetric charges vary according to both the season (summer vs. winter) and the time of day (see Table 1), with either two or three TOU periods during each day, depending on the utility and the season. PG&E’s residential TOU rate is tiered, with the same five usage tiers within each TOU period as are used on the utility’s flat rate. Customers on the TOU rate are thus assigned a baseline allotment for each TOU period, and usage within each TOU period is charged according to the tier within which it falls. SCE’s residential TOU rate is also tiered, though it only has two tier levels, with Tier 1 corresponding to consumption up to 130% of the baseline level and Tier 2 corresponding to all consumption over that level.
18 SCE’s tariff book includes three residential TOU rates; however, two of these rates (Schedules TOU-D-1 and TOU-D-2) were closed to new customers on October 1, 2009, and were replaced by the third TOU rate (Schedule TOU-D-T). Our analysis focuses primarily on Schedule TOU-D-T, although Section 4.3 discusses the implications of this change in TOU rates. 19 There are 10 baseline regions in PG&E’s service territory and 9 in SCE’s, each corresponding to a particular climate zone. 20 Legislation passed in 2001 (Assembly Bill 1X) froze prices for usage up to 130% of the baseline (Tiers 1 and 2), contributing to the steep tiering structure in place today. More recently, legislation passed in 2009 (Senate Bill 695), allows Tier 1 and 2 rates to be increased by up to 5% per year, which will presumably lead to less steeply tiered rates and thus reduce the variability across customers in the value of the bill savings provided by net-metered PV.
5
The volumetric prices of both utilities’ TOU rates are summarized in Figure 1(b-c), along with the flat rates, for comparison. On PG&E’s TOU rate, the combination of steep tiering and a TOU rate structure yields quite high marginal prices for high-usage customers during summer on-peak periods (e.g., $0.61/kWh and $0.68/kWh for Tier 4 and 5, respectively). Prices on SCE’s TOU rates do not rise as high, with summer on-peak prices reaching $0.53/kWh. The utilities’ TOU rates all contain both fixed and minimum monthly customer charges. Note that the SCE TOU rate described in Figure 1(c) is the recently introduced TOU-D-T rate, which replaces two other residential TOU rates (TOU-D-1 and TOU-D-2) that have no usage tiers.
$0.0
$0.1
$0.2
$0.3
$0.4
$0.5
$0.6
$0.7
$0.8
0% 100% 200% 300% 400% 500%
Consumption within Billing Period
(percent of baseline)
Marg
inal
Ele
ctr
icy P
rice (
$/k
Wh
)
PG&E E-1SCE D
Flat Rates
(a)
$0.0
$0.1
$0.2
$0.3
$0.4
$0.5
$0.6
$0.7
$0.8
0% 100% 200% 300% 400% 500%Consumption within Billing Period
(percent of baseline)
Marg
inal
Ele
ctr
icy P
rice (
$/k
Wh
)
PG&E E-6
(b)
Sum. On
Sum. Part
Sum. Off
Wint. Part
Wint. Off
PG&E E-1
$0.0
$0.1
$0.2
$0.3
$0.4
$0.5
$0.6
$0.7
$0.8
0% 100% 200% 300% 400% 500%Consumption within Billing Period
(percent of baseline)
Marg
inal
Ele
ctr
icy P
rice (
$/k
Wh
)
SCE TOU-D-T
(c)
Sum. On
SCE D
Wint. On
Sum. OffWint. Off
Figure 1. Prices under Current PG&E and SCE Residential Retail Rates
* For PG&E, Winter is November-April, and Summer is May-October. For SCE, Winter is October-May, and Summer is June-September.
** Holidays are treated as off-peak, regardless of time or day of week.
2.1.2. Current Net Metering Tariffs PG&E and SCE both offer net metering to residential customers with PV systems. Under current the terms of the net metering tariffs, customers are able to offset volumetric charges within each billing period, but fixed charges cannot be offset, and minimum monthly charges still apply. Any excess bill credit remaining at the end of each monthly billing period is carried over to the subsequent billing period. However, under existing net metering tariffs, any excess bill credits remaining at year-end are forfeited.21 For a customer on a flat rate, bill credits within any 12 month period of time are exhausted when annual PV generation is approximately equal to annual consumption.22 For a customer on a TOU rate, however, bill credits may be exhausted by PV systems that meet less than 100% of the customer’s usage, if the PV generation is more highly concentrated during high-priced TOU periods than is the customer’s usage. 2.1.3. The Market Price Referent The alternative compensation mechanisms considered in this report are based upon California’s Market Price Referent (MPR). The MPR is a price established by the CPUC and updated each year that is intended to represent the long-term market price of electricity, based on the ownership, operating, and fixed-price fuel costs for a new natural gas-fired combined cycle gas turbine (CCGT). The original purpose of the MPR was to serve as a benchmark for assessing the above-market costs of contracts with renewable generators signed by the state’s investor-owned utilities for complying with California’s RPS. More recently, it has become the basis for the contract price under California’s small renewable generator feed-in tariff program. That program, which is available to certain solar and other renewable generation projects smaller than
21 A recent law passed in California, Assembly Bill (AB) 920, alters this element of the net metering rules by requiring utilities to offer customers the choice either to receive compensation for net surplus electricity at the end of the year or to roll forward the net surplus electricity to be used as a credit against future electricity consumption. As of the writing of this report, revised tariffs implementing AB 920 had not yet been approved by the California Public Utilities Commission, and therefore the changes required by AB 920 are not reflected in our analysis. 22 Because net metered customers cannot eliminate minimum monthly charges, a customer on a flat rate could actually exhaust her annual bill credits with a PV system that generates somewhat less than her annual consumption.
7
1.5 MW, provides an alternative to net metering under which customers can opt to either sell all electricity generated by their system under an MPR-based feed-in tariff or use their renewable generator to first meet on-site load and sell only the excess generation to the utility under the feed-in tariff. Two of the alternative compensation mechanisms considered in this report are modeled after, though not identical to, the two compensation options under the state’s existing feed-in tariff program. The MPR has several elements. The “baseload” MPR price, which is based on the long-term cost of a CCGT, is updated annually and varies according to the year in which the renewable energy project enters commercial operation and the contract length (see Table 2 for the 2009 MPR baseload prices). To establish the MPR price for a specific renewable energy generator or contract, the baseload MPR price is adjusted according to the Time-of-Delivery (TOD) period within which electricity is generated (see Table 3), by multiplying the baseload MPR rate by the utility-specific TOD adjustment factor. Thus, similar to the utilities’ retail TOU rates, the MPR TOD adjustment factors provide higher levels of compensation during summer afternoon hours than at other times, although specific structural details (e.g., the definitions of the time periods and price spread between time periods) differ between the retail TOU rates and the MPR TOD factors. Table 2. 2009 Baseload MPR Prices ($/kWh)
First Year of Commercial Operation 10-Year 15-Year 20-Year 25-Year
2010 0.08448 0.09066 0.09674 0.10020
2011 0.08843 0.09465 0.10098 0.10442
2012 0.09208 0.09852 0.10507 0.10852
2013 0.09543 0.10223 0.10898 0.11245
2014 0.09872 0.10593 0.11286 0.11636
2015 0.10168 0.10944 0.11647 0.12002
2016 0.10488 0.11313 0.12020 0.12378
2017 0.10834 0.11695 0.12404 0.12766
2018 0.11204 0.12090 0.12800 0.13165
2019 0.11598 0.12499 0.13209 0.13575
2020 0.12018 0.12922 0.13630 0.13994
Source: CPUC (2009)
8
Table 3. MPR TOU Periods and TOD Adjustment Factors
2.2. Customer Load Data Our analysis relies on 15-minute interval load data from residential customers located throughout the service territories of PG&E and SCE, none of which have PV systems installed. These data were originally collected as a part of California’s Statewide Pricing Pilot (SPP), which sought to analyze changes in electricity consumption associated with peak pricing rate structures. Our analysis specifically utilizes data for the SPP control group of customers, who were not under peak pricing rate structures. The original SPP control group dataset consisted of load data from 442 customers, who where chosen using Bayesian sampling techniques in order to reflect the diversity of California customers across climate zones (Charles River Associates 2005). Following the data cleaning process described below, load data from 215 of these customers (118 PG&E customers and 97 SCE customers) were ultimately used in our analysis. Several steps were required to prepare the SPP load data for analysis. First, a common 12-month time period was selected. The original data spanned 15 months, from May 19, 2003 to September 30, 2004. For our analysis, we used data from the last 12 months of this time period (i.e., October 1, 2003 to September 30, 2004), as this was the period with the least amount of missing load data. Second, two types of customers were removed from the dataset: multi-family housing (N=133) and single-family customers with more than seven cumulative days of missing or zero-value load data (N=145). Third, gaps in the load data for the remaining customers were filed. For gaps of four continuous hours or less, the missing data were replaced with linearly interpolated values from the hours immediately preceding and following the gap. For gaps longer than four continuous hours, the entire day was replaced with data from the previous weekday/weekend (depending on whether the missing data occurred on a weekday or weekend).
9
After cleaning the raw data set, the resulting working dataset contained 227 customers. Each customer was then assigned to a utility and baseline region, using Geographic Information System (GIS) software and the zip code data records contained within the SPP database. Based on this GIS analysis, 118 customers were determined to be located in PG&E’s service territory, 97 customers in SCE’s, and 12 in San Diego Gas and Electric (SDG&E)’s territory. Customers of SDG&E were excluded from our analysis, due to the inadequate sample size. Figure 2 shows the distribution in usage – expressed here as the average monthly usage per customer – across the customers in the final data set. PG&E customers in our sample consumed 667 kWh/month in the median case and 734 kWh/month on average, while the SCE customers consumed 730 kWh/month in the median case and 827 kWh/month on average. The figure compares the average usage per customer between our sample and the total population of residential customers of each utility. As shown, customers in our final sample have, on average, higher electricity consumption than the overall population of residential customers (by 30% and 38% for PG&E and SCE, respectively). This is, in part, a consequence of the fact that we removed customers in multi-family residential buildings (e.g., apartments) from our sample, who on average have lower electricity consumption than customers in single-family homes.23
0
200
400
600
800
1,000
1,200
1,400
1,600
PGE (N=118) SCE (N=97)
Sample mean Utility mean (2007) NEM customers
Note: box plot shows
10/25/50/75/90 percentiles
Avera
ge C
on
su
mp
tio
n p
er
Cu
sto
mer
(kW
h/m
on
th)
Figure 2. Distribution in Average Monthly Consumption across Customers in Data Sample24
However, the customers in our sample appear to have average electricity consumption well below the current population of residential customers with PV. For example, MRW &
23 Had the multi-family customers been included, the mean consumption for the sample would have been 625 kWh/month and 746 kWh/month, for PG&E and SCE customers, respectively, or 11% and 26% over the 2007 average consumption for PG&E and SCE customers, respectively. 24 Data on average usage by residential customers of each utility is derived from Energy Information Administration, Form EIA-861. Data on average usage by actual PG&E and SCE residential Net Energy Metering (NEM) customers is from the E3 NEM cost-benefit analysis, as reported by DeBenedictis (2010).
10
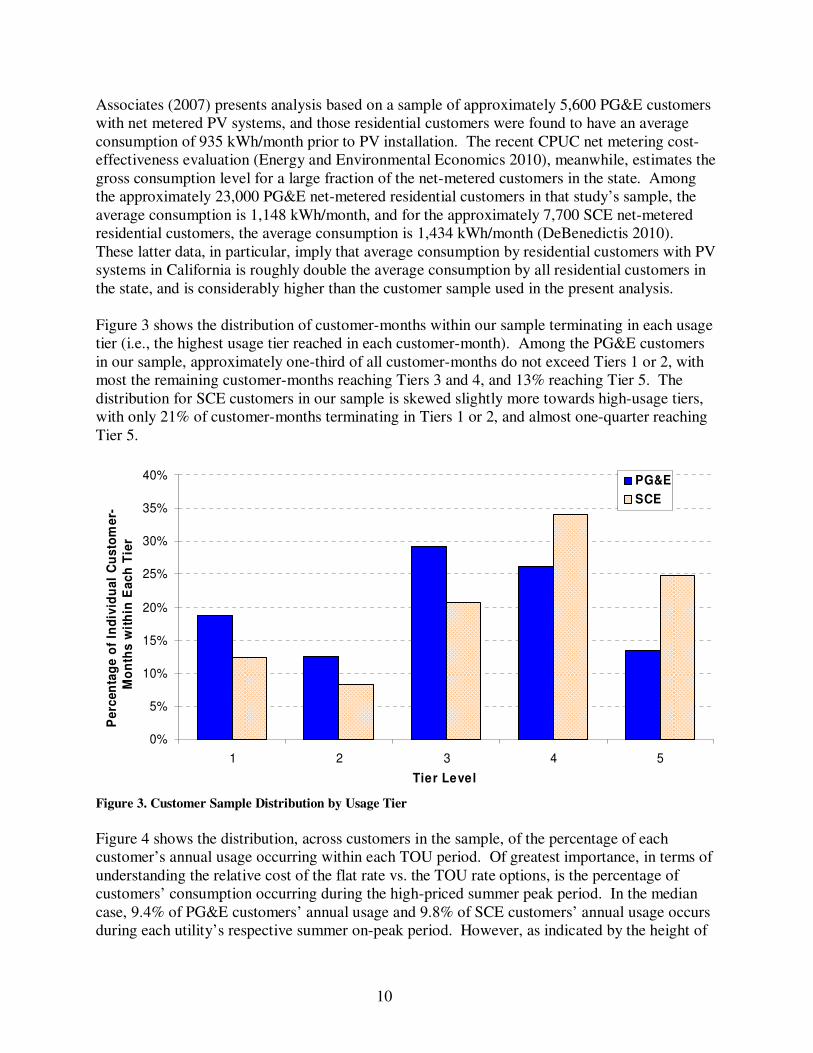
Associates (2007) presents analysis based on a sample of approximately 5,600 PG&E customers with net metered PV systems, and those residential customers were found to have an average consumption of 935 kWh/month prior to PV installation. The recent CPUC net metering cost-effectiveness evaluation (Energy and Environmental Economics 2010), meanwhile, estimates the gross consumption level for a large fraction of the net-metered customers in the state. Among the approximately 23,000 PG&E net-metered residential customers in that study’s sample, the average consumption is 1,148 kWh/month, and for the approximately 7,700 SCE net-metered residential customers, the average consumption is 1,434 kWh/month (DeBenedictis 2010). These latter data, in particular, imply that average consumption by residential customers with PV systems in California is roughly double the average consumption by all residential customers in the state, and is considerably higher than the customer sample used in the present analysis. Figure 3 shows the distribution of customer-months within our sample terminating in each usage tier (i.e., the highest usage tier reached in each customer-month). Among the PG&E customers in our sample, approximately one-third of all customer-months do not exceed Tiers 1 or 2, with most the remaining customer-months reaching Tiers 3 and 4, and 13% reaching Tier 5. The distribution for SCE customers in our sample is skewed slightly more towards high-usage tiers, with only 21% of customer-months terminating in Tiers 1 or 2, and almost one-quarter reaching Tier 5.
0%
5%
10%
15%
20%
25%
30%
35%
40%
1 2 3 4 5
Tier Level
Pe
rcen
tag
e o
f In
div
idu
al
Cu
sto
me
r-
Mo
nth
s w
ith
in E
ac
h T
ier
PG&E
SCE
Figure 3. Customer Sample Distribution by Usage Tier
Figure 4 shows the distribution, across customers in the sample, of the percentage of each customer’s annual usage occurring within each TOU period. Of greatest importance, in terms of understanding the relative cost of the flat rate vs. the TOU rate options, is the percentage of customers’ consumption occurring during the high-priced summer peak period. In the median case, 9.4% of PG&E customers’ annual usage and 9.8% of SCE customers’ annual usage occurs during each utility’s respective summer on-peak period. However, as indicated by the height of
11
the bars surrounding the median values, many customers’ load profiles are either more or less concentrated during the summer on-peak period.
0%
10%
20%
30%
40%
50%
60%
On-Peak Part-
Peak
Off-peak Part-
Peak
Off-peak On-Peak Off-peak On-Peak Off-peak
Summer Winter Summer Winter
Pe
rce
nt
of
An
nu
al
Co
ns
um
pti
on
in E
ac
h T
OU
Pe
rio
d
PG&E SCE
Note: Box plots identif y
10th/25th/50th/75th/90th
percentile values
Figure 4. Customer Load Distribution by TOU Period
2.3. Simulated PV Generation Data Each customer within our load data sample was matched with simulated PV production data. For our analysis, we used PV simulation data from the National Renewable Energy Laboratory (NREL), based on the PVFORM/PVWatts Model and the National Solar Radiation Database (NREL 2007, Denholm et al. 2009, NREL 2010). The data consists of simulated hourly AC electricity generation for a 1 kW system located at each of 73 weather stations located throughout California, derived from weather data for the same 12-month period as the customer load data (October 1, 2003 through September 30, 2004). Each customer within the load data set was assigned to the PV production data from the nearest of the 73 weather stations.25 We obtained simulated PV production data for a number of PV panel orientations. For our base case analysis, we used simulated production for a south-facing (i.e., 180º azimuth) system with a 25º tilt, as this is the azimuth that produces the most kWh per kW in the northern hemisphere, and 25º is a typical angle for a sloping rooftop. We also conducted sensitivity analyses for two alternate PV panel orientations: a 240º azimuth (approximately west-southwest, though we refer to this orientation from here on simply as “southwest”) with a 25º tilt, and flat-mounted system (i.e., tilt=0º). The southwest orientation was chosen because systems facing in that direction receive more sunlight during the summer on-peak TOU period when retail electricity rates are highest under the utilities’ TOU rates. The no-tilt orientation was chosen to represent systems
25 The weather station nearest to each customer was identified using GIS software. Because customer location data consisted only of the zip code within which each customer was located, the proximity of each weather station to each customer was based on the distance between the weather station and the centroid of the customer’s zip code.
12
installed on flat roofs, which are common in some parts of California. Both alternative PV orientations yield less annual PV generation than our base case orientation: based on the location of the customers in our sample, the southwest orientation results in 11% less PV electricity production in the median case, and the flat PV orientation results in 10% less electricity production. For each paired set of customer load and PV production data, the simulated hourly PV production was scaled so that total annual PV generation would equal specific percentages of the customer’s annual consumption (herein referred to as “PV-to-load ratio”). Three particular PV-to-load ratios – 25%, 50%, and 75% – were used throughout our analysis. In comparison, among the actual population of residential PV customers in California, the average PV-to-load ratio is approximately 56% for PG&E residential customers and 62% for SCE residential customers (DeBenedictis 2010). We did not include a case with a 100% PV-to-load ratio, as systems of this size would, under current net metering rules, result in forfeited bill credits at year-end for many customers. Figure 5 shows the percentage of annual PV electricity production within each retail-rate TOU period of the two utilities, for each of the three PV orientations included our analysis. Each bar in the figures represents the median value26, across the customers within the data sample; also included in the figures, for comparison, is the median percentage of customer load within each TOU period (as presented previously in Figure 4). Focusing first on the south-facing systems with a 25º tilt (our base-case PV orientation), 23% and 24% of annual PV electricity production is generated during the high-priced summer peak periods of PG&E and SCE, respectively. PV electricity production is therefore significantly more-concentrated during the summer peak period than is customer usage, with 9.4% of PG&E customer usage and 9.8% of SCE customer usage occurring within each utility’s respective summer peak period. When comparing between our base-case and alternate PV orientations, we find relatively modest changes in the distribution of PV production across TOU periods. Of most importance, perhaps, is that for both alternate orientations, electricity production is more highly concentrated during summer peak periods, compared to the base-case orientation. This effect is, as expected, more pronounced for the southwest-facing orientation, where 29% and 31% of electricity production occurs during the summer peak period for PG&E and SCE, respectively (compared to 23% and 28% in the base case). Also of note is that flat-mounted systems yield more highly concentrated electricity production during all summer TOU periods than the base-case orientation. This occurs because the angle of the sun is steeper during the summer, and thus the sunlight hits flat-mounted PV panels at a less oblique angle.
26 We present only the median value (rather than a box-and-whiskers chart, as used in other figures), as the distribution of PV production within each TOU period, across customers, is quite narrow.
South facing Flat Southwest facing Customer Load (Median)
PG&E SCE
Pe
rce
nt
of
An
nu
al
PV
Ge
ne
rati
on
/ C
us
tom
er
Lo
ad
in
Ea
ch
TO
U P
eri
od
(M
ed
ian
)
Figure 5. Distribution of PV Electricity Generation by Retail TOU Period
0%
5%
10%
15%
20%
25%
30%
35%
40%
45%
SP Sh N SP Sh N SP Sh N On Mid Off Mid Off SO
Summer Winter Spring Summer Winter
Perc
en
t o
f A
nn
ual
PV
Gen
era
tio
n
in E
ach
TO
D P
eri
od
(M
ed
ian
)
South facing Flat Southwest facing
SCEPG&E
PG&E
SP = Super-Peak
Sh=Shoulder
N=Night
SCE
On=On-Peak
Mid=Mid-Peak
Off=Off-peak
SO=Super-Off
Figure 6. Distribution of PV Electricity Generation by MPR-TOD Period
As described further in Section 2.4.2, our analysis also considers scenarios in which PV generation is compensated, in whole or in part, based on the utilities’ MPR pricing structures, which have different TOD period definitions than the utilities’ retail TOU rates. Figure 6 presents the distribution of PV production across the MPR-TOD periods for each PV orientation. As in the previous figure, each bar represents the median value across the customers within the data sample. Focusing first on the south-facing systems, 16% of annual PV generation occurs
14
within PG&E’s highest priced MPR-TOD period (Summer Super-Peak), and 17% occurs within SCE’s highest priced period (Summer On-Peak). These percentages are smaller than the corresponding values for the summer peak periods under the utilities’ retail TOU rates, because the highest priced MPR-TOD periods are defined to cover a narrower set of hours each day and/or a narrower set of months, as discussed previously. Similar to what was observed with the retail TOU rates, compared to the base-case PV orientation, the alternate PV orientations yield a greater percentage of total production during the highest-priced MPR-TOD periods. For the southwest-facing systems, 21% of annual production occurs within PG&E’s Summer Super-Peak MPR-TOD period as well as within SCE’s Summer On-Peak period. 2.4. Utility Bill Calculations We calculated annual utility bills for each customer, both with and without a PV system, under each of the currently available residential retail rates offered by the utility in whose service territory the customer is located. Utility bills with PV systems were calculated for each possible combination of:
• PV-to-load ratio (25%, 50%, and 75%);
• PV orientation (south-facing at a 25° tilt, southwest facing at a 25° tilt, and flat); and
All bill calculations are based on the retail rates, net metering rules (if applicable), and MPR prices (if applicable) in place as of March 2010. Further details on the bill calculation procedure for each PV compensation mechanism are as follows. 2.4.1. Net Metering For customers on the flat rate (that is, the non-TOU rate), monthly utility bills were calculated by first computing the customer’s net electricity consumption – that is, the difference between gross electricity consumption and PV electricity production – for the month. Net consumption was then compared to the customer’s baseline allocation for that month to determine the quantity of net consumption within each usage tier. Finally, the applicable price for each tier was applied to the net consumption quantity within each tier. For customers on a TOU rate, monthly utility bills are calculated according to the same basic series of steps, except that charges and credits are computed for each TOU period. First, the net electricity consumption within each TOU period of the month was calculated. Total net consumption for the billing month (i.e., the sum of the net consumption over all TOU periods) was then compared to the customer’s baseline allocation for that month to determine the quantity of consumption within each usage tier. Charges for net consumption within each usage tier were then calculated based on a weighted-average of the volumetric prices for each TOU period, where those prices were weighted according to the customer’s net consumption within each TOU period. This computation is described by equation (1):
15
( )∑=
⋅+⋅+⋅=
5
1
,,,
i
opiopppipppip
t
i crcrcrc
cBill (1)
where ci is the net consumption in tier i, ct is net consumption for the entire billing month, rp,i is the peak rate for tier i, cp is the net consumption during peak periods, rpp,i is the part-peak rate for tier i (if applicable), cpp is the net consumption during part-peak periods (if applicable), rop,i is the off-peak rate for tier i, cop is the net consumption during off-peak periods. 27 For all customers (both those on TOU rates and those on the default non-TOU rate), if the monthly charges calculated according to the preceding procedures are less than the minimum monthly charge under the given retail tariff, the difference is carried forward to the following billing month as a bill credit. However, at the end of the 12-month analysis period, any remaining bill credits are forfeited by the customer.28 2.4.2. Alternative PV Compensation Mechanisms Three hypothetical alternatives to net metering were considered under which some or all PV production is compensated at an MPR-based rate (rather than at the retail electricity rate, as under net metering) and is credited against charges for the customer’s usage. These three alternatives are:
(1) An MPR-based feed-in tariff, under which the customer is credited for all PV generation at the MPR rate;
(2) MPR-based hourly netting, whereby PV production can offset up to 100% of customer usage within each hour, but any excess hourly production is credited at the applicable MPR rate; and
(3) Monthly netting, whereby PV production can offset up to 100% of customer usage within each month (or, for customers on a TOU rate, within each TOU period of each month), but any excess production is credited at an MPR-based rate.
The first two of these alternative compensation mechanisms are modeled after – though not identical to – California’s existing feed-in tariffs for small renewable generators, which provide customers with certain solar and other renewable generation projects the option to either sell all electricity generated by their system at MPR-based prices or use their renewable generator to
27 Although the procedure embodied in equation (1) is defined for a rate structure with three TOU periods per month and five usage tiers (the most complex of the rate structures evaluated), it was used for all of the residential retail rates analyzed, by using constant prices across TOU periods for non-TOU rates and for TOU rates with only two TOU periods in a particular billing month, and by using constant prices across usage tiers for SCE’s TOU-D-T rate, which has only two tiers. 28 A recent law passed in California, Assembly Bill (AB) 920, alters this element of the net metering rules by requiring utilities to offer customers the choice either to receive compensation for net surplus electricity at the end of the year or to roll forward the net surplus electricity to be used as a credit against future electricity consumption. As of the writing of this report, revised tariffs implementing AB 920 had not yet been approved by the California Public Utilities Commission, and therefore the changes required by AB 920 are not reflected in our analysis.
16
first meet on-site load and sell only the excess generation to the utility at MPR-based prices.29 The third option is a variant of net metering that exists in a number of states, under which customers receive payment for monthly excess generation at an avoided cost based rate, rather than rolling the net excess generation forward to the following month and thereby receiving compensation at retail electricity prices. The bill calculation procedure for each of the three alternative compensation mechanisms is described below. In each case, we use the approved 2009 baseload MPR rate for a 20-year contract with deliveries beginning in 2010, equal to $0.09674.
Option 1: MPR-Based feed-in tariff. Under this option, all electricity generated by the PV system is compensated at the prevailing MPR-TOD rate. Compensation for PV generation and charges for consumption are therefore entirely independent of one another, and the consumption portion of the bill is the same as in the “no PV” case (i.e. the PV system is not installed “behind the meter”). Bill credits for PV electricity production in each MPR-TOD period are equal to the product of the quantity of PV generation in the TOD period, the MPR rate, and the applicable TOD factor. Bill credits for each TOD period are then summed to determine the total monthly bill credit for PV electricity production, which is then deducted from the charges for the customer’s consumption to determine the net monthly bill. Option 2: Hourly netting. This option represents a hybrid between standard net metering and a full feed-in tariff, whereby all PV production up to the customer’s usage level within each hour offsets consumption, but excess PV production within each hour is compensated at the prevailing MPR-TOD rate. To compute monthly utility bills under this compensation mechanism, net consumption (subject to a minimum value of zero) and excess PV production are computed for each hour. Hourly net consumption values are summed for each TOU period, and monthly charges for net consumption are then calculated in the same manner as under standard net metering. The monthly bill credit for PV electricity production is calculated in a similar manner as under Option 1, except that it is based on the sum of excess production within each hour of each MPR-TOD period (rather than on the sum of all PV production within each MPR-TOD period). Option 3: Monthly netting. This option is similar to Option 2, except that PV generation can offset up to 100% of the customer’s usage within each month (rather than only within each hour), and excess PV production at the end of the month is compensated at an MPR-based rate. In effect, the only difference between this option and standard net metering is that excess production at the end of each month is credited at an MPR-based rate, rather than at the retail rate. The application of the monthly netting option differs slightly depending on whether customers are taking service under a flat rate or TOU rate. For customers on a flat rate, PV production is netted against total monthly consumption, and any net excess PV production at the end of the month is compensated at a single MPR-based price. In that case, the MPR-based price is an average of the applicable MPR-TOD prices, weighted according
29 Under the “excess sales” option of the existing feed-in tariffs, excess generation may be computed on a sub-hourly basis. Within our analysis, however, excess generation is computed on an hourly basis, as that is the time resolution of our source of simulated solar generation data.
17
to the median percentage of PV production in each MPR-TOD period (see Table 4).30 For customers on a TOU rate, PV production is netted against monthly consumption within each
TOU period, and any net excess PV production within each TOU period at the end of the month is compensated at an MPR-based price defined for that particular TOU period. In this case, the MPR-based price for each retail rate TOU period is an average of the MPR-TOD prices overlapping the TOU period, weighted according to the median percentage of PV production occurring within each overlapping MPR-TOD period (see Table 4).31
Table 4. MPR-Based Prices for Monthly Excess PV Generation under the Monthly Netting Option
Season* TOU Period PG&E SCE
Customers on Flat Rates
Summer n/a $0.1310 $0.1907
Winter n/a $0.0919 $0.0841
Customers on TOU Rates
Peak $0.1819 $0.2571
Part-peak $0.1011 n/a Summer
Off-peak $0.0991 $0.0856
Peak n/a $0.0500
Part-peak $0.1108 n/a Winter
Off-peak $0.0915 $0.0468
* For PG&E, Winter is November-April, and Summer is May-October. For SCE, Winter is October-May, and Summer is June-September.
The bill calculation procedures described above are used to calculate the pre-tax value of the bill savings under each alternative compensation mechanism. However, explicit payments or bill credits provided to customers for generation exported to the grid (i.e., for generation not used to directly offset consumption) may be subject to federal and state income taxes. In that case, customers may then also be able depreciate the capital costs of their PV system, thereby offsetting, at least in part, taxes assessed on electricity sales. Given that these tax effects are somewhat uncertain, we have opted to focus primarily on the pre-tax value of the bill savings. However, as a “worst-case” scenario, we also estimate the after-tax bill savings under the assumption that customers are taxed for all electricity sales but do not depreciate the capital cost of their PV system. In this scenario, we assume that electricity sales are taxed at a federal personal income tax rate of 28% (the marginal rate for a married couple filing jointly with
30 That is, for each retail rate season, the median percentage, across all customers, of PV generation within each overlapping MPR-TOD period is calculated. Those percentages are then applied to the corresponding MPR-TOD prices to determine a weighted-average seasonal MPR-based price that reflects the median distribution of PV generation within the season. These prices are then applied to monthly net excess generation within the season for all customers taking service on a flat rate under the monthly netting option. 31 The MPR-based prices for customers on TOU rates under the monthly netting option are calculated and applied in an analogous manner as for customers on flat rates, the only difference being that the prices are based on the median distribution of PV generation occurring within each retail rate TOU period (rather than within the season).
18
taxable income of $137,300 - $209,250 in 2010) and a California personal income tax of 9.55% (the rate for married couples filing jointly with income greater than $92,698). 2.5. Value of Bill Savings Metric To determine the value of the utility bill savings to each customer, we compare the annual utility bill with and without a PV system, for each combination of PV-to-load ratio, PV orientation, and compensation mechanism. Unless otherwise noted, we assume that customers choose the least-cost rate before and after PV installation. We express the bill savings on a $/kWh basis, in terms of the annual reduction in the utility bill per kWh generated by the PV system, as shown in equation (2):
GenerationPV
BillBill SavingsBill of Value PVnoPV −= (2)
Expressing the value of bill savings in terms of $/kWh allows for a direct comparison of electricity bills between customers with different loads as well as between alternate PV-to-load ratios. Also, since electricity is charged to retail customers per kWh and the rate paid to generators (e.g. MPR rate) is also per unit energy output, the units and the significance of the numbers can easily be interpreted.
19
3. Least-Cost Rate Selection with Net Metering
For customers that can choose between multiple rate options – in the case of PG&E and SCE residential customers, between a flat rate and a TOU rate – the choice of retail rate can potentially impact the value of bill savings from PV. Throughout most of our analysis, we assume that customers select the least-cost rate, both before and after PV installation. In this chapter, we first compare the cost of electricity between each utility’s flat and TOU rate options, and show how the least-cost rate choice varies across customers, PV-to-load ratios, and alternate PV panel orientations. We then examine in more detail how the least-cost rate option depends on customers’ load characteristics – specifically, the amount of net consumption and the peakiness of the hourly consumption profile. The results presented in this chapter assume that PV production is compensated via net metering; in Chapter 5, we present an abbreviated analysis of least-cost rate selection under the three alternative PV compensation mechanisms. 3.1. Least-Cost Rate Choice across PV-to-Load Ratios We define the cost of electricity (COE) as a customer’s total annual bill divided by its net annual consumption, which effectively represents the average price paid by the customer for each kWh of net consumption. Figure 7 shows the distribution, across customers in the sample, of the difference between the COE on the TOU rate and on the flat rate. Thus, a positive value on the graph indicates that the flat rate is least-cost, and a negative value indicates that the TOU rate is least-cost. Across the PG&E customers in our sample, the flat rate is consistently least-cost when no PV system is installed, with a median COE $0.014/kWh less than the TOU rate. As the PV-to-load ratio increases, however, the TOU rate becomes progressively more attractive, relative to the flat rate. The logic underlying this trend is simply that, at a low PV-to-load ratio, most customers in the sample would have too much usage during high-priced TOU periods for the TOU rate to be least-cost. However, as the PV system increases in size, it disproportionately reduces the customer’s net consumption during high-priced TOU periods, driving down the annual bill on the TOU rate faster than on the flat rate. At a PV-to-load ratio of 75%, the COE on the TOU rate is, on average, substantially less than on the flat rate, with half of the customers in the sample paying at least $0.025/kWh less on the TOU rate, and one-quarter of the customers paying at least $0.061/kWh less. Note, however, that the apparently large difference between the COE on the TOU and the flat rate at a 75% PV-to-load ratio is partly the result of the fact that net consumption (i.e., the denominator in the COE calculation) is relatively small – thus, a relatively large difference in COE between the two rates does not necessarily imply a large difference in the absolute dollar size of the annual utility bill. The trend for the SCE customers in the sample bears some qualitative similarities to the trend for PG&E customers – namely, the TOU rate becomes progressively more attractive at a higher PV-to-load ratio. However, at any given PV-to-load ratio, SCE’s TOU rate is relatively more attractive compared to its flat rate, than it is for PG&E. With no PV system, the median difference in COE between the TOU rate and flat rate is approximately zero, and at a 75% PV-to-load ratio, the median COE for the TOU rate is $0.044/kWh less than the flat rate (compared to $0.024/kWh less for the PG&E customers). The fact that SCE’s TOU rate is relatively more
20
attractive than PG&E’s can be loosely attributed to the fact that SCE’s TOU rate has only one TOU period (the summer peak period) with prices higher than the flat rate, while PG&E’s TOU rate has two TOU periods (the summer peak and summer part-peak periods) with prices higher than the flat rate.
-$0.10
-$0.08
-$0.06
-$0.04
-$0.02
$0.00
$0.02
$0.04
0% 25% 50% 75% 0% 25% 50% 75%
PV-to-Load Ratio
CO
E o
n T
OU
min
us
CO
E o
n F
lat
Rate
($ /
net
kW
h)
PG&E SCE
Note: Box plots identify
10th/25th/50th/75th/90th
percentile values
Figure 7. Difference between COE on TOU and Flat Rate
Given the relative COE of the available rate options, Figure 8 shows the corresponding percentage of customers in the sample for which the TOU rate would be the least-cost option. Focusing first on PG&E customers, we see that with no PV system, the TOU rate is least-cost for almost none of the customers in our sample. As the PV-to-load ratio increases, the TOU rate steadily becomes more attractive (for reasons described previously), becoming least-cost for 78% of customers at a PV-to-load ratio of 75%. Among the SCE customers in our sample, 54% would find the TOU rate least-cost with no PV system installed, and at a PV-to-load ratio of 75%, virtually all of the customers would find the TOU rate least-cost. The previous analyses assumed our base-case PV panel orientation (south-facing at 25° tilt). Figure 9, however, shows the least-cost rate both for the base-case orientation as well as the two alternate PV orientations considered (southwest-facing at 25° tilt and flat). For PG&E customers, we see that, with the alternate PV orientations, a somewhat larger percentage of customers would find the TOU rate to be least-cost, compared to our base-case orientation. This is as one would expect, given that the alternate PV orientations result in a higher percentage of PV production occurring during the TOU peak period (as shown previously in Figure 5), which will tend to make the net consumption profile less peaky and the TOU rate more attractive. A similar, though much less pronounced trend, is evident for SCE customers.
21
0%
10%
20%
30%
40%
50%
60%
70%
80%
90%
100%
0% 25% 50% 75%
PV-to-Load Ratio
Pe
rce
nt
of
Cu
sto
mers
fo
r w
hic
h T
OU
Ra
te i
s L
eas
t C
os
t
PGE (N=118)
SCE (N=97)
Figure 8. Least-Cost Rate Choice at Varying PV-to-load Ratios
0%
10%
20%
30%
40%
50%
60%
70%
80%
90%
100%
25% 50% 75% 25% 50% 75%
PV-to-Load Ratio
Perc
en
t o
f C
usto
me
rs f
or
wh
ich
TO
U R
ate
is
Le
as
t C
os
t
South facing
Flat
Southwest facing
PG&E SCE
Figure 9. Least-Cost Rate Choice under Alternate PV Orientations
3.2. Impact of Customer Size and Usage Profile on Least-Cost Rate Option For any given set of rate options and PV-to-load ratio, the least-cost rate option will be determined by the characteristics of the customer’s consumption pattern. This relationship is illustrated in Figure 10 and Figure 11, which show, for each individual customer, its net annual consumption (on the x-axis, as a percent of baseline), the peakiness of its net load shape (on the
22
y-axis, expressed in terms of net summer peak period consumption as a percent of net annual consumption), and its least-cost rate choice. For both utilities, the peakiness of the customer’s net load shape is the primary determinant of whether the flat rate or TOU rate is least-cost, where customers with relatively peaky load shapes tend to prefer the flat rate. However, net annual consumption is also important, as indicated by the fact that lower-usage customers tend to find the flat rate least-cost. In the case of PG&E, this is due to the fact that its TOU rate (but not its flat rate) contains a fixed daily charge, which adds about $8 to the monthly bill. For low-usage customers with a relatively flat net load shape, this fixed charge is large enough to offset the cost advantage that the TOU rate would otherwise provide. For SCE, net annual consumption has a more modest impact on the least-cost rate choice. Nonetheless, there is a tendency for SCE’s higher-usage customers to prefer the TOU rate because SCE’s TOU rate has fewer usage tiers than its flat rate.
0%
5%
10%
15%
20%
0% 200% 400% 600%
Flat rate (PG&E E-1)
TOU rate (PG&E E-6)
Ne
t S
um
me
r O
n-P
eak
Co
ns
um
pti
on
as
% o
f N
et
An
nu
al
Co
ns
um
pti
on
(a)
No PV
Net Annual Consumption as % of Baseline
-5%
0%
5%
10%
15%
20%
0% 100% 200% 300% 400%Ne
t S
um
me
r O
n-P
ea
k C
on
su
mp
tio
n
as %
of
Ne
t A
nn
ua
l C
on
su
mp
tio
n
(b)
25% PV-to-Load Ratio
Net Annual Consumption as % of Baseline
-20%
-15%
-10%
-5%
0%
5%
10%
15%
20%
0% 100% 200% 300%Ne
t S
um
me
r O
n-P
ea
k C
on
su
mp
tio
n
as %
of
Ne
t A
nn
ua
l C
on
su
mp
tio
n
(c) Net Annual Consumption as % of Baseline
50% PV-to-Load Ratio
-60%
-50%
-40%
-30%
-20%
-10%
0%
10%
20%
0% 50% 100% 150%Ne
t S
um
me
r O
n-P
ea
k C
on
su
mp
tio
n
as
% o
f N
et
An
nu
al
Co
ns
um
pti
on
(d) Net Annual Consumption as % of Baseline
75% PV-to-Load Ratio
Figure 10. Customer Characteristics Associated with Least-Cost Rate Choice (PG&E)
23
0%
5%
10%
15%
20%
25%
0% 200% 400% 600% 800%
Flat rate (SCE D)TOU rate (SCE TOU-D-T)
(a)
Net
Su
mm
er
On
-Pe
ak
Co
ns
um
pti
on
as %
of
Ne
t A
nn
ua
l C
on
su
mp
tio
n
Net Annual Consumption as % of Baseline
No PV
-5%
0%
5%
10%
15%
20%
25%
0% 100% 200% 300% 400%Ne
t S
um
me
r O
n-P
ea
k C
on
su
mp
tio
n
as
% o
f N
et
An
nu
al
Co
ns
um
pti
on
(b) Net Annual Consumption as % of Baseline
25% PV-to-Load Ratio
-20%
-10%
0%
10%
20%
30%
0% 100% 200% 300% 400%
Ne
t S
um
me
r O
n-P
ea
k
Co
ns
um
pti
on
as
% o
f N
et
An
nu
al
Co
ns
um
pti
on
(c) Net Annual Consumption as % of Baseline
50% PV-to-Load Ratio
-60%
-50%
-40%
-30%
-20%
-10%
0%
10%
20%
30%
0% 50% 100% 150% 200%
Ne
t S
um
me
r O
n-P
ea
k C
on
su
mp
tio
n
as
% o
f N
et
An
nu
al
Co
ns
um
pti
on
(d) Net Annual Consumption as % of Baseline
75% PV-to-Load Ratio
Figure 11. Customer Characteristics Associated with Least-Cost Rate Choice (SCE)
24
4. Bill Savings under Current Retail Rates and Net Metering Rules
This chapter presents the results of our analysis of the value of the bill savings from PV for the PG&E and SCE residential customers in our sample, based on current retail rates and current net metering rules. We first present results for our base-case assumptions at varying PV-to-load ratios, highlighting the significance of customer usage level on the value of the bill savings. We then present two sensitivity analyses showing how sub-optimal rate selection and alternate PV panel orientations affect the value of the bill savings. Last, we present two peripheral, but related, analyses. The first of these briefly investigates the impact of recent change to SCE’s TOU rates on the bill savings realized through net metering. The second explores certain implications of a specific provision within existing net metering tariffs – forfeiture by the customer of any excess bill credits at year-end – by identifying the PV-to-load ratio at which each customer would exhaust its annual bill credits. 4.1. Bill Savings under Base-Case Assumptions Figure 12 presents the distribution in the value of bill savings across customers in our sample, under our base-case assumptions (least-cost rate choice both before and after PV installation, and south-facing PV panels at a 25° tilt). Bill savings are expressed in terms of the calculated reduction in the annual utility bill per kWh of PV electricity generated. Across the PV-to-load ratios shown, the median bill savings ranges from $0.19-$0.25/kWh for the PG&E customers in our sample, and from $0.20-$0.24/kWh for the SCE customers. Median bill savings are somewhat higher for the PG&E customers, because PG&E’s retail rates are generally somewhat higher than SCE’s (as shown previously in Figure 1), leading to a slightly higher average bill savings from PV.
$0.00
$0.05
$0.10
$0.15
$0.20
$0.25
$0.30
$0.35
$0.40
$0.45
$0.50
25% 50% 75% 25% 50% 75%
PV-to-Load Ratio
Valu
e o
f B
ill
Savin
gs (
$/k
Wh
)
PG&E SCE
Note: Box plots identify
10th/25th/50th/75th/90th
percentile values
Figure 12. Distribution in Bill Savings under Net Metering and Base-Case Assumptions
25
As evident by the height of the box-plots in Figure 12, the value of the bill savings varies significantly across customers at each given PV-to-load ratio, though the distributions are substantially wider for PG&E than for SCE. This variation across customers is associated primarily with differences in customer usage level, where higher usage customers receive greater bill savings from PV by offsetting higher-priced usage within the upper usage tiers. The specific relationship between the per-kWh value of bill savings and customer usage level is shown in Figure 13, which plots the value of bill savings for each customer against the customer’s gross annual consumption (as a percent of the baseline allocation). For the PG&E customers in the sample, the value of bill savings increases steadily with customer consumption. At a 50% PV-to-load ratio, for example, the value rises from a low of approximately $0.12/kWh for customers in Tier 1 to $0.36-$0.46/kWh for customers in Tier 5. In contrast, the value of bill savings for the SCE customers in the sample increases at a much more gradual pace, and tapers off with increases in usage above the Tier 5 threshold: at a 50% PV-to-load ratio, the bill savings for the SCE customers in our sample rises from approximately $0.14/kWh for customers in Tier 1 to $0.24-0.29/kWh for customers in Tier 5. The differing trend between the two utilities is a result of differences between their retail rate structures – specifically, the fact that SCE’s flat rate has less steep usage tiers than PG&E’s, and that SCE’s TOU rate has only two usage tiers, while PG&E’s has five. Consequently, high-usage SCE customers face a significantly lower marginal price for their usage than do PG&E customers, resulting in lower bill savings from net metered PV for those customers.
PG&E
$0.00
$0.10
$0.20
$0.30
$0.40
$0.50
0% 100% 200% 300% 400% 500%
Valu
e o
f B
ill
Savin
gs (
$/k
Wh
)
25% PV-to-Load Ratio50% PV-to-Load Ratio75% PV-to-Load Ratio
Tier 1 Tier
3
Tier 4 Tier 5
Tie
r 2
SCE
0% 100% 200% 300% 400% 500%
Tier 1 Tier 4 Tier 5Tier
3Tie
r 2
Gross Annual Consumption as % of Baseline Figure 13. Variation in Bill Savings with Customer Gross Annual Consumption
The fact that bill savings value increases with customer consumption has an important implication for the applicability of our results to the population of net metered residential customers in California. As described earlier in Section 2.2, the average consumption of customers in our data sample is significantly lower than the average consumption of the actual population of residential customers with PV in California. As such, though our analysis is still
26
valid in presenting the bill savings impacts of PV over a range of residential customer characteristics, it likely understates the median bill savings for the actual population of residential customers in California with net metered PV. Another key trend exhibited in Figure 12 is that the per-kWh value of bill savings declines with an increasing PV-to-load ratio. This trend is also illustrated in Figure 13 by the downward shift in the per-kWh bill savings for each customer, with each successive increase in the PV-to-load ratio. This decline occurs for the simple reason that incremental increases in PV production offset consumption in progressively lower-priced usage tiers. As such, the decline in the per-kWh value of bill savings with PV-to-load ratio is particularly pronounced for the high-usage PG&E customers in our sample, as these customers progress through a larger number of lower-priced usage tiers than would a lower-usage customer that starts from a lower initial tier. This can be seen in the precipitous drop in the upper tail of the PG&E distribution in Figure 12, where the 90th percentile value of bill savings declines from $0.45/kWh to $0.33/kWh when the PV-to-load ratio increases from 25% to 75%. We do not observe the same magnitude of drop off for the SCE customers in our sample (for which the decline in the 90th percentile value of bill savings is from $0.29/kWh to $0.25/kWh), primarily because the majority of the SCE customers in our sample with PV are found to minimize their bill by taking service under the TOU rate, which has only two usage tiers, and also because the usage tiers under SCE’s flat rate are significantly less steep than under PG&E’s flat rate. 4.2. Net Metering Sensitivity Analyses We conducted two sensitivity analyses to examine how deviations from our base-case assumptions affect the value of bill savings from PV under net metering. The first sensitivity analysis examines the impact of sub-optimal rate choice, and illustrates the importance of proper rate selection for customers seeking to maximize the value of the bill savings from their PV system. The second sensitivity analysis examines alternate PV panel orientations, showing that, under certain circumstances, the alternate PV orientations can lead to a slightly higher bill savings on a per-kWh basis, although the absolute dollar magnitude of the bill savings produced by such systems may be lower due to reduced annual PV production per kW of installed capacity. 4.2.1. Impact of Sub-Optimal Rate Choice on Bill Savings The base case analysis assumed that customers chose the lowest cost rate before and after installation of their PV systems. Given that customers may not always choose the least-cost rate, however, we also calculated the value of bill savings assuming that all customers choose the most expensive rate after PV installation, but continue to select the least-cost rate prior to PV installation.32 This combination of assumptions results in the lowest value of bill savings
32 There is some evidence that, in fact, many PV customers do not select the least-cost rate – or more specifically, that customers remain on the flat rate rather than switching to TOU, even if doing so would reduce their bill. Energy and Environmental Economics (2010) identifies the actual rate choice of net metered PG&E and SCE customers, indicating that approximately 13% of the residential PG&E customers and 4% of the SCE customers appear to be taking service on a TOU rate. Although we do not know the PV-to-load ratio for these customers, our analysis suggests that the TOU rates likely would be the least-cost option for a much larger fraction of these customers.
27
possible, among the various combinations of assumptions about rate choices, and thus helps to illustrate both the significance of our base-case assumption, as well, more generally, the importance of proper rate selection for customers with net metered PV. For each customer, we then calculated the difference between the value of the bill savings under the worst-case rate selection assumptions and under the least-cost (i.e., base-case) rate selection assumptions. Figure 14 shows the distribution, across customers, in the difference in value of the bill savings between these two cases, at varying PV-to-load ratios. The values are thus negative, as sub-optimal rate selection causes a reduction in the bill savings value. In general, the results indicate that sub-optimal rate selection can have a sizable impact on the value of the bill savings for some customers at low PV-to-load ratios, but has a relatively modest effect at higher PV-to-load ratios. Specifically, at a 25% PV-to-load ratio, the median reduction in bill savings resulting from sub-optimal rate selection is $0.028/kWh (or an 11% decrease) and $0.021/kWh (a 10% decrease) for the PG&E and SCE customers in our sample, respectively. However, the distributions at a 25% PV-to-load ratio are wide, with some customers – in particular, those with particularly flat or peaky load profiles who would be much better off on one rate than on the other – experiencing a substantially greater loss of bill savings. For example, one-quarter of the PG&E customers in our sample would experience a decline of $0.049/kWh (23%) or more, and one-quarter of the SCE customers would see a decline of $0.039/kWh (17%) or more.
-$0.07
-$0.06
-$0.05
-$0.04
-$0.03
-$0.02
-$0.01
$0.00
25% 50% 75% 25% 50% 75%
PV-to-Load Ratio
Dif
fere
nc
e i
n V
alu
e o
f B
ill
Sa
vin
gs
Be
twe
en
Su
b-O
pti
ma
l a
nd
Op
tim
al
Ra
te S
ele
cti
on
($
/kW
h)
PG&E SCE
Note: Box plots identify
10th/25th/50th/75th/90th
percentile values
Figure 14. Distribution in the Effect of Sub-Optimal Rate Selection on the Value of Bill Savings
At higher PV-to-load ratios, the impact of sub-optimal rate selection on the value of bill savings is diminished. This is fundamentally a mathematical phenomenon: at higher PV-to-load ratios, customers’ net consumption, and thus their exposure to retail rates, is lower, reducing the absolute dollar impact of the choice between rate options. At the same time, the amount of PV
28
generation is greater, reducing the dollar impact per kWh generated even further. Thus, for PG&E customers, the median loss in bill savings associated with improper post-PV rate selection declines to $0.012/kWh (a 5% decrease) and $0.013/kWh (6%) at 50% and 75% PV-to-load ratios, respectively. For SCE customers, the median loss in bill savings declines to $0.016/kWh (a 7% decrease) and $0.015/kWh (7%) at 50% and 75% PV-to-load ratios. 4.2.2. Impact of PV Panel Orientation on Bill Savings The results presented in Section 4.1 assumed that PV panels were facing due-south at a 25° tilt. To test the effect of alternate PV orientations, we also calculated the per-kWh value of bill savings for systems facing at an azimuth of 240° (approximately west-southwest) with a 25° tilt, and for systems with no tilt (i.e. mounted flat on a non-sloping rooftop). Figure 15shows the difference in the per-kWh value of the bill savings between each alternative PV orientation and our base-case orientation. In general, the difference in bill savings between alternate PV orientations is quite modest – in most cases, less than $0.01/kWh or 5% – and can be either positive or negative. For most PG&E customers, the flat orientation results in slightly lower bill savings per kWh than the base-case orientation, particularly at low PV-to-load ratios, while the southwest-facing system generally results in higher per-kWh bill savings than the base-case orientation. For SCE customers, both alternate orientations generally yield higher per-kWh bill savings than the base-case orientation.
-$0.010
-$0.005
$0.000
$0.005
$0.010
$0.015
25% 50% 75% 25% 50% 75% 25% 50% 75% 25% 50% 75%
PV-to-Load Ratio
PG&E SCE
Flat SW Facing Flat SW
Facing
Note: Box plots identif y
10th/25th/50th/75th/90th
percentile values
Inc
rea
se
d V
alu
e o
f B
ill
Sa
vin
gs
fro
m
Ori
en
tati
on
Oth
er
tha
n S
ou
th 2
5º
($/k
Wh
)
Figure 15. Difference in Bill Savings between Alternate and Base-Case PV Orientations
To be clear, the comparisons presented in Figure 15 are intended only to illustrate whether deviations from the base-case PV panel orientation would significantly alter our results. These comparisons do not, however, indicate which orientation would produce a greater absolute level of bill savings (in terms of the total dollar reduction in annual utility bills), as the quantity of PV electricity production also varies among orientations. In the median case, the west-southwest
29
orientation results in 11% less PV electricity production than the south-facing orientation, and the flat PV orientation results in 10% less electricity production. These effects are, in fact, much more significant than the change in the per-kWh value of the bill savings across the three PV panel orientations, and imply that, for most customers, the absolute dollar amount of bill savings would be lower under the alternative PV panel orientations than under the base-case orientation, irrespective of the changes in the per-kWh value of bill savings shown in Figure 15. 4.3. Impact of Changes to SCE’s TOU Rates on the Bill Savings under Net Metering One feature of net metering is that the bill savings can change over time as a result of changes to the underlying retail rate. As an illustration, we consider the impact of changes to SCE’s residential TOU rates at the end of 2009.33 Prior to October 2009, SCE offered two TOU rates to residential customers, schedules TOU-D-1 and TOU-D-2, which are now closed to new customers (though still available for customers that were already enrolled). Unlike the new TOU-D-T rate, the old TOU rates had no usage tiers,34 which provided a strong incentive for high-usage customers to opt for a TOU rate and thereby avoid the high-priced usage tiers under the flat rate. To characterize the impact of this revision to SCE’s residential TOU rates on net metered PV customers, we calculated, for each SCE customer in the sample, the bill savings under the pre-October 2009 set of rate options – assuming, as usual, that customers choose the least-cost rate option available – and compared it to the bill savings under the current set of rate options (i.e., the base-case results, presented earlier).35 Figure 16 shows the difference in the value of bill savings, for each customer, under the current set of rate options and under the pre-October 2009 rate options. Thus, a positive value indicates that the current rate options result in higher bill savings. In the median case, the impact is small, with most customers receiving bill savings that are approximately $0.01-$0.02/kWh greater under the current set of rate options. However, for high-usage customers, the current set of rate options appears to result in a fairly sizable increase in the value of the bill savings. This is because, under the previous set of rate options, high-usage SCE customers without PV systems are found to opt for one of the TOU rate options, in order to avoid the high-priced usage tiers under the flat rate. Because the new TOU rate includes usage tiers, utility bills for high-usage customers without PV systems are higher, which in turn results in a larger decrease in the utility bills after a PV system is installed. Separate from that dynamic, the introduction of usage tiers in the TOU rate also results in an increase in utility bills at high PV-to-load ratios, as the incremental PV generation tends to displace usage in the lower-
33 Of note, PG&E recently proposed a major revision to its residential retail rates, under which Tiers 3, 4, and 5 would be combined into a single usage tier, and baseline allotments would be reduced. Although we do not analyze this rate proposal here, it would likely have a significant impact on the value of the bill savings received by high-usage customers with net metered PV systems. 34 Schedule-TOU-D-1 does, however, offer a discount of $0.035/kWh for usage within the baseline tier. 35 To be clear, in one case, we assume customers select the least cost option (both before and after PV installation) among the flat rate and the two old TOU rates, and in the other case, between the flat rate and the current TOU rate. In reality, customers that were previously taking service on one of the old TOU rates could switch to the new TOU rate; however, for simplicity, we did not include this combination of choices within our analysis.
30
priced usage tier. Consequently, the difference in the value of the bill savings between the current and old set of rate options tends to diminish at higher PV-to-load ratios.
-$0.02
$0.00
$0.02
$0.04
$0.06
$0.08
$0.10
0% 100% 200% 300% 400% 500% 600%
Gross Annual Consumption as % of Baseline
Va
lue
of
Bil
l S
av
ing
s w
ith
TO
U-D
-T
Min
us
Va
lue
of
Bil
l S
av
ing
s
wit
h T
OU
-D-1
/2 (
$/k
Wh
)
25% PV-to-Load Ratio
50% PV-to-Load Ratio
75% PV-to-Load Ratio
Tier 1 Tier 3 Tier 4 Tier 5
Tie
r 2
Figure 16. Difference in Bill Savings between Current and Old SCE Rate Options
4.4. Maximum PV Size to Exhaust Annual Bill Savings The net metering tariffs in place as of March 2010 allow customers to offset all volumetric energy charges over the course of year, but any excess bill credits remaining at year-end are forfeited by the customer.36 As discussed previously in Chapter 3, at relatively high PV-to-load ratios, most PG&E and SCE customers would minimize their utility bill on the TOU rate option. Because PV production is typically more highly concentrated during high-priced TOU periods than is customer consumption, most customers would therefore exhaust their annual bill savings with a PV system that is sized to meet less than 100% of their annual consumption. Figure 17 presents cumulative frequency distributions showing the percentage of customers that would exhaust their annual bill savings at varying PV-to-load ratios As shown, 86% of the PG&E customers in the sample, and 97% of the SCE customers would exhaust their bill savings with PV systems sized to meet less than 100% of their annual usage. In the median case, the PG&E customers exhaust their bill savings at a PV-to-load ratio of 93%, and the SCE customers do so at a PV-to-load ratio of 92%.
36 A recent law passed in California, Assembly Bill (AB) 920, alters this element of the net metering rules by requiring utilities to offer customers the choice either to receive compensation for net surplus electricity at the end of the year or to roll forward the net surplus electricity to be used as a credit against future electricity consumption. As of the writing of this report, revised tariffs implementing AB 920 had not yet been approved by the California Public Utilities Commission, and therefore the changes required by AB 920 are not reflected in our analysis.
31
0%
10%
20%
30%
40%
50%
60%
70%
80%
90%
100%
75% 80% 85% 90% 95% 100% 105% 110% 115%
PV-to-Load Ratio
Pe
rce
nt
of
Sam
ple
fo
r w
hic
h P
V
Sy
ste
m E
xh
au
sts
An
nu
al
Bil
l S
avin
gs
PG&E
SCE
Figure 17. PV System Size that Exhausts Annual Bill Savings
32
5. Bill Savings under Alternative PV Compensation Mechanisms
In this chapter, we compare the bill savings between net metering and each of three alternative compensation mechanisms, under which some or all PV generation is compensated at prices based on the state’s Market Price Referent (MPR), rather than at the customer’s retail rate.37 These three alternatives are:
(1) An MPR-based feed-in tariff, under which the customer is credited for all PV generation at the MPR rate multiplied by the applicable MPR-TOD adjustment factors;
(2) Hourly netting, whereby PV production can offset up to 100% of customer usage within each hour, but any excess hourly production is credited at the applicable MPR rate; and
(3) Monthly netting, whereby PV production can offset up to 100% of customer usage within each month (or, for customers on a TOU rate, within each TOU period of each month), but any excess production is credited at an MPR-based rate.
The first two of these alternative compensation mechanisms are similar – though not identical – to compensation options currently offered though California’s small renewable generator feed-in tariff program.38 The third alternative is a variant of net metering that exists in a number of states, under which customers receive payment for monthly excess generation at an avoided cost based rate, rather than rolling the net excess generation forward to the following month and thereby receiving compensation at retail electricity prices. The MPR-based prices paid under each of these alternatives are based on the 2009 MPR prices (CPUC 2009). However, MPR prices are adjusted annually and are based in part on contemporaneous long-term projections of natural gas prices, which can change significantly from year to year; thus, any comparison between the bill savings under net metering and under MPR-based alternatives is also subject to such fluctuation. Although these three options are reasonable points of comparison to the existing net metering tariffs in California, they by no means represent the universe of possible alternatives, either in terms of pricing or structure. With respect to pricing, the MPR-based price paid for excess PV production under each of these alternatives reflects only avoided generation costs. Cost-benefit analyses of distributed PV often identify other benefits to utilities and ratepayer, including, though not limited to, deferred T&D capacity upgrades and reduced line losses. As such, the MPR arguably represents a lower-bound on the value of distributed PV production to the utility and ratepayers. Although we do not comprehensively examine the range of other possible benefits of distributed PV, at the end of this chapter, we do explore the potential impact of
37 Net metered customers in California are exempt from interconnection fees. In comparing the bill savings between net metering and the alternative compensation mechanisms, we assume no difference in interconnection costs or other ancillary costs of participation (e.g., meter costs) born by the customer. 38 California’s small renewable generator feed-in tariff program is available to certain solar and other renewable generation projects smaller than 1.5 MW. That program, which provides an alternative to net metering, provides customers with the option to either sell all electricity generated by their system under an MPR-based feed-in tariff or to use their renewable generator to first meet on-site load and sell only the excess generation to the utility under the feed-in tariff. Under the latter, “excess sales” option, excess generation may be computed on a sub-hourly basis. Within our analysis, however, the smallest time interval over which excess generation is computed is an hourly basis, as that is the time resolution of our source of simulated PV generation data.
33
increasing the prices paid under the alternative compensation mechanisms to reflect avoided T&D costs and reduced line losses. The comparisons presented in this chapter between net metering and the alternative compensation mechanisms focus primarily on the pre-tax value of the bill savings or payments for net excess generation. However, unlike the bill savings that customers receive through net metering, explicit payments or bill credits provided to customers for generation exported to the grid may be subject to federal and state income taxes. In that case, customers may then also be able depreciate the capital costs of their PV system, thereby offsetting, at least in part, taxes assessed on electricity sales. Given that these tax effects are somewhat uncertain, we have opted to compare bill savings primarily on a pre-tax basis. However, as a “worst-case” scenario, we also present comparisons under the assumption that customers are taxed for electricity sales but do not depreciate the capital cost of their PV system. 5.1. Net Excess PV Production Under the hourly and monthly netting options, only a portion of PV production – the hourly or monthly net excess PV generation, respectively – is compensated at MPR-based prices rather than at the retail rate. Figure 18 shows the portion of annual PV production subject to MPR-based prices (i.e., total annual net excess generation as a percentage of total annual generation), based on all PG&E and SCE customers in the sample combined. Net excess generation is computed in three different ways: on an hourly basis (for the hourly netting option), a monthly TOU-period basis (for customers on a TOU rate under the monthly netting option), or a simple monthly basis (for customers on a flat rate under the monthly netting option).
0%
10%
20%
30%
40%
50%
60%
70%
80%
0% 20% 40% 60% 80% 100%
PV-to-Load Ratio
Ex
ce
ss g
en
era
tio
n f
rom
PV
(% o
f a
nn
ua
l P
V g
en
era
tio
n) Hourly Netting
Monthly Netting Flat
Monthly Netting TOU
Solid lines represent
m edian values ; dashed
lines represent 25 th and
75 th percentile values
Figure 18. Annual Net Excess PV Generation under Hourly and Monthly Netting Options
34
As to be expected, annual net excess PV generation as a percentage of total generation rises with the PV-to-load ratio, and is greatest under hourly netting and least under simple monthly netting for customers on a flat rate. With hourly netting, net excess generation begins to occur at a PV-to-load ratio of roughly 10% (in the median case), rising to approximately 5% of total annual PV generation at a 25% PV-to-load ratio and to 44% at a 75% PV-to-load ratio. For monthly-TOU netting, net excess generation begins to occur at PV-to-load ratios greater than about 30%, reaching 15% of total PV generation at a 75% PV-to-load ratio. Finally, when calculated on a simple monthly basis for customers on a flat rate, net excess generation occurs only at PV-to-load ratios greater than about 65%, reaching just 3% of total annual PV generation at a 75% PV-to-load ratio. From this analysis, we can see that, with monthly netting, a relatively small portion of PV generation is compensated in a different manner than under net metering. 5.2. Least-Cost Rate Choice under Alternative Compensation Mechanisms Bill savings under the hourly and monthly netting options depend in part on customer rate choices, just as under net metering. As in the net metering analysis, we assume that customers take service under the least-cost rate option, both before and after PV installation. Figure 19 identifies, for each compensation mechanism and across PV-to-load ratios, the percentage of customers for which the TOU rate would be the least-cost option.
0%
10%
20%
30%
40%
50%
60%
70%
80%
90%
100%
0% 25% 50% 75% 0% 25% 50% 75%
PV-to-Load Ratio
Perc
en
t o
f C
usto
mers
fo
r w
hic
h
TO
U r
ate
is L
east
Co
st
Net Metering
MPR Feed-in Tariff
MPR Hourly Netting
MPR Monthly Netting
PG&E SCE
Figure 19. Least-Cost Rate Choice under Alternative PV Compensation Mechanisms
In general, the results show that, under the alternative compensation mechanisms, customers’ least-cost rate choice is less dependent on the PV-to-load ratio and, consequently, TOU rates are the least-cost rate option for a smaller percentage of customers than under net metering. Under the full MPR-based feed-in tariff, the least-cost rate is, as one would expect, wholly independent of the PV-to-load ratio and is therefore simply based on whatever the least-cost rate was in the case of no PV. Under the hourly and monthly netting options, an increasing percentage of
35
customers find the TOU rate to be the least-cost option at higher PV-to-load ratios, the same as under net metering; however, the trend towards TOU with increasing PV-to-load ratio is dampened. TOU rates are somewhat less valuable under the hourly and monthly netting options, because net excess PV production occurs disproportionately in the summer peak period, and thus a smaller fraction of the total PV production is credited at the summer peak TOU period retail price under hourly and monthly netting than under net metering.39 5.3. Comparison of Bill Savings between Net Metering and Alternative Compensation
Mechanisms With the previous results as background, for each customer, we now calculate the bill savings under each of the alternative compensation mechanisms and at each PV-to-load ratio, and compare those savings to the bill savings under net metering. Key findings of this analysis are summarized below, for each alternative compensation mechanism in turn. 5.3.1. MPR-Based Feed-In Tariff Figure 20(a) presents the distribution, across customers in our sample, of the value of the bill savings under the full MPR-based feed-in tariff. As shown, under the full MPR-based feed-in tariff, the median value of the bill savings (or feed-in tariff payment, as the case may be) from PV is approximately $0.12/kWh for the PG&E customers in the sample, and $0.13/kWh for the SCE customers, with little variation across customers or across PV-to-load ratios. Figure 20(b) presents the distribution in the difference between the bill savings value under the MPR-based feed-in tariff and under net metering; thus, negative values indicate that the bill savings under a particular alternative are lower than under net metering. For most customers, the bill savings received through the MPR-based feed in tariff are substantially lower than under net metering, and the reduction in bill savings is greatest for high-usage customers (especially high-usage PG&E customers), who receive the largest bill savings under net metering. Specifically, among the PG&E customers in the sample, the median reduction in bill savings under the MPR-based feed-in tariff, relative to net metering, ranges from $0.08-$0.13/kWh (a 40%-54% reduction) across the PV-to-load ratios examined. For the quartile of PG&E customers with the highest usage, however, the reduction in bill savings exceeds $0.14-$0.23/kWh (55%-67%) across the PV-to-load ratios. Among the SCE customers in the sample, the median reduction in bill savings under the MPR-based feed-in tariff, relative to net metering, ranges from $0.07-$0.11/kWh (34%-46%) across the PV-to-load ratios. The difference in bill savings between the MPR-based feed-in tariff and net metering is less for SCE than for PG&E, primarily because the
39 Figure 19 exhibits a number of other trends as well. First, under monthly netting, the percentage of PG&E customers for which the TOU rate is least-cost decreases slightly from a 50% to a 75% PV-to-load ratio. This occurs because monthly net excess generation is lower under the flat rate than under the TOU rate (as shown previously in Figure 18), allowing a larger percentage of PV production to be compensated at retail rates, rather than at the MPR-based rate. Because the retail rate is higher than the MPR, this tends to make the flat rate more attractive. Second, for SCE, the TOU rate is least-cost for a larger percentage of customers with hourly netting than with monthly netting for customers with a 50% and 75% PV-to-load ratio, while the reverse it true for PG&E. This difference ultimately derives from the fact that, with monthly netting, the TOU rate results in larger amounts of net excess generation during winter peak periods, and SCE’s MPR-based price during the winter peak period is much lower than its retail rates, which tends to make the flat rate somewhat more attractive under monthly netting.
36
bill savings under net metering are generally lower for the SCE customers than for the PG&E customers, particularly for high-usage customers.40
$0.00
$0.05
$0.10
$0.15
$0.20
$0.25
$0.30
$0.35
$0.40
$0.45
25% 50% 75% 25% 50% 75%PV-to-Load Ratio
Va
lue
of
Bil
l S
avin
gs
($
/kW
h)
PG&E SCE
(a)
Note: Box plots identify
10th/25th/50th/75th/90th
percentile values
-$0.35
-$0.30
-$0.25
-$0.20
-$0.15
-$0.10
-$0.05
$0.00
25% 50% 75% 25% 50% 75%
PV-to-Load Ratio
PG&E SCE
(b)D
iffe
ren
ce
in
Va
lue
of
Bil
l S
av
ing
s
Co
mp
are
d t
o N
et
Me
teri
ng
($
/kW
h)
Figure 20. Distribution in Bill Savings under the MPR-Based Feed-In Tariff and the Change in Bill Savings Relative to Net Metering
For a customer with PV to be indifferent between the full MPR-based feed-in tariff and net metering, the average price paid for PV generation under the feed-in tariff would therefore need to be higher than the average MPR-based price, by an amount equal to the difference in the value of bill savings between the two options, as shown in Figure 20(b). Thus, for the median PG&E customer in our sample, the feed-in tariff price would need to be $0.13/kWh higher than the average MPR-based price at a 25% PV-to-load ratio and $0.08/kWh higher at a 75% PV-to-load ratio.41 Similarly, for the median SCE customer in our sample, the feed-in tariff price would need to be $0.11/kWh higher than the average MPR-based price at a 25% PV-to-load ratio and $0.07/kWh higher at a 75% PV-to-load ratio. The preceding results are based on the pre-tax value of the bill savings under the MPR-based feed-in tariff. If one were to assume that all compensation provided through the MPR-based feed-in tariff were subject to state and federal income tax, however, and that customers do not take advantage of the corresponding opportunity to depreciate the capital cost of their PV system, then the difference between the after-tax value of the bill savings provided under net metering and under the MPR-based feed-in tariff would be $0.043-$0.048/kWh greater in the
40 In addition, SCE’s MPR rate has a higher summer on-peak TOD adjustment factor than PG&E, which tends to make MPR-based compensation more attractive for SCE customers than for PG&E customers. However, this effect is offset to some extent by other differences between the two utilities’ MPR-TOD structures (e.g., PG&E has three MPR seasons, while SCE has two, and PG&E’s Summer Super-Peak period spans a wider set of hours than SCE’s Summer Super-Peak). 41 To be clear, these values effectively represent the size of the “adder” that would need to be included in the price paid for each kWh of PV generation under the feed-in tariff, in order for the median customer to be indifferent between the feed-in tariff and net metering. The adder does not represent the increase in the baseload MPR price that would be required to achieve that outcome.
37
median case. Specifically, among the PG&E customers in our sample, the median difference in the after-tax value of bill savings would be $0.175/kWh at a 25% PV-to-load ratio and $0.121/kWh at a 75% PV-to-load ratio, compared to a pre-tax difference of $0.132/kWh and $0.078/kWh, respectively. Similarly, among the SCE customers in the sample, the median difference in the after-tax value of bill savings would be $0.160/kWh at a 25% PV-to-load ratio and $0.116/kWh at a 75% PV-to-load ratio, compared to a pre-tax difference of $0.112/kWh and $0.067/kWh, respectively. 5.3.2. MPR-Based Hourly Netting Under the hourly netting option, the total bill savings for any individual customer is equal to the sum of the bill savings from offsetting hourly consumption at retail prices and the bill credits for hourly net excess generation as compensated at the applicable MPR rate. As shown in Figure 21(a), the median bill savings for the PG&E customers in the sample is approximately $0.23/kWh at a 25% PV-to-load ratio, declining to $0.17/kWh at a 75% PV-to-load ratio. For SCE customers, the median bill savings ranges from $0.23/kWh at a 25% PV-to-load ratio to $0.18/kWh at a 75% PV-to-load ratio.
$0.00
$0.05
$0.10
$0.15
$0.20
$0.25
$0.30
$0.35
$0.40
$0.45
25% 50% 75% 25% 50% 75%PV-to-Load Ratio
Valu
e o
f B
ill
Savin
gs (
$/k
Wh
) Note: Box plots identify
10th/25th/50th/75th/90th
percentile values
(a)
PG&E SCE-$0.35
-$0.30
-$0.25
-$0.20
-$0.15
-$0.10
-$0.05
$0.00
25% 50% 75% 25% 50% 75%
PV-to-Load Ratio
PG&E SCE
(b)
Dif
fere
nce i
n V
alu
e o
f B
ill
Savin
gs
Co
mp
are
d t
o N
et
Mete
rin
g (
$/k
Wh
)
Figure 21. Distribution in Bill Savings under MPR-Based Hourly Netting and the Change in Bill Savings Relative to Net Metering
Customers of both utilities would generally experience a reduction in bill savings under hourly netting, relative to net metering, but the difference is significantly less than under the full MPR-based feed-in tariff. As shown in Figure 21(b), the median reduction in bill savings relative to net metering is, among the PG&E customers in the sample, approximately $0.015/kWh at a 25% PV-to-load ratio (about a 6% reduction in bill savings), increasing to $0.024/kWh (or 12%) reduction at a 75% PV-to-load ratio. For the SCE customers, the median reduction in bill savings ranges from $0.016/kWh (6%) to $0.021/kWh (11%) over this range in PV-to-load ratios. Furthermore, unlike the full MPR-based feed-in tariff, the reduction in bill savings is not significantly greater for high-usage customers than for other customers in the sample, as demonstrated by the tighter range of results shown in Figure 21(b), compared to Figure 20(b).
38
The difference in the bill savings between net metering and MPR-based hourly netting derives specifically from the difference in the value of the bill credits provided for hourly excess generation. As shown in Figure 22, under MPR-based hourly netting, the median value of the bill credits for hourly excess generation is about $0.12/kWh across all PV-to-load ratios and for the customers of both utilities in our sample. In comparison, the median value of the bill credits for hourly excess generation under net metering ranges from $0.15-$0.18/kWh for the PG&E customers, and from $0.16-$0.21/kWh for the SCE customers in the sample, across the three PV-to-load ratios.42
$0.00
$0.05
$0.10
$0.15
$0.20
$0.25
$0.30
$0.35
$0.40
$0.45
PV-to-Load Ratio
Valu
e o
f B
ill
Savin
gs f
or
Ho
url
y
Excess G
en
era
tio
n (
$/k
Wh
)
PG&E SCE
Note: Box plots identify
10th/25th/50th/75th/90th
percentile values
25% 75%50%25%75%50%
MPR-Based Hourly NettingNet Metering
Figure 22. Comparison of Bill Credits for Hourly Excess Generation under Net Metering and MPR-Based Hourly Netting
Higher prices for hourly net excess generation would therefore be required for most customers within our sample to be indifferent between hourly netting and net metering. Among PG&E customers in our sample, the price for hourly net excess generation would, in the median case, need to be increased above the current average MPR-based price by approximately $0.07/kWh at a 25% PV-to-load ratio and $0.04/kWh at a 75% PV-to-load ratio. Similarly, for the SCE customers in our sample, the price for hourly net excess generation would, in the median case, need to be increased above the current average MPR-based price by approximately $0.09/kWh at a 25% PV-to-load ratio and $0.04/kWh at a 75% PV-to-load ratio. 42 In comparison, the recent E3 net metering cost-effectiveness evaluation (Energy and Environmental Economics 2010) reports that the average value of the bill credits provided for hourly excess generation under net metering is $0.22/kWh for the population of net metered PG&E customers and $0.16/kWh for SCE customers. These average values differ from the median values calculated for customers in our sample for a number of reasons: all else being equal, the average bill credit will generally be higher than the median value; the customers in our sample are smaller, on average; and our analysis assumes that customers choose the least-cost rate option, whereas the E3 study relies on the actual rate choice of each customer.
39
The preceding results are based on the pre-tax value of the bill savings under the hourly netting option. If one were to assume that payments or bill credits provided for hourly net excess generation were subject to state and federal income tax, however, and that customers do not take advantage of any corresponding opportunity to depreciate the capital cost of their PV system, then the difference between the after-tax value of the bill savings provided under net metering and under MPR-based hourly netting would be approximately $0.007-$0.026/kWh greater in the median case. Specifically, among the PG&E customers in our sample, the median difference in the after-tax value of bill savings would be $0.028/kWh at a 25% PV-to-load ratio and $0.049/kWh at a 75% PV-to-load ratio, compared to the pre-tax difference of $0.015/kWh and $0.024/kWh, respectively. Similarly, among the SCE customers in the sample, the median difference in the after-tax value of bill savings would be $0.023/kWh at a 25% PV-to-load ratio and $0.046/kWh at a 75% PV-to-load ratio, compared to the pre-tax difference of $0.016/kWh and $0.021/kWh, respectively. 5.3.3. MPR-Based Monthly Netting Last, under the MPR-based monthly netting option, the value of the bill savings is only marginally different than under net metering (see Figure 23(b)). Specifically, the reduction in bill savings relative to net metering is zero (or approximately zero) at low PV-to-load ratios, and slightly greater at higher PV-to-load ratios (i.e., a median loss of less than $0.01/kWh at 75% PV-to-load ratio, for both the PG&E and SCE customers in the sample). The difference between the value of the bill savings under net metering and under monthly netting is small for two reasons. First, and most obviously, the portion of PV generation that is compensated differently between the two options is quite small, as shown earlier in Figure 18. Second, under net metering, monthly excess PV production is effectively credited at Tier 1 prices, which differ only slightly from the MPR-based prices.
$0.00
$0.05
$0.10
$0.15
$0.20
$0.25
$0.30
$0.35
$0.40
$0.45
25% 50% 75% 25% 50% 75%PV-to-Load Ratio
Valu
e o
f B
ill
Savin
gs (
$/k
Wh
)
PG&E SCE
Note: Box plots identify
10th/25th/50th/75th/90th
percentile values
(a)
-$0.35
-$0.30
-$0.25
-$0.20
-$0.15
-$0.10
-$0.05
$0.00
25% 50% 75% 25% 50% 75%
PV-to-Load Ratio
PG&E SCE
(b)
Dif
fere
nce i
n V
alu
e o
f B
ill
Savin
gs
Co
mp
are
d t
o N
et
Mete
rin
g (
$/k
Wh
)
Figure 23. Distribution in Bill Savings under MPR-Based Monthly Netting and the Change in Bill Savings Relative to Net Metering
40
5.4. The Potential Bill Savings Impact of Accounting for Avoided T&D Costs and Reduced Line Losses
The preceding comparisons were based on alternative compensation mechanisms with prices based on the MPR, which is intended to represent the long-run market price of electricity. However, distributed PV may result in additional avoided costs that could conceivably be incorporated into the price paid for PV generation under these compensation mechanisms. Here, we review the results of other studies that have attempted to estimate two specific additional sources of avoided costs – deferred T&D capacity upgrades and reduced line losses – and consider the potential impact of incorporating these avoided costs into the alternative compensation mechanisms analyzed in the preceding sections. Cost-benefit studies of distributed PV have, in some cases, included other, additional benefits; however, we limit our analysis here solely to avoided T&D costs and reduced line losses.43 First, with respect to T&D capacity deferrals, one inherent challenge to incorporating the associated avoided costs into a PV compensation mechanism is that they are highly idiosyncratic and depend on the specific location of each individual PV system, the quantity of PV installed, the point in time that it is installed, and the temporal correlation between PV generation and peak demand on the T&D systems. Various studies have evaluated the benefit of T&D capacity deferrals from distributed PV, a sub-set of which are summarized in Table 6. These studies evaluate T&D capacity deferrals under two fundamentally different types of situations. The first set of studies focuses on T&D capacity upgrades that would be required to meet load growth but are deferred as a result of distributed PV. The range in avoided costs, both within and across this class of studies, is wide, ranging from less than $0.001/kWh to more than $0.04/kWh. This variation reflects differences in underlying economic drivers (e.g., load growth, the cost of T&D capacity, solar insolation, PV system configuration, etc.), as well as methodological differences among the studies. The other set of studies in Table 6, instead, address the avoided costs from distributed PV that may occur as a result of deferring long-distance transmission that would otherwise be required to access remote renewable resources. Kahn (2008) focuses on the specific case of the proposed Sunrise Transmission Link into San Diego; based on his analysis, the benefit provided by distributed PV in deferring construction of that line ranges from approximately $0.057-$0.132/kWh. This range is considerably higher than the unit cost of the transmission line per kWh delivered, which Kahn (2008) estimates to be $0.035/kWh.44 In other contexts, however, the avoided cost value of deferring transmission may be more closely approximated by the unit cost of transmission per kWh of renewable energy delivered, which Mills et al. (2009) and Mills et al. (2010) report as ranging from $0.005-$0.062/kWh and from $0.008-$0.032/kWh, respectively. However it is estimated, including a “T&D adder” in the alternative compensation mechanisms considered previously, in order to account for the value of deferred T&D capacity, would close
43 For example, distributed PV may provide a hedge against fuel price risk and environmental regulation risks. Hoff et al. (2006) also estimate benefits provided in the form of reduced disaster recovery costs to the utility. 44 The reason for this divergence is that Kahn (2008) effectively assumes that each kW of distributed PV capacity (adjusted for transmission losses) displaces a kW of transmission capacity, rather than assuming that each kWh of distributed PV generation displaces a kWh of remote renewable generation.
41
the gap between the bill savings provided through those mechanisms and net metering.45 However, the significance of the effect naturally depends on the avoided cost value assumed, which, as Table 6 indicates, could vary by more than two orders of magnitude. For example, a T&D adder of $0.01/kWh would reduce the median pre-tax difference in bill savings between net metering and the full MPR-based feed-in tariff by 8%-13% for the PG&E customers in our sample and by 9-15% for the SCE customers, across the range of PV-to-load ratios examined (see Table 5). A T&D adder of this magnitude would reduce the median difference in bill savings between net metering and the hourly netting option by 13%-26% for the PG&E customers in our sample and by 10%-23% for the SCE customers, across the range of PV-to-load ratios examined. The impact of a larger T&D adder would be proportional to the increase in the size of the adder (i.e., a doubling of the T&D adder to $0.02/kWh would yield effects twice the size of the percentage values identified in Table 5). Table 5. Reduction in the Median Loss of Bill Savings Relative to Net Metering if Avoided T&D Costs and Line Losses Are Included in the Price for Net Excess Generation
Avoided Line Losses (10% loss factor) Full Feed-in Tariff 9% 11% 15% 12% 15% 19% Hourly Netting 15% 21% 29% 13% 17% 30%
The values in the table represent the median percentage reduction, across customers in the sample, in the difference between the value of the bill savings under net metering and under the alternative compensation mechanisms, if the price paid for net excess generation under the alternative compensation mechanisms incorporated avoided T&D costs and avoided line losses, at the illustrative levels shown.
Distributed PV also results in reduced T&D line losses to the extent that the electricity generated is consumed onsite or nearby (e.g., within the same distribution feeder). In general, line losses vary by utility system and by time of day, with higher losses during peak hours. For PG&E and SCE, T&D line losses range from 6-11%, depending on the season and time of use period (Energy and Environmental Economics 2010). Accounting for reduced line losses within the alternative compensation mechanisms can be achieved by applying a line loss multiplier (e.g., 110% if losses are 10%) to PV generation that is compensated at MPR-based prices, rather than used to offset customer consumption. A multiplier of 110% would reduce the median pre-tax difference in bill savings between net metering and the full MPR-based feed-in tariff by 9%-15% for the PG&E customers in our sample and by 11%-19% for the SCE customers, across the range of PV-to-load ratios examined (see Table 5). A line loss multiplier of this magnitude would reduce the median difference in bill savings between net metering and the hourly netting option by 15%-29% for the PG&E customers in our sample and by 13%-30% for the SCE customers, across the range of PV-to-load ratios examined.
45 We do note that there is some logical inconsistency in applying to the MPR an “avoided T&D cost adder” that is based specifically on the avoided cost of long-distance transmission to access remote renewable resources. Use of the MPR is predicated on the assumption that the avoided generation is a CCGT. If one posits that distributed PV is deferring long-distance transmission to access remote renewables, then avoided generation costs should arguably be based on the cost of the renewable resources that would be connected to the deferred transmission line.
42
Table 6. Estimates of Avoided T&D Costs from Distributed PV Study Value of Avoided
T&D Costs ($/kWh) Notes
Deferred T&D Capacity Upgrades for Load Growth
Energy and Environmental Economics (2010)
$0.013/kWh
The study estimates the value of avoided costs associated with T&D capacity deferral to the California IOUs. The value cited in this table represents the average value for residential net metered customers of PG&E and SCE.
Sollar Alliance et al. (2008)
$0.006-$0.044/kWh (PG&E)
$0.023-$0.037/kWh
(SCE)
The study estimates avoided T&D costs for PV systems in California, using the E3 avoided cost calculator. The range in values reflects differences across climate zones. Note that the E3 calculator was developed for the purpose of evaluating avoided costs from energy efficiency programs, not distributed PV.
Hoff, T. et al. (2006) $0.001-$0.002/kWh
The study estimates the value of avoided costs associated with T&D capacity deferral to Austin Energy (AE), the municipal utility serving Austin, TX. The range in values corresponds to different distribution planning areas. The study notes that the calculated T&D deferral benefit is lower at AE than at other municipal utilities, because AE reports particularly low levels of potentially-deferrable T&D upgrades.
Hoff, T., B. Norris, and G. Wayne (2003)
$0.005-$0.037/kWh
The study estimates the value of T&D capacity deferral to Nevada Power. The range reflects differences across planning areas and PV system configurations (fixed-axis or single-axis). The study reports the NPV of avoided costs on a $/kW basis; those values were converted here to levelized $/kWh by dividing by the discounted lifetime kWh produced by a 1 kW system.
R.W. Beck, Inc. (2009)
$0-$0.008/kWh The study estimates the value of avoided costs associated with T&D capacity deferral for various PV deployment scenarios within the service territory of Arizona Public Service Company.
Deferred Transmission Capacity Upgrades for Accessing Remote Renewable Resources
Kahn (2008)
$0.057-$0.132/kWh (transmission
capacity and line losses)
The study estimates the value of avoided transmission capacity costs for PV systems installed in San Diego, based on cost of the proposed Sunrise Transmission Project. The range in avoided cost estimates reflects differing discount rates and assumptions about the length of time over which transmission capacity could be deferred. The study reports the dollar value of avoided costs for a 10 kW PV system located in San Diego; those values were converted here to $/kWh by dividing by the discounted lifetime kWh produced such a system.
Mills et al. (2009) $0.005-$0.062/kWh
The study compiles the results from a large number of transmission expansion studies for accessing remote wind resources. The values cited here refer to the levelized cost per unit of delivered energy among studies of transmission projects to deliver wind energy to California utilities.
Mills et al. (2010) $0.008-$0.032/kWh
The study developed estimates of the transmission capacity additions and costs required to meet a 33% RPS throughout the Western Interconnect. The values cited here refer to the levelized cost per unit of delivered energy, of the marginal transmission capacity resource required to meet the 33% requirement; the range in values reflects variation across California load zones.
43
6. Conclusions and Policy Implications
Net metering, in combination with other policy support mechanisms, has been instrumental in jump-starting the market for distributed PV in California and elsewhere in the U.S. The primary benefit that net metering bestows upon customers with distributed PV is that it allows the customer to offset its consumption with PV generation, independent of the temporal coincidence between consumption and generation.46 This provides customers with greater flexibility in the sizing of their system and eliminates the uncertainty that would otherwise exist if customers could only offset their instantaneous consumption and received no compensation for generation exported to the grid. Although similar benefits might be obtained through wholesale electricity sales (e.g., a feed-in tariff), net metering arguably involves lower transaction costs for the customer and may be more amenable to participation by small, individual residential customers. One inherent feature of net metering, however, is that the bill savings received by the customer are highly dependent on the underlying retail rate structure. The current residential electricity tariffs offered by PG&E and SCE are relatively unique in their steeply-sloping inclined usage tiers. As a result, the bill savings for net-metered residential PV customers in these utilities’ service territories varies widely across customers (by a factor of 4-5 for the PG&E customers in our sample and by a factor 2-3 for the SCE customers), depending on the customer’s usage level and the relative size of the PV system. Though this level of variation in bill savings across customers and PV system sizes is relatively unique to California (and, specifically, to the current retail tariffs offered by the state’s investor-owned utilities), it demonstrates the sensitivity of the bill savings value of net metered PV to the underlying rate structure. In the early stages of market development, variation in bill savings across customers may serve a useful purpose by providing relatively high levels of compensation for a sub-set of customers and thereby fostering early adoption. In the long-run, however, large differences in the compensation provided for distributed PV across customers may be more problematic. First, from a social welfare perspective, the variation in bill savings occurring under the particular net metering and retail rates currently offered by PG&E and SCE arguably has little or no economic justification – that is, a PV system installed by a high-usage customer does not provide higher value to society than a PV system installed by a low-usage customer, nor does a kWh produced by a small distributed PV system necessarily provide higher value than one produced by a larger system.47 Second, the degree of variability across customers observed for the two utilities may introduce complexity and uncertainty for customers considering a potential investment in distributed PV. Many residential customers may not possess the analytical know-how, for example, let alone the necessary data, to accurately forecast the bill savings that they would receive under the current set of residential retail rates and net metering rules offered by the two utilities. Perhaps as important, retail rate structures are subject to change over the life of a PV system, introducing further uncertainty for a customer considering a long-term PV investment. Of course, any alternative to net metering may also entail complexity and uncertainty for the
46 In addition, net metering customers in California are exempt from interconnection fees. 47 Of course, concerns about the societal justification of the current rate structure in California go well beyond the bill savings value of PV, and the variation in the bill savings value for PV under net metering applies more-or-less equally to the bill savings value of customer-driven energy efficiency investments.
44
customer and, in the end, the relative levels of complexity and uncertainty and the implications therein must be weighed against one another. One potential alternative to net metering is to simply compensate all distributed PV electricity production under a feed-in tariff. Our analysis, however, indicates that, if the price of the feed-in tariff were based on California’s Market Price Referent (MPR), which is intended to represent the long-run wholesale market price of electricity, the value of the bill savings would be significantly eroded for most PG&E and SCE customers. Enabling continued deployment of distributed PV in California would therefore likely require a feed-in tariff with prices well above the current MPR. Increasing the feed-in tariff price to account for avoided T&D costs and reduced line losses would reduce, but likely would not eliminate, the erosion in bill savings that would occur under the MPR-based feed-in tariff. Of course, moving from net metering to a feed-in tariff may also involve a number of other advantages or disadvantages (financial and otherwise) that are not addressed in this report. Alternatively, an argument could be made that PV installed on the customer-side of the meter should not be treated fundamentally different from energy efficiency upgrades installed by the customer, and that distributed PV production should therefore be able to offset up to 100% of (hourly) customer usage, but any excess PV production would be compensated at a price reflective of avoided costs. Our analysis indicates that, even at relatively high PV-to-load ratios, such an approach would not significantly erode the value of the bill savings for PG&E and SCE customers, provided that the hourly net excess PV generation is compensated at a price equal to or greater than the MPR. At the same time, however, this type of compensation mechanism would not fundamentally mitigate the variability and uncertainty in bill savings under net metering, given that most of the PV generation would continue to be used to offset customer usage, and thus the compensation provided for distributed PV generation would continue to largely be based on the underlying retail rate structure.
45
References
Borenstein, S. 2005. Valuing the Time-varying Electricity Production of Solar Photovoltaic
Cells. Center for the Study of Energy Markets, Working Paper 142. Berkeley, California: U.C. Energy Institute.
Borenstein, S. 2007. Electricity Rate Structures and the Economics of Solar PV: Could
Mandatory Time-of-Use Rates Undermine California’s Solar Photovoltaic Subsidies? Center for the Study of Energy Markets, Working Paper 172. Berkeley, California: U.C. Energy Institute.
Borenstein, S. 2008. The Market Value and Cost of Solar Photovoltaic Electricity Production.
Center for the Study of Energy Markets, Working Paper 176. Berkeley, California: U.C. Energy Institute.
Bright Power Inc., Energywiz, Inc., and The Association of Energy Affordability, Inc. 2009.
Solar Real-Time Pricing: Is Real-Time Pricing Beneficial to Solar PV in New York City?
Prepared for the New York City Economic Development Corporation. New York, NY. Charles River Associates. 2005. Impact Evaluation of the California Statewide Pricing Pilot.
Final Report, Oakland, CA. Cook, C. and J. Cross. 1999. A Case Study: The Economic Cost of Net Metering in Maryland:
Who Bears the Economic Burden. Unpublished, Maryland Energy Administration. CPUC. 2009. Energy Division Resolution E-4298. California Public Utilities Commission.
http://docs.cpuc.ca.gov/PUBLISHED/FINAL_RESOLUTION/111386.htm DeBenedictis, A. 2010. Personal communication. Andrew DeBenedictis, Energy and
Environmental Economics. Denholm, P., E. Drury, and R. Margolis. 2009. The Solar Deployment System (SolarDS) Model:
Documentation and Sample Results. NREL/TP-6A2-45832. Golden, CO: National Renewable Energy Laboratory.
DSIRE (Database of State Incentives for Renewable Energy). 2010. Map of Net Metering
Policies. <http://www.dsireusa.org/documents/summarymaps/Net_Metering_map.ppt>. Accessed January 12, 2010.
Energy and Environmental Economics. 2004. Methodology and Forecast of Long-Term Avoided
Costs for the Evaluation of California Energy Efficiency Programs. Prepared for the California Public Utilities Commission. San Francisco, CA: Energy and Environmental Economics.
46
Energy and Environmental Economics. 2010. Net Energy Metering Cost Effectiveness
Evaluation. Prepared for the California Public Utilities Commission. San Francisco, CA: Energy and Environmental Economics.
Hoff, T., B. Norris, and D. Wayne. 2003. Potential Economic Benefits of Distributed
Photovoltaics to the Nevada Power Company. Clean Power Research. Hoff, T. and R. Margolis. 2004. Are Photovoltaic Systems Worth More to Residential Consumers
on Net Metered Time-of-Use Rates? Proceedings: Solar 2004 Conference. Portland, Oregon.
Hoff, T., R. Perez, G. Braun, M. Kuhn, and B. Norris. 2006. The Value of Distributed
Photovoltaics to Austin Energy and the City of Austin. Napa, CA: Clean Power Research, LLC.
Kahn, E. 2008. “Avoidable Transmission Cost is a Substantial Benefit of Solar PV.” The
Electricity Journal, Vol. 21, Issue 5. Mills, A., A. Phadke, and R. Wiser. 2010. Exploration of Resource and Transmission Expansion
Decisions in the Western Renewable Energy Zone Initiative. LBNL-3077E. Berkeley, CA: Lawrence Berkeley National Laboratory.
Mills, A., R. Wiser, G. Barbose, and W. Golove. 2008. The Impact of Retail Rate Structures on
the Economics of Commercial Photovoltaic Systems in California. Energy Policy, 36: 3266-3277.
Mills, A., R. Wiser, and K. Porter. 2009. The Cost of Transmission for Wind Energy: A Review
of Transmission Planning Studies. LBNL-1471E. Berkeley, CA: Lawrence Berkeley National Laboratory.
MRW & Associates. 2007. Solar PV and Retail Rate Design. Unpublished draft report for the
California Energy Commission. Oakland, CA: MRW & Associates. National Renewable Energy Laboratory (NREL). 2007. National Solar Radiation Database
1991-2005 Update: User’s Manual. NREL/TP-581-41364. Golden, CO: National Renewable Energy Laboratory.
National Renewable Energy Laboratory (NREL). 2010. Renewable Resource Data Center:
PVWatts. Website. < http://www.nrel.gov/rredc/pvwatts/> Accessed February 1, 2010. Simons, G. 2005. CPUC Self-Generation Incentive Program Preliminary Cost-Effectiveness
Evaluation Report. Vancouver, WA: Itron, Inc. Solar Alliance et al. 2008. “Opening Comments of The Solar Alliance, The California Solar
Energy Industries Association, The Vote Solar Initiative, GreenVolts, and Recurrent Energy, Inc. on the Issues Regarding Phase 2 of Tariff and Standard Contract
47
Implementation for RPS Generators.” Comments filed in Rulemaking 06-05-027. July 3, 2008. California Public Utilities Commission.
Rose, J., S. Chapman, G. Rose, R. Jackson, J. Weidman, J. Keyes, K. Fox, T, Culley, M.
Quinlan, L. Varnado, and C. Murchie. 2009. Freeing the Grid 2009 Edition: Best and
Worst Practices in State Net Metering Policies and Interconnection Standards. New York, NY: Network for New Energy Choices.
R.W. Beck., Inc. 2009. Distributed Renewable Energy Operating Impacts and Valuation Study.
Prepared for Arizona Public Service. Seattle, WA. VanGeet, O., E. Brown, T. Blair, and A. McAllister. 2008. Solar San Diego: The Impact of
Binomial Rate Structures on Real PV Systems. NREL/CP-670-42923. Proceedings: ASES Annual Conference, San Diego, CA.