The Impact of Referents on Entrepreneurship—Growth of Small and Medium Sized Software Companies in Three Finnish Regions Jussi Autere Dissertation for the degree of Science in Technology to be presented with due permission of the Department of Industrial Engineering and Management for public examination and debate in Auditorium K of Helsinki University of Technology on the 29th of April, 2005, 1:00 p.m. Helsinki University of Technology Department of Industrial Management Institute of Strategy and International Business
Transcript
The Impact of Referents on Entrepreneurship—Growth of Small and Medium Sized Software Companies in Three Finnish Regions
Jussi Autere
Dissertation for the degree of Science in Technology to be presented with due permission of the Department of Industrial Engineering and Management for public examination and debate in Auditorium K of Helsinki University of Technology on the 29th of April, 2005, 1:00 p.m.
Helsinki University of Technology Department of Industrial Management
The foundation of this study is the assumption that social constructionism offers a fruitful theoretical perspective within which growth phenomena of small companies in information intensive industries can be understood. The perspective helps us to understand where the growth oriented mindset that guides the managers of entrepreneurial companies originates from.
The study applies the perspective and other complementary cognitive and motivational theories upon the question of how the growth orientation of management is born and further how growth orientation together with management mental models affect growth of small software companies. Based upon literature analysis of the major theories in the area, a model upon factors affecting growth orientation as well as growth is built.
The empirical part of the study tests 12 hypothesis derived from the theoretical model. They are related to birth of growth orientation, regional cultural effects upon the orientation, and relationship between orientation, mental models and growth. The empirical part is based upon structured interviews in 76 software companies in three Finnish regions. Analysis of the results is done both with hierarchical regression analysis as well as structural equation modeling.
The results support following hypothesis: The growth orientation of Finnish (socially linked) referents has a positive impact on growth orientation. The impact of Finnish referents on growth orientation is stronger than a foreign referent. Outside owners increase growth orientation. Management experience reduces growth orientation. There are regional effects on the growth orientation of that are mediated through reference persons. Previous growth experience has a positive effect upon growth. There are regional effects on the growth orientation of that are mediated through reference persons. Growth orientation has a positive effect upon growth. Previous experience moderates the effect of growth orientation upon growth.
In a discussion based upon the empirical results, it is concluded that view of social constructionists can help understanding of the behavior of small business managers. Also social learning theory and its concept of self-efficacy seem to help understanding.
4
Acknowledgements
This dissertation would never have become reality without the support of a group of friends. I owe deep gratitude to my supervisor, Professor Erkko Autio for forcing me to complete this project. His pressure would still have been inefficient without two other persons. Professor Olli Martikainen from the University of Oulu and Professor Hannele Wallenius from the Helsinki University of Technology convicted me that the objective was worth pursuing for. Professor Martti M Kaila once initiated the project and later made sure that it was proceeding as it should.
The preliminary examiners Professor Asko Miettinen from the Tampere University of Technology, and Professor Hannu Littunen from the University of Kuopio, invested substantial time and effort in examining this thesis. I would also like to thank Professor Johan Wiklund from the Jönköping International Business School for his commitment to act as opponent in the public defense of this thesis.
My partners from my own venture, Gearshift Group Oy, Jukka Kotovirta and Jussi Mononen deserve gratitude both for the great years of starting and running a company together, as well as tolerating the efforts that I have put in this project without a hope of monetary payback. I would also like to thank Dr. Ari J. Salonen from CellExchange, Inc. for helping me start this work; Dr. William L. Paulin and Professors Tomi Laamanen and Markku Maula from the Helsinki University of Technology for guiding it and Hannu Aaltonen from C.Diem Oy for finalizing it.
The research for this dissertation has been funded partly through grants from the Technology Development Agency of Finland, Tekes and the Academy of Finland, which is gratefully acknowledged.
Lastly, I would like to thank the key people that made this dissertation possible, the executives from the 76 software companies that allocated their valuable time to interviews that have been the foundation of this research.
Social constructionism constitutes a broad school in social research (e.g. Bruner, 1990; Gergen, 1985; Harre & Stearns, 1995; Miller & Hoogstra, 1992; Parker & Burman, 1993; Potter & Wetherell, 1987). The foundation of this study is the assumption that social constructionism offers a fruitful theoretical perspective within which growth phenomena of small companies in information intensive industries can be understood. The perspective is expected to help us to understand where the growth oriented mindset that guides the managers of entrepreneurial companies originates. It can also illustrate how management can develop skills in order that the company can reach its growth targets. Thus, it can offer good possibilities to enhance the understanding of one of the most central areas of entrepreneurship research, namely growth.
Social constructionism suggests that explanations for beliefs cannot be found in the individual psyche or in social structures, but rather in the interactive processes that take place routinely between people (Burr, 1995:7). The versions of events individuals construct are bound up with social relations (Harre, 1998). Thus subjective beliefs are not purely products of private cognitive processing, but are also constructed through social processes. The processes involve active and purposive selection and suppression. Social constructionists do not believe in the existence of value-free foundations or sources of knowledge, nor do they conceptualize a clear objective-subjective distinction, or make a clear distinction between “knowledge” and “reality” (Honderich, 1995). They suggest that we may achieve things through the illocutionary force of the words we utter and these achievements may include the maintenance of a sense of meaning to ourselves (e.g. Goffman, 1959; Miller & Hoogstra, 1992).
Until now, entrepreneurial research related to cognition and learning has mainly concentrated upon how individuals find meanings and models, not upon how social processes create them (e.g. Baron, 1998: Busenitz & Lau, 1996; Wright et al., 2000). Downing (2005) describes the current status: “there are examples of work that show a sensitivity toward joint social construction of reality through interaction and the duality of structure, but they lack any holistic analysis of the processes involved.” As constructionism effectually challenges the essential notions that underlie much of ordinary and scientific thinking, it is worthwhile to conduct exercises, in which its perspectives are applied to an entrepreneurship research context. So far, the majority of entrepreneurial studies with the constructionist view have concentrated upon how entrepreneurs construct their view on technology, future trends, and dynamics between individual voluntarism and institutional determinism (Fuller, 2002; Forslund, 2002). This study instead applies the perspectives to entrepreneurial goal setting and execution. The views are used
2
to understand one of the main questions in entrepreneurship research: why some small companies grow and some do not? In the light of the perspectives applied, this question can be rephrased in a new way: How do some small companies build such managerial mental models that empower their company to grow while the majority of small companies do not achieve this?
Even though social constructionism provides a new potential approach for understanding phenomena related to entrepreneurial cognition, it alone is not sufficient as a foundation for empirical research testing hypothesis. Social constructionism is merely just an epistemological position, not an explanatory theory (Burr, 1995). This “position, not theory” approach leads to a problem in understanding entrepreneurship and small business. The problem is that social constructionism sees the dynamics of the generative activity which result from interactions of the voluntary activities by and between individual people as the key method of creating constructing abstract concepts (Gergen, 1990). Analytical abstraction, by its very nature, does not enable us to understand this kind of dynamics of voluntary interaction (Fuller, 2002). In the ideal case we should have a method to understand the overall effects of these activities without resorting to the statistical averaging employed in positivist science. But as no such method has been accepted into common use, this study relies upon a statistical methods and positivistic approach, even though it’s epistemological position is based on natural science (Gergen, 1996). Theory is used in this study mainly as a way to get a perspective on variables where differences in social environment can be detected. Other theories presented in Chapter 2 are needed to help generate the exact hypothesis as well as such hypothesis that do not relate to differences in the social environment.
Besides its nature as a view, not a theory, another problem of social constructionism is that it has tended to regard language as the sole source of constructions (Bayer 1998: 5). This limitation forgets three other sources of constructions: (1) personal social history and embodiment, (2) material environment and (3) the institutions using power in the society and culture (Cromby & Nightingale, 1999: 2). As this study handles the relationship between people and a material phenomenon—economical growth, this research has to have wider view than just purely linguistics on the sources of constructions. It sees “…the character of the firm as a discursive practice: a form of life, a community, in which individuals come to share an unarticulated background of common understanding” (Tsoukas, 1996: 23).
3
1.2 Background
Growth of a new entry belongs to the two most commonly studied subjects in entrepreneurship research (Murphy et al., 1996; for an extensive discussion about growth studies, see e.g. Storey, 1994b; and Wiklund, 1998). From its beginning, entrepreneurship research assumed entrepreneurship to be a specific characteristic of a firm or of an individual (Carland et al., 1984; Begley & Boyd, 1987; Cooper & Gascon, 1992). This characteristic would cause performance like growth or efficiency. The task of the research was to recognize the entrepreneurship from the individuals or firms (Gartner, 1990), how entrepreneurs distinguish themselves from the general population (Low & MacMillan, 1988). Thus the research on entrepreneurship tried to identify characteristics that caused performance; most commonly growth.
However, the research failed to recognize the entrepreneurship (Gartner, 1988), even though scholars have developed numerous typologies to describe alternate perspectives of entrepreneurship (e.g., Cooper & Dunkelberg, 1986; Schollhammer, 1982; Webster, 1977). These classification systems typically search differences in the existence of entrepreneurship as the result of various combinations of individual, organizational, or environmental factors that influence how and why entrepreneurship occurs as it does, rather than adopting a process-oriented approach. Although these efforts have served to point out the various dimensions of the entrepreneurial process, they have not led to any widely held consensus regarding how to characterize entrepreneurship (Low & MacMillan, 1988; Lumpkin & Dess, 1996). Regarding personal characteristics of entrepreneurs Hatten (1997: 40) concludes: “The conclusion after 30 years of research indicates that there are no personality characteristics that predict who will be a successful entrepreneur.”
Because of this failure, there has been a paradigm change in the research field. Starting in the 1990s, the focus has moved from the characteristics of entrepreneurship (Venkataraman, 1997) to entrepreneurial behavior and processes. The focus has shifted from traits to behaviors, from studies on entrepreneurship to studies on entrepreneurial orientation and measuring the degree of entrepreneurship (Lumpkin & Dess, 1996, Brown et al., 2001). The argument was that the relationship between behavior and performance is context specific and the dimensions of behavior may vary independently from each other in a given context (Lumpkin & Dess, 1996: 137). This study follows the new paradigm in its problem setting.
If a researcher focuses upon defining process how an entrepreneurial behavior develops, the his/her implicit assumption is that a given individual can, at different times, be considered as entrepreneurial or as non-entrepreneurial depending upon individual’s behavior (Autere & Autio, 2000). A key question then becomes what factors regulate the “entrepreneurial” behavior
4
in firms and individuals. By focusing on this issue, the origins of entrepreneurship itself can be tracked.
To further complicate a one-dimensional definition of entrepreneurship, it has been found that the problem is not only whether a small or medium sized business manager can act in an entrepreneurial way, but also whether he/she has the desire to do so (Hay & Khamshad, 1994). In the 1990s, it was found that the previous assumptions about growth being one of the self-evident goals for small and medium sized firms were not true. Most small firms and entrepreneurs are not even interested in pursuing growth, or choose to pursue only moderate growth rates (Storey, 1994a; Cambridge Small Business Research Centre, 1992). Thus, even motivational factors driving managerial processes or behavior were found to differ between companies.
In the majority of small and mid-sized firms, growth orientation of management is not high (Storey et al., 1987). In such a situation the research should address the question, what is the management sense-making process that results in a desire for growth (Autere & Autio, 2000; Penrose, 1959). The unsuccessful search for generic entrepreneurial management characteristics of management has so far left this stream of research mainly untouched. The overwhelming majority of all empirical studies that have attempted to explain growth performance of firms have failed to consider the degree to which the firms concerned actually aspired for growth (Autio et al. 2000).
In the present study, the objective is to go beyond the traditional assumption of existing growth orientation and look at the antecedents and consequences of the growth orientation on a small firm’s strategic manager level. The study searches for the answer from combining the theories of motivational and cognitive psychology. Of these, expectancy theory (Vroom, 1964) and its derivative theory of planned behavior (Ajzen, 1991) already have an effect on management motivation studies. In addition, another stream of study has tried to relate entrepreneurial characteristics to behavior and behavior then to personal motivation (Wilken, 1979; McClelland, 1961). However, this attempt to link motivation directly to entrepreneurship characteristics has not been very successful (Cooper et al., 1988). Some of the motivational studies upon the subject such as Greve’s (1998) and Geletkanycz’s & Hambrick’s (1997) have not even discussed the relationship with the firm’s growth. Entrepreneurial cognition studies (Baron, 1998; Busenitz & Lau, 1996) for their part have not considered motivational sources and have instead been focusing upon cognition as a result of individual heuristics, not of a social process. Even many recent cognitive studies take high motivation to achieve performance as a given (Wright et al., 2002).
5
1.3 Research problem
A small proportion of the small and medium sized firm population, the “flyer” firms, has created the majority of new employment generated over the long run (Storey, 1994b). Most of the firms themselves do not want to grow (Oakey, 1993), but profitability and long-term stability are considered as more important objectives. Because only a small portion of small firms even want to grow, it makes more sense to focus on the factors that can help affect growth orientation than to study environmental and characteristic factors affecting the success of companies, when growth of firms is studied. Still, the sense-making processes that affect an entrepreneur’s willingness to grow have seldom been studied in entrepreneurship research.
The broad aim of this study is to discuss potential answers to one of the central questions of entrepreneurships: why some small companies grow and some do not? From the social constructionist setting of this study comes the guidance about what more focused questions to concentrate in this general area. From the need to understand sources of growth orientated mental models arises the main question of this study:
How is the growth orientation of management born?
The studies on entrepreneurship can be divided into three main categories: what happens when entrepreneurs act; why they act; and how they act (Stevenson & Jarillo, 1990). The main question in this study clearly falls within the “why” category: why managers act in an entrepreneurial way. The disciplines that help find answers to these kinds of questions are psychology and sociology.
The general characteristics and demographic background of management and management teams as sources of entrepreneurship have already been chartered quite often (Begley & Boyd, 1987; Cooper & Dunkelberg, 1986; Eisenhardt & Schoonhoven, 1990; MacMillan et al., 1987). Instead of these static characteristics however, this study concentrates on sense-making processes that lead dynamically to growth orientation. Cognitive psychology research explains sense-making processes through the formulation of mental models. The social environment of the management guides the mental model formulation process. Studies on cognitive processes have been able to show differences between entrepreneurs and non-entrepreneurs. For instance, Palich and Bagby (1995) found that entrepreneurs tend to categorize business situations to have more strengths, opportunities, and potential for gain than non-entrepreneurs.
It has been found that in building their mental models and views, virtually all human beings seek to identify the causes of events through a process called attribution (e.g. Heider, 1958; Weiner,
6
1986; Pittman, 1993). In attribution, an individual observes through orderly and rational processes information that may shed light on causal relationships. Important targets of observation are other individuals. Thus a contact network and the assumed behavior of the referents that the management is using may have an important role in the process by which mental models relating to growth are born. So they may have an important effect on the birth of growth orientation. Also empirical research on strategic management has shown the importance of links outside the organizational boundaries for the management (e.g. Goes & Park, 1997; Minzberg, 1973).
Answering the following research question is therefore the focus of this study:
Who are the referents that most affect the growth orientation of management?
One source of mental models, and also of bias, is the generally accepted beliefs of the manager`s community. Some studies have pointed out the importance of regional business culture as an important factor affecting the behavior of the enterprise management (Saxenian, 1994). It is therefore important to analyze what effect the regional environment of companies has on growth orientation and growth. The following question needs to be answered:
Through which paths do regional differences affect growth orientation?
It is not self-evident that growth orientation leads to growth. To understand fully the relationship between growth and growth orientation, there is also a need to understand the relationship between motivation, execution capabilities and the actual growth of firms. Growth oriented managers make strategic and execution choices that they think will lead to growth, but in specific industry circumstances, some other choices might have been more efficient. There exists a vast array of literature on the relationship between strategic choice and growth (for a detailed review on the literature on the strategic choice and performance relationship see, e.g. Boeker, 1989). Of the many possible issues raised by literature regarding strategic choice, this study focuses upon the relationship between growth orientation and the experience of management. Experience plays an important role in creating the cognitive models that guide the behavior of the management.
To understand the relationship between growth orientation and growth, the following question must be answered.
How does growth orientation affect the actual growth of companies in the industry under study?
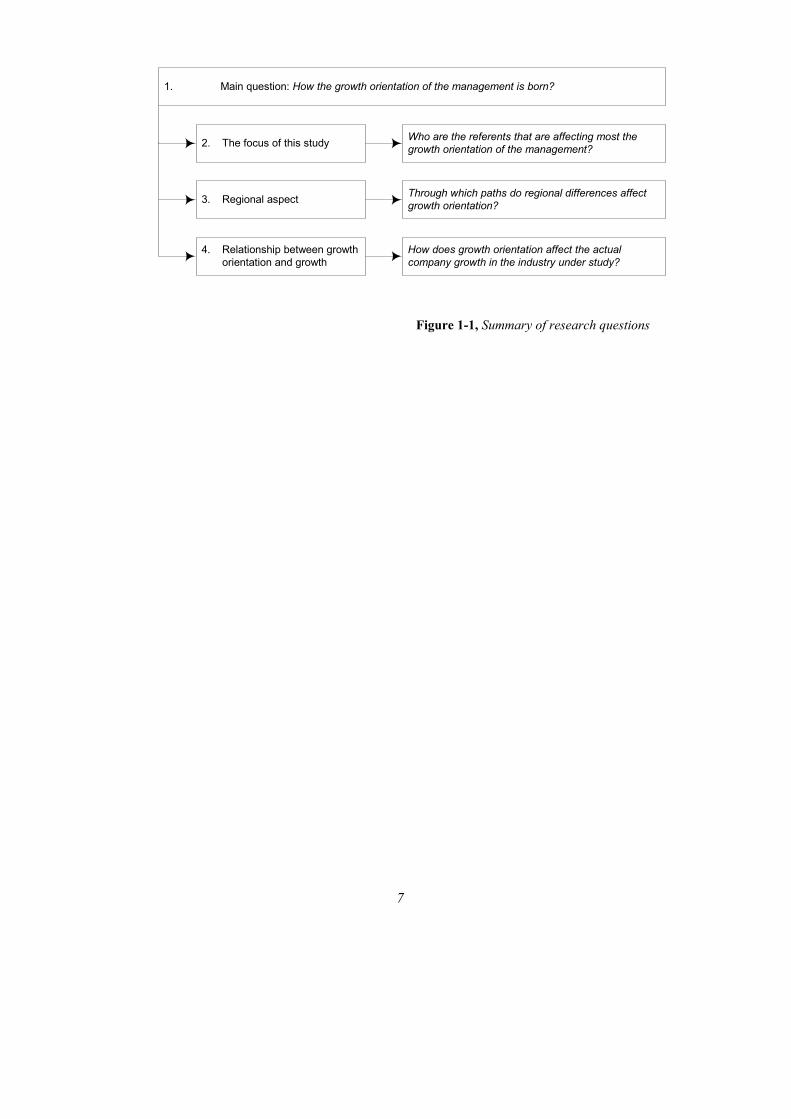
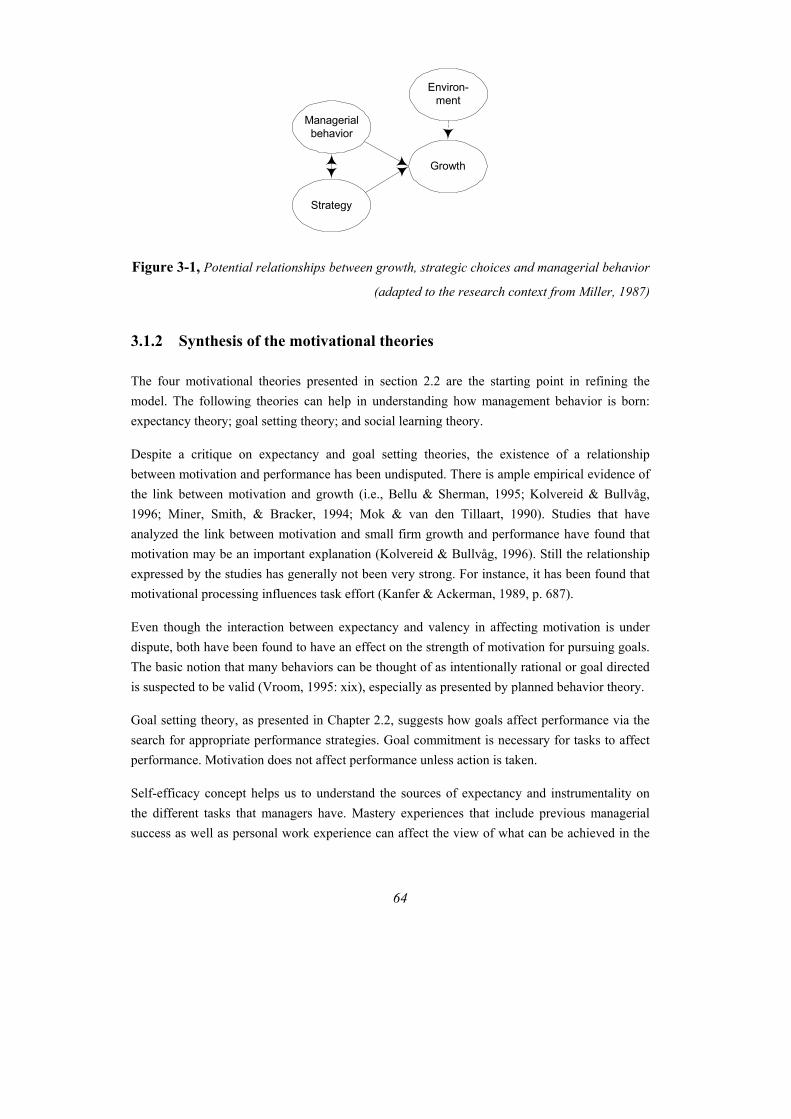
In summary, the research questions are presented in Figure 1-1.
7
1. Main question: How the growth orientation of the management is born?
2. The focus of this study Who are the referents that are affecting most thegrowth orientation of the management?
3. Regional aspect Through which paths do regional differences affectgrowth orientation?
4. Relationship between growthorientation and growth
How does growth orientation affect the actualcompany growth in the industry under study?
Figure 1-1, Summary of research questions
8
1.4 Objectives
The main objective of this study is to answer the research questions presented in the previous chapter. On the one hand, the study aims at describing how the referents and mental models of management are related to the growth orientation of the management of the company. On the other hand, the purpose of this study is to identify some of the factors that might explain the differences in growth rates between technology-based small and medium sized companies.
In order to meet these two higher-level objectives, several sub-objectives need to be achieved. These sub-objectives include building theoretical model on the basis of previous literature and testing the model on a sample of technology based small and medium sized companies. To make the normative analysis between behavior and growth possible, these companies have to operate in the same industry. To make the analysis of regional cultural effects possible, these companies have to reside in geographically separate regions. Based on the theoretical model and statistical analysis of the empirical data, the following sub-objectives need to be achieved:
• Finding how managerial cognitive capabilities and motivation are linked to growth of the firm;
• Linking of management’s mental and reference models to the growth orientation of management through cognitional and motivational psychological theories;
• Defining whether motivational and cognitive factors work independently or moderate each other when affecting growth;
• Understanding how the previous growth experiences of the company and the managers affect the growth orientation.
The pragmatic objective of this study is to present a basis for recommending which linking mechanisms between the company and its external environment are most effective in generating growth orientation.
9
1.5 Scope of the study
The detection of the effects focused upon in this study is difficult because of two other factors that affect growth (Sandberg & Hofer, 1987). Firstly, the growth of a company depends heavily upon the environment in which it operates: what industry, what location, and which customers the company has. Secondly, in many industries, the impact of tangible assets and existing resources affects the growth possibilities so heavily that the value created through social impacts is hidden behind these factors. Thus the empirical setting selected has to be such that the environment is as homogenous as possible for all the companies being studied. This can be achieved by concentrating upon one industry as well as upon one limited cultural and geographical region. The industry selected has to be knowledge intensive, and not investment intensive.
This study concentrates upon one industry, software product producers, for two main reasons. First, it permits better control for variation in industry and for demand conditions that might influence the patterns and speed of growth. Key relationships between resource characteristics and firm growth differ across industries (Hitt et al., 1997). Second, the underlying basic technologies for the companies are similar, reducing the possibility of variation because of external technological change. One industry normally includes companies that have to face similar external situations and so could be expected to meet comparable administrative problems and needs (Chandler, 1962). The one-industry limitation reduces the ability to make generalizations from the results.
The reason to select the software product industry of this study as the focus industry is that from a strategic management perspective, other industries are also becoming increasingly knowledge driven, and thus more similar in their management problems to the software industry (Hoch et al., 1999).
The study concentrates upon three regions in the country of Finland. It is expected that companies residing in same limited geographical areas are better able to share the same mental models and regional externally available resources like social networks than companies scattered geographically. The three regions are selected to have as much common as possible. They all have both similar university structure, as well as major operations of the main Finnish large high technology companies, which make them different from all the other regions in Finland.
The study concentrates upon a short time period 1996-2000, during which time the firms under study experienced a fast growth situation in a turbulent environment. The annual turnover growth of the researched population was on average 40 percent annually on a company-by-
10
company basis and 41.8 percent of the total population. According to the classification system of Eisenhardt and Schoonhoven (1990), markets that have a growth rate of over 20 percent are either growth or emergent markets. In these markets, the impact of different strategic choices becomes presumably rapidly visible. The nature of the markets limits the ability to create generalizations and makes the results biased towards conditions in a turbulent environment.
This study concentrates only upon growth as the phenomenon whose sources are analyzed. The effects of mental models on other factors, like opportunity recognition or new business start-up activities, are not studied.
The approach of the empirical study is statistical and quantitative. This approach has been selected because the aim of the empirical study is to statistically test hypotheses that have been developed separately.
There are three potential different approaches on the social processes of organizational sense making (Maitlis, 2005): (1) investigations how certain leadership groups influence others’ understanding of issues; (2) investigations how middle managers shape organizational accounts by sense giving to their leaders; and (3) the interaction of different actors’ sense making behaviors and how this interaction affects sense making processes. This study has selected the first approach and thus does neither consider organizational structure aspects nor the actual interactive sense making processes.
11
1.6 Concepts
The core concepts used in this study are presented in this chapter. Explicit definitions help the readers to understand the discussion in the same way the writer has done.
This is a study on growth of the firm, which is one of the most controversial concepts in economics. The basic definition of growth is rather straightforward. It refers to change in size or magnitude from one period of time to another (Wiklund, 1998). Growth of the firm refers to the increased size of individual firms. The definition gets complicated when one tries to define the exact indicator of the growth arguments can be presented; either sales, employment, profit, margins, shareholder value or market share growth is the best indicator.
It seems unlikely that growth could take place in other dimensions without increasing sales. Some researchers have stressed that a consensus has been reached among academics that sales or turnover growth is the best growth measure (Hoy et al., 1992). A clear majority of entrepreneurship studies that have used growth as a dependent variable have measured sales growth (Murphy et al., 1996). It reflects both short- and long-term changes in the firm, and is easily obtainable. Entrepreneurs themselves often use sales growth as a performance indicator (Barkham et al., 1996). Therefore, it makes sense to define growth in terms of sales or, because it is easier to measure, turnover. In the empirical part of the study, growth refers only to growth of turnover of an individual firm.
Due to current high levels of unemployment, there is a general interest in the creation of new employment. For this reason, employment growth is another important aspect of growth. This is reflected in the large number of studies that focus mainly on employment growth (Delmar, 1996). Therefore, in the conceptual analysis and literature review, the term growth is sometimes used also to refer to the growth of employment of the firm.
This is further a study on growth of the firm that focuses upon growth orientation of the management. The definition of growth orientation is based on the Stevenson and Jarillo (1990) view. High growth orientation means that rapid growth is top priority. Risk is accepted to achieve growth. A low growth orientation means safe, slow and steady growth as priorities for management (Brown et al., 2001).
The concept entrepreneurship has many times been understood to cover only actions of persons in companies experiencing their start-up phases (Sexton & Landström, 2000). This study uses a wider opportunity-based definition from Stevenson: “The process by which individuals – either on their own or within organizations – pursue opportunities without regard to the
12
resources they currently control (Stevenson & Jarillo, 1990)”. Thus the actions of professional management in established companies can also be regarded as entrepreneurship and part of entrepreneurial behavior is the growth orientation of the management.
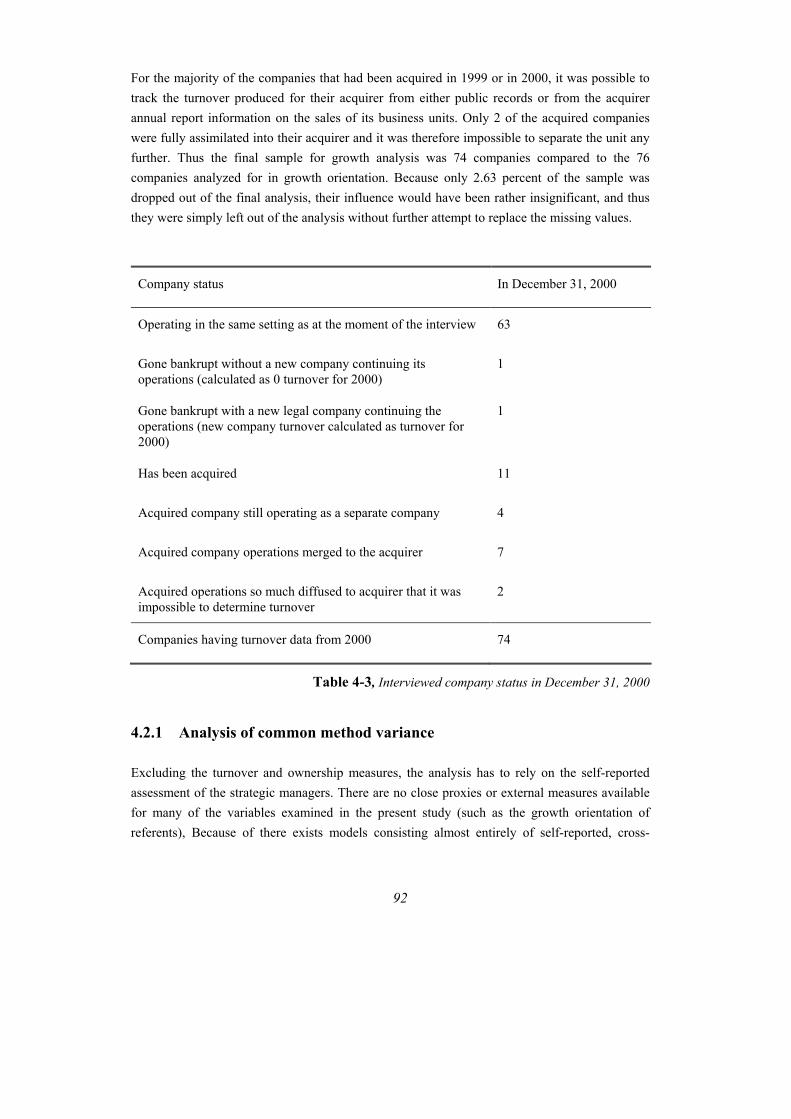
More recently, Stevenson’s opportunity based view of entrepreneurship has received widespread recognition and support in literature (Brown et al., 2001). In summary, Stevenson has provided us with a conceptualization of entrepreneurship that places it within a broader management framework and is coherent with classical as well as contemporary definitions of entrepreneurship.
Pouder and St. John (1996) define management mental models following the lines of Walsh (1995) as management’s mental template consisting of organized knowledge about information environment that enables interpretation and action in that environment. The mental models are the ways of reasoning and structuring the business situation of a firm that management uses to define the objectives of the firm.
Mental models are one explanation how people generate meanings: linking observations to their cognitive descriptions. The view of this study on how the models act as sources of beliefs resides in the mutualist theory of meaning (e.g. Still & Good, 1992). Mutualism holds that meaning is a social construction as opposed to a purely private cognitive construction. In the words of Hackley (1998: 98) “Meanings, for social constructionists, do not subsist inside my head: they derive primarily from the social world. This mutualist view of meaning places individual consciousness in a clearly significant, but crucially subsidiary position to social structures.” Meanings are, in this view ineluctably social constructions that are constituted through discursive practices and fractured in time.
The process through which meanings are born is sense making. Dougherty et at. (2000) describe sense making as, ". . . the process through which various information, insight, and ideas coalesce into something useful, or 'stick' together in a meaningful way".
The word referent that study is used in this study for the meaning given by Webster’s (1993) dictionary: “someone that is referred to or consulted”. Of the meanings the dictionary gives to the verb to refer, we mainly consider “to have recourse; apply, appeal.” In the discussion we do not limit the term strictly only persons, but use it also to include groups or people—organizations or firms. Thus the term referent in this study means those persons or organizations whose behaviors are consulted as sources of potential models of own behavior
13
1.7 Structure of the dissertation
This report is divided into seven parts. The first part serves as an introduction to the topic. It discusses the research questions, objectives, and the scope of the study.
The second part establishes the theoretical foundation for the study. It is divided into six parts as illustrated in Figure 1-2.
2.3 Theory on growth of the firm
2.2 Growth motivation
2.1 Management''s cognition
2.4 Strategic coice
2.5 Region
2.6 Software products industry
Figure 1-2, Structure of theory presentation
The theoretical analysis starts from literature on social constructionism and complementary theories in the field of cognition research. It presents cognitive processes and how they result in mental models and motivation of management. These views are then complemented by presenting motivational theories explaining behavior in a business environment. The views are then put into context by presenting the theories of growth of the firm. Literature presents multiple reasons for the growth of firms. This analysis focuses upon what differentiates firms that have different growth rates. The aim is primarily to analyze growth orientation of management..
Besides the primary focus area of this study, other factors affecting growth are analyzed to better understand the way the primary factors work, and to control that discovered effects are not caused by other factors than what is assumed. The two areas, where these control and complementary factors are analyzed, are strategic choices of the management and the regional
14
culture effects. The literature on strategic choice relevant in this context is presented in section 2.4 and regional culture in section 2.5.
Finally, the characteristics of the industry domain of the study are presented in section 2.6.
After the literature presentation, in chapter 3, the characteristics of the specific empirical research context are presented and relationships between constructs identified in the second part are crystallized to theoretical models. The theoretical model is further developed to a set of hypotheses. The hypotheses are further integrated into a theoretical model of some factors that might have an effect on growth and strategic choices of a firm.
Chapter 4 introduces the research approach and provides a methodological discussion. Issues related to research design, sample selection, and data gathering process are explored. The application of the theoretical model into measurable variables is done in chapter 5.
The empirical results are presented in chapter 6. Chapter 7 contains a discussion of results, a refinement of the theoretical models, and the implications for the theory and practice of the fields of research considered.
15
2 Literature review
The focus of most studies upon small firm growth has been characteristically upon “entrepreneurial” growth and upon “entrepreneurial” firms. Most growth studies have tended to assume growth orientation rather than control it (Autio et al., 2000). In a typical model, growth has been assumed to follow directly from firm-internal factors, strategy, and environment, and management motivation and cognition has neither included as mediating and moderating variables (see review on the studies in, e.g. Wiklund, 1998). When expectations and aspirations are neglected, what results is a myopic view of growth; something that almost automatically results when the right raw-materials are mixed. Such a view implicitly assumes an entrepreneur who is highly rational, a characteristic that is seldom associated with real-life entrepreneurs (Kets de Vries, 1996).
Because managerial cognition and motivation are central in objective setting of this study, literature review concentrates on them, and leaves less attention to growth, strategy and environment literature.
16
2.1 Managerial and entrepreneurial cognition research
As many researchers (e.g. Boulding, 1956; Pondy & Mitroff, 1979; Daft & Weick, 1984) have pointed out, organizations are among the most complex systems imaginable. They are vast, fragmented and multidimensional. These complex systems have to interpret information that is collected from environment through multiple receiving channels. The environment contains certain level of uncertainty and the difficulty in scanning many times adds biases and equivocality to the data collected (Daft & Weick, 1984). Usually, it is in practice impossible to interpret the information only through objective analysis, but organizational actors have to use mental models they have learned earlier to give meaning to data in a more subjective process.
In their summary of analyzing two streams of literature: the one that sees rational data gathering as the heart of strategic decision making (Wally & Baum, 1994; Nutt, 1998; Werder, 1999) and the one that thinks intuition or tacit knowledge may aid managerial decision making (Mintzberg, 1994; Agor, 1986; Wally & Baum, 1994; Blattberg & Hoch, 1988), Daake et al. (2004) state that the collective decision-making processes used by members of a strategic planning team would involve using a combination of rational and intuitive information. “Managers’ cognition—the psychological result of perception, learning and reasoning has a central role in organizational interpretation and making decisions based on the interpretations.” The differences in cognition affect how efficient management is in handling complex organizational decision situations.
In psychological theory, motivation, cognitive ability, and environment are regarded as the three important variable constructs in determining the direction, persistence and intensity of action as well the level of performance (Kanfer & Ackerman, 1989). This relationship illustrated in Figure 2-1.
Motivation
Cognitiveability
Environ-ment
Action* Direction* Intensity
* Persistence*Performance
Figure 2-1, Applied psychological constructs and environment affecting actions (Wiklund,
1998)
17
If cognition and action are linked as presented in Figure 2-1, however, it is intuitively apparent that both should be related to performance. Performance linkages to cognition and action, although clearly important, have received considerably less study than those between cognition and action. An important area of concern in this field is the investigation of the relationships among cognition, action, and organizational performance (Thomas et al., 1993). As presented in the introduction of the study, the in the conceptual model building section, this study will address the question about relationships between organizational performance, actions and cognition.
This literature analysis will first concentrate on the role of cognition in entrepreneurial growth goal setting and performance in pursuing growth, but it will also discuss the how motivation for such goal setting is born. The aim is to present theories that suit best to explain how social environment affect managerial mental models behind strategies and growth performance.
There are two strands of cognitive psychology research that relate to strategic management and the selection of enterprise management objectives (Minzberg et al., 1998). Both are based upon the observation that most human motivation and action is cognitively generated (Bandura, 1995). The first strand, the constructionist wing of cognitive psychology, is interested how cognition structures strategies, and considers strategy as some kind of interpretation of the worlds. The second strand, the positivistic wing treats human processing and structuring knowledge as an effort to produce some kind of objective motion picture of world. A human being has a limited ability to scan and understand the world and the ability is distorted. The first wing believes that cognition creates the world; the second wing seeks to understand cognition as some kind of re-creation of the world (Minzberg et al., 1998). The second wing of research is mainly related to the study of cognitive ability of humans and organizations, whereas the first wing is mainly related to the construction of beliefs or mental models.
There a specific new field of research emerging that connects cognition theory to entrepreneurship research. Entrepreneurial cognition theory (Baron, 1998; Busenitz & Lau, 1996) became visible in the late 1990s. The theory indicates that strategic decisions are significantly influenced by individual heuristics. The understanding of strategic decision-making is significantly limited without attention to these cognitive processes (Hitt & Tyler, 1991). This has particular implications for entrepreneurs, because they regularly find themselves in situations that tend to maximize the potential impact of various heuristics (Baron, 1998). In attempts to find how entrepreneurial decision-making differs from other types of managerial decision-making, the entrepreneurial cognition theory mainly sees cognition as a source of heuristics based logics that are used in deciding (Baron, 1998). Thus, entrepreneurial cognition theory falls mainly in the area of positivist cognitive research. It is handled in more detail in the chapter discussing positivist strand.
18
2.1.1 Constructionist cognitive research on management’s mental models
Already in 1959, Penrose noticed in her seminal work on firm growth that often, it is not a firm’s resources per se that limit the rate of growth. Instead the environment is treated, in the first instance, as an “image” in the entrepreneur’s mind. The image is telling the entrepreneur about the possibilities and restrictions with which he is confronted. How managers create their cognitive maps is key to the understanding of strategy formation. A strategy is a concept, and so, strategy making is concept attainment (e.g. Bruner et al., 1956). Thus ideas of constructionism have been sources of entrepreneurship researcher for a long time, but empirical studies trying to connect these two have been rare.
The researchers of the interpretive view are usually called social constructionists (e.g. Bateson, 1955). Berger and Luckmann’s The Social Construction of Reality (1966) is usually cited as the seminal text that launched this new field. Essentially, the view is a framework that encourages people to be aware that they are continually constructing realities through conversation, and therefore the next thing they say or hear contributes to the process (Campbell, 2000). We are in the process of constructing the future. From the interpretative or constructionist point of view, what is inside the human mind is not a reproduction of the external world. The mind constructs its world; the “enacted environment” (Smircich & Stubbart, 1985). Social constructionism is not a theory, but a perspective or position, because it does not claim, nor does it offer, a replacement metanarrative and therefore does not remove or resist opposing views. On the contrary, "... constructionist views function as an invitation to a dance, a game, or a form of life" (Gergen, 1994: 79).
According to the view, two basic cognitive processes characterize managers’ sense making activities: scanning and interpretation (Thomas et al., 1993). Scanning involves receiving information, and it has traditionally been seen as an antecedent to interpretation (Daft & Weick, 1984). Scanning provides the external intelligence that a decision maker uses. Interpretation involves processing and understanding the meaning of the received information. Interpretation is often viewed as the faulty part of the sense making process because the use of various heuristics, and other cognitive shortcuts to process information, often leads to inaccuracies (Calori et al., 1992). Decisions and resulting action are the outcomes of scanning and interpretation processes, although researchers recognize the reciprocal effects between them (Thomas et al., 1993).
In the enacted environment view, the assumption is that organization and environment are created together (enacted) through the social interaction processes of key organizational participants. An essential part of social constructionism is that all meanings are social constructions, not purely private (Burrel & Morgan, 1979). Separate objective environments simply do not exist. Instead, organizations and environments are convenient labels for patterns of activity (e.g. Harre & Stearns, 1995). Stated pragmatically in the context of this study, this
19
means that managers and the firms they manage can not be treated as totally separate units of analysis, but each reflects other’s meanings.
According to this interpretive view, the analysis of environmental effects is essentially based on mental models. The general cognition theory implies that information flowing in through filters and decoded by cognitive maps interacts with cognition and is shaped by it (Laukkanen, 1989). Within an organization sense making results in common objectives and activities; however, but sense making also acts as the filter that prevents new knowledge from being embraced (du Toit, 2003). Therefore, the prevailing sense making system within an organization will influence and direct interactions and activities among the members of the organization. Under the constructionist perspective, metaphors become important (Chaffee, 1985) as do symbolic actions and communications; all based on the manager’s total life experience (Hellgren & Melin, 1993). The implication of sense making on organizations is the fact that members of organizations create and sustain their own particular reality (Sims & Gioia, 1986).
The interpretive view has brought in its assumptions a totally new dimension to the organizational research. Traditional organizational scholars view an organization as a framework, control system or open system (Huczynski & Buchanan, 1991). According to the view, to survive, organizations must have mechanisms to interpret ambiguous events and to provide meaning and direction for participants (Daft & Weick, 1984). The interpretive view considers organization as more like a group of transformation processes than control systems. Organizations are meaning systems that have cognitive systems and memories. The mental models of the managers working in organization reflect these systems, and thus individual level models and organizational level models are interwoven.
Bateson (1955) argued that a psychological frame performs a function not dissimilar to that of a picture frame: it resolves the ambiguity of what is inside and what is outside, what is real in the context of interaction between viewer and situation and what is not. The frame tells what information is taken into account. For instance, the sense of reality can change rapidly as the actors change the frame of sense making (Goffman, 1974). The frame is a different concept from the schema that essentially belongs to the individual. The schema depends upon what the individual sees and believes. The frame on the other hand depends upon group dynamics. Frame is more a less a schema shared by a group. El Sawy and Pauchant (1988) found in their empirical study that other group members can persuade group members to interpret information in such a way that the original frame remains correct. Even those members who express a need to modify existing frames in order to interpret the information can be persuaded. This means that no one in an organization sees the environment objectively—environments are constructed within the organization, they are little more than the product of managerial beliefs.
Convention is a concept that tries offer a parsimonious framework for integrating them in order to foster a common understanding of practice in organizations, based on the role of deep
20
structure rather than that of rational action (Gomez and Jones, 2000). Convention is an attempt to make perspectives of constructionists more tangible and analyzable. Gomez and Jones (2000) characterized the concept by stating:
• A convention eliminates a situation of uncertainty where the result of a decision or an action for an agent would be indeterminate by individual calculation alone;
• A convention is an evolutionarily stable (Sugden 1989) element of regularity. It provides a justifying set of norms (the rational void), which makes justification of some choices dispensable, but which gives them sense in the context of a screen of symbols, which relate objects, discourse, and behaviors to the same rational void;
• A convention is based on a shared belief.
There is a group of other concepts worth noticing for further discussion and emerging from the enacted environment view and meaning roughly the same phenomena. The literature mentions dominant logic (Bettis & Prahalad, 1995), corporate culture (Schein, 1992), cognitive maps (Langfield-Smith, 1992), or frame (Bateson, 1955). All of these are used to notion about the effect of commonly held beliefs. Dawson (2005) notices also that studies in the area of social capital (Coleman, 1988) and embeddedness (Granovetter, 1985) are closely linked to the view, and research areas of entrepreneurial innovation (e. g. Hill & Levenhagen, 1995) and the creation of support for entrepreneurial visions (Mintzberg, 1989) have touched the field.
2.1.2 Positivist and perceived environment cognitive research
Numerous positivistic cognitive studies have investigated the role of cognitive intellectual
abilities and job performance and the fact that cognitive ability is related to the direction and
performance of action has been shown (Kanfer & Ackerman, 1989).
In the management and strategic research, the effects of cognitive abilities have mainly been
analyzed by using behavioral decision theory (Autere & Autio, 2000). According to this more
positivistic tradition, executives develop their own cognitive representations of reality called
schema or mental understandings that are stored and then used as templates to explain and
interpret events (Hastie, 1981). These mental structures control the selection of information to be
noticed and encoding and reconstruction of it in memory (Starbuck & Milliken, 1988).
21
Management researchers have been especially stimulated by the work of Herbert Simon
(editions 1947 and 1957). He has popularized the notion that the world is large and complex,
while human brains and their information-processing capabilities are highly limited in
comparison. Decision-making thus becomes not so much rational as a vain effort to be rational.
Due to the limitations of the human condition, individuals must learn to amplify relevant
information and attenuate irrelevant information in order to create understanding.
Das and Teng (1999) suggest that cognitive biases are systematically associated with strategic
decision processes. Different decision processes tent to accentuate particular types of cognitive
bias. In their integrative analysis they recognize four basic types of cognitive bias under five
different modes of decision making. The cognitive biases include (1) prior hypotheses and focus
on limited targets, (2) exposure to limited alternatives, (3) insensitivity to outcome probabilities
and (4) illusion of manageability (Das & Teng, 1999).
The research on the relationship between task performance and cognitive ability has shown that
cognitive ability has an effect on how well the task is performed via the effective meeting of
dynamic cognitive resource demand imposed by the task (Kanfer & Ackerman, 1989). The place
on which positivistic cognitive research sheds light on understanding performance is in the phase
of actual task execution, not that much in how motivation is born and direction selected as
Figure 2-2 shows.
Cognitiveability
Taskselection
Taskexecution
TaskperformanceMotivation
Figure 2-2, Relationships between motivation, task selection, and performance (Kanfer &
Ackerman, 1989)
2.1.2.1 Entrepreneurial cognition research
A research perspective called entrepreneurial cognition sheds light on the differences between cognitive abilities of entrepreneurial and “managerial” behavior. There is a growing
22
accumulation of successful studies framed in entrepreneurial cognition terms (Mitchell et al., 2002b).
Baron (2004) suggests that a cognitive perspective may provide important insights into key aspects of the entrepreneurial process. Specifically, Baron (2004) proposes that cognitive perspective—which has yielded impressive results in many other fields—can help the field of entrepreneurship to answer three basic questions it has long addressed: (1) Why do some persons but not others choose to become entrepreneurs? (2) Why do some persons but not others recognize opportunities for new products or services that can be profitably exploited? (3) Why are some entrepreneurs so much more successful than others?
The entrepreneurial cognition analysis has suggested that entrepreneurs’ thinking may differ, in important ways, from that of other persons; specifically that they may be more susceptible to various kinds of errors and bias than other persons (Baron, 1998). In his conceptual analysis, Baron (1998) suggests that these biases entrepreneurs are more prone to than other people are:
• Counterfactual thinking; the tendency to imagine what might have been in a given setting and regrets over missed opportunities;
• Affect infusion; affective states produced by one-source influence judgments and decisions about other, unrelated sources;
• Attribute styles; most individuals tend to attribute positive outcomes to internal causes, but negative outcomes to external causes (the self-serving bias);
• Planning fallacy; the tendency of most people to underestimate the time required to complete various projects, or to overestimate how much they can accomplish in a given period of time;
• Escalation of commitment: self-justification; the tendency to continue investing resources in losing ways, because of the initial commitment and the desire to justify the initial decision;
Baron (1998) further argues that the differences of cognition between entrepreneurs and other people do not stem primarily from the differences in personal traits, but rather from the fact that entrepreneurs operate in situations and under conditions that would be expected to maximize such errors and biases. Thus Baron is suggesting a self-enforcing loop: people in situations creating typical entrepreneurial biases tend to commit such decisions that create more biases.
Wright et al. (2000) further refine the assumptions on entrepreneurial cognition based on their conceptual analysis. They present six main characteristics of entrepreneurial cognition: (1) Individual behavior is heuristics based. (2) Firm ownership facilitates exploitation of
23
entrepreneurship skills. (3) Heuristics are used to quickly interpret the complex and changing business environment to detect emerging trends. (4) Risk concerns are overruled by opportunity recognition. (5) Strategic information, unavailable from the marketplace, emerges from experience and heuristics-based logic. (6) Heuristics based logic complements entrepreneurial learning, which leads to the evolution of radical innovations.
Busenitz and Barney (1997) found that entrepreneurs have more often overconfidence (overestimating the probability of being right) and representativeness (the tendency to over generalize from a few characteristics or observations) biases compared to managers in large organizations. Simon et al. (2000) found that illusion of control and belief in the law of small numbers reduce the risk perception of entrepreneurs, which reduces the probability of the decision to start a new venture. They also directly increase the probability of the decision to start a new venture.
Mitchell et al. (2000b) analyzed how cognitive scripts affect the decision to found an enterprise. Cognitive scripts are a concept presented by expert information processing theory. According to the theory, experts in an area possess knowledge structures, or scripts, about particular domains that allow them significantly outperform non-experts (Read, 1987; Glaser, 1984). They found that arrangement scripts, relating to the feasibility of a venture; willingness scripts, relating to the propensity to act; and ability scripts, related to venture desirability all had statistically significant effect on new venture creation decision. Mitchell et al. (2002a) presented further analysis that individuals who possess professional entrepreneurial cognitions do indeed have cognitions that are distinct from business non-entrepreneurs. They also presented evidence of a universal social cognition and culture of entrepreneurship.
The problem with entrepreneurial cognition research has been the definition, who is an entrepreneur (Mitchell et al., 2002a). In the absence of existing measurable operationalization of entrepreneur that could be used as the dependent variable, the analysis has created actually a new definition of entrepreneurs. Despite this problem, the research increases understanding how entrepreneurial persons might make sense of the world around them. Another potential problem is that the research so far has mainly concentrated upon defining biases, and thus falls in the area of positivistic cognitive research. The stream of constructionist and social cognition research has only started to emerge during last five years (Mitchell et al., 2000; Mitchell et al. 2002a).
2.1.2.2 Entrepreneurial learning
The notion of organizational learning has been explored in management literature for several decades (e.g., March & Simon, 1958; Argyris & Schön, 1978; Hayes et al., 1988; Schein, 1993). This interest stems from the premise that success in changing environments requires learning—recognizing a need for change, evaluating new possibilities, and implementing new courses of
24
action (Edmondson, 2002). Organizational learning is an encompassing rubric under which researchers have studied, in remarkably varied ways, this fundamental need to adapt and change.
Learning generally is viewed as an iterative process of action and reflection in which action is taken, accessed by the actor, and modified to produce desired outcomes (Kolb, 1984; Dewey, 1938). Organizational learning is often further defined as a process of improving organizational actions through better knowledge and understanding (Fiol & Lyles, 1985; Garvin, 2000). Garvin (2000) further states that a useful conception of organizational learning must include change so that an organization can be said to learn when its actions have been modified as a result of reflection on new knowledge or insight.
Entrepreneurial learning research complements the other views of entrepreneurial sense making mechanisms. Lei et al. (1996) claim that traditional approaches to studying competitive advantage, while valuable, are not adequate to explain how firms can operate effectively in turbulent and often chaotic environments. They offer a resource or skill-based view focusing upon the development and application of core competences to supplement traditional approaches. They present a model of the development and outcomes of dynamic core competences based upon organizational meta-learning. Dynamic core competences can be leveraged to create growth alternatives of global diversification, new applications of existing technologies, and the development of business lines.
Minniti and Bygrave (2001) model entrepreneurial learning as a calibrated algorithm of an iterated choice problem in which entrepreneurs learn by updating a subjective stock of knowledge accumulated on the basis of past experiences. Specifically, it is argued that entrepreneurs repeat only those choices that appear most promising and discard the ones that result in failure. They provide a structural model of entrepreneurial learning in which failure is as informative—though clearly not as desirable—as success. The entrepreneurs process information, make mistakes, update their decisional algorithms and, possibly through this struggle, improve their performance.
Deakins and Freel (1998) draw on case and interview material from research with small and medium-sized enterprise entrepreneurs to examine the process of entrepreneurship and entrepreneurial learning. The cases have been drawn from different sectors including services, manufacturing and technology-based sectors such as hydraulics and software development. They review the contribution of organizational learning theories as well as other theories. Case study evidence is presented on the nature of entrepreneurial learning in growth oriented small and mid-sized enterprises. It is found that small and mid-sized enterprise strategic change and development occurs more as a result of a combination of knowledge and reaction to critical events than through planned development. This indicates the importance of learning from experience on future development even though there may be broad plans in place and the entrepreneurs may have clear objectives concerning their role in the expanded company. The
25
entrepreneur, through experience, acquires the ability to learn. Learning is the result of a series of reactions to critical events in which the entrepreneur learns to process information, adjust strategy, and take decisions. They argue that organizational learning theories are inappropriate when applied to the entrepreneurship process and the growth process in small firms.
Based on the discussion above, entrepreneurial learning research seems more a way to define what entrepreneurial behavior is and how it differs from ordinary organizational behavior than an analysis of the differences inherent in entrepreneurial and ordinary organizational learning. Available literature does not offer much of a foundation for the application of statistical research either, but empirical research so far tends to be mainly case studies. Still entrepreneurial learning is an important notion to be used in further model building in this study. Even though it starts from a positivists view, the notion puts emphasis how entrepreneurial learners do not only learn to better operate under the existing rules, but are also able to develop new personal schemas and even organizational frames to be able to make decisions efficiently even in chaotic environments.
26
2.2 Managerial motivation
Besides cognition, motivation represents the second of the two most commonly presented basic determinants of work performance in applied psychology, as presented in Chapter 2.1.
Since the late 1980s, studies on managerial growth motivation have shed doubts on the earlier assumptions that managerial behavior is always based on seeking growth. Hay and Kanshad (1994) concluded that a significant number of British firms in their sample of small and medium-sized enterprises did not hold growth as a major objective, A study of 747,970 firms in the United Kingdom found that 55 percent of the firms had no plans for growth; even at the high point of economic growth in June 1987 (Hakim, 1989). Only 15 per cent of independent small firms overall were actively looking for significant expansion. Small firms (0-2 employees) particularly had no growth aspirations. Covin et al. (1990) ended up classifying only 17 percent of their original sample as growth seeking firms. As there are many companies whose management is not growth seeking, the motivation of management to grow may also have an important role in explaining the differences in growth (Hay & Khamshad, 1994).
Based upon abovementioned research findings, there is clearly a need to understand what motivational factors drive managerial behavior. Otherwise the full picture regarding the different factors affecting small and medium sized company growth is not achieved. When the rationality assumption of entrepreneurial management is relaxed, the natural focus shifts to expectations and motivations as influences on growth orientation, strategies, and eventual growth (Autere & Autio, 2000). If decision-making is not assumed to be based on rational firm situation analysis, the role in management decision making based upon free choice increases.
Explicit research on growth orientation has been increasing in volume during recent years (e.g. Miner et al., 1989; Miner et al. 1994; Davidsson, 1989; 1992; Kolvereid, 1992; Davidsson & Wiklund, 1997; Orser et al., 1998; Arenius, 1999). Typically such studies have drawn on the classical motivation and expectancy theories to model managerial behavior. Therefore we next turn to these theories.
There are plenty of different theories on work motivation, so the main task of this analysis is to recognize which ones are the most valid. The main difference between the multiple theories is their focus upon different stages of the motivation process. Locke and Henne (1986) and Locke (1991) have described the stages to which each theory applies best. Their classification is illustrated in Figure 2-3.
ValuesNeed for achievementRole motivation theoryExpectancy theoryEquity theory
GoalsLocke &Latham's goalsetting theory
S e l f - e f f i c a c y &ExpectancyBandura's social-cognitive theoryExpectancy theory
Performance
Figure 2-3, Sequence of motivation related concepts affecting performance (Locke, 1991)
The term needs in the figure refers to requirements of the organism’s survival and well-being. The term values refer to assumptions “what the individual acts to gain and/or keep” (Rand, 1964). They are what individual considers good or beneficial. Values are of conscious. In contrast, needs may or may not be conscious. Goals are means of actualizing values; they are the mechanism by which values are translated into action (Locke & Henne, 1986).
This is a study of factors affecting organizational performance. Thus, the most relevant motivational theories for this study are those that are most directly linked to performance. From Figure 2-3 it can be seen that the most potent theories are: goal setting theory which provides insights on how strategic directions are set; social-cognitive theory which provides insight on what affects performance except strategies; and expectancy and equity theories which provides insights how the basic assumptions in goal setting are made.
Role motivation theory (Miner, 1980) is concentrated on the motivation of persons working in large and bureaucratic organizations and as such, is not very applicable for small and medium sized company studies. Task motivation theory does not link characteristics of managers directly to action and is therefore not very interesting for the purposes of this study (Miner, Smith, & Bracker, 1989).
Maslow’s (1954) need hierarchy theory and Deci’s (Deci & Ryan, 1985) intrinsic motivation theory are more concentrated on distal and general aspects of motivation than goals related to specific action. As this study seeks to explore reasons for direction of action, theories concerning only intensity, persistence, and performance are less suitable.
In addition to the theories in Figure 2-3 the motivation theories include, e.g. Hackman-Oldman job characteristics theory (Hackman & Oldham 1980), Herzberg two factor theory (Herzberg et
28
al, 1959), and Locke’s (1976) satisfaction theory. However these are used to explain job satisfaction, not performance. Thus none of these theories are analyzed further.
In entrepreneurship research, a very popular theory has been McClelland’s achievement motivation theory (McClelland, 1961). It studies a person’s need for how each characteristic affects their performance; especially success as an entrepreneur, and the motivation of a person. As presented in Chapter 1, this study does not handle the characteristics of managers. Thus achievement motivation theory is left out of this study.
The summaries of four work motivation theories relevant to this study are presented in the following four sub-chapters. The theories are goal setting theory, expectancy and planned behavior theory, self-efficacy theory, and equity theory.
2.2.1 Goal setting theory
According to Locke’s sequence of motivation model, most proximal motivational constructs to action are goals and intentions. The theory focusing upon them is Goal setting theory that is mainly concerned with the relationship between goals and performance of work-tasks (Locke, 1968; Tubbs, 1986; Locke & Latham, 1990; Earley & Shalley, 1991). Originally Locke (1968) presented also sophisticated steps, how values created goals, but this part has been paid less attention in further work, and even Locke himself has turned to social cognition theory on sources of goals (Bandura & Locke, 2003).
In goal setting theory, goals are claimed to influence task performance by directing attention and action, by mobilizing effort to the task and by motivating individuals to develop goal-attainment strategies (Locke et al., 1981). Goal is defined as “a specific standard of proficiency on a given task, usually within some time limit” (Locke & Latham, 1990: 26). Feedback on the work-task results is necessary in order for individuals to relate performance to goals. Feedback indicating that an individual is lagging behind the goal will motivate the individual to increase his or her performance. Goal commitment is also necessary for goals to affect performance (Locke & Henne, 1986).
The goals are an intermediate step between values and action. According to Locke (1991) the relation of goals to values is the relation of general to the specific. Goals can be viewed as applications of values to specific situations. Goals are hypothesized to reflect the person’s values as they are seen (consciously or subconsciously) to pertain to the situation. “A person who is ambitious, for example, might set high goals at her workplace but not at ‘bridge’, which she may play in her leisure time” (Locke, 1991).
29
Locke et al. (1981) observed that 90 percent of all goal-setting studies showed a beneficial effect of goal-setting upon performance. Latham and Lee (1986) compared goal-setting studies that compared results when persons had either specific, challenging goals or than had no goals. They found that in 97 percent of cases, a positive correlation between having goals and achieving them was found.
The more detailed findings of goal setting research are as follows (Locke & Henne, 1986):
• Difficult goals lead to higher task performance than easy goals;
• Specific and difficult goals lead to higher performance than do non-existent or vague goals;
• The mechanisms by which goals affect task performance are: by directing attention and action; by mobilizing effort; by increasing persistence; and by motivating the search for appropriate performance strategies;
• Feedback appears necessary in order for goal setting to work. Feedback and goals work together substantially better than either do alone;
• Goal commitment is necessary for goals to affect performance (Wofford et al., 1992);
• Goal commitment seems to be generally unaffected by participation in goal setting, but is affected by factors such as goal success expectancy as well as success valency;
• Money may encourage spontaneous goal setting, may lead to higher goals being set, and may also lead to higher goal commitment:
• Individual difference measures, such as e.g. demographics or personality, are not consistently related to goal-setting effectiveness..
The main critique of goal setting theory has stemmed from cognitive ability studies (Huber, 1985) and perceptual control theory (Vancouver et al., 2001). Goals which are too high or specific may restrain the cognitive abilities of an individual. In a computerized maze task, Huber (1985) found that subjects with specific performance goals did significantly worse than those told to do their best. This theory demonstrates that in cases in which subjects reach the limits of their ability with difficult goals, the relationship between goal setting and performance levels off (Locke & Latham, 1990).
Several studies show that setting proximal performance goals in addition to distal goals can produce better performance than distal goals alone (Bandura & Schunk, 1981; Latham & Seijts, 1999; Morgan, 1985). Distal goals define the ultimate level of performance to be achieved, whereas proximal goals define preliminary levels of performance to be achieved while working
30
toward the distal goal. Bandura (1997: chap. 4) described several motivational and self-referent processes believed to produce this effect. According to Bandura, proximal plus distal goals produce better performance than distal goals alone because (1) proximal goals create a sense of immediacy that reduces procrastination; (2) proximal goal attainment provides a clear mark of progress that increases feelings of accomplishment, which increases motivation; (3) proximal goal attainment increases perceived efficacy for attaining the distal goal, leading to increased effort and persistence; (4) proximal goal attainment leads to a sense of mastery and causal agency that increases intrinsic interest in the task; and (5) proximal goals provide benchmarks used to evaluate progress toward the distal goal so that workers can develop more effective task strategies when their progress indicates that the distal goal will not be met. Existing research has tested the effects of self-efficacy (Bandura & Schunk, 1981; Latham & Seijts, 1999), intrinsic interest (Bandura & Schunk, 1981; Morgan, 1985), and persistence (Bandura & Schunk, 1981) and has shown that these variables do mediate the proximal goal effect.
Frink & Ferris (1998) state that while extensive research has shown us how goal setting works, understanding why it works has proven elusive. It seems possible that both setting and accomplishing goals (i.e., both the processes and outcomes) may serve as a means for achieving self-satisfying objectives, such as elevating or defending either our self or public image. In this view, the goal setting process itself may help one achieve a secondary objective, such as image enhancement, providing a motivational basis for goal setting. Indeed, empirical research supports this notion. For example, Greenberg (1985) investigated goal setting as a self-handicapping strategy, and suggested that choosing a very difficult goal allowed individuals to externalize outcomes that might have threatened their self-images, thus providing an excuse for poor performance. Performance is not elevated, because the goal-performance linkage is severed, and. A positive relationship under conditions of low accountability is expected and a much reduced relationship under high accountability is expected (Frink & Ferris, 1998).
An empirical study by Weldon and Yun (2000) increased the understanding how goal setting works. In their study, setting proximal goals in addition to distal goals led group members to set more difficult distal goals, which in turn increased the level of performance ultimately achieved. Contrary to some previous research (Durham et al., 1997; Weldon et al., 1991), they did not find development of strategies to have a mediating effect on group goals and group performance. Hence, it is feelings of accomplishment, perceived efficacy, and intrinsic interest in the task rather than a capability to select the correct task strategy which makes goal setting work.
In the context of this study, goal-setting theory is used to reason why the growth orientation level selected leads or does not lead to higher growth. Goal setting theory seems to be capable of explaining motivational effects, but not actual strategic and execution choices. Goal setting theory does not shed much light on the main question of this study, how growth orientation is born.
31
2.2.2 Expectancy and planned behavior theories
Expectancy theory purports to answer the question of why individuals choose certain actions over others. As a generalized value theory, it is applicable on analyzing different complexes of values. Vroom (1964) presented expectancy theory in its classical form. The theory proposes that motivation results from simultaneous good Perceived Outcome Valency and Effort-Outcome Expectancy.
The concept of valency refers to affective orientations toward particular outcomes. An outcome is positively valence when the person prefers attaining it to not attaining it. An outcome has a valency of zero when the person is indifferent to attaining it or not attaining it and it has negatively valency when he prefers not attaining it to attaining it. It is assumed that valency can take a wide range of both positive and negative values. (Vroom, 1964)
The concept of expectancy is defined as a momentary belief regarding the likelihood that a particular act will be followed by a particular outcome. Expectancies may be described in terms of their strength. Maximal strength is indicated by subjective certainty that the act will be followed by the outcome while minimal strength is indicated by subjective certainty that the act will not be followed by the outcome. Expectancy is an action-outcome association. In its original form, expectancy theory sees motivation as a result of complex mathematical calculations that require valency and expectancy data from all possible actions and outcomes related to a potential motivational force area (Vroom, 1964). In later development, the exact strict formulas were removed.
Advanced versions of theory suggest a third construct on which a person’s motivation to perform a given act will depend: i.e., the instrumentality of the act (Pinder, 1991). This is usually measured as the perceived probability that the act will lead to a given outcome. Expectancies are then redefined as the subjective belief that exerting a given level of effort will lead to successful performance of the act. Hence, insertion of instrumentality concept separates belief in a successfully performed act, and a causal relationship between the act and its outcome, In most versions of the theory, the instrumentalities of each outcome are multiplied by the valency for each outcome Pinder, 1991). The sum of these products is multiplied by the expectancy of obtaining the total measure of the motivational force strength (Locke & Henne, 1986).
The development of this theory has also changed the definition of construct valency from anticipated satisfaction to importance (value). Pecotich and Churchill (1981) compared these two operationalizations of valency. Ratings given by 40 salespeople in this study showed extremely high agreement between the two operationalizations of valency. So, even though there might be
32
a conceptual difference between valency and value, in practical operationalization, the difference is vague.
In the preface of his seminal book (Vroom, 1964), Vroom (1995) himself critiques the original assumption behind expectancy theory in that human choice is rational. He states that since 1964, developments in cognitive psychology have shown serious limitations to this type of theory. People make decisions that they believe to be optimal at the time when they make them, but these decisions are not always objectively optimal.
In the original form of expectancy theory, individual decision-makers should have considered all alternatives and be capable of evaluating each and every relevant dimension. Already before the emergency of expectancy theory Simon (1947) pointed out regarding the limitations of peoples` cognitive capabilities that is an unrealistic requirement. Vroom (1995) also states that the emphasis of expectancy theory upon maximization has later been considered as unfortunate. The empirical modeling of behavior requires the belief that all the values that people attain in a particular situation can be measured (Ajzen & Madden, 1986).
Based upon the doubts surrounding human cognitive capability, a modified version of expectancy theory, named planned behavior (TBP), was born (Ajzen, 1985; 1987; 1991). It has been widely applied across a range of disciplines. According to this modified theory, behavioral intention is the immediate antecedent to behavior. A person is more likely to perform a behavior as behavioral intention increases. The theory specifies three influences on the intent to perform a given act: perceived behavior control (PBC), subjective norm (SN), and the individual’s attitudes towards the act (A).
Attitude examines a person’s disposition toward a behavior (Ajzen, 1991). Attitudes towards behavior arise from a person’s beliefs about the consequences resulting from its performance and the person’s affective response to those consequences. Ajzen proposed that as person’s attitudes toward the behavior become more favorable his or her intention to perform a behavior increases.
Subjective norm includes attributes of a person’s social environment; the individual’s perceptions regarding the social desirability of the act (Ajzen, 1991). Subjective norms depend upon a person’s perception of the important referents’ evaluation of a behavior and the person’s motivation to conform to those evaluations. Intention to perform a behavior increases as subjective norms become more favorable.
Perceived behavior control represents the individual’s confidence that she is able to control the consequences of a given act (Ajzen, 1991). In the case of growth motivation, perceived behavior control represents the person’s confidence that she will be able to grow her firm successfully. In many situations, this would be the same as the perceived likelihood, or expectancy, of success. The research has mostly also equated perceived behavior control to self-efficacy (Ajzen, 1985).
33
By attributing social norm and own attitudes to behavior, the planned behavior theory has addressed the subjective rationality assumption for which traditional expectancy theory has at times been criticized (Vroom, 1995). In the many empirical studies of planned behavior theory, the attitudes construct has been found to have strongest relationship with behavior intentions (Ajzen, 1991). Therefore it might be wise to assume that attitudes are one of the strongest factors that affect growth intentions and growth oriented acts.
Empirical studies show that expectancy and planned behavior theories have demonstrated certain robustness in predicting the growth motivation of managers. Davidsson (1989; 1992) and Kolevereid (1992) found support for both expectancy theory and planned behavior theory in their samples of Swedish and Norwegian entrepreneurs. Previous growth experience was found to be positively associated with growth motivation. Previous growth experience was assumed to positively influence both the expectancy of positive growth outcomes as well as perceived behavioral control.
Orser et al. (1998) used the theory of planned behavior to examine the relationship between personal and business success expectations with growth intentions. They found growth intentions to be positively associated with an owner’s expectation of positive growth outcomes, social norms, and perceptions regarding the feasibility of growth perceptions. In her sample of 136 business service entrepreneurs in Finland, Arenius (1999) found a positive association between expected outcomes and growth motivation.
Even if the strict mathematical formulation for the relationship between motivation, expectancy and valency is relaxed, the original proposition of expectancy theory, that there is an interaction between valency and expectancy when affecting motivation, has been met with both conceptual (See, e.g. Mitchell, 1982) and empirical (See, e.g. Terborg, 1977) criticism. Empirical studies have produced mixed evidence regarding whether ability-motivation interaction exists. Expectancy theory gives little attention to a complex skill acquisition phase and assumes that the prerequisite skills have been learned before the rules apply (Kanfer & Ackerman, 1989). It has been proposed that differences in task difficulty might explain when the expectancy theory rules should apply (Terborg, 1977). In less difficult tasks, ability may represent a less potent predictor of performance than would motivation. In contrast, the interactive effects of motivational processes and ability may substantially affect performance of more difficult task assignments.
In a critical summary, Kanfer and Ackerman (1989) state that no unified approach currently exists for understanding the simultaneous effects of motivation and individual differences in the abilities of task performance. Therefore it seems that planned behavior theory that does not assume interaction between independent variables is more robust than expectancy theory that assumes such interactions.
34
Planned behavior theory provides potential answers to the main question of this study: how growth orientation is born. It provides three potential explanations to differences: different social norms, different perceived behavior control, and attitudes. In this context, potentially important social norms might be shared in the same region and might be detected through, for instance, those who are considered to be opinion leaders in a given region. Perceived behavior control is potentially higher if the company or manager has faced met fast growth situations before. Attitudes might be dependent upon the views of the company stakeholders.
2.2.3 Attribution and social cognitive theory and self-efficacy concept
In building their mental models and views, virtually all human beings seek to identify the causes of events through a process called attribution (e.g. Pittman 1993). In attribution, an individual observes through orderly and rational processes information that may shed light on causal relationships. Important targets of observation are other individuals. Attribution theory is a field of research about how people explain events (Heider, 1958; Jones & Davis, 1965). They can either search causal reasons for (“attribute”) their behavioral outcomes from external factors or their internal capability. Attribution theory is relevant to the study of a person’s perceptions, event perceptions and attitude change, which can then lead to individuals impacting their own self-esteem, as well as their own levels of anxiety.
In the setting of this research, where the intention is to understand how self-esteem is born, possibly the most relevant strand of attribution is theory called social learning theory (Bandura, 1977) that has been further developed from locus of control theory (Rotter, 1966). Social learning theory has the central idea that one observes another person’s behavior and then does something similar (Rogers, 2003). Bandura (1986) has further developed social learning theory to a more generic theory usually called social cognitive theory. It explains human behavior in terms of continuous reciprocal interaction between cognitive, behavioral, an environmental influences. The component processes underlying observational learning are: (1) attention, including modeled events (distinctiveness, affective valence, complexity, prevalence, functional value) and observer characteristics (sensory capacities, arousal level, perceptual set, past reinforcement), (2) retention, including symbolic coding, cognitive organization, symbolic rehearsal, motor rehearsal), (3) motor reproduction, including physical capabilities, self-observation of reproduction, accuracy of feedback, and (4) motivation, including external, vicarious and self reinforcement.
The central concept in social cognitive theory is self-efficacy (Bandura, 1977, 1982 and 1997). It is defined as a person’s belief in his or her capability to perform a task (Gist, 1987). Self-efficacy is directly linked to personal action, but also to how goals and intentions are influenced.
35
Self-efficacy or perceived behavior control is one of the suggested sources of intended behavior in planned behavior theory (Ajzen, 1985). The concept of self-efficacy is closely related to the concept of perceived behavioral control (Ajzen, 1987). Both concepts refer to perceptual factors that are specific to the attainment of a given behavior or behavioral goal. The concept of self-efficacy is also related to expectancy concept of expectancy theory. Self-efficacy differs from expectancy concept in that self-efficacy focuses on a conviction that one can carry out a required behavior (Gist, 1987). Self-efficacy is considered to be a broader concept than perceived behavioral control, extending beyond mere effort considerations to include such factors as mood and coping abilities (Gist & Mitchell, 1992).
Self-efficacy is concerned with judgment by individuals: how well one can execute courses of action required to deal with prospective situations (Bandura, 1982). Hence it addresses an individual’s belief about how good he or she is in performing specific work-tasks. If a person’s self-efficacy regarding a specific work-task is high, this person is more likely to perform the task, and more likely to perform it well. Although these are beliefs rather than value concepts, they are nonetheless beliefs with important motivational consequences (Locke, 1991). Self-efficacy is acquired gradually through the development of complex cognitive, social, linguistic, and/or physical skills that are obtained through experience (Gist, 1987). Thus the acquisition of skills through past achievements reinforces self-efficacy and contributes to higher aspirations and future performance (Herron & Sapienza, 1992).
Attribution theory and social learning theories are not motivational theories, but cognitive and constructionist ones. Still, their effects are mainly motivational so it is handled here as a theory explaining the motivational reasons behind actions. In this theory, a person’s level of motivation, affective states, and actions are addressed. The aim is to give full comprehension of personal causation. The theory explains, within a unified conceptual framework, the origins of personal efficacy, its structure and function, the processes through which it operates, and its diverse effects.
The findings from diverse causal tests, in which efficacy beliefs are systematically varied, consistently show that such beliefs contribute significantly to human motivation and attainments (Bandura, 1992). The stronger the perceived self-efficacy, the higher the goal a person sets for himself, the firmer is their commitment (Locke & Latham, 1990).
According to social learning theory, there are four main factors which influence people’s beliefs regarding their efficacy (Bandura, 1997).
• Mastery experiences. Success builds a robust belief in one’s personal efficacy. Failures undermine it, especially if failures occur before a sense of efficacy is firmly established. Developing a sense of efficacy involves acquiring the cognitive, behavioral, and self-regulatory tools for creating and executing appropriate courses of action;
36
• Vicarious experiences. Seeing people similar to them succeed by perseverant effort increases an observer’s beliefs that they too possess the capability to master comparable activities. The greater the assumed similarity, the more persuasive are the models’ successes and failures. Proficient role models convey efficient strategies for managing situations, and they affect self-efficacy through a social comparison process (Wood & Bandura, 1989);
• Social persuasion. People who are persuaded verbally that they possess the capability to master given activities are more likely to mobilize greater effort and sustain it than these that if they harbor self-doubt and dwell on personal deficiencies when problems arise (Litt, 1988);
• Psychological and emotional states. People interpret their stress reactions and tension as signs of vulnerability to poor performance. Positive mood enhances perceived self-efficacy; despondent mood diminishes it (Kavanagh & Bower, 1985).
If the views of social constructionism are taken into account, the third factor gets a wider content than just verbal persuasion. According to the view the sense of self is dependent on the perception others have of an individual and how that is reflected back to the individual (Campbell, 2000).
An individual’s performance judgments result from an integration and assimilation of efficacy information derived from all four of these sources (Gist & Mitchell, 1992). The formation of self-efficacy is also influenced by the individual’s assessment of the availability of resources and constraints—both personal and situational—that may affect future performance (Ajzen, 1987; Gist & Mitchell, 1992).
Social cognitive theory is mainly interested in an individuals’ belief in their ability to execute requisite activities and how this affects the behavior of that individual. The theory only needs other motivational theories like expectancy theory or goal setting theory to more closely analyze the relationship between behavior and outcome, as well as how outcome expectancies affect perceived efficacy and behavior (Bandura, 1997: 21-24). Thus, in the context of this study, social cognitive theory is valuable in giving insights on the potential cognitive sources of growth. The theory suggests that previous growth experience, such as the success of other role models in growing their companies as well as social norms might affect a manager’s growth motivation.
Boyd and Vozikis (1994) have made a conceptual analysis upon integrating self-efficacy to entrepreneurial intentionality. They define entrepreneurial intentionality a concept dealing with intentions to start a new enterprise, not with the growth of the entry, but the analysis gives support on the applicability of self-efficacy in understanding processes how entrepreneurial mindsets are born and how they work. They propose that enactive mastery previous job
37
experience will contribute positively to the acquisition of entrepreneurial self-efficacy. The higher the entrepreneurial self-efficacy, the higher the probability entrepreneurial actions during the later stages if one’s career or after a career interruption. They further suggest, based upon empirical studies on parent role models (Bowen & Hisrich, 1986; Mokry, 1989; Scherer et al., 1989) that the presence of an entrepreneurial role model positively affects the degree of entrepreneurial self-efficiency, which leads to higher probability of entrepreneurial actions. They provide corresponding support also to the effects of social persuasion and goal setting factors on self-efficacy and on entrepreneurial behavior.
Chen et al. (1998) develop the integration of self-efficacy concept to entrepreneurial intentionality further. They have operationalized a specific construct, entrepreneurial self-efficacy (ESE). They find support for the hypothesis that higher entrepreneurial self-efficacy is related to actions to found an enterprise. The hypothesis was empirically tested with 175 business managers and 141 students. Thus it seems that self-efficacy concept can be effectively used to enrich the view on processes how entrepreneurial mindsets are born and what are the characteristics of an entrepreneur. It might be possible to use the concept or views behind it also in analyzing entrepreneurial growth.
2.2.4 Equity theory
Equity theory (Adams, 1965) is more concentrated upon the distal and general aspects of motivation than upon goals related to specific action: However, equity theory raises an important issue as regards motivation theory. The theory is built upon that most people prefer a condition of equity or fairness in their exchange relationships with other people and organizations.
Equity theory is generally stated in terms of an individual’s perceived inputs and outcomes in the work environment (Adams, 1965). Inputs are anything which an individual perceives he is giving. Examples of inputs might be education, skill and work. Outcomes are what the individual perceives he receives from the exchange relationship, e.g. money, intrinsic rewards, etc. Equity theory states that the individual compares the ratio of his own outcomes and input with the corresponding ratio for a reference person, usually another person in the organization. When the ratios are no longer perceived as equal, a state of inequity is said to exist. According to Adams (1965), inequity creates tension in the individual, proportional to the magnitude of the inequity. This tension motivates the individual to reduce the inequity.
Actual reactions to inequity may take many forms. Miner (1980) suggests that the individual who feels inequitably treated may: (1) alter his inputs; (2) alter his outcomes; (3) distort his views of his inputs and outcomes; (4) leave the situation; (5) act upon the reference individual; or (6) change the reference individual.
38
Research interest in equity theory has declined significantly since the 1960s, most probably because the theory is too flexible (Locke & Henne, 1986). The researcher can explain afterwards any behavior in terms of theory. Further, its utility is limited because equity is only one of many values that human beings seek. Thus it can offer only a partial explanation of behavior.
In empirical testing, it has been found that equity theory predictions with respect to people who feel under-compensated have been supported, while equity theory predictions with respect to overcompensated people are less consistent (Mowday, 1979). Also, an individual’s level of moral development may determine the theory’s explanatory power (Vecchio, 1981). More mature individuals will behave more in accordance with equity theory.
In the context of this study, equity theory has limited impact other than its notion about reference persons. The theory is focused upon finding equity in outcome-to-input relationships with referent partners, not in explaining pure reference relationships where no direct exchange relationship exists.
More fruitful than equity theory for this study is a related theory from the field of sociological studies: discrepancy theory (Lawler, 1971). Both the equity and discrepancy theory are based on the notion that examples from other entities can guide the motivational settings of persons and their organizations. Discrepancy theory does not demand an input or output relationship with a comparison entity, but includes both the possibility that one compares his organization or organizational settings with other organizations and the possibility that a person compares herself to other persons (Lawler, 1971). Thus, according to discrepancy theory, it is possible that other firms may be used as referents instead of other managers. For instance, in his pay satisfaction study, Goodman (1974) found seven types of referents: other-inside, other-outside, system-structure, system-administration, self-pay-history, self-family and self-internal. Therefore a system-structure, meaning an organization (not the people working within it) can also be a source of referents.
39
2.3 Theories on the growth of small firms
2.3.1 Penrose’s theory on the growth of the firm
The long history of growth research has produced many views on what causes the growth of a firm. The analysis of firm growth as a separate phenomenon from analyzing advantages of being a particular size originates from Penrose (1959). Before her book, traditional economics had concentrated upon explaining movement from one size to another in terms of the net advantages of different sizes (O’Farrell & Hitchens, 1988). Penrose (1959: 1-2) argued that there is no optimum size of a firm. Penrose suggests that firms have a natural reason to grow: the economies of growth. The size of a firm is only a by-product of the process of growth.
Penrose (1959) argued that internal inducements on expansion arise when some specialized service required for the operations of the firm demands a resource. For the most part, resources are only obtainable in discrete amounts; that is to say, a “bundle” of services must be acquired even if only a “single” service should be wanted. Some capacities of the resource remain unused and unproductive. Having acquired resources for actual and contemplated operations, a firm has an incentive to use as profitably as possible the services obtainable from each unit of each type of resource acquired.
As the main limit of growth, Penrose (1959: 43-64) suggests the firm’s managerial ability. The rate of growth and the effectiveness in the use of a large enterprise’s resources has been found to rest upon the ability and ingenuity of its administrators to build, adjust, and apply its personnel and facilities to broad population, technological, and income changes (Chandler, 1962). A firm cannot take advantage of all expansion opportunities, if managerial ability is limited. The nature of a firm as an administrative and planning organization requires that the existing responsible officials at least know and approve the plans and operations. The number of officials cannot be increased without time limits. It takes time for them to achieve requisite experience to run a firm. Chandler (1991) presented a slightly different view on this type growth limit by stating that technical and marketing expertise of top management also constrains growth.
As she herself admitted, Penrose did not present any empirical evidence on her theories except for illustrative cases. There was not sufficient systematic information available on firm growth at that time. Furthermore, the factors presented in the growth limit analysis could not, in their presented format, be tested against the external world variables.
Another weakness in Penrose’s theory, which Penrose herself admitted, was that she only analyzed growth in firms that are able to grow. She did not analyze why some firms grew and
40
some did not. This is a major shortcoming from this study’s perspective. As multiple studies during the late 1980s and 1990s have shown, the differences in growth rates between firms have been found to be immense (Storey et al., 1987; Storey, 1994b).
Other shortcomings in Penrose’s theory exist (Ollinger, 1994): (1) The focus of the analysis is upon large and multidivisional firms, and (2) it assumes that marketing, production, and research skills are imitable and can be transferred between business units in a multidivisional firm.
Penrose also expects managers to behave rationally and to always be motivated to use company resources as efficiently as possible. Already in the late 1950s existed research that doubted that assumption. Pre-World War II economists like Schumpeter had already noticed the effect of human feeling, human nature, and social recognition upon the economic behavior (Schumpeter, 1942). The Carnegie School further elaborated upon the view in the 1960s (e.g. Cyert & March, 1963). According to the Carnegie school, factors such as changing environments, conflicting informational clues, complexity of the decision-making process, and competing goals and expectations tax the cognitive limitations of strategic decision-makers. Strategic decisions are the result of behavioral factors rather than the result of techno-economic, rational optimization (Geletkanycz & Hambrick, 1997).
The theory neither gives an explanation as to why the differences in empirically detected growth rates of small companies are huge. The differences between individuals in their managerial or general intellectual capabilities have not been found to be so huge. For instance, a study of small firms in Northern England found that out of every 100 small firms, the fastest growing four firms would create half the jobs in the group over a decade (Storey et al. 1989). A study of small manufacturing firms between the years of 1973-1986 in Northern Ireland found that 3.8 percent of the initial firm population of new firms yielded 43 per cent of employment (NIERC, 1988). A study of new firms founded between the years 1979–1984 in Minnesota in the United States found that by 1986, 9 per cent of surviving firms provided in excess of 50 per cent of employment (Reynolds & Miller, 1988). In analyzing these studies as well as five other long-term employment studies, Storey (1994a) states that, in the long term, job creation among a small group of fast growing flyer firms substantially exceeded that of the failing and trundling firms (Storey, 1994b). Furthermore, Kirchhoff (1994) reported that 4 per cent of the highest growth firms formed in 1977-78 created 74 per cent of employment growth among the whole cohort of firms six years later.
41
2.3.2 Small firm growth models
Since Penrose, the studies on factors affecting growth have been numerous and concentrated in many different areas. Storey (1994b) divides the studied factors of new and small firm growth into three groups: the entrepreneur, the firm, and the strategy. As laid out by Sandberg and Hofer (1987), the dominant paradigm in the research of entrepreneurial firm growth has been to apply a three-level framework that differentiates between strategy, environment and firm-internal factors. This framework represented an important step forward from the traditional focus on the entrepreneur, her human capital, and her personality traits, and it has been echoed in growth studies ever since (Storey, 1994b). Of firm-internal factors, the human capital possessed by the firm has occupied a dominant share of research attention (e.g. Eisenhardt & Schoonhoven, 1990; Cooper et al., 1994; for an extensive discussion, see Storey, 1994b; and Wiklund, 1998).
Besides growth factor analysis, another strand of firm growth research has focused upon differentiating a firm’s growth stages. Already in 1957, Ansoff presented his stages of growth model and in 1969 Steinmetz published his seminal work on the subject. Since, an array of studies and theories on firm growth stages has been based upon the view that growth is the natural tendency of firms. It is suggested that like biological beings, firms grow through a number of predictable life-cycle changes. Some researchers talk of life-cycle stages, whilst others use terms such as growth stages or development stages (Hanks et al., 1993).
While there are differences in the number of stages proposed and the dimensions used to describe specific stages, most models of the organization life cycle suggest a fairly common pattern of organization growth, comprising stages of start-up, growth and maturity (Hanks & Chandler, 1994). Studies centering on high technology firms have tended to divide start-up into two distinct stages: the first centering on research and development (R&D) and prototype development activities, followed by an early commercialization stage. Thus, life cycle models centered on high-technology firms have suggested a four-stage growth typology, comprising conception and development, commercialization, growth, and maturity (Galbraith, 1982; Kazanjian, 1988; Dodge & Robbins, 1992).
It has been noticed for a while that empirical findings show that growth stage models have a questionable foundation (O’Farrell & Hitchens, 1988). Not all firms move through all growth stages. A significant proportion of small businesses cease to trade fairly early and never reach later stages (Storey, 1994b). Firms may achieve a particular stage that makes a survival strategy feasible and never have any intention of moving beyond that stage. While Churchill and Lewis (1983) developed their five stages of growth model, they studied 83 small companies and found that the grow-or-fail hypothesis implicit in most simple growth-stage models is invalid. Some of the enterprises had passed through the survival period and had reached a plateau—remaining essentially the same size, with some marginally profitable and others very profitable, over a period between 5 and 80 years. In their data, the percentage of such companies was 31 percent.
42
Hansen and Bird (1998) studied the sequence of first-hire and first-sale events in a sample of 18 high-tech firms. The sample differed in one important aspect from a number of previously used high-technology stage of growth model samples. The previous studies tended to draw their observations from the files of venture capitalists, but Hansen and Bird`s sample was drawn from a geographical region. Hansen and Bird found that entrepreneurs with prior business experience were much more likely to follow the stages model than entrepreneurs who had experience primarily as scientists, engineers, and other technology specialists. In general, the results supported the notion that the new venture founding process is stochastic and not based on natural stages.
If stages of life models are understood to describe general problem situations of a small firm at a certain point of time, and not as a strict development path, the empirical studies on characteristics of different stages produce rather coherent results (Dodge & Robbins, 1992). For instance the results of Dodge and Robbins’ (1992) study of 364 small businesses confirmed that the owner-manager has to contend with different problems in the various stages of the organization's life cycle which signal different operational contexts. They found statistically significant relationships between identified problems and life cycle stages. External environmental problems are more important early in the life cycle, while internal problems become more critical assumedly in the later stages of small business. However in the study, the company stage classification was based upon subjective case by case classifications and stage descriptions were problem situation based, rather than being based upon a specific age or development path in the venture.
43
2.4 Strategic choice, environment and resources
Managerial behavior alone does not completely explain all the potential sources of differences in the growth rate of companies. There are many other influential factors. This chapter briefly addresses the most important ones: strategic choices the company makes, resources and the business environment. The intention is not to develop new views but to illustrate the existing common views.
At a generic level the strategic choices can include (Rumelt et al., 1991):
• the selection of goals;
• the choice of products and services to offer: the design and configuration of policies determining how the firm positions itself to compete in product-markets;
• the design of organization structure, administrative systems and policies used to define and coordinate work; and
• the choice of an appropriate level of scope and diversity.
Of these strategic choices, this chapter handles the last three ones. A focus area of this study is the selection of goals. Theories handling management goal setting have been presented in the previous two chapters (2.1 and 2.2). The first part of this section (2.4.1) deals with theories concerning links between firm product-market environment and strategies: what external factors affect the best way to pursue growth. The second part of the section (2.4.2) deals with the constraints that organizational structure poses for growth. The third part of the section (2.4.3) deals with the appropriate levels of scope and diversity—i.e. strategic focus—a small firm producing software product can have if it seeks to achieve fast growth.
2.4.1 Environment and strategy
There are multiple schools in strategic management that emphasize that the fit between environmental demands and strategy has performance implications (Romanelli, 1989). The theories that analyze the fit include contingency (Child, 1972), related resource dependence theory (Pfeffer & Salancik 1978); institutional (DiMaggio & Powell, 1983; Meyer & Rowan, 1977) and population ecology (Hannan & Freeman, 1977) theories. Furthermore, the mainstream of strategic management and analysis practice is mainly interested in finding the best strategy to
44
make a company thrive in its current environment or to find more nourishing new environments. Different environments require different strategies to achieve high performance (Tushman & Romanelli, 1985). The strategic fit theories differ in their view regarding how much freedom a firm has in choosing different strategic orientations.
Contingency theorists maintain that managers have the freedom to choose between different strategic orientations under the same environmental contingencies (Child, 1972). Strategy may depend on, but is not completely determined by, environment. The destiny of the small firm is not completely determined by the characteristics of the environment or other factors outside the control of the small firm. Given a certain threshold level of performance, managers may choose to pursue various goals that are not necessarily economically rational. This view of small firm performance and growth has previously been labeled a strategic choice approach (Keats & Bracker, 1988). Practical disciplines of strategic planning (Ansoff, 1965) and of selecting competitive strategies (Porter, 1980; 1985) also assume that there are possibilities to choose between strategies, and even environments. These choices affect company success. Thus, of the three presented theories analyzing the fit between environment and strategy, their theoretical foundations fall closest to contingency theory.
In contingency theory, the concept of configuration has been used to analyze relationships between environment, structure, and strategy (e.g. Burns & Stalker, 1961; Miller, 1990). It is claimed that elements of structure, strategy, and environment are aligned with each other and appear in a limited number of configurations. Competitive business conditions in the marketplace force configurations to be optimal and firms must adjust their configurations to survive. Firms that do not will be selected out. Mismatches between strategy, structure and environment are expected to be rare.
Miller (1987) argues that there are four major principal imperatives (major root causal factors) that give rise to configurations: environment (including technology), structure, strategy; and executive personality. Researchers have proposed a number of causal directions between configuration actors. Some argue that a particular environment will influence the structure and strategy of the firm. Others start with the strategy of the firm, suggesting that the firm chooses the appropriate structure and environment based upon a strategy. For instance, in his original study on the relationship between strategy and structure Chandler (1962) points out how changes in strategy to exploit resources as efficiently as possible affect corporate structure, but in an introduction he wrote 25 years later, Chandler emphasizes that structure also affects strategy. It has even been claimed and even empirically proved that structure is not only the result of rational decision-making and adaptation to the environment, but also of fashion. New strategies are matched with these fashionable structures (Rumelt, 1974).
The school that views environment to be the cause of structure and strategy finds its strongest expression in the work of researchers who label their approach “population ecology” (Hannan &
45
Freeman, 1977). They believe that the basic structure and character of an organization is configured shortly after birth. Subsequent actions make it more rigid and less able to make decisions that are truly strategic. The freedom of choice or adaptation becomes rather limited.
The institutional theory (DiMaggio & Powell, 1983; Meyer & Rowan, 1977) is concerned with the institutional pressures an organization faces in its environment, from both other organizations and from the pressures of itself being an organization. The theory as presented by DiMaggio and Powell (1983) sees the environment as a repository of two resource types: economic and symbolic. Economic resources are the familiar: tangible money; land; and machinery. Symbolic resources include such things as: reputation for efficiency; leaders celebrated for past achievements; and the prestige that derives from a close connection to powerful and well-known firms. The way of acquiring economic resources and converting them into symbolic ones is what the concept strategy covers. The environment consists of interactions among key suppliers, consumers, government, and competitors. Over time, the interactions produce an increasingly complex and powerful set of norms that dominate practice. To be successful organizations must meet and master these norms. This drives organizations in the same environment over time to adopt similar structures and practices, the same configuration.
Neo-institutional theorists assert the importance of normative frameworks and rules in guiding, constraining, and empowering behavior. In particular, they regard firms as consisting of cognitive, normative, regulative structures and activities that give meaning to social behavior (Scott, 1995). Cultures, structures and routines operating at multiple levels of jurisdiction become carriers through which institutions impact firms (Scott, 1995). Organizational practices can become, in Selznicks’s words, “infused with value beyond the technical requirements at hand” (1957:17) and can be adopted for the sake of legitimacy rather than improved performance (DiMaggio & Powell, 1983).
The weakness of general contingency theory is that its constructs are often abstract, vague, and aggregated (Shenkar et al., 1995). Contingency research often tries to explain the similarities of organizations due to similar environments even though the basic idea of strategic research is to find how firms can distinguish themselves. The main construct that is supposed to explain the majority of differences is environmental uncertainty (Galbraith, 1977), but despite its centrality, no agreement exists on the conceptualization or operationalization of uncertainty and its distinctive dimensions (Pennings, 1975).
One of the problems of contingency theory is the large amount of empirical evidence that refutes its suggestions (Aldrich, 1999). This is basically a result of the vague definition of environmental variables. Pennings (1975), for example, found in his empirical study that organizational structures had little or no correlation with the observed environmental variables. In addition, there is very little longitudinal evidence to confirm that the transformation of
46
organizational structures and decision-making processes according to environmental demands leads to higher performance in the long run.
The problem with population ecology is that in its original form, it can not explain how two organizations can operate successfully in similar environments with very different strategies. It also neglects the opportunity of organizational change and adaptation (Barnett & Carroll, 1995). As a response to this critique, Freeman and Hannan re-framed their extremist view into a somewhat milder form by accepting the existence of different adaptive strategies between populations (Freeman & Hannan, 1983). Still, the firm level adaptation process has essentially remained a black box.
The dimensions relating to the managed motivation of management and the mental models to pursue strategic goals are either left out from contingency, population ecology, or institutional theory analysis or handled as separate from the environment. Usually contingency theorists characterize more narrowly environment by levels competition, change, munificence, and the legal, social, and physical infrastructure, but even contextual factors such as technology, age, and size, although not strictly outside the organization, are still contingencies with implications (Miller, 1990). The cognitive process regarding how management perceives environment is not explicitly handled, however the distinction between objective and perceived environment is handled, but only when subjective perceptions are used as proxies to measure the characteristics of the objective environment (see e.g Aldrich & Marsden, 1988).
One critique of all theories dealing with the fit between strategy, structure and environment is that neither the strategic choices nor the environmental determinists, nor those in between, question the pivotal notion of environments as being independent, external, and tangible entities (Smircich & Stubbart, 1985). The interpretive perspective treats environments as ecological contexts of thought and action which is not independent of the observer-actor’s theories, experiences and tastes. Smircich and Stubbart suggest that strategists` social knowledge constitutes their environment. The main interest is in knowing those social processes that produce the rules by which an “organization” is managed and judged.
As a synthesis from contingency theory, the view of Romanelli (1989) can be used. She accepted that start-up conditions and strategy might impact both the survivability of new, technology-based firms during their first years of development. Therefore strategy needs to be controlled when studying small firm growth. She explained that while the environment provides resources for growth and development, organizational strategies represent the firm’s ability to actually take advantage of the resources. Another important synthesis from the contingency theory is that the relationship between a firm’s managerial factors and strategic choices may not be one-dimensional. Strategy can also have an effect upon growth orientation. The critique from interpretive cognitive research upon theories describing relationships between environment, structure, and strategy supports the view that analysis focus should not be upon observing
47
environment. Rather it should be upon social processes and the factors that produce rules by which an organization is managed and judged (Smircich & Stubbart, 1985).
2.4.2 Resource constraints upon choice
Resource based perspective on strategy focus upon the internal strengths of a firm. The resource-based view sees industry structure as reflecting efficiency outcomes rather than market power (Rumelt et al., 1991). In this stream of industrial organization research, differences in performance tend to signal differences in resource endowments. It also emphasizes the importance of unique, difficult to imitate resources in sustaining performance. In this resource-based perspective, managers have to select an appropriate strategy in order to make the most effective use of the firm’s resource’s and capabilities (Grant, 1991). That is why it is seen as a potential tool in strategic management literature (Peteraf, 1993). The resource-based model suggests what additional characteristics, besides product and market positioning these resources require if they are to generate sustained competitive advantage (Barney, 1991).
Penrose’s (1959) study on the theory of the growth of the firm suggests that a firm’s direction and success lie in its internal resources. Penrose describes the firm in terms of the resources it integrates: “Thus, a firm is more than an administrative unit; it is also a collection of resources the disposal of which between different uses and over time is determined by administrative decision “ (Penrose 1959: 26). Also industry organization research, associated with the University of Chicago (e.g. Stigler, 1968), suggested that industry structure reflects efficiency outcomes rather than market power of the firm.
It was only in the late 1970s and 1980s that internal resources received wider attention (see, for example Wernerfelt, 1984). This perspective experienced increased popularity during the 1990s in strategic management literature (see, for example Barney, 1991). This may be due to the increasing importance of fast changing high-technology industries for industrialized economies. Because of the rapid pace of environmental change, firm-specific technological resources and capabilities provide a more durable basis for strategy formulation than do the firm’s position in the industry (Grant, 1991). This stream of literature includes many closely related approaches, such as evolutionary economics (Nelson & Winter, 1982), the dynamic capability and competence-based approaches (Foss, 1993), and knowledge-based approach (Foss, 1996).
The borderline between resource-based and related competence-based, and knowledge-based approaches is somewhat blurred. The resource-based view explains the existence, boundaries, and the success of the firm in terms of resource characteristics. The competence perspective deepens the understanding on the linkages between the resources and their relationship to
48
performance (Quélin, 1997). It focuses upon resources in use rather than resources per se (Lowendahl & Haanes, 1997). The knowledge-based approach understands the firm as a social community specializing in the speed and efficiency of knowledge creation and transfer (Kogut & Zander, 1996). In the knowledge-based view, factors that help firms to achieve growth or other objectives are not static or non-imitable, but can be learned many times. Thus the knowledge-based view, and to a lesser extent, the competence based view integrates learning effects to the static resource based view.
Hofer and Schendler (1978) suggested six major categories of resources: financial; technological; physical; human; reputation; and organizational. Barney has defined resources to be all the assets, capabilities, organizational processes, information, knowledge, etc. controlled by a firm that enable it to create and pursue effectively used strategies. He categorizes resources to be: physical capital; human capital; and organizational capital (Hofer & Schendel, 1978). Other researchers have used different categories for referring to basically the same resources (e.g. Grant, 1991). Often, the term resource is delimited to those phenomena that have some capacity to generate profits or to prevent losses (Miller & Shamsie, 1996).
A general availability of resources will neutralize their advantage to the firm (Barney, 1991). Hence, in order for a firm to gain high levels of performance and sustained competitive advantage, it needs to possess resources that are heterogeneous across firms and difficult to create, substitute or imitate. In the resource based perspective, the environment provides few restrictions on the growth of the firm. Increasing costs for resources and declining revenues for individual products may limit the expansion for those particular resources and products.
Perhaps the most fundamental criticism against resource-based theory is posited against the definitions of the resource concept itself (Priem & Butler, 1991). The definition of resources easily becomes tautological and circular. This is the case if resources are considered to encompass anything and everything that contributes to a firm’s sustainable performance.
Another important criticism is that if the resource-based view is used as the sole analysis tool, it says practically nothing about the firm’s environment. As McGrath (1996) points out: “While a major strength of the resource-based view is its clear focus on the firm level of analysis, this creates a corresponding neglect of context. Competitive outcomes are obviously shaped by many forces, most beyond the boundaries of a given firm. Future theory building would benefit from more comprehensively linking external with internal phenomena”. The resource-based perspective alone is probably not sufficient to explain the performance and growth of small firms. The competitive value of resources can be enhanced or eliminated by changes in technology, competitor behavior, or buyer needs which an inwardly focused view upon resources will overlook (Porter, 1991).
49
The resource based view has also been criticized for concentrating only upon an idealized and narrow sample of factors that are relevant to a firm’s development. As Montgomery (1995) states, the resource-based view has a penchant for the positive. The name for this stream of work has come to tell a great deal about its emphasis. It focuses upon a firm’s positive assets and attributes. Most of the attention in this line of inquiry has gone to an analysis of the “best of the best”, the so-called “crown jewels” of a company. In order to enhance the applicability of the resource-based view, a wider perspective on resources should be applied acknowledging the full spectrum of resources: the good, the bad, and the boring.
The philosophical cornerstones of the resource-based view have also been criticized. Creating a normative recipe for combining resources in order to yield a sustained competitive advantage may be logically impossible. The development of the best resource combinations is often unique and path-dependent (Conner, 1991).
The analysis regarding the resource-based view shows that it is difficult to define the exact resources that may always have a clear impact upon growth or management attitudes. But if a wider, knowledge-based view approach is taken, there may be a general influence upon learning and experience. Or experience, cognitions, and possibly even goals could be regarded as resources and thus the analysis in this book falls also in the area of resource-based view.
2.4.2.1 Social capital as a resource
One of the resources a company can possess is the social capital of its managers. The core intuition guiding social capital research has been that social capital is the goodwill, i.e. the sympathy, trust, and forgiveness offered us by our friends and acquaintances (Dore, 1983).
Social scientists have offered a number of definitions of social capital. An example of those is “the web of social relationships that influences individual behavior and thereby affects economic growth” (Pennar, 1997: 154). These definitions are broadly similar, but differences exist depending upon whether they focus on the substance, the sources, or the effects of social capital (Robinson et al., 2002). A focus upon external relations supports what has been called “bridging” forms of social capital; whereas a focus upon internal ties within collectivities supports “bonding” forms of social capital (Adler & Kwan, 2002). The bridging view focuses primarily on social capital as a resource that exists in the social network joining a focal actor to other actors. In contrast, bonding views focus upon collective actors’ internal characteristics. According to these views, the social capital of a collectivity (organization, community, nation, and so forth) is not so much in that collectivity’s external ties to other external actors as it is to its internal structure. The linkages among individuals or groups within the collectivity and, specifically, those features that give the collectivity cohesiveness and thereby facilitate the pursuit of collective goals are the main type of social capital in bonding views.
50
Social capital’s sources lie—as do other resources’—in the social structure within which the actor is located. Indeed, we can differentiate social capital from other types of resources by the specific dimension of social structure underlying it. Social capital is the resource available to actors as a function of their location in the structure of their social relations (Adler and Kwan, 2002). They propose that relations create capital (or effect actions) in three different ways. (1) An actor’s network of social ties creates opportunities for social capital transactions. External ties to others give actors the opportunity to leverage their contacts’ resources. For collective actors, internal ties create the opportunity to act together. (2) Motivation for donors is the second type of connection. Traditionally this has been referred to in business related social research as instrumental motivation. Actors are seen as cultivating and exploiting social capital to advance their career (Lin et al., 1981) and to reduce transaction costs (Baker, 1990). Lately the fact is that social capital is sometimes motivated by normative commitments of a less directly instrumental nature, such as norms, or generalized reciprocity (Portes, 1998). (3) Ability—the competencies and resources at the nodes of the network. If social capital is the resource provided by an actor’s network, its magnitude depends upon the resources made available to the actor by the other nodes of this network (Lin, 1999).
Liao and Welsch (2003) have empirically studied the relationship between growth aspiration and social capital. Their results from structural equation modeling suggest that technology-based entrepreneurs benefit more from relational embeddedness; the freer and greater exchange of non-redundant information. Non-technology-based entrepreneurs benefit more from structural embeddedness—the extensiveness of social networks. Each dimension of social capital reinforces the creation of the other dimensions in technology-based new ventures, which in turn, contributes to entrepreneurial growth aspiration.
If goodwill is the substance of social capital, its effects flow from the information, influence, and solidarity such goodwill makes available (Adler & Kwan, 2002). As presented though in section 2.1, the flow is not one dimensional; the same flows also guide the sense making process of management. Thus studying the effects of social capital on company behavior is related to studying how social ties guide birth of management mental models. The empirical results that can be understood resulting from goodwill effect of social capital can many times, as well, be result of correct mental models flowing to management.
2.4.3 Appropriate levels of scope and diversity
The analysis of appropriate levels of scope and diversity is limited in this report to the situation under study—what is their effect on growth. State in other words in this context, the question is that in order to maximize growth, should the company diversify to other businesses; or not. The
51
implications of resource-based view and environmental view are different in guiding which strategies a company should have when it pursues growth. The pure environmental view studying potential of different markets leads usually to think that expanding to other markets or products offers possibilities to growth. To understand the implications of resource-based view demands making a different of two different concepts describing level of diversity: concentration and segmentation (Porter, 1985; Pearce & Harvey, 1990).
Concentration and segmentation are many times bundled together in a strategic analysis, even though in many industries and situations there is no need to make a distinction between concentration and segmentation. For instance, Porter (1985) defines generic focus strategies as: “the choice of a narrow competitive scope within an industry. The focuser selects a segment or group of segments in the industry and tailors its strategy to serving them to the exclusion of others.” This definition includes both concentration and segmentation aspects.
While studying small firms that operate in large global markets where even narrow segments are large and demand big resources, the need for a researcher to make a distinction between concentration and segmentation increases. This is the situation in this study, so the terms have clearly different meanings:
• Concentration refers to the degree to which a company has focused on operating only in one business and excluded all the other business areas outside its operations. The higher degree of strategy concentration is considered, the fewer business areas the company has. This definition is in line with, for instance, the definition by Pearce and Harvey (1990).
• Segmentation refers to the narrowness and depth of the business area in which the company is operating. The degree of segmentation of the strategy is considered higher the more levels of possible choices are excluded from the total industry by definition of the segment. This definition is further developed from Porter’s (1985) focus strategy.
According to these definitions, a company can have a low concentration, but a high segmentation strategy: i.e., if it is operating in many narrow not-well interrelated segments. Another company can have a high concentration, but a low segmentation strategy: In this case, it is operating only in one segment, but the segments represent a wide area of industry.
The first potential strategic choice leading to growth is a concentration upon area resources that lead to growth. According to Penrose (1959), the managerial resource is the factor limiting growth. Companies must use a lot of their managerial resource on learning how to run each of the businesses in which they are involved. Small companies that have many separate businesses are prone to find it difficult to operate successfully in each of them.
52
The resource-based view gives a clear implication to the relationship between concentration strategy and growth. If a company has limited managerial resources, it can most effectively exploit them by concentrating them in one business. The limited managerial resources of small and medium sized companies are not consumed by the need to manage different kinds of businesses that have lower growth rates than a fast growth business. “Superior combat power must be concentrated at the critical time and place for a decisive purpose” (Summers, 1981). The strategy that can be considered as leading to growth should have at least one property: concentration.
Besides the fact that management resources are a growth-limiting factor, there are other reasons why multi-business firms have more difficulty in growing. Central to the management process is group knowledge structure by which a common frame of interpretation becomes domination (Barr et al., 1992). Emergent frames are constructed in when a need emerges to deal with a novel problem or issue. This takes time and cognitive energy, but once established, there is a strong incentive to keep using it. It may then be used automatically when interpreting strategic information; whether it is appropriate or not. Before a new one can be constructed the top management team will have to unlearn a frame. If the team learns the management frames from other businesses, it is dubious whether they will be best management practices in the software product business (Corner et al., 1994).
In new product development research, as well in large firm strategy research, there is ample evidence that concentration upon a one product-market or business strategy leads to successful growth. After examining 195 case histories, Calantone and Cooper (1981) found that the type of new product introduction which had the highest level of market success (72%) was described as a synergistic “close-to-home” product. These successful introductions had significant overlap with the firm’s existing products, markets, technical expertise, and production proficiency. An analysis of the 250 largest firms, from America’s 25 largest industries, revealed that firms that have higher measures of concentrated growth show greater financial performance (Varadarajan, 1986).
There is also literature that presents the wide product range as a strategy for high growth (McDougall et al., 1994; Murray & O’Gorman, 1994). The wider the product range, the higher the probability that the firm has growth products. Also, research on experience curves proposes that cumulative experience, at least in production, could be a primary driver of unit costs, not scale in one business per se (Boston Consulting Group, 1970). So if a firm can exploit the experience or knowledge achieved in different businesses in some other businesses, then non-concentrated strategies might be more efficient.
If the distinction is made between concentration and segmentation strategies, the direction in the relationship between strength of segmentation strategy, and growth in a fast growing industry, is rather clear. The more focused a company is upon one segment of a business, the less resources
53
it dedicates to pursue growth outside its niche. If the relationship is controlled for segment growth, the highly segmented strategy leads to lower growth. Only in the situations where the target segment grows faster than any or the neighbouring segments, segmentation leads to fast growth.
54
2.5 Regional culture
One of the goals of this study was to determine how effects of regional culture differences affect the behavior of companies.
The relationship between geographical regions and economic and other organizational behavior has traditionally been researched by regional science (Isard, 1956; 1960) and economic geography (Dunning, 1988; Scott, 1988). For regional scientists, a region is in most instances a geographical area smaller than the nation in which it is located. A region might be a city, a county, a group of counties or a state. One of the research areas of both regional science and economic geography is industrial and regional clusters (Porter, 1990; 1998). Industry clusters refer to the tight connections that bind certain firms and industries together in various aspects of common behavior, e.g., geographic location, sources of innovation, shared suppliers and factors of production, and so forth (Enright, 1996).
Besides cultural effects, regional science sees agglomeration and social capital as sources of industrial clusters. The research of social capital was handled in Chapter 2.4 in this paper. The concept of agglomeration dates back already to 19th century and discussions of “external economies of scale” (e.g. Marshall, 1890; Hoover, 1948). External economy has gained popularity during last two decades thanks to acquired ability to model it precisely which owes much to the insight of Fujita (1988) who demonstrated how the monopolistic competition model of Chamberlin (1933) could be adapted to generate spatial agglomeration of economic activities. These models made it clear that standard market processes based on price interaction alone could generate increasing returns, the “external economies” of agglomeration (Johansson & Quigley, 2003). The economic advantages of proximity are today quite explicit.
There are at least three basic cases how agglomeration works to be distinguished (Johansson & Quigley, 2003). (1) An entire industry may benefit from agglomeration, since the size of the agglomeration provides sufficient demand to allow individual firms with internal scale economies to develop differentiated products. (2) An individual firm may benefit from the option to buy more specialized inputs at lower transactions costs from differentiated input suppliers within the region. (3) An individual firm may benefit from information spillovers outside the market that arise from proximity within an agglomeration. The role of regional agglomeration falls outside the focus area of this study and thus this analysis will not handle it further, but will concentrate on regional culture.
Culture is usually defined as the shared meaning that a group of people create over time (Keesing, 1974). The sharing of meaning can be achieved by purely social activities, such as
55
talking, celebrating, and even grieving. Shared meaning is also created between those who work together on common tasks: Meaningful interaction takes place between them and the resources they employ. Tangible resources such as machines and buildings, as well as intangible resources, such as scientific know-how and budgetary systems interact with members of a group to produce what anthropologists call material culture. This emerges when human-made objects reflect, consciously or unconsciously, directly or indirectly, the beliefs of the individuals who commissioned, fabricated, purchased, or used them and, by extension, the beliefs of the larger society to which these individuals belong (Prown, 1993).
Culture also relates to some other areas of research presented in this literature review. (1) The resource-based view of a firm relates to material culture (Barney, 1986). The definition of material culture leads to the idea that it is not products that compete in the marketplace, but the systems of producing them. This supports the resource-based view. Culture also fulfils the main criteria set by strategic resources. It is loaded with causal ambiguity which makes it difficult to understand and imitate. (2) Cultures differ in their system of values (Inkeles & Levinson, 1969, Erez & Earley, 1993), thus relating cultures to different theories on motivation. (3) Culture is a result of cognition (Jonson, 1992). It is essentially composed of interpretations of a world and the activities and artifacts reflecting these. Culture includes shared beliefs. Beliefs are reflected in values, traditions and habits as well as more tangible manifestations such as stories, symbols, architecture and products. Different priorities for what stimuli deserve attention (selective attention), and the meaning we attach to these perceptions (encoding), are formed by gradual internalization of prevailing cultural patterns (Markus & Kitayama, 1991; Miller et al., 1990). Research indicates that social cognitions such as perceptions of events and attributions made about their causes (Ting-Toomey, 1988) both vary across cultures. The effects of culture on labeling and attributions of also strategic issues have been empirically shown (Barr & Glynn, 2004)
There exist different levels of culture; in society, industry, and organization. For instance, the organizational culture can be described as an expressive social tissue that binds the bones of organizational structure to the muscles of organizational processes (Pettigrew, 1985). The different levels of culture interact, every which way. National cultures influence the way the environment is interpreted, creating different strategic responses by the same company in different countries (Roth & Ricks, 1994). For instance, Rieger (1987) has demonstrated the impact of national cultures on the structures and decision-making styles of various national airline carriers.
Mitchell et al. (2000) studied the moderating effect of national cultural values of social cognitive constructs on new venture creation decisions. They found that cultural constructs power distance and individualism moderate the effect of arrangement and ability cognition upon new venture creation decisions. Mitchell et al. (2002a) examined further three research questions concerned with entrepreneurial cognition and culture: (1) Do entrepreneurs have cognitions distinct from
56
those of other business people? (2) To what extent are entrepreneurial cognitions universal? (3) To what extent do entrepreneurial cognitions differ by national culture? In answer to question one, it was found that individuals who possess professional entrepreneurial cognitions do indeed have cognitions that are distinct from business non-entrepreneurs. In answer to the second question, further confirmation of a universal culture of entrepreneurship was reported. And in answer to the third question, observed differences were found on 8 of the 10 proposed cognition constructs. The pattern of country representation within an empirically developed set of entrepreneurial archetypes does indeed differ among countries. These results suggest increasing credibility for the cognitive explanation of entrepreneurial phenomena in a cross-cultural setting.
One emerging field of cultural research is the studies on regional culture in which companies are embedded. The interest is driven by political objectives (Kevin, 2000). The literature on regional culture emphasizes the effect of these differences on the operations of high technology companies. Regional culture is claimed to have an effect on the way managers operate and think. It may be so that the set of entrepreneurial archetypes differ not only among countries but between different cultural regions within one country.
The effects of shared meanings, as one source of location related differences in behavior, have been implied in a couple of studies. Greve (1996) found, in a longitudinal study of new format adoptions by U.S. radio stations, support for the argument that innovations in market positions are mimetically adopted so that new market positions diffuse in the industry. He showed that stations entering a new format cause mimetic entry by stations that can easily observe their actions because they are spatially or socially proximate to them. The recently innovated market positions are mimetically adopted by organizations that can easily observe previous adoptions and see them as relevant to their market situations, increasing the market differentiation (Greve, 1998). Oettingen (1995) has empirically found that the differences in educational practices can lead to differences in self-efficacy of less intelligent students between different nations and cultures leading to different performance. If verbal persuasion reduces the self-efficacy of less capable students, they tend to perform more poorly than do their counterparts in cultures where there is less in the educational system.
A great deal of research upon regional effects has been concentrated in the Silicon Valley region in order to identify the reasons for its almost uninterrupted growth. One of the suggestions has been regional culture. An empirical study of the creation and the survival of semiconductor firms established in the USA from 1978 to 1986 led Schoonhoven and Eisenhardt (1989) to conclude that Silicon Valley is an “incubator region” consisting of institutions that nurture the growth of small start-up firms. They attributed the higher survival rate of semiconductor start-ups in Silicon Valley to this incubator effect. Studying venture capital in Silicon Valley and in the Route 128 region of Massachusetts, Florida and Kenney (1988) found what they termed a “social structure of innovation”, an interactive set of institutions dedicated to encouraging technological innovation crystallized by the creation of firms. Saxenian (1994) draws upon
57
cultural reasons, but even goes further. She considers the reasons why a faster recovery in Silicon Valley compared to the Route 128 region after the downturn in the mid-1980s was successful. She argues that because the firms in the region abandoned the inflexible vertical and hierarchical organization models, they returned to their roots as flexible organizations and utilized the flexible networks of other specialized enterprises and professionals.
There is a theoretical and empirical foundation for claiming that regional cultures affect firm and management behavior, but studies have also received criticism. Technological trajectories and their path dependencies have received little attention in these studies. For instance, Kenney and von Burg (1999) have argued that the different characteristics and development paths of the most important technologies in Silicon Valley and Route 128, semiconductors and minicomputers, can explain much of the different development paths experienced by the two regions.
The effect of location on firm success has been evidenced in many empirical studies. The success of strategy and structural interactions may vary from one region to another. Keeley et al. (1990) made such findings in a three-region study of the US, Europe, and Japan featuring 127 venture-capitalist-backed start-ups mainly from the computer, biotech, software, and electronics industries. Stearns et al. (1995) also showed that industry structure, strategy, and firm location can jointly predict firm survival, though these factors do not necessarily have any significant predictive power alone. Baum (1995) argued that it is the local industry structure that mediates the relationship between firm strategy and performance.
In their study of 93 Massachusetts and 77 Irish software firms, Cooney and O’Driscoll (1999) found that initial, smaller difference in strategy making and structure between firm populations in two countries increased as firms matured. They saw economic and cultural differences as the reason for the development.
Basic economic facts can also affect the regional development more than culture. For instance the size of the regional local markets is an important consideration. Davidsson et al. (1996) studied differences in the net growth of firm population firms per inhabitant between the ages of 16-64 years. They found that during 1989-1994 the differences among 83 Swedish regions were most strongly related to the total population of the region, the density of population and the percentage of employees employed by small and medium sized enterprises. These factors need to be controlled when studying the effects of regional culture.
58
2.6 Research on the software products industry
Our intention is to study such growth enhancers that are not related to efficient resource utilization. To do so, software companies are a fruitful area of research. In the software industry, there is a very limited need for any kind of specialized production machinery which if used inefficiently would inhibit a firm’s production (Autere et al., 1999). Even product development resources are often regarded as flexibly transferable to different uses. A better understanding of the different drivers in the software industry is also useful for other purposes than understanding management mental models (Hoch et al., 1999). Software is becoming one of the key enablers of other industries. Other industries are also becoming increasingly knowledge driven and thus more similar to the software product industry regarding their management problems (Autere et al., 1999). Thus, phenomena detected in the software industry may also become familiar in other industries in the future.
Banerjee (2003) suggests that the explored views regarding core capabilities, or even regarding dynamic core capabilities, do not appear to offer plausible dimensions for firm competencies for companies operating in many fields of information and communication technology (ICT). In contrast to large firms belonging to older sectors, ICT and especially software firms would require more intensive concentration to dynamic core competencies. They are fraught with even higher degrees of potential competition, rapid changes and the shortest of product life cycles (Banerjee, 2003). He states examples of peculiarities of the software industry like: absence of volume production; greater degree of closeness between products offered and the projects/services offered; very high level of personnel turnover; little sunk capital; and a greater requirement of cash flow. “Strategies adopted by firms in old sectors thus appear inapplicable to software firms” (Banerjee, 2003). A small software firm cannot neither reallocate resources in order to increase its core competency (Autere et al., 1999), nor enhance dynamic technological competency through knowledge management as easily as would be done by an established large manufacturing firm. It is rational to consider competition in this new sector as a process (Foss & Foss, 2000) and therefore it would be appropriate to reckon indicators of competence as process indicators.
In their study of 100 software companies from around the world, Hoch et al. (1999) found that the critical success factors did not vary much across different regions, economic environments and cultures. The factors differed quite substantially across three industry segments: professional services; enterprise solutions; and mass-market products. The nature of these three sub-segments is presented in Table 2-1.
59
h
Figure 2-4, Degree of productization and unit volume in three market segments of the software
industry (Hoch et al., 1999)
Product business 10,000,000
1,000,000
100,000
10,000
1,000
100
10
1
Sales Units
Packaged mass-market
software
Enterprise solutions
Degree of
Productization
Professional services
Low Medium High
60
Professional
software services
Enterprise
solutions
Packaged mass-
market software
Revenues 1997 of ten largest companies globally
$26,630M $27,540M $18,930M
Worldwide revenues 1997 $115M $61M $57M
Annual growth 1993-1997 20% 18% 10%
Table 2-1, Worldwide revenues and growth in three software industry segments (Hoch et al.,
1999)
Software provision is a very capital efficient business. Therefore venture capitalists like to invest in software companies. An average software company requires only $3M to start up according to Hummer Winblad Venture Partners portfolio (Ubois, 1998). Therefore economic resources do not limit growth and strategic choices as in many other industries. Even for start-up companies with very limited tangible assets it is possible to raise the sufficient amount of capital to succeed. The dominance of small enterprises within the software industry has been legendary in academic literature (Merges, 1996). This may be based upon the capital efficiency and high dynamism of the industry.
The importance of innovation, vision and motivation over material resources is evident in software company research. The software industry is one of the most research and development intensive of industries. In their study of the 500 largest global companies, Bowonder et al. (2000) found the software industry to be the second most R&D intensive industry of all studied only after biotechnology. R&D expenditure was 12.06 percent of the turnover of the largest companies in the industry. In their survey, Hoch et al. (1999) found an extremely strong correlation between a high aspiration level and company success; measured as sales growth and return on sales. Of the successful companies, 93 had a clear and ambitious vision, whereas only 25 percent of the less successful companies had the same aspiration level. It appears that a large share of the company’s business can be created by innovation and management and is not so dependent upon existing tangible resources.
In the late 1990s, there was, in Finland, a widely shared view as to what would be best strategy to achieve fast growth in this business. Concentrating upon software products was considered the strategy which would lead to the fastest growth (Autere et al., 1999). Along the same lines, Banerjee (2003) found, in his study of 27 software company managers, that managers accord the
61
highest importance to increased earnings from their own products. It seems that most firms in the software business wish to enter the product arena even though all the competencies of these firms are more suited to project work. There was a shared belief amongst the business leaders that strategies focused upon product based businesses were the ones that should lead to fast growth.
In reality, the growth during 1998-2000 in information services and software industry was not fastest in software products, but professional services grew even faster as can be seen from Table 2-2. Thus, the strategy that was generally supposed to lead faster growth in 1998, did not produce better results than strategy based on selling project work and other services.
Year Global software and services Global Software
$ Millions Y toY growth $ Millions Y toY growth
1998 $ 452.870 15.7% $ 59.485 10.5%
1999 $ 526.298 16.2% $ 68.438 15.1%
2000 $ 620.749 17.9% $ 80.068 17.0%
2001 $ 735.057 18.4% $ 88.715 10.8%
Table 2-2, Worldwide revenues and growth in software and IT services (Datamonitor, 2003a;
Datamonitor, 2003b)
62
3 Models and hypotheses
The literature analysis presented in the previous Chapter 2 is a basis for the building of a theoretical model of relationships between concepts identified in the literature. The relationships presented in the theoretical model are further analyzed and become a set of hypotheses. The hypotheses presented are meant to answer the original research questions. Based on the hypotheses, an integrative, two-part model of the relationships between constructs is presented for use in empirical testing.
3.1 Model building
The stages in the process of defining theoretical model are the following: first, concepts related to growth orientation taken from the literature analysis are presented. The model is then simplified in hypotheses development by omitting concepts located between growth orientation and the concepts focused upon this study. These intermittent concepts illustrate either the nature of the relationships or the logic of how the relationship is born and are used to help recognize potential sources of growth orientation. After simplification, the remaining assumed relationships between concepts in refined form are the hypotheses in generic form.
3.1.1 Growth of firm research
Our model building starts from empirical firm growth studies. They show that there are differences in the growth rates of firms that can not be explained solely by the managerial resources or other available resources (Geroski, 2000). This is contrary to what Penrose (1959) suggested. Penrose`s basic proposal, that inefficiencies in the use of resources is the driver for growth, is valid, but it alone is not sufficient to explain how small firms grow (Rugman & Verbeke, 2002). Possible explanations regarding these differences might be other firm internal factors including the capabilities and motivation of management, either entrepreneurial or professional, the strategy chosen, and environmental effects (Sandberg & Hofer, 1987). Thus literature suggests that both strategic choices and managerial execution behavior can have effects on growth. Even though the focus is upon sources of growth differences, one must also observe the Carnegie school research that suggests that managerial behavior affect not only the growth of the firm, but also the strategies of the firm (Cyert & March, 1963). Empirical studies have also
63
found that managerial capabilities and motives have a clear impact on how well a company proceeds in pursuing growth opportunities (Kor, 2003) .
The studies exploring the differences between company growth rates and stages have not discovered any specific industry or resource which differentiates between fast and slow growing companies. It has even been claimed, based on empirical data, that industry has no impact on growth (Rumelt, 1991). If industry specific resources do not affect differences in growth rates, the question emerges whether Penrose’s view of a resource’s importance as the rational driver for growth is a sufficient explanation for all the phenomena related to firm growth. The empirical result Hansen and Bird (1998) achieved, that experienced business managers more often follow stage models demonstrates the importance of management’s sense making processes in decision making related to firm growth. Maybe managerial motivation and capability are needed to explain differences in growth.
From empirical studies emerges a view that differences in growth rates of firms can not be explained solely by managerial resources or by other resources available, as suggested by Penrose. Other possible explanations include: capabilities and motivation of management, the strategy chosen and environmental effects (Sandberg & Hofer, 1987). Thus literature analysis suggests that both strategic choices and managerial execution behavior can have an effect on growth. Research from the Carnegie school further suggests that managerial behavior affects not only the growth of the firm, but also the strategies of the firm (Cyert & March, 1963).
As the direct effect of resources on growth were not the focus of this study, the more interesting potential relationships are between managerial behavior and other factors. Managerial behavior affects firm growth based upon three main factors: firm-internal factors, strategy, and environment. In addition, a fourth area needs to be analyzed in this context. The fourth construct “firm internals without management behavior” can be included in resources.
The relationships suggested by analyzing from empirical studies are presented in Figure 3-1. The figure that presents the high level relationships between growth, environment, strategy and managerial behavior is the starting point for the building of a theoretical model. Because the effect of resources upon growth has been studied thoroughly earlier, they do not relate to the main questions of this study. The concept of resources is left out of the model already at this stage.
64
Strategy
Managerialbehavior
Environ-ment
Growth
Figure 3-1, Potential relationships between growth, strategic choices and managerial behavior
(adapted to the research context from Miller, 1987)
3.1.2 Synthesis of the motivational theories
The four motivational theories presented in section 2.2 are the starting point in refining the model. The following theories can help in understanding how management behavior is born: expectancy theory; goal setting theory; and social learning theory.
Despite a critique on expectancy and goal setting theories, the existence of a relationship between motivation and performance has been undisputed. There is ample empirical evidence of the link between motivation and growth (i.e., Bellu & Sherman, 1995; Kolvereid & Bullvåg, 1996; Miner, Smith, & Bracker, 1994; Mok & van den Tillaart, 1990). Studies that have analyzed the link between motivation and small firm growth and performance have found that motivation may be an important explanation (Kolvereid & Bullvåg, 1996). Still the relationship expressed by the studies has generally not been very strong. For instance, it has been found that motivational processing influences task effort (Kanfer & Ackerman, 1989, p. 687).
Even though the interaction between expectancy and valency in affecting motivation is under dispute, both have been found to have an effect on the strength of motivation for pursuing goals. The basic notion that many behaviors can be thought of as intentionally rational or goal directed is suspected to be valid (Vroom, 1995: xix), especially as presented by planned behavior theory.
Goal setting theory, as presented in Chapter 2.2, suggests how goals affect performance via the search for appropriate performance strategies. Goal commitment is necessary for tasks to affect performance. Motivation does not affect performance unless action is taken.
Self-efficacy concept helps us to understand the sources of expectancy and instrumentality on the different tasks that managers have. Mastery experiences that include previous managerial success as well as personal work experience can affect the view of what can be achieved in the
65
current situation of the firm (Bandura, 1997). If a manager has previous experience of achieving growth, he will have more confidence in being able to achieve growth.
When the general growth model presented is refined further, a new concept is needed to accommodate the part of entrepreneurial management behavior in which we are interested: growth orientation. In this study, the concept of growth orientation refers to growth motivation and commitment by the firm’s manager. In the model, presented in Figure 2-3, growth orientation falls either within the area of values or within the area of expectations and self-efficacy. Another part of managerial behavior is execution capability.
The links between the growth orientation (value or expectation) and growth (outcome) of a company can be direct as proposed by the original social cognitive theory, or can affect goal setting as proposed by goal setting theory. Management takes longer term goals to achieve its values or expectations and these are often strategic. Therefore, management’s orientation works through making strategic choices (Boone et al., 1996). Strategic choice can act as a mediating variable between growth orientation and growth. The further refined concepts and their relationships are presented in Figure the 3-2. In this figure, the concepts practical goals, strategic choices and growth orientation represent the dimensions of managerial behavior and strategy.
Strategicchoices
Growthorientation
Practicalgoals Growth
Figure 3-2, Relationship between Growth Orientation and Growth
Wiklund and Shepherd (2003: 1920) suggest that while empirical studies on motivation’s effects on growth make significant contributions in this important area, they share limitations. They present as the first limitation that the studies rely on bi-variate analyses and do not consider the possible direct or moderating influence of other variables. Thus, there is a need to further complement the model with such factors that may moderate motivational effects, or co-exist with high growth orientation; leading to a real effect upon high growth, instead of upon motivation. Part of this analysis can be based upon motivational theories and is discussed next.
The next modeling question regards the way attitudes, social norms, and self-efficacy affect goals and performance. The exact way values and expectancies interact with motivation to pursue potential goals is here under discussion. As Chapters 2.1 and 2.2 present, the link
66
between attitudes, social norms and self-efficacy to motivation is undisputed. It is then reasonable to expect that attitudes towards growth, social pressure towards growth, as well and the perceived difficulty to grow (effort-to-growth expectancy) have an effect upon growth orientation.
The assumption that effort-growth expectancy is related to growth motivation is supported further by social cognitive theory. If a person’s self-efficacy regarding a specific work-task is high, this person is more likely to perform the task. If a person has high self-efficacy that he or she can achieve high growth, the person is likely to have high growth orientation and select a high-growth strategy. Besides seeing goal-oriented motivation as an intermediating factor, social learning and planning theories imply also that there might be a more direct link between effort growth expectancy and growth. A manager having high self-efficacy is more likely to perform the task of achieving growth and also is likely to perform it well. Therefore, effort-growth expectancy may have a direct effect upon pursuing growth-oriented strategy and upon moderating the effect of success in pursuing growth-oriented strategy. The presumed relationships are presented in Figure 3-3.
Strategic choices
Growth orientation (behavior intention)
Practical goals Growth
Attitude towrds growth
Self-efficacy on
growth
Social norm on growth
Figure 3-3, Synthesis on expectancy, planned behavior and social learning theory based views
on strategic choice
The social cognitive theory’s view of possible sources provides ideas about what can affect expectancies. Mastery experiences gained from previous successes or failures while pursuing growth can affect effort-growth expectancy.
Referent persons with whom that the manager has social contact, or with whom he considers as coming from a similar environment, may also affect social norms. If growth orientation is detected in the social environment, the detector might consider them to be a part of normal behavior. There may also be linkages that transmit growth oriented social norms to the manager. This indicates that there might be a difference between in effect of two types of referents which
67
a manager has: those that are not socially linked thus being affected only through feelings of inequality; and those that are socially linked being affected, not only through inequality, but also through social norms and pressures. The two different referent types, and their route of effect, are inserted into the growth orientation model as presented in Figure 3-4.
Strategic choices
Growth orientation
Practical goals
Growth
Perceived social growth
pressure
Self-efficacy on
growth
Previous growth
experience
Growth attitudes
Socially linked
referents
Other referents
Figure 3-4, Expectancy, planned behavior, and social learning theory based growth model
Besides motivation, the ability of a manager to execute is also likely to affect growth. Theories dealing with behavior under limited volitional control model behavioral outcome as a joint function of motivation and individual ability (Ajzen, 1991). Both the capability of managers to achieve growth as well as the sources of their motivational status cannot be understood without analyzing the sense-making process of the manager. The next section (3.1.3) will concentrate on the cognitive theories that can explain managerial and entrepreneurial sense-making processes.
3.1.3 Synthesis of cognitive theories
From the study model’s perspective, the inputs suggested by general positivistic cognitive research relate to successful goal pursuing. Cognitive ability achieved during a manager’s previous experience can have a moderating effect on how efficiently the manager achieves chosen goals.
Entrepreneurial cognition analysis also gives more detailed insight on one of the relationships identified from individual motivation. If entrepreneurs are more likely than other people to experience regret over missed opportunities (Baron, 1998), then this previous experience would increase their willingness to act upon perceived opportunities; to be more willing to search for growth goals, independent of whether the experience has originated from a growth company or from a non-growing company. Because of this self-serving bias, lost opportunities from previous experience are considered to result from external causes whereas successes are considered to
68
result from one’s own capabilities (Baron, 1998). Thus, for entrepreneurial people, previous experience increases self-efficacy towards growth, and through it, growth orientation. Entrepreneurial learning analysis raises the same point. It is also suggested that it is not only entrepreneurial experience that carries the learning effect, but that the whole organization can “meta-learn” from previous experiences.
The complete growth model with the two new potential relationships identified by positivistic cognitive research is shown in Figure 3-5.
Strategic choices
Growth orientation
Practical goals
Growth
Positivisticcognitive research
Perceived social growth
pressure
Self-efficacy on
growth
Previous growth
experience
Growth attitudes
Socially linked
referents
Other referents
Previous experience
Entrepreneurialcgnition
Figure 3-5, Motivation theories based growth model complemented by positivist cognitive
research
To the model under development in this study, the constructionist view adds value through two routes. One of them is already presented in social learning theory. How previous experience of the manager affects this is already analyzed in Section 3.1.2.
The second route through which cognition can have a role is reference models. Reference models and social links can provide a social identification method for management. According to the conceptual analysis by Nahapiet and Ghostal (1998), identification is the process whereby individuals see themselves as one with another person or group of people. This may result from their membership in that group or through the groups functioning as a reference group. Identification acts as a resource in influencing both the anticipation of value to be achieved through combination and exchange, and the motivation to combine and exchange knowledge. The mean strategy of a reference group becomes a focal point towards which an organization’s manager converges (Feigenbaum & Thomas, 1995). This convergence enacts the mental model as a real situation in the industry (Porac et al., 1995).
The commonality of frames means that the management of a firm shares codes and language with other companies. In this way, the management may generate cognitive social capital that generates new intellectual capital for the firm by making access to other parties easier; allowing
69
the exchange and combination of information (Nahapiet & Ghoshal, 1998). Management sees its environment as similar to its reference models. Links between actors in a network constitute conduits through which beliefs are shared (Friedkin, 1984). The constructionist’s view strengthens the view formed already in the analysis of motivational theories. It strengthens the view that perceived motives of reference models have an impact upon management’s motives. Figure 3-6 illustrates this further.
Strategic choices
Growth orientation
Practical goals
Growth
Perceived social growth
pressure
Self-efficacy on
growth
Previous growth
experience
Growth attitudes
Socially linked
referents
Other referents
Previous experience
Construtiovinism
Figure 3-6, Motivation theories based growth model complemented by cognitive research
3.1.4 Synthesis of strategic choice and regional culture research
The roles of the company and the manager need to be understood before we discuss the implications of the strategic research on this study and what the strategic choice construct can include. In the strategy research, there exists two approaches relating to the role of CEO, or other strategy formulator. The former approach investigates the main effects of CEO characteristics on strategy and performance. The CEO is viewed as the architect of the organization’s strategic orientation (Hambrick & Mason, 1984). The latter is based on the contingency view of strategy and focuses upon the concept of match, arguing that managerial characteristics should be aligned to a given strategy in order to achieve high organizational performance (Gupta, 1984; Nahavandi & Malekzadeh, 1993). The implicit assumption is that strategies are given and the main task of CEOs is therefore to implement rather than to formulate strategies. In the former view, the leader formulates strategies. In the latter view, the leader moderates the relationship between strategy and performance (Boone et al., 1996). Therefore, there might also exist a moderating relationship between growth orientation and strategic choice in their relationship to growth.
If the first approach is valid, there is not much reason to distinguish between top management decisions and the strategic choices of the company. A company is strategically more or less the
70
same as its upper management. The relationship is as follows: from the management’ goals to strategic choices and from there to growth. If the second approach is more valid, management goals have a moderating relationship between the strategic choice created by environment and structure. Growth orientation moderates the relationship between strategic choice and growth. The model is complemented with the potential contingency theory originated view in Figure 3-7. Even if contingency theory does not hold the resource and social structure, related constraints limit the possible choices.
Contingency theory also emphasizes the role of connection between the environment, structure and strategy. The theory implies feedback loops between these factors. One way a manager can obtain information from the environment is through sales activities and their successes. Previous sales growth tells management which markets are served by the firm and how much effort is required to it achieve growth. In this way, a feedback loop linking through effort-growth expectancy and growth orientation to strategies is born. The firm and its management’s capability to grow may lead increased social networks allowing still more growth and also access to necessary resources and assets. Thus, previous growth experience may moderate the success of growth seeking efforts.
Strategic choices
Growth orientation
Practical goals Growth
Perceived social growth
pressure
Self-efficacy on
growth
Previous growth
experience
Growth attitudes
Socially linked
referents
Other referents
Previous experience
Figure 3-7, Additions from research on strategic choice to the model
Besides some additions to the model, strategy research literature gives advice on how the model can be operationalized and understood.
First of all, all strategy research streams agree that between attributions and results, such as between growth motivation and achieving growth, there is a need for strategy setting (Romanelli, 1989). Even population ecology confirms this point by stating that organizations that do not have a feasible strategy die. Whilst the environment provides resources for growth and development, organizational strategies represent the firm’s ability to actually take advantage of the resources (Romanelli, 1989).
71
Secondly, there might be generally accepted views as to what strategies lead to growth in general, and more specifically, in the software product industry. Still it may be so that these strategies do not lead efficiently to growth within a specific industry condition and timeframe. It might be so that the management mental model that drives towards choosing a high growth strategy leads to a selection that, in fact, is not most growth optimal in changing industrial and competitive conditions. Research on the actual content of the strategy has not identified specific strategic choices that always give good results, and an effective strategy depends on the competitive situation and on the structure of the industry (Thomas & Venkatraman, 1988). As the best known figure in generic strategies research, Porter (1985) notes, changes in industry structure can affect the basis on which generic strategies are built and thus alter the balance along them. Even though the industry structure would remain the same, the most common generic strategies proposed are based on industrial economics analysis. They are based on phenomena at the industry-level, while strategic management deals mainly with issues that are relevant to the individual firm (Rumelt et al., 1991).
Thirdly, the resource-based view presented in Chapter 2.4 may imply what might be the most efficient strategy for a small or medium sized software product company to grow. The strategy might be to concentrate in the product business, because for small companies, even small market niches offer high growth potential. The environmental school gives one possible strategy for a firm seeking fast growth. The firm should select and operate in a fast growing sub-industry.
The review of regional culture literature does not reveal new potential sources for growth orientation besides such that are already included in the model. Based upon the literature presented in Chapter 2.5 and Bandura (2002), cultural differences may have the following ways to affect growth orientation:
• Culture can affect the perceived social pressure upon management. The effect can be related to reference models and the selection of them.
• Management self-efficacy: Culture can affect the expertise level that triggers management to consider a certain level of growth as sufficient.
72
3.2 Hypotheses
3.2.1 Sources of growth orientation
The main research question was: How the growth orientation of the management is born?
To answer the question, the potential factors affecting growth orientation are identified from the theoretical model. The focus in identification is specifically on factors that potentially answer the first two more detailed research questions: (1) Who are the referents that are affecting most the growth orientation of the management? and (2) Through which paths do regional differences affect growth orientation?
Because this study concentrates upon searching principal sources of growth orientation, the effect of growth orientation, and those sources of actual growth, not all the intermittent constructs presented in the model are needed. The constructs to be left out from the hypotheses formulation are attitudes and growth-effort expectancy. They can be removed, because there is a need to understand the basic reasons, not explicitly analyze which are the exact mechanisms connecting the independent constructs to growth orientation. After these expletory constructs are left out from further analysis, the model about sources of growth orientation is shown in Figure 3-8. The figure presents the theoretical constructs. The relationships to growth orientation are presented in the hypotheses regarding the sources of growth orientation. The numbers attached to each of the arrows is the number of the hypothesis that handles the relationship illustrated by the arrow.
73
Growth orientation
Previous experience
H5
Previous growth
H4
Socially linked
referents
H1Other
referents H2
Social norm
H3
H6
Figure 3-8, Model of factors potentially affecting growth orientation
The first hypothesis relates the socially linked referents with growth orientation. The theories illustrating the potential nature of the relationship include institutional theory, equity theory, discrepancy theory, and cognitive research.
The institutional theory of strategic management implies that mimetic isomorphism results from borrowing and imitation (Feigenbaum & Thomas, 1995). Management observes what similar companies and their managers do and imitate the practices that they feel most feasible. Greve (1996) found, in a longitudinal study of new format adoptions by U.S. radio stations, support for the argument that innovations in market positions are mimetically adopted so that new market positions diffuse in the industry. The recently innovated market positions are mimetically adopted by organizations that can easily observe previous adoptions and see them as relevant to their market situations, increasing the market differentiation (Greve, 1998). Besides showing that managers adapt to practices that are easily observed, Greve (1996) also indicated that stations entering a new format cause mimetic entry by such stations that are spatially or socially proximate to them. Thus mimetic isomorphism indicates that managers can borrow their mental models from referents. It also indicates further that the most efficient reference models might be those that are socially or spatially linked.
Institutional theory does not provide insight on the further question as to whether it is the company, or manager of the company, that is the real target of observations. This question is handled by other theories.
74
In sociological studies of referents, the basis is either equity theory or discrepancy theory (Lawler, 1971). They both are based on the notion that examples from other entities can guide the motivational settings of persons and their organizations. Discrepancy theory includes both the possibility that one compares his organization or organizational settings with other organizations and that a person compares herself to other persons. Thus, according to discrepancy theory, it is possible that other firms are also used as referents in addition to other managers. For instance, in his pay satisfaction study, Goodman (1974) found seven types of referents: other-inside; other-outside; system-structure; system-administration; self-pay-history; self-family; and self-internal. Therefore system-structure, meaning organization, per se, not the people working within it, can also be a source of referents. Thus discrepancy theory gives the same guidance as institutional theory. It implies that referent companies can be useful towards creating objectives for management.
Equity and cognitive theories provide more guidance as to whether persons or organizations are a more important source of references. The equity theory says that one person compares himself and his results and objectives with other persons. In referent studies, it is colleagues that are found to be most important referent group outside the company (Law & Wong, 1998). According to the theory, the individual compares the ratio of his own outcomes and input with the corresponding ratio for a comparison other, usually another person in the organization. When the ratios are no longer perceived to be equal, a state of inequity is said to exist. According to Adams (1965), inequity creates tension in the individual, proportional to the magnitude of the inequity. This tension motivates the individual to reduce the inequity. As individuals compare themselves to similar objects elsewhere, the comparison is made with other managers in other companies, not between an individual and an organization. Therefore, according to equity theory, it is expected that other strategic level managers are the most important referent group for the strategic management of software product companies. The problem with this notion is that equity theory demands an input or output relationship between the manager and the referent person’s company. Thus it does not directly tell that persons are always more important referents than organizations, but this view is a generalization of the theory.
The relationship between referents and own attitudes can be explained also by cognitive research. Seeing people similar to them succeed raises a manager’s belief that they too possess the capability to master the growth process. Managers of companies in the same or similar industry than the respondents, and whom they know and recognize at a personal level, affect the beliefs of the growth valence as well as of effort-growth expectancy.
Cognitive research indicates the importance of socially close referents. The management has the largest commonality of frames with socially close referents. This means that the management of a firm shares codes and language with managers of companies who share socially and cultural similarities. Through that, the management may have generated cognitive social capital that generates new intellectual capital for the firm by making other peoples` access to intellectual
75
capital easier; making exchange and combination of information easier (Nahapiet & Ghoshal, 1998). The management sees its environment as similar to its referents. So according to this view, referents, that are assumed to live in a similar environment as the manager, provide the most directly applicable behavior models.
Institutional theory can be also used to analyze the relationship between referents and managerial behavior. Abrahamson and Fombrun (1994) propose that homogeneity of beliefs within an inter-organizational macro-culture encourages member firms’ managers to interpret environment in similar ways, to identify similar issues as strategic, and so to adopt similar competitive positions. In the words of the sociological perspective that builds upon dependency theory, this can be expressed: behavior is a function of organizational embeddedness in networks and social structures, and of organizations’ ability to manage this embeddedness (Granovetter, 1985). Links between actors in a network constitute conduits through which beliefs are shared (Friedkin, 1984). As Gulati and Gargiulo (1999: 1445) observe, managers have a “widespread preference for transacting with individuals of known reputation,” for turning to “trusted informants” who have dealt with the other party to the transaction, and found the party trustworthy, or, preferably, for relying on “information from one’s own past dealings with that person”.
Past research in the area of institutional theory suggests that organizational leaders may use three different modes of imitation: frequency-based imitation, trait-based imitation, and outcome-based imitation (Williamson & Cable, 2003). Frequency-based imitation suggests that firms imitate actions that have been taken by a large number of organizations. Its effects are handled in the discussion of hypothesis concerning regional culture. Trait-based imitation refers to organizations’ selective imitation of practices that some subset of firms with certain traits has used. The managers imitate the behavior of model firms or their managers because the behavior of the imitated subset is regarded as legitimate. Usually the trait-based imitation is understood to lead the imitation of large firms, but it may as well be the acts of socially close firms are considered more legitimate as distant firms. Outcome-based imitation is based on the logic that decision makers will imitate the practices that they believe have produced positive outcomes to other firms. In the case of outcome-based imitation, the size or social proximity of a firm does not have an effect on the intensity of imitation, which leads to the possibility that also distant firms and their managers can act as referents.
From theory to theory, the value of the relationship between growth orientation and growth orientation of the referents is indisputable. It is positive. Cognitive and equity theories also imply that it is more efficient to study the relationship between human referents and management growth orientation, at least in this industry context. In this study, there is an opportunity to separate more closely socially linked referents from usually non-socially linked. This is done by using Finnish and foreign referents. Finland is a small country where people are all living in a similar culture. Usually, the main actors of each industry know each other. This was also found
76
out to be true in the Finnish software industry as determined by a control question in this study. Foreigners are still socially more distant. According to cognitive and institutional theories the Finnish referents should then have a stronger connection to growth orientation than foreign referents, or organizations as referents to persons. This relationship between the expectedly strongest referent group and growth orientation is thus expressed in the first hypotheses that are modified from Autere and Autio’s (2000) original hypotheses:
H1a The growth orientation of Finnish referents has a positive impact on growth orientation
H1b The impact of Finnish referents on growth orientation is stronger than a foreign referent
The second hypothesis concerns the situation when there is no social link with the referent. Even then it is possible that there is a connection between referents and growth orientation according to institutional theory, discrepancy theory, and cognitive research.
Organizations often copy the approaches of successful competitors, obviously because they associate it with success, but also because they want to convince others that they too are at the cutting edge of best practice. The mean strategy of a reference group becomes a focal point that organizations converge towards (Feigenbaum & Thomas, 1995). Structural equivalency predicts that two people identically positioned in the flow of influential communication will use each other as a frame of reference for subjective judgments and so make similar judgments even if they have no direct communication with each other (Burt, 1987). Examples of coordinating mechanisms that do not demand direct communication are industry-specific newspapers, magazines, and newsletters (Abrahamson & Fombrun, 1992). These sources of information tend to present examples of companies that are exceptional and use them as general references in the industry. They may guide the general norm of industry behavior to be adapted everywhere.
The view that an organization converges towards the mean strategy of a reference group (Autere & Autio, 2000) has a serious limitation. How does the organization know what the mean strategy is of its reference group or reference company? According to both the perceived and enacted environment worldview of cognitive research, the decision-maker does not have an objective view of what the strategy is of the reference companies. It is also difficult to directly observe the real strategic thinking inside the company towards which company management is supposedly converging. The management can only guess what the reference company management is trying to do. So it is not the mean behavior of reference companies that the management can use as a reference point, but rather the perceived behavior. It is also possible that the management will select as referents such socially distant managers that mirror the attitudes of the manager himself.
77
If it is assumed that non-socially linked referents are selected to reflect already existing norms, or referents give general behavioral norms for the whole industry. The referents that are used, due to their visibility, may have a strong connection to attitudes. Thus it is assumed that:
H2 The growth orientation of foreign referents has a positive impact on growth orientation.
The third hypothesis still considers different aspects mental model sources, especially regarding how social norms on growth attributes are transmitted. Early cognitive research into environmental scanning suggests that executives greatly prefer information from personal contacts to documentary sources (Aguillar, 1967). The influence of external contacts extends beyond information acquisition, however, to affect interpretation as well. They construct logic for their own immediate contexts by relying on the experiences, definitions, and interpretations bestowed on similar contexts by their counterparts (Berger & Luckmann, 1966). They shape the frames of reference by which executives understand the external context. “Any message, which either explicitly or implicitly defines a frame, ipso facto, gives the receiver instructions or aids in any attempt to understand the messages included within the frame” (Bateson, 1955: 187-8). There are multiple sources of messages for strategic managers, but not many easily observed and quantified. Most important are the constructs measuring experience and company governance, and ownership structures.
The sources used for financing a business are likely to have an influence upon the growth (Hall, 1989). The use of external funding can be related to growth orientation of the management by three ways. Firstly, those firms that are more growth oriented may be more willing to share ownership to spur the growth rate further (Cambridge Small Business Research Center, 1992). Secondly, an outside owner values growth of technology based firms because they see the growth as the best route to increase the value of their investment (Doorley & Donovan, 1999). They exercise their ownership power to impose upon the management the social pressure best to pursue growth. Thirdly, the outside owner might link the management to his/her contact network (Autere & Autio, 2000). This portfolio presumably includes consultants and business support firms used by the investor as well as other investments of the owner; presumably that presumably high growth oriented firms which act and such way act as a promote a growth oriented social norm.
In the vast majority of studies regarding fast-growth businesses, those which indicated a willingness to share equity were willing more likely to grow than the businesses which indicated a reluctance to share equity (Cambridge Small Business Research Centre, 1992). Some of the studies found that the relationship between external funding is present in a univariate context, but weak in a multivariate context (Kinsella et al., 1993). This implies that the major effect of external ownership on growth is through mediating variables. A positive association between external equity and growth may reflect the fact those businesses of interest to an external owner
78
are those which have shown, or which show the potential for growth (Storey, 1994b). Growth orientation and a high valency of growth might be mediating variables between external ownership and growth.
According to Nahapiet and Ghoshal (1998), each of the institutional links increases the structural social capital of the firm. Whether the firm has outside owners or not is addressed by the institutional link. Structural social capital constitutes a valuable source of information benefits, i.e. “what you know“ can affect “who you know“. They influence the range of information that may be accessed. The ownership structure may increase the desirability of growth objectives, e.g. if the firm is owned by venture capitalists or is publicly traded.
Haunschild’s (1994) study of acquisition premiums demonstrated that relationships with outside financial (investment banking) professionals contributed to the purchase decision. It is assumed that outside owners are persons who have expertise on how to increase the value of a firm. Outside owners see it as easiest to increase value in the software product business through growth, and therefore contribute to the increased growth willingness.
Besides knowledge and information transmission related explanations, the agency theory suggests there is a relationship between external ownership and growth orientation (Schulze et al. 2003). According to the principal-agent model, the agency positions of outside owners and owner-managers differ. Outside owners prefer growth oriented risk-taking because they benefit solely from the appreciation of shareholder value. They also are indifferent to the level of risk specific to any particular investment made because they can reduce that risk by holding diversified portfolios. Owners who manage a private firm, in contrast, define its value in terms of utility, and therefore they will undertake risks that are commensurate with their preferences for certain outcomes. The principal-agent model has had a profound influence upon corporate governance theory (Jensen, 1998).
Based on these different perspectives, the third hypothesis is formulated in a very narrow, but
measurable way compared to the original model. It is suggested as Autere and Autio (2000) have
done earlier:
H3 Outside owners increase growth orientation
Prior experience and a manager’s education before joining a small or medium sized company is an important source of mental models, outside contact networks, and reference models. Its effect upon growth orientation must be analyzed.
The contingency theory emphasizes the connection between the environment, structure and strategy. The theory implies feedback loops between these factors. One way that managers can obtain information from the environment is through their activities and successes. Prior growth
79
of sales tells management which kind of markets surround the firm and how much effort is required to achieve growth. In this way, the feedback loop from effort-growth expectancy to growth orientation and then to strategies is created.
The enacted environment worldview of cognitive research assumes that organizations and environments are convenient labels for patterns of activity. “What people refer to as their environment is generated by human actions and accompanying intellectual efforts to make sense of their actions. “The world is essentially an ambiguous field of experience” (Smircich & Stubbard, 1985: 726). Thus previous experience of achieving growth makes managers assume that the structure of their whole business tends towards growth. In this way, previous experience growth increases the growth expectation and causes managers to plan for growth. Social cognitive perspective also suggests the acquisition of skills through past achievements reinforces self-efficacy and contributes to higher aspirations and future performance (Herron & Sapienza, 1992). Thus earlier growth experiences creates higher aspirations for growth in the future.
Davidsson (1989; 1992) and Kolevereid (1992), in their samples of Swedish and Norwegian entrepreneurs, found that previous growth experience was positively associated with growth motivation. Previous growth experience was assumed to positively influence both the expectancy of positive growth outcomes as well as perceived behavioral control.
Even though there is a tendency for previous growth expectancy to increase growth expectations and further plans for growth, there may be factors blurring this relationship. The relationship regarding perceived behavioral control has been found to have weaker, and in some cases, even negative relationships to intended behavior, if organizational aspects, other than personal, are measured (Corano & Frieze, 2000). If a person is frustrated with his organizational context’s willingness to grow, he exaggerates his growth intentions. This might affect results in some situations where the respondent is not a strategic decision-maker in the company. In the study’s research setting, it is not considered normal to respondents who are part of the strategic management. In these cases perceived behavior control has a positive effect.
Another factor possibly weakening the relationship is that the industry under study experienced a very high growth period previously inexperienced by the managers. Those who had not experienced this aggressive fast growth may have been overwhelmed and unable to form accurate mental models of growth. Managers and companies with earlier fast growth experience may have had a better ability to estimate and plan for growth.
The presented potentially distorting factors however may not completely change the effects proposed by constructionists’ and social cognitive theory. Therefore, it is suggested:
Previous hypothesis discussed growth specific experience. Besides this, the management can have general experience on running business. Two contrasting hypotheses could be presented on its effect. The first suggests that prior experience increases growth orientation. The reasoning is that individuals, who have previously worked in the same sector in which they establish their business, will have developed their expertise and experience about the acceptable norms and practices in that sector. Only after this is understood and implemented can significant business growth can be achieved (Storey, 1994b). Management can create informal relationships with former employees from some important business incubators that generate relational social capital for the organization and through this, intellectual capital for the business Nahapiet & Ghoshal, 1998).
There are multiple empirical studies that have examined the relationship between business growth and whether the founder had experience in the sector prior to the business being formed. The studies have not directly considered the relationship between growth orientation and previous experience. The picture is mixed. Several studies do not identify an impact (Storey et al., 1989; Kalleberg & Leicht, 1991; Solem & Steiner, 1989; Reynolds & Miller, 1988; Westhead & Birley, 1993a), some identify that prior sectoral experience is associated with slower-growing firms (Jones, 1991; Storey, 1994a; Dunkelberg et al., 1987; Reynolds, 1993), and one suggests that prior sectional experience is associated with faster-growing firms. There are possibly two different forces at play that affect different directions and exert different strengths upon firm populations under different situations. There may not be a general, inter-industry relationship between experience and growth. So there may well be a basis for contrasting hypothesis: prior experience reduces growth orientation or experience increases it.
Already Penrose (1959) based her theory on the assumption that experienced managers have learned more capabilities to manage and to achieve their objectives than inexperienced ones. The effect of experience may also have an effect on the management analysis of environment and company potential. If managers have a realistic view of the potential to achieve growth, experienced managers may consider their company’s potential better than inexperienced managers. But this assumption does not necessarily hold true in all cases. Inexperience can also bring a more biased view of potential. In the late 1990s, in the industry climate of fast growth successes, inexperienced managers may have found it more difficult to adapt the existing realities and economic growth constraints. It can also be assumed that experienced managers have a higher potential to manage companies with better prospects and thus those that tend to estimate higher growth in the future.
The experience, from the industry, relates mostly to the norms and practices that managers have learned to be present. So this gives basis for a manager’s mental model which explains the optimum industry growth rate. The Finnish software products industry had grown slower and was based upon more stable domestic companies in the 1980s and early 1990s than in the late 1990s (Autere et al., 1999). Therefore the previous experience from this early industry
81
development gives birth to a cognitive model for experienced managers to expect slower growth than the managers who learned first-hand during the late 1990s what growth expectations could be.
In the Finnish software product industry in the late 1990s the growth was high and the industry was turbulent (Hietala et al., 2002). Therefore the obsolescence and consequent devaluing of experience in the software industry was stronger than what the second hypothesis would suggest. As Hambrick et al. (1993) found, a top manager’s tenure in his/her industry provides a better predictor of their commitment to status quo than his/her tenure in their organization. The hypothesis suggests that of importance is the whole time the manager has been working in the industry, including also, the time before the manager joined the company. Therefore it is suggested:
H5 Management’s general and industry experience reduces growth orientation
The presented reasoning of a potential distortion effect for hypothesis H4 gives rise to another hypothesis. Although the average growth rate in the industry were beyond of the ordinary growth experience of the managers, they still had to base their plans upon some standard. Those managers that have both experience with growth and other business situation may have the widest foundation of sources on which to form their models on business situation. Their perceptions correspond best with the turbulent situation and they have are able plan for future development realistically. Managers with only growth experience and limited general experience may lack sources for accurate models when it comes to such business situations that are not similar than the ones that they have met previously, and thus will not detect factors in environment and resource that might limit growth.
The empirical data used in this study show that, in this industry, managers were too optimistic in planning their growth between 1998 and 2001. More modest growth intentions would have been better adapted to the real business situation and possibilities for growth of the company. Thus a wider previous experience than just from fast growth situations may have reduced the effect of previous growth experience on planned behavior. Thus increasing previous experience may lower the effect of high previous growth experience and it is suggested:
H6 Previous experience moderates negatively the effect of previous growth experience
3.2.2 Relationship between growth orientation and regional environment
The third research question was: Through which paths do regional differences affect growth orientation?
82
The different levels of culture; in society, industry, and organization; interact, every which way. National cultures influence the way each environment is interpreted, creating different strategic responses by the same company in different countries (Roth & Ricks, 1994). Rieger (1987) has demonstrated the impact of national cultures on the structure and decision-making styles of various national airline carriers. In a similar way, regional cultures can affect the decision making of companies.
Regional and cultural differences are transmitted to organizational behavior through social interaction. Knowledge and meaning are always embedded in a social context; both created and sustained through ongoing relationships in such collectivities (Nahapiet & Ghoshal, 1998). Meaningful communication requires at least some sharing of context between the parties to such exchange (Boland & Tenaski, 1995). Codes organize data and provide a frame of reference for observing and interpreting the environment. Each manager is exposed to a great information flow, e.g., local newspapers, opinions of colleagues, family and friends as well as knowledge generated in previous life (Abrahamson & Fombrun, 1992). Besides shared language, codes, and information flow, myths, stories, and metaphors also provide a powerful mechanism in communities for exchanging, and preserving rich sets of meanings. The emergence of shared narratives within a community thus enables the creation and transfer of new event interpretations (Weick, 1995). An example is how to interpret reference models.
As presented in the model in Chapter 3.1, the variables that should have an effect on growth orientation are referents, external ownership, previous experience and the previous growth of the company. The independent model variable constructs can affect the differences in shared beliefs and codes in two ways. Firstly, the shared codes and metaphors can point out whom to select as prime direct referent. The regional culture can affect the selection of socially linked, i.e. Finnish referents. Thus following hypothesis is presented:
H7 Finnish reference persons mediate the differences in regions to the growth orientation.
It was assumed in hypothesis H3 that external ownership creates a channel for information and norms that in turn create more growth oriented mental models for managers. It can be assumed further that regional beliefs also affect the management’s opinion regarding the benefits of outside ownership; either a more growth oriented regional culture makes management more growth oriented and willing to allow growth through external ownership, or regional culture makes managers see external ownership more admissible. As external ownership is then in place, growth orientation increases. In both cases it can be hypothesized:
H8 Outside ownership mediates the differences in regions to the growth orientation
.
83
3.2.3 Factors affecting growth
The fourth research question is: How does growth orientation affect the actual growth in the industry under study? The hypotheses concerning the relationship between independent variables, growth orientation, and actual growth, addresses this question. The part of the theoretical model that handles the relationship between these constructs is presented in Figure 3-9. Again the intermittent variables, that are not relevant for testing the relationships under study, have been removed.
Strategicchoices
Growthorientation GrowthH10
Previousgrowth
experience
H9
Previousexperience
H11
Figure 3-9, The concepts affecting growth
As strategic choice is not a focus area for this study, the relationships between strategies and growth have not been discussed in the hypotheses. Furthermore, variables measuring strategic orientation of the company are used only as controls in the empirical analysis.
According to the theory of planned behavior, intentions and behavioral control must correspond to the particular behavior in focus (Ajzen, 1991). Therefore, in predicting firm growth, it is important to assess the specific resources and opportunities that may affect firm growth. The small business manager’s human capital of gives him/her the ability to achieve growth (Wiklund & Shepherd, 2003). A small business founder with great human capital is likely to enhance organizational performance. It increases the chance that the manager will make correct decisions and conduct proper activities. The human capital of a manager consists of skills and knowledge that assist him/her in running the business successfully (Snell and Dean, 1992). Such skills and knowledge can be obtained through education and experience.
As suggested by Wiklund & Shepherd (2003: 1924) based on Becker (1975), a distinction can be made between general and specific human capital. General human capital is unrelated to the ability of conducting a specific job and typically refers to years of education or years of work
84
experience (Becker, 1975). A consistent finding for general human capital is that educated individuals are more likely to run faster-growing small businesses than those who are less educated (Storey, 1994b). But previous research has not found evidence that general work experience affects small business growth (Wiklund & Shepherd, 2003). The reason may be that differences in business context changes also the most successful business logic and management practices. For this reason, the applicability of previous experience is limited. Therefore, the hypothesis that previous experience is directly connected to growth will not be presented. The direct connection between previous experience and growth will be removed from further models.
In the context of this study specific human capital is specific to the domain of operating a small business. It consists of skills and knowledge of conditions that help organize the business successfully, thus facilitating growth (Rauch & Freese, 2000). Specific human capital, such as start-up experience, management experience, and experience of working in rapidly growing organizations, has been found to explain, in part, the growth of small firms (Birley & Westhead, 1994; Macrae, 1992; Van de Ven, Hudson, & Schroeder, 1984). The area, specific human capital, is a focus area of this study and affects previous growth experience. Thus, following the logic or Wiklund and Shepherd (2003: 1925) it is suggested:
H9 Previous growth experience of management has a positive effect on growth.
As presented in the literature analysis, there may be three different factors that can affect action: environment, motivation and cognition. Growth motivation is a closely related to growth orientation. Growth orientation can be assumed to give rise to actions that lead to growth. Locke et al. (1981) observed that 90 percent of all goal setting studies showed a beneficial effect of goal setting on performance. The effect can be direct.
As summarized by Wiklund & Shepherd (2003) there exists a number of existing empirical research reports that have presented a direct positive relationship between motivation and growth (Bellu & Sherman, 1995; Kolvereid & Bullvåg, 1996; Miner, Smith, & Bracker, 1994; Mok & van den Tillaart, 1990), and direct effects of intention on behavior have been reported in planned behavior theory tests (Ajzen, 1988; Ajzen, 1991; Bagozzi & Warshaw, 1992; Doll & Ajzen, 1992). In this context, it is relevant to speak about management’s intention to grow: growth orientation, and growth. Thus the hypothesis dealing with the relationship between growth orientation and growth is an assumption of direct relationship based upon the theory of planned behavior and empirical research related to it.
Even though the general direction of the relationship between growth orientation and growth is positive, whether analyzed based on common sense or any relevant theory, the relationship might not be linear. Several studies show that setting proximal performance goals in addition to distal goals can produce better performance than distal goals alone (Bandura & Schunk, 1981; Latham & Seijts, 1999; Morgan, 1985). The contingency view of the strategy making approach
85
focuses on the concept of match, arguing that managerial characteristics should be aligned to a given strategy in order to achieve high organizational performance (Gupta, 1984). Overly ambitious growth objectives may be more distant than more modest growth goals, and thus they may not work as efficiently as lower goals. Thus the positive relationship between growth orientation and growth may plateau, or even decline, due to differences between the current target situations.
Even though the relationship between growth orientation and growth might not be linear, it is most probably positive, or at least neutral. Therefore the hypothesis is that intention directly influences subsequent growth. Thus the approach selected here is not the contingency view, but a view that believes that CEOs and other strategy makers can have a direct effect upon performance, not only a moderating role. This approach has been selected because it is simpler to test. This study does not focus upon freedom of choice research in strategy formulation. Thus it is suggested as e. g. Autio and Autere (2000) have done earlier:
H10 Growth orientation has a positive effect on growth
The last hypothesis further handles the relationship between management experience in general, growth orientation, and growth.
As the intention of this part of the study is the prediction of growth, and there is reason to believe that actual behavioral control plays a role in firm growth, we model the influence of behavioral control on growth. As Ajzen (1991: 188) notes, “the past theory as well as intuition would lead us to expect an interaction between motivation and control.” In defining the type of relationship, this study follows the guidance of Wiklund & Shepherd (2003) by assuming that behavioral control is likely to moderate the relationship between intentions and growth. Thus, the model tested contains the relationship between intentions and behavior, moderated by behavioral control. In the context of this study this suggests that previous experience gives management a basis for believe in his/her capability in controlling actions. It is guiding behavioral control and thus moderating the relationship between intentions and behavior.
The natural direction of the relationship is that behavioral control has a positive effect on motivation. As expected, Wiklund & Shepherd (2003) found a positive moderating effect of experience on how growth intentions relate to growth. This moderation is a rather natural phenomenon. The experience affects how managers in practice act and make decisions. If the plan is to achieve fast growth, management experience helps make correct day-to-day decisions and tasks. But the situation in the industry under this study was different from Wiklund & Shepherd’s setting. The business situation of companies planning to have fast growth was different from traditional growth rates of companies in the business. In the late 1990s, also other changes hit Finnish software industry; like increasing availability of capital and the fast internationalization of business. Therefore the growth oriented companies with management
86
having experience from previous business logic were worse of than companies with less experienced managers.
Business situations change though and so managers as they collect experience. In such situations, experienced managers still make decisions based upon mental models grown during their previous career. Less experienced managers try to analyze the current situation at hand and adapt her behavior more. If the previous rules do not work, the least experienced manager is actually better off than the experienced. In the industry under study, the business situation of companies planning to have fast growth was different from traditional growth rates of companies in the business. In the late 1990s, also other changes hit Finnish software industry; like increasing availability of capital and the fast internationalization of business (Autere et al., 1999). Therefore the growth oriented companies with management having experience from previous business logic were worse of than companies with less experienced managers.
If the aspiration for growth is comparatively low, the manager’s general experience from usually non-high growth situations is more relevant than in a situation where the aspiration for growth is high. Thus if there is no high growth orientation present, there is neither present a situation where general experience is not feasible. The negative effect is in force, when growth orientation is high.
Suggestions of Baron (1998) also point to the same direction than reasoning in the previous three paragraphs in situations, where management is motivationally entrepreneurial, but lacks sufficient expertise to execute in high growth situations. Baron suggests that entrepreneurs are more prone than other managers to cognitive errors that lead to not well fitting decisions in high pressure. Entrepreneurs are more susceptible to escalation of commitment effects and tendencies toward self-justification than are other people. They have the tendency to continue investing time, effort, or money in losing courses of action because of initial commitment to this course of action.
Thus:
H11 Previous experience moderates negatively the effect of growth orientation on growth in the industry under study.
87
3.3 The growth model used in testing
The total model contains only the relationships that are present in our hypotheses present. This model is presented in Figure 3-10:
H10
H9
H11H5
H4
H1a
H2
H3
H6
GrowthGrowth orientation
Previous experiencePrevious
growth
Other referents
Socially linked
referents
Channels transmitting
growth message
Figure 3-10, Total model containing all the hypotheses from chapters 3.2.1 and 3.2.3
88
4 Methods
This chapter discusses the methodology used in the present study. Firstly, the general approach of the research is discussed. Secondly, the sources of primary and secondary data as well as the survey method are discussed. Thirdly, the statistical methodology used is discussed. Thereafter, the operationalization of constructs is presented. Finally, the chapter discusses the various elements of reliability, validity, and generalizability and how those elements have been taken into account in the present study. This discussion as well as analysis is done according to the guidelines by Maula (2001), which give more detail discussion and description of the methods.
4.1 Research approach
This dissertation aims to consolidate and expand the existing literature on relationships between external referents of management and entrepreneurs, and the growth of a firm. Another aim is to contribute to a wider body of literature on regional and cultural relationships and their effects on company behavior and success. This happens by building upon existing theories and empirical research by and developing an integrated model of some motivational and cognitive mechanisms that affect growth. Hypotheses derived from the model are based upon empirical testing with data collected from primary and secondary sources.
The basic approach for this research emerges from the positivism or empiricism stream of social sciences. The aim is to find certain “facts” by using empirical methods, that is, methods based upon world experience (Dooley, 1995: 5). This study is based upon the social cognition perspective, which may pose some problems on the positivistic approach. Subjective meanings are not regarded purely as the products of private cognitive processing, but as ineluctably social constructions. Luckily, the view is that this does not imply that researchers mistrust self-reporting by research subjects. As Hackley (1998) points “there is no conclusive version of social events, which can lie outside of the discursive production of those events. The social constructionist approach takes subjective reports of events, emotions, and cognitions to be multifaceted constructions which can be interpreted on many levels; one level being the self-reported one.”
In this study, conceptual frameworks are developed based upon a review of extant literature. Then the prepared theoretical model is further developed into a research model and hypotheses are taken from the model. After hypothesis definitions, theoretical constructs are operationalized
89
by either adopting measures used in previous studies or by deriving new measures based upon the underlying theory. Finally, the hypotheses are tested empirically using statistical methods on operationalized constructs.
The data on independent and mediating variables for empirically testing the hypotheses were collected with structured quantitative interviews from November 1998 to May 1999 with CEOs, Board Chairmen or other senior management which the companies nominated as their key strategic decision makers. The dependent variable, turnover data, for years 1996-2000, was collected annually from public sources after the interviews. In addition, data on turnover between years 1996-1998 was collected by a separate questionnaire in 1999 in order to check the validity of the data by comparing the results from two independent sources. Thus the empirical study is based upon panel data from the parts that regard the study of realized growth, but the empirical results regarding factors affecting growth orientation is based upon cross-sectional data. The cross-sectional research design does not allow for tracking the evolution of relationships over time or for making conclusions about the direction of causal relationships based upon the data. Thus such conclusions on the effects on growth orientation are based upon conceptual analysis. However, a quantitative approach makes it possible to empirically reject hypotheses derived from extant theoretical and qualitative work, and it allows for the simultaneous inclusion of elements derived from different theoretical approaches. With its quantitative approach, the study aims at consolidating and expanding the existing knowledge in the field and subjecting it to testing.
.
4.2 Sampling and data collection procedure
The population from which a sample was selected was a database of Finnish companies producing software products, either mass-market software or enterprise solutions. The database was collected in 1997-1998 by combining the lists of companies developing software products. The lists had been collected by the Finnish foreign Trade Association, Finpro, a venture capital company SFK Finance, Tekes, and the Finnish regional centers of expertise. The list was also complemented by lists of companies from two independent consultants specialized in the industry. The database contained information of 187 Finnish firms that stated they operated a software product business which had been founded at the latest in 1996. The list is considered to be rather comprehensive and includes the majority of the Finnish companies that had significant software product business at the beginning of 1998.
Of these companies, all 22 Oulu sub-region and 23 Tampere sub-region small and mid-sized companies, founded in 1996 or before, were picked for further interviews. 46 Helsinki sub-
90
region small and mid-sized companies founded in 1996 or before were randomly selected to be interviewed.
Of the 91 companies selected for the sample, two proved to be different business units of the same company and seven had either ended their software product business, had been acquired by other companies or had moved outside the regions under study. Therefore 83 of the selected companies were still operating as independent software product companies in software product business. Of these 83 companies, 76 agreed to be interviewed so the response rate of the study was 91.6 percent. The regional response rates are presented in Table 4-1.
Location Helsinki Oulu Tampere
Number of small and mid-sized firms in the database
70 22 23
Selected for the sample 46 22 23
Still independent companies in software product business when contacted
43 20 20
Interviewed 40 18 18
Analyzed companies 40 18 18
Table 4-1, Regional response rates
The request for interview was addressed to the CEO of each company. The person requested for interview from each company was the one responsible for strategic software product decision-making. It was also possible to name multiple respondents from each company. A total of 83 interviews were made, because in seven companies, more than one interview was needed to obtain reliable answers to all questions. The types of respondents can be found from Table 4-2.
91
Primary position of the respondent Number of respondents
Chief Executive Officer 63
Chairman of the Board (also operational in the company) 4
Chief Technology Officer 4
Chief Operating Officer 5
Vice President of Business Development 5
Others 2
Total 83
Table 4-2, Table of type of persons interviewed
The interviews were conducted in Oulu, Helsinki and Tampere. These three regions of Finland had the largest number of firms producing software products in 1998. In addition, the many newly founded fast growing technology based enterprises have emerged in the Oulu sub-region during the 1990s in telecommunications and electronics industry. The aim was to find whether there is something special about the region or the firms. In the beginning, Helsinki was selected as a comparison region because 43 percent of software product companies in the database resided in the Helsinki sub-region. After analyzing the first results, the researcher decided to also include the Tampere sub-region in the study because the differences in growth orientation between Helsinki and Oulu were found to be small. Therefore, a region representing the rest of Finland was needed. Tampere was selected as the third region because some of its important regional factors were similar to Helsinki and Oulu. The interviews were conducted between November 1998 and May 1999.
Company turnover data from the 1996-1998 were collected in a separate survey in March 1999. The turnover data was also gathered from the database of a Finnish credit information company, Asiakastieto Oy, for years 1996-2000. Asiakastieto Oy collects income and balance sheet information from the official records of the Finnish Trade register. In principle, all companies in the database have a legal obligation to submit their annual report information to that register. Asiakastieto Oy was able to provide turnover data for all the companies in the sample that remained as legal independent companies up until the end of 2000. By the end of December 2000, of the 76 companies interviewed, 12 had either been acquired or gone bankrupt as can be seen from Table 4-3.
92
For the majority of the companies that had been acquired in 1999 or in 2000, it was possible to track the turnover produced for their acquirer from either public records or from the acquirer annual report information on the sales of its business units. Only 2 of the acquired companies were fully assimilated into their acquirer and it was therefore impossible to separate the unit any further. Thus the final sample for growth analysis was 74 companies compared to the 76 companies analyzed for in growth orientation. Because only 2.63 percent of the sample was dropped out of the final analysis, their influence would have been rather insignificant, and thus they were simply left out of the analysis without further attempt to replace the missing values.
Company status In December 31, 2000
Operating in the same setting as at the moment of the interview 63
Gone bankrupt without a new company continuing its operations (calculated as 0 turnover for 2000)
1
Gone bankrupt with a new legal company continuing the operations (new company turnover calculated as turnover for 2000)
1
Has been acquired 11
Acquired company still operating as a separate company 4
Acquired company operations merged to the acquirer 7
Acquired operations so much diffused to acquirer that it was impossible to determine turnover
2
Companies having turnover data from 2000 74
Table 4-3, Interviewed company status in December 31, 2000
4.2.1 Analysis of common method variance
Excluding the turnover and ownership measures, the analysis has to rely on the self-reported assessment of the strategic managers. There are no close proxies or external measures available for many of the variables examined in the present study (such as the growth orientation of referents), Because of there exists models consisting almost entirely of self-reported, cross-
93
sectional data, it is important to ensure that common method variance is not causing the relationships between variables (Avolio et al. 1991, Podsakoff & Organ 1986).
The first method to ensure that common method variance does not dominate the results was that earlier validated measures were used as much as possible (Spector, 1987). The second method was to test the possibility of common method variance was by using Harman’s single factor test as suggested by Podsakoff & Organ (1986). Inclusion of all the items used in the 6 multi-item scales yielded 6 factors with an eigenvalue of over 1.00. The first factor explained 24 percent of the variance. Adding the 3 one-item scales, 7 factors with an eigenvalue of over 1.00 were yielded. The first factor explained 22 percent of the variance and no pair of the one-item scores had more than 0.3 load in the same factor. Inclusion of all the items used in the 5 multi-item scales based on interview data yielded 5 factors with an eigenvalue of over 1.00. The first factor explained 27 percent of the variance. Adding 3 one-item scales yielded 8 factors with an eigenvalue of over 1.00. The first factor explained 24 percent of the variance and no pair of the one-item scores had more than a 0.3 load in the same factor. Based upon this analysis, it appears that the common method variance is not a serious threat to the validity of this study.
4.2.2 Unit of analysis
This study has two potential units of analysis—individual or a firm. The entrepreneurship research tradition uses the manager of the firm as the unit of analysis when studying the actions of the firm, but strategy researchers use the organization as the unit of analysis to study the actions of large firms (Wiklund, 1998). As Wiklund points out dual focus on both the individual and the organization is needed when researching small firms.
The main research question of this study is related to firm growth. Thus the focus has to be upon firm level. Managers are considered as representing the general mindset of their firms, and selected to represent the core strategic decision making of the firm. All data collected are related to firms in the analysis, not to individuals. Still, some variable constructs could be understood in both levels of analysis, as the one objective of the study is to find how firm level actions and motives of managers interlay. In the cases where multiple managers from one firm were interviewed, the results from their answers were averaged to form a one measure of the value of the variable in their firm. This decision to focus upon firm level is in line with the views of social constructionism. According to the view, organizations are meaning systems that have cognitive systems and memories. The mental models of the managers working in organization reflect these systems, and thus individual level models and organizational level models are interwoven.
94
4.3 Statistical methods
The statistical analysis principles and discussion about the methods is mainly based on the guidance from Hair et al. (1998) and following the practices Maula (2001) was using in his work. In order to test hypotheses developed in the study, four main statistical methods were employed. Firstly, constructs were created. Confirmatory factor analysis was employed in testing the validity of the constructs that were based upon earlier research and not found through explanatory analysis. Term confirmatory analysis refers here to its traditional meaning of confirming that the set of items has a relationship that is predicted by a theory or previous analysis (DeVellis, 2003), not SEM based analysis. Explanatory factor analysis was employed to the strategic control constructs that are industry dependent and were not based on earlier research. Cronbach’s alpha was used for the same purpose for all the constructs. Secondly, multiple regression analysis was used in testing the paths between constructs. Thirdly, an application of the multiple regression analysis was used to test the mediation effects. Fourthly, structural equation modeling was employed to test simultaneously the paths in the integrated model. More detailed description of these common practices can be found in the abovementioned sources.
The variables used in regression models were mainly not the original, empirically observed ones, but rather a new, reduced set of variables was created to partially replace the set of original variables. The creation of averaged scales or composite measures is supported by both conceptual and empirical issues (Hair et al., 1998: 10). They state that the uses of multivariate indicators do not place a total reliance upon a single response, but instead, upon the average or typical response to a set of related responses. The several variables used all represent different facets of the composite measure. Factor analysis was the main method in defining the constructs.
Principal component analysis was used in the present study for extracting factors. Varimax rotation algorithm was used whenever a factor solution consisted of more than one factor. In the factor analysis of the present study, Kaiser (1960) criterion for eigenvalues was used to confirm that the number of factors which emerge from the data corresponds to the number of factors determined on the basis of theoretical grounds or explanatory work (Dunteman, 1989). Only such factors that had an eigenvalue over 1 were retained. As Peterson (2000) notes, different researchers apply different thresholds when determining whether a given factor loading is high or low. In this study, a guideline from Stevens (2002: 395) was followed. Only such factors that had loadings higher than 0.8 and three items, or higher than 0.6 and four items were retained. Items that had a loading of 0.4 or higher on were dropped from the factor component.
The need for factor analysis to define the exact components of constructs describing different strategic choice emerges from the nature of strategic decisions. Strategic group research suggests the effect of competitive strategies depends upon the specifics of industry context (Thomas &
95
Venkatraman, 1988). In each industry, in each point of time, strategic choices can be different and the constructs cannot be defined beforehand based upon previous studies from different context. The constructs must be defined case-by-case.
The suitability of selected single variable combinations found in factor analyses was analyzed by measuring Cronbach’s alpha on the combined scale. Only those scales that had alpha over 0.70 were included in the further analysis for study constructs (Nunnally, 1978; Netemeyer et. al., 2003) and over 0.50 for control constructs.
The main statistical method to test the hypotheses in this study was multiple linear regression analysis. The dependent variables used in this study were metric so the choice of method was straightforward (Hair et al., 1998).
In the regression analysis of the present study data transformations were used when analyses indicated nonlinear relationships. Logarithmic transformations were also used to normalize distributions. The presence of heteroscedasticity was also tested by using the Levane’s test for homogeneity of variance (Hair et al., 1998). It was found between growth orientation and the dummy variable telling that the company was located in Tampere. After heteroscedasticity was detected, the variable was dropped from further analysis. VIF (variance inflation factor) values were measured but problematic ones above 10 (Hair et al., 1998) were no detected. The most problematic was the relationship between the construct measuring manager’s previous experience and the control variable company age, but even their VIF values were below 3.3.
In the present study, the model, which explained turnover growth, had too many independent variables compared to the sample size (Hair et al., 1998). To test whether this mattered, the model was reduced by dropping the least important independent variables out of the model. The new model still produced the same significant relationship between independent and dependent variables.
In the line with some other recent studies (e.g. Maula, 2001; Zahra et al., 2000), the present study used multiple regression analysis with summated scales as the primary analytical method. However, the multiple regression analyses were supplemented with path analyses carried out using structural equation modeling in order to test all the hypotheses simultaneously, as well as to test that there are no other important paths in the model. Structural equation modeling is a multivariate method that can be used to examine a set of regression equations simultaneously (Bollen 1989). The discussion on structural equation modeling is based on Maula (2001).
When looking at the presented results in this study, one has to remember that research has shown that the techniques developed for assessing structural equation models have a confirmation bias (Hair et al., 1998: 590), The techniques tend to confirm that the model fits the data. Thus, if the proposed model has an acceptable fit by whatever criteria are applied, the researcher has not proved the proposed model. He has only confirmed that it is one of several possible acceptance
96
models. One has also to remember that the proposed model is by no means exhaustive, as discussed by Wiklund (1998: 54).
The practice in this study to employ structural equation modeling was nested models protocol (Loehlin, 1987:62-67). The fit and robustness of the hypothesized model is tested by comparing it to other alternative models. The Chi-squares of hypothesized model are compared to models that differ in the number of paths. A significant difference in Chi-square indicates that the more complex model provides a better fit with the data (Steiger et al., 1985: 254).
97
4.4 Reliability and validity analysis
In this dissertation, the reliability and validity of the results are given high attention. The hypotheses have been developed based upon received theories. Related earlier research has been used when developing measures. Statistical methods have been selected and employed only after ensuring that data fulfill their assumptions. The most reliable data sources available have been used, and some of the primary data collected in this research has been validated through external validation. In the following section, the various elements of reliability and validity are reviewed in more detail (Carmines & Zeller, 1979; Litwin, 1995; Nunnally, 1978; Venkatraman & Grant, 1986). A summary of the elements relevant for this study is presented in Table 4-5. How each of these elements has been taken into account in the research is discussed in the following sections.
Objective Elements
Reliability • Reliability of data sources • Reliability of measures
Validity • Face validity: construct conforms to common understanding of the concept
• Content validity: construct covers all relevant facets of the concept • Criterion-related validity: results are in consonance with theory and
previous results • Concurrent validity: measure is associated with previously validated
measure • Predictive validity: measure predicts another measure as predicted in
theory • Construct validity: construct theoretically reflects the phenomenon
under study • Convergent validity: different measures of the same construct
converge, or are highly correlated (Netemeyer, 2003) • Discriminant validity: constructs of the study are conceptually
distinct • Nomological validity: the extent to which a measure operates within
a set of theoretical constructs and their respective measures (Netemeyer, 2003)
Generalizability (external validity)
• Representativeness • Generalizability to other contexts
Table 4-4, Elements of reliability, validity, and generalizability (Maula, 2001: 128)
98
4.4.1 Reliability
Reliability refers to the extent to which the measurement results are due to effects that persist from sample to sample (e.g. Netemeyer et al., 2003). Reliable measurement values are close to their ”error-free” value. Two dimensions of reliability are explicitly discussed in the next chapters (1) reliability of empirical data, and (2) reliability of constructs. The discussion is based on Maula (2001).
Reliability of empirical data refers to the extent how reproducible the measurement is (Litwin, 1995: 6). In survey studies, repeated measures are not common. However, in the present study, the turnover figures of dependent variables have been measured directly in a survey, and then again obtained from public sources for the years 1996-2000, thus there it is possible to measure directly reliability. Due to the lack of available secondary data covering the other measures, the analyses of independent and mediating variables are primarily based on primary data collected from CEOs of technology-based new firms. Several steps were taken to ensure the reliability of the self-reported data. The steps were
• In the first seven company interviews, the questionnaire was presented to two respondents in order to determine whether huge differences exist between respondents within the same company. Responses from within the same company tended to be coherent so for the remaining 69 companies, a single-respondent method was used;
• In order to maximize the reliability of the data collected, they were based upon interviews with the key informants, primarily with CEOs or board chairmen. The data were collected in interviews from which it was possible to detect whether the informant was familiar with the subject and cases were dropped when the quality of the informant was in doubt. In one case, a company was dropped from the analysis, and even from the list of firms eligible for the study, because it was found that the firm, in reality, was not located in the regions under study;
• The questionnaire instrument was designed with five rounds of revisions. The questionnaire was tested with seven interviewees before the final data collection was conducted. Several interviews and the pre-testing of the questionnaire provided confidence that the respondents would not misunderstand the questions and that they would be have good understanding upon issues covered.
• Thanks to interviewing method, the quality of the data is good. There are no missing values in the data except even though two of the companies (2.6%) studied totally
99
dissimulated their acquirers during the research period. Therefore, it was impossible to get turnover information or an estimate on them for year 2000.
• The reliability of the data was improved by complementing the primary data from other sources and testing the reliability of a dependent variable. The correlation between the turnover obtained from the public Asiakastieto database and the responses in the survey was very high (r=.99, p<0.001).
The extent to which the measurement of the constructs can be considered as reliable is another aspect of reliability. Multi-item scales were used to measure most of the constructs (Spector, 1992). The main method used to examine the reliability of the constructs was measuring inter-item reliability of the constructs. All the constructs used in the analysis exceeded the value 0.70, except the segmentation strategy construct that was used as a control. It was accepted with its alpha value of 0.56. Therefore, all the multi-item constructs in this analysis appear to be reliable enough. The results of confirmatory factor analysis as well as Cronbach’s alphas of the constructs are reported in Chapter 6.2.
4.4.2 Validity
Validity refers to the extent a measurement instrument does what it is intended to do (Nunnally, 1978: 86). The discussion on validity is based on Maula (2001).
In the present study, previously validated measures have been used when possible in order to improve the validity of the study. In the following, the validity of the constructs is discussed in detail and divided into four dimensions: face validity, content validity, construct validity, and criterion related validity (Litwin, 1995; Nannally, 1978).
Face validity basically amounts to the belief that an instrument seems to correspond “common sense” without empirical evidence (Nunnally, 1978). It was ensured in several ways. Firstly, a literature analysis was carried out in order to understand the relevant concepts. Secondly, as far as possible, the constructs and measurement items were developed on the basis of previous research. Thirdly, the questionnaire was developed and pre-tested with CEOs in the target group as well as with academics. Fourthly, the data were collected in an interview setting, which made it possible to get direct comments on the questions used.
Content validity refers to the extent “to which an empirical measurement reflects a specific domain of content” (Carmines & Zeller, 1979: 20; Venkatraman & Grant, 1986). A construct should cover all relevant aspects of the concept. In this study, several methods were used to ensure and test content validity. First, literature reviews helped understand the phenomena and to
100
identify the most important facets of the constructs. The constructs were checked against discussions with entrepreneurs. Second, most of the constructs were operationalized using multiple measurement items. Third, the questionnaires were pre-tested.
Criterion validity consists of concurrent and predictive validity (Campbell & Stanley, 1963). There are some earlier validated measures in the study that can be used to determine the concurrent validity—how well the measure relates to other manifestations of the construct it is supposed to measure. For growth orientation, three of the measures had been validated by Autio et al. (2000). Fourth measure, resembling the one used by Davidsson (1989), Delmar (1996) and Wiklund & Shepherd (2003) correlated significantly with the three validated measures in the present study, indicating concurrent validity. Similarly measures of experience were adopted from previously validated constructs and correlated significantly in the present study providing further evidence of the concurrent validity.
Predictive validity refers to the extent the measure predicts another measure as predicted in theory. Predictive validity is demonstrated in well the results meet the hypotheses. Results from hypothesis testing are discussed in Chapter 6.
Construct validity refers to the extent to which an operationalization measures the concept it is intended to measure (Bagozzi et al., 1991). It has two dimensions, convergent validity and discriminate validity. Also criterion validity is often classified as a dimension of construct validity. Construct validity can be assessed employing confirmatory factor analysis (Bagozzi et al., 1991; Spector, 1992). In this study, confirmatory factor analysis was employed to confirm the unidimensionality of the multi-item constructs. Confirmatory factor analysis indicated that only one factor was represented in each set of items measuring a construct and that items measuring different constructs did not load on a common factor.
Convergent validity is the degree to which multiple attempts to measure the same concept are in agreement (Bagozzi et al., 1991; Venkatraman & Grant, 1986). Two or more measures of the same concept should correlate highly if they are valid measures of the concept (Bagozzi et al., 1991). In this study, two methods were used to ensure it. First, new constructs and measurement items were developed on the basis of theory and earlier related research. Second, confirmatory factor analysis was carried out. All the measurement items in a construct scale load higher than 0.60 on their primary factor, clearly exceeding the common threshold value of 0.50 (Hair et al., 1998: 111).
Discriminate validity is the degree to which measures of different constructs are distinct (Bagozzi et al., 1991; Venkatraman & Grant, 1986). If two or more concepts are unique, then valid measures of each should not correlate too highly (Bagozzi et al., 1991). In this study, two methods were used to ensure and test discriminate validity. First, new constructs and measurement items were developed based upon theory and earlier related research. Second,
101
confirmatory factor analysis was carried out. All the included measurement items loaded 0.40 or below on other factors than their primary factor. 0.40 is the commonly used threshold value acceptable. Furthermore, I also examined the possibility of common method variance (Avolio et al., 1991; Podsakoff & Organ, 1986) using Harman’s single factor test as suggested by Podsakoff & Organ (1986). The multitrait-multimethod matrix (Campbell & Fiske, 1959) was not used these two other methods did not imply any problems. As explained in Section 4.2.1, no threat to the validity of the study was detected.
Nomological validity evaluates the extent to which the measure fits “lawfully” into a network of relationships or a nomological network (Cronbach & Meehl, 1955). Structural equation modeling (SEM) and regression-based methods are the common ways to provide evidence on nomological validity (Netemeyer et al., 2003). As the objective of the study was not to establish new constructs, separate models were not built to evaluate nomological validity of the constructs, but the aspect is embedded in the other regression and SEM modeling of the study.
4.4.3 Generalizability
The representativeness and the generalizability of the study to other contexts are discussed in detail in Chapter 7.4—Limitations.
102
5 Measures
5.1 Characteristics of the regions under study
The companies that were interviewed in the empirical part of the study were selected from three Finnish sub-regions1: Helsinki, Tampere and Oulu.
The Helsinki sub-region has, by far, the largest population in Finland. The Tampere sub-region is, by population, the second largest region in Finland. The Oulu sub-region is, by population, the largest region in Northern Finland. These three regions represent the three most important hi-technology concentrations in Finland. The numbers of inhabitants of regions are presented in Table 5-1.
Region Inhabitants 1997 Inhabitants 2000
Helsinki Sub-Region 1 139 644 1 184 845
Tampere Sub-Region 287 357 297 655
Oulu Sub-Region 165 580 188 953
Table 5-1, Number of inhabitants in regions under study in the end of 1997 and 2000 (Statistical
Yearbook of Finland, 2000 and 2002)
The Helsinki sub-region has traditionally been the center of business and international trade in Finland. The largest Finnish software companies have their headquarters and major operations there, as do the subsidiaries of global IT companies.
The largest technology enclave in Finland, the Otaniemi Technopolis is located in the Helsinki Metropolitan region. It is, by many standards, the most important concentration of technology-
1 For most part of the analyses in this chapter, the geographical units handled are sub-regions. They are the smallest areas, from which public statistical information is available. Some data are not available at sub-regional level, but for larger regions. Helsinki sub-region belongs to Uusimaa region, Tampere sub-region belongs to Pirkanmaa region, and Oulu sub-region belongs to North Ostrobothnia region.
103
based research and education in Finland. Approximately half of the public investment in technology-based research in Finland has been channeled to the Otaniemi area (Autio, 1995).
In the Oulu sub-region there has been a concentration upon small fast growing technology based firms. Ahokangas and Räsänen found that, in the Oulu sub-region, the percentage of fast growing electronics industry firms between 1992 and 1995 was clearly higher than the Scandinavian average. (Ahokangas & Räsänen, 1999). Of the 40 Oulu sub-region electronics studied, 55 percent grew fast during that period and 15 percent achieved moderate turnover growth. During the same period, of the 58 randomly selected Nordic electronics firms, only 3.4 percent grew fast and 32.8 percent achieved moderate turnover growth.
The rapid growth of Oulu sub-region electronics firms during 1992-1995 may, for a great part, be the result of subcontracting for Nokia Corporation which grew fast in the Oulu sub-region during that time. The growth rate has decreased since 1995. In 1992-1995, small technology based firms hired 1,542 new employees constituting about 67 percent of new employment by technology-based firms in the region. During 1995-1998, the number of entries of new technology based firms decreased, but 1,867 new jobs were created within the region (Oulu Business Review, 1995 and 1998). Still, as a result of this phenomenon, there were plenty of reference firms and individuals in the Oulu sub-region during the mid- and late 1990s that had successfully managed their technology based companies.
In the data, Tampere represents the most common region in the Finland. Still, Tampere is more advanced technologically than rest of the Finland. In Tampere is also the University of Technology as well as the large and fast growing presence of Nokia.
As can be seen from Table 5-2, the three regions under study are clearly more technology intensive than the rest of the country. It is worth noting that the Pirkanmaa region, where the Tampere sub-region is located, was less developed than the two other regions under study during the mid-1990s and started to reach them only in the late 1990s.
Region 1995 (€) 1998 (€) 2000 (€)
Uusimaa Region (Helsinki) 899 1186 1510
Pirkanmaa Region (Tampere) 436 988 1404
North Ostrobothnia Region (Oulu) 531 1047 1388
Finland as a whole 424 650 854
Table 5-2, Expenditure in R&D per capita (Statistical Yearbook of Finland, 2000 and 2002)
104
Also the rate of new company establishment is far higher in the three regions under study than in the other parts of Finland.
Region 1995 1996 1997 1998 (estimate)
Helsinki Sub-Region 8.31 7.33 6.78 6.14
Tampere Sub-Region 7.13 6.01 5.57 5.24
Oulun Sub-Region 10.13 8.70 8.26 7.36
Finland as a whole 5.93 5.23 4.87 4.54
Table 5-3, The new companies founded per 1000 inhabitants (Statistics Finland, 2002)
From the data, it can be seen that the three regions under study have general technology activity that is clearly higher than the rest of the Finland, as well as the general activity to found companies. All three regions have fast increasing large high-technology companies. In particular, Nokia and its sub-contractor network have benefited from universities which provide engineering education for IT professions. The general economic environment, excluding the size of the region, is similar for each region. The differences between the regions may be, for a great part, due to cultural differences.
The strength of regional culture in the Oulu sub-region may be stronger than in the two other regions thanks to a strong incubator center, the Oulu “Technology Village”. As can be seen from Table 5-4, the percentage of sample companies residing in the regional incubator centers is clearly higher in the Oulu sub-region than in the Helsinki or Tampere sub-regions.
Region Companies in sample residing in an incubator center
Percentage Companies in sample that have resided in the incubator center
Percentage
Helsinki 5 12.5% 13 32.5%
Tampere 5 27.8% 6 33.3%
Oulu 9 50% 12 66.7%
Table 5-4, Percentage of the companies studied of the region residing in an incubator center
105
5.2 Dependent variable
The dependent variable Firm Growth measures how successful a firm has been in pursuing growth. Turnover was selected as the variable to proxy growth because of its and related variables’ like sales or revenues sheer dominance as the dependent variable in entrepreneurial growth studies (Murphy et al, 1996). It has also been found that the sales figures which companies report themselves correlate strongly with turnover figures found from public sources (Brush & VanderWerf, 1992).
The growth in itself is a change process. This leads to some methodological problems concerning the modeling of it. In an ideal situation there would be full and detailed information on growth. The it would be easier to model size changes over a period of time. In this study, information concerning the studied firms is scarce, and growth is calculated from the size of the company at the moment of the cross-sectional interview compared with the size two years later. The growth rates, measured as present size minus previous size or present size as a percentage of previous size, are the prevalent measures in this case (e.g. Delmar, 1996). When a researcher introduces any of these mathematical equations for growth measurement, the researcher is actually modeling a specific growth pattern. Relative sales growth measures are likely to produce inflated results for small firms, and absolute sales growth measures are likely to produce inflated results for large firms. Regardless of which direct growth measurement model is used, certain assumptions regarding firm growth are made (Wiklund, 1998). Put another way, different scores often result in biased or unreliable error terms because the magnitude of the initial condition is related to the condition being examined (Cohen & Cohen, 1983).
In order to examine growth in this study, the researcher—following Fombrun and Gingsberg (1990) and Young, Smith, and Grimm (1996)—tests the effects of our independent variables upon the total sales in 2000 while controlling for the sales levels in 1998. This approach is more unbiased compared to measuring growth as the relative or absolute differences in sales over the period of 1998 - 2000. The problem with this method is that it assumes that growth takes place as one quantum leap, which appears unlikely from an empirical standpoint (Wiklund, 1998), but the practical implications of the problem, with this short of a timeframe, are small.
To check the robustness of the results, another measure of growth was also used. This was a construct, combining logarithms of relative and absolute growth figures of the companies, during 1998-2000. Because there are many orders of magnitude differences in the company turnover size and the growth rates between companies also vary largely, it is important to make sure that the type of growth measurement does not affect the analysis. Also therefore a confirmatory regression analysis and structural equation modeling was also conducted by using a
106
different growth construct than the basis method of 2000 turnover controlled by turnover 1998 as a dependent variable. Another construct of growth was built from two measures. First, relational growth was measured by dividing turnover from 1998 by turnover from 1996 and taking the logarithm from the ratio. Second, absolute growth was measured by reducing turnover from year 1996 from turnover from 1998 and taking a logarithm from this.
The turnover size of the companies under study can be found in Table 5-5.
Turnover, Millions of FIM Number of firms in 1998 Number of firms in 2000
0.00-0.99 12 6
1.00-1.99 2 6
2.00-3.99 13 12
4.00-7.99 9 12
8.00-15.9 22 13
16.0-29.9 7 8
30.0-59.9 4 9
60.0-119 6 1
120-239 1 4
240 or over 0 3
Total 76 74
Mean Median Std. Dev. Min. Max N
1998 16.5 8.11 27.2 .05 152 76
2000 35.1 8.14 71.6 .00 359 74
Table 5-5, Turnover of the companies under study
The table shows that on average, the companies under study have grown fast, 113 percent in two years, but, interestingly, the median has not grown. The large companies have been growing fast, as well as the smallest ones, but the median companies have been more stable.
107
5.3 Mediating variable
The mediating variable construct, Growth orientation, is a measure of the willingness to achieve growth by the firm’s management. What are actually measured in this variable construct are attitudes, not actual behavior. An attitude is defined as the valuation of an object or a concept; i.e. to what extent an object or concept is judged to be good or bad (Eagly & Chaiken, 1993). There has been much controversy concerning the importance of attitudes in predicting behavior. However, resent research has shown that attitudes are able to predict behavior, if certain conditions are met (Kim & Hunter, 1993). Attitudes have been found to be moderately strong predictors of goal directed behavior (r=0.79) between attitude and behavior when methodological artifacts were removed (Doll & Ajzen, 1992). The probability of a significant relationship increases when attitudinal and behavioral measures correspond with respect to action, target, context, and time. For example, the relationship is expected to be weak if there has been a substantial time interval between the measurement of attitude and the behavioral act. The relationship is also expected to be weak if a single act in a specific context is measured, instead of a range of action with no specific context (e.g. growing the business). As the attitudes measured relate directly to action and the target and measurement is as close to the behavioral act, it is expected that the relationship is not weak in this study.
The growth orientation is measured in this study by asking four questions. The first three questions have been used in previous literature together to measure growth orientation and the fourth question has been used separately to measure a similar variable. In this study, four variables are combined into one variable construct. The measures are presented in Table 5-6.
108
1. Respondent indicates the importance of growth on a 7-point Liket-type scale (Doll & Ajzen, 1992; Brown et al., 2001):
• Growing as rapidly as possible is the most important goal of this venture
2. Respondent indicates the importance of growth on a 7-point Liket-type scale (Doll & Ajzen, 1992; modified from Brown et al., 2001):
• Aiming for rapid growth is not what drives this venture (reverse scale)
3. Respondent distributes 100 points across five goals of potential importance to high-tech SMEs (Autio et al. 2000):
• Maximizing profitability
• Maximizing sales growth
• Maximizing technical superiority
• Maximizing the value of the firm for eventual acquisition
• Maximizing stability and longevity of the firm
The points given to maximizing sales growth are used as third measure.
4. The logarithm of relative change from the present to turnover size objective in three years is then used as the fourth measure (Davidsson,1989; Delmar, 1996; Wiklund & Shepherd, 2003)
Table 5-6, Measures on growth orientation construct
Growth orientation is measured with three different methods in order to minimize common method problems that inevitably occur when a cross-sectional questionnaire is used. This is the case where different constructs are tested with questions having similar phrases.
The measured goals of companies under study can be found in Table 5-7.
Longevity of the venture 26.3 25.0 14.6 .00 60.0 76
Total 100.0
Table 5-7, Goals of the companies under study
All the goals ranked at the same order of magnitude. In the venture, the rank of longevity was higher than other objectives. This might be partially due to there being three objectives that aim at maximizing longevity as an objective reflects the willingness to have stability.
Table 5-8 presents the turnover objectives for year 2001 for the companies under study.
110
Turnover, Millions of FIM
Realized turnover 1998, # of firms
Median realized turnover 1998, MFIM
Median realized turnover 2000, MFIM
Median realized turnover 2001, MFIM
Median turnover objective for 2001, MFIM
0.00-0.99 12 0.47 0.90 0.92 10.0
1.00-1.99 2 1.29 3.04 2.93 11.0
2.00-3.99 12 2.57 3.65 3.57 12.0
4.00-7.99 10 4.62 5.96 5.74 10.0
8.00-15.9 22 10.6 14.0 11.9 22.7
16.0-29.9 8 18.4 41.8 57.8 67.5
30.0-59.9 3 34.1 34.2 42.1 65.0
60.0-119 6 83.3 148 194.2 220
120-239 1 152 359 362 400
240 or over 0 - - - -
Mean Median Std. Dev. Min. Max N
1998 realized 16.5 8.11 27.2 .05 152 76
2000 realized 35.1 8.14 71.6 .00 359 74
2001 realized 46.1 8.64 93.3 .00 488 71
2001 objective 55.0 20.0 110 .50 780 76
Table 5-8, Turnover objectives of the companies under study
As can be seen from the average yearly growth rate objectives for firms 1998-2001 and realized growth between 1998 and 2000, the growth objectives were clearly higher than the achieved growth, even though the realized growth was rather fast amongst the studied companies.
111
5.4 Independent variables
In this study, the referents; owners of the company; previous growth of the company and managers and previous experience of the managers are handled as independent variables.
To measure which reference models the manager has, the direct method (See e.g. Ambrose & Kulik, 1988) is used. To find out which reference models the management has, the following procedure was used:
Which managers in the industry the management uses as role models: To distinguish between those with whom managers can have social ties, from those with whom managers are not usually having social ties, we asked respondents to give both a domestic and a foreign referent. The domestic referent was considered as the one being socially linked and whereas the foreigner was not.
Further, the perceived growth orientation of the referents was measured by asking the respondent why he uses this person as a referent. 100 points between the same objectives as with measuring growth orientation with the similar question were divided as the reason to have this referent. The points given to indicate the growth orientation of the reference model individuals are then taken as the measure of the referent growth orientation. No attempt was made to build a multi-item constructs to measure a latent variable. The intention was to recognize potential measures that could be directly asked from respondents. As these measures were not intended to non-directly observable nor abstract per se, the reasons when a researcher has to develop a construct were not present (Netemeyer et al., 2003).
Table 5-9 presents descriptive statistics about these two measures that were used directly as independent variables in regression analysis.
Mean Median Std. Dev. Min. Max N
1. Growth orientation of
Finnish referent
33.2% 27.5% 32.7% 0 100% 76
2. Growth orientation of
foreign referent
25.0% 0% 34.3% 0 100% 76
Table 5-9, Measures on the growth orientation of manager’s referent person
112
It is interesting to note that over half of the managers did not regard the use of their main foreign referent person as a growth example. The foreign referents were more often used as an example of technology management. Already this suggests that the socially distant referents are not regarded as examples when considering the practical business objectives of their own company.
Whether the firm has outside owners was asked directly from the respondents. It was also checked from the Finnish public company database, Asiakastieto. Whether the firm had outside owners or not was used as a dummy variable to catch only the social networking based reference effect and to minimize other effects outside ownership might have. Altogether, there were 39 companies that had outside owners.
Management’s previous work and industry experience indicates whether some assignments have an impact on mental models (Nahapiet & Ghoshal, 1998). The following (Table 5-10) measures were used to map different types of work experience (Cooper et al., 1994; McGee et al., 1995). The answers were given in years (Hambrick et al., 1993).
Mean Median Std. Dev. Min. Max N
1. Years in companies providing similar services or products
12.6 11 7.54 0 36 76
2. Years in companies having same customers
11.6 11 6.72 1 31 76
3. Years as manager 12.7 11 6.95 2 32 76
Table 5-10, Measures on manager’s previous experience and their descriptive statistics
The growth experience of the company management under study measures the exposure to growth with the management’s mental models. The construct consists of four different measures, three of them for measuring company growth, and one for management experience. They are presented in Table 5-11.
113
Mean Median
Std. Dev. Min. Max N
1. Turnover of the manager’s current company from 1998 divided by average turnover from 1996 and 1997 (logarithmic scale)
2.09 1.92 0.788 -0.25 36 76
2. Turnover of the manager’s current company from 1998 reduced by average turnover from 1996 and 1997 (logarithmic scale)
0.604 0.480 0.606 -0.55 31 76
3. The years between 1996 and 1998 that company has grown fast. Over 20 percent (Eisenhardt & , 2001) annual growth was considered fast.
2.18 1 0.691 0 2 76
4. The experience the responding manager had from managing fast growing companies, experience measured in years and over 20 percent growth considered as fast.
3.33 2 3.56 0 18 76
Table 5-11, Measures to construct management/company fast growth experience
Besides reference and experience variables, a third group of variables, handled mainly as independent variables in this study, are the variables describing the general regional cultural environment of the firm. As each region has its specific culture, and there are not well-established measures to quantify the different dimensions of regional business culture characteristics, dummy variables telling in which region the companies under study were residing were used as variables describing the effect of regional culture. As there are no hypothesis related to regional culture in the main models of the study used for analyzing growth and growth orientation, these dummy variables are used only as control variables in regression analysis. Their effect on other independent variables is studied separately.
114
5.5 Control variables
The size of the local markets has been found to relate to the growth of small firms; the logarithm of the total size of the population is correlated with small firm growth. The population differences between the three regions under study are significant. Therefore the logarithm for the total size of the region’s population in which the company is operating, is used as a control variable when analyzing growth (Davidsson et al., 1996).
It appears that, over time, the mental models executives use during strategic decision making become solidified through use (Hambrick et al., 1993). Besides the work experience of the respondent, his/her age is related to the amount of mental modes. Age has been used as an independent variable in studies concerning the cognitive development of mental understandings (Tyler & Steensma, 1998). Age is highly correlated with total work experience, organizational tenure and the age of the organization. This correlation makes it extremely difficult to determine whether the relationship between age and the choices of executives is dependent upon other factors. Therefore age is used as a control variable to see whether industry experience and the age of the company are related to growth orientation independent of the age effect.
According to Morris and Venkatesh (2000), the age of a person can be a key factor influencing planned behavior. It can have a direct effect upon behavior, but as well be linked, or mediated, through attitudes, social norms, or self-efficacy. In their empirical study of age’s influence upon technology usage it was determined that age can affect both behavior as well as factors affecting intended behavior, such as growth orientation. Therefore age of the respondent must be used as a controlling variable in studies on motivation in organizational settings.
The limitations of information-processing capability have been found to not only be limited to individuals, but also to organizations. Corner et al. (1994) argue that organizations operate along essentially the same principles. As discussed in Chapter 2.1 central to the entire process is some sort of group knowledge structure, by which a common frame of interpretation becomes domination. Emergent frames are constructed in an ad hoc fashion to deal with a novel problem or issue. This takes time and cognitive energy, but once established, there is a strong incentive to keep using it. It may then be used automatically when interpreting strategic information whether it is appropriate or not. In the case of top management, a team will have to unlearn a frame before a new one can be constructed. Therefore age of the company was used as a control variable.
To control the potential effects of different strategic choices made by management, a group of variables describing company business area selections were collected by a structured interview.
115
Before the interviews, these variables were not grouped, but instead an exploratory factor analysis was used to recognize the constructs. The variables included strength of concentration, segementation strategy, and the growth of a selected industry segment.
The widely held belief field in the Finnish software industry is that product businesses are the key to fast growth (Autere el al., 1999). The same view is dominant in the Indian software business (Banerjee, 2003). Finnish (and presumably Indian) software product companies, trying to increase their product sales of products are prone to have management resources as a limiting factor because there is not much accumulated experience in Finnish companies regarding how to run such a business successfully. To be successful in running a product based business, the company must concentrate upon allocating as much of its managerial resources as possible to this strategy. This also requires that the time not be spent upon growth limiting activities such as software projects. As a strategic choice, this means that the company must concentrate upon one area where its management can utilize as much of their cognitive abilities as possible in one business. If the software product company concentrates upon one cognitively defined business area, it is assumed that the company grows faster than companies having many business areas.
Banerjee (2003) found four indicators that could be used to operationalize characteristics of software companies. These indicators were competencies in product, project/services, technology, and strategy. Of these, product and project compentency measures offer a foundation for operationalization concentration on supposed growth business (products) strategy in this study:
o Ratings given to “earning from new projects more than 80% of total earning excluding earning from own products”;
o Ratings given to “one should undertake the overall project, not a part of it”;
116
o Ratings given to “projects are services from which information service products can be innovated”;
o Ratings given to “offering system and technical consultancy, technical development services”;
o Ratings given to “offering business and strategic consultancy”.
If the distinction is made between concentration and segmentation strategies as suggested in Chapter 2.4.3, the direction in the relationship between the second strategic control variable, strength of segmentation strategy, and growth in a fast growing industry, becomes clear. The more focused a company is upon one segment of a business, the less environmental, and internal resources, it dedicates to pursue growth outside its niche. If the relationship is controlled for segment growth, the highly segmented strategy leads to lower growth.
The assumption behind the third potential strategy construct, selection of a fast growth industry, leading to growth originates from theories on the effect of environment on companies. Companies that have a growing industry environment find it easier to grow. Vesper (1990) suggested that the growth of an industry as a whole plays a large role in determining growth patterns of new start-ups in that industry. Rapid industry growth also helps incumbents to maintain their performance despite the entry of new firms and it enables longer-term contracts with customers and suppliers (Porter, 1980).
There are many empirical studies in which demand munificence has been found to be one of the key explanations for the high performance of new, technology-based firms (Cooper et al., 1986). Evidence shows that new ventures entering growing markets are more successful (Sandberg & Hofer, 1987). Young firms typically perform better in growth stage markets than in emerging or mature stage markets. In their study of 17 venture-capitalist-backed new ventures, Sandberg and Hofer (1987) found that those ventures performed better when they operated in industries that were in development or in the growth stages of evolution.
A dominant view is that emerging industries offer more growth opportunities than mature industries. Still, the concept of industry evolution has its limitations (Low & Abrahamson, 1997). Some industries never take off; others rise and fall precipitously. Even for those industries that follow the pattern, there is wide variation in the shape of the S-curve. Some industries may continue to grow for years, whereas others plateau quickly. This variation limits the predictive value of the S-curve model. Although the overall pattern holds, in any given circumstance it is hard to be sure where to position a specific industry on the evolutionary curve, especially when it is in an emergent or fast growing stage.
There also exists empirical research that questions what effect industry segment growth has on firm growth. Acs and Audretsch (1992) found no relationship existing between industry growth
117
and small-firm growth, when growth was measured as the value of shipments. Kunkel and Hofer (1993) found that new ventures performed better when they entered stable markets instead of rapidly growing markets. The study concluded that market growth is not a necessary precondition for firm growth, and that new venture opportunities can also be found in industries other than in rapidly growing ones.
Cooney and O’Driscoll (1999) did not find significant differences in the growth segment selection strategy between high-growth companies and non-high-growth companies; neither in America nor in Ireland. As the matured, the high-growth American companies tended to have less impetus in high growth segments than non-high-growth companies. This can be attributed to the fact that the whole segment has matured.
The selection of a sub-industry in which to operate is one strategic choice obviously related to growth orientation. Because the absolute objective measurement of the industry development stage is difficult, it is wiser, for the purposes of this study, to rely on the subjective view of management in the development phase. The subjective view describes the choices management thinks it has made. Thus growth intensity measures of the industry segment selected are based upon the subjective views of management.
The fourth and fifth potential strategy construct related to growth emerges from content or generic strategy research. Maidique & Patch (1982) base their classification of broad strategies found in high-technology industries on the choices firms make in their technology policy. The dimensions they analyze are: selection, specialization, and the embodiment of technologies the firm invests in; the level of competence in understanding and applying the technology; the sources of technology; the R&D investment level; the timing of entry into in the product life cycle; and the R&D organization and policies. They do not consider their broad strategic types to be mutually exclusive or collectively exhaustive. A wide spectrum of other strategies is logically possible and potentially effective.
The strategies Maidique & Patch define are (1982: 239-242):
• The first mover, or first-to-market strategy, attempts to introduce a product to the market before the competition does so. It provides the advantages of a temporary monopoly. Timing of entry is during the early product life cycle. The organization`s strategy emphasizes flexibility over efficiency.
• The low-cost producer, or cost-minimization strategy, achieves a relative cost advantage over competitors through economies of scale in manufacturing and distribution, through process and product design modifications to reduce costs, and through overhead minimization and operating-cost control. Timing of entry is during the early growth stage. The organization`s strategy combines elements of flexibility and efficiency.
118
• The second-mover, or fast follower, strategy involves quick imitation of innovations pioneered by a competitor. The emphasis is generally on attracting customers away from the technical innovator. Timing of entry is during late growth or early maturity. The organization`s strategy emphasizes efficiency and hierarchical control.
• The niche strategy focuses on serving small pockets of customers with special applications of basic technology. Timing of entry is during the growth stage. The organization`s strategy emphasizes flexibility and control required in serving different customer’s requirements.
Miles and Snow (1978) presented a typology that considers strategy relating a firm to its chosen markets, and, as such resembles Maidique & Patch typologies. Boeker tested the applicability of the previously presented typologies as well as third so called Porter (1985) typology in semiconductor industry. For this testing, he found the Maidique & Patch typology to have the greatest content validity. Based on this result, Boeker (1989) recommends using the Maidique and Patch typology in high-technology industries.
The technology and product life cycle based analysis of Maidique and Patch implies that cost-leadership or cost minimization strategy is feasible for those companies entering the markets in late growth or maturity stage when the institutional growth of the industry is slower than before. So to analyze the effect of the cost leadership strategy on growth, the perceived life cycle of the industry should be controlled (Maidique & Patch, 1982); as is done in this study. Cost leadership strategy leads to growth in new and growing industries, because in most cases, cost leadership is the result of high volumes. To achieve cost leadership, a firm has to grow. Innovation, or first mover, strategy is feasible when a company enters new or emerging markets.
The summary of control variables supposedly affecting growth and growth orientation resulting from discussion above are presented in Table 5-12.
Measure
1. Age of the company (Corner et al. 1994)
2. Age of the manager (Morris and Venkatesh, 2000)
3. Strategy of the company
3a. Strength of concentration strategy
In this study, a original, industry specific measurement scale was developed for the
119
concentration strategy variable construct:
I The companies were divided by researchers into two groups of roughly the same size: those whose business was mainly in the area of enterprise systems and those whose business was mainly selling standardized mass-products. This variable is used as a dummy.
II Percentage of software engineers not bound to specific customer project
III Number of separate business areas
IV Weight of product business compared to project, tailoring and consultation business in a cognitive map (Porac et al., 1995; Hodginson & Johnson, 1994)
3b.
Strength of segmentation strategy
I To what degree do each of the following four descriptions fit your organization currently? Show their relative importance by allocating shares of 100% of your effort:
• Points in given to the choice: Rather than attempting to serve the entire market, focus on serving small pockets of demand with special application of the basic technology
II Likert-scale question: Our sub-industry is highly segmented
3c. The development stage of the industry is measured by following likert-style questions
I Does the company perceive that it operates in a growth industry segment (Cooney & O’Driscoll, 1999)?
II Importance of OEM sales. This question assumes that in industries where the technologies have not yet matured, technology is first sold through OEM channels because small markets do not give enough volume for building their own sales networks and many times technologies have not matured to the stage where independent sales channels could sell them.
III Perceived importance of innovativeness in the markets the firm is selling its products. The question tests the conceptual marketplace input to the strategy.
3d. Strength of cost leadership strategy. Scale is proposed by Boeker (1989)
I Respondents share 100 points between different generic strategic objectives. To what degree do each of the following four descriptions fit your organization currently? Show their relative importance by allocating shares of 100% of your effort:
• Points given to the following choice: Cost leadership
120
3e. Strength of innovation strategy. Scale is proposed by Boeker (1989)
I Respondents share 100 points between different generic strategic objectives. To what degree do each of the following four descriptions fit your organization currently? Show their relative importance by allocating shares of 100% of your effort:
• Points in given to the following choice: Aim to get the product to market before competition. We are the first to introduce new products or major innovations
• Points in negative given to the choice: Rather than attempting to serve the entire market, focus on serving small pockets of demand with special application of the basic technology
Table 5-12, Control variables used in the study
121
6 Data and results
6.1 Factor analysis
6.1.1 Experience constructs
There are two different experience variable constructs used in this study. The first is a construct describing how much experience a manager has had from a similar business. It is calculated as their years of tenure in the current company plus their prior experience. The construct is supposed to consist of three different experience measures.
• Experience from the software product industry;
• Experience with being a manager in general;
• Experience in working with the same customer base.
The second construct measures the experience the company management has with growth. The construct is supposed to consist of four different measures, three of them measuring company growth experience and the fourth measures a specific respondent. The measures are:
• The number of years the respondent has in experiencing a growth rate of more than a 20 percent before joining the current company. To this number is added the tenure of the manager in years in the current company, if the company is a growth company. The current company is categorized as a growth company during 1995 - 1998, if its average turnover growth during 1996 -1998 was over 20 percent.
• Turnover of the manager’s current company from 1998 divided by turnover from 1996 (logarithmic scale)
• Turnover of the manager’s current company from 1998 reduced by turnover from 1996 (logarithmic scale)
• The years between 1996 and 1998 that the company grew fast. Over 20 percent (Eisenhardt & Schoonhoven, 1990) annual growth was considered fast.
The confirmatory factor analysis of these two constructs is done together, because there is a risk of there being a common methodology problem or that measures for both constructs would be too closely correlated. Factor analysis for the four variables can be seen in Table 6-1. The scales used in the analysis are logarithmic.
122
Variable Factor 1 loading Factor 2 loading
Experience from the software product industry 0.85
Table 6-1, Factor analysis with experience variables divided into two separate components
In the factors studied meet the eigenvalue criteria presented in Chapter 4. They have also no problem with the criteria for loadings. Only items with factor loadings of 0.60 or higher on the primary four-item factor or 0.80 or higher on the primary three-item factor, and loadings of 0.40 or lower on any other factor, are retained. Thus, the results show that components load the expected factors with all the loading falling in the admissible range. Thus the constructs pass the factor analysis test. The independent constructs, experience in general and growth experience, differ sufficiently from each other.
Because component measures for the experience in general construct are all measured by the same type of questions, a further factor analysis between the original (non logarithmic) measures is conducted in order to verify their common loadings are not due to a common methodology problem. The measure “Years as a manager in growth company” is measured the same way as the general experience construct. Thus, the same factor should be loaded if there is a severe common methodology problem; especially when measures are not logarithmic. The results can be seen in Table 6-2.
123
Variable Factor 1 loading
Factor 2 loading
Experience from the software product industry 0.88
Experience from being a manager in general 0.86 0.34
Experience in working with the same customer base 0.90
Years as manager in growth company 0.99
Eigenvalue 2.37 1,04
Varimax rotated loadings >0.2
Table 6-2, Results from factor analysis of variables measuring experience years
As can be seen from the results, the measures load to different factors as expected and they meet the criteria presented in Chapter 4.
6.1.2 Growth orientation construct
The growth orientation construct should consist of four components. The first is a measure of the management expectation of future growth: expected future (2001) turnover divided by current (1998) turnover. Logarithms of the measure are used to normalize the scale. The next two measures are likert-scaled questions measuring the strength objective in management priorities. The fourth measure is a question where management must provide the growth objective a weight against other planning level objectives: profitability, valuation, longevity and technological leadership. The results of the confirmatory factor analysis are presented in Table 6-3.
124
Factor 2 loading
LN of ratio of growth objective in 2001 compared to revenues in 1998 0.74
Likert-scale question: Growth is not what drives this venture -0.82
Likert-scale: Growth is the most important objective of this venture 0.85
Percentage of points given to growth in question where the respondent gave 100 points between: growth, profitability, stability and technological leadership
0.75
Eigenvalue 2.52
Varimax rotated loadings >0.2.
Table 6-3, Factor analysis with experience variables divided into two separate components
Only one factor emerges with an eigenvalue over 1.0 and all the components of the construct load the same factor with loadings over 0.6. Thus the growth orientation construct passes this test.
6.1.3 Strategic level control factor constructs
The factor analysis of strategic level measures is an explanatory factor analysis of potential components because the relationship between the components is industry and situation specific. To the factor analysis is fed ten components that potentially load different factors describing which strategy and sub-industry the company has selected. The potential components are presented in chapter 5.5. The results can be seen in Table 6-4.
125
Variable Factor 1 loading
Factor 2 loading
Factor 3 loading
Factor 4 loading
Importance of project business 0.83 0.25
Ln Percentage of software engineers in project business
0.78 -0.21
Ln Number of separate business areas 0.73 -0.21
Has the company selected mass-market or an ERP business
-0.81
Percentage points given for segmentation strategy 0.88
Perceived segmentation rate of own market area 0.73
Percentage points given for innovator strategy -0.52 0.76
Percentage points given for cost-leadership strategy
-0.35 -0.88
Perceived importance of innovativeness in own markets
0.78
Perceived maturity of own markets 0.32 -0.72
Eigenvalue 2.85 1.76 1.42 1.17
Varimax rotated loadings >0.2
Table 6-4, Results from factor analysis of strategic level variables
Only such items are retained that have a loading higher than 0.6 on the primary factor, and 0.4 or lower on any other factor. For this stage, the number of items is not considered relevant, as some items will be removed in further analysis anyhow. It seems that the measure suggested by Boeker (1989) to measure innovativeness strategy loads more than one factor. Explanatory factor analysis technique recommendations suggest that such components must be left out and another round of analysis needs to be run. The second round of analysis produces results presented in Table 6-5.
126
Variable Factor 1 loading
Factor 2 loading
Factor 3 loading
Importance of project business 0.85 -0.22
Ln Percentage of software engineers in project business 0.81 0.20
Ln Number of separate business areas 0.70
Has the company selected mass-market or an ERP business
-0.81
Percentage points given for segmentation strategy 0.79
Perceived segmentation rate of own market area 0.73
Percentage points given for cost-leadership strategy -0.66
Perceived importance of innovativeness in own markets 0.85
Perceived maturity of own markets 0.30 0.62
Eigenvalue 2.71 1.66 1.21
Varimax rotated loadings >0.2
Table 6-5, Results from factor analysis of strategic level variables
One good, and two borderline construct candidates emerge for further analysis. The first good construct consists of variables intended to test how concentrated the company is in its key product business areas. It will be called “concentration construct” in the further analysis. The second borderline factor consists of variables intended to measure how much the company will focus upon specific market segments. It will be called “segmentation construct” in further analysis. It appears that cost, or rather volume leadership, is regarded as an opposite choice to segmentation. The third potential construct consists of variables meant to measure how mature the markets are in which the company has selected to operate. The third construct will be called the “emergent markets” construct. As it consists of only two items, it is not considered at this stage as a real factor, but nevertheless, its reliability would be tested with Cronbach Alpha analysis to get full picture of its possibilities.
127
6.2 Reliability of variable constructs
Calculating the Cronbach Alpha measurement further verifies the internal validity of multi-component variable constructs that have been caused by explanatory or confirmatory factor analysis. If the components together have over a 0.7 Cronbach Alpha, they pass the test. The threshold in the test is 0.5-0.7. Constructs with Alpha values in this range are accepted in explanatory research
The results for the proposed variable construct that describe the previous general experience of the manger are presented in Table 6-6. As shown, the construct can be used in the further analysis.
Item Cronbach Alpha if item removed Cronbach Alpha
Experience
• Years in management
• Years in software business
• Years with same customers
0.79
0.83
0.77
0.86
Table 6-6, Reliability of variable construct experience
The results for the proposed variable construct that describes the previous growth experience of the company management under study are presented in Table 6-7. As shown, the construct can be used in the further analysis.
Item Cronbach Alpha if item removed
Cronbach Alpha
Growth Experience
• Years in management of a growth company
• Managing a growth company
• Relational growth 1996-1998
• Absolute growth 1996-1998
0.72
0.74
0.62
0.64
0.74
Table 6-7, Reliability of variable construct growth experience
128
The reliability test for the growth orientation variable construct is presented in Table 6-8. As shown from the alpha value over 0.7, the construct can be used in the further analysis.
Item Cronbach Alpha if item removed
Cronbach Alpha
Growth orientation • LN of ratio of growth objective in 2001 compared to revenues in 1998 • Likert-scale question: Growth is not what drives this venture • Likert-scale: Growth is the most important objective of this venture • Percentage of points given to growth in question where the respondent gave 100 points between: growth, profitability, stability and technological leadership
0.78 0.74 0.72 0.78
0.80
Table 6-8, Reliability of variable construct growth orientation
The Cronbach Alphas of proposed strategic and industry selection constructs found in factor analysis are presented in Table 6-9. All the variables having a load of more than 0.3 in the factor analysis are fed into the reliability analysis.
129
Item Cronbach Alpha if item removed
Cronbach Alpha
Focusing in one business • Mass product or ERP company • Number of separate business areas (reverse scale) • Percentage of software engineers concentrating on product development • Importance of product business compared to the project business (7 point likert scale)
0.75 0.81 0.75 0.74
0.81
Segmentation strategy • Expressed importance of segmentation • Perceived segmentation of own markets • Countervalue or expressed importance of cost leadership
0.44 0.42 0.57
0.55
Selecting emerging markets strategy • Perceived matureness of the markets (countervalue) • Perceived importance of innovativeness in the markets
- -
0.26
Table 6-9, Reliabilities of strategic choice variable constructs
It appears that the variables meant to measure the maturity of the markets do not constitute a construct in the reliability analysis. Therefore this construct candidate is left out from any further analysis. The construct to measure concentration has an alpha value over 0.7, so it will be used as a construct in further analysis. The alpha value for segmentation strategy is over 0.5 but below 0.7 so it will be used in the explorative analysis. High value in the segmentation strategy construct is assumed to lead to reduced growth. The high value is assumed to be a result of reduced growth intentions. Therefore, the values of the relationships are expected to be negative.
In this research setting, it was possible to obtain and estimate the reliability of the variable turnover. Turnover data was collected from public sources. The Asiakastieto database was used. It collects information from the public company registers of Finland. Turnover figures from the register were collected from 1996-2000. In 1999, the sample company turnover during 1996-1998 was also collected by survey. The reliability of the publicly source figures were then estimated by comparing these two turnover figures together. The results can be seen from Table 6-10.
130
Item Cronbach Alpha Pearson correlation
1996 0.997 0.994**
1997 0.997 0.993**
1998 0.999 0.998**
Table 6-10, Reliabilities of turnover variables
The measurement of turnover can be considered rather reliable. The turnover used for years 1996-1998 averages between the official and reported turnover.
In this study, two different ways of measuring growth were used. The first was to use absolute turnover of the year 2000 as dependent variable and controlling for the turnover in 1998. The previous paragraph describes reliability of the turnover variables used. The second way to measure growth was to use a variable construct of two different growth measures. The first measure was the relative growth of turnover (logarithmic) between 1998 and 2000. The second measure was the absolute growth of turnover (logarithmic) between 1998 and 2000. The Cronbach Alpha of this construct 0,87.
131
6.3 The regression models on growth orientation
The next step in the statistical analysis, after the factor and reliability analysis is to form multi-component constructs by standardizing and averaging the measurements of each of the components. First, the correlations between multi-component constructs and remaining one-component constructs are calculated together. The correlation matrix is used to verify that there exist odd or unexpected correlations as well as to confirm that independent variables do not have such strong correlations between each other, or with control variables. If such correlations are found, there is then a need to recombine them.
Nothing unexpected is present in the correlation table (Table 6-11), nor is there anything that requires further analysis except planned regression and SEM analysis.
132
Variable Mean
Standard deviation
1. 2. 3. 4. 5. 6. 7. 8. 9. 10. 11. 12. 13.
1. Turnover in 2000a 35.1 71.6 2. Turnover in 1998a 16.5 27.2 0.95** 3. Concentration strategy
a Logarithm, b mean and standard deviation for component “years as manager in growth business”, * Correlation is significant at the 0.05 level (2-tailed), ** Correlation is significant at the 0.01 level (2-tailed).
Table 6-11, Correlations between variables to be used in regression and SEM analysis
133
6.3.1 Regression models on growth orientation
The next step is to conduct a structural regression analysis on the dependent variable “growth orientation”. The purpose is to test the first series of hypotheses suggesting potential sources of growth orientation. In these models, the locations of firms in Helsinki and Oulu are used as dummies to control the effect of variables under study. The regression analysis on the dependent variable growth orientation is presented in Table 6-12.
Age of the respondent -0.17† -0.15† -0.17† -0.22* -0.16† -0.04 -0.13 -0.12 Age of the company -0.20* -0.20* -0.20* -0.14 -0.20* -0.13 -0.13 -0.10 Firm located in Oulu 0.20† 0.16† 0.21† 0.13 0.21† 0.19† 0.12 0.13 Firm located in Helsinki
The coefficients are presented as standardized beta weights
*** p ≤ .001, ** p ≤ .01, *p ≤ .05, † ≤ Ρ .10; one-tailed tests.
Table 6-12, Regression model of independent variables on growth orientation
134
The first model (Model 1.0) with control variables only hints that firms located in Tampere are less growth oriented than companies in the two other regions. It also indicates that the age of the respondent or company in general, tends to reduce growth orientation. In addition, it indicates that choosing to concentrate on the mass product business is strongly related to growth orientation.
The second model (Model 1.1) indicates that there is a strong positive relationship between how the main domestic referent person is perceived to act and their own plans. The relationship is statistically very significant even though the relationship is controlled for age of the respondent, and for the strategic and industry choices. The third model (Model 1.2) indicates a similar relationship does not exist with a foreign referent as what exists between growth orientation and a domestic referent. This implies that the observed strong correlation effect of a socially linked referent is not the result of the common methodology for measuring growth orientation and the growth orientation of a domestic referent. It also suggests that referents consider birth to growth oriented mental models as significant. Growth orientation has not guided the selection of referents and how they are perceived. Still the direction of this relationship is not indisputable because the methods of selecting and perceiving socially linked and non-linked relationships may differ. Domestic referents are possibly selected and analyzed by subjective criteria. Selecting and analyzing socially more distant referents is more objective.
The fourth model (Model 1.3) indicates that outside owners have a significant positive impact upon growth orientation as expected.
The fifth model (Model 1.4) does not support the hypothesis it was meant to test. Previous growth experience does not increase growth orientation, but instead reduces it slightly. This does not necessarily tell that the basic reasoning behind the hypothesis is wrong. However, the inversely affecting forces may be as strong, or even stronger, than the relationship between the previous situation where specific learning and models were used in planning. The industry under study experienced a fast turbulent fast growth situation. It was difficult therefore for management to plan. It might have been a situation where some of the managers lacking growth experience saw the general need and trend of fast growth, but were then overestimating the importance of growth. The managers with more growth experience had more realistic plans. Another explanation is that the companies experiencing fast growth in previous years saw their growth stabilize whereas some of the companies expecting fast growth had been in a product development phase during previous years, and were, in 1998, only starting to roll out their products.
The sixth model (Model 1.5) indicates that previous experience almost has, statistically, a negative significant impact upon growth orientation. Even in a model that is controlled for the age of the respondent and the company, the impact and its relation are as probable. There may be forces that affect, to opposite direction to the basic mental model base relationship inversely between experience and growth orientation. This explains why the relationship is just barely statistically significant. For instance, managers may perceive themselves more competent to manage growth
135
than the less experienced. They may also be managing companies that have a better potential for growth.
Models that analyze combined effects of the independent variables shed more light on some of the relationships. In the seventh model (Model 1.T), with all the independents in the same model, any statistical significance from previous experience disappears, as does the significance of external ownership, whereas the relationship between domestic referent and growth orientation remains very significant. Even its strength though reduces. A domestic referent therefore thus partly mediates the effect of each other, or affects through the same mechanisms. For external ownership, this interrelationship is not a surprise, because in the original theoretical model (Figure 3-7), both referents and external owners are assumed to be affected through the same mediator; social norm. The models do not anticipate the interrelationship between previous experience and domestic referents. The Sobel test (e.g., Baron & David, 1986) presented Table 6-13 indicates that the mediating effects are not statistically significant even though the mediating effect of a Finnish referent upon previous experience is not very far from being significant.
Independent variables
B Standard error
t Tested mediation
Z (Sobel test of mediation)
p (2-tail)
Finnish referent controlled with external owners
0.007703 0.002 3.309 Finnish referent on external owners
0.894 0.371
Finnish referent controlled with previous experience
0.007717 0.002 3.248 Finnish referent on previous experience
1.390 0.165
External ownership controlled with Finnish referent
8.019 8.628 0.929
Previous experience controlled with Finnish referent
-17.522 11.392 -1.538
Table 6-13, Sobel test on domestic referent mediating the effects of previous experience and
external ownership
The last model (Model 1.6) is used to analyze whether previous general experience moderates the effect of growth experience. The model indicates that the moderating term is positive and almost statistically significant. Therefore, there is some moderating effect where the two independent variables directly affect one another, not inversely as was expected in the hypothesis. The previous
136
experience strengthens the negative effect of previous growth experience upon growth orientation. But neither of the original variables becomes statistically significant, and thus the moderating effect is not very strong.
6.3.2 Regional culture effects
To illustrate what differences the regional cultures may be creating, a selection of results from independent samples T-testing between companies are presented in Table 6-14.
Mean Std. dev Sig. (two tailed)
Growth orientation Helsinki
Oulu
Tampere
.17
.06
-.45
.86
.76
.48
He – Ou: .21
He – Ta: .005**
Ou – Ta: .023*
Domestic referent growth orientation Helsinki
Oulu
Tampere
41.7
28.5
19.0
34.4
29.7
26.9
He – Ou: .14
He – Ta: .009**
Ou – Ta: .32
Foreign referent growth orientation Helsinki
Oulu
Tampere
34.7
21.1
7.2
38
29.9
18.7
He – Ou: .19
He – Ta: .005**
Ou – Ta: .11
Outside owners Helsinki
Oulu
Tampere
.49
.78
.28
.51
.43
.46
He – Ou: .029*
He – Ta: .13
Ou – Ta: .002**
Previous experience Helsinki
Oulu
2.43
2.25
.569
.433
He – Ou: .20
He – Ta : .26
Tampere 2.61 .538 Ou – Ta: .037*
Previous growth experience Helsinki
Oulu
Tampere
-.063
.272
-.132
.712
.433
.731
He – Ou: .14
He – Ta : .74
Ou – Ta: .12
Table 6-14, Differences between regions in ownership and referents
It is apparent from Table 6-14 that Helsinki rates highest in growth orientation level. Oulu and Helsinki seem to be close to each other and more growth oriented than Tampere companies. This
137
indicates that the so called “Oulu phenomenon” is less about the Oulu sub-region being totally different from other Finland, but rather more about the Oulu sub-region having a similar culture to the capital region. Oulu seems to aim at being on the same level of Helsinki. Thus, the Oulu sub-region business culture is more growth oriented than other non-capital regions from Finland. Oulu seems to be different than other Finnish regions, but, in reality, the largest high-technology cluster region in Finland, Helsinki, has the same characteristics as Oulu. Still, there is one distinguishing feature among Oulu sub-region companies. Outside ownership seems to be a variable through which Oulu companies differ from other companies.
To get a full understanding of the relationships between region and the other variables in the study, a set of regression models on growth orientation were built. The variables mediating the regional culture effect (those related to hypothesis H7 and H8) indicate the strongest effects in the growth orientation analysis to be outside owners and domestic referents. In theses models, company location dummies in Oulu and Helsinki are used as independent variables. The results are shown in Table 6-15.
The coefficients are presented as standardized beta weights
*** p ≤ .001, ** p ≤ .01, *p ≤ .05, † p ≤ .10; one-tailed tests.
Table 6-15, Regression model of region on growth orientation if domestic referent
The first two models (Model 2.1 and 2.2) indicate the same result as the models in Table 6-12. The suggested mediating variables, domestic referents and outside owners, increase growth orientation. The third and fourth models (Model 2.3a and 2.3b) suggest that location in Oulu does not affect much growth orientation and that location in Helsinki increased it. Based upon Table 6-14, this was widely expected.
The fifth model (Model 2.Ta) adds the potential mediating variable domestic referent to the model and as expected, the strength of Helsinki as a location is reduced from statistically significant to non-significant, suggesting that effect of location is mediated through socially linked referents as hypothesis H7 indicates.
139
The sixth model (Model H8), testing hypothesis H8, shows that external ownership does not affect the domestic referent. Although external ownership still transmits the effect, there is no evidence of linear regression relationship mediation between the values of the variables. The transmission effect can also occur due to different ownership structures between regions. This will be tested by structural equation modeling. The analyst also should note that a linear regression model is not feasible for analyzing the relationships between binary variables such as dummies for ownership and locations.
Sobel`s test results for mediating the effect of domestic referents upon location are presented in Table 6-16.
Independent variables
Dependent B Standard error
t Tested mediation
Z (Sobel test of mediation)
p (2-tail)
Finnish referent controlled with Oulu
Growth orientation
0.009 0.002 4.001 Finnish referent on Oulu
0.92 0.36
Finnish referent controlled with Helsinki
Growth orientation
0.008 0.002 3.57 Finnish referent on Helsinki
1.97 0.049
Location Oulu Finnish referent
-8.65 9.18 -0.94
Location Helsinki Finnish referent
17.60 7.46 2.36
Table 6-16, Sobel test of domestic referent and external ownership mediating the effects of
location
As can be seen from Table the 6-16, the mediating effect is significant in a two-tailed test. Domestic referents appear to transmit the effects of location upon growth orientation.
6.3.3 Regression models on growth
The last set of regression models analyzes the effect of growth orientation, growth experience and previous experience upon the actual growth of the company. In the first set of models, growth is measured as turnover in 2000 controlled by turnover in 1998. This method of growth modeling, as a whole, strengthens the models. Due to the strong relation of previous turnover upon current
140
turnover, the impact of other variables is analyzed mainly by checking whether they are statistically significant or not. The results are presented in Table 6-17.
Model 3.0
Model 3.1
Model 3.2
Model 3.3
Model 3.4a
Model 3.4b
Model 3.T
Growth orientation a 0.08* 0.08* 0.08* 0.09* 0.09*
Moderators
Growth orientation x Previous Growth experience
0.00 0.01
Growth orientation x Previous experience
-0.07* -0.07†
Independents
Growth orientation of Finnish referent
-0.02 -0.02 -0.04 -0.05 -0.05
Growth orientation of foreign referent
0.03 0.03 0.04 0.04 0.04
Firm has outside owners 0.06† 0.06† 0.05 0.03 0.04
Previous experience a -0.03 -0.03 -0.02 0.00 0.00
Previous growth experience a 0.13** 0.13** 0.12* 0.12* 0.12*
F 92.7*** 85.3*** 59.5*** 56.9*** 52.0*** 54.5*** 50.1***
Degrees of freedom 7,66 8,65 12,61 13,60 14,59 14,59 15,58
The coefficients are presented as standardized beta weights
*** p ≤ .001, ** p ≤ .01, *p ≤ .05, † p ≤ .10; one-tailed tests.
Table 6-17, Regression models on growth
141
The first model (Model 3.0), with only control variables, suggests that companies that have concentrated upon narrow segments grow slower than companies with a wider focus. The model also suggests, interestingly, that the strategic choice, supposedly leading to growth (focusing upon the mass product business) has not led to growth. Potential explanations might be that during the period under study, project work business was booming due to the so-called “year 2000” problem and as can bee seen from the statistics from Datamonitor presented in Chapter 2.6, software services business grew globally faster than software product business. At the same time, there was also overcapacity and a lot of competition in the many sectors of the packaged, or licensed, software business.
The second model (Model 3.1) testing the effect of growth orientation upon growth supports hypothesis (H10) and suggests a positive relationship. The third model (Model 3.2) tests another growth hypothesis (H9) and suggests that previous growth experience increases growth. The relationship between the growth experience construct and growth is statistically very significantly positive so hypothesis is supported. One interesting observation from this model is that the control variable “age of the company” becomes significantly positive. This suggests that controlled by experience and ownership, older companies grow faster. This appears to be a logical relationship, at least in project-related businesses where older companies have greater ability to recruit, and thus have access to the most critical growth resource. As expected, previous general experience does not have a statistically significant effect on growth.
The last models (Models 3.3, 3.4, and 3.T) analyze the combined effects of the variables. When both growth orientation and previous growth experience are combined in the same model (Model 3.3), the effect of both becomes weaker. They appear partially to explain the same variation in growth. When adding moderating terms to the equation in the fifth (Model 3.4a), and sixth model (Model 3.4b), it can be seen that previous growth experience does not have the effect upon growth orientation as expected. However, previous experience does have this effect as expected in Hypothesis H11. The moderating term strengthens the effect of growth orientation. Growth orientation can be assumed therefore to be the moderated variable, and previous experience is the moderator. The sign of the moderating term is negative as also assumed in the hypothesis. This implies that the previous experience of management makes growth-oriented companies less prone to success when specific growth experience is controlled. Therefore, previous experience can be damaging when it falls outside the applicable area. The last model (Model 3.T) combines all the variables into the same model, which does not change the results achieved by earlier models.
To confirm the results, a second set of regression models are built with different growth measures. The same regression models are built. However, the dependent variable is not a construct for variable growth that would consist of relational and absolute growth as a dependent variable. The results can be seen in Table 6-18.
142
Model 4.0
Model 4.1
Model 4.2
Model 4.3
Model 4.4a
Model 4.4b
Model 4.T
Growth orientation a 0.21† 0.20† 0.21† 0.23* 0.25*
Moderators
Growth orientation x Previous Growth experience
0.04 0.05
Growth orientation x Previous experience
-0.18† -0.18†
Independents
Growth orientation of Finnish referent
-0.04 -0.09 -0.09 -0.10 -0.11
Growth orientation of foreign referent
0.11 0.12 0.13 0.12 0.12
Firm has outside owners 0.16† 0.13 0.12 0.10 0.09
Previous experience a -0.02 0.05 0.04 0.12 0.11
Previous growth experience a 0.42*** 0.40*** 0.39*** 0.42*** 0.41***
Degrees of freedom 6,67 7,66 11,62 12,61 13,60 13,60 14,59
The coefficients are presented as standardized beta weights
*** p ≤ .001, ** p ≤ .01, *p ≤ .05, † p ≤ .10; one-tailed tests.
Table 6-18, Regression models on growth construct
143
This second set of regression models does not produce results that differ from the first set of growth models. The effect of growth orientation is not as strong as in previous set of models. However, the discovered relationship is still nearly statistically and is controlled with moderating terms that are statistically significant. Thus these results give no reason to re-evaluate the findings from the previous set of models. Therefore, it appears that the results from testing hypotheses H9-H11 are not bound to a specific growth measurement method.
144
6.4 Structural equation models
The regression analysis done in Chapter 6.3 produces the model presented in Figure 6-1. The model presents the relationships between independent variables, growth orientation and growth. In this model, two previously separated models on growth orientation and growth are combined into one model. Growth orientation is considered to be a mediating variable.
H10
H9
H11H5
H1a
H3
H6
GrowthGrowth orientation
Previous experiencePrevious
growth
Foreign referent
Domestic referent
Outside owners
Figure 6-1, Total model derived from the hierarchical regression analysis
In this chapter, structural equation modeling is used to further test this model. Because SEM techniques do not allow the testing effects of moderator upon moderator while their combined effect upon the dependent variable is tested, the above model is divided into two test models. The first tests on the effects on growth are shown in Figure 6-2.
145
H10
H9
H11
H1a
H3
GrowthGrowth orientation
Previous experiencePrevious
growth
Foreign referent
Domestic referent
Outside owners
Figure 6-2, Model to test the effects of growth
To increase the external validity of the testing, two different measures for the dependent constructs are used, as was also the case in hierarchical regression analysis. The first dependent construct used is logarithm of turnover in 2000, with turnover 1998 included in the model as an independent variable affecting turnover in 2000. The second dependent construct used is the logarithmic average of the relational growth of turnover 1998-2000 and absolute growth of turnover 1998-2000.
First the predicted model is tested against a list of other potential models by using the so called “nested protocol”. Statistics describing the different models, considered in the protocol, are presented in Table 6-19.
3. Model where domestic referent is partially mediated GO
23.8 22 .358 1.08 .927 .922 .993 69.8 .033
4. Model where foreign referent is mediated by GO
24.9 22 .301 1.13 .925 .919 .989 70.9 .043
5. Model where foreign referent is affecting turnover 2000
24.7 22 .312 1.12 .925 .919 .990 70.7 .041
6. Model where outside ownership is partially mediated
25.0 22 .299 1.13 .925 .918 .989 71.0 .043
7. Model where previous growth experience is also mediated by GO
24.9 22 .303 1.13 .925 .919 .989 70.9 .043
Table 6-19, Models with turnover in 2000 controlled by turnover in 1998 as the dependent
variable
The normed chi-square of the hypothesized model falls between 1 and 2 so its general fit is acceptable.
According to the nested protocol, the hypothesized model is tested against null models and, if there is a statistically significant change in chi-square, the hypothesized model is selected. After this, the hypothesized model is compared against other potential models, and if there is a statistically significant change in the chi-squared model, the more parsimonious model is accepted. Otherwise a less parsimonious model is selected. Testing is presented in Table 6-20.
147
More parsimonious model Less parsimonious model ∆χ2 ∆df P Preferred
1. Null model 2. Hypothesized model 281.0 13 <.005 Model 2
1b. Null model with correlations
2. Hypothesized model 32.68 6 <.005 Model 2
2. Hypothesized model 3. 1.18 1 >.100 Model 2
2. Hypothesized model 4. 0.05 1 >.100 Model 2
2. Hypothesized model 5. 0.27 1 >.100 Model 2
2. Hypothesized model 6. 0.01 1 >.100 Model 2
2. Hypothesized model 7. 0.10 1 >.100 Model 2
Table 6-20, Testing between different models on the first version of growth variable, one tailed
tests
As the analysis shows, the hypothesized model is the model of choice. The complete model, with beta coefficient values and the correlation relationships used, is presented in Figure 6-3.
0.06†
0.13**0.01
0.37**
0.14†
Turnover1998
Growthorientation
Previousexperience
Previousgrowth
Foreignreferent
Domesticreferent
Outsideowners
GO xprevious
experience
Turnover2000
Err1
0.88**
Err2-0.07†
-0.28
0.18
-0.35
0.17
0.40
0.62
Figure 6-3, Total model derived from the SEM analysis on first measure on growth
148
The relationships found in the model related to the hypotheses are presented in Table 6-21. The last column indicates the statistical significance empirically found in the hypothesized relationships.
Hypothesis Effecting variable Direction Effected variable Std.
H2 Foreign referent -> + Growth orientation N/A in model
H3 Outside owners -> + Growth orientation 0.14†
H9 Previous Growth
Experience
-> + Growth 0.13**
H10 Growth orientation -> + Growth 0.06†
H11 Previous Experience x
GO
-> + Growth -0.07†
*** p ≤ .001, ** p ≤ .01, *p ≤ .05, † p ≤ .10; one-tailed tests.
Table 6-21, Testing of hypothesis based upon the first growth model
As can be seen from the results, of the tested hypotheses, all others received support except the connection between foreign referent and growth orientation (H2). It was no supported in the nested protocol analysis. In the rejected model, the standard coefficient was below the limit for statistical significance, and relationship was removed from the coefficient analysis. This finding is in line with the hierarchical regression analysis results.
Hypothesis H3 received only partial support. The effect of external ownership is barely statistically significant, as was also the case with regression modeling. However, two different statistical analysis methods produce the same result, which further supports the hypothesis. Hypotheses H10 each received only partial support. Related to both of these results is the attempt to model the combined impact of two variables, growth orientation and previous experience. A multiplication variable was used to describe the common impact. Even though this is the most common method currently used with SEM, its usage and analysis capability is not as straightforward as with regression analysis. Thus, even the fact that result that both hypotheses
149
obtained barely statistically significant support results can be considered a further strengthening of the hypothesis.
When the growth is operationalized with the second method in this study (a construct combining relational and absolute measure), SEM modeling produced statistics for different models. This is presented in Table 6-22.
3. Model where domestic referent is partially mediated by GO
32.9 24 .106 1.37 .911 .796 .929 74.9 .071
4. Model where foreign referent is mediated by GO
32.9 24 .107 1.37 .911 .796 .929 74.9 .071
5. Model where foreign referent is affecting growth
31.4 24 .142 1.31 .914 .805 .941 73.4 .065
6. Model where outside ownership is partially mediated
32.8 24 .108 1.37 .911 .796 .930 74.8 .071
7. Model where previous growth experience is also mediated by GO
32.8 24 .108 1.37 .912 .797 .930 74.8 .071
Table 6-22, Models with the construct of rational and absolute turnover growth as a dependent
variable
A normed chi-square of the hypothesized model falls in the acceptable range between 1 & 2. The results analyses from comparing chi-square statistics are presented in Table 6-23.
150
More parsimonious model Less parsimonious model ∆χ2 ∆df P Preferre
d
1. Null model 2. Hypothesized model 128.27 11 <.005 Model 2
1b. Null model with correlations
2. Hypothesized model 38.84 5 <.005 Model 2
2. Hypothesized model 3. 0.03 1 >.100 Model 2
2. Hypothesized model 4. 0.08 1 >.100 Model 2
2. Hypothesized model 5. 1.52 1 >.100 Model 2
2. Hypothesized model 6. 0.13 1 >.100 Model 2
2. Hypothesized model 7. 0.14 1 >.100 Model 2
Table 6-23, Testing between different models on the second version of growth variable, one
tailed tests
The results from model level analysis are essentially the same as that achieved when using turnover from year 2000 controlled by turnover in 1998 as the growth measure. Figure 6-4 presents the total model.
151
0.18†
0.51**0.28†
0.36**
0.15†
Growthorientation
Previousexperience
Previousgrowth
Foreignreferent
Domesticreferent
Outsideowners
GO xprevious
experience
Err1
Err2-0.16
0.89
-0.37
-0.18
Rational Absolute
Growth
0.79 0.98
0.36
Figure 6-4, Total model derived from the SEM analysis on the second measure on growth
The analysis of the relationships related to the hypotheses is presented in Table 6-24.
Hypothesis Effecting variable Direction Effected variable Std.
H2 Foreign referent -> + Growth orientation N/A in model
H3 Outside owners -> + Growth orientation 0.15†
H9 Previous Growth
Experience
-> + Growth 0.51**
H10 Growth orientation -> + Growth 0.18†
H11 Previous Experience x GO -> + Growth -0.16
*** p ≤ .001, ** p ≤ .01, *p ≤ .05, † p ≤ .10; one-tailed tests.
152
Table 6-24, Coefficients in the second SEM growth model related to hypotheses
Most of the results from this analysis are the same as the results from the analysis of the previous dependent variable. The most important difference is that in this case, the connection from the moderator term to growth did not get barely any significant statistical support. As mentioned in the context of previous analysis, the modeling practice, for combining effects of variables in SEM, is still in its infancy. Indeed, the sample size was rather small for this kind of SEM analysis. Therefore, the result cannot be used to reject the hypothesis.
The hypothesis H4-H6 were tested by a separate analysis by using the model presented in Figure 6-5. The connection between previous growth experience and growth orientation is used in the hypothesized model, because this is common practice.
H5
H1a
H3
H6
Growth orientation
Previous experience
Previous growth
Foreign referent
Domestic referent
Outside owners
H4 (neededby modeling)
Figure 6-5, Model on factors affecting growth orientation derived from the hierarchical
regression analysis
First, the predicted model is tested against a list of other potential models by using the nested protocol. The statistics of different models are presented in Table 6-25.
4. Model where previous growth experience is not connected to GO
13.9 14 .454 .996 .946 .720 1.00 41.9 .000
5. Model where external ownership moderated by domestic referent
12.7 12 .394 1.05 .953 .746 .977 44.6 .027
6. Model where previous experience is mediated by domestic referent
10.7 12 .556 .891 .961 .785 1.00 42.6 .000
Table 6-25, Statistics of models on growth orientation
The normed chi-square of the hypothesized model falls between 1 and 2 so its general fit is acceptable.
According to the nested protocol, the hypothesized model is tested against null models, and if there is statistically significant change in the chi-square, the hypothesized model is selected. After this, the hypothesized model is compared against other potential models, and if there is a statistically significant change in the chi-squared model, the more parsimonious model is accepted. Otherwise the less parsimonious model is selected. Testing is presented in Table 6-26.
154
More parsimonious model Less parsimonious model ∆χ2 ∆df P Preferred
1. Null model 2. Hypothesized model 35.83 8 <.005 Model 2
1b. Null model with correlations
2. Hypothesized model 34.87 5 <.005 Model 2
2. Hypothesized model 3. 0.00 1 >.100 Model 2
4. 2. Hypothesized model 0.00 1 >.100 Model 4
2. Hypothesized model 5. 1.28 1 >.100 Model 2
2. Hypothesized model 6. 3.25 1 >.071 Model 2
Table 6-26, Testing between different models on growth orientation, one tailed tests
As the analysis shows, the hypothesized model is not the model of choice, but rather the model that was already implied by the regression analysis: no direct effect between previous growth experience and growth orientation. It is also worth noting that the model, where domestic referent has a mediating effect on the effect of previous experience, was almost accepted. The result confirms the Sobel test. The complete model with coefficient beta values and the correlation relationship used is presented in Figure 6-6.
-0.34**
0.38**
0.17*
Growthorientation
Previousexperience
Previousgrowth
Foreignreferent
Domesticreferent
Outsideowners
-0.01
ExperienceX
Growth
0.14†
Err1
0.39
-0.110.02
Figure 6-6, Total model on growth orientation derived from SEM
155
The analysis of the relationships connected to the hypotheses is presented in Table 6-27.
Hypothesis Effecting variable Direction Effected variable Std.
H5 Previous Growth Experience -> + Growth orientation N/A in model
H6 Previous Experience X
Growth Experience
-> - Growth orientation 0.14†
Table 6-27, The coefficients in the second SEM growth model related to hypotheses
The results confirm the regression analysis. Domestic referents, previous experience and external owners have an impact on growth. In this model, all of them have a statistically significant effect. The combined effect of previous experience and growth experience received nearly significant support.
Finally, the differences between companies located in different regions were analyzed. The model used is presented in Figure 6-7.
H5
H1
H3
H6
Growth orientation
Previous experiencePrevious
growth
Foreign referent
Domestic referent
Outside owners
H4
H2
Err
Growth x experience
156
Figure 6-7, SEM model to test regional effects
It is worth noting that in this model, a relationship between foreign referent and growth orientation was expected. The reason for this was to explore whether some regional cultures would support more use of foreign referents than other cultures. The results are presented in Figure 6-28.
. Helsinki Tampere Oulu
N 40 18 18
H1a Domestic Referent -> + GO 0.43** 0.29 0.30
H2 Foreign Referent -> + GO -0.14† 0.36 0.27
H3 Outside owners -> + GO 0.19 0.22 0.24†
H4 Previous Experience -> - GO -0.33** 0.32 0.27
H5 Previous Growth Experience -> + GO -0.11 0.39 0.29
H6 Previous Experience X Growth Experience
-> - GO 0.11 0.33 0.33
Table 6-28, SEM analysis of regional groups on factors affecting growth orientation
The analysis of differences between groups is merely explanatory; because the sample size for Tampere and Oulu groups was too small for SEM. Still in Oulu, external ownership was statistically significant in relation to growth orientation. There is a clear difference in the growth orientation between externally owned and other companies. Thus, even though external ownership did not clearly mediate an impact of region upon growth orientation, there are regional differences regarding how external ownership effects growth orientation. However, they may be structural differences.
Interestingly, many of the relationships in the different regions have different directions suggesting that there may be multiple forces affecting the relationship. In Helsinki, growth orientation of a foreign referent reduces one’s own growth orientation, whereas in other regions, it increases one’s own orientation. Also, the negative relationship between previous experience and growth orientation is only a Helsinki sub-region effect. Elsewhere, previous experience increases growth orientation. A partial explanation to this phenomenon is that growth orientation was highest in Helsinki. The previous experience might influence managers to plan for modest growth which in Tampere would be considered faster. The same reasoning may partially explain the different relationships of previous growth experience between the regions.
157
6.5 Support for hypotheses
A synthesis of the analysis done in the previous sections of chapter 6 is presented in Table 6-29. It shows which of the presented hypotheses have gained support from the statistical analysis of empirical data.
Regression
analysis
SEM analysis
H1a The growth orientation of Finnish (socially linked) referents has a positive impact on growth orientation.
Supported Supported
H1b The impact of Finnish referents on growth orientation is stronger than a foreign referent.
Supported Supported
H2 The growth orientation of referents in general (not socially linked) has a positive impact on growth orientation.
H6 Previous experience moderates negatively the effect of previous growth experience.
Partly supported (opposite direction)
Partly supported (opposite direction)
H7 There are regional effects on the growth orientation of that are mediated through reference persons.
Supported Explanatory support
H8 There are regional effects on the growth orientation that are mediated through external ownership.
Not supported Explanatory support
H9 Previous growth experience has a positive effect on growth.
Supported Supported
H10 Growth orientation has a positive effect on growth. Supported Partly Supported
H11 Previous experience moderates the effect of growth orientation on growth
Supported Partly Supported
Table 6-29, Synthesis of the results of statistical analysis: Support for the hypotheses
158
As can be seen from the table, the strongest support of the hypotheses for sources of growth orientation were the effects of socially linked referents and outside owners. The effect of socially linked referents is further strengthened by the fact that the effects of non-socially linked referents were not supported from the data. In addition, the hypotheses relating management experience to growth orientation found sufficient support, whereas previous growth experience did not have the same effect. Its impact seems more to be moderating the effect of general experiences.
Of the hypotheses related to regional culture, the effects regarding thought socially linked referents received clear support. The effects regarding ownership also received support, although not as strong. The weak support for relating ownership to regional culture may partly be due to the way ownership and regional culture were operationalized, both as being measured by dummy proxies.
Regarding sources of growth, the learning based hypothesis suggesting the effect of previous experience from a growth situation, received strongest support. Also the hypothesis on the effect of growth orientation, as well as the moderating effect of previous general experience, received sufficient support.
159
7 Discussion and conclusions
7.1 Discussion of the results
The implications of results from empirical testing of hypotheses are discussed in this chapter as well as potential explanations on why some of the hypotheses were not supported are discussed.
7.1.1 Sources of growth orientation
The results of analysis concerning first hypothesis (H1a) is clear: socially linked referents seem to increase growth orientation. Because of the cross-sectional nature of data measuring this relationship and the use of similar questions to measure both, some doubts upon the result can still be shed. It might be so that the selection and perception of referent behavior is just a reflection of respondents’ own plans the direction of causality is opposite to the one hypothesized. This finding supports the views of social learning theory: managers are setting their self-efficacy based upon role models and social norms. It also supports the views of social constructionists. The strategy of a reference group becomes a focal point towards which an organization’s manager converges (Feigenbaum & Thomas, 1995). This convergence enacts the mental model as a real situation in the industry (Porac et al., 1995).
The result that the effect of socially linked referents is stronger than non-linked (H1b) implies that institutional learning happens mainly through socially or culturally close links, not through global or general examples that are generally available for everyone. This confirms the findings that individual cognition and behavior is shaped by social influences, that is, by the attitudes and behaviors of others with whom they interact (Pfeffer & Salancik, 1978; Hackman, 1992). This also supports the views of social cognitive theory: when role models are socially close, there are more than one factor supposed to establish self-efficacy present, but if they are distant, the role model factor is the sole possibly affecting. Even though the social learning derivation of attribution theory supports the finding, in the general theory does not support it. The general attribution theory explain the birth of self-efficacy or corresponding concepts through learning and observation and not that much as an interactive process of constructing mental models from in a mutual process with the social environment. The support is even stronger for social constructionism perspective than social learning theory, because the view wants to emphasize the importance of social frame building, when organizational actors build their mental models.
160
The support for hypothesis H1b does not increase the evidence on the validity of expectancy and planned behavior theories, where the growth aspirations are supposed to be born through mostly rational reasoning, and the difference between socially close and distant models in setting expectancies and views on control is not supposed to be that significant. Especially expectancy theory in its original form would make one expect that the social closeness is not that important factor. For planned behavior theory, the result indicates that for managers the subjective norm might be more important source of intentions than attitudes. Attitudes are supposed to be born from the person’s beliefs about the consequences resulting from the intention and should not be that much dependent on the social relatedness of references. The found support for hypothesis H1b is against the views of discrepancy theory. It assumes that the actual inequality is not dependent on the social closeness of the referents. Besides the results presented in chapter 6, it was also statistically studied whether there existed relationship between growth orientation and referent organizations besides referent persons. There were no signs of such relationships found. Thus this study does not increase support for discrepancy theory.
The failure to get statistical support for the second hypothesis actually increases the validity of results of testing the first one. The second hypothesis regarding the relationship between socially non-linked referent and growth orientation was measured with the same method as the first one, but results differ totally. Thus the common methodology does not explain the finding, at least totally. And if perceptions on referents were only reflection of own plans, why would then this reflection happen only with socially linked referents, not distant ones.
The non-existence of relationship proposed for the hypothesis H2 reduces somewhat the support for social constructionists and also the suggestion that self-efficacy is born through vicarious experiences. If it is assumed that non-socially linked referents are selected to reflect already existing norms or frames, also the socially non-linked referents should be related to growth orientation. Highly growth oriented managers select highly growth oriented referents to strengthen their worldview.
The non-existence of support for hypothesis H2 does not put expectancy assumptions in more doubt than the already explained implications of support for hypothesis H1b. This result is not in line with previous findings of empirical testing of planned behavior theory that has found stronger support for attitudes factor than social norm and perceived social control (Ajzen, 1991). The non-support neither puts basic assumptions of social learning in doubt, but only implies that of the potential factors creating self-efficacy, vicarious experience might be not that significant than social persuasion.
The found support for the third hypothesis further strengthens the observation that individual entrepreneurial behavior is shaped by social influences: the closer the external models for behavior come to the management, the more influential they are. The support is strongest for attributions theories, because this hypothesis was derived from the theoretical model to test whether there is an
161
attribution mechanism between referents and orientation besides general social mutualism and norms. Still, in the light of missing support for H2, one can still doubt that this empirical setting gives support for theories that are based on affects that are not norms or learning based. It might also be that external owners have a strong capability to affect the model building or the norms. In the terminology of planned behavior theory, the found relationship might as well result from strong social capability to affect subjective norms than from mechanisms affecting attitudes.
The fact that the relationship between ownership and growth orientation was found to be only almost significant statistically may result from the nature of measurement. The measure used was a dummy variable telling only that external ownership exists without giving more information of the nature of the ownership. Sometimes this dummy may not work as a proxy for existence of growth oriented corporate governance.
The found validity of the third hypothesis can also be attributed to established agency theory (Jensen & Meckling, 1976) besides explanations based on social and cognitive influences. But even though agency theory suggests the disparity of interest of outside owners and owners-managers, recent research has suggested (Lane et al., 1998) that the predictions of agency theory are unsupported in instances when managerial interests do not clearly conflict those of shareholders. Stewardship theory that has emerged as an alternate to agency theory (Lee & O’Neill, 2003) offers an alternative perspective (Fox & Hamilton, 1994). It suggests that the interests of managers may be aligned with those of owners. In other words, what works to control and motivate an opportunistic manager may not work well to control or motivate a steward. These recent developments in the research upon the corporate governance may apply to the situations of the studied companies. Thus the straightforward agency theory based explanations may no be as feasible in understanding the found impact as the effects of social and cognitive impacts.
The fourth hypothesis suggested that management or company experience from previous fast growth would increase the growth orientation. No support was found for this hypothesis. The reason might be that the average growth rate of the industry during study period was very fast, faster than in previous years and faster than what was classified as fast growth in measurements of fast growth experience. Thus the changed environment might hinder the potential relationship. Another explanation why no relationship was found may be that experience from fast growth earlier may bring realism to planning in similar situations. The missing support is not in line with the expectations set up by expectancy and planned behavior theory nor attribution theories, especially their assumptions about how self-efficacy and similar concepts are born.
Especially interesting is that the assumption of importance of mastery experience factor in attributions theories did not get support. This might be because of the specifics of the empirical data. The growth objectives in the companies studied were much higher that was achieved. There might have been such social environment that was pressing non-growth experienced managers to set goals based solely on social persuasion, because they felt that their mastery experience did not
162
apply to the situation. Those managers who had mastery experience from the similar situations were able to balance social persuasion and mastery experience factors.
The result also contradicts the enacted worldview based reasoning that previous experience of achieving growth makes managers assume that the structure of their whole business tends towards growth. In this way, previous experience growth increases the growth expectation and causes managers to plan for growth. But another way of reasoning in this specific situation is that those organizations that had been already earlier able to develop their interpretation mechanisms in environments allowing and demanding fast growth, were able to use such interpretation that was built on real world experience, whereas organizations without already existing interpretation had to rely on interpretation that was based more on high growth possibility assumptions then popular in the social environment.
The fifth hypothesis suggested that previous general experience of management reduces growth orientation. It was supported. It appears that in high growth environmental situations, management with experience from generally lower growth environments may have limited capabilities to see all the growth potential that exists for the firm. The support for the fifth hypothesis is in line with the attribution theories as well as planned behavior and expectancy theories. It also supports the views set up by the entrepreneurial cognition theory and thus positivistic cognition views.
The sixth hypothesis suggested that previous general experience may decrease the effect of growth experience on growth orientation. Some support for this hypothesis was found suggesting that experienced managers appreciate more the company and own experience fit with the current management situation, but the direction of the relationship was other than expected: previous general experience strengthens the effect of growth experience. The result may be such because of the fact that the direction of the relationship between growth experience and growth orientation in these data was different than expected: growth experience and previous experience both affect to the same direction, and as combined they increase their effect. Thus, in through testing this hypothesis were got slightly more support for reasoning presented in the discussion on previous hypothesis: those who have more direct experience on same type of situation are using mental models based on experience whereas those who do not have such models have to loan them from social environment. But we must be cautious in making any strict conclusions from results of testing this hypothesis, because of the specialties of the empirical data.
The non-hypothesized but observed almost significant mediating effect of socially linked referents on relationship between previous experience and growth orientation my have a rather logical explanation further strengthening the view presented by the first hypothesis. Individual cognition and behavior—through which organizational learning necessarily occurs—is shaped by social influences, that is, by the attitudes and behaviors of others with whom they closely work or interact (Pfeffer & Salancik, 1978; Hackman, 1992). How companies and management learn, is guided by the social relation network that the management has.
163
7.1.2 Regional effects
The data from different regions show that clear differences in managerial attitudes exist in different regions. It appears, in general, that Helsinki and Oulu companies are rather close to each other and Tampere companies are more conservative. As the original assumption was that there was something special in Oulu sub-region culture, these results suggest that the special thing is that Oulu firms differ from other Finnish non-Helsinki metropolitan area companies and do not have “provincial” cognitive models.
Both of the more detailed the hypothesis regarding the nature of relationship between regional culture and growth orientation got support, even though support for ownership effect was not strong. The weakness of detected support for ownership effect may be a result of the operationalizations and research setting, not because of the weakness of studied relationship. The found support suggests that regional effects can affect through social links, either through non-formal links when company management follow its referents or more directly when company management takes external owners in and let them guide their thinking. Also motivational theories can get support from these notions, especially social learning theories and its assumptions of social pressure as a factor affecting motivation.
It has been found empirically that the firm's local environment affects its survival in the critical operational phase (Littunen et al., 1998), but new firms have equal chances for growth independently of their locality (Littunen & Tohmo, 2003). Based on the findings of this study it seems that the reason for growth differences between regions can as well be cultural links and role models guiding management mental models as well as social capital and agglomeration that regional science also sees as sources differences.
7.1.3 Impacts on growth
All the three hypotheses regarding the potential factors affecting growth were supported, even though the support for last two ones was vague in structural equation modeling.
Previous growth experience was related to faster growth, and no similar relationship was found between experience in general and growth. Thus learning from the same kind of context helps management, and this kind directly related learning from the problem situation is more beneficial than general experience. The hypothesis was derived research on human capital and further on assumption that specific human capital is more valuable than general. The manager has to have such mental models that give him understanding what the contingences between resources,
164
environment and objectives are. Managers have to be able to set realistic and valid goals. As empirical research on goal setting theory has shown, goal setting theory works, but the goals have to be realistic for goal setting to work. Thus it can be assumed that the reason also here why growth was achieved was because the management was able to set correct strategic goals. But the effective goals were a result of cognitive ability to interpret external and internal information with working mental models. Thus the reason why goal setting theory works might be that goals reflect mental models that connect environment, resources and aspirations together and guide actions.
The second hypothesis regarding to effects of managerial motivational and cognitive factors on growth stated that higher growth orientation would result in faster growth. This hypothesis was supported confirming rather generally accepted conception. One reason for the only partial support of the hypothesis in structural equation modeling may result from the form of relationship between targets and their realization. If the objectives are distant from current company situation, their guiding effect may not be as strong as when the goals are close to current situation and the relationship is not linear. Proximal goals are more effective than distant ones (Bandura, 1997). The assumption that goals affect directly performance is most directly stated in Goal setting theory of the motivational and cognitive theories. As growth orientation is a more distant variable from performance than the variables in goal setting theories and is a more expectancy theory and self-efficacy concept related variable, the vagueness of relationship between Growth orientation and growth might actually strengthen the support for goal setting theory. General aspirations do not suffice alone to achieve objectives, but more concrete achievable goals. The support for expectancy theory and self-efficacy concept is not as strong as for goal setting theory. The task of searching growth for an enterprise is a long term, complex objective. It seems that in such a situation a general self-efficacy or aspiration level is not sufficient to increase performance sufficiently. The actions resulting from motivation need to in line with the demands of the context for the motivation to lead to performance.
The last hypothesis stated that previous general experience would decrease the effect of growth orientation on achieving faster growth. Also this hypothesis was supported suggesting that experience from different context combined with objectives that are outside from the familiar frame of reference of the management can be even damaging for the company. This result further strengthens the view that to understand how motivation creates performance in complex organizational settings, it does not suffice to study how motivation creates action, but there must also be controls or models upon how decision makers are able to choose correct actions.
The findings about not strong connection between growth orientation and growth, and the negative effect of previous experience can also be understood through entrepreneurial cognition theory. Baron (1998) suggests that entrepreneurs, the highly growth oriented managers in this study, are more prone than other managers to cognitive errors that lead to not well fitting decisions in high pressure. Entrepreneurs are more susceptible to escalation of commitment effects and tendencies toward self-justification than are other people. They have the tendency to continue investing time,
165
effort, or money in losing courses of action because of initial commitment to this course of action. They have the desire to justify the initial choice or decision in an escalation of commitment situation. The differences of cognition between entrepreneurs and other people do not stem primarily from the differences in personal traits, but rather from the fact that entrepreneurs operate in situations and under conditions that would be expected to maximize such errors and biases. They select high growth objective, and if they do not have direct experience on the situation, they are more prone than other people to end up in a self-enforcing loop: people in situations creating typical entrepreneurial biases tend to commit such decisions that create more biases. Another explanation emerging from entrepreneurial cognition research comes from Mitchell et al. (2000b). Following their logic one can assume that the previous growth experience has given managers expert scripts how to arrange resource possession, how to protect own ideas, etc. to make their company grow. Other managers lack these scripts and are not as effective in trying to achieve growth.
The models also show that strategic choice variables used as control variables in this research have an impact upon the growth. The companies that have selected high growth markets as their operating industries have experienced faster growth, as well as companies that have not been segmenting their operations to too tight niches.
7.1.4 Answers to research questions
The main question in this study was: How the growth orientation of the management is born?
The results from the study imply that social cognition plays an important role in the creation of growth aspirations. The socially linked referents create models for growth aspirations either through generally used frames in the business community, or more directly through frames of thinking from stakeholders of the company. Also management’s own earlier personal experience from previous business situations has an effect.
The first sub-question of this study was: Who are the referents that are affecting most the growth orientation of the management?
The regional business culture was found to be a factor affecting the behavior of the enterprise management as was expected (Saxenian, 1994). The referents that belong to the same culture have more effect than those that are living in different countries. It was also noticed that the question is correct, as referents, people are more important than organizations.
The second sub-question of this study was: Through which paths do regional differences affect growth orientation?
166
It was found that regional effects have impact through cultural factors like selection of role models and scripts to follow. To some extent, culture may also affect the selection of owners or other stakeholders that transmit the regional frames to the company.
The third sub-question of this study was: How does growth orientation affect the actual growth of companies in the industry under study?
Support was found for the view that high aspirations lead to performance as high growth orientation increases the probability of growth. Still, motivational level alone is not sufficient condition in reaching the growth targets, but management need to have experience from growth situations to be efficient in pursuing growth. Interestingly, it seems that general management experience without a match in growth aspirations and previous growth experience may lead to worse performance than no experience. So the results do not support directly goal setting theory. If goals are too difficult, they do not lead to higher performance as the basic assumption of goal-setting theory goes as presented in Chapter 2.2. Management’s mental models need to meet the competence demands set up by goal settings for management to be efficient.
167
7.2 Theoretical contributions of the dissertation
As Khartri and Ng (2000) note, while theoretical decision-making models abound, applied research regarding top management information use in decision making is virtually nonexistent. This study sheds some light on how the decision making happens, bringing up the importance of socially linked cognitive and learning processes.
The found difference between management previous experience in general and previous experience from fast growing companies is maybe the most interesting result from the study. The intuitively apparent relationship between cognition and performance (Thomas et al., 1993) gets empirical support, but the results also complement current knowledge about mental models and their relatedness of company performance. Where previous experience from fast growing companies clearly affects positively the growth of the company, and is positively moderated by growth orientation, the general experience does not have clear effect upon growth and high growth orientation moderates the relationship negatively. It appears that not all experience is beneficial, but the management mental models that affect the execution of tasks as well as practical goal setting should be from similar kind of business situation. If the business situation differs too much from previous experience, the manager cannot adapt the mental models to the new situation, but either understands the situation wrongly or selects from actions. For theoretical research the implication is that mental models differ from business situation to another, and previous mental models prevent adaptation to new business situation.
These findings fit well in the findings of organizational learning research. Crossan et al. (1999) state that no theory of organizational learning is complete without distinction between two different kinds of learning: exploitative (March, 1991), first-order learning (Lant & Mezias, 1992), or incremental (Miner & Mezias, 1996) and explorative, second-order, or radical learning. Improving existing routines or capabilities characterize the former; and reframing a situation, developing new capabilities, or solving ambiguous problems characterizes the latter. In short term, the management acts according to models achieved through incremental learning, and can be effective only within contexts that resemble the previous situations from which the management has gained its experience. It may demand more time before radical learning makes management more effective.
From the point of view of social constructionism it is easy to understand the difference between experience from similar business situation and more distant experience. Within an organization, common meanings act as filters that prevent new knowledge from being embraced (du Toit, 2003). Therefore, the prevailing sense making system within an organization will influence and direct interactions and activities among the members of the organization. If the interest of group harmony
168
results in compromise responses, the ability of the group to adapt to changing circumstances may be eroded. In those organizations where retained information is treated as sacred, routines and grooved thinking will prevent the organization from processing new information and adapting past knowledge to accommodate changed circumstances.
From different motivational theories, the findings fit best to the social cognitive theory and its assumptions about sources of self-efficacy. Still the findings are not contradicting directly other theories that accept other sources of learning than own direct experience. It can also be claimed that the research setting that was focused on finding effects of different reference aspects, was emerging from the attribution theory field, and other motivational theories would have benefited from a different research setting. For the social learning theory this research gives some clear implications how they could be developed further. It seems that mastery experience and social persuasion have larger role than vicarious experience in entrepreneurial management situation. Further, it seems that self-efficacy leads to best performance in managerial action when mastery experience factor balances social persuasion.
To further understand the empirical findings we draw on theories of managerial and organizational cognition. Very little has been known about the micro level decision context that influences whether organizational leaders will make discriminating choices that fit an organization’s unique circumstances whether they simply follow the pack (Fiol & O’Connor, 2003). To understand different effects and their interaction, we go back to the basics of social cognition and its distinction the scanning and information processing mechanisms that characterize the decision context.
The scanning process in a managerial target setting process uses external information sources to find meanings that further create beliefs through already existing mental models. As was found in this study, external referents guide management belief building and thus the assumption of social constructionism that mental models are born in a process of social interactions was enforced. Socially linked referents affect the goal setting of managers, but non-socially linked not. In different regions different referents were selected as socially linked referents. Social processes seem to guide the scanning process of models and beliefs that affect goal setting.
The study sheds also light on how the social construction affects the information processing inside the organization. The scanning and guiding of motivational levels seems to be unrelated to organizational capabilities: even many companies that did not have track on achieving growth were trying to achieve fast growth because of their social environment. The information processing needed to really achieve growth seems to demand more organizational and managerial fit. Those companies and managers that had a track record in growing were able to grow faster. It may be that when mental models are needed to guide practical action, more fit between own conceptions of environment and the “real” environment is needed than in guiding goal setting.
169
Thus organization-internal cognition is more important in execution than in strategy setting. These conclusions are summarized in Figure 7-1.
GoalmotivationScanning Execution
Goalachievement
Existingmodels
Modelgeneration
Figure 7-1, Processes of social cognition in entrepreneurial growth
The results also contribute to understanding of growth of a firm. Penrose (1959) states that there is no limit how large a firm can be. This statement was rather natural to be made in 1959 after a period of time when large US corporations had been able to grow year after year. After 1959 the growth companies of Penrose time have met the limits of their size. There appear to be some limits to the growth. Based on suggestions above, this study gives one potential reason why there are limits to the size of the companies: if the business environment changes enough so that the applicability of incremental learning does not suffice, the management resources of the firm lose their value. Penrose stated that the managerial capability is the limit of growth rate. As managerial capability can also lose its value, managerial capability may limit also the absolute size of companies, if the environment of the companies faces turbulent changes regularly. The managerial asset loses its accumulated value due to the changes in the business logic and it can happen that the managerial capability of a firm in a fast environmental change actually reduces, even though the number of the managers remains the same.
The control variables used in the regression analysis imply interesting by-product from the empirical analysis. Boeker (1989) recommends using Maidique and Patch typology in high-technology industries when analyzing different strategic choices. But the empirical data in this study suggested no significant relationships between the choices Maidique and Patch suggest and growth of the company. Instead, variables derived from Porter typology and further refined: segmentation and concentration had statistically significant relationships with growth. Thus if segmentation and concentration are separated in analysis, Porter typology may give a basis for analysis of different choices available for high technology companies. Of course, the result here is achieved on dependent variable growth instead of profit that majority of previous research ahs been using when analyzing Porterian generic strategies. Thus the result needs further verifications.
The finding that the maturity or growth of the selected segment did not affect growth is interesting and is in line with Acs and Audretsch (1992) finding that no relationship existed between industry growth and small-firm growth, with growth measured as value of shipments. Kunkel and Hofer
170
(1993) found that the new ventures performed better when they entered stable markets instead of rapidly growing markets. These studies concluded that market growth is not necessary precondition for firm growth ant that new venture opportunities can also be found in industries other than rapidly growing ones.
When tested, there was no evidence that the relationship between growth orientation and growth was U shaped. Contingency theories suppose that the closer objectives are the fir for the company, the better the company performs. Thus the closer the aspirations and objectives are to the realistic potential of the company, the better the company performs. Empirical data collected in this study did not support this view. The result does not directly contradict with the contingency views of strategic management, because there were no hypotheses tested.
171
7.3 Managerial implications
The managerial implications of the results from hypothesis concerning growth orientation and regional effects fall mostly to the public and semi-public actors. Some of the potential implications are: (1) The found potential referent effects may mean that promoting of local prominent business figures as examples of hoped for business practices may result in these practices being adopted more widely. (2) Promoting different investment vehicle and practices that bring growth oriented angel investors or venture capitalists to owners of companies may increase the growth orientation of the companies. (3) In focusing public support of consultation and advising practices, only such practitioners should be supported that have experience from high growth situations should be subsidized. Practices where general management experience is transmitted should not be promoted.
The implication from experience effects upon growth to public actors is that the resources should be directed to those companies whose management has previous experience from growth situations.
The practical management implication from the study is clear. When analyzing the potential of managers to succeed in certain situation, previous experience should be rated according to how close it is from the current situation. It is better to recruit someone that has no experience than someone that has experience from dissimilar situation.
The study presents also one managerial implication for investors and portfolio managers. A dominant view shared by them is that emerging industries offer more growth opportunities than mature industries. Still, the concept of industry evolution has its limitations (Low & Abrahamson, 1997). Some industries never take off; others rise and fall precipitously. Even for those industries that follow the pattern, there is wide variation in the shape of S-curve. Some industries may continue to grow for years, whereas others plateau quickly. This variation limits the predictive value of the S-curve model. This study did not find support for the simplified assumptions of companies operating in growth industries or companies operating in industries in earlier stages of their S-curve growing faster than other companies.
172
7.4 Limitations of the study and directions for future research
Some of the limitations of the present study and the implications of these limitations are discussed in this chapter.
Limited applicability of empirical hypothesis testing in the general positioning view of the study. The perspective of social constructionists sees the role of positivistic empirical research settings feasible mainly in two areas: (1) illustrating interesting or challenging ideas and (2) tracing patterns of conduct of major significance to the society (Gergen, 1996). As the perpective doubts the existence of universal processes of mind, empirical hypothesis testing regarding them is more or less waste of time. Thus from the positioning ot this research,, the results achieved are more or less just indicative patterns or challenging ideas.
Limited industry, time and geographical focus. The present study focused upon the development of firms developing software products in three Finnish regions 1998-2000. This focus was selected to guarantee homogeneity of the environmental effects so that the effects of concepts under study would become clearer. The one-industry, one timeframe focus limits especially the applicability of the findings related to relationship between previous general experience, previous growth experience, growth orientation and growth. The focus companies were highly growth oriented and during the study period experienced a high growth stage. What would have been the relationship with less growth oriented companies and lower industry growth remains unresolved. The amount of different regions under study: three and the similarities between them prevent us from making any statistical analysis on quantified regional differences as well as saying what might be the normal situation in Finnish regions in general, not to mention other countries. The three regions under study were selected to be similar and are unique even in Finnish setting.
Partially cross-sectional nature of the study. Even though the study has matrix data on the dependent variable, the data on independent variables and mediating construct are cross-sectional. Opportunities for claiming causalities in the identified relationships are thus limited. It can not be made purely on the basis of empirical findings, with the models upon growth orientation. However, the hypotheses were developed on the basis of received theories and empirical research, thus improving the validity of the results as discussed in Chapter 4.4. The models on growth are suffering less on this limitation.
Use of perceptual measures. One of the limitations of this study is that it employs some perceptual measures as key variables. Luckily, the reliability of perceptual measures has been found to be good in many of the studies examining analogous situations such as studies on planned behavior, intended strategies, or performance (Shortell & Zajac, 1990; Venkatraman & Ramanujam, 1987).
173
Majority of variable constructs have been theoretically based and based upon previously validated components. This increases the reliability and validity in the present study, (Nunnally, 1978) and confirmatory factor analysis has been used to increase the validity.
In its attempt to answer the research questions outlined in the Introduction, the present study has pinpointed some areas of potential future research.
The first area is to test whether the found relationships hold also in other contexts. Especially interesting would be to test whether the observed difference between general and situation specific experience hold in other industry contexts, or are the finding limited to only turbulent or high-growth situations.
Also the role of referents needs further testing, but further analysis demands more work on operationalization side of the analysis. Instead of using one-component measures, multi-items scores have to be developed to describe the referent perception.
The idea of old experience losing its value in changing environment and being the limit of the size of companies needs besides further empirical research. Further conceptual analysis is first needed to help us to understand better the effect of the phenomenon of growth of the firm.
Beside the abovementioned directions for further empirical studies; there is also a possibility, and even a need, to expand the theoretical foundation of the research in the future work. One of the most important areas of research related to social constructionism is the social cognition perspective upon organizational decision-making. Social cognition or sociocognition is the study of how people make sense of others and themselves and how cognitive processes influence behavior (Fiske & Taylor, 1991). The basic assumption of the theory is that persons try to make rational decisions, but what she considers rational depends on sense making processes.
Sociocognitive perspective suggests that individuals cope with complex decision making tasks by relying upon the schemata or "knowledge structures" they have developed about their environment (Kiesler & Sproull, 1982; Walsh, 1995). These structures are born as a result of social interaction. Sociocognitive factors affect how beneficial the management sees the growth to be and how willing it is to achieve growth. Even though this study has shed light on how managerial cognition is born in social and cultural environment, it has not directly touched how the social interaction works, or how the structure of social networks affects behavior or cognition. Thus there is a need of more direct analysis and empirical research setting on how sociocognition actually works.
174
7.5 Conclusions
The greatest weakness in the model presented and studied is reflected in Thorngate’s (1976) postulate of commensurate complexity. His postulate states that a theory of social behavior cannot be simultaneously general, accurate and simple. Only two of these characters are possible. The model in this paper has attempted to find general and simple relationships to enrich understanding how and why managers’ mental models guide the behavior of their companies, and the trade-off is that it is not very accurate in specifying details. Empirical testing of the model is used only to explore that the model might work in some occasions, not to define exact parameters or the exact route. The loss in precision is almost unavoidable in this area of research, because an interpretation system that the research has tried to model is an awesomely complex human social activity that may not even at all be amenable to precise measurement (Daft & Wigington, 1979). Unfortunately for the generalizability for the results, it was found in the research that the data used in empirical testing contained some case specific features in relations to relationship between growth experience and growth aspirations. These peculiarities might make the empirically created model accurate in this situation, but in other situation the model might be different, which reduces the possibilities to use the results in defining a general model,
The model presented is far away from a complete model of all the factors affecting growth, growth orientation, or even the birth of growth orientation related mental models. A more complete model would offer challenges for the future research. There are plenty of candidates for new variables; both contingent environmental and organizational like structure, strategy-making process, firm resources and top management team characteristics; and contingency (Lumpkin & Dess, 1996).
As a final answer to the basic research question expressed in the terms of social constructionist’s view “How do some small companies build such managerial mental models that empower their company to grow while the majority of small companies do not achieve this?” this study gives a hint of a general level answer: visible examples in the social environment close to the management guides and frames how managers build their mental models about possibilities in achieving growth. Motivation is supposedly born mainly through this cognitive mechanism, not that much as through seeing the benefits of growth. Earlier mastery learning was not shown to have direct effect on the orientation, but when the aspiration level is set, it helps them to act in a way that makes intentions a reality.
If the main research question is understood to mean, which theories give best understanding on the building of mental models and how they affect, this research gives an answer that in general social constructionism seems to be able to produce some good explanations. Majority of the same explanations can be produced through social cognitive theory, if the relationships of the factors
175
affecting self-efficacy are tuned. Expectancy and planned behavior theories can also mainly lead to same conclusions, but the empirical results shed some questions on their applicability without taking account the views of social constructionists. The views of social constructionists’ shed more light on the understanding of the complex relationship between growth motivation and growth that solely motivation oriented theories do not illustrate fully. It would be difficult to understand why previous general experience moderates negatively growth orientation without the view.
Even if the environments would have been feasible for generalizations, building accurate general models had been very questionable. People in organizations are talented at normalizing deviant events, at reconciling outliers to central tendency, at making do with scraps of information, and at translating equivocal information into feasible alternatives (Weick & Daft, 1983). According to the social constructionist’s view this process is not very systematic and tidy and may vary significantly from one organization and manager to another. Thus it is doubtful whether it is possible to define accurate models that can describe how mental models are born in general in organizations, or in some specific group of organizations. The researcher of this study is satisfied that he has been able to produce more evidence on how social constructionism affects small technology based company behavior and even success. He has shown that success in entrepreneurial growth is at least partly about being able to build relevant mental models through social referents and experience, not just about correct business ideas, strategies, operating in a feasible environment, management static characteristics, and having correct motivational orientation.
176
8 References
Abell, D. F. (1980). Defining the Business: The Starting Point of Strategic Planning. Prentice-Hall, Englewood Cliffs, NJ.
Abrahamson, E. (1996). Management Fashion. Academy of Management Review, 21(1): 254-285.
Abrahamson, E. and Fombrun, C. J. (1992) Forging the iron cage: Interorganizational networks and the production of macro-culture. Journal of Management Studies. 29: 175-194.
Abrahamson, E. and Fombrun, C. J. (1994). Macrocultures: Determinants and consequences. Academy of Management Review, 19(4): 728-755.
Acs, Z. J. and Audretsch, D. B. (1992). The social and economic impact of entrepreneurship. In: Secton, D. L. and Kasadra, J. D. (Eds.). The state of the art of entrepreneurship research. PWS-Kent Publishing Company, Boston, MA. pp. 45-67.
Adams, J. S. (1965). Inequity in social exchange. In Berkowitz (Ed.), Advances in Experimental Social Psychology (Vol. 2). Academic Press, New York, NY.
Adler P. S. and Seok-Woo Kwon. (2002). Social capital: prospects for a new concept. Academy of Management Review. 27(1): 17-40.
Agor, W. H. (1986). The Logic of Intuition: How Top Executives Make Important Decisions. Organizational Dynamics, 3: 5-29.
Aguillar, F. J. (1967). Scanning the Business Environment. Macmillan, New York, NY.
Ahokangas, P. and Räsänen, P. (1999). Growth of small technology-based firms—the Oulu phenomenon and parallel Nordic developments. In: Virtanen, M. (ed.) Proceedings of the Conference on Growth and Job Creation in SMEs. Mikkeli, Finland. January 7-9, 1998.
Ajzen, I. (1985). From intentions to actions: A theory of planned behavior. In J. Kuhl & J. Beckman (Eds.), Action-control: From cognition to behavior. Springer, Heidelberg.
Ajzen, I. (1987). Attitudes, traits, and actions: A theory of planned behavior. In L. Berkowitz (Ed.) Advances in experimental social psychology. Academic Press, New York, NY. pp. 1-63.
Ajzen, I. (1991). The theory of planned behavior. Organization Behavior and Human Decision Processes, 50: 179-211.
Ajzen, I. and Madden, T. J. (1986). Prediction of goal-directed behavior: Attitudes, intentions, and perceived behavioral control. Journal of Experimental Social Psychology, 22: 453-474.
Albert, K. J. (1981). Straight Talk about Small Business. McGraw-Hill, New York, NY.
177
Aldrich, H. (1979). Resource dependence and inter-organizational relations. Administrative Science Quarterly, 7:419-454.
Aldrich, H. (1999). Organizations Evolving. Sage, Thousand Oaks, CA.
Aldrich, H. E. and Marsden, P. V. (1988). Environments and organizations. In: Smelser, N. J. (Ed.) Handbook of sociology. Sage, Newbury Park. pp. 361-392.
Ambrose, M. L. and Kulik, C. T. (1988). Referent sharing: Convergence within workgroups of perceptions of equity and referant choice. Human Relations, 41: 697-707.
Andrews, K. (1971). The concept of corporate strategy. Dow Jones-Irwin, Inc., Homewood, IL. pp. 59-103.
Ansoff, I. (1965). Corporate Strategy, McGraw-Hill, New York, NY.
Ansoff, I. (1957). Strategies for diversification. Harvard Business Review, 35(5): 113-119.
Arenius, P. (1999). Effect of Human Capital, Expected Outcomes of Growth and Performance Level on Entrepreneurial Growth Motivation. Licentiate’s Thesis, Helsinki University of Technology, Espoo.
Argyris, C. and Schön, D. (1978). Organizational learning: A theory of Action Perspective. Addison-Wesley, Reading, MA.
Asiakastieto (2002). Asiakastieto Internet credit information service/ Finnish Subjects. Suomen Asiakastieto Oy, Helsinki.
Autere, J. and Autio, E. (2000). Is entrepreneurship learned? Influence of mental models on growth orientation, growth strategy, and growth. Academy of Management 2000 Conference, Toronto, August 4-9.
Autere, J., Lamberg, I., and Tarjanne, A. (1999). Ohjelmistotuotteilla kansainväliseen menestykseen—Toimialan kehittämistarpeet ja toimenpide-ehdotukset. Teknologiaraportti 74/99. Tekes: Helsinki.
Autio, E. (1995). Symplectic and generative impacts of new, technology-based firms in innovation networks: An international comparative study. Dissertation, Helsinki University of Technology, Institute of Industrial Management, Espoo.
Autio, E., Sapienza H. J., and James G. A. (2000). Effects of age at entry, knowledge intensity, and imitability on international growth. Academy of Management Journal, 43(5): 909–924.
Autio, E., Wallenius, H. and Arenius, P. (1999). Finnish Gazelles: Origins and Impacts. 44th ICSB World Conference, Naples, Italy, June 20-23, 1999.
Avolio B. J., Yammarino F. J. and Bass B. M. (1991). Identifying Common Methods Variance with Data Collected from a Single Source: An Unresolved Sticky Issue. Journal of Management, 17: 571-587.
178
Bagozzi R.P., Yi Y. and Phillips L. W. (1991). Assessing Construct Validity in Organizational Research. Administrative Science Quarterly 36: 421-458.
Bagozzi, R. P. and Warshaw, P. R. (1992). An examination of the etiology of the attitude behavior relation for goal-directed behaviors. Multivariate Behavioral Research, 27(4): 601-634.
Baker W. (1990). Market networks and corporate behavior. American Journal of Sociology, 96: 589-625.
Bandura, A. (1977). Self-efficacy: Toward a unifying theory of behavioral change. Psychological Review, 84: 191-215.
Bandura, A. (1982). Self-efficacy mechanism in human agency. American Psychologist, 37:122-147.
Bandura, A. (1986). Social foundations of thought and action: A social-cognitive theory. Prentice-Hall, Englewood Cliffs, NJ.
Bandura, A. (1992). Exercise of personal agency through self-efficacy mechanisms. In R. Schwartzer and R. A. Wicklund (Eds.) Self-efficacy: Thought control of action. Hemisphere, Washington, DC. pp. 355-394.
Bandura, A. (1995). Exercise of Personal and collective efficacy in changing societies. In Bandura, A. (Ed.) Self-efficay in Changing Societies. Reprint 1999, Cambridge University Press, Cambridge, UK. pp. 1-45.
Bandura, A. (1997). Self-efficacy: The exercise of control. W.H. Freeman and Company, New York, NY. 603 p.
Bandura, A. (2002). Social cognitive theory in cultural context. Journal of Applied Psychology: An International Review, 51: 269-290.
Bandura, A. and Locke, E. A. (2003). Negative self-efficacy and goal effects revisited. Journal of Applied Psychology, 2003, 88(1): 87–99.
Bandura, A. and Schunk, D. (1981). Cultivating competence, self-efficacy, and intrinsic interest through proximal self-motivation. Journal of Personality and Social Psychology, 41:586-598.
Banerjee, P. (2003). Some indicators of dynamic technological competencies: understanding of Indian software managers. Technovation, 23(7): 593-602.
Barkema, H. G. and Vermeulen, F. (1998). International expansion through start-up or acquisition: a learning perspective. Academy of Management Journal, 41(1): 10.
Barkham R., Gudgin G., Hart M., and Hanvey E. (1996). The Determinants of Small Firm Growth: An Inter-Regional Study in the United Kingdom 1986-90 (Regional Policy and Development, No 12). Jessica Kingsley Associates, London.
Barney, J. B. (1986). Organizational Culture: Can It Be a Source of Sustained Competitive Advantage. Academy of Management Review, 11(3): 656-665.
179
Barnett, W. P. and Carroll, G. (1995) Modeling internal organizational change. Annual Review of Sociology, .21: 217-236.
Barney, J. B. (1991). Firm Resources and Sustained Competitive Advantage. Journal of Management, 17(1): 99-119.
Baron, R. (1998). Cognitive mechanisms in entrepreneurship: Why and when entrepreneurs think differently than other people. Journal of Business Venturing, 13(4): 275-294.
Baron, R. (2004). The cognitive perspective: a valuable tool for answering entrepreneurship's basic "why" questions. Journal of Business Venturing, 19(2): 221-239.
Baron, R. M. and David A. K. (1986), The Moderator-Mediator Variable Distinction in Social Psychological Research: Conceptual, Strategic, and Statistical Considerations, Journal of Personality and Social Psychology, 51 (6): 1173-1182.
Barr P. S. and Glynn M. A. (2004). Cultural variations in strategic issue interpretation: relating cultural uncertainty avoidance to controllability in discriminating threat and opportunity. Strategic Management Journal, 25(1): 59-67.
Barr, P. S., Stimpert, J. L. and Huff, A. S. (1992). Cognitive Change, Strategic Action, and Organizational Renewal. Strategic Management Journal, 13:15-36.
Bateson, G. (1955). A Theory of Play and Fantasy. Reprinted in Steps to an Ecology of Mind. 1972, Ballantine books, New York, NY. pp. 117-193.
Baum, J. B. (1995). The relation of traits, competencies, motivation, strategy, and structure to venture growth. In Bygrave, W. D., Bird, B. J., Birley, S., Churchill, N. C., Hay, M., Keeley, R. H., and Wetxel, W. E. (Eds.). Frontiers of Entrepreneurship Research 1995. Babson College, Babson Park, MA. pp. 547-561.
Bayer, B. (1998). Introduction: Re-enchanting constructionist inquiries. In Bayer and John Shotter (eds.) Betty Reconstructing The Psycho-logical Subject. Bodies, Practices and Technologies. Sage, London: 1–20.
Becker, G. S. (1975). Human Capital. (2 ed.). Chicago University Press, Chicago, IL.
Begley, T. and Boyd, D. (1987). A comparison of entrepreneurs and managers of small business firms. Journal of Management, 13(1): 99–108.
Bellu, R. R. and Sherman, H. (1995). Predicting business success from task motivation and attributional style: A longitudinal study. Entrepreneurship & Regional Development, 7: 349-363.
Bettis, R. A. and Prahalad C. K. (1995). The dominant logic: Retrospective and extension. Strategic Management Journal, 16(1): 5-15.
Berger, P. L. and Luckmann, T. (1966). The Social Construction of Reality. Doubleday, Garden City, NY.
180
Birley, S. and Westhead, P. (1994). A comparison of new businesses established by "novice" and "habitual" founders in Great Britain. International Small Business Journal, 12(1): 38-60.
Blattberg, R. C. and Hoch S. J.. (1988). Database Models and Managerial Intuition: 50% Model + 50% Manager. Management Science, 36: 887-899.
Boeker, W. (1989). Strategic Change: The effects of founding and history. Academy of Management Journal, 32(3): 489-525.
Boland, R.J., and Tenaski, R. V. (1995). Perspective making and perspective taking in communities of knowing. Organizational Science, 6: 350-372.
Bollen K. A. (1989). Structural Equations with Latent Variables. John Wiley & Sons, Chapel Hill, NC.
Boone, C., de Brabander, B. and van Witteloostuijn, A. (1996). CEO locus of control and small firm performance: An integrative framework and empirical test. Journal of Management Studies, 33(5): 667-699.
Boston Consulting Group (1970). Perspectives on Experience. Boston Consulting Group, Boston, MA.
Boulding, K. E. (1956). General systems theory: The skeleton of science. Management Science, 2:197-207.
Boyd, N. G. and Vozikis, G. S. (1994). The influence of self-efficacy on the development of entrepreneurial intentions and actions. Entrepreneurship Theory and Practice, 18(4): 63-77.
Bowen, D. D. and Hisrich, R. D. (1986). The female entrepreneur: A career development perspective. Academy of Management Review, 11(2): 393-407.
Bowonder B., Yadav S. and Sunil Kumar B. (2000). R&D spending patterns of global firms. Research Technology Management, 43(5): 40-56.
Brown T. E., Davidsson P. and Wiklund J. (2001). An operationalisation of Stevenson's conceptualization of entrepreneurship as opportunity-based firm behavior. Strategic Management Journal, 22: 953–968.
Bruner, J. (1990). Acts of Meaning. Harvard University Press, Cambridge, MA.
Bruner, J. S., Goodnow, J. J. and Austin, G. A. (1956). A Study of Thinking. John Wiley, New York, NY.
Bruno, A. V. and Tyebjee, T. T. (1982). The environment for entrepreneurship. In: Kent, C. A., Sexton, D. L., and Vesper, K. H. (Eds.). The encyclopedia for entrepreneurship. Prentice-Hall, Englewood Cliffs, NJ. pp. 288-316.
Brush, C.G. and Vanderwerf, P.A. (1992). A comparison of methods and sources for obtaining estimates of new venture performance. Journal of Business Venturing, 7: 157–170.
181
Burns, T. and Stalker, G. M. (1961). The Management of Innovation. Tavistock, London.
Burr, V. (1995). An introduction to social constructionism. Routledge, London.
Burrel, G. and Morgan, G. (1979). Sociological paradigms and organizational analysis. Heinemann, London.
Burt, R. S. (1987). Social contagion and innovation, cohesion versus structural equivalency. American Journal of Sociology, 92: 1287-1335.
Busenitz, L. W, and Barney, J. B. (1997). Differences between entrepreneurs and managers in large organizations: Biases and heuristics in strategic decision-making. Journal of Business Venturing. 12(1): 9-30.
Busenitz, L. W. and Lau, C. (1996). A cross-cultural cognitive model of new venture creation. Entrepreneurship Theory and Practice, 20(4): 25-39.
Byrne B. M. (2001). Structural Equation Modeling with AMOS: Basic Concepts, Applications, and Programming. Lawrence Erlbaum Associates, Inc., Mahwah, NJ.
Calantone, R. and Cooper, R. G. (1981). New Product Scenarios: Prospects for Success. Journal of Marketing, 45(2): 48-60.
Calori, R., Johnson, G., and Sarnin, P. (1992). French and British managers’ understanding of the structure and the dynamics of the industries: A cognitive analysis and comparison. British Journal of Management, 3: 61-78.
Campbell, D. (2000). The Socially Constructed Organization. Kamac, London.
Cambridge Small Business Research Centre (1992). The State of British Enterprise. Department of Applied Economics, University of Cambridge.
Campbell, D. T. and Fiske, D. W. (1959) Convergent and discriminant validity by the multitrait-multimethod matrix. Psychological Bulletin. 56: 81-105.
Campbell, D. T. and Stanley, J. C. (1963). Experimental and Quest-Experimental Designs for Research. RandMcNally & Company, Chicago, Ill.
Carland, J. W., Hoy F., Boulton W. R., and Carland J. A. C. (1984). Differentiating entrepreneurs from small business owners: A conceptualization. Academy of Management Review 9(2): 354-359.
Carmines E. G. and Zeller R. A. (1979). Reliability and Validity Assessment. Sage, Beverly Hills, CA.
Castrogiovanni, G. J. (1991). Environmental munificence: a theoretical assessment. Academy of Management Review, 16(3): 542-565.
Chaffee, E. E. (1985). Three Models of Strategy. Academy of Management Review, 10(1):89-98.
Chamberlin, E. (1933). The theory of monopolistic competition. Harvard University Press, Cambridge, MA.
182
Chandler, A. C. (1962). Strategy and Structure: Chapters in the History of the American Industrial Enterprise. Nineteenth printing 1995, The MIT Press, Cambridge, MA.
Chandler, A. D., Jr. (1991). The Functions of the HQ Unit in the Multibusiness Firm. Strategic Management Journal, 12: 31-50.
Chen, C. S., Greene, P. and Crick, A. (1998). Does Entrepreneurship Self-Efficacy Distinguish Entrepreneurs from Managers? Journal of Business Venturing, 13(4): 523-542.
Chen, M.-J. and Miller, D. (1994). Competitive Attack, Retaliation and Performance: An expectancy-valency framework. Strategic Management Journal, 15: 85-102.
Child, J. (1972). Organizational structure, environment and performance. The role of strategic choice. Sociology, 6: 1-22.
Churchill, N. C. and Lewis, V. L. (1983). The five stages of small business growth. Harvard Business Review, May-June 1983: 30-50.
Cohen, J. and Cohen, P. (1983). Applied multiple regression/correlation analysis for the behavioral sciences. 2nd edition, Lawrence Erlbaum Associates, Hillsdale, NJ.
Coleman, J. (1988). Social capital in the creation of human capital. American Journal of Sociology, 94: 95-120.
Conner, K. R. (1991). A historical comparison of resource-based theory and five schools of thought within industrial organization economics: do we have a new theory of the firm? Journal of Management, 17(1): 121-154.
Cook, K. (1977). Exchange and power in networks of inter-organizational relations. The Sociological Quarterly, 18: 62-82.
Cooney, T. M. and O’Driscoll, A. (1999). High-growth firms in the software industry: Comparing Ireland with America through structure, strategy, and entrepreneurial teams. Paper presented in Babson-Kauffman conference May 1999, Columbia, SC.
Cooper, A. C. and Dunkelberg, W. C. (1986). Entrepreneurship and Paths to Business Ownership; Summary. Strategic Management Journal 7(1): 53-68.
Cooper, A. C., Dunkelberg W.C., and Woo, C. Y. (1988). Survival and failure: A longitudinal study. Frontiers of Entrepreneurship Research 1988. Babson College, Babson Park, MA, pp. 222-237.
Cooper, A.C. and Gascon, F. J. G. (1992). Entrepreneurs, processes of founding, and new-firm performance. In: Sexton, D.L. and Kasarda, J.D., Editors, 1992. The State of the Art of Entrepreneurship,.PLOS-KENT Publishing, Boston, pp. 301–340.
Cooper, A. C., Gimeno-Gascon, F. J., and Woo, C. Y. (1994). Initial human and financial capital as predictors of new venture performance. Journal of Business Venturing. 9: 371-395.
Cooper, A. C., Willard, G. E., and Woo, C. Y. (1986). Strategies of high-performing new firms: a reexamination of the niche concept. Journal of Business Venturing, 1(3): 247-260.
183
Cooper, R. G. (1983). The Impact of New Product Strategies. Industrial Marketing Management, 12(4): 243-256.
Corano, M and Frieze, I. H. (2000). Pollution reduction preferences of U.S. environmental managers: applying Ajzen’s theory of planned behavior. Academy of Management Journal, 43(4): 627-641.
Corner, P. D., Kinicki, A. J., and Keats, B. W. (1994). Integrating Organizational and Individual Information Processing Perspectives of Choice. Organization Science, 1994/3: 294-308.
Covin, J. G. and Slevin, D. P. (1989). Strategic management of small firms in hostile and benign environments. Strategic Management Journal, 10: 75-87.
Covin, J. G., Slevin, D. P., and Covin, T. J. (1990). Content and performance of growth-seeking strategies: A comparision of small firms in high- and low-technology industries. Journal of Business Venturing. 4: 391-412.
Cromby, J. and Nightingale, D. (1999). What’s wrong with social constructionism? In D. Nightingale and J. Cromby (eds.) Social Constructionist Psychology. Open University Press, Buckingham: 1–20.
Cronbach, L. J. and Meehl, P. E. (1955). Construct validity in psychological tests. Psychological Bulletin, 52: 281-302.
Crossan, M. M., Lane, H. W. and White, R. E. (1999). An organizational learning framework: From intuition to institution. Academy of Management Review 24(3): 522-537.
Cyert, R. M. and March, J. M. (1963). A Behavioral Theory of the Firm. New York NY: Prentice-Hall.
Daake D., Dawley D. D. and Anthony W. P. (2004). Formal Data Use in Strategic Planning: An Organizational Field Experiment. Journal of Managerial Issues, 16(2) pg. 232-347.
Daft, R. L. and Weick, K. E. (1984). Toward a model of organizations as interpretative systems. Academy of Management Review, 9: 284-295.
Daft, R. L. and Wigington, J. C. (1979). Language and organization. Academy of Management Review, 4:179-192.
Das T.K. and Teng B-S. (1999). Cognitive Biases and Strategic Decision Processes: An Integrative Perspective. Journal of Management Studies, 36(6): 757-778.
Datamonitor (2003a). Global Software & Services, Reference Code: 0199-2139. Publication date: May 2003. London.
Datamonitor (2003b). Global Software, Reference Code: 0199-0381. Publication date: June 2003. London.
Davidsson P. (1989). Continued Entrepreneurship and Small Firm Growth. Stockholm School of Economics, Stockholm.
Davidsson, P. (1992). Environment and entrepreneurship: culture, structure, and new firm formation rates in Sweden. Paper presented at the ENDEC World Conference on Entrepreneurship, Singapore, August.
184
Davidsson, P., Lindmark, L. and Olofsson, C. (1996). Näringlivsdynamik under 90-talet. info 326-1996. Nutek, Stockholm.
Davidsson, P. and Wiklund, J. (1997). Values, beliefs and regional variations in new firm formation rates. Journal of Economic Psychology, 18(2,3): 179-200.
Davis, G., F. (1991). Agents without Principles? The Spread of the Poison Pill through the Intercorporate network. Administrative Science Quarterly, 36: 583 - 613.
Deakins, D. and Freel, M. (1998). Entrepreneurial learning and the growth process in SMEs. The Learning Organization, 5(3): 144.
Deci, E. L. and Ryan, R. M. (1985). Intrinsic Motivation and Self-Determination in Humann Behaviour. Plenum, New York.
Delmar, F. (1996). Measuring growth: Methodological considerations and empirical results. Paper presented at the RENT X, Brussels.
Dewey, J. (1938). Logic: The Theory of Inquiry. Holt, New York.
DeVellis, R. F. (2003). Scale Development; theory and applications, second edition. SAGE Publications, Thousand Oaks, CA.
D’Aunno, T. A. and Zuckerman, H. S. (1987). A life-cycle model of organizational federations: The case of hospitals. Academy of Management Review, 12: 543-545.
Dierickx, I. and Cool, K. (1989). Asset Stock Accumulation and Sustainability of Competitive Advantage. Management Science, 35(12): 1504-1523.
DiMaggio, P. J. and Powell, W. W. (1983). The Iron Cage Revisited: Institutional Isomorphism and Collective Rationality in Organizational Fields. American Sociological Review, 48: 147-160.
Doll, J. and Ajzen, I. (1992). Accessibility and stability of predictors in theory of planned behavior. Journal of Personality and Social Psychology, 63(5): 754-756.
Dodge H. R. and Robbins J. E. (1992). An empirical investigation of the organizational life cycle model for small business development and survival. Journal of Small Business Management, 30(1): 27-28.
Dooley, D. (1995). Social Research Methods. Third Edition. Prentice-Hall: Englewood Cliffs, NJ.
Doorley, T. L. and Donovan, J. M. (1991) Value-creating growth. Jossey-Bass Publishers, San Francisco, CA.
Dore, R. (1983). Goodwill and the spirit of market capitalism. British Journal of Sociology, 34: 459-482.
Dougherty, D., Borrelli, L., Munir, K., and O'Sullivan, A. (2000). Systems of organizational sense making for sustained product innovation, Journal of Engineering and Technology Management, 17: 321-55.
185
Downing, S. (2005). The social construction of entrepreneurship: narrative and dramatic processes in the coproduction of organizations and identities. Entrepreneurship Theory and Practice, 30(2): 185-204.
Dunkelberg, W. G., Cooper A. C., Woo C., and Dennis, W. J. (1987). New Firm Growth and Performance. In N.C. Churchill, J.A. Hornaday, B.A. Kirchhoff, C.J. Krasner and K.H. Vesper (Eds.), Frontiers of Entrepreneurship Research. Babson College, Boston, MA.
Dunning, J. (1988) The eclectic paradigm of international production: A restatement. Journal of International Business Studies, 19(1): 1-32.
Dunteman, G. H. (1989). Principal components analysis. Sage Publications, Quantitative Applications in the Social Sciences Series, No. 69, Thousand Oaks, CA.
Durham, C., Knight, D. and Locke, E. (1997). Effects of leaderrole, team-set goal difficulty, efficacy, and tactics on team effectiveness. Organizational Behavior and Human Decision Processes, 72: 203-231.
du Toit, A. (2003). Knowledge: A sense making process shared through narrative. Journal of Knowledge Management, 7(3): 27-37.
Eagly, A.H. and Chaiken, S. (1993). The Psychology of Attitudes. Harcourt Brace Jonanovich, Inc., Orlando, FLA.
Earley, P.C. and Shalley, C.E. (1991). New perspectives on goals and performance: Merging motivation and cognition. In G. R. Ferris and K. M. Rowland (Eds.) Research in personnel and human resources management (Vol. 8). JAI Press, Greenwich, CT. pp. 121-157.
Edmonson, A. C. (2002). The Local and Variegated Nature of Learning in Organizations: A Group-Level Perspective. Organization Science, 13(2): 128-146.
Eisenhardt, K. M. and Schoonhoven C. B. (1990). Organizational Growth: Linking Founding Team, Strategy, Environment, and Growth among U.S. Semiconductor Ventures, 1978-1988. Administrative Science Quarterly, 35: 504-529.
El Sawy, O. A. and Pauchant, T. C. (1988). Triggers, Templates, and Twitches in the Tracking of Emerging Strategic Issues. Strategic Management Journal, 9: 455-474.
Emerson, R. (1962). Power Dependence Relations. American Sociological Review, 27: 31-41.
Enright, M. J. (1996). Regional clusters and economic development: A research agenda. In U. H. Staber et al (Eds.) Business Networks: Prospects for Regional Development. Walter de Gruyter, Berlin.
Erez, M. and Earley, P. C. (1993). Culture, self-identity and work. Oxford University Press, New York, NY.
Feigenbaum, A. and Thomas, H. (1995). Strategic groups as reference groups: Theory, modeling and empirical examination of industry and competitive strategy. Strategic Management Journal. 16(6): 461-476.
186
Festinger, L. (1950). Informal social communication. Psychological Review, 57: 271-282.
Fiol, C. M. and Lyles, M. A. (1985). Organizational learning. Academy of Management Review. 10(4): 803-813.
Fiol, C. M and O’Connor, E. J. (2003). Waking up! Mindfulness in the face of bandwagons. Academy of Management Review. 28(1): 54-70.
Fiske, S. T. and Taylor, S. E. (1991). Social cognition. 2nd edition, McGraw-Hill, New York, NY.
Florida, R. and Kenney, M. (1988). Venture Capital-financed Innovation and Technological Change in the USA. Research Policy, 17: 119-137.
Flynn, D. M. (1993). A critical exploration of sponsorship, infrastructure, and new organizations. Small Business Economics, 5: 129-156.
Fombrun, C. J. and Ginsberg, A. (1990). Shifting gears: Enabling change in corporate aggressiveness. Strategic Management Journal, 11(4): 293-307.
Ford, R. H. (1987). The Value Of Outside Directors: Myth or Reality? Business, 37(4): 44-49.
Forslund, M. (2002). Det omöjliggjorda entreprenörskapet - om förnyelsekraft och företagsamhet på golvet. Vaxsjö Universitet, Vaxsjö.
Foss, N. (1993). Theories of the firm: contractual and competence perspectives. Journal of Evolutionary Economics, 3(12): 127-144.
Foss, N. (1996). Knowledge-Based Approaches to the Theory of the Firm: Some Critical Comments. Organization Science, 7(5): 470-476.
Foss, K. and Foss, N. (2000). Economic organisation in a process perspective. In: J. Krafft (Ed.) The Process of Competition. Edward Elgar, Cheltenham. pp. 27–48.
Fox, M. A. and Hamilton, R. T. (1994). Ownership and diversification: Agnecy theory of stewardship theory. Journal of Management Studies, 31: 69-81.
Freeman, J. and Hannan, M. T. (1983). Niche width and the dynamics of organizational populations. American Journal of Sociology, 88(6): 1116-1145.
Friedkin, N. E. (1984). Structural cohesion and equivalency explanations of social homogeneity. Sociological Research and Methods, 12: 235-261.
Frink D. D, and Ferris, G. R. (1998). Accountability, Impression Management, and Goal Setting in the Performance Evaluation Process. Human Relations, 51(10): 1259-1283.
Fujita, M. (1988). A monopolistic competition model of spatial agglomeration: A differentiated product approach. Regional Science and Urban Economics, 18: 87–124.
Fuller, T. (2002). Social constructionism and reflexivity; researchers and owner managers are not immune; but it is science? Working paper; Presented at RENT XVI RESEARCH
187
IN ENTREPRENEURSHIP AND SMALL BUSINESS 16TH Conference Barcelona, Spain - November 21-22, 2002.
Galasgiewicz, J. (1985). Interorganizational relations. In R.H. turner and J.F. Short, Jr. (Eds.) Annual review of sociology, 11: 281-304.
Galaskiewicz, J. and Waaserman, S. (1989). Mimetic processes within an interorganizational field: An empirical test. Administrative Science Quarterly, 34:454-479.
Galbraith, J. R. (1977). Organizational design. Addison-Wesley, Reading MA.
Galbraith, J. (1982). The stages of growth. Journal of Business Strategy, 3(1): 70-79.
Gartner, W. B. (1988). ‘Who is the entrepreneur?’ is the wrong question. American Journal of Small Business, 12(4): 11-32.
Gartner, W. B. (1990). What are we talking about when we talk about entrepreneurship? Journal of Business Venturing, 5: 15–28.
Garvin, D. (2000). Learning in Action. Harvard Business School Press, Boston, MA.
Geletkanycz, M. A. and Hambrick, D. C. (1997). The External Ties of Top Executives: Implications for Strategic Choice and Performance. Administrative Science Quarterly, 42: 654-681.
Gergen, K. (1985). The social constructionist movement in modern psychology. American Psychologist, 40: 266-275.
Gergen, K. J. (1990). Toward a postmodern psychology. The Humanistic Psychologist, 18: 23-34.
Gergen, K. J. (1994). Toward Transformation in Social Knowledge. 2nd ed., Sage, London.
Gergen, K. J. (1996) Social psychology as social construction: The emerging vision. In C. McGarty and A. Haslam (eds.) The Message of Social Psychology: Perspectives on Mind in Society, Blackwell, Oxford.
Geroski, P. A. (2000), The growth of firms in theory and practice, in N. Foss and V. Mahnke (eds), Competence, Governance, and Entrepreneurship: Advances in Economic Strategy Research. Oxford University Press, Oxford.
Gist M. E. (1987). Self-efficacy: Implications for organizational behavior and human resource management. Academy of Management Review, 12(3): 472-485.
Gist, M. E. and Mitchell, T. R. (1992). Self-efficacy: A theoretical analysis of its determinant and malleability. Academy of Management Review, 17(2): 183-211.
Glaser, R. (1984). Education and thinking. American Psychologist, 39: 93-104.
Goes, J. B. and Park, S. H. (1997). Interorganizational links and innovation: The case of hospital services. Academy of Management Journal, 40(3): 673-696.
188
Goffman, I. (1959). The Presentation of Self in Everyday Life. Doubleday Anchor, New York, NY.
Goffman, I. (1974). Frame analysis: An essay on the organization of experience. Harper Row, New York, NY.
Gomez, P-Y. and Jones, B. C. (2000). Conventions: An interpretation of deep structure in organizations. Organization Science. 11(6): 696
Goodman, P. S. (1974). An examination of referents used in the evaluation of pay. Organizational Behavior and Human Performance, 13: 170-195.
Granovetter, M. (1985). Economic Action and Social Structure: The Problem of Embeddedness. American Journal of Sociology, 91(3): 481-510.
Grant, R. M. (1991). The resource-based theory of competitive advantage: Implications for strategy formulation. California Management Review, 33(3): 114-135.
Greenberg, J. (1985). Unattainable goal choice as a self handicapping strategy. Journal of Applied Social Psychology, 15: 87-101.
Greve, H. R. (1996). Patterns of competition: The diffusion of market position in radio broadcasting. Administrative Science Quarterly, 40(September): 29-60.
Greve, H. R. (1998). Managerial Cognition and the Mimetic Adoption of Market Positions: What You See is What You Do. Strategic Management Journal, 19: 968-972.
Grimm, C. M. and Smith, K. G. (1991). Management and organizational change: A note on the railroad industry. Strategic Management Journal. 12(7): 557-562.
Gulati R. and Gargiulo, M. (1999). Where do interorganizational networks come from? American Journal of Sociology. 104: 1439-1493.
Gupta, A. K. (1984). Contingency linkages between strategy and general manager characteristics: a conceptual examination. Academy of Management Review, 9: 399-412.
Hackley, C. (1998). Mission statements as corporate communications: The consequences of social constructionism. Corporate Communications, 3(3) 92-98.
Hackman, J. R. (1992). Group influences on individuals on organizations. In M. D. Dunnette and L. M. Hough (Eds.) Handbook of Industrial and Organizational Psychology. Consulting Psychologists Press, Inc., Palo Alto, CA.
Hackman, J. R. and Oldham G. R. (1980). Work Redesign. Addison-Wesley, Reading, MA.
Hair, J. F., Anderson, R. E., Tatham R. L., and Black W. C. (1998). Multivariate Data Analysis. Fifth Edition, Prentice Hall, NJ, 729 p.
Hakim, C. (1989). Identifying Fast Growth Small Firms. Employment Gazette, January 1989: 29-41.
189
Hall, G. (1989). Lack of Finance as a Constraint on the Expansion of Innovatory Small Firms. In J. Barber, J. S. Metcalf and M. Porteus (Eds.) Barriers to Growth in Firms. Routledge, London.
Hall, R. (1992). The strategic analysis of intangible resources. Strategic Management Journal, 13: 135-144.
Hall, R. (1993). A Framework Linking Intangible Resources and Capabilities to Sustainable Competitive Advantage. Strategic Management Journal, 14: 607-618.
Hambrick, D. C., Geletkanycz, M. A., and Fredrickson, J. W. (1993). Top executive commitment to the status quo: Some tests of its determinants. Strategic Management Journal. 14(6): 401-418.
Hambrick, D. C. and Mason, P. A. (1984). Upper echelons: the organization as a reflection of its top managers. Academy of Management Review, 16: 193-206.
Hamer, D. and Copeland, P. (1994). The Science of Desire: The Search for the Gay Gene and the Biology of Behavior. Simon & Schuster, New York, NY.
Hanks, S. H., Watson, C. J., Jansen, E. and Chandler, G. N. (1993). Tightening the life-cycle construct: A study of growth stage configurations in high-technology organizations. Entrepreneurship Theory and Practice, 18(2): 5-29.
Hanks, S. H. and Chandler, G. N. (1994). Patterns of functional specialization in emerging high tech. Journal of Small Business Management, 32(2): 23-36.
Hannan, M. T. and Freeman, J. (1977). The Population Ecology of Organizations. American Journal of Sociology. 82(5): 929-964.
Hansen, E. L. and Bird, B. J. (1998). The Stages Model of High-Tech Venture Founding: Tried But True? Entrepreneurship Theory and Practice. 22(2): 111-122.
Harre, R. (1998). The Singular Self: An Introduction to the Psychology of Personhood. Sage, London.
Harre, R. and Stearns, P. (1995). Discursive Psychology in Practice. Sage, London.
Hastie, R. (1981). Schematic principles in human memory. In: Higgins, E. T., Herman C. P., and Zanna, M. P. (Eds.) Social Cognition: The Ontario Symposium, Vol. 1. Erlbaum, Hillsdale, NJ: pp. 39-88.
Hatten, T. S. (1997). Small Business: Entrepreneurship and Beyond. Prentice-Hall, Upper Saddle River, NJ.
Haunschild, P. R. (1994). How much is the company worth? Interorganizational relationships, uncertainty, and acquisition premiums. Administrative Science Quarterly. 39: 391-411.
Haunschild, P. R. (1993). Interorganizational Imitation: The Impact of Interlocks on Corporate Acquisition Activity. Administrative Science Quarterly, 38: 564-592.
190
Hay, M. and Kamshad, K. (1994). Small firm growth: Intentions, implementation, and impediments. Business Strategy Review, 5(3): 49-68.
Hayes, R. H., Wheelwright, S. C., and Clark, K. B. (1988). Dynamic Manufacturing: Creating the Learning Organization. The Free Press, London, U.K.
Heider, F. (1958). The psychology of interpersonal relations. Wiley, New York, NY.
Hellgren, B. and Melin, L. (1993). The Role of Strategists’ Ways-of-Thinking in Strategic Change Processes. In J. Hendry, G. Johnson, and J. Newton (Eds.) Strategic Thinking: Leadership and the Management of Change. John Wiley, Chichester. pp. 47-68.
Herron, L. and Sapienza, H. J. (1992). The entrepreneur and the initiation of new venture launch activities. Entrepreneurship Theory and Practice, 17(1): 49-55.
Herzberg, F., Mausner, B., and Snyderman, B. B. (1959). The motivation to work. Wiley, New York, NY.
Hietala, J., Maula, M. V. J., Autere, J., Lassenius, C., Kari, N., and Autio, E. (2002). Finnish Software Product Business: Results from the National Software Industry Survey 2002. Centre of Expertise for Software Product Business and Helsinki University of Technology, Espoo.
Hill, R. C. and Levenhagen, M. (1995) Metaphors and mental models: Sensemaking and sensegiving in innovative and entrepreneurial activities. Journal of Management, 21(6): 1057-1074.
Hitt, M. A., Gimeno, J., and Hoskisson, R. E. (1997). Current and future research methods in strategic management. Paper presented at the Academy of Management meetings, Boston.
Hitt, M. A. and Tyler, B. B. (1991). Strategic decision models: Integrating different perspectives. Strategic Management Journal, 12: 327-351.
Hoch, D. J., Roeding, C. R., Purkert G., Lindner, Sandro K., and Müller R. (1999). Secrets of Software Success: Management Insights from 100 Software Firms around the World. Harvard Business School Press, Cambridge, MA. 312 p.
Hodginson, G. P. and Johnson, G. (1994). Exploring the Mental Models of Competitive Strategists: The Case for a Processual Approach. Journal of Management Studies, 31(4): 525 – 551.
Hofer, C. and Schendel, D. (1978). Strategy Formulation: Analytical concepts. West, St. Paul, MN.
Honderich, T. (Ed.) (1995). The Oxford Companion to Philosophy. Oxford University Press, Oxford.
Hoover, E. M. (1948). The location of economic activity. McGraw-Hill, NewYork.
Hoy, F., McDougall, P. P. and Dsouza, D. E. (1992). Strategies and environments of high growth firms. In D.L. Sexton and J.D. Kasarda (Eds.), The State of the Art of Entrepreneurship. PWS-Kent Publishing, Boston, MA. pp. 341-357.
191
Huber, V. L. (1985). Effects of task difficulty, goal setting and strategy on performance of a heuristic task. Journal of Applied Psychology, 70: 492-504.
Huszynski, A. A. and Buchanan, D. A. (1991) Organizational behavior. Prentice Hall International (UK), Hertfordshire.
Ilgen, D. R., Nebeker, D. M. and Pritchard, R. D. (1981). Expectancy theory measures: An empirical comparison in an experimental simulation. Organizational Behavior and Human Performance, 28: 189-223.
Inkeles, A. and Levinson, D. J. (1969). National character: The study of model personality and sociocultural systems. In G. Lindsey and E. Aronson (Eds.) The handbook of social psychology (2nd ed., Vol. 4). Addison-Wesley, Reading, MA.
Isard, W. (1956). Location and space economy. Technological press of MIT, New York, NY, and Wiley, New York, NY.
Isard, W. (1960). Methods of regional analysis: an introduction to regional science. Technological press of MIT, New York, NY, and Wiley, New York, NY.
Janis, I. L. (1972). Victims of Groupthink. Houghton-Mifflin, Boston, MA.
Jensen, M. C. (1998). Self-interest, altruism, incentives, and agency. In M. C. Jensen (Ed.) Foundations of organizational strategy. Harvard University Press, Cambridge, MA. pp. 39-50.
Jensen, M.C. and W.H. Meckling, (1976), Theory of the firm: Managerial behavior, agency costs and ownership structure, Journal of Financial Economics, 3: 305-360.
Johansson B. and Quigley J. M. (2003). Agglomeration and networks in spatial economies. Papers in Regional Science, 83(1): 165-176.
Jones (1991). Employment Change in Small Firms: A Cohort Analysis from 1985, 1988 and 1991 Survey Findings. Paper presented to 14th Small Firms Policy and Research Conference, Blackpool, November 1991.
Jones, E. E. and Davis, K. E. (1965). From acts to dispositions: The attributional process in personal perception. In L. Berkowitz (Ed.) Advances in experimental social psychology (Vol. 2). Academic Press, New York, NY. pp. 219-266.
Jonson, G. (1992). Managing Strategic Change—Strategy, Culture and Action. Long Range Planning, 25(1): 28-36.
Joreskog, K. G. and Sorbom D. (1988). LISREL 7: A Guide to the Program and Applications. SPSS, Inc.: Chicago, IL.
Kahneman, D., Slovic, P., and Tversky, A. (Eds.) (1982). Judgment under uncertainty: Heuristics and biases. Cambridge University Press, New York, NY.
Kaiser, H. F. (1960). The application of electronic computers to factor analysis. Educational and Psychological Measurement, 20:141-151.
192
Kalleberg, A. L. and Leicht K. T. (1991). Gender and Organizational Performance: Determinant of Small Business Survival and Success. Academy of Management Journal, 34(1): 136-161.
Kanfer, P. and Ackerman, P. L. (1989). Motivation and Cognitive Abilities: An Integrative/Aptitude-Treatment Interaction Approach to Skill Acquistion. Journal of Applied Psychology, 74(4): 657-690.
Kavanagh, D. J. and Bower, G. H. (1985). Mood and self-efficacy: Impact of joy and sadness on perceived capabilities. Cognitive Therapy and Research, 9: 507-525.
Kazanjian, R. K. (1988). Relation of Dominant Problems to Stages of Growth in Technology-Based New Ventures. Academy of Management Journal, 31 (June): 257-279.
Kazinjian, R., and Drazin, R. (1990). A stage contingent model of design and growth for technology based new ventures. Journal of Business Venturing. 5: 137-150.
Keats, B. W. and Bracker, J. S. (1988). Toward a theory of small firm performance: a conceptual model. American Journal of Small Business, 14: 41-58.
Keeley, R. H., Roure, J. B., Goto, M. and Yoshimura, K. (1990). An international comparison of new ventures. In: Churchill, N. C., Bygrave, W. D., Hornaday, J. A., Muzyka, D. F., Vesper, K. H., and Wetzel, W. E. (Eds.) Frontiers of Entrepreneurship Research 1990. Babson College, Babson Park, MA. pp 472-496.
Keesing, R. M. (1974). Theories of culture. Annual Review of Antropology, 3:73-97.
Kenney, M. and von Burg, U. (1999). Technology, Entrepreneurship and Path Dependence: Industrial Clustering in Silicon Valley and Route 128. Industrial and Corporate Change, 8(1): 67-103.
Kets de Vries, M. F. R. (1996). The anatomy of the entrepreneur: Clinical observations. Human Relations, 49(7): 853-884.
Kevin, T. (2000). Policy review section: Creating regional cultures of innovation? The regional innovation strategies in England and Scotland. Regional Studies, 34(2): 190-198.
Khatri, N. and Ng, H. A. (2000). The role of intuition in strategic decision making. Human Relations, 53(1): 57-86.
Kiesler, S., and Sproull, L. (1982). Managerial response to changing environments: Perspectives on problem sensing from social cognition. Administrative Science Quarterly, 27: 548-570.
Kimberly, J. R. (1975). Environmental constraints and organizational structure: A comparative analysis of rehabilitation organizations. Administrative Science Quarterly. 20: 1-19.
Kim, M-S. and Hunter, J. E. (1993). Attitude-behavior relations: A meta-analysis of attitudinal relevance and topic. Journal of Communication, 43(1): 101-142.
Kinsella, R. P., Clarke, W., Coyne, D., Mulvenna, D., and Storey, D. J. (1993). Fast Growth Firms and Selectivity. Irish Management Institute, Dublin.
193
Kirchhoff, B. (1994). Entrepreneurship and Dynamic Capitalism. Praeger, Westport, CT.
Khandwalla, P. N. (1977). The design of organizations. Harcount Brace Jovanovich, New York, NY.
Kharti, N. and Ng H. A. (2000). The Role of Intuition in Strategic Decision Making. Human Relations, 53: 57-86.
Kogut, B. and Zander, U. (1996). What Firms Do? Coordination, Identity, and Learning. Organization Science, 7(5): 502-518.
Kolb, D. A. (1984). Experiental Learning. Prentice-Hall, Englewood Cliffs, NJ.
Kolvereid, L. (1992). Growth Aspirations among Norwegian Entrepreneurs. Journal of Business Venturing, 7(3): 209-222.
Kolvereid, L. and Bullvåg E. (1996). Growth intentions and actual growth: The impact of entrepreneurial choice. Journal of Enterprising Culture, 4(1): 1-17.
Kor, Y. Y. (2003). Experience-Based Top Management Team Competence and Sustained Growth. Organization Science. 2003, 14(6): 707-719.
Kunkel, S. W. and Hofer, C. W. (1993). The impact of industry structure on new venture performance: some new findings. In: Churchill, N. C., Birley, S., Bygrave, W. D., Doutriaux, J., Gatewood, E. J., Hoy, F. S., and Wetzel, W. E. Jr. (Eds.). Frontiers of Entrepreneurship Research 1993. Babson College, Babson Park, MA, pp. 1-15.
Lane, P. J., Cannella, A. A. and Lubatkin, M. H. (1998). Agency problems as antecedents to unrelated mergers and diversification: Amihud and Lee reconsidered. Strategic Management Journal, 19: 555-578.
Langfield-Smith, K. (1992). Exploring the need for a shared cognitive map. Journal of Management Studies 29 (3).
Lant, T. K. and Mezias, S. J. (1992). An organizational learning model of convergence and reorientation. Organizational Science, 3(1): 47-71.
Latham, G. P, and Seijts, G. H. (1999). The effects of proximal and distal goals on performance on a moderately complex task. Journal of Organizational Behavior, 20: 421-429.
Latham, G. P. and Lee, T. W. (1986). Goal setting. In E. Locke (Ed.) Generalizing from Laboratory to Field Settings. Lexington Books, Lexington, MA.
Laukkanen, M. (1989). Understanding the formation of managers' cognitive maps: a comparative case study of context traces in two business firm clusters. Helsinki School of Economics (A-65), Helsinki.
Law, K. S. and Wong, C-S. (1998). Relative importance of referents on pay satisfaction: A review and test of a new policy-capturing approach. Journal of Occupational and Organizational Psychology, 71: 47-60.
194
Lawler, E. E (1971). Pay and organizational effectiveness: A psychological review. McGraw-Hill, New York, NY.
Lee, P. M. and O’Neill H. M. (2003). Ownership structures and R&D investments of U.S. and Japanese firms: agency and stewardship perspectives. Academy of Management Journal, 46(2): 212-225.
Lei, D., Hitt, M. A. and Bettis, R. (1996). Dynamic core competences through meta-learning and strategic context. Journal of Management; 22(4): 549-570.
Levitt, B. and March, J. (1988). Organizational learning. Annual Review of Sociology, 14: 319-340.
Liao J. and Welsch H. (2003). Social capital and entrepreneurial growth aspiration: A comparison of technology- and non-technology-based nascent entrepreneurs. Journal of High Technology Management Research, 14(1): 149.
Lin N., Ensel, W. M., and Vaughn J. C. (1981). Social resources and strength of ties: Structural factors in occupational status attainment. American Sociological Review, 46: 393-405.
Lin, N. (1999). Social networks and status attainment. Annual Review of Sociology, 25: 467-487.
Litt, M. D. (1988). Self-efficacy and perceived control: Cognitive mediators of pain tolerance. Journal of Personality and Social Psychology, 54: 149-160.
Littunen, H. & Tohmo, T. (2003). The High Growth in New Metal-Based Manufacturing and Business Service Firms in Finland. Small Business Economics, 21 (2): 187-200.
Littunen, H., Storhammar, E., and Nenonen, T. (1998). The Survival of Firms over the Critical First Years and the Local Environment. Entrepreneurship and Regional Development, an International Journal, 10(3): 189-202.
Litwin, M. S. (1995). How to Measure Survey Reliability and Validity. Sage Publications, Thousand Oaks, CA.
Locke, E. A. (1968) Toward a Theory of Task Motivation and Incentives. Organizational Behavior and Human Performance 3: 157-189.
Locke, E. A. (1976). The nature and causes of job satisfaction. In: M. D. Dunnette (Ed.) Handbook of industrial and organizational psychology. Rand McNally, Chicago, IL.
Locke, E. A. (1991). The Motivation Sequence, the Motivation Hub, and the Motivation Core. Organizational behavior and human decision processes, 50: 288-299.
Locke, E. A. and Henne, C. (1986). Work motivation theories. In C. Cooper and I. Robertson (Eds.) International Review of Industrial and Organizational Psychology. John Wiley and Sons Ltd, Chischester. pp. 1-35.
Locke, E. A. and Latham, G. P. (1990). A theory of goal setting and task performance. Prentice-Hall, Englewood Cliffs, NJ.
195
Locke, E. A., Shaw, K. N., Saari, L. M., and Latham, G. P. (1981). Goal setting and task performance: 1969-1980. Psychological Bulletin, 90: 125-152.
Loehlin J. C. (1987). Latent Variable Models: An Introduction to Factor, Path, and Structural Analysis. Erlbaum: Hillsdale, NJ.
Low, M. B. and Abrahamson, E. (1997). Movements, bandwagons, and clones: industry evolution and the entrepreneurial process. Journal of Business Venturing, 12: 435-457.
Low, M. B. and MacMillan, I. C. (1988). Entrepreneurship: past research and future challenges. Journal of Management, 14(2): 139-161.
Lowendahl, B. and Haanes, K. (1997). The unit of activity: A new way to understand competence building and leveraging. In: Heene, A and Sanchez, R. (Eds.) Competence-Based Strategic Management. John Wiley & Sons, Chischester. pp. 19-38.
Lumpkin, G. T. and Dess, G. G. (1996). Clarifying the entrepreneurial orientation construct and linking it to performance. Academy of Management Journal, 21(1): 135-172.
MacCrimmon, K. R. and Wehrung, D. A. (1990). Characteristics of risk taking executives. Management Science, 36: 422-435.
McDougall, P. P., Covin, J. G., Robinson, R. B., and Herron, L. (1994). The Effects Of Industry Growth And Strategic Breadth On The Content Of New Venture Strategies. Strategic Management Journal, 15: 537-554.
Macrae, D. J. R. (1992). Characteristics of high and low growth small and medium sized businesses. Management Research News, 15(2): 11-17.
McGrath, R. G. (1996). The trouble with competence: opportunities and limitations in the adolescence of the resource-based view. Academy of Management 1996 Annual Meeting. Cincinnati, OH. 1996-08-11 – 1996-08-14.
MacMillan, I. C., Zemann, L. and Subbanarasimha, P. N. (1987). Criteria distinguishing successful from unsuccessful ventures in the venture screening process. Journal of Business Venturing, 2(2): 123-137.
Mahoney, J. T. and Pandian, J. R. (1992). The resource-based view within the conversation of strategic management. Strategic Management Journal 13(5): 363-380.
Maidique, M. and Patch, P. (1982). Corporate strategy and technology policy. In M. Tushman & W. Moore (Eds.). Readings in the management of innovation. Second Edition 1988, HarperBusiness, USA, pp. 236-248.
Maitlis, S. (2005). The social processes of organizational sensemaking. Academy of Management Journal, 48(1): 21-49.
March, J. G. (1991). Exploration and exploitation in organizational learning. Organization Science, 2(2): 71-87.
March J. G. and Simon, H. A. (1958). Organizations. Wiley, New York, NY.
196
Markides, C. C. and Williamson, P. J. (1996). Corporate Diversification and Organizational Structure: A Resource-based view. Academy of Management Journal, 39(2): 340.
Markus, H. R., and Kitayama, H. (1991). Culture and the self: implications for cognition, emotion, and motivation. Psychological Review, 98(2): 224-253.
Marshall A. (1890). Principles of economics, 8th ed. Macmillan, London.
Maslow, A. H. (1954). Motivation and Personality. 2nd edition 1970, Harper and Row, New York, NY.
Maula M. V. J. (2001). Corporate venture capital and the value-added for technology-based new firms. Helsinki University of Technology, Institute of Strategy and International Business, Espoo.
McClelland, D. C. (1961). The Achieving Society. Van Nostrand, Princeton, NJ:.
McClelland, D. C. (1987). Human Motivation. Cambridge University Press, New York, NY.
McDougall, P. P. (1989). International versus domestic entrepreneuship: new venture strategic behavior and industry structure. Journal of Business Venturing, 4(6): 387-400.
McDougall, P. P., Covin, J. G., Robinson, R. B., and Herron, L. (1994). The Effects Of Industry Growth And Strategic Breadth On The Content Of New Venture Strategies. Strategic Management Journal, 15: 537-554.
McGee, J. E., Dowling, J. E., and Meggison,W. L. (1995). Co-operative strategy and new venture performance: The role of business strategy and management experience. Strategic Management Journal, 16: 565-580.
Merges, R. P. (1996). A comparative look at property rights and the software industry. In: D.C. Mowery (Ed.) The International Software Industry. Oxford University Press, New York, NY 1996, pp. 272–303.
Meyer, J. W. and Rowan, B. (1977). Institutionalized organizations: Formal structure as myth and ceremony. American Journal of Sociology. 83: 364-385.
Meyerson, D. E. and Martin J. (1987). Cultural change: An integration of three different views. Journal of Management Studies, 24: 623-648.
Michel, John G. and Hambrick Donald G. (1992). Diversification posture and top management team characteristics. Academy of Management Journal, 35(1): 9-37.
Miles, R. E. and Snow, C. C. (1978). Organizational Strategy, Structure, and Process. McGraw-Hill, New York, NY.
Miles, R. E., Snow, C. C., Meyer, A. D., and Coleman, H. J. Jr. (1978). Organizational Strategy, Structure, and Process. American Management Review, 3(3): 546-562.
Miller, D. (1987). The genesis of configuration. Academy of Management Review. 12: 686-701.
197
Miller, D. (1990). Organizational configurations: Cohesion, change, and prediction. Human Relations, 43(8): 771-789.
Miller, D. and Shamsie, J. (1996). The Resource-based View of the Firm in Two Environments: the Hollywood film studios from 1936 to 1965. Academy of Management Journal, 39(3): 519-543.
Miller, D. and Toulouse, J. M. (1986). Strategy, Structure, CEO personality and performance in small firms. American Journal of Small Business, 10: 47-62.
Miller, J. G., Bersoff, D. M., and Harwood, R. I. (1990). Perceptions of social responsibilities in India and the United States: moral imperatives or personal decisions. Journal of Personality and Social Psychology, 58: 33-47.
Miller, P. J. and Hoogstra, L. (1992). Language as a tool in the socialisation and apprehension of cultural meanings. in Schwartz, T., White, G. and Lutz, C. (Eds.) New Directions in Psychological Anthropology. Cambridge University Press, Cambridge.
Miner, A. S. and Mezias, S. J. (1996). Ugly duckling no more: Pasts and futures of organizational learning research. Organization Science, 2(2): 71-87.
Miner, J. B. (1980). Theories of Organizational Behavior. Dryden, Hinsdale, IL.
Miner, J. B. (1990). Entrepreneurs, high growth entrepreneurs, and managers: contrasting and overlapping motivational patterns. Journal of Business Venturing, 5(4): 221-234.
Miner, J. B., Smith, N. R., and Bracker, J. S. (1989). Role of entrepreneurial task motivation in the growth of technologically innovative firms. Journal of Applied Psychology, 74(4): 554-560.
Miner, J. B., Smith, N. R., and Bracker, J. S. (1994). Role of entrepreneurial task motivation in the growth of technologically innovative businesses: Interpretations from follow-up data. Journal of Applied Psychology, 79(4): 627-630.
Minniti, M. and Bygrave, W. (2001). A dynamic model of entrepreneurial learning. Entrepreneurship Theory and Practice, 25(3): 5-17.
Minzberg, H. (1973). True Nature of Managerial Work. Harper & Row, New York, NY.
Mintzberg, H. (1989) Mintzberg on management: Insider our strange world of organizations. Free Press, New York, NY.
Mintzberg, H. (1994). The Rise and Fall of Strategic Planning: Reconceiving Roles for Planning, Plans, Planners. The Free Press, New York, NY.
Mintzberg H., Ahlstrand B., and Lampel J. (1998). Strategy Safari: A Guided Tour Through The Wilds of Strategic Management. The Free Press, New York, NY.
Mitchell, T. R. (1982). Expectancy-value models in organizational psychology. In N.T. Feather (Ed.) Expectations and actions: Expectancy-value models in psychology. Erblaum, Hillsdale, NJ. pp. 293-321.
198
Mitchell, R. K., Smith, B., Seawright, K. W., and Morse, E. A. (2000). Cross-cultural cognitions and the venture creation decision. Academy of Management Journal. 43(5): 974-993.
Mitchell, R. K., Smith, J. B., Morse, E. A., Seawright, K. A. et al. (2002a). Are entrepreneurial cognitions universal? Assessing entrepreneurial cognitions across cultures. Entrepreneurship Theory and Practice. 26(4): 9-32.
Mitchell, R. K., Busenitz, L., Lant, T., McDougall, P. P,, Morse, E. A., and Smith, J. B. (2002b). Toward a theory of entrepreneurial cognition: Rethinking the people side of entrepreneurship research. Entrepreneurship Theory and Practice. 27(2): 93-104.
Mok, A. L. and van den Tillaart, H. (1990). Farmers and small businessmen: A comparative analysis of their careers and occupational orientation. In R. Donckels & A. Miettinen (Eds.) New Findings and Perspectives in Entrepreneurship. Avebury, Aldershot, VA.
Mory, B. W. (1989). Entrepreneurship and public policy. Quorum Books, New York, NY.
Montgomery, C. A. (1995). Of diamonds and rust: a new look at resources. In: Montgomery, C. A. (Ed.) Resource-based and evolutionary theories of the firm: towards a synthesis. Kluwer Academic Publishers, Norwell, MA. pp. 251-268.
Morgan, M. (1985). Self-monitoring of attained subgoals in private study. Journal of Educational Psychology, 77: 623-630.
Morris, M. G. and Venkatesh, V. (2000). Age differencies in technology adaptation decisions: implications for a changing work force. Personnel Psychology, 53: 375-403.
Mowday, R. T. (1979). Equity theory predictions of behavior in organizations. In R. M. Steers and L. W. Porter (Eds.) Motivation and Work Behavior. McGraw-Hill, New York, NY.
Murphy, G. B., Trailer, J. W., and Hill, R. C. (1996). Measuring performance in entrepreneurship. Journal of Business Research, 36(1): 15–23.
Murray, J. A. and O’Gorman, C. (1994). Growth Strategy For Smaller Businesses. Journal of Strategic Change, 3: 175-183.
Nahapiet, J. and Ghoshal, S. (1998). Social Capital, Intellectual Capital, and the Organizational Advantage. Academy of Management Review, 23(2): 242 - 266.
Nahavandi, A. and Malekzadeh, A. R. (1993). Leader style in strategy and organizational performance : an integrative framework. Journal of Management Studies, 30: 405-425.
Nelson, R. R. and Winter, S. (1982). An Evolutionary Theory of Economic Change. The Belknap Press of Harvard University Press, Cambridge, MA.
Netemeyer, R. G., Bearden, R. G. and Sharma S. (2003). Scaling Procedures: Issues and Applications. SAGE Publications, Thousand Oaks, CA.
Nunnally, J. C. (1978). Psychometric Theory. 2nd edition, McGraw-Hill: New York, NY.
Nutt, P. C. (1998). Framing Strategic Decisions. Organization Science, 9: 195-216.
199
Oakey, R, (1993). High technology small firms: A more realistic evaluation of their growth potential. In Johannisson, B. Karlsson, C. Storey D. (Eds.) Small business dynamics: International, national, and regional perspectives. Routledge, London. pp. 224 – 242.
Oettingen, G. (1995). Cross-cultural perspectives on self-efficacy. In Bandura, A. (Ed.) Self-efficacy in changing societies. Reprint 1999, Cambridge University Press, Cambridge, UK. pp. 149-176.
O’Farrell, P. N. and Hitchens, D. M. W. N. (1988). Alternative theories of small-firm growth: A critical review. Environment and Planning, 20: 1365-1383.
Oliver, C. (1990). Determinants of interorganizational relationships: Integration and future directions. Academy of Management Review, 15: 241-265.
Ollinger, M. (1994). The limits of growth of the multidivisional firm: A case study of the U.S. oil industry from 1930-90. Strategic Management Journal, 15(7): 503-521.
Orser, B., Hogart-Scott, S. and Wright, P. (1998). On the growth of small enterprises: The role of intentions, gender and experience. In: Reynolds, P., Bygrave, W., Carter, N., Davidsson, P., Gartner, W., Mason, C., & McDougall, P. (Eds.) Frontiers of Entrepreneurship Research. Babson College: Wellesley, MA.
Oulu Business Review 2/95 and 1/98 (1995 and 1998). (OBR) Oulun kaupunki, elinkeinokeskus, Oulu.
Palich, L. E. and Bagby, D. R. (1995). Using cognitive theory to explain entrepreneurial risk-taking: Challenging conventional wisdom. Journal of Business Venturing 10(6): 425-438.
Parker, I. and Burman, E. (1993). Against discursive imperialism, empiricism and constructionism: thirty two problems with discourse analysis, in Burman, E. and Parker, I. (Eds.) Discourse Analytic Research: Repertoires and Readings of Texts in Action. Routledge, London. pp. 155-172.
Pearce, A. J. and Harvey, J. W. (1990). Concentrated growth strategies. Academy of Management Executive, 4(1): 60-68.
Pecotich, A. and Churchill, G. A. (1981). An examination of the anticipated-satisfaction importance valency controversy. Organizational Behavior and Human Performance, 27: 213-226.
Pennar K. (1997). The ties that lead to prosperity: The economic value of social bonds is only beginning to be measured. Business Week, December 15: 153-155.
Pennings, J. M. (1975). The relevance of the structural contingency model for organizational effectiveness. Administrative Science Quarterly. 20: 393-410.
Penrose, E. T. (1st edition 1959). The Theory of Growth of the Firm. Third Edition (1995), Oxford University Press, Oxford.
Peteraf, M. A. (1993). The Cornerstones of Competitive Advantage: A Resource-Based View. Strategic Management Journal, 14: 179-191.
200
Peterson, R. A. (2000). A Meta-Analysis of Variance Accounted for and Factor Loadings in Exploratory Factor Analysis. Marketing Letters 11:(3): 261-275.
Pettigrew, A. M. (1985). The awakening giant: Continuity and Change in Imperial Chemical Industries. Oxford, UK: Basil Blackwell.
Pfeffer, J. (1981). Power in organizations. Pitman Publishers, Marshfield, MA.
Pfeffer, J. (1982). Organizations and organization theory. Pitman Publishers Marshfield, MA. pp. 197-198.
Pfeffer, J. and Salancik, G. R. (1978). The external control of organizations: a resource dependence perspective. Harper & Row. New York, NY. pp. 143-187.
Pinder, C. (1991), Valence-instrumentality-expectancy theory, in Steers, R. and Porter, L. (Eds), Motivation and Work Behavior, McGraw-Hill , New York, NY, pp. 144-63.
Pittman, T.S. (1993). Control motivation and attitude change. In G. Waery, F. Gleichner, and K.L. Marsh, (Eds.) Control Motivation and Social Cognition. Springer-Verlag, New York, NY.
Podsakoff P. M. and Organ D. W. (1986). Self-Reports in Organizational Research: Problems and Prosepects. Journal of Management 12: 531-544.
Pondy, L. R. and Mitroff, I. I. (1979). Beyond open systems models of organizations. In B. M. Staw (Ed.) Research in organizational behavior. JAI Press, pp. 3-39.
Porac, J. F., Thomas, H. and Baden-Fuller, C. (1989). Competitive Groups as Cognitive Communities: The case of Scottish knitwear manufacturers. Journal of Management Studies, 26(4): 397-426.
Porac, J. F., Thomas, H. and Baden-Fuller, C. (1995). Rivarly and the industry model of Scottish knitwear products. Administrative Science Quarterly, 40(June): 203-227.
Porter, M. E. (1980). Competitive strategy: techniques for analyzing industries and competitors. The Free Press, New York, NY.
Porter, M. E. (1985). Competitive advantage: creating and sustaining superior performance. Reprint 1996, Free Press, New York, NY.
Porter, M. E. (1990). The competitive advantage of nations. Free Press, New York, NY.
Porter, M. E. (1991). Towards a dynamic theory of strategy. Strategic Management Journal, 12: 95-117.
Porter, M. E. (1998). Clusters and the new economics of competition. Harvard Business Review, 76(6): 77-90.
Portes, A. (1998). Social capital: Its origins and applications in modern sociology. Annual Review of Sociology, 24: 1-24.
Potter, J. and Wetherell, M. (1987). Discourse and Social Psychology. Sage, London.
201
Pouder, R. and St. John C. H. (1996). Hot Spots and Blind Spots: Geographical Clusters of Firms and Innovation. Academy of Management Review, 21(4): 1192-1225.
Priem, R. L. and Butler, J. E. (2001) Tautology in the resource-based view and the implicatons of externally determined resource value: Further comments. The Academy of Management Review, 26(1): 57-66.
Prown, J. D. (1993). The Truth of Material Culture: History or Fiction. In S. Lubard and W. D. K. Kingery (Eds.) History from Things: Essays on Material Culture. Smithsonian Institute Press, Washington DC. pp. 1-19.
O’Farrell, P. N. & Hitchens, D. M. W. N. (1988). Alternative theories of small-firm growth: a critical review, Environment and Planning A, 20(2): 1365-1383.
Quélin, B. (1997). Appropriability and the creation of new capabilities through strategic alliances. In: Heene, A and Sanchez, R. (Eds.) Competence-Based Strategic Management. John Wiley & Sons. pp. 139-160.
Rand, A. (1964). The Virtue of Selfishness. Signet, New York, NY.
Rauch, A. and Frese, M. (2000). Human Capital of Small Scale Business Owners and Business Success: A Longitudinal Study of Moderators and Mediators. Paper presented at the ICSB World Conference 2000, Brisbane, Australia.
Read, S. J. (1987). Constructing causal scenarios: A knowledge structure approach to causal reasoning. Journal of Personality and Social Psychology, 52: 288-302.
Reynolds, P. D. and Miller, B. (1992). The Stages Model of High-Tech Venture Founding: Tried But True? Journal of Business Venturing, 7: 405-417.
Reynolds, P. D. and Miller, B. (1988). 1988 Minnesota New Firms Study: An Exploration of New Firms and their Economic Contributions. Centre for Urban and Regional Affairs, Minneapolis, Minnesota.
Reynolds, P. D. (1993). High Performance Entrepreneurship: What Makes it Different? paper presented at Babson Entrepreneural Conference, University of Houston, March 1993.
Rieger, F. (1987). The Influence of National Culture on Organizational Structure, Process, and Strategic Decision Making: A Study of International Airlines. Doctoral dissertation, McGill University, Faculty of Management, Montreal, Canada.
Rogers, E. M. (2003). Diffusion of Innovations, fifth edition. Free Press, New York, NY.
Romanelli, E. (1989). Environments and strategies of organization start-up: effects on early survival. Administrative Science Quarterly, 34: 369-387.
Roth, K. and Ricks, D. A. (1994). Goal Configuration in a Global Industry Context. Strategic Management Journal, 15: 103-120.
Rotter, J. B. (1965). Generalized expectancies of internal versus external control of enforcement. Psychological Monographs: General and Applied, 80(609).
202
Rugman, A.M. and Verbeke A. (2002). Edith Penrose's contribution to the resource-based view of strategic management. Strategic Management Journal, 23(8): 769-780.
Ruist, E. (1990). Modelbygge för empirisk analys (Model building for empirical analysis). Studentlitteratur, Lund.
Rumelt, R. P. (1974). Strategy, Structure, and Economic Performance. Harvard Business School Press Boston, MA. 149 p.
Rumelt R. P. (1991). How much Does Industry Matter? Strategic Management Journal, 12: 167-185.
Sandberg, W. R. and Hofer C. W. (1987). Improving new venture performance: the role of strategy, industry structure, and the entrepreneur. Journal of Business Venturing, 2: 5-28.
Saxenian, A. (1994). Regional Advantage. Harvard University Press, Cambridge, MA.
Schoonhoven, C. B. and Eisenhardt, K. (1989). The Impact of Incubator Region on the Creation and Survival of New Semiconductor Ventures in the US 1978-1986. Report to the Economic Development Admministration, US Department of Commerce (August 1989).
Schein, E. H. (1992). Organizational Culture and Leadership. Jossey-Bass, San Francisco, CA.
Schein, E. H. (1993). How can organizations learn faster? The challenge of entering the green room. Sloan Management Rev, 34(2): 85-90.
Scherer, R. F., Adams, J. S., Carley, S. S., and Wiebe, F. A. (1989). Role model performance effects on the development of entrepreneurial career preference. Entrepreneurship Theory and Practice, 13(3): 53-71.
Schollhammer, H. (1982). Internal corporate entrepreneurship. In C.A. Kent, D.L. Sexton and K.H. Vesper (Eds.) Encyclopedia of Entrepreneurship. Prentice-Hall, Englewood Cliffs, NJ, pp. 209-229.
Schulze, W. S., Lubatkin M. E. and Dino, R. N. (2003). Exploring the agency consequences of ownership dispersion among the directors of private family firms. Academy of Management Journal, 45(2): 179-194.
Schumacker R. E. and Lomax R. G. (1996). A Beginner’s Guide to Structural Equation Modeling. Lawrence Erlbaum Associates. Mahwah, NJ.
Schumpeter, J. A. (1942 edited 1950). Capitalism, Socialism and Democracy. Harper & Row, New York, NY.
Scott, A. J. (1988). New industrial spaces. Pion, London.
Scott, W. R. (1995). Institutions and organizations: Foundations for organizational science. Sage, Thousand Oaks, CA.
Sexton D. L. and Landström H. (2000). Introduction. In D. L. Sexton and H. Landstöm (Eds.) The Blackwell Handbook on Entrepreneuship. Blackwell: Oxford, UK; pp. 435-443.
203
Sharfman M. P. and Den J. W. Jr. (1991). Conceptualizing and measuring the organizational environment: a multidimensional approach. Journal of Management, 17(4): 681-700.
Shenkar, O., Aranya, N. and Almor, T. (1995). Construct dimensions in the contingency model: An analysis comparing metric and non-metric multivariate instruments. Human Relations, 48(5): 559-580.
Sheppard, J. P. (1995). A resource dependence approach to organizational failure. Social Science Research, 24: 28-62.
Shortell, S. M. and Zajac, E. J. (1990). Perceptual and Archival Measures of Miles and Snow's Strategy Types: A Comprehensive Assessment of Reliability and Validity. Academy of Management Journal, 33(4): 817-832.
Simon, H. A. (editions 1947 and 1957). Administrative Behavior. MacMillan, New York, NY.
Simon M., Houghton S. M., and Aquino K. (2000). Cognitive biases, risk perception, and venture formation: How individuals decide to start companies. Journal of Business Venturing, 15(2): 113-134.
Sims, H.P. Jr. and Gioia, D.A., and Associates (1986). The Thinking Organization. Jossey-Bass, New York, NY.
Slancik, G. and Pfeffer J. (1978). A social information processing approach to job attitudes and task design. Administrative Science Quarterly. 23: 224-253.
Smircich, L. and Stubbart, C. (1985). Strategic Management in an Enacted World. Academy of Management Review, 10(4): 724-736.
Smith, N. R. and Miner, J. B. (1984). Motivational considerations in the success of technologically innovative entrepreneurs. In J.A. Hornaday, F.J. Tarpley, J.A. Timmons, and K.H. Vesper (Eds.) Frontiers of Entrepreneurship Research. Babson College, Wellesley, MA. pp. 488-495.
Snell, S. A. and Dean, J. W. Jr. (1992). Integrated Manufacturing and Human Resource Management: A Human Capital Perspective. Academy of Management Journal, 35(3) 467-504.
Solem, O. and Steiner, M. P. (1989). Factors for Success in Small Manufacturing Firms – and with Special Emphasis on Growing Firms. Paper presented at Conference on Small and Medium Sized Enterprises and the Challenges of 1992, Mikkeli, Finland.
Spector P. E. (1987). Method Variance as an Artifact is Self-Reported Affect and Perceptions at Work: Myth or significant Problem? Journal of Applied Psychology, 73(3): 483-443.
Spector P. E. (1992). Summated Rated Scale Construction: An Introduction. Sage Publications: Newbury Park, CA.
Spender, J. (1996). Making knowledge the basis of dynamic theory of the firm. Strategic Management Journal, 17(1): 45-62.
204
Starbuck, W. H. and Milliken, F. J. (1988). ‘Executives’ perceptual filters: What they notice and how they make sense. In: Hambrick, D. C. (Ed.) The Executive Effect: Concepts and Methods for Studying Top Managers. JAI Press, Greenwich, CT. pp. 35-66.
Statistical Yearbook of Finland (2000 and 2002). Statistics Finland, Helsinki, Finland.
Statistics Finland (2002). Web services (www.tilastokeskus.fi). Helsinki, Finland.
Stegall, D. P., Steinmetz, L. L. and Kline, J. B. (1976). Managing the Small Business. Richard D. Irwin, Homewood, IL.
Steiger J. H., Shapiro A., Browne M. W. (1985). On the Multivariate Asymptotic Distribution of Sequential Chi-Square Statistics. Psychometrika, 50: 253-264.
Steinmetz, L.L. (1969). Critical stages of small business growth: when they occur and how to survive them. Business Horizons, 12(1): 29-34.
Sterns, T. M., Carter, N. M., Reynolds, P. D., and Williams, M. (1995). New firm survival: industry, strategy, and location. Journal of Business Venturing, 10(1): 23-42.
Stevens, J. P. (2002). Applied multivariate statistics for the social, sciences (4th ed.). Lawrence Erlbaum, Mahwah, NJ.
Stevenson H. H. and Jarillo J. C. (1990). A paradigm of entrepreneurship: entrepreneurial management. Strategic Management Journal, 11: 17-27.
Still, A. and Good, J. (1992). Mutualism in the human sciences: towards the implementation of a theory. Journal of the Theory of Social Behaviour, 22: 105-128.
Stigler, G. (1968). The Organization of Industry. Irwin, Homewood, Ill.
Storey, D. J. (1994a). The role of legal status in influencing bank financing and new firm growth. Applied Economics, 26(2): 129-136.
Storey, D. J. (1994b). Understanding the Small Business Sector. Routledge, London.
Storey, D. J., Keasey, K., Watson, R., and Wynarczyk, P. (1987). The Performance of Small Firms: Profits, Jobs and Failures. Croom Helm, London.
Storey, D. J., Watson, R. and Wynarczyk, P. (1989). Fast Growth Small Businesses: Case Studies of 40 Small Firms in Northern England, Research Paper No. 67. Department of Employment, London.
Stuart, R. W. and Abetti, P. A. (1987). Start-up ventures: towards the prediction of initial success. Journal of Business Venturing, 2(3): 215-229.
Stuart, R. W. and Abetti, P. A. (1986). Field study of start-up ventures – part II: predicting initial success. In: Ronstadt, R., Hornaday, J. A., Peterson, R., and Vesper, K. H. (Eds.). Frontiers of Entrepreneurship Research 1986. Babson College, Babson Park, MA. pp. 21-39.
Sudgen R. (1989). Spontaneous order. Journal of Economic Perspectives, 3(Fall): 85-97.
205
Summers H. G., Jr. (1981). On Strategy: The Vietnam War in Context. Washington, DC: GPO, Strategic Studies Institute, U.S. Army War College, Carlisle Barracks, PA.
Sutcliffe, K. M. and Huber, G. P. (1998). Firm and industry as determinants of executive perceptions of the environment. Strategic Management Journal, 19: 793–807.
Teece, D. J. (1986). Profiting from technological innovation: implications for integration, collaboration, licensing and public policy. Research Policy, 15(6): 286 - 305.
Terborg, J. R. (1977). Validation and extension of an individual differences model of work performance. Organizational Behavior and Human Performance, 18: 188-216.
Thomas, H. and Venkatraman, N. (1988). Research on strategic groups: progress and prognosis. Journal of Management Studies, 25: 537-555.
Thomas, J. B., Clark, S. M. and Gioia, D. A. (1993). Strategic sensemaking and organizational performance: Linkages among scanning, interpretation, action, and outcomes. Academy of Management Journal, 36: 239-270.
Thorngate, W. (1976). “In general” vs. “It depends”: Some Comments on the Gergen-Schlenker debate. Personality and Social Psychology Bulletin, 2:404-410.
Ting-Toomey, S. (1988). A face-negotiation theory. In Y. Kim, &W. B. Gudykunst (Eds.), Theory in intercultural communication. Sage, Newbury Park, CA.
Tsoukas, H. (1996). The firm as a distributed knowledge system: A construtionist approach. Strategic Management Journal, 17(Winter special issue): 11-25.
Tubbs, M. E. (1986). Goal-setting: A meta-analytic examination of the empirical evidence. Journal of Applied Psychology, 71: 474-483.
Tushman, M. L. and Aderson, P. (1986). Technological discontinuities and organizational environments. Administrative Science Quarterly, 31: 439-465.
Tushman, M. and Romanelli, E. (1985). Organization evolution: A metamorphosis model of convergence and reorientation. In B.M. Staw and L.L. Cummings (Eds.) Research in Organizational Behavior Vol. 7. JAI Press, Greenwich, CT. pp. 171-232.
Tyler, B. B. and Steensma, H. K. (1998). Executive Effects on Assessment of Alliances. Strategic Management Journal., 19: 939-965.
Ubois, Jeff (1998). Interview of Ann Winblad in Internet World magazine, vol. 9. No 1.
Van de Ven, A. H., Hudson, R. and Schroeder, D. (1984). Designing New Business Startups: Entrepreneurial, Organizational, and Ecological Considerations. Journal of Management, 10(1): 87-108.
Van de Ven, A. and Walker, G. (1984). The dynamics of inter-organizational coordination. Administrative Science Quarterly, 29(1): 598-621.
206
Vancouver, J. B., Thompson, C. M., & Williams, A. A. (2001). The changing signs in the relationships between self-efficacy, personal goals, and performance. Journal of Applied Psychology, 86: 605–620.
Varadarajan, P. (1986). Product Diversity and Firma Performance: An Empirical Investigation. Journal of Marketing, 50: 43-57.
Vecchio, R. P. (1981). An individual-differences interpretation of the conflicting predictions generated by equity theory and expectancy theory. Journal of Applied Psychology, 66: 470-481.
Venkataraman S. (1997). The distinctive domain of entrepreneurship research. In: Katz, J. A. (Ed.) Advances in Entrepreneurship, Firm Emergence and Growth: Vol. 3. JAI Press, Greenwich, CT, pp. 119-138.
Venkatraman, N and Grant, J. H. (1986). Construct Measurement in Organizational Strategy Research: A Critique and Proposal. Academy of Management Review 11(1): 71-87.
Venkatraman, N. and Ramanujam, V. (1987). Measurement of Business Economic Performance: An Examination of Method Convergence. Journal of Management, 13: 109-122.
Verdin, P. J., and Williamson, P. J. (1994). Core competences, competitive advantage and market analysis: Forging the links. In G. Hamel and A. Heene (Eds.) Competence-based competition. Wiley, New York, NY, pp. 77-110.
Vesala K. M. (1992). Pienyrittäjien kontrollipremissit. Sosiaalipsykologinen tarkastelu. Acta Psychologica Fennica, 5. Suomen psykologinen seura, Helsinki
Vesper, K. (1990). New Venture Strategies. Prentice Hall, Englewood Cliffs, NJ.
Vroom, Victor H. (1964, reprinted 1995). Work and Motivation, Reprinted 1995 with a new introduction. Jossey-Bass Inc, San Francisco, CA.
Walsh, J. P. (1995). Managerial and organizational cognition: Notes from a trip down memory lane. Organization Science, 6: 280-321.
Wally, S. and Baum. J. R. (1994). Personal and Structural Determinants of the Pace of Strategic Decision Making. Academy of Management Journal, 37: 932-956.
Weick, K. E. (1995). Sensemaking in organizations. Sage, Thousand Oaks, CA.
Weick, K. E. and Daft, R. L. (1983). The effectiveness of interpretation systems. In K. S. Cameron and D. A. Whetten (Eds.) Organizational Effectiveness: A comparison of multiple models. New York: Academic Press: 71-93.
Webster, F. A. (1977). Entrepreneurs and ventures: An attempt at classification and clarification. Academy of Management Review, 2: 54-61.
Webster’s third new international dictionary of the English language. (1993). Merriam-Webster, Springfield, MA.
207
Weiner, B. (1986). An Attributional Theory of Motivation and Emotion. Springer: New York, NY.
Weldon, E. and Yun, S. (2000). The effects of proximal and distal goals on goal level, strategy development, and group performance. The Journal of Applied Behavioral Science, 36(3): 336-345.
Weldon, E., Jehn, K. A. and Pradhan, P (1991). Processes that mediate the relationship between a group goal and improved group performance. Journal of Personality and Social Psychology, 61: 555-569.
Werder, A. (1999). Argumentation Rationality of Management Decisions. Organization Science, 10: 672-690.
Wernerfelt, B A (1984). A resource-based view of the firm. Strategic Management Journal, 5: 171-180
Westhead, P. and Birley, S. (1993). Environments for Business Deregistrations in the UK, 1987-90. University of Warwick, Warwick.
White, H. (1980). A Heteroscedasticacity-Consistent Covariance Matrix Estimator and a Direct Test for Heteroscedasticacity. Econometrica, 48: 817-838.
Wiklund, J. (1998). Small Firm Growth and Performance — Entrepreneurship and Beyond. Dissertation. Jönköping International Business School, Jönköping.
Wiklund, J. and Shepherd, D. (2003). Aspiring for, and Achieving Growth: The Moderating Role of Resources and Opportunities. Journal of Management Studies, 40 (8): 1919-1941.
Williamson, I. O. and Cable, D. M. (2003). Organizational hiring patterns, interfirm network ties, and interorganizational imitation. Academy of Management Journal 46(3): 349-358.
Wofford, J. C., Goodwin, V. L., and Premack, S. (1992). Meta-analysis of the antecedents of personal goal level and of the antecedents and consequences of goal commitment. Journal of Management, 18: 595-615.
Wood, R. and Bandura, A. (1989). Social cognitive theory of organizational management. Academy of Management Review, 14(3):361-384.
Wright, P. (1987). A refinement of Porter’s strategies. Strategic Management Journal, 8: 93-101.
Wright, M., Hoskisson, R. E., Busenitz, L.W., and Dial, J. (2000). Entrepreneurial growth through privatization: The upside of management buyouts. The Academy of Management Review, 25(3): 591-600.
Young, G., Smith, K.G., and Grimm, C.M. (1996). “Austrian“ and industrial organization perspectives on firm-level competitive activity. Organization Science, 7: 243-254.
208
Zahra, S. A., Ireland, R. D., and Hitt, M. A. (2000). International Expansion by New Venture Firms: International Diversity, Mode of Market Entry, Technological Learning and Performance. Academy of Management Journal, 43(5): 925-950.
209
APPENDIX: Interview questions The questionnaire was filled by the interviewers. A. Mediating variable I Growth orientation a) Please allocate 100 points across the five goals below to indicate how important they have been to your firm in the recent: ________ Maximizing profitability ________ Maximizing sales growth ________ Maximizing technical superiority ________ Maximizing value of the firm for eventual acquisition ________ Maximizing stability and longevity of the firm 100 TOTAL POINTS b) (1= strongly disagree, 7= strongly agree) 1. Growing as rapidly as possible is the most important goal of this venture 1 2 3 4 5 6 7 2. Aiming for rapid growth is not what drives this venture 1 2 3 4 5 6 7 c) What is your turnover objective in 2001 ________. B. Independent variables I Growth orientation of Finnish referent a) Who is the Finnish person that you regard as a model for your business management? _____________ b) Why you have this Finnish referent? Please allocate 100 points across the four goals below to indicate how important they have been to you when using this person as a model. His capability in: (same table was filled as with question A. I a)) II Growth orientation of foreign referent a) Who is the foreign person that you regard as a model for your business management? _____________ b) Why you have this foreign referent? Please allocate 100 points across the four goals below to indicate how important they have been to you when using this person as a model. His capability in: (same table was filled as with question A. I a)) III Outside ownership a) Does you company have owners that are not your managers or other employees, yes/no? IV Previous experience a) When did you join this company? _______ b) Before joining this company, how many years you had been working with:
companies providing similar services or products? _______ companies having same customers? _______
c) How many years you had been in managing position before joining this company? _______
210
V Previous growth experience a) When did you join this company? _______ b) Before joining this company, how many years you had been working in management of a growth company (over 20% of annual growth)? _______ C. Control variables I Concentration strategy a) Quantitative questions 1. Total number of your software engineers _________ 2. Percentage of your software engineers not bound to specific customer projects ________ 3. Number of your separate business areas ______ b) [An open ended question, in which respondents were asked to describe the structure of their business.] What parts your business consists of? [From the description, as a measure was taken the number of product business related parts divided by total number of parts presented] II Segmentation strategy a) To what degree do each of the following four descriptions fit your organization currently? Show their relative importance by allocating shares of 100% of your effort: _______ We aim to get the product to market before competition. We are the first to
introduce new products or major innovations. _______ We try to achieve low costs. _______ We aim to be or fast follower, strategy involves quick imitation of innovations
pioneered by a competitor. _______ Rather than attempting to serve the entire market, we focus on serving small
pockets of demand with special application of the basic technology. 100 TOTAL POINTS
b) (1= strongly disagree, 7= strongly agree) 1. Our sub-industry is highly segmented III Age of the manager a) When you were born? ________