The Impact of Regulation, Socio-economics & Technology on the Arab Internet Market Michael Minges International Telecommunication Union The views expressed are those of the author and may not necessarily reflect the opinions of the ITU or its Members.
Transcript
The Impact of Regulation, Socio-economics & Technology on
the Arab Internet MarketMichael Minges
International Telecommunication Union
The views expressed are those of the author and may not necessarily reflect the opinions of the ITU or its Members.
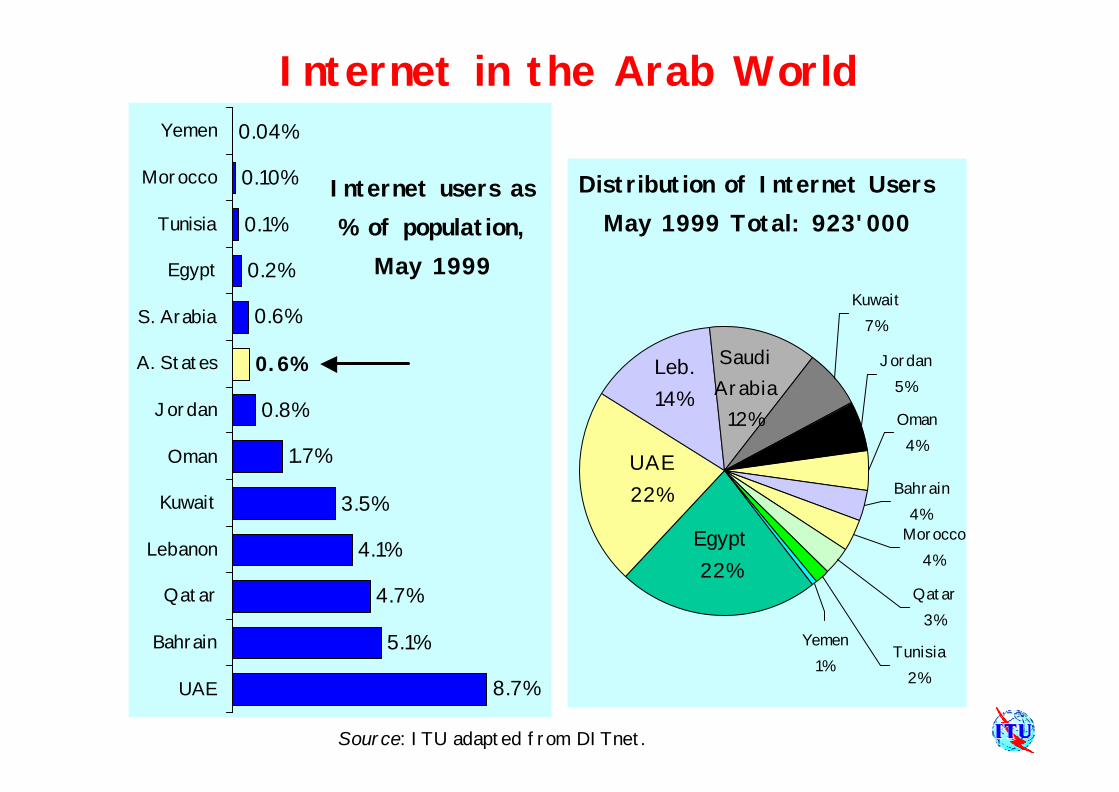
0.10%
0.04%
8.7%
5.1%
4.7%
4.1%
3.5%
1.7%
0.8%
0.6%
0.6%
0.2%
0.1%
UAE
Bahrain
Qatar
Lebanon
Kuwait
Oman
Jordan
A. States
S. Arabia
Egypt
Tunisia
Morocco
Yemen
Internet users as % of population,
May 1999
Internet in the Arab World
Tunisia2%
Qatar3%
Yemen1%
Bahrain4%
Kuwait7%
Morocco4%
Oman4%
Jordan5%
Saudi Arabia
12%
Leb.14%
Egypt22%
UAE22%
Distribution of Internet UsersMay 1999 Total: 923'000
Source: ITU adapted from DITnet.
Wealth & Internet
Source: ITU adapted from DITnet and World Bank data.
Tunisia
OmanBahrain Qatar
MoroccoEgypt
Jordan
Saudi Arabia
Lebanon
Algeria
UAE
R2= 0.68
0.00%
0.01%
0.10%
1.00%
10.00%
$0 $5'000 $10'000 $15'000 $20'000
GNP per capita, US$
Inte
rnet
use
rs,
% o
f po
pulation
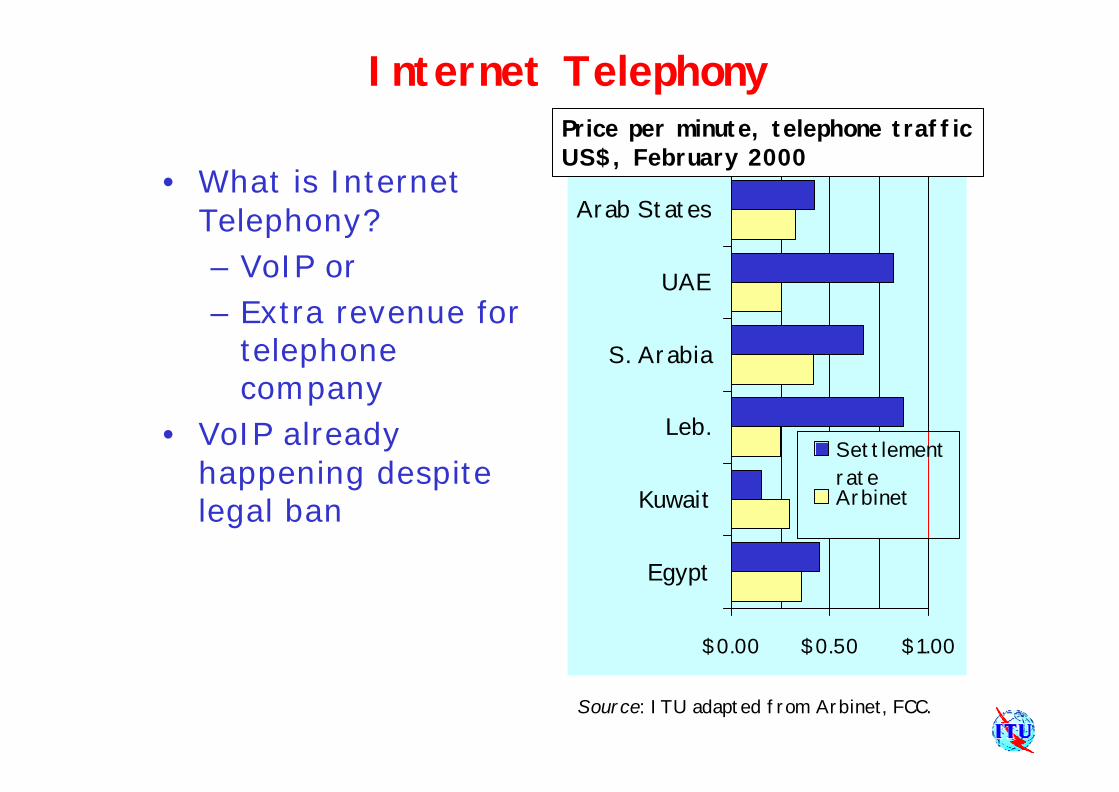
Internet absorbtion “hard” factors Rather have a cellphone