Informing Science: the International Journal of an Emerging Transdiscipline Volume 18, 2015 Cite as: Petersen, C., & Johnston, K. A. (2015). The impact of social media usage on the cognitive social capital of university students. Informing Science: the International Journal of an Emerging Transdiscipline, 18, 1-30. Retrieved from http://www.inform.nu/Articles/Vol18/ISJv18p001-030Petersen1522.pdf Editor: Grandon Gill Submitted: November 28, 2014; Revised March 22, 2015, Accepted April 17 The Impact of Social Media Usage on the Cognitive Social Capital of University Students Chad Petersen and Kevin A. Johnston University of Cape Town, Cape Town, South Africa [email protected][email protected]Abstract The impact that Social Media, such as Facebook and Twitter, usage has on the creation and maintenance of university students’ cognitive social capital was investigated on students in the Western Cape Province of South Africa. Facebook and Twitter were selected as part of the re- search context because both are popular online social network systems (SNSs), and few studies were found that investigated the impact that social media has on the cognitive social capital of South African university students. Data was collected from a survey questionnaire, which was successfully completed by over 100 students from all five universities within the Western Cape. The questionnaire was obtained from a previous study, allowing comparisons to be made. The research involves disciplines such as Information Systems, Psychology, and Sociology, and the information gathered is meant to inform inquiry in various disciplines. Analysis of the results, however, did not show a strong relationship between the intensity of Facebook and Twitter usage and the various forms of social capital. Facebook usage was found to correlate with student satis- faction with university life, which suggests that increasing the intensity of Facebook usage for students experiencing low satisfaction with university life might be beneficial. Keywords: Facebook, Twitter, Cognitive Social Capital, Bridging Social Capital, Bonding Social Capital, Maintained Social Capital, Usage, University Students, Social Network Systems (SNS) Introduction The purpose of the research was to investigate the impact of Facebook and Twitter usage on the cognitive social capital of university students within the Western Cape Province of South Africa. The study aimed to gain familiarity and new insight into social capital among university students. Many people have begun using the Internet to create and maintain social relationships through online profiles, the gathering of online friends, commenting on friends’ website pages, and the monitoring of the online status of others (Ellison, Steinfield, & Lampe, 2007; Giannakos, Choria- nopoulos, Giotopoulos, & Vlamos , 2013; Pfeil, Arjan, & Zaphiris, 2009; Powell, 2009; Stevens & Morris, 2007). This research is transdisciplinary in that it involves disciplines such as Infor- mation Systems, Psychology, and Soci- ology, and the information gathered is meant to inform inquiry in various dis- ciplines (Cohen, 2009). Because social network systems (SNSs) provide individuals with more opportu- Material published as part of this publication, either on-line or in print, is copyrighted by the Informing Science Institute. Permission to make digital or paper copy of part or all of these works for personal or classroom use is granted without fee provided that the copies are not made or distributed for profit or commercial advantage AND that copies 1) bear this notice in full and 2) give the full citation on the first page. It is per- missible to abstract these works so long as credit is given. To copy in all other cases or to republish or to post on a server or to redistribute to lists requires specific permission and payment of a fee. Contact [email protected]to request redistribution permission.
Transcript
Informing Science: the International Journal of an Emerging Transdiscipline Volume 18, 2015 Cite as: Petersen, C., & Johnston, K. A. (2015). The impact of social media usage on the cognitive social capital of university students. Informing Science: the International Journal of an Emerging Transdiscipline, 18, 1-30. Retrieved from http://www.inform.nu/Articles/Vol18/ISJv18p001-030Petersen1522.pdf
Editor: Grandon Gill Submitted: November 28, 2014; Revised March 22, 2015, Accepted April 17
The Impact of Social Media Usage on the Cognitive Social Capital of University Students
Chad Petersen and Kevin A. Johnston University of Cape Town, Cape Town, South Africa
Abstract The impact that Social Media, such as Facebook and Twitter, usage has on the creation and maintenance of university students’ cognitive social capital was investigated on students in the Western Cape Province of South Africa. Facebook and Twitter were selected as part of the re-search context because both are popular online social network systems (SNSs), and few studies were found that investigated the impact that social media has on the cognitive social capital of South African university students. Data was collected from a survey questionnaire, which was successfully completed by over 100 students from all five universities within the Western Cape. The questionnaire was obtained from a previous study, allowing comparisons to be made. The research involves disciplines such as Information Systems, Psychology, and Sociology, and the information gathered is meant to inform inquiry in various disciplines. Analysis of the results, however, did not show a strong relationship between the intensity of Facebook and Twitter usage and the various forms of social capital. Facebook usage was found to correlate with student satis-faction with university life, which suggests that increasing the intensity of Facebook usage for students experiencing low satisfaction with university life might be beneficial.
Keywords: Facebook, Twitter, Cognitive Social Capital, Bridging Social Capital, Bonding Social Capital, Maintained Social Capital, Usage, University Students, Social Network Systems (SNS)
Introduction The purpose of the research was to investigate the impact of Facebook and Twitter usage on the cognitive social capital of university students within the Western Cape Province of South Africa. The study aimed to gain familiarity and new insight into social capital among university students.
Many people have begun using the Internet to create and maintain social relationships through online profiles, the gathering of online friends, commenting on friends’ website pages, and the monitoring of the online status of others (Ellison, Steinfield, & Lampe, 2007; Giannakos, Choria-
nopoulos, Giotopoulos, & Vlamos , 2013; Pfeil, Arjan, & Zaphiris, 2009; Powell, 2009; Stevens & Morris, 2007). This research is transdisciplinary in that it involves disciplines such as Infor-mation Systems, Psychology, and Soci-ology, and the information gathered is meant to inform inquiry in various dis-ciplines (Cohen, 2009).
Because social network systems (SNSs) provide individuals with more opportu-
Material published as part of this publication, either on-line or in print, is copyrighted by the Informing Science Institute. Permission to make digital or paper copy of part or all of these works for personal or classroom use is granted without fee provided that the copies are not made or distributed for profit or commercial advantage AND that copies 1) bear this notice in full and 2) give the full citation on the first page. It is per-missible to abstract these works so long as credit is given. To copy in all other cases or to republish or to post on a server or to redistribute to lists requires specific permission and payment of a fee. Contact [email protected] to request redistribution permission.
Impact of Facebook and Twitter Usage on Social Capital
2
nities to interact, communicate, and share with others, individuals are able to create and maintain relationships (Donath & Boyd, 2004; Ellison et al., 2007; Kwon, D’Angelo, & McLeod, 2013; Powell, 2009; Raacke & Bonds-Raacke, 2008). SNSs enable individuals to build and reserve so-cial capital for future use (Kwon et al., 2013; Powell, 2009).
Social capital refers to all resources (virtual or actual) that have been accumulated from various relationships and social interactions (Coleman, 1989; Kwon et al., 2013; Valenzuela, Park, & Kee, 2009), and is “well suited for transdisciplinary studies” (Burton, Wu, & Prybutok, 2010, p. 122). Social capital is perceived as a by-product of social relationships stemming from social en-gagement through structured social networks (Bourdieu & Wacquant, 1992; Islam, Merlo, Kawa-chi, Lindström, & Gerdtham, 2006). “Researchers have begun to approach the concept of social capital at the individual level instead of at the community level and the virtual world instead of the corporeal and to discern between two particular types of social capital at an individual level” (Kwon et al., 2013, p. 36). Social capital is important to students for several reasons, including fun, arranging activities, and finding friends (Giannakos et al., 2013).
In order to understand the dynamic of social capital among university students in the Western Cape of South African, an understanding of South African universities is required. According to Akpojivi (2013) and Van der Merwe (2013), public universities within South Africa are catego-rised into three distinct types: traditional, universities of technologies, and comprehensive universities. Traditional Universities offer theoretically-oriented university degrees (Akpojivi, 2013; Van der Merwe, 2013), Universities of Technology offer vocationally-oriented diplomas and degrees (Akpojivi, 2013; Van der Merwe, 2013), while Comprehensive Universities offer a combination of both types of qualifications (Van der Merwe, 2013). The study done by Johnston, Tanner, Lalla, and Kawalski (2013) surveyed five universities throughout South Africa, none of which were of the comprehensive university type. The study, therefore, added a comprehensive university to the research context.
Few studies were found that address the impact that Facebook and Twitter have on the cognitive social capital of university students. The study done by Johnston et al. (2013) and Ellison et al. (2007) used only Facebook as the research context.
The gaps identified by Johnston et al. (2013) suggest that new avenues of future research could create a more detailed analysis with regard to the demographic use and non-use of SNSs within South Africa, as well as the role of race and age in the creation and maintenance of social capital among South African university students.
The research questions for this study were:
1. What is the impact of Facebook and Twitter usage on the cognitive social capital of uni-versity students in the Western Cape?
• What is the impact of Facebook and Twitter on the creation of social capital? • What is the impact of Facebook and Twitter on the maintenance of social capital?
2. What is the relationship between Facebook and Twitter usage and social capital?
This study extended the study by Johnston et al. (2013) by using both Facebook and Twitter as the research context and by adding a comprehensive university to the research context. The study focused on Facebook and Twitter since they are two of the most popular social media networks (Lin & Lu, 2011; Stutzman, 2006; Valenzuela et al., 2009).
Literature Review Literature was sourced from academic journals and Google Scholar, using the papers by Ellison et al. (2007) and Johnston et al. (2013) as starting points. Following a transdisciplinary approach,
Petersen & Johnston
3
journals from a variety of disciplines such as Education, Health, Information Systems, Manage-ment, Philosophy, Psychiatry, Psychology, and Sociology were included (Cohen, 2009).
Online Social Network Systems According to Lin and Lu (2011), online social networks are virtual communities where people engage and share resources through the use of computing devices. Social networks have made an impact on online business activities and have transformed the way business is conducted (Burton et al., 2010; Lin & Lu, 2011). Social networks enable people to express themselves, develop so-cial network ties, as well as to create and maintain social relationships (Johnston et al., 2013; Lin & Lu, 2011; Steinfield, Ellison, Lampe, & Vitak, 2012).
The internet has become a key driver for transforming social networks (Bargh & Mckenna, 2004; Johnston et al., 2013; Lin & Lu, 2011) from simply a means of accessing information to plat-forms for individuals to connect with others (Weaver & Morrison, 2008). People who have access to social networks may join groups based on school affiliations, employers, geographical loca-tions, hobbies, or any shared interest (Chan, 2014; Gross & Acquisti, 2005; Terrana & Pilato, 2013; Ting, Wang, Chi, & Wu, 2013).
According to Boyd and Ellison (2007, p. 221), an online SNS is defined as a platform that enables the users to “(1) construct a public or semi-public profile within a bounded system, (2) articulate a list of other users with whom they share a connection, (3) view and transverse their list of con-nections and those made by others within their system”. Most SNSs are used primarily to com-municate with existing social contacts rather than expanding networks of contacts (Boyd & Ellison, 2007), thus being very similar to real-life social relationships (Ellison et al., 2007).
Facebook is the world’s largest SNS (Gjoka, Kurant, Butts, & Markopoulou, 2010; Ljepava, Orr, Locke, & Ross, 2013; Thinyane, 2010; Ting et al., 2013) and was created in 2004 (Boyd & Ellison, 2007; Ljepava et al., 2013). Facebook is freely available to anyone with either a valid email address or cell phone number; however, in order to make use of Facebook, users must be older than 13 years of age (Chan, 2014; Kwak, Choi, & Lee, 2014). Facebook has over 1 billion users, and over 70 billion items of content are shared every month (Kwak et al., 2014; Statistic Brain, 2013a; Westwood, 2014). The average Facebook user spends 15 hours and 33 minutes per month on the website, while two-thirds of Facebook’s user base are active daily (Cassidy, 2006; Ellison et al., 2007; Statistic Brain, 2013a; Westwood, 2014). Facebook has, therefore, become strongly integrated into the daily activities of its users (Cassidy, 2006; Ellison et al., 2007; Westwood, 2014).
Much of the academic research on Facebook has concentrated on privacy concerns (Gross & Ac-quisti, 2005; Stutzman, 2006), and self-disclosure (Hewitt & Forte, 2006; Kwak et al., 2014; Mazer, Murphy, & Simonds, 2007). Other academic research has concentrated on the relationship between friendship enunciation and an individual’s profile structure (Ellison et al., 2007), as well as the impact that Facebook has on social capital (Johnston et al., 2013; Ljepava et al., 2013; Steinfield et al., 2012).
Twitter is a microblogging social networking service launched in 2006 (Brockman, 2013; Kwak, Lee, Park, & Moon, 2010), used by over 600 million members (Brockman, 2013; Kwak et al., 2010), and boasts an average of 58 million tweets per day (Kwak et al., 2010; Statistic Brain, 2013b). Currently, Twitter is available to anyone with either a valid email address or cell phone number (Brockman, 2013; Ljepava et al., 2013; Terrana & Pilato, 2013). Much of the previous academic research has concentrated on Twitter usage, the context in which Twitter is used (Larsson & Moe, 2012; Recuero, Araujo, & Zago, 2011), the impact Twitter usage has on aca-demic performance ( Junco, 2012; Junco, Heiberger, & Loken, 2011), and the engagement of stu-dents (Junco, 2012; Junco et al., 2011; McEwan, 2011).
Impact of Facebook and Twitter Usage on Social Capital
4
According to Bargh and Mckenna (2004) and Johnston et al. (2013), the internet and SNSs may have a negative impact on social interactions, especially face-to-face engagements. However, Fukuyama (2001) argued that changes in technology alter the means of associations between people. According to Uses and Gratification Theory, “the particular purpose of individuals within a communicational setting determines the interaction outcomes”, and is not dependent on the form of communication channel used (Bargh & Mckenna, 2004, p. 578). Bargh and Mckenna (2004) and Johnston et al. (2013) suggest that the components that make up SNSs have an impact on the outcomes of social engagement, which is dependent on the context of the social setting.
Online engagement provides a new platform of social interaction and communication among so-cial networks; it also functions as a replacement or substitute for physical interaction. Wellman, Haase, Witte, and Hampton (2001) argued that online engagement strengthens relations within a social network. A lack of structured longitudinal research has been one of the reasons why there has initially been some confusion with regards to the impact online SNSs have on social capital (Johnston et al., 2013; Steinfield et al., 2012; Williams, 2006).
According to Johnston et al. (2013), online SNSs may be useful tools for individuals who struggle to create and maintain social capital. Online SNSs might enable individuals who do not have as many ties with friends as well as neighbours and who have low psychological well-being to im-prove their social capital among different social networks (Bargh & Mckenna, 2004; Steinfield et al., 2012). Social network engagement barriers can be lowered as well as self-disclosure stimulat-ed through means of communication through the use of SNSs (Bargh & Mckenna, 2004; Johnston et al., 2013; Steinfield et al., 2012).
Intensity of usage of online social networks may be defined by the number of friends or followers an individual has on Facebook or Twitter, and quantity of usage may be determined by the frequency and duration of time an individual spends on a site (Ellison et al., 2007; Johnston et al., 2013). Researchers should be aware that many individuals tend to admire and trust individuals who have more friends or followers, the social contagion effect (Vishwanath, 2014). Social contagion can cause deception in social media reserach, as the apparent number of friends/followers may be deceptive (Vishwanath, 2014). “The potency of social networks comes from the social capital they embody” (Burton et al., 2010, p.121).
Cognitive Social Capital Cognitive social capital may be defined as the expected benefit and accumulated resources gained from various social relationships or social engagements (Burton et al., 2010; Coleman, 1989; Fukuyama, 2001; Islam et al., 2006; Johnston et al., 2013; Vitak, Ellison, & Steinfield., 2011). Social capital is perceived as a by-product of social relationships which stem from social en-gagement through structured social networks (Islam et al., 2006). Although social capital origi-nated in sociology, it has been applied in a variety of disciplines and “has become a core concept in business, political science, and sociology” (Burton et al., 2010, p.122). Social capital may be defined at the individual level as the potential resources (actual or virtual) that accrue to an indi-vidual by virtue of an individual’s set of ties in social networks (Burton et al., 2010). The under-lying premise is that there is social capital value within social networks (Molina-Morales & Teresa, 2010; Vitak et al., 2011).
The benefits of social capital are that it is a forecaster of many things, including academic per-formance, physical and mental health, economic and intellectual development (Ellison et al., 2007; Johnston et al., 2013; Rost, 2011; Vitak et al., 2011). Social capital enhances knowledge sharing, influences learning, forms shared understanding, and fosters greater consistency of action (Burton et al., 2010). Social capital established in an individual’s social network enables that in-dividual to be better informed (Burton et al., 2010). Therefore, an increase in social capital within
Petersen & Johnston
5
a community is followed by a general commitment to a collective action (Johnston et al., 2013; Rost, 2011).
The downside of social capital is that social capital might lead to the establishment of hate groups, which may exclude people from a group, and restrict the freedom of individuals (Bargh & Mckenna, 2004; Johnston et al., 2013; Ting et al., 2013).
There are two classes of social capital: structural and cognitive social capital (Islam et al., 2006; Johnston et al., 2013; Vitak et al., 2011). Structural social capital is the externally perceivable aspects of social groups such as the number of people within a social network or the social en-gagement patterns (Chan, 2014; Islam et al., 2006; Johnston et al., 2013). Structural social capital inspects the power of links of association, the density of social associations, and the indicators of social interactions (Islam et al., 2006; Johnston et al., 2013).
Cognitive social capital stems from the personal characteristics that make up a person’s cultural norms, beliefs, values, and attitudes (Forsman, Nyqvist, Schierenbeck, Gustafson, & Wahlbeck, 2012; Islam et al., 2006; Johnston et al., 2013; Nyqvist, Forsman, Giuntoli, & Cattan, 2013). Cognitive social capital is a derivative of a person’s shared experiences, religious beliefs, tradi-tions, and culture (Forsman et al., 2012; Fukuyama, 2001; Johnston et al., 2013). Culture is the shared “knowledge, beliefs, attitudes and artifacts” of a group of people, and culture “plays a cen-tral role in informing research” (Gill, 2013, p.71).
The current study excludes structural social capital from the research context and focuses on the cognitive social capital of university students.
Figure 1 shows three different types of cognitive social capital that form the focus of this study. Cognitive social capital is comprised of bridging, bonding, and maintained social capital (Boyd & Ellison, 2007; Johnston et al., 2013; Putnam, 2000).
The measurement, as well as the meaning of social capital, is abstract (Islam et al., 2006; John-ston et al., 2013; Williams, 2006). Perceived cognitive social capital from SNSs may be measured
Figure 1: Cognitive Social Capital (Johnston et al., 2013)
Impact of Facebook and Twitter Usage on Social Capital
6
using the Internet Social Capital Scales (ISCS) framework developed by Williams (2006). The ISCS measures perceived internet social capital and has been validated in previous studies (Ellison et al., 2007; Johnston et al., 2013; Valenzuela et al., 2009).
The ISCS compares two dimensions: bridging versus bonding, and online versus offline. The two dimensions correspond to four subscales: offline bonding, online bonding, offline bridging, and online bridging. All of these dimensions make use of ten question items with five-point Likert scale responses. Table 1 shows the ISCS framework by Williams (2006).
Table 1: Internet social capital scales (Williams, 2006)
Bridging social capital The focus of bridging social capital is on external relations (Adler & Kwon, 2002; Burke, Kraut, & Marlow, 2011; Vitak et al., 2011) and on the weak ties that are formed among individuals (Burke et al., 2011; Johnston et al., 2013; Putnam, 2000; Vitak et al., 2011). These weak ties are usually established between people from different occupations, ethnic groups, and cultural back-grounds (Islam et al., 2006; Johnston et al., 2013; Vitak et al., 2011) and are not limited by any socio-economic or geographical distance (Carter & Maluccio, 2003; Johnston et al., 2013; Vitak et al., 2011).
Bridging social capital is heterogeneous (Burke et al., 2011; Helliwell & Putnam, 2004; Johnston et al., 2013), since weak tie relationships are perceived to be relationships that are lacking in depth and are short-lived (Johnston et al., 2013; Williams, 2006). Bridging social capital affords different outlooks and non-redundant and/or beneficial information (Johnston et al., 2013; Vitak et al., 2011). Although bridging social capital might expand an individual’s social horizon, it does not offer much emotional support to the individual (Ellison et al., 2007; Granovetter, 1983, 2001; Johnston et al., 2013; Williams, 2006). Individuals who have more bridging social capital usually have more information at their disposal, as well as access to more opportunities (Burke et al., 2011; Granovetter, 1983; Johnston et al., 2013).
SNSs such as Facebook and Twitter have the capacity to increase the formation and maintenance of bridging social capital due to the low usage costs of SNSs (Donath & Boyd, 2004; Johnston et
Petersen & Johnston
7
al., 2013). Cohesion between different backgrounds, ethnicities and racial groups can also be achieved as a result of weak tie relationships (Adler & Kwon, 2002; Johnston et al., 2013).
The study done by Ellison et al. (2007) showed that students who made use of Facebook intensively and significantly contributed to the generation and maintenance of bridging social capital. Based on previous studies (Donath & Boyd, 2004; Ellison et al., 2007), the following hy-potheses were proposed to investigate whether the intensity of Facebook and Twitter usage sup-ports the generation and maintenance of an individual’s perceived bridging social capital:
H1a: Intensity of Facebook use will be positively associated with individuals’ perceived bridging social capital.
H1b: Intensity of Twitter use will be positively associated with individuals’ perceived bridging social capital.
Bonding social capital The focus of bonding social capital is on the internal relations and the strong ties that are formed among individuals within a social network (Adler & Kwon, 2002; Gill, 2012; Johnston et al., 2013; Rost, 2011). Bonding social capital usually exists among individuals who are closely relat-ed, such as members of a family, close friends, and other forms of close relationships (Adler & Kwon, 2002; Johnston et al., 2013; Morrow, 2001; Rost, 2011).
Bonding social capital is largely homogeneous, existing among individuals who are in strongly associated, closely related, and emotionally connected relationships (Ellison et al., 2007; Wil-liams, 2006) or cultures. Individuals in strong cultures have shared values, which increases the understanding and bonding between individuals when communicating or informing about each other’s experiences (Gill, 2013). Homophily is the tendency of individuals to group with individ-uals perceived to be similar to themselves, and homophily “is significant in the development of social and informing networks” (Gill, 2012, p.50).
Emotional support and behavioural transfers are common among individuals within bonding rela-tionships (Forsman et al., 2012; Islam et al., 2006). Both Ellison et al. (2007) and Williams (2006) pointed out that little empirical research had been done to examine the effects of the inten-sity that internet usage has on bonding social capital, although some studies have questioned whether intense internet use supplements or replaces strong ties.
Previous studies (Ellison et al., 2007; Johnston et al., 2013) showed that the intensity of Facebook usage is a predictor of bonding social capital. The following hypotheses were proposed to inves-tigate whether the intensity of Facebook and Twitter usage supports the generation and mainte-nance of an individual’s perceived bonding social capital:
H2a: Intensity of Facebook use will be positively associated with individuals’ perceived bonding social capital.
H2b: Intensity of Twitter use will be positively associated with individuals’ perceived bonding social capital.
Maintained social capital Social networks change over time as new relationships form and other relationships are aban-doned (Ellison et al., 2007). According to Ellison et al. (2007) and Putnam (2000), significant changes within a social network may impact the social capital of individuals. The focus of main-tained social capital is on the maintenance of relations and on the benefits obtained from main-tained relations (Bargh & Mckenna, 2004; Ellison et al., 2007; Recuero et al., 2011).
Impact of Facebook and Twitter Usage on Social Capital
8
Putnam (2000) argued that moving geographic location as well as progressing through life are possible causes that can reduce an individual’s social capital. Previous studies (Cummings, Lee, & Kraut, 2006; Wellman et al., 2001) investigated the role that intensity of internet use had on an individual’s maintained social capital. The results of Kwon et al. (2013) and Wellman et al.’s (2001) study showed that intense internet users made use of email services to maintain long distance relationships, rather than using email to substitute offline interactions with those living nearby. Both Ellison et al. (2007) and Putnam (2000) argued that technology could be utilised to assist in maintaining relationships threatened by changes.
According to Paul and Brier (2001) and Ishler (2004), “friendsickness” refers to the anguish caused by the loss of connection to old friends, with both providing an example of friendsickness when school-leavers move away to a tertiary institution. A study done by Cunnings, Lee, and Kraut (2006) found that university students maintain relationships with their high school friends primarily through email and instant messaging services provided by SNSs. Kwon et al. (2013, p. 36) support this when they say, “SNS use supports loose social ties and helps users create and maintain relationships.”
To determine the role of maintained high school relationships as weak bridging ties, Ellison et al (2007) adapted Williams’ (2006) scale for general bridging relationships to relate to maintained high school relationships. This construct, according to both Ellison et al. (2007) and Johnston et al. (2013), is defined as “maintained social capital”. Hence this construct was used in this study to measure maintained social capital.
The following hypotheses, drawn from research by Ellison et al (2007) and Johnston et al. (2013), were proposed to focus on the maintenance of existing social capital:
H3a: Intensity of Facebook use will be positively associated with individuals’ perceived maintained social capital.
H3b: Intensity of Twitter use will be positively associated with individuals’ perceived maintained social capital.
Benefits of Social Capital The benefits of social capital are linked to various social outcomes, such as being an enabler in improving accessibility to healthcare and a driver for economic development, improved educa-tion, and lower crime rates (Adler & Kwon, 2002; Johnston et al., 2013; McKenzie, Whitley, & Weich, 2002). Social capital offers many benefits to social networks such as the reduction of “free riding”, which occurs when an individual gains from the efforts of others without contrib-uting to the collective (Boyd & Ellison, 2007). These benefits are realised by means of shared values and norms of behaviour among individuals within a social network (Johnston et al., 2013).
Social capital can be used to predict characteristics of education, such as academic performances, quality of education, and intellectual development (Boyd & Ellison, 2007). Social capital can also be used to predict characteristics of healthcare, such as mental and physical health. Economic characteristics can also be predicted from social capital, such as the state of the economy, sources of employment, and criminal activities (Boyd & Ellison, 2007; Coleman, 1989; McKenzie et al., 2002; Portes, 1998; Portes & Vickstrom, 2011; Putnam, 2000).
Social capital usually tends to be inversely proportional to social disorder, reduced civic partici-pation, and distrust (Portes & Vickstrom, 2011). The lower the social capital within a community, the greater the social disorder, the distrust among individuals, and the lower civic participation (Helliwell & Putnam, 2004). However, an increase in social capital within a community or a so-cial network comes with a collective commitment of members towards a positive action, which results in a positive impact on member interaction (Ellison et al., 2007).
Petersen & Johnston
9
For individuals, greater social capital allows a person to be more resourceful and draw on re-sources from other members within a social network to which the individual belongs (Ellison et al., 2007). These resources can take the form of personal relationships, information sharing, the capacity to formulate groups, or employment connections (Ellison et al., 2007). Moreover, the various forms of social capital are also related to indices of psychological well-being, such as measures of self-esteem and satisfaction with life (Bargh & Mckenna, 2004; Ellison et al., 2007; Helliwell & Putnam, 2004; Johnston et al., 2013). Self-esteem may be assessed using Rosen-berg’s (1965) self-esteem scale, and satisfaction with life by using Pavot and Diener’s (1993) scales, two validated measures of subjective well-being.
The following hypotheses aim to investigate whether Facebook and Twitter usage is beneficial towards an individual’s social capital by investigating the relationship between the intensity of Facebook and Twitter usage and an individual’s bridging social capital with changing self-esteem and satisfaction with university life (Ellison et al., 2007; Johnston et al., 2013):
H4a: The relationship between quantity of Facebook use and bridging social capital will vary depending on the degree of a person’s self-esteem.
H4b: The relationship between quantity of Twitter use and bridging social capital will vary depending on the degree of a person’s self-esteem.
H5a: The relationship between quantity of Facebook use and bridging social capital will vary depending on the degree of a person’s satisfaction with life.
H5b: The relationship between quantity of Twitter use and bridging social capital will vary depending on the degree of a person’s satisfaction with life.
Negative Social Capital Although social capital has various benefits, negative characteristics do exist (Graeff & Svendsen, 2013; Portes, 1998; Portes & Vickstrom, 2011). According to Fukuyama (2001), social capital with the aid of SNSs such as Facebook and Twitter may be used to promote the formation of hate groups and hate speech (Pepper, Leithauser, Loroz, & Steverson, 2012; Recuero et al., 2011).
Outsiders of a social network may be excluded and not given access to a social network due to the bonding capital between individuals (Johnston et al., 2013; Portes, 1998; Portes & Vickstrom, 2011). Free riding can become prevalent within a social network, when socially weaker individu-als make excessive claims on the socially stronger individuals (Johnston et al., 2013; Portes, 1998; Portes & Vickstrom, 2011).
Individuals within social networks generally experience that their degree of conformity within a social network increases as their degree of involvement increases, since individuals start exhibit-ing the sharing of norms, values, and beliefs (Johnston et al., 2013; Portes, 1998; Portes & Vickstrom, 2011); this can counter individual freedom.
The following hypotheses investigate the association between Facebook and Twitter usage with an individual’s bonding social capital and whether the association is negative or not by investigat-ing the relationship with the degree of self-esteem and satisfaction with university life (Ellison et al., 2007; Johnston et al., 2013):
H6a: The relationship between quantity of Facebook use and bonding social capital will vary depending on the degree of a person’s self-esteem.
H6b: The relationship between quantity of Twitter use and bonding social capital will vary depending on the degree of a person’s self-esteem.
Impact of Facebook and Twitter Usage on Social Capital
10
H7a: The relationship between quantity of Facebook use and bonding social capital will vary depending on the degree of a person’s satisfaction with life.
H7b: The relationship between quantity of Twitter use and bonding social capital will vary depending on the degree of a person’s satisfaction with life.
The South African Context This research was done in South Africa, and no South African study may be done without under-standing the country’s social context (Johnston et al., 2013). During the Apartheid era in South Africa (1948-1992), people of colour were humiliated and oppressed, which limited them from gaining access to education as well as the ability to gain and make use of assets (Carter & May, 2001). Every South African was given a racial classification and given an identification document that contained the individual’s name, identification number, year of birth as well as racial classifi-cation (Johnston et al., 2013; Ramphele, 2008). The South African government, during the apart-heid years, developed and implemented laws that segregated the people of South Africa by race (Johnston et al., 2013; Ramphele, 2008).
Twenty years into South Africa’s democracy, issues related to race and identity still persist and affect various aspects of the lives of South Africans (Boesak, 2009). South Africa still remains a divided nation, where white people mainly populate the first world parts of the country, and black people populate the third world parts (Adato, Carter, & May, 2006). This, in turn, impacts and distorts most South African statistics (Waddock, 2007).
Table 2 compares the life expectancy, literacy rate and GDP per capita of South Africa with the Sub-Saharan African region as well as with the world (Klugman, 2013). According to a report by the World Bank (2013), the GINI index of South Africa was measured at 67.4 in 2006 and dropped to 63.14 in 2009. According to Hall (2007) and Hall (2012), South Africa is one of the world’s most unequal countries, with more than 50% of South African’s living in poverty and more than 10% of South African’s living in absolute poverty. The South African population is estimated to be 52.83 million, with 51% of South African’s being female, 79.8% of South Afri-can’s being black, 9% coloured, 2.5% Indian or Asian and 8.7% white (Statistics South Africa, 2013).
Table 2: Life Expectancy, Literacy Rate and GDP per Capita Comparison (Klugman, 2013)
South Africa Sub-Saharan Africa The World
Life Expectancy 53.4 54.9 70.1
Literacy Rate 88.7 63.0 81.3
GDP per Capita $9,678 $2,094 $10,103
The average rate of graduation among undergraduate university students in the 23 public univer-sities of South Africa lies at 12%; for master’s degree students, the average graduation rate is 20%, and for doctoral students 12% (Nzimande, 2013). The graduate rate refers to the number of graduates in a given year expressed as a percentage of the total enrolment (covering all years of the study) in that year (Nzimande, 2013). According to Nzimande (2013), the reasons for these low graduation rates include financial constraints, lack of academic preparedness, and students not receiving adequate support from their universities. Nzimande stated that the student popula-tion was comprised of 54% female students enrolled in contact programmes and 63% female stu-dents enrolled in distance education programmes. Black students made up 78% and 83% of all students enrolled at contact programmes and distance education programmes respectively. More than one-third of the students were enrolled at the University of South Africa (UNISA), making
Petersen & Johnston
11
UNISA, in terms of student population size, the largest university in South Africa (Nzimande, 2013). While the majority of South African students are black, their financial struggles and histor-ical prejudice still impact’s their schooling.
Research Methodology The research philosophy, according to Saunders, Lewis, and Thornhill (2012), relates to the de-velopment of knowledge and the nature of the knowledge being developed. According to Saunders et al., the four research philosophies in management research are Positivism, Realism, Interpretivism, and Pragmatism. Positivism states that the only authentic knowledge is scientific knowledge that can come only from positive verification of observable experience, while Real-ism entities exist independently of being perceived or independently of theories about the entities (Saunders et al., 2012). Interpretivism starts from the position that the knowledge of reality, in-cluding the domain of human action, is a social construction by human actors and equally applies to research, and Pragmatism proposes that either or both observable phenomena and subjective meaning can provide acceptable knowledge dependent on the research question (Saunders et al., 2012).
This research made use of the positivist research philosophy, which states that the only authentic knowledge is scientific knowledge that can come only from positive verification of observable experience (Saunders et al., 2012). The research was a replication of a previous study (Johnston et al., 2013), which also made use of a positivist research philosophy.
This study was of an explanatory nature since it aimed to establish casual relationships between variables (Saunders et al., 2012). The research aimed to establish the fundamental relationships between the impact Facebook and Twitter usage has on university students’ cognitive social capi-tal.
The research approach was deductive, as this study was based on previous research done by John-ston et al. (2013), and would use and test the qualitative data collected (Saunders et al., 2012).
The research instrument used was a survey questionnaire which made extensive use of five-point Likert scales designed to gather quantitative data. The reason for this choice was based on the success achieved from previous, similar studies conducted by Ellison et al. (2007) and Johnston et al. (2013). The research instrument is available on request. The questionnaire was distributed via email to a random sample of the over 100,000 students attending the five universities. Accompa-nying the email was a cover letter explaining the purpose and objectives of the questionnaire, in-formation about the confidentiality agreement, and a request to forward the questionnaire to fel-low university students. The data collected from the survey questionnaire was used to suggest reasons for relationships between variables and to produce models representative of those rela-tionships (Saunders et al., 2012).
This research made use of non-probability sampling techniques, namely a combination of both convenience based sampling and snowball sampling due to time constraints as well as to the rela-tive ease of access (Saunders et al., 2012). Convenience based sampling eliminates the difficulty involved in surveying the population, and snowball sampling ensures that a representative sample of the population is selected (Saunders et al., 2012). This study targeted all students from public universities within the Western Cape.
The collected data was checked for completeness and cleaned using Microsoft Excel 2013 by re-moving all incomplete responses so that statistical analysis of the data could be done using Statis-tica. The Chi-squared Goodness of Fit test was used to determine whether the sample accurate-ly represented the population of university students within the Western Cape (Seago & Vallado, 2010). Regression Analysis was used to measure the impact of Facebook and Twitter on the so-
Impact of Facebook and Twitter Usage on Social Capital
12
cial capital of university students (Atkinson & Riani, 2000; Chatterjee & Hadi, 2013). Cronbach alphas were used to the determine reliability of all constructs within the study, with numbers > 0.6 taken to indicate reliability (Tavakol & Dennick, 2011).
The main limitation of this study was that respondents may have misreported behavioural or de-mographic details since this study made use of self-reported measures rather than direct measures of Facebook and Twitter use and other surveyed variables. Since a combination of convenience sampling and snowball sampling was used, the sample is likely not an accurate reflection of the current state of South Africa, and a generalisation to all South African universities is not plausible (Saunders et al., 2012).
Results The instrument adapted from Johnston et al. (2013) collected 110 valid responses for Facebook and 69 for Twitter. Data regarding the respondents’ demographic details, including gender, age, academic year, residency, and race/ethnicity are in Table 3. The gender demographics of the re-spondents is in inverse proportion to the general university population of South Africa, with a higher percentage of males (51%), compared to the general university population which has 46% males (Nzimande, 2013).
Table 3: Sample demographics (N = 110)
Mean or % (N) S.D Gender:
Male 51% (56) Female 49% (54)
Age 22,5 2.59 Out-of-town student 27% (30) University:
Cape Peninsula University of Technology 6.4% (7) Stellenbosch University 5.4% (6)
University of Cape Town 51% (56) University of South Africa 5.4% (6)
University of the Western Cape 31.8% (35) Current Residence:
Campus Residence 14.5% (16) Diggs 15.5% (17)
Family 70% (77) Year in school 3.11 1.11 Race/Ethnicity:
White 6% (7) Black (includes Coloureds and Asians) 94% (103)
Member of Clubs/Societies 48% (53) Facebook Members 97% (107) Twitter Members 61% (67)
The racial mix of 6% whites is similar to the overall mix in South Africa, where whites make up 8.7% of the population (Statistics South Africa, 2013). The chi-squared goodness-of-fit test con-firmed that the sample used was a good representation of Western Cape university students both in terms of race and gender when compared to data from HEMIS (2013), pertaining to South Af-rican universities’ student enrolment.
Petersen & Johnston
13
Facebook and Twitter Intensity The intensity scales attempted to measure the intensity of both Facebook and Twitter use other than just measures of frequency or duration of use (Ellison et al., 2007; Johnston et al., 2013). Both constructs consisted of two questions regarding Facebook use (Q14 and Q15 in Table 4), and two questions regarding Twitter use (Q20 and Q21 in Table 5). Two Likert-scale questions containing six sub questions were used to assess respondents’ attitudes towards Facebook (Q18 in Table 4) and Twitter (Q24 in Table 5). The attitudinal questions measured the respondents’ extent of emotional connectedness to Facebook and Twitter, as well as the significance of Facebook and Twitter within participants’ regular activities (Ellison et al., 2007; Johnston et al., 2013). The Fa-cebook intensity construct yielded a Cronbach’s alpha of 0.7896, and the Twitter intensity con-struct yielded a Cronbach’s alpha of 0.8986, (both > 0.6) indicating good reliability (Tavakol & Dennick, 2011).
Table 4: Summary statistics for Facebook intensity (N = 110)
Question Individual items and scale Mean S.D Facebook intensity (Cronbach’s alpha = 0,7896) 3.78 1.07 Q. 14 About how many total Facebook friends do you have? 7.82 2.43 1 = 10 or less, 2 = 11-50, 3 = 51-100, 4 = 101-150, 5 = 151-200, 6 = 201-250, 7 =251-300, 8 =301-400 9 = 401-500, 10 = More than 500 Q. 15 In the past week, on average, approximately how much time
per day have you spent on Facebook? 3.51 1.53
1 = Less than 10 min, 2 = 10-30 min, 3 = 31-60 min, 4 = 1-2 hours, 5 = 2-3 hours, 6 = More than 3 hours Q. 18 1. Facebook is part of my everyday activity. 3.36 1.14 2. I am proud to tell people I’m on Facebook. 3.32 0.87 3. Facebook has become part of my daily routine. 3.32 1.17
4. I feel out of touch when I haven’t logged onto Facebook for a while.
2.76 1.30
5. I feel I am part of the Facebook community. 3.15 1.08
6. I would be sorry if Facebook shut down. 3.03 1.26 The analysis of Tables 4 and 5 indicate that the average Western Cape university student claims to have between 301-400 Facebook friends and between 101-150 Twitter followers. The number of Facebook friends has increased from 100-150 as per Johnston et al.’s (2013) results. The num-ber of friends of friends included is unknown. Tables 4 and 5 also indicate that the average West-ern Cape university student spent between 1-2 hours a day on Facebook and between 10-30 minutes on Twitter. Once again a huge increase from Johnston et al.’s (2013) respondents who spent between 10-30 minutes a day on Facebook. The reason for the differences with Johnston et al.’s (2013) study is due to factors such as the increased rate of mobile penetration in the developing world (Lau, Cassidy, Hacking, Brittain, Haricharan & Heap, 2014), Johnston et al.’s (2013) data was gathered in 2011; today, Facebook is more widely used by students and accepted by university students (Akpojivi, 2013; Thinyane, 2010). The Likert-scale questions for Facebook intensity provided neutral results, with mean values around three, whereas for Twitter intensity, the respondents had mean values around two. However, the standard deviations for most items for both constructs were relatively high (i.e., above 1) excluding sub question 2 for Facebook intensi-ty.
Impact of Facebook and Twitter Usage on Social Capital
14
Table 5: Summary statistics for Twitter intensity (N = 69)
Question Individual items and scale Mean S.D Twitter intensity (Cronbach’s alpha = 0,8986) 2,56 1,21 Q. 20 About how many total Twitter followers do you have? 3,97 2,79 1 = 10 or less, 2 = 11-50, 3 = 51-100, 4 = 101-150, 5 = 151-200, 6 = 201-250, 7 =251-300, 8 =301-400 9 = 401-500, 10 = More than 500 Q. 21 In the past week, on average, approximately how much time
per day have you spent on Twitter?
2,18 1,57
1 = Less than 10 min, 2 = 10-30 min, 3 = 31-60 min, 4 = 1-2 hours, 5 = 2-3 hours, 6 = More than 3 hours Q. 24 1. Twitter is part of my everyday activity. 2,28 1,42 2. I am proud to tell people I’m on Twitter. 2,97 1,15 3. Twitter has become part of my daily routine. 2,19 1,32
4. I feel out of touch when I haven’t logged onto Twitter for a while. 2,01 1,32
5. I feel I am part of the Twitter community. 2,39 1,23 6. I would be sorry if Twitter shut down. 2,49 1,51
Profile Elements and Perceptions of Profile Views Respondents were asked to indicate the profile elements they have included within their Face-book (results in Figure 2) and Twitter profiles (Figure 4). Respondents were also asked to indicate who they thought viewed their Facebook (Figure 3) and Twitter profiles (Figure 5). According to Ellison et al. (2007) and Johnston et al. (2013), these items are valuable in assessing the use of both Facebook and Twitter with regard to the development of new relationships and the mainte-nance of existing relationships.
‘My High School’ was the most common Facebook profile element on respondents’ Facebook profiles (85%), and ‘My Classes’ was the least common profile element (14%). Johnston et al.’s
Figure 2: Facebook profile elements
Petersen & Johnston
15
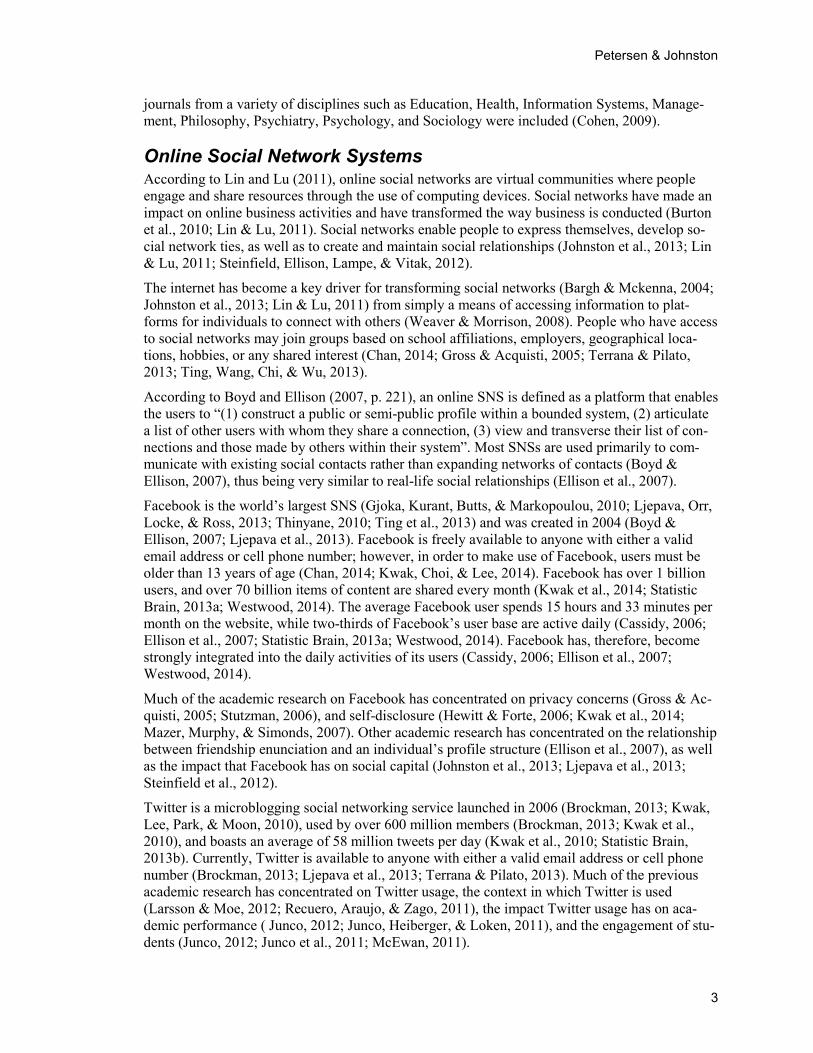
(2013) respondents indicated ‘Contact details’ as the most common Facebook profile element (77%), and ‘My Classes’ as the least common Facebook profile element (10%). ‘Contact details’ have probably dropped due to a higher awareness of security issues.
Figure 3 shows respondents’ perceptions of who they think viewed their Facebook profile, ‘High school friends’ (94%), ‘Family members’ (87%), and ‘Friends other than high school friends’ (85%) were the most selected responses. Johnston et al.’s (2013) respondents had ‘High school friends’ (88%), ‘Friends other than high school friends’ (85%), and ‘Family members’ (66%) as the most selected responses.
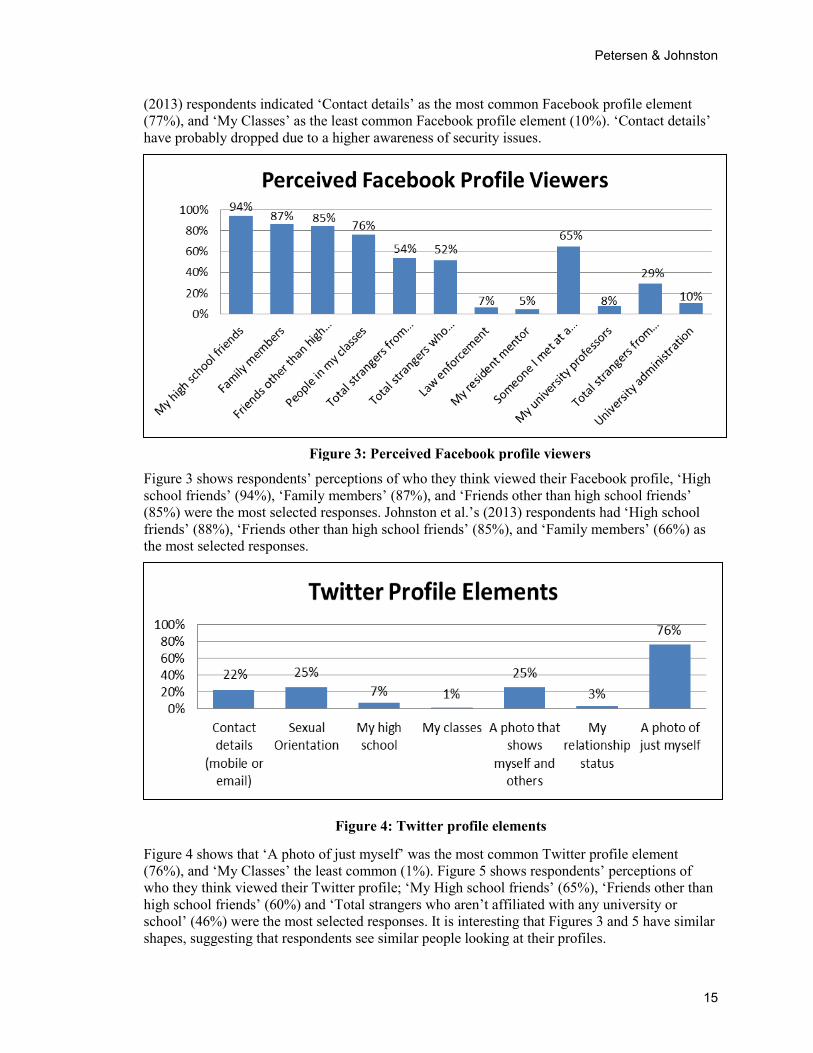
Figure 4 shows that ‘A photo of just myself’ was the most common Twitter profile element (76%), and ‘My Classes’ the least common (1%). Figure 5 shows respondents’ perceptions of who they think viewed their Twitter profile; ‘My High school friends’ (65%), ‘Friends other than high school friends’ (60%) and ‘Total strangers who aren’t affiliated with any university or school’ (46%) were the most selected responses. It is interesting that Figures 3 and 5 have similar shapes, suggesting that respondents see similar people looking at their profiles.
Figure 4: Twitter profile elements
Figure 3: Perceived Facebook profile viewers
Impact of Facebook and Twitter Usage on Social Capital
16
Use of Facebook and Twitter to Meet New People Vs. Connect with Existing Offline Contacts The purpose of this construct was to ascertain whether respondents are motivated to use Facebook and Twitter to search for new people online or to connect with people with whom they already have an offline relationship (Ellison et al., 2007; Johnston et al., 2013). Table 6 shows that the Cronbach’s alpha for the construct ‘Offline to online: use of Facebook to connect with offline contacts’ is 0.69 and is considered to be reliable (>0.6). Table 7 shows that the Cronbach’s alpha for the construct ‘‘Offline to online: use of Twitter to connect with offline contacts” is 0.86 and is considered to be highly reliable in supporting the construct. This indicates that Twitter is used to connect with offline contacts more than Facebook is.
Table 6: Summary statistics for Facebook use for prior contacts and meeting new people (N = 110)
Question Individual items and scale Mean S.D Offline to online: use Facebook to connect with offline contacts (Cronbach’s alpha = 0,69)
3,04 1,24
Q. 17 1. I have used Facebook to check out someone I met socially. 4,05 1,14
2. I use Facebook to learn more about other people in my classes.
2,86 1,35
3. I use Facebook to learn more about other people living near me.
2,16 1,27
4. I use Facebook to keep in touch with my old friends. 4,33 0,99 Online to offline: I use Facebook to meet new people (single-item meas-ure)
1,83 1,06
Table 6 shows that the single item measure ‘Online to offline: I use Facebook to meet new peo-ple’ has a mean of 1.83. Johnston et al.’s (2013) study produced a mean of 2.55, while Ellison et al., (2007) had a mean of 1.97. Table 7 shows that the single item measure ‘Online to offline: I use Twitter to meet new people’ has a mean of 2.12 which is lower than Johnston et al.’s (2013) Facebook single item measure, but higher than the current study’s Facebook single item measure (1.83). Similar to Johnston et al.’s (2013) study, the sub question ‘I use Facebook to keep in touch
Figure 5: Perceived Twitter profile viewers
Petersen & Johnston
17
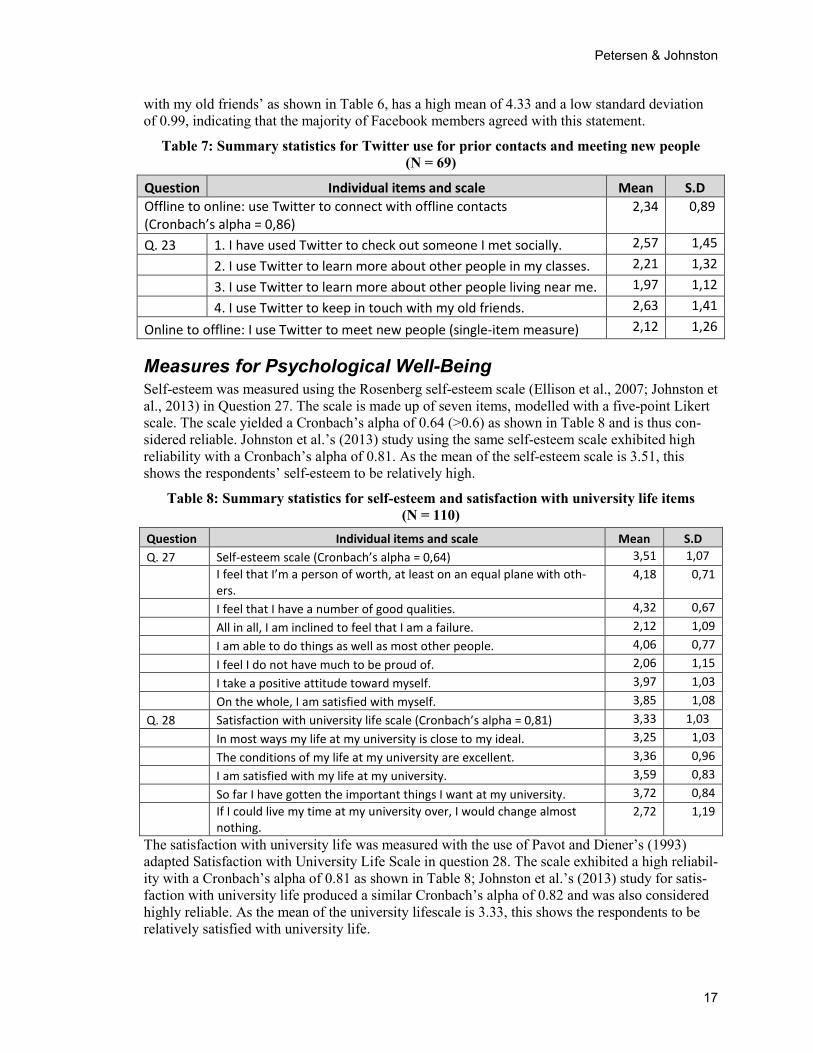
with my old friends’ as shown in Table 6, has a high mean of 4.33 and a low standard deviation of 0.99, indicating that the majority of Facebook members agreed with this statement.
Table 7: Summary statistics for Twitter use for prior contacts and meeting new people (N = 69)
Question Individual items and scale Mean S.D Offline to online: use Twitter to connect with offline contacts (Cronbach’s alpha = 0,86)
2,34 0,89
Q. 23 1. I have used Twitter to check out someone I met socially. 2,57 1,45
2. I use Twitter to learn more about other people in my classes. 2,21 1,32
3. I use Twitter to learn more about other people living near me. 1,97 1,12
4. I use Twitter to keep in touch with my old friends. 2,63 1,41
Online to offline: I use Twitter to meet new people (single-item measure) 2,12 1,26
Measures for Psychological Well-Being Self-esteem was measured using the Rosenberg self-esteem scale (Ellison et al., 2007; Johnston et al., 2013) in Question 27. The scale is made up of seven items, modelled with a five-point Likert scale. The scale yielded a Cronbach’s alpha of 0.64 (>0.6) as shown in Table 8 and is thus con-sidered reliable. Johnston et al.’s (2013) study using the same self-esteem scale exhibited high reliability with a Cronbach’s alpha of 0.81. As the mean of the self-esteem scale is 3.51, this shows the respondents’ self-esteem to be relatively high.
Table 8: Summary statistics for self-esteem and satisfaction with university life items (N = 110)
Question Individual items and scale Mean S.D Q. 27 Self-esteem scale (Cronbach’s alpha = 0,64) 3,51 1,07
I feel that I’m a person of worth, at least on an equal plane with oth-ers.
4,18 0,71
I feel that I have a number of good qualities. 4,32 0,67 All in all, I am inclined to feel that I am a failure. 2,12 1,09 I am able to do things as well as most other people. 4,06 0,77 I feel I do not have much to be proud of. 2,06 1,15 I take a positive attitude toward myself. 3,97 1,03 On the whole, I am satisfied with myself. 3,85 1,08 Q. 28 Satisfaction with university life scale (Cronbach’s alpha = 0,81) 3,33 1,03 In most ways my life at my university is close to my ideal. 3,25 1,03 The conditions of my life at my university are excellent. 3,36 0,96 I am satisfied with my life at my university. 3,59 0,83 So far I have gotten the important things I want at my university. 3,72 0,84
If I could live my time at my university over, I would change almost nothing.
2,72 1,19
The satisfaction with university life was measured with the use of Pavot and Diener’s (1993) adapted Satisfaction with University Life Scale in question 28. The scale exhibited a high reliabil-ity with a Cronbach’s alpha of 0.81 as shown in Table 8; Johnston et al.’s (2013) study for satis-faction with university life produced a similar Cronbach’s alpha of 0.82 and was also considered highly reliable. As the mean of the university lifescale is 3.33, this shows the respondents to be relatively satisfied with university life.
Impact of Facebook and Twitter Usage on Social Capital
18
Measures of Cognitive Social Capital The three forms of cognitive social capital (bridging, bonding, and maintained social capital) were measured by adapting existing scales and including items which also captured internet-specific social capital (Ellison et al., 2007; Johnston et al., 2013). All items that measured the three forms of social capital were factor analysed with varimax rotation to ensure that the items reflected three distinct dimensions of social capital. The results show that the items measuring social capital are representative of three distinct dimensions as shown in Table 9.
Table 9: Summary statistics and factor analysis results for social capital items
Individual Items and Scales Mean S.D Factor Loadings
Bridging Social Capital
Bonding Social Capital
Maintained Social Capi-tal
Bridging Social Capital (Cronbach’s alpha = 0,83)
3,76 0,84
I feel I am part of my university community. 3,68 0,91 0,59 0,23 0,07
I am interested in what goes on at my uni-versity.
3,76 0,76 0,81 0,03 0,07
I would be willing to contribute money to my university after graduation.
3,27 1,04 0,33 0,08 0,26
My university is a good place to be. 4,13 0,75 0,53 0,25 0,19 Interacting with people at my university reminds me that everyone on the world is connected.
3,80 0,84 0,77 0,11 0,04
Interacting with people at my university makes me want to try new things.
3,85 0,72 0,63 0,13 0,22
Interacting with people at my university makes me feel like part of a larger commu-nity.
3,84 0,83 0,73 0,14 0,25
I am willing to spend time to support gen-eral university activities.
3,50 0,85 0,60 0,13 0,13
At my university, I came in contact with new people all the time.
4,05 0,82 0,67 0,01 0,06
Bonding Social Capital (Cronbach’s alpha = 0,31)
3,50 1,03
There are several people at my university I trust to solve my problems.
3,40 1,06 0,15 0,63 -0,02
If I needed an emergency loan of R100, I know someone at my university I can turn to.
3,61 1,27 0,10 0,78 0,00
There is someone at my university I can turn to for advice about making very im-portant decisions.
4,04 0,87 0,08 0,71 0,30
The people I interact with at my university would be good job references for me.
4,07 0,88 0,29 0,61 0,21
Petersen & Johnston
19
Individual Items and Scales Mean S.D Factor Loadings
Bridging Social Capital
Bonding Social Capital
Maintained Social Capi-tal
I do not know people at my university well enough to get them to do anything im-portant.
2,39 1,04 -0,03 -0,71 0,00
Maintained Social Capital (Cronbach’s alpha = 0,84)
3,48 1,08
I’d be able to find out about events in an-other town from a high school acquaint-ance living there.
3,31 1,01 0,27 0,01 0,66
If I needed to, I could ask a high school ac-quaintance to do a small favour for me.
3,44 1,11 0,21 0,14 0,75
I’d be able to stay with a high school ac-quaintance if travelling to a different city.
3,32 1,20 0,04 0,20 0,79
I would be able to find information about a job or internship from a high school ac-quaintance.
3,61 1,01 0,02 0,00 0,82
It would be easy to find people to invite to my high school reunion.
3,71 1,07 0,11 0,00 0,76
The first construct measured the extent to which respondents experienced bridging social capital (Ellison et al., 2007; Johnston et al., 2013), by making use of Williams’ (2006) bridging social capital subscale. The scale exhibited high reliability producing a Cronbach’s alpha value of 0.83, and a mean of 3.76.
The degree to which respondents experienced bonding social capital (Ellison et al., 2007; Johnston et al., 2013) was measured using Williams’ (2006) adapted bonding social capital sub-scale. The scale did not exhibit high reliability, producing a Cronbach’s alpha value of 0.31, and a mean of 3.50.
The degree to which respondents experienced maintained social capital was measured using a scale adapted from Johnston et al. (2013). The scale exhibited high reliability, producing a Cronbach’s alpha value of 0.83, and a mean of 3.48.
Findings Johnston et al.’s (2013) study included 33% of respondents which were not Facebook members, whereas the current study included only 3% of respondents who were not members of Facebook, indicating that the percentage of Facebook members has increased. Thus, the current study cannot draw conclusions about whether Facebook members and non-Facebook members differ signifi-cantly with regard to demographics, due to the low proportion of non-Facebook members. How-ever, having 39% of respondents not being members of Twitter provided an interesting aspect.
The respondents spent 1-2 hours per day using Facebook, while Johnston et al.’s (2013) study indicated that 10-30 minutes per day was spent by South African university students that were Facebook members. Twitter respondents spent 10-30 minutes on Twitter per day, similar to the results of Johnston et al.’s (2013) study with regard to Facebook. The average respondent has be-tween 301-400 Facebook friends and between 101-150 Twitter followers, while Johnston et al.’s
Impact of Facebook and Twitter Usage on Social Capital
20
(2013) study indicated that South African students had between 100-150 Facebook friends (simi-lar to the number of Twitter followers). It appears that Twitter is today where Facebook was a few years ago. The increase in the average hours spent per day on Facebook as well as an in-crease in the average number in Facebook friends may be due to an increased technological adop-tion rate and an increased technological awareness. The respondents of the current study were just as balanced in terms of gender (51% male) as in Johnston et al.’s (2013) study (55% male).
In the current study, 73% of respondents indicated that their home residence is within the city they are studying in, while 27% were from ‘out-of-town’. By comparison, in Johnston et al.’s (2013) study, only 61% indicated that their home residence was within the city in which they were studying, and 39% were from ‘out-of-town’. The current study indicated that 48% of all re-spondents are members of clubs and societies, similar to Johnston et al.’s (2013) results of 43%.
The aim of the research was to identify whether Facebook and Twitter use have an impact in the creation and maintenance of social capital. The respondents in Johnston et al.’s (2013) study pri-marily used Facebook as a tool for developing an online persona for themselves, as can be seen by ‘Contact details’, ‘A photo of myself with others’, ‘A photo of myself’, and ‘Relationship sta-tus’ being the most highly selected Facebook profile elements and ‘my classes’ being the least. This study yielded similar results with regard to the primary use of Facebook, but ‘Maintaining high school relationships’ was also important. The respondents primarily use Twitter to develop an online persona since ‘A photo of myself’ was the highest selected profile element. ‘My high school’ and ‘My classes’ were the least selected Twitter profile elements which indicates that Twitter is not used to maintain high school and university relationships, which is similar to the Johnston et al.’s (2013) study with regard to Facebook usage.
The question ‘I use Facebook to keep in touch with old friends’ (part 4 of Q17 in Table 6) has a mean of 4.33 and a standard deviation of 0.99. This indicates that the majority of the respondents strongly agreed with this statement, indicating that most respondents make use of Facebook to build their maintained social capital. The similar sub item for Twitter produced a mean of 2.63 and a standard deviation of 1.41, which indicates that the intended use of Twitter is not to main-tain relationships since the majority of respondents disagreed with this sub item.
In order to explore the research hypotheses, regression analyses were conducted to predict wheth-er certain variables were significant in impacting the various forms of social capital. An initial regression model was created and accessed for each form of social capital. The initial regression models controlled for demographics, subjective well-being, and general internet use factors, in order to assess the amount of variance Facebook and Twitter usage accounted for within the vari-ous forms of social capital. Additional variables of measuring the intensity of Facebook and Twit-ter use were added to the initial regression models and reassessed. Finally, both interaction varia-bles of self-esteem by Facebook and Twitter intensity and satisfaction with university life by Fa-cebook and Twitter intensity were introduced and the regression model reassessed.
Regression Model: Bridging Social Capital In order to test Hypotheses 1a and 1b, the extent to which control variables (demographics, gen-eral internet use, and measures of psychological well-being) predicted the amount of bridging social capital as reported by Western Cape university students was investigated. This initial re-gression model yielded an adjusted R2 value of 0.18, which means the variables account for 18% of the variability.
To assess the impact of Facebook use on predicting bridging social capital, an additional variable of ‘intensity of Facebook usage’ was included to the initial regression model, which yielded an adjusted R2 value of 0.16. Two interaction variables (self-esteem and satisfaction with university life) were then introduced to produce Model 1 and Model 2 (see Table 10).
Petersen & Johnston
21
These models yielded adjusted R2 values of 0.15 (Model 1) and 0.19 (Model 2). For Model 1, none of the factors were considered significant predictors of bridging social capital. The self-esteem by Facebook intensity factor is also not a significant predictor of bridging social capital (p = 0.48, <0.5 to be significant). In Model 2, the factors that were considered significant predictors of bridging social capital were ‘Satisfaction with university life’ (p = 0.036) being most signifi-cant, ‘Facebook (FB) intensity’ (p = 0.0426), and ‘Satisfaction by FB intensity’ (p = 0.0433). To assess the impact of Twitter use on predicting bridging social capital, an additional variable of ‘intensity of Twitter’ was included to the initial regression model, which yielded an adjusted R2 value of 0.248, which is greater than the adjusted R2 value produced by the Facebook equivalent model. Models 3 and 4 explored whether Twitter intensity interacted with self-esteem and satis-faction with university life scales (see Table 10).
Table 10: Regressions predicting the amount of bridging social capital
Model 1 Model 2 Model 3 Model 4
Independent variables Stand. Beta p Stand. Beta p Stand. Beta P Stand. Beta p Intercept 0,984 5,522 0,615 1,402 Gender: Male -0,007 -0,019 -0,106 -0,108 Ethnicity: white -0,024 -0,053 0,031 0,018 Year in university 0,236 0,227 0,006 0,023 Home residence: out-of-town 0,125 0,139 0,189 0,189 Local residence: university residence 0,366 0,361 0,077 0,082 Club/society member 0,016 -0,005 0,089 0,108 Hours of internet use per day 0,007 -0,026 -0,124 -0,109 Self-esteem 0,162 -0,671 0,623 * 0,315 * Satisfaction with university life 0,611 0,226 * 0,263 * 0,394 Facebook (FB) intensity 0,332 -1,438 * Twitter (TW) Intensity 1,360 0,413 Self-esteem by FB intensity -0,502 Satisfaction by FB intensity 1,724 * Self-esteem by TW intensity -1,306 Satisfaction by TW intensity -0,313 F= 2,7086, ** F= 3,1542, ** F= 3,1066, ** F= 2,9361, ** NFB = 104; NTw = 69 Adjusted R2= 0,15 Adjusted R2 = 0,19 Adjusted R2 = 0,25 Adjusted R2 = 0,24
Notes: *p < 0.05, **p < 0.01, ***p < 0.001. Only one interaction term was entered at a time in each regression.
The Twitter models yielded higher adjusted R2 values of 0.254 (Model 3), and 0.238 (Model 4). For Model 3, the factors considered significant predictors of bridging social capital include ‘Self-esteem’ (p = 0.030) as most significant, and ‘Satisfaction with university life’ (p = 0.049). Self-esteem by Twitter intensity was found not to be significant in predicting bridging social capital (p = 0.48) in Model 3. For Model 4, ‘Self-esteem’ (p = 0.019) was the only significant predictor of bridging social capital. Both ‘Twitter (TW) intensity’ (p = 0.472) and ‘Satisfaction by TW inten-sity’ (p = 0.609) were found not to be significant predictors of bridging social capital.
Since most of the independent variables were considered insignificant in predicting perceived bridging social capital, Hypotheses 1a and 1b were rejected and the findings of Ellison et al., (2007) and Johnston et al. (2013) were not supported.
Impact of Facebook and Twitter Usage on Social Capital
22
The relationship between quantity of Facebook usage and bridging social capital (hypotheses 4a and 5a) did not change with varying levels of self-esteem but did change with varying levels of satisfaction with university life. The relationship between quantity of Twitter usage and bridging social capital (hypotheses 4b and 5b) did not vary with different levels self-esteem and different levels of satisfaction with university life. Hence hypotheses 4a, 4b, 5a and 5b were rejected.
Regression Model: Bonding Social Capital In order to test Hypotheses 2a and 2b, the extent to which control variables (demographics, gen-eral internet use, and measures of psychological well-being) predicted the amount of bonding so-cial capital as reported by Western Cape university students were investigated. This initial re-gression model of control variables with respect to bonding social capital yielded an adjusted R2 value of 0.17.
Table 11: Regressions predicting the amount of bonding social capital
Model 1 Model 2 Model 3 Model 4
Independent variables Stand. Beta p Stand. Beta p Stand. Beta p Stand. Beta p Intercept 2,530 1,196 1,309 1,791 Gender: Male 0,044 0,053 0,040 0,024 Ethnicity: white 0,004 0,019 0,072 0,064 Year in university 0,183 0,194 0,466 0,495 Home residence: out-of-town 0,027 0,017 -0,032 -0,009 Local residence: university residence 0,106 0,127 0,369 0,433 Club/society member -0,108 -0,105 0,015 0,043 Hours of internet use per day 0,181 0,194 0,251 * 0,249 * Self-esteem 0,285 ** 0,353 -0,011 0,138 Satisfaction with university life -0,183 0,234 * 0,273 -0,183 Facebook (FB) intensity -0,543 -0,031 Twitter (TW) Intensity -0,410 -0,836 Self-esteem by FB intensity 0,649 Satisfaction by FB intensity -0,085 Self-esteem by TW intensity 0,543 Satisfaction by TW intensity 1,022 F= 3,3622,*** F= 3,2506, *** F= 2,2892, * F= 2,6124, ** NFB = 104; NTw = 69 Adjusted R2 = 0,20 Adjusted R2 = 0,19 Adjusted R2 = 0,17 Adjusted R2 = 0,21
Notes: *p < 0.05, **p < 0.01, ***p < 0.001. Only one interaction term was entered at a time in each regression.
In a similar approach to the bridging social capital model, two different interaction variables were introduced into the separate regression models for bonding social capital, resulting in four mod-els. For Facebook, Model 1 and Model 2 produced adjusted R2 values of 0.20 and 0.19 respective-ly. For Twitter, Model 3 and Model 4 produced adjusted R2 values of 0.17 and 0.21 respectively (see Table 11).
For Model 1, the only factor considered significant in predicting bonding social capital was ‘Self-esteem’ (p = 0.019). Both ‘Facebook (FB) intensity’ (p = 0.258) and ‘Self-esteem by FB intensi-ty’ (p = 0.347) were found not to be significant predictors of bonding social capital. The only fac-tor considered significant in predicting bonding social capital in Model 2 was ‘Satisfaction with university life’ (p = 0.029).
Petersen & Johnston
23
For Model 3 (Twitter), the only factor considered significant in predicting bonding social capital was ‘Hours of internet use per day’ (p = 0.048). Similar to the Facebook models, both ‘Twitter (TW) intensity’ (p = 0.705) and ‘Self-esteem by TW intensity’ (p = 0.634) were found not to be significant predictors of bonding social capital. The factor considered significant in predicting bonding social capital in Model 4 was also ‘Hours of internet use per day’ (p = 0.044).
Since most of the independent variables were considered insignificant in predicting perceived bonding social capital, Hypotheses 2a and 2b were rejected and the findings of Ellison et al., (2007) and Johnston et al. (2013) were not supported.
The regression model for bonding social capital measuring hypotheses 6a and 6b, yielded a standardised beta of 0.65 (p = 0.35) for self-esteem by Facebook intensity, and standardised beta of 0.54 (p = 0.63) for self-esteem by Twitter intensity. These interaction variables are non-significant and, therefore, hypotheses 6a and 6b were rejected. This implies that students re-porting low levels of Facebook and Twitter intensity along with low levels of self-esteem do not necessarily report lower levels of bonding social capital than students with higher Facebook and Twitter intensity. Thus the relationships between Facebook intensity and Twitter intensity with respect to bonding social capital do not vary by different levels of self-esteem. The results of Johnston et al.’s (2013) study were similar.
The regression model for bonding social capital, measuring hypotheses 7a and 7b, yielded a standardised beta of -0.08 (p = 0.92) for satisfaction with university life by Facebook intensity, and standardised beta of 1.02 (p = 0.11) for satisfaction with university life by Twitter intensity. These interaction variables are non-significant and, therefore, hypotheses 7a and 7b were re-jected.
Regression Model: Maintained Social Capital In order to test Hypotheses 3a and 3b, the extent to which control variables (demographics, gen-eral internet use and measures of psychological well-being) predicted the amount of maintained social capital were investigated. This initial regression model of control variables with respect to maintained social capital yielded an adjusted R2 value of 0.08.
In a similar approach to the bridging and bonding social capital models, two different interaction variables were introduced into the separate regression models for maintained social capital, re-sulting in four models. For Facebook, Model 1 and Model 2 produced adjusted R2 values of 0.11 and 0.12 respectively. For Twitter, Model 3 and Model 4 produced adjusted R2 values of 0.15 and 0.16 respectively (see Table 12).
For Model 1, the only factor considered significant in predicting maintained social capital was ‘Year in university’ (p = 0.033). The factors considered significant in predicting maintained so-cial capital in Model 2 included ‘Year in university’ (p = 0.0256) as most significant, ‘Satisfac-tion by Facebook intensity’ (p = 0.0259), ‘Local residence: university residence’ (p = 0.0336) and ‘Facebook intensity’ (p = 0.0367).
None of the factors were significant in predicting maintained social capital for Twitter in Model 3. The only factor that was a significant predictor of maintained social capital for Model 4 was ‘Self-esteem’ (p = 0.011).
Since most of the independent variables were considered insignificant in predicting perceived bonding social capital, Hypotheses 3a and 3b were rejected and the findings of Ellison et al., (2007) and Johnston et al. (2013) were not supported.
Impact of Facebook and Twitter Usage on Social Capital
24
Table 12: Regressions predicting the amount of maintained social capital
Model 1 Model 2 Model 3 Model 4
Independent variables Stand. Beta p Stand. Beta p Stand. Beta p Stand. Beta p Intercept 4,001 6,269 -0,528 0,735 Gender: Male 0,136 0,147 0,158 0,144 Ethnicity: white 0,009 0,021 0,056 0,042 Year in university 0,522 * 0,545 * 0,210 0,244 Home residence: out-of-town 0,027 0,016 0,089 0,109 Local residence: university residence 0,415 0,478 * 0,060 0,117 Club/society member -0,038 -0,058 0,045 0,079 Hours of internet use per day -0,070 -0,073 -0,076 -0,071 Self-esteem 0,169 -0,699 0,385 0,361 ** Satisfaction with university life -0,887 -0,040 0,135 -0,188 Facebook (FB) intensity -0,911 -1,572 * Twitter (TW) Intensity 0,334 -0,491 Self-esteem by FB intensity 1,469 Satisfaction by FB intensity 2,015 * Self-esteem by TW intensity -0,177 Satisfaction by TW intensity 0,716
F= 2,1600, *
F= 2,2968, *
F= 2,0608, *
F= 2,2178, *
NFB = 103; NTw = 69 Adjusted R2 = 0,11
Adjusted R2 = 0,12
Adjusted R2 = 0,15
Adjusted R2 = 0,16
Notes: *p < 0.05, **p < 0.01, ***p < 0.001. Only one interaction term was entered at a time in each regression.
This research cannot definitively state that there is a positive relationship between the various kinds of Facebook and Twitter usage and the creation and maintenance of social capital, because Facebook and Twitter intensity were not considered significant predictor variables of all three types of cognitive social capital.
‘Year in university’, ‘Local residence: university residence’, ‘Facebook (FB) intensity’ and ‘Sat-isfaction by FB intensity’ were significant variables for predicting maintained social capital using Facebook. This suggests that Facebook is used to maintain existing offline relationships, and is further supported by the results of Table 6, which shows higher means for the offline-online con-struct (3.04) that the online-to-offline construct (1.83).
For Twitter, ‘self-esteem’ was the only significant predictor of maintained social capital. This indicated that a rise in self-esteem increases individuals perceived maintained social capital. Indi-viduals with higher self-esteem are more likely to have an increased sense of perceived main-tained social capital.
Conclusion This research was a replication of a study done by Johnston et al. (2013) which focused on uni-versity students within the Western Cape. The study aimed to assess the impact of Facebook us-age as well as Twitter usage among university students of the Western Cape Province of South Africa and whether the intensity of Facebook and Twitter usage is useful to students in the crea-tion and maintenance of cognitive social capital.
Petersen & Johnston
25
This study aimed to fill a gap by focusing on the impact of the intensity of both Facebook and Twitter usage on the social capital of Western Cape university students. The research provided an analysis of demographic uses of Facebook and Twitter and attempted to answer the research questions.
The results of this study show that the intensity of both Facebook and Twitter usage does not play a significant role in the creation and maintenance of social capital within the context of Western Cape university students; this is in contradiction to other studies (Ellison et al., 2007; Johnston et al., 2013). This study included a low proportion of non-Facebook members, making the analysis of non-Facebook members inconclusive.
The research questions were answered and all of the research hypotheses were rejected. Future research could address the limitations highlighted by approaching Facebook and Twitter usage as well as social capital by making use of various methodologies. Additional research could follow a qualitative approach, and compare and contrast the results with the quantitative results.
A more direct method of capturing Facebook and Twitter usage, such as profile analysis, would enable researchers to compare the results of surveys with direct behavioural and demographic measures.
Acknowledgements This work is based on the research supported in part by the National Research Foundation of South Africa (Grant Number 91022).
References Adato, M., Carter, M. R., & May, J. (2006). Exploring poverty traps and social exclusion in South Africa
using qualitative and quantitative data. Journal of Development Studies, 42(2), 226–247.
Adler, P. S., & Kwon, S. (2002). Social capital: Prospects for a new concept. The Academy of Management Review, 27(1), 17–40.
Akpojivi, U. (2013). Attitudes towards information privacy amongst Black South African Generation Y students: A study of loyalty cards. Mediterranean Journal of Social Sciences, 4(3), 647–658. doi:10.5901/mjss.2013.v4n3p647
Atkinson, A., & Riani, M. (2000). Robust diagnostic regression analysis. New York: Springer Publishing Company.
Bargh, J. A., & Mckenna, K. Y. A. (2004). The Internet and social life. Annual Review of Psychology, 55(1), 573–590. doi:10.1146/annurev.psych.55.090902.141922
Boesak, A. (2009). Running with horses: Reflections of an accidental politician. Cape Town: Joho Publish-ers.
Bourdieu, P., & Wacquant, L. J. (1992). An invitation to reflexive sociology. Chicago: The University of Chicago Press.
Boyd, D. M., & Ellison, N. B. (2007). Social network sites: Definition, history, and scholarship. Journal of Computer-Mediated Communication, 13(1), 210–230. doi:10.1111/j.1083-6101.2007.00393.x
Brockman, C. J. (2013). A quantitative survey: Are Twitter advertisements effective for college students. (Doctoral dissertation). California Polytechnic State University, San Luis Obispo.
Burke, M., Kraut, R., & Marlow, C. (2011). Social capital on Facebook: Differentiating uses and users. In Proceedings of the SIGCHI Conference on Human Factors in Computing Systems (pp. 571-580). ACM.
Impact of Facebook and Twitter Usage on Social Capital
26
Burton, P., Wu, Y., & Prybutok, V. (2010). Social network position and its relationship to performance of IT professionals. Informing Science: The International Journal of an Emerging Transdiscipline, 13(1), 121-137. Retrieved from http://www.inform.nu/Articles/Vol13/ISJv13p121-137Burton554.pdf
Carter, M. R., & Maluccio, J. A. (2003). Social capital and coping with economic shocks: An analysis of stunting of South African children. World Development, 31(7), 1147–1163.
Carter, M. R., & May, J. (2001). One kind of freedom: Poverty dynamics in post-apartheid South Africa. World Development, 29(12), 1987–2006.
Cassidy, J. (2006). Me media: How hanging out on the Internet became big business. Retrieved from http://www.newyorker.com/magazine/2006/05/15/me-media
Chan, T. H. (2014). Facebook and its effects on users’ empathic social skills and life satisfaction: A double-edged sword effect. Cyberpsychology, Behavior and Social Networking, 17(5), 276-280. doi:10.1089/cyber.2013.0466
Chatterjee, S., & Hadi, A., (2013). Regression analysis by example. New York: John Wiley & Sons.
Cohen, E. B. (2009). A philosophy of informing science. Informing Science: the International Journal of an Emerging Transdiscipline, 12, 1-15. Retrieved from http://www.inform.nu/Articles/Vol12/ISJv12p001-015Cohen399.pdf
Coleman, J. S. (1989). Social capital in the creation of human capital. American Journal of Sociology, 94(6), S95 – S120.
Cummings, J., Lee, J., & Kraut, R. (2006). Communication technology and friendship during the transition from high school to college. In R. E. Kraut, M. Brynin, & S. Kiesler (Eds.). Computers, phones, and the internet: Domesticating information technology (pp.265–278). New York: Oxford University Press.
Donath, J., & Boyd, D. (2004). Public displays of connection. BT Technology Journal, 22(4), 71–82.
Ellison, N. B., Steinfield, C., & Lampe, C. (2007). The benefits of facebook “friends:” Social capital and college students’ use of online social network sites. Journal of Computer-Mediated Communication, 12(4), 1143–1168. doi:10.1111/j.1083-6101.2007.00367.x
Forsman, A. K., Nyqvist, F., Schierenbeck, I., Gustafson, Y., & Wahlbeck, K. (2012). Structural and cogni-tive social capital and depression among older adults in two Nordic regions. Aging & Mental Health, 16(6), 771–779. doi:10.1080/13607863.2012.667784
Fukuyama, F. (2001). Social capital, civil society and development. Third World Quarterly, 22(1), 7–20.
Giannakos, M. N., Chorianopoulos, K., Giotopoulos, K., & Vlamos, P. (2013). Using Facebook out of hab-it. Behaviour & Information Technology, 32(6), 594-602.
Gill, T. G. (2012). Informing on a rugged landscape: Homophily versus expertise. Informing Science: The International Journal of an Emerging Transdiscipline, 15, 49-91. Retrieved from http://www.inform.nu/Articles/Vol15/ISJv15p049-091Gill616.pdf
Gill, T. G. (2013). Culture, complexity, and informing: How shared beliefs can enhance our search for fit-ness. Informing Science: the International Journal of an Emerging Transdiscipline, 16, 71-98. Re-trieved from http://www.inform.nu/Articles/Vol16/ISJv16p071-098GillFT87.pdf
Gjoka, M., Kurant, M., Butts, C. T., & Markopoulou, A. (2010). Walking in Facebook: A case study of unbiased sampling of OSNs. INFOCOM, 2010 Proceedings IEEE (pp. 1-9).IEEE.
Graeff, P., & Svendsen, G. T. (2013). Trust and corruption: The influence of positive and negative social capital on the economic development in the European Union. Quality & Quantity, 47(5), 2829–2846.
Granovetter, M. S. (1983). The strength of weak ties: A network theory revisited. Sociological Theory, 1(1), 201–233.
Granovetter, M. S. (2001). The strength of weak ties. American Journal of Sociology, 78(6), 1360–1380.
Gross, R., & Acquisti, A. (2005). Information revelation and privacy in online social networks. In Proceed-ings of the 2005 ACM workshop on Privacy in the electronic society (pp. 71–80). ACM.
Hall, M. (2007). Poverty, inequality and the university. Michigan: Institute for the Humanities, University of Michigan.
Hall, M. (2012). Inequality and higher education : Marketplace or social justice . London: Leadership Foundation for Higher Education.
Helliwell, J. F., & Putnam, R. D. (2004). The social context of well-being. Philosophical Transactions of the Royal Society, 22(3), 1435–1446.
HEMIS. (2013). Higher education management information system report. Cape Town: National Depart-ment of Education.
Hewitt, A., & Forte, A. (2006). Crossing boundaries: Identity management and student / faculty relation-ships on the Facebook. Retrieved from http://www.andreaforte.net/HewittForteCSCWPoster2006.pdf
Ishler, J. L. C. (2004). Tracing “friendsickness” during the first year of college through journal writing: A qualitative study. NASPA Journal, 41(3), 518–537.
Islam, M. K., Merlo, J., Kawachi, I., Lindström, M., & Gerdtham, U. G. (2006). Social capital and health: does egalitarianism matter? International Journal for Equity in Health, 5(3), 1–8.
Johnston, K., Tanner, M., Lalla, N., & Kawalski, D. (2013). Social capital: The benefit of Facebook “friends.” Behaviour & Information Technology, 32(1), 24–36. doi:10.1080/0144929X.2010.550063
Junco, R. (2012). The relationship between frequency of Facebook use, participation in Facebook activities, and student engagement. Computers & Education, 58(1), 162–171.
Junco, R., Heiberger, G., & Loken, E. (2011). The effect of Twitter on college student engagement and grades. Journal of Computer Assisted Learning, 27(2), 119–132.
Klugman, J. (2013). Human development report 2013: The real wealth of nations: Pathways to human de-velopement. Chicago: Palgrave Macmillan.
Kwak, H., Lee, C., Park, H., & Moon, S. (2010). What is Twitter, a Social Network or a News Media. In Proceedings of the 19th International Conference on World Wide Web (pp. 591–600).ACM.
Kwak, K. T., Choi, S. K., & Lee, B. G. (2014). SNS flow, SNS self-disclosure and post hoc interpersonal relations change: Focused on Korean Facebook user. Computers in Human Behavior, 31(1), 294–304. doi:10.1016/j.chb.2013.10.046
Kwon, M-W., D’Angelo, J., & McLeod, D.M. (2013). Facebook use and social capital: To bond, to bridge, or to escape. Bulletin of Science, Technology & Society, 33(1-2) 35–43.
Larsson, A. O., & Moe, H. (2012). Studying political microblogging: Twitter users in the 2010 Swedish election campaign. New Media & Society, 14(5), 729–747.
Lau, Y. K., Cassidy, T., Hacking, D., Brittain, K., Haricharan, H. J., & Heap, M. (2014). Antenatal health promotion via short message service at a midwife obstetrics unit in South Africa: A mixed methods study. BMC Pregnancy and Childbirth, 14(1), 284.
Lin, K.-Y., & Lu, H.-P. (2011). Intention to continue using Facebook fan pages from the perspective of social capital theory. Cyberpsychology, Behavior, and Social Networking, 14(10), 565–570. doi:10.1089/cyber.2010.0472
Ljepava, N., Orr, R., Locke, S., & Ross, C. (2013). Personality and social characteristics of Facebook non-users and frequent users. Computers in Human Behavior, 29(4), 1602–1607. doi:10.1016/j.chb.2013.01.026
Mazer, J. P., Murphy, R. E., & Simonds, C. J. (2007). I’ll see you on “Facebook”: The effects of computer-mediated teacher self-disclosure on student motivation, affective learning, and classroom climate. Communication Education, 56(1), 1–17. doi:10.1080/03634520601009710
Impact of Facebook and Twitter Usage on Social Capital
28
McKenzie, K., Whitley, R., & Weich, S. (2002). Social capital and the mental health. British Journal of Psychiatry, 181(4), 280–283.
McEwan, B. (2011). Hybrid engagement: How Facebook helps and hinders students’ social integration. Cutting-Edge Technologies in Higher Education, 2(1), 3–23.
Molina-Morales, F. X., & Teresa, M. (2010). Social networks: effects of social capital on firm innovation. Journal of Small Business Management, 48(2), 258–279.
Morrow, V. (2001). Young people’s explanations and experiences of social exclusion: Retrieving Bour-dieu’s concept of social capital. International Journal of Sociology and Social Policy, 21(6), 37–63.
Nyqvist, F., Forsman, A. K., Giuntoli, G., & Cattan, M. (2013). Social capital as a resource for mental well-being in older people: A systematic review. Aging & Mental Health, 17(4), 394–410.
Nzimande, B. (2013). Department of Higher Education and Training Annual Report 2012/13 (pp. 14 – 298). Retrieved from www.dhet.gov.za/LinkClick.aspx?fileticket=PAOOTxJCFK0=&tabid=1131
Paul, E. L., & Brier, S. (2001). Friendsickness in the transition to college: Precollege predictors and college adjustment correlates. Journal of Counseling & Development, 79(1), 77–89.
Pavot, W., & Diener, E. (1993). Review of the satisfaction with life scale. Psychological Assessment, 5(2), 164–172.
Pepper, M. B., Leithauser, A., Loroz, P. S., & Steverson, B. (2012). Responding to hate speech on social media: A class leads a student movement. International Journal of Cyber Ethics in Education (IJCEE), 2(4), 45–54.
Pfeil, U., Arjan, R., & Zaphiris, P. (2009). Age differences in online social networking–A study of user profiles and the social capital divide among teenagers and older users in MySpace. Computers in Hu-man Behavior, 25(3), 643–654.
Portes, A. (1998). Social capital: Its origins and applications in modern sociology. Annual Review of Soci-ology, 22(1), 1–24.
Portes, A., & Vickstrom, E. (2011). Diversity, social capital, and cohesion. Annual Review of Sociology, 37(1), 461–479.
Powell, J. (2009). 33 million people in the room: How to create, influence, and run a successful business with social networking. New Jersey: Que Publishing.
Putnam, R. (2000). Bowling alone. New York: Simon & Schuster.
Raacke, J., & Bonds-Raacke, J. (2008). MySpace and Facebook: Applying the uses and gratifications theo-ry to exploring friend-networking sites. Cyberpsychology & Behavior, 11(2), 169–174.
Ramphele, M. (2008). Laying ghosts to rest: Dilemmas of the transformation in South Africa. Cape Town: Tafelberg.
Recuero, R., Araujo, R., & Zago, G. (2011). How does social capital affect retweets ? In Weblogs and So-cial Media, 2011 AAAI Fifth International Conference on (pp. 305–312).AAAI.
Rosenberg, M. (1965). Society and the adolescent self-image. Princeton: Princeton University Press.
Rost, K. (2011). The strength of strong ties in the creation of innovation. Research Policy, 40(4), 588–604. doi:10.1016/j.respol.2010.12.001
Saunders, M., Lewis, P., & Thornhill, A. (2012). Research methods for business students (6th edition). Pearson Education, India.
Seago, J. H., & Vallado, D. A. (2010). Goodness-of-fit tests for sequential orbit determination. Paper AAS 10–149.
Statistic Brain. (2013a). Social networking statistics. Retrieved April 29, 2014, from www.statisticbrain.com/social-networking-statistics/
Statistic Brain. (2013b). Twitter statistics. Retrieved from www.statisticbrain.com/twitter-statistics/
Statistics South Africa. (2013). Mid-year population estimates (pp. 4–16). Retrieved from http://beta2.statssa.gov.za/publications/P0302/P03022013.pdf
Steinfield, C., Ellison, N. B., Lampe, C., & Vitak, J. (2012). Online social network sites and the concept of social capital. Frontiers in New Media Research, 15, 115.
Stevens, S. B., & Morris, T. L. (2007). College dating and social anxiety: Using the internet as a means of connecting to others. CyberPsychology & Behavior, 10(5), 680–688.
Stutzman, F. (2006). An evaluation of identity-sharing behavior in social network communities. Journal of the International Digital Media and Arts Association, 3(1), 10–18.
Tavakol, M., & Dennick, R. (2011). Making sense of Cronbach’s alpha. Internal Journal of Medical Edu-cation, 2(15), 53–55. doi:10.5116/ijme.4dfb.8dfb
Terrana, D., & Pilato, G. (2013). Detection, clustering and tracking of life cycle events on Twitter using electric fields analogy. In Semantic Computing (ICSC), 2013 IEEE Seventh International Conference on (pp. 220–227).IEEE
Thinyane, H. (2010). Are digital natives a world-wide phenomenon? An investigation into South African first year students’ use and experience with technology. Computers and Education, 55(1), 406–414. doi:10.1016/j.compedu.2010.02.005
Ting, I-H., Wang, S-L., Chi, H-M., & Wu, J-S. (2013) Content matters : A study of hate groups detection based on social networks analysis and web mining. Conference on Advances in Social Networks Anal-ysis and Mining (ASONAM), 2013 IEEE/ACM International Conference, 1196–1201.
Valenzuela, S., Park, N., & Kee, K. F. (2009). Is there social capital in a social network site: Facebook use and college students’ life satisfaction, trust, and participation. Journal of Computer-Mediated Commu-nication, 14(4), 875–901. doi:10.1111/j.1083-6101.2009.01474.x
Van der Merwe, D. (2013). The place and role of higher education in an evolving South African democra-cy. In Contemporary India and South Africa: Legacies, Identities, Dilemmas. Retrieved from www.books.google.co.za
Vishwanath, A. (2014). Diffusion of deception in social media: Social contagion effects and its anteced-ents. Information Systems Frontiers, 1-15.
Vitak, J., Ellison, N. B., & Steinfield, C. (2011). The ties that bond: Re-examining the relationship between Facebook use and bonding social capital. In System Sciences (HICSS), 2011 44th Hawaii International Conference on (pp. 1-10). IEEE.
Waddock, S. (2007). Leadership integrity in a fractured knowledge world. Academy of Management Learn-ing & Education, 6(4), 543–557.
Weaver, A. C., & Morrison, B. B. (2008). Social networking. Computer, 41(2), 97–100.
Wellman, B., Haase, A. Q., Witte, J., & Hampton, K. (2001). Does the Internet increase, decrease, or sup-plement social capital? Social networks, participation, and community commitment. American Behav-ioral Scientist, 45(3), 436-521.
Westwood, J. (2014). Social work and social media: An introduction to applying social work principles to social media. Social Work Education, 33(4), 551–553. doi:10.1080/02615479.2014.884325
Williams, D. (2006). On and off the net: Scales for social capital in an online era. Journal of Computer-Mediated Communication, 11(2), 593–628.
World Bank. (2013). GINI index. Retrieved from http://data.worldbank.org/indicator/SI.POV.GINI?page=1
Impact of Facebook and Twitter Usage on Social Capital
30
Biographies Chad Petersen completed his post graduate degree in the Department of Information Systems at the University of Cape Town in 2014. Chad currently works at Effcomm, a technology firm based in Cape Town, South Africa.
Kevin Johnston is an Associate Professor and head of the Department of Information Systems at the University of Cape Town. He worked for 24 years for companies such as De Beers, Liberty Life, Legal & General and BoE. Kevin’s main areas of research are ICT Strategic Management, IS educational issues, IS-related social issues and Open Source Software.