Date post: | 14-Mar-2018 |
Category: |
Documents |
Upload: | nguyennhan |
View: | 214 times |
Download: | 1 times |
ORIGINAL ARTICLE
The Impact of Supply Chain Management Practices in TotalQuality Management Practices and Flexible System PracticesContext: An Empirical Study in Oil and Gas Industry
Fauzia Siddiqui • Abid Haleem • Chitra Sharma
Received: 2 August 2011 / Accepted: 1 February 2012 / Published online: 17 May 2012
� Global Institute of Flexible Systems Management 2012
Abstract A supply chain management (SCM) is an
ongoing process and needs continuous efforts to get the
desired results. SCM practices has become a potentially
valuable way of securing total quality management (TQM)
practices and flexible system (FS) practices since compe-
tition is no longer between organizations, but among sup-
ply chains. Poor SCM erodes profitability, delays projects,
and limits production. This research conceptualizes and
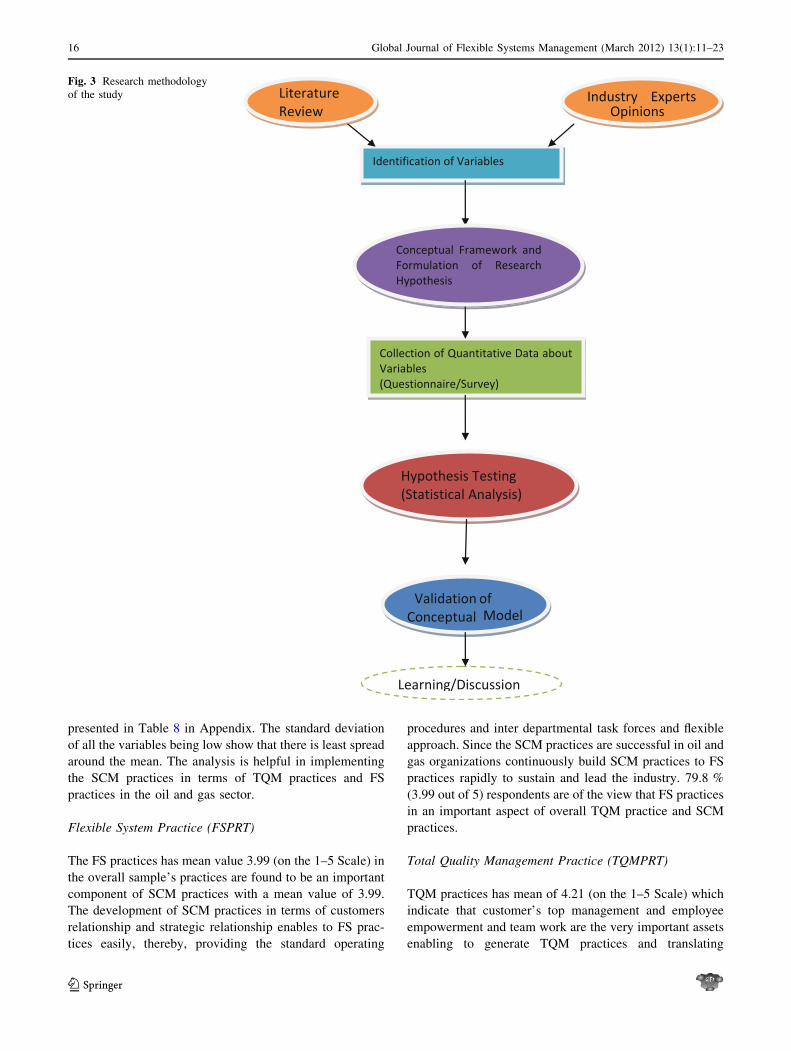
develops two dimensions of SCM practices (strategic
relationship and customer’s relationship) and tests the
relationship of SCM practice in terms of SCM program,
TQM practices, and FS practices. Structured questionnaire
has been developed on the basis of extensive literature
survey. Data for the study were collected from major
players of oil and gas industries and the relationships
proposed in the framework were tested using SPSS-16
software. The hypotheses testing for selected variables
have been done by using stepwise regression analysis.
Further correlation was done among the selected vari-
ables, reveals that SCM practices is positively correlated
with TQM Practices and FS Practices. TQM practice and
FS practices are vital and play crucial role in SCM
practice. The validated model so developed shows the
relationship among the selected variables. SCM program
has been observed to be directly linked with FS practices
and not by any other variable. This observation has
emerged from the statistical analysis of the data collected
from questionnaire based survey. India today remains one
of the least explored regions with well density per thousand
sq. kms. Being among the lowest, it is also evident that vast
amount of capital investments are necessary if exploration
efforts are to be substantially augmented. Therefore, there
is need of FS practices and SCM practices to attract both
the national oil companies, as well as, private sector oil
companies to invest in this critical area.
Keywords Customer relationship �Flexible system practices � Indian oil and gas industry �Supply chain management practices � Flexibility �Strategic management � Total quality management
Introduction
Supply chain management (SCM) can be defined as the
configuration, coordination and continuous improvement of
an organized set of operations. Its goal is to provide max-
imum customer service at the lowest cost possible, where a
customer is anyone who uses the output of a Process. Since
the goal of a company is to maximize profits, it must weigh
the benefits versus the costs of its decisions along the supply
chain. Very few industries can benefit more from maxi-
mizing supply chain efficiencies than the oil and gas com-
panies (Chima and Hills 2007). The understanding and
practicing of SCM has become an essential prerequisite for
staying in the global race as well market for enhancing
profitability (Moberg et al. 2002). The concept of SCM has
F. Siddiqui (&)
Department of Manufacturing Technology, JSS Academy
of Technical Education, Noida 201301, U.P., India
e-mail: [email protected]
A. Haleem
Department of Mechanical Engineering, Faculty of Engineering
and Technology, Jamia Millia Islamia, New Delhi 110 025, India
e-mail: [email protected]
C. Sharma
Department of Mechanical and Automation Engineering,
IGIT, GGSIPU, New Delhi 110 025, India
e-mail: [email protected]
123
Global Journal of Flexible Systems Management (March 2012) 13(1):11–23
DOI 10.1007/s40171-012-0002-9
been considered from different points of view as described
in the literature (Croom et al. 2000), such as purchasing and
supply management, logistics and transportation, operation
management, marketing, organizational theory, and man-
agement information systems.
The purpose of this work is to empirically develop and test
a framework by identifying the relationships among total
quality management (TQM) practices, flexible system (FS)
practices and SCM program and their impact on SCM
practices in oil and gas industry. The oil and gas sector is one
of the six core industries in India that has significant forward
linkages with the entire economy. India has been growing
annually and is committed to maintain the growth momen-
tum in the years to come. This would translate into India’s
energy needs growing many times in the years to come
(KPMG Report-2009). Hence, there is an emphasized need
for wider and more intensive exploration for new finding,
more efficient and effective recovery, a more rational and
optimally balanced global price regime—as against the
rather wide upward fluctuations of recent times, and a spirit
of equitable common benefit in global energy cooperation.
The framework developed has been tested empirically,
using data collected from 309 respondents to a survey
questionnaire in oil and gas industry. SPPS-16 is used to test
the hypothesized relationships. In the study three variables
define TQM Practices (top management, employee empow-
erment and team work). The FS Practices in terms of inter-
departmental task forces, standard operating procedures and
flexible approach towards process, routing, volume, product
and expansion has been considered. In SCM Program the
variables in terms of effective customer’s relations, co-
management activities and building trust, the variables are
selected by implementing the factor analysis.
The remainder of this paper is organized as follows:
second section gives a brief review of the Indian oil and gas
industry, the figure of energy basket and gross turn over in
industry for 2009 is also provided. Thew third section
presents a literature review underlying each dimension of
SCM practices; discuss the concepts of FS practices and
TQM practices. In fourth, fifth, sixth and seventh major
sections problem definition, research methodology, design
of questionnaire and data analysis are discussed. In later
sections correlation, stepwise regression analysis along
with discussion of hypothesis is then presented followed by
the implication of the study.
Oil and Gas Sector in India: An Overview
The oil and gas sector in India presents a significant oppor-
tunity for investors and is expected to demonstrate robust
growth with the Indian economy (Hussain et al. 2006). The
new exploration licensing policy (NELP), conceived to
address the increasing demand supply gap of energy in India,
has proved to be successful in attracting the interest of both
domestic and foreign players. Companies therefore have
recognized that improved supply chain efficiencies represent
a huge area for cost savings, specifically in the logistics area;
they are estimated to be an average between 10 and 20 per-
cent of revenues (Hamilton 2003). Also, companies believe
that the supply chain in which they participate as customers
and suppliers is what creates competition rather than indi-
vidual companies (Whitfield 2004; Lang 2004; Morton
2003; Collins 1999; Coia 1999).
India is the fifth largest energy consumer in the world
with primary commercial energy consumption in 2004 of
375.8 million metric tonnes of equivalent (MMTOE)
(Source: KMPG-statistical survey 2009). In 2004, the
consumption of oil and gas formed a major percentage in
the world energy consumption basket. In India, however,
coal dominated the consumption basket. The national oil
companies (NOCs), Oil and Natural Gas Corporation Ltd.
(ONGC) and Oil India Ltd. OIL dominate upstream seg-
ment with 80 % contribution of oil and natural gas pro-
duction of India. The present energy basket of India looks
somewhat like this and is presented in Fig. 1.
GAIL (India) Limited, is India’s flagship natural gas
company, integrating all aspects of the natural gas value
chain (including exploration & production, processing,
transmission, distribution and marketing) and its related
services. GAIL has a market share of 78 % of the gas
transmission business and 70 % of the gas marketing busi-
ness in India. India now ranks amongst the most preferred
destinations for many of the major oil and gas players. The
prominent oil and gas players in the Indian Market in terms of
their turnover are: ONGC, IOCL, BPCL, HPCL, GAIL, OIL,
RIL, MRPL, GSPC, Essar, Cairn Energy etc.
Figure 2 shows the TQM practice and FS practice are
vital and important for SCM practices in effective and
efficient manner. In this paper efforts have been made to
find the exact relationship between TQM practice, SCM
and FS practice in terms of SCM practice in the Indian oil
and gas sector. It examines six research hypotheses and for
Fig. 1 Present Energy basket of India.
Source: (British Gas-Report, 2009)
12 Global Journal of Flexible Systems Management (March 2012) 13(1):11–23
123
the purpose of investigating these issues. The consequences
section deals with the literature review for assessing SCM
practices was developed.
Literature Review
A literature review has been done to identify the key
research issues of SCM practices, TQM practices, and their
role in FS practices. The research paper and articles were
reviewed in the areas of Customer’s relationship, strategic
relationship, top management, team work, effective cus-
tomer’s relation, standard operating procedure and inter-
departmental tasks, employee empowerment, building trust
and marketing. A brief review of SCM program, TQM
practice FS practices, SCM Practices and its impact on oil
and gas industry has also been covered.
Supply Chain Management Practices
The challenge for firms today is not just to take up a SCM
initiative but also to implement it successfully as the future
shall see a competition among supply chains. (Ellaram and
Cooper 1990) defined that SCM is an integrative philoso-
phy to manage the total flow of distribution channel from
supplier to ultimate user. (Mohanty and Deshmukh 2005)
stated that SCM is a loop that starts with customers and
ends with customer; through the loop flow all materials,
finished goods, information, and transaction’s. Today’s
businesses have become extremely complex. SCM has
received ever-growing interest both in the literature as well
as from industrial practice (Oliver & Weber 1992).
Customers are demanding more variety, better quality and
service, including both reliability and faster delivery.
Technological developments are occurring at a faster pace,
resulting in new product innovations and improvement in
manufacturing processes (Tarofder and Ashiquzzaman
2008). The latest evolution of SCM practices, which includes
supplier partnership, outsourcing, continuous flow, and
information technology sharing (Donlon 1996). SCM prac-
tices represent use of purchasing, quality, and customer
relations (Tan et al. 1998). The concept of SCM practices
include agreed vision and goal, information sharing, coop-
eration, long term relationship and agreed supply chain
leadership (Min and Mentzer 2004), The three main strategic
imperatives that emerged in this century are low cost, high
quality and improved responsiveness (both delivery time and
flexibility of product delivery) (Aquilano et al. 1995).
Flexible System Practices
Flexibility in supply chain execution means that the appli-
cations must change and adapt as quickly as businesses
around them (Gupta and Nehra 2002). With this increased
flexibility, manufacturing systems are able to accommodate
different routing and have the choice to choose the best, are
suggested (Fawzan 2005). Four flexible conditions are
associated with the manufacturing of a part, namely
sequencing flexibility, machine flexibility, routing flexibil-
ity, and processing flexibility (Sethi and Sethi 1990).
Sequencing flexibility refers to the possibility of altering the
sequence of manufacturing operations for a given part, tak-
ing into account the restrictions of the design specification.
There are machine flexibility, process flexibility, product
flexibility, routing flexibility, volume flexibility, expansion
flexibility, operation flexibility and production flexibility
(Ozmutlu and Harmonosky 2005) justify a flexible manu-
facturing systems relatively high investment, it is of utmost
important to make full use of the flexibilities that the FMS
offer is routing flexibility, which is the capability of pro-
cessing a part type using alternate routing through machines
(Ghosh and Gaimon 1992). Pankaj (1991) reflects the view
that the flexibility of a system is a function of the technology
as well as how well the system is managed with the global-
ization of manufacturing sector. Sushil (1997) carried a
survey that the main aim of Flexible Systems Management
is to facilitate the actor in liberation from ignorance by
understanding the dynamic interplay of forces. Mandelbaum
and Buzacott (1990) deemed flexibility as required in a
‘‘system or process so that it is able to respond change in the
system’s environment or a change in the decision maker’s
perception of reality’’. The changes in the environment could
be in the form of demand fluctuations, machine breakdowns
absenteeism of the skilled labour (Wadhwa and Rao 2002).
Total Quality Management Practices
Total quality management (TQM) is both a philosophy and
a set of principles that represents the foundation of a
continuously improving organization (Calingo 1995). It
involves everyone in the organization and extends to sup-
pliers as well as customers. In a TQM environment the
customer is the focal point and customer satisfaction is the
driving force (Stevenson 1993). TQM is a management
strategy aimed at embedding awareness of quality in all
Fig. 2 TQM practice & FS practices in terms of SCM practices.
(Fauzia and Haleem 2009)
Global Journal of Flexible Systems Management (March 2012) 13(1):11–23 13
123
organizational processes. Customer focus, process
improvement and total involvement are the three funda-
mental principles of TQM (Tenner and Toro 1992). At
organisation level, however (House1998) suggests that
empowerment could be achieved through employee selec-
tion and training programs designed to provide required
technical skills together with a culture that encourage self-
determination and collaboration instead of competition.
Schlesinger et al. (1991a, b) found that employee’s per-
ception of service quality positively relates to job satis-
faction, job commitment, and pride of workmanship.
Related finding reported by (Tornow and Wiley 1991) are
employee attitudes-measured by feelings about reward for
performance, work itself, management practices, satisfac-
tion with the company, work group climate, and a culture
for success are related to customer satisfaction.
After TQM has been in use, it’s very common for parts
to be redesigned so that critical measurements either cease
to exist, or become much wider. The last decade has wit-
nessed the increased acceptance and use of TQM in the
service sector (Milakovich 1995), with service quality
being an important factor for growth, survival and success
(Quinn and Humble 1993; Donaldson 1995; Rust et al.
1995). Hosein Fallah (1993) reviews quality system mod-
els, introduces AT&T’s Total Quality Approach (TQA),
and describes the TQA implementation strategy.
The Table 1 lists the factors of TQM practices and FS
practices which are considered as a part of micro variables
in the present study and these micro variables are supported
by the authors as to how these factors are important to
TQM practices and FS practices. Among these micro
variables the FS practices variables are highly affecting the
performance in terms of SCM practices in terms of cus-
tomer’s relationship and strategic relationship in oil and
gas industry. Among the above six factors role of flexible
approach and interdepartmental tasks are strongly related
to SCM practices.
Oil and Gas Scenario
Very few industries can benefit more from maximizing
supply chain efficiencies than the oil and gas companies
(Chima and Hills 2007). In this sector, there is a need to
ensure that each entity along the supply chain can respond
quickly to the exact needs of its customers. On the other
hand, one of its weaknesses is that each entity is likely to act
in its best interests to optimize its own profit. Oil SCM is
intrinsically associated with integrated planning. First, it is
concerned with functional integration of acquisition of raw
material (crude oil), manufacturing (refining), transporta-
tion, and warehousing activities (Shapiro 2006). The steadily
increasing global demand for oil and its derivatives such as
petrochemicals has enabled companies providing these
products to reach more customers and increase their market
share and profitability. This boom in global demand along
with the ease of international trade and the inflexibility
involved in the petroleum industry’s supply chain has made
its management more complex and more challenging (Coia
1999; Morton 2003). Despite the importance of SCM and its
growing complexity, the petroleum industry is still in the
development stage of efficiently managing their supply
chains. The oil and petrochemical industry’s insight into the
supply chain is still in its infancy (Schwartz 2000). However,
even with the inflexibility and complexity involved in the
industry’s supply chain, there is a lot of room for improve-
ment and cost reduction, specifically in its logistics area.
A large number of articles using surveys-based empiri-
cal methods have also been published in the area of FS,
Table 1 List of major factors constituting TQM practice and FS practice
Sub constructs Definition Literature
Employee
empowerment
Employee empowerment means turning ‘‘front line’’ loose and encouraging and
rewarding Employees to exercise initiative and imaginative
Zemke and Schaaf (1989)
Top Management Top Management in quality, to act on suggestions, to reach common goals and avoid
conflict, to work with internal and external customers
Taveira et al. (2003)
Teamwork Team work is defined as the extent to which the people work for a specific purpose is
used in the intended. For example in TQM training, successful team work occurs if
the trainee can apply the knowledge and skills learned in the formal training
sessions to working on the problem faced by the TQM team
Tesluk et al. (1995)
Standard operating
Procedures
Logically flexible production technologies are needed to support continuous
improvement as top management strategy is intended to produce continuous
improvement
McLaughlin and Clark (1994)
Interdepartmental tasks Interdepartmental task firm performance is contingent upon how well the technology
fits the organization of work and the firm’s HR systems
Ichniowski et al. (1996)
Flexible approach Flexible approach that consist of skill variety achieved through job rotation and job
autonomy is defined in terms of taking responsibility for quality and continuous
improvement
MacDuffie and Krafcik (1992)
14 Global Journal of Flexible Systems Management (March 2012) 13(1):11–23
123
TQM and SCM. The integration of these three factors was
shown in the review paper ‘‘role of SCM in context of
TQM in FS: A state of the art literature review’’ (Fauzia
and Haleem 2009).
Problem Definition
The aim of the present work is to understand and analyze
SCM strategy, TQM practices and FS approach and their
impact on SCM practices on oil and gas industry, in
national capital region. Following are the major research
objectives:
The scope of this study relates SCM, in terms of SCM
program and SCM practices of final product, to TQM
practice and FS practice in oil and gas industry. The study
is concentrated only on the above mentioned factors and
their relationships. The area covered in the study is only
national capital region (NCR).
Research Hypothesis Formulation
The questionnaire was developed on the basis of the model
which shows the integration between the three factors SCM,
TQM and FS systems (Fauzia and Haleem 2009), based on
these factors a pilot survey and the industry expert opinion
were taken to identify the critical factors on that basis we
formulate the following three sets of hypotheses to express
the relationship between the SCM practices, TQM practices,
SCM program and FS practices. In total, six hypotheses are
formulated for testing and validation of the model.
Predictors of Organization’s SCM Practices
A1: Organization’s SCM practices are affected by FS
Practices in oil and gas industry.
A2: Organization’s SCM practices are affected by TQM
practices in oil and gas industry.
A3: Organization’s SCM practices are affected by SCM
program in oil and gas industry.
Predictors of Organization’s TQM Practices
B1: Organization’s TQM practices are affected by FS
practices in oil and gas industry.
B2: Organization’s TQM practices are affected by SCM
program in oil and gas industry.
Predictors of Organization’s FS Practices
C1: Organization’s FS practices are affected by SCM
program in oil and gas industry.
Research Methodology
The study is carried out for testing the above hypothesis
requires a data on selected variables of FS practices, TQM
practices and SCM practices and SCM program in Indian oil
and gas industry. The method of study is collecting informa-
tion from primary source through a questionnaire. The qual-
itative data has been collected using interviewing and
observing techniques, and quantitative data has been collected
using questionnaire. statistical software for social sciences
(SPSS-16) software is used for mean, correlation and stepwise
regression analysis. The analysis shows that SCM practices
are highly correlated with FS practices although it is also
showing the correlation with TQM practices also but if we
compare the two variables then the effect of FS is more in
SCM practices as compared to TQM practices.
Following are the steps used in conducting the study.
Literature review and experts opinions have been com-
pleted. Identification of variables has been done. On the
bases of identified variables a conceptual model has been
developed and Research Hypothesis Formulated. Ques-
tionnaire was developed and data was collected from the
target audience. Data has been analyzed by the software
package for social science (SPSS-16). Regression, corre-
lation and various statistical analyses have been done to
validate the model. Conceptual model was validated on the
basis of data analysis Learning and discussion has been
done to summarize the study findings (Figs. 3, 4).
Design of the Questionnaire
The research objectives were translated into hypotheses,
which were then defined as relationships of guiding vari-
ables. The guiding variables were further divided into
micro variables and translated into specific questions or
statements. Rensis Likert has developed Likert type scale
where the respondents are asked to express their position
on a scale, which has two extremes. Here 5 point Likert
scale (1–5) is used starting from ‘‘very low to very high’’ as
two extremes of continua, which have been divided in five
intervals for measurement, respondents were to indicate the
level of their agreement and disagreement to these state-
ments. In addition, the approximations were used in terms
of numbers and/or percentages, obtained for measurement.
To convey the intent quickly, question description has been
kept short and precise.
Data Analysis
The univariate analysis for variables has been carried out
and the statistical description of data on mean values is
Global Journal of Flexible Systems Management (March 2012) 13(1):11–23 15
123
presented in Table 8 in Appendix. The standard deviation
of all the variables being low show that there is least spread
around the mean. The analysis is helpful in implementing
the SCM practices in terms of TQM practices and FS
practices in the oil and gas sector.
Flexible System Practice (FSPRT)
The FS practices has mean value 3.99 (on the 1–5 Scale) in
the overall sample’s practices are found to be an important
component of SCM practices with a mean value of 3.99.
The development of SCM practices in terms of customers
relationship and strategic relationship enables to FS prac-
tices easily, thereby, providing the standard operating
procedures and inter departmental task forces and flexible
approach. Since the SCM practices are successful in oil and
gas organizations continuously build SCM practices to FS
practices rapidly to sustain and lead the industry. 79.8 %
(3.99 out of 5) respondents are of the view that FS practices
in an important aspect of overall TQM practice and SCM
practices.
Total Quality Management Practice (TQMPRT)
TQM practices has mean of 4.21 (on the 1–5 Scale) which
indicate that customer’s top management and employee
empowerment and team work are the very important assets
enabling to generate TQM practices and translating
Fig. 3 Research methodology
of the study
16 Global Journal of Flexible Systems Management (March 2012) 13(1):11–23
123
innovative ideas into actions. SCM practices in terms of
customer’s relationship and strategic relationship allow an
organization to deliver superior performance to achieve
employee empowerment. It is evident from the mean value
that 84.2 % (4.21 out of 5) of the respondents feel positive
relationship between customer’s relationship and Strategic
relationship in terms of TQM Practices.
SCM Program (SCMPRG)
Enhancement of SCM program results in better SCM
practices of an organization. If an organization builds
effective customer’s relation and building trust in market-
ing leads to effective SCM practices in terms of customer
relationship and Strategic relationship, it ultimately adds
profit resulting in improved performance. The mean value
of SCM program is found to be 3.486 (on the 1–5 scale),
which tells us that 69.72 % of the responses are in favour
of the view that SCM Program are positively linked with
the SCM practices.
SCM Practice (SCMPRT)
The SCM practices have mean value of 3.561. It means
71.22 % (3.561 out of 5) respondents feel that SCM
practices is affected by the TQM practice, SCM program
and strongly affects the FS practices.
Among the different micro variables the study of mean
and standard deviations clearly signifies that how posi-
tively the FS practices are affecting the SCM practices in
the oil and gas sectors.
Correlation Among Variables
Correlation technique is used to measure the degree of
association between two sets of quantitative data and it also
help to understand strength of linear relationship between
the two quantitative variables. In the present study, corre-
lation analysis has been carried out on all four variables,
viz TQM practice, SCM program, FS practices and SCM
practices. After calculating the values of all four variables;
these are presented in Table 2. The results show the degree
of association among variables. Pearson correlation test is
used for the full sample of 309 responses.
It is found that SCM PRT has significant correlation
with TQM PRT (0.273**), FS PRT (0.595**) and SCM
PRG (0.455**) at 99 % of confidence level.
SCM Program has significant relationship with TQM
practice (0.455**) and FS practice (0.595**) at 99 % of
confidence level. It shows that the SCM program is
strongly dependent on the TQM practice and FS practice of
an organization but more towards FS practice (0.645**).
TQM practices leads to FS practices enhancement in terms
of interdepartmental task, standard operating procedures
and flexible approach towards volume, expansion and
product. The above data show that SCM practices
enhancement is significantly linked with TQM practices,
FS practices and SCM program at 99 % of confidence
level.
There is strong relationship exists between TQM prac-
tices and FS practices (0.556**) at 99 % level of
confidence.
Regression Analysis for Selected Variables
Step wise regression of multivariate technique has been
used to test the hypotheses is the step-wise regression
analysis. It presents the large amount of complex data in a
more simplified and meaningful form. The analysis enabled
to predict the variability in dependent variable based on its
covariance with all the independent variables. The purpose
of performing the stepwise regression analysis is to
examine the statistical significance of model showing
Fig. 4 Conceptual model (Fauzia and Haleem 2009)
Table 2 Correlation among selected variables
TQMPRT FSPRT SCMPRG SCMPRT
TQMPRT 1
FSPRT 0.556** 1
SCMPRG 0.498** 0.645** 1
SCMPRT 0.273** 0.595** 0.455** 1
** Correlation is significant at the 0.01 level (2-tailed)
* Correlation is significant at the 0.05 level (2-tailed)
Global Journal of Flexible Systems Management (March 2012) 13(1):11–23 17
123
relationships of variables presented in the Conceptual
Model (Fig. 5).
SCM Practice as Dependent Variable in TQM
Practices
The coefficient of determination (R2) indicates that 52 %
variation in SCM practices is explained by ‘TQM prac-
tices’. Beta Value which indicates regression coefficient
shows the degree of association between SCM practices
and TQM practices is 0.193 (b value). The ‘t’ statistics
(3.302) tests the significance of the slope, which is equiv-
alent to testing the significance of the correlation between
dependent and independent variable given in Table 4 in
Appendix.
The sum of the squared error is 19.737; it means that this
could be the amount of error if mean of the dependent
variable is predictor. But using FS practices as the pre-
dictor, this error is reduced by 38.0 %, which is the value
for adjusted R Square. The standard error of the estimate is
the square root of the residual mean square in ANOVA
given in Table 5 in Appendix. In this case, standard error is
equal to 0.771 and measures the spread of the residuals or
errors. The F-value 5.526 (square of t value) being small,
(5.526 with 1, 100 degree of freedom) shows that inde-
pendent variable helps to explain the less variation in the
dependent variable; here F value is statistically significant.
SCM Practice as Dependent Variable in FS Practice
The model summary, ANOVA, and coefficient summary,
in terms of SCM practices as dependent variable, are
shown in in Table 6 in Appendix, respectively. Two steps
have been taken to compute stepwise regression analysis
for SCM as dependent variable. The change in FS practices
due to standard operating procedures and flexible approach
in expansion,volume and routing can be explained by the
R2 (0.227). Higher will be the value of R2 better will be the
prediction. Standard coefficient b shows that the flexible
system practices (0.520) have more impact as compared to
TQM practice (0.269). The F-value (30.330) is statistically
significant where TQM practice and SCM practice are
independent variables.
SCM Practices as Dependent Variable
SCM practices are affected by TQM practices. 23.6 % (R2
value) variation in SCM practices is explained by TQM
practices. The degree of association (b value) with
dependent variable of flexible system practices is 0.556.
The independent variable reduces the sum of squared errors
by 22.8 %. The F-value 30.843 (with 1,100 degrees of
freedom) shows the highly significant relation of SCM
practice with ‘FS approach and explains the variation in
TQM practice.
The model summary, ANOVA, and coefficient summary,
in terms of SCM practices as dependent variable, are shown
in Tables 4, 5, 6, 7, 8 in Appendix, respectively (Fig. 6).
Discussion on Hypothesis Testing
The summary of the three regression models is shown in
the Table 3 below in terms of the independent variables
acting as predictors, cumulative R2 and the hypothesis
codes for the hypotheses accepted and the hypotheses
rejected. Though all the R2 values are significant indicating
a reasonable explanation of the respective dependent
Fig. 5 Validated model for
relationship of selected
variables
18 Global Journal of Flexible Systems Management (March 2012) 13(1):11–23
123
variables, the highest one is for SCM practices (0.520) in
FS practices. The variable comparatively less explained is
TQM practices with R2 value of 0.227 and for SCM pro-
gram the value of R2 is less 0.269 but higher than the TQM
practices.
Total six (6) hypotheses of association were formulated
at macro level; only four have been accepted as shown in
Table 3 above.
Two hypotheses have been rejected. The rejected
hypotheses are linked with TQM practices (A2, A3). The
SCM practices are in terms of customer’s relationship and
strategic relationship and TQM practices in terms of top
management, employee empowerment and team work. The
above results imply that SCM practices is not strongly
dependent on TQM practice and its factors. It is dependent
on FS practices which here are taken as interdepartmental
task forces, standard operating procedure and flexible
approach.
The results from this study show that SCM practices is
predominantly affected by the TQM practices and linked
with FS practices. According to Sutcliffe et al. (2000), the
literature distinguishes two types of research trends
regarding change and efficiency in organizations. The SCM
practices and its positive impact on the SCM program can
Fig. 6 Validated model for micro variable SCM practices as dependent variables
Table 3 Model summary table for variables analysis
Dependent
variable
Independent
variables
R2 Hypotheses
accepted
Hypotheses
rejected
SCM Practices TQM Practice 0.227 A1 A2, A3
FS practices 0.520 B1, B2 –
SCM Program 0.269 C1 –
Global Journal of Flexible Systems Management (March 2012) 13(1):11–23 19
123
be achieved by focusing more on the variables of TQM
practices and FS practices in oil and gas industry. The
study is only a modest attempt to bring out the significant
variables and factors affecting the SCM practices. More
efficient and cost effective supply chain practices in the
petroleum industry represent important factors for main-
taining continuous supplies of crude oil, the reduction of
lead times, and lowering of production and distribution
costs (Raed 2006). Due to the FS practices are involved in
the petroleum industry’s supply chain network, logistics
represent a great challenge. However, it is only one of
several challenging factors. Interdepartmental task forces,
standard operating procedures and flexible approach are
equally important. Despite the great challenges in the gas
and petroleum industry’s supply chain, opportunities for
improvements and cost savings do exist along the supply
chain. One major area for improvement and cost savings
lies in the logistics function. Companies in the petroleum
industry have become increasingly reliant on the services
of third-party logistics companies to manage their supply
chains. Companies in the petroleum industry took the
outsourcing idea a step further to collaborate with com-
petitors and found shared solutions to their supply chain
challenges.An example in the real world is present in the
Indian Gas Industry. GAIL the leading gas distribution and
marketing company has flexible gas sourcing options (in-
fraline 2009). In 2004 when the domestic gas supply option
was exhausted GAIL took the initiative and formed petr-
onet LNG (PLL) for importing regassified liquefied natural
gas (RLNG) from the Gulf region through ships or tankers.
The enablers in the SCM practice in the Indian Oil &
Gas Industry have been the new oil and gas discoveries in
India. Traditionally India has been a gas deficit company
but things are going to change. The Government of India
(GoI) is considering all options available to increase the
supply of natural gas in the country. India is heavily
dependent on imports to meet the rapidly growing demand
for petroleum products and change in SCM practices and
implementation of more SCM practices and FS practices
will increase the Current demand and supply projections
indicate that the level of self-sufficiency to about 30% over
the next few years. Substantial efforts are therefore, nec-
essary to boost the level of exploration activity in the
country, so that, new finds can be made and the level of
crude oil and gas production significantly increases in the
years to come.
Conclusion
TQM practice and FS practices are vital and play crucial
role in SCM practice. The validated model so developed
shows the relationships among the selected variables. A
relationship between SCM program, FS practices, TQM
practice and SCM practices has been observed (Fig. 5).
From this framework we have not observed any significant
direct relationship between SCM program and SCM prac-
tices and TQM practices. SCM program has been observed
to be directly linked with FS practices and not by any other
variable. This observation has emerged from the statistical
analysis of the data collected from questionnaire based
survey. The results shows that if the FS practices in terms
of interdepartmental tasks, standard operating procedures
and flexible approach towards product, volume, routing and
expansion positively relates to SCM practices in terms of
customers relationship and strategic relationship as the
final product in oil and gas industry.
Best-in-class SCM in oil and gas supply chains results in
steadier and more profitable capital expansion, which means
a higher return on assets (ROA). Steadier prices would
translate to higher operating profits and lower operating
costs. Perhaps most importantly, more stable investment in
new technology results in greater oilfield productivity.
Appendix
See Tables 4, 5, 6, 7, 8.
Table 4 Model summary/
ANOVA/coefficients for SCM
practice as dependent variable
in TQM practices
a Dependent variable:
SCMPRT
Model R R2 Adjusted R2 Std. Error of the estimate
1 0.227a 0.052 0.042 0.771
1
Regression 9.863 3 3.288 5.526 0.001a
Residual 18.874 304 0.595
Total 19.737 307
B Std. Error b Std. Error of the estimate
1
(Constant) 2.680 0.365 7.335 0.000
TQMPRT 0.216 0.068 0.193 3.203 0.002
20 Global Journal of Flexible Systems Management (March 2012) 13(1):11–23
123
Table 6 Coefficients for TQM
practice as dependent variable
in FS practices & SCM
practices
a Dependent variable:
TQMPRTb Predictors: (Constant),
FSPRTc Predictors: (Constant),
SCMPRG
Model Unstandardized coefficients Standardized coefficients t Sig.
B Std. Error Beta
1
(Constant) 3.641 0.380 9.583 0.000
FSPRT 0.020 0.061 0.021 0.333 0.740
Model Sum of squares df Mean square F Sig.
1
Regression 8.578 1 8.578 14.409 0.000b
Residual 18.159 306 0.595
Total 19.737 307
2
Regression 9.781 4 2.445 4.095 .003c
Residual 18.956 303 0.597
Total 19.737 307
Table 5 Model summary/
ANOVA/coefficients for SCM
as dependent variable in FS
practices
a Dependent variable:
SCMPRTb Predictors: (constant), FSPRT
Model R R2 Adjusted R2 Std. error of the estimate
1 0.085a 0.007 -0.003 0.789
Model Sum of squares df Mean square F value Sig.
1
Regression 1.372 3 0.457 0.734 0.532a
Residual 189.365 304 0.623
Total 190.737 307
Model Unstandardized coefficients Standardized coefficients t Sig.
B Std. Error b
1
(Constant) 3.641 0.380 9.583 0.000
FSPRT 0.082 0.067 0.075 1.218 0.224
Table 7 Coefficients for
SCMPRT as dependent variable
in FS practices and TQM
practices
s Dependent variable:
SCMPRT
Model Unstandardized coefficients Standardized coefficients t Sig.
B Std. Error Beta
1
(Constant) 3.055 0.260 11.728 0.000
TQMPRT 0.238 0.063 0.212 3.796 0.000
2
(Constant) 2.776 0.438 6.344 0.000
FSPRT 0.071 0.066 0.065 1.082 0.280
Global Journal of Flexible Systems Management (March 2012) 13(1):11–23 21
123
References
Aquilano, N. J., Chase, R. B., & Davis, M. M. (1995). Fundamentalsof operations management. Chicago, IL: Irwin.
Calingo Luis, Ma. R. (1995). The corporate guide to the Singapore
quality award. Singapore: EPB Publishers Pte Ltd. Vol. 22,
pp. 533–556.
Chan, H. K. (2004). Analysis of dynamic control strategies of an FMS
under different scenarios. Robotics & Computer-IntegratedManufacturing, 20(5), 423–437.
Chase, R. B., Aquilano, N. J., & Jacobs, R. (2000). operationsmanagement for competitive advantage. Boston, MA: Irwin/
McGraw-Hill.
Chima, C. M., & Hills, D. (2007). Supply-chain management issues
in the oil and gas industry. Journal of Business, 5(6), 27–36.
Coia, A. (1999). Integrating oil’s supply chain. Traffic World, 259, 2.
Collins, T. (1999). Striking it big together. Supply Management, 4, 18.
Croom, S., Romano, P., & Giannakis, M. (2000). Supply chain
management: An analytical framework for critical literature
review. European Journal of Purchasing and Supply Manage-ment, 6(1), 67–83.
Donaldson, B. (1995). Customer service as a competitive strategy.
Journal of Strategic Marketing, 3, 113–126.
Donlon, J. P. (1996). Maximizing value in the supplychain. ChiefExecutive, 117, 54–63.
Ellaram, L. M., & Cooper, M. C. (1990). Supply chain management
partnership, and the shipper third party relationship. TheInternational Journal of Logistics Management, 1(2), 1–10.
Fallah, H. (1993). Managing TQM in a large company. IEEE O-7803-
0917-0/93. Overview and assessment. Industrial Relations,25(3), 299–333.
Fauzia, S., Haleem, A., et al. (2009). Role of supply chain
management in context of total quality management in flexible
systems: A state-of the art literature review. Global Journal ofFlexible Systems Managements, 10(3), 1–14.
Fawzan, M. A. (2005). An algorithm for production planning in a
flexible production system. Computers & Industrial Engineer-ing, 48(4), 681–691.
Ghosh, S., & Gaimon. (1992). Routing flexibility & production
scheduling in a FMS. European Journal of Operation Research,60, 344–364.
Gupta, M. P., & Nehra, G. (2002). Analysis of flexibility and supply
chain management in select Indian Industries. Global Journal ofFlexible Systems Management, 3(2/3), 31–44.
Hamilton, S. (2003). Must chemical companies outsource logistics tosave money? Georgetown: GL&SCS.
House, R. J. (1998). Power and personality in complex organisations.
In L. L. Cummings & B. M. Staw (Eds.), Research inorganizational behavior,10 (pp. 305–357). Green, CT: JAI Press.
Hussain, et al. (2006). Supply chain management in the petroleum
industry: Challenges and oppurtinities. International Journal ofGlobal Logistics and Supply Chain Management, 1(2), 90–97.
Ichniowski, C., Kochan, T. A., Levine, D., Olson, C., & Strauss, G.
(1996). What works at work: Overview and assessment.
Industrial Relations, 35, 299–333.
Lang, C. (2004). Extreme makeover: SC edition chemical market
report, 266, 16, 21.
MacDuffie, J. P., & Krafcik, J. ( 1992). Integrating high technology
and human resources for high performance manufacturing. In T.
Kochan & M. Useem (Eds.), Transforming, organizations (pp.
209–226). New York: Oxford University Press.
Mandelbaum, M., & Buzacott, J. (1990). Flexibility and decision
making. European Journal of Operation Research, 44, 17–27.
McLaughlin, I., & Clark, J. (1994). Technological change at work(2nd ed.). Buckingham, UK: Open University Press.
Milakovich, M. E. (1995). Improving service quality-achieving highperformance in the public and private sector. Delray Beach, FL:
St. Lucie Press.
Min, S., & Mentzer, J. T. (2004). Developing and measuring supply
chain concepts. Journal of Business Logistics, 25(1), 63–99.
Moberg, C. R., Cutler, B. D., Gross, A., & Speh, T. W. (2002).
Identifying antecedents of information exchange within supply-
chains. International Journal of Physical Distribution andLogistics Management, 32(9), 755–770.
Mohanty, R. P., & Deshmukh, S. G. (2005). Supply chain manage-ment: Theories and practices. Delhi: Biztantra.
Monczka, R. M., & Morgan, J. (1997). What’s wrong with supply
chain management? Purchasing, 122(1), 69–72.
Morton, R. (2003). Good chemistry in the supply chain. LogisticsToday, 44, 10, 30.
Oliver, R. K., Webber, M. D. (1992). Supply-chain management:
Logistics catches up with strategy. In M. Christopher (Ed.),
Logistics- the strategic issues (pp. 63–75), London: Chapman &
Hall.
Ozmutlu, S., & Harmonosky, C. M. (2005). A real-time methodology
for minimizing mean flow time in FMSs with routing flexibility:
Threshold-based alternate routing. European Journal of Oper-ational Research, 166(2), 369–384.
Pankaj, et. al. (1991). Models for the evaluation of routing andmachine flexibility. Decision Craft Analytics, pp. 56–63.
Quinn, M., & Humble, (1993). Using service to gain a competitive
edge-the Prompt approach. Long Range Planning, 26, 419–445.
Raed, H. (2006). International journal of global logistics and supply
chain management. 1(2), 90–97.
Rust, R. T., Zahorik, A. J., & Keiningham, T. L. (1995). Return on
quality (ROQ): Making service quality financially accountable.
Journal of Marketing, 59, 58–70.
Schlesinger, L. A., & Heskett, L. (1991). Breaking the cycle of failure
in services. Sloan Management Review, 32(3), 17–28.
Schlesinger, L. A., & Zomitsky, J. (1991). Job Satisfaction, services
capability and customer satisfaction: An examination of linkages
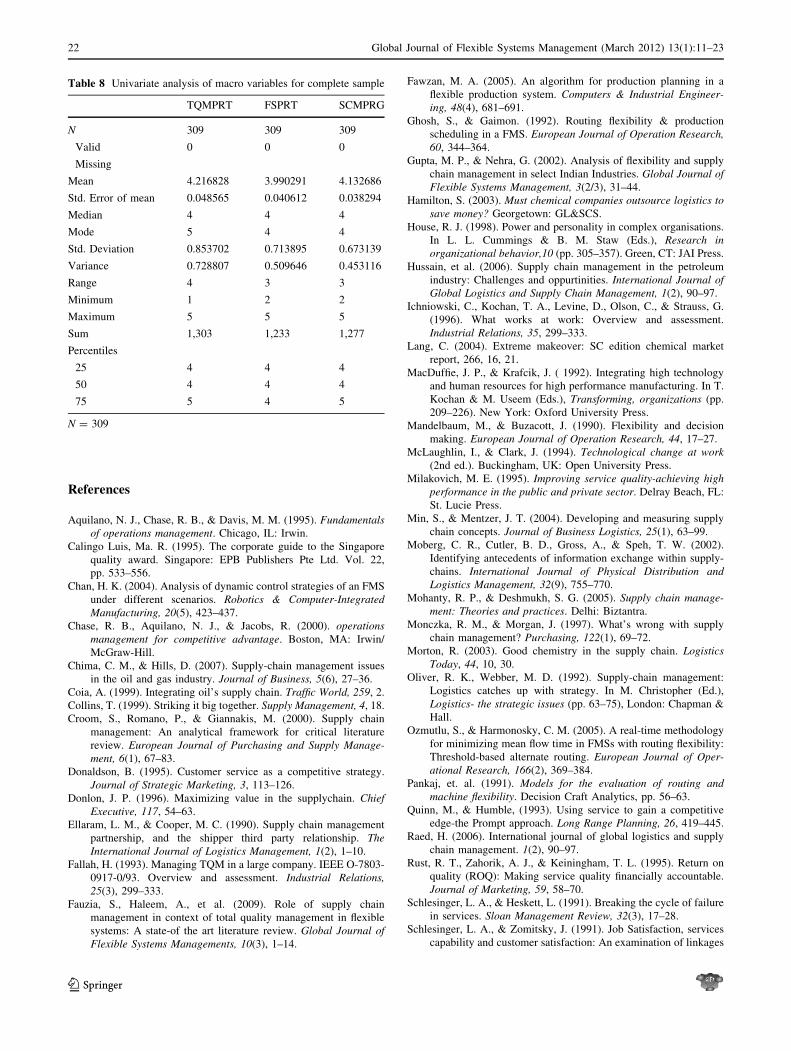
Table 8 Univariate analysis of macro variables for complete sample
TQMPRT FSPRT SCMPRG
N 309 309 309
Valid 0 0 0
Missing
Mean 4.216828 3.990291 4.132686
Std. Error of mean 0.048565 0.040612 0.038294
Median 4 4 4
Mode 5 4 4
Std. Deviation 0.853702 0.713895 0.673139
Variance 0.728807 0.509646 0.453116
Range 4 3 3
Minimum 1 2 2
Maximum 5 5 5
Sum 1,303 1,233 1,277
Percentiles
25 4 4 4
50 4 4 4
75 5 4 5
N = 309
22 Global Journal of Flexible Systems Management (March 2012) 13(1):11–23
123
and management implications. Human Resource Planning,14(2), 141–149.
Schwartz, B. (2000). The crude supply chain. Transportation &Distribution, 41, 8.
Sethi, A. K., & Sethi, S. P. (1990). Flexibility in manufacturing: A
survey. International Journal of Flexible Manufacturing Sys-tems, 2(4), 289–328.
Shapiro, J. F. (2006). Modeling the supply chain. Pacific Grove CA:
Duxbury Press.
Stevenson, W. J. (1993). Production/operations management. Home-
wood, IL: Irwin. Vol. 46, pp. 763–779.
Sushil, (1997). Flexible systems management: An evolving paradigm.
System Research and Behavioral Science, 14(4), 259–275.
Sutcliffe, K. M., Sitkin, S. B., & Browning, L. D. (2000). Tailoringprocess management to situational requirements: Beyond thecontrol and exploration dichotomy, the quality movement andorganization theory. Thousand Oaks: Sage publication.
Tan, K. C., Lyman, S. B., & Wisner, J. D. (1998). Supply chain
management: A strategic perspective. International Journal ofOperations and Production Management 002, 22(6), 614.
Tarofder, A. K., & Ashiquzzaman, (2008). Supply chain management
practices: Malaysian perspective. International Journal of Man-agement and Entrepreneurship, 4(2), 58–81.
Taveira, A. D., James, C. A., & Francois Sainfort, B. (2003). Quality
management and the work environment: an empirical investiga-
tion in a public sector organisation. Applied Ergonomics,34(2003), 281–291.
Tenner, A. R., & DeToro, I. J. (1992). Total quality management:Three steps to continuous improvent. Reading, MA: Addison-
Wesley.
Tesluk, P. E., Farr, J. L., Mathieu, J. E., & Vance, R. J. (1995).
Generalization of employee involvement training to the job
setting: Individual and situational effects. Personnel Psychology,48, 607–632.
Tornow, W. W., & Wiley, J. W. (1991). Service quality and
management practices: A look at employee attitudes, customer
satisfaction, and bottom-line consequences. Human ResourcesPlanning, 14(2), 105–115.
Wadhwa, S., & Rao K. S. (1999). Developing a novel view on
manufacturing flexibility.
Wadhwa, S., & Rao, K. S. (2000). Flexibility: An emerging meta-
competence for managing high technology. International Jour-nal of Technology Management, 19(7/8), 820–845.
Wadhwa, S., & Rao, K. S. (2002). Framework for a flexibility
maturity model. Global Journal of Flexible Systems Manage-ment, 3(2/3), 45–53.
Whitfield, M. (2004). A stronger link. European Chemical News, 81,
2116, R12.
Zemke, R., & Schaaf, D. (1989). The service edge: 101 companiesthat profit from customer care. New york, NY: American
Library.
Key Questions
What is the impact of SCM practices in terms of TQM and FS
practices in oil and gas industry?
What are the benefits of using SCM practices in oil and gas
industry?
What are the key factors affecting the SCM practices?
Author Biographies
Fauzia Siddiqui is a research scholar at USIT,
GGSIPU, Delhi pursuing PhD in the area of
Industrial and Production Engineering. She is
currently the Assistant Professor at the Department
of Manufacturing Technology, JSS Academy of
Technical Education, Noida U. P. India. She has
an experience of 9 years in the field of education.
Dr. Abid Haleem is Professor and Head of
Mechanical Engineering Department at Faculty of
Engineering and Technology, and is also Honorary
Director, IQAC, Jamia Millia Islamia (A Central
University by an Act of Parliament), New Delhi,
India. Dr. Haleem obtained his PhD from IIT
(Delhi) in the area of ‘Strategic Management’ and
completed his graduation and post graduation
degrees in ‘Mechanical Engineering’ and ‘Industrial Engineering’
respectively. Professor Haleem has more than hundred research
papers to his credit, published in international and national journals
like National Social Science Journal (USA), Production Planning and
Control, Journal of Architectural Engineering, International Journal
on Electronic Governance, Global Journal of Flexible Systems
Management,), Journal of Human Ergology, Industrial Engineering
Journal, IJMMR (Malaysia), International Review of Mechanical
Engineering (Italy), Indian Journal of Business and Economics, Pro-
ductivity, Pranjana etc. He has authored a book titled ‘‘Innovation,
Flexibility and Technology Transfer’’, published by Tata McGraw
Hill, India. He was on the Board of TCIL as an Independent Director
during 2008–2011.
Chitra Sharma is Associate Professor and Head
of the Mechanical and Automation Engineering,
Indira Gandhi Institute of Technology, GGSIP
University, Delhi. She had earned the PhD in
Industrial Engineering and Management from the
Indian Institute of Technology, Delhi, INDIA in
the year 1999. She has over 12 years’ experience
in the education sector. She has supervised PhD
work of students in diverse areas which include flexible manufac-
turing systems, total quality management, electronic discharge
machining, and metrology. Her research interests include application
of qualitative and quantitative techniques to evaluate and rank issues
related to technology forecasting planning and implementation at the
macro level.
Global Journal of Flexible Systems Management (March 2012) 13(1):11–23 23
123
Copyright of Global Journal of Flexible Systems Management is the property of Global Institute of Flexible
Systems Management and its content may not be copied or emailed to multiple sites or posted to a listserv
without the copyright holder's express written permission. However, users may print, download, or email
articles for individual use.