Forschungsinstitut zur Zukunft der Arbeit Institute for the Study of Labor DISCUSSION PAPER SERIES The Impact of Syrian Refugees on the Labor Market in Neighboring Countries: Empirical Evidence from Jordan IZA DP No. 9667 January 2016 Ali Fakih May Ibrahim
Transcript
Forschungsinstitut zur Zukunft der ArbeitInstitute for the Study of Labor
DI
SC
US
SI
ON
P
AP
ER
S
ER
IE
S
The Impact of Syrian Refugees on the Labor Market in Neighboring Countries:Empirical Evidence from Jordan
IZA DP No. 9667
January 2016
Ali FakihMay Ibrahim
The Impact of Syrian Refugees on the
Labor Market in Neighboring Countries: Empirical Evidence from Jordan
Any opinions expressed here are those of the author(s) and not those of IZA. Research published in this series may include views on policy, but the institute itself takes no institutional policy positions. The IZA research network is committed to the IZA Guiding Principles of Research Integrity. The Institute for the Study of Labor (IZA) in Bonn is a local and virtual international research center and a place of communication between science, politics and business. IZA is an independent nonprofit organization supported by Deutsche Post Foundation. The center is associated with the University of Bonn and offers a stimulating research environment through its international network, workshops and conferences, data service, project support, research visits and doctoral program. IZA engages in (i) original and internationally competitive research in all fields of labor economics, (ii) development of policy concepts, and (iii) dissemination of research results and concepts to the interested public. IZA Discussion Papers often represent preliminary work and are circulated to encourage discussion. Citation of such a paper should account for its provisional character. A revised version may be available directly from the author.
IZA Discussion Paper No. 9667 January 2016
ABSTRACT
The Impact of Syrian Refugees on the Labor Market in Neighboring Countries: Empirical Evidence from Jordan*
This paper analyzes time-sensitive data on a humanitarian crisis in the Middle East. It aims to assess the impact of the steep influx of Syrian refugees into Jordan on the country’s labor market since the onset of the conflict in Syria (March 2011). As of August 2014, nearly 3 million registered Syrians have sought refuge in neighboring countries (Lebanon, Jordan, Iraq, and Turkey), according to the United Nations High Commissioner for Refugees (UNHCR). Jordan and Lebanon are hosting the majority of them. This paper utilizes data regarding unemployment rates, employment rates, labor force participation, the number of refugees, and economic activity at the level of governorates. The Vector Autoregressive (VAR) methodology is used to examine time series data from the most affected governorates in Jordan. The empirical results of Granger causality tests and impulse response functions show that there is no relationship between the influx of Syrian refugees and the Jordanian labor market. Our results are verified through a set of robustness checks. JEL Classification: J61, H56, N45 Keywords: forced refugees, host country, labor market, VAR model Corresponding author: Ali Fakih Department of Economics, School of Business Lebanese American University P.O. Box 13-5053 Beirut Lebanon E-mail: [email protected]
* The authors wish to acknowledge the valuable comments of Eric Le Borgne (Lead Economist, The World Bank) and Wissam Harake (Economist, The World Bank).
1
1. Introduction
Over the past three years, the world has faced one of the largest exoduses in recent history in the
Syrian conflict that began in March 2011. One direct implication of this conflict is large-scale
population displacement. Indeed, approximately 3 million Syrians have fled their country in
search of a safe haven along the borders with the country’s immediate neighbors, namely,
Lebanon, Jordan, Turkey and Iraq.1 Such a humanitarian crisis has prompted governments in
these countries to receive and host refugees of different age groups, genders, religious affiliations
and income levels. Lebanon and Jordan, which are currently hosting the majority of those
refugees, have experienced substantial macroeconomic and social impacts as a result. Against
this backdrop, this paper contributes to the migration and economics literature by examining the
impact of refugee inflows on a neighboring country’s economy by investigating the case of
Syrian refugees in Jordan. We specifically study the effects of displacement on certain key labor
market variables, such as unemployment rates, employment rates, and labor force participation.
According to the United Nations High Commissioner for Refugees (UNHCR) (2014), the
number of Syrian refugees registered or awaiting registration in Jordan reached 604,868 in July
2014, representing approximately 10% of the Kingdom’s population and 26% of total Syrian
refugees in neighboring countries. The Jordanian government officially recognized the growing
refugee crisis in 2012, when increased fighting in Syria forced an average of 1,000 refugees to
cross the border each day. In response, the Zaatari refugee camp was set up in July 2012 in the
northern part of the country. In July 2013, the number of refugees in the Zaatari camp was
estimated to be 144,000, rendering it the second largest camp in the world and the fourth largest
city in Jordan, according to data from the UNHCR.2 UNHCR surveys (2013) indicate that not all
Syrian refugees reside in camps, as some are hosted by their relatives (mostly in cities close to
the Syrian border). Others rent apartments at low prices, whereas few have benefited from
donated housing. UNHCR data indicate that Amman has the largest population of urban refugees
(32% of the total), followed by Irbid (29%) and Zarqa (10%). Furthermore, data from home
visits undertaken by UNHCR and International Relief and Development (IRD) between 2011
1 According to Gomez et al. (2010), approximately 75% of the world’s refugees are displaced in neighboring
countries that share land or maritime borders. Moreover, the largest percentage of forced refugees in the world is
found in the Middle East and North Africa region. 2 It is noteworthy that a large number of Palestinians and Iraqis are also registered as refugees, making Jordan the
highest ranked country in the world in terms of refugees per capita (Olwan and Shiyab, 2012).
2
and 2013 indicate trends of high mobility among refugees, which renders it difficult to ensure
traceability.
Given the disruptive nature of population displacements, assessing the impact of the
influx of refugees into a certain country is imperative to understanding the changes, whether
negative or positive, that the country on the receiving end can face, be they social, economic,
demographic or political. The remainder of the paper is organized as follows. Section 2 describes
the contextual setting. Section 3 presents the literature survey. Section 4 describes the data and
the empirical methodology. Section 5 presents and discusses the empirical results. The final
section presents brief concluding remarks.
2. Contextual Setting
This section provides an economic background on Jordan for the period 2011-2013 and describes
the legal framework governing Syrian refugees in Jordan.
2.1. Economic Background (2011-2013)
Jordan is a small open economy located in the Middle East and North Africa (MENA) region; it
is considered an upper middle income country, according to the World Bank. The Gross
Domestic Product (GDP) was equal to US$ 33.68 billion (current value) in 2013. Jordan has
faced a combination of economic challenges prior to the spillovers of the Syrian conflict and the
influx of Syrian refugees into the country. Two main external shocks, the global financial crisis
(2008/2009) and the turmoil that followed the Arab uprising in the region (2011), exacerbated
the country’s economic volatility. The Kingdom’s economic challenges expanded after 2011, as
it was forced to spend an additional US$ 2.5 billion per year to secure fuel and diesel from
international markets at costly rates due to the steep reduction in supplies of less costly gas from
Egypt, which was used to generate approximately 80% of the local electricity supply. The rise in
international commodity prices and the use of expensive fuel products, as mentioned above, have
led to the deterioration of Jordan’s current account deficit, which reached 18% of GDP.
The steep influx of Syrian refugees into the country imposed an additional burden on the
government in terms of public spending, especially on infrastructure needed to supply the
additional demand for electricity, water and municipal services (approximately US$ 1.7 billion
3
as of October 2013).3 These additional costs were incurred by the Jordanian government to meet
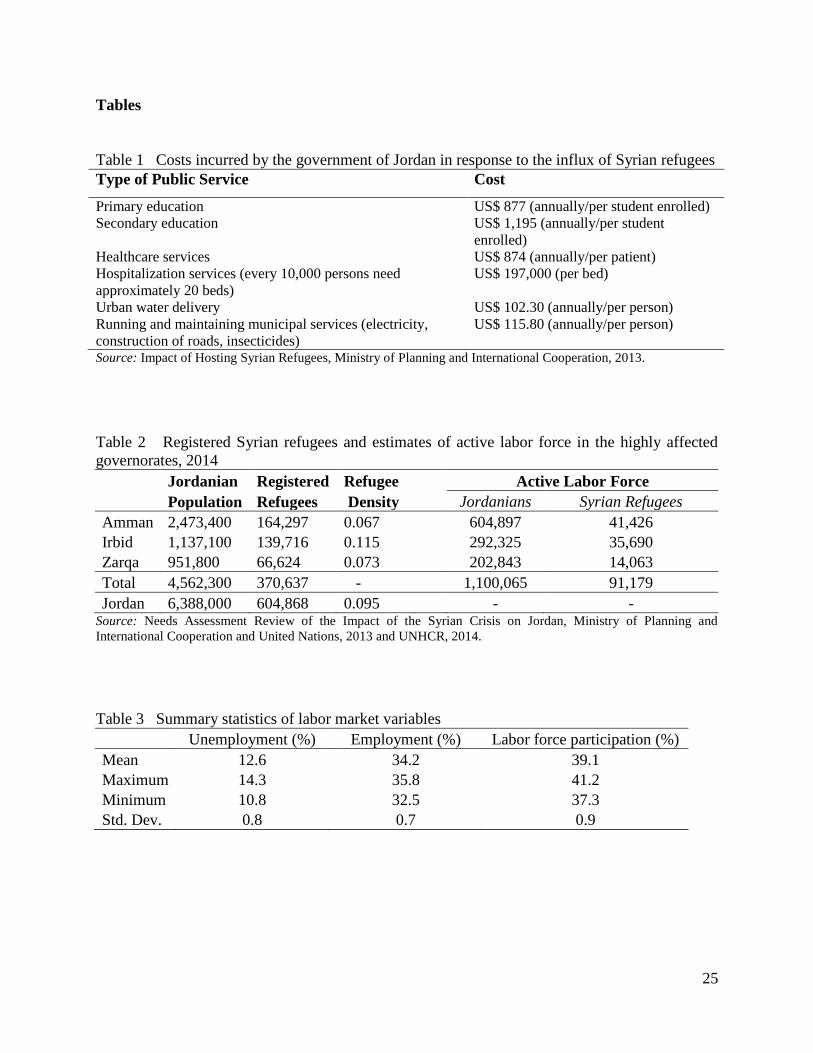
the demand of hosting the large number of Syrian refugees on public services, as shown in Table
1. The annual cost of having a student enrolled in primary education is approximately US$ 877,
whereas this number increases to approximately US$ 1,195 for a student enrolled at the
secondary level. This resulted in an additional cost of US$ 81.4 million to enroll approximately
78,531 Syrian children in 2013. Moving to health services, we find that the annual cost of
providing health services is approximately US$ 874 per patient per year, resulting in an
additional total cost of approximately US$ 167.8 million for hosting approximately 600,000
Syrian refugees.4 We also observe that every 10,000 people will require approximately 20 beds
with a cost of US$ 197,700 per bed. Looking at the cost of providing and maintaining the water
network, we note that the figure reaches approximately US$ 102.3 per person annually, resulting
in additional costs of approximately US$ 62 million annually to cover the needs of Syrian
refugees. Finally, to continue hosting Syrian refugees, municipalities that provide services such
as electricity, road construction, and insecticides will also face additional challenges. According
to the Jordanian government, the cost of providing such services is estimated to be
approximately US$ 115.8 per person each year, totaling US$ 40.5 million annually.
[Table 1 near here]
In terms of unemployment, a marginal decline was registered from 12.9% in 2011 to
12.2% in 2012, and more recent figures from Jordan’s Department of Statistics indicate a further
decline to 11% in the last quarter of 2013. Government figures indicate that in many of the areas
populated by refugees, more than 15% of the Jordanian population is unemployed. According to
a recent study by the Food and Agriculture Organization (FAO) (2013)5, the Syrian crisis has
decreased domestic employment opportunities in the agricultural sector, which is considered a
main source of income for 60% of Jordanians living in rural areas. The Ministry of Labor
estimates that there are 30,000 Syrian children, mainly boys, currently engaged in child labor,
3 Impact of Hosting Syrian Refugees, Ministry of Planning and International Cooperation, 2013.
4 Approximately 32% of the population admits to receiving health services that are subsidized by the government.
Thus, taking into account the total numbers of Syrian refugees in the country, the health system will accommodate
approximately 192,000 Syrian patients (Impact of Hosting Syrian Refugees, Ministry of Planning and International
Cooperation, 2013). 5 Agricultural Livelihoods and Food Security Impact Assessment and Response Plan for the Syria Crisis in the
Neighboring Countries of Egypt, Iraq, Jordan, Lebanon and Turkey, Food and Agriculture Organization, 2013.
4
with approximately 47% of the families who reported receiving income also reporting that
children who had entered the workforce provided part or all of this income. In addition to
agriculture, young boys who are acknowledged to be working are mainly employed in
construction, the service industry, and retail, whereas young girls are more likely to be involved
in domestic work and agriculture, which imposes additional concerns related to child labor and
exploitation or abuse.
2.2. Legal framework governing Syrian refugees in Jordan
Jordan was long considered to be a destination for Syrian workers and workers from other
neighboring countries such as Iraq and Egypt. The different crises that have occurred in the
region over the past decade (i.e., the Iraq War in 2004 and the current Syrian conflict) brought a
large number of refugees to Jordan. According to Olwan and Shiyab (2012), Syrian refugees in
Jordan are treated as foreign nationals and are subject to national laws that govern their entry,
residence, and departure because Jordan does not have an explicit law to address issues related to
refugees. Indeed, Jordan is not a signatory to the UN 1951 Geneva Convention that governs the
situation of refugees, but it does treat all refugees under its Alien Law. Nevertheless, the country
does collaborate with the UNHCR to help refugees under an agreement, and a memorandum of
understanding (MOU) was signed between the two parties in 1997 and 2003 (Olwan and Shiyab,
2012). Accordingly, Syrian refugees can enter Jordan without a visa or a residence permit.
Theoretically, refugees can remain in Jordan for only six months, in which case it is the
responsibility of the UNHCR to find a resettlement country;6 it is also the responsibility of the
UNHCR to define the refugees’ status in the absence of such a determination mechanism in
Jordan. Despite these constraints, Syrian refugees in Jordan have access to public health services,
their children can attend school for free, they are included in the food voucher program, and
finally, they are eligible for the cash assistance program. Syrian refugees are not legally allowed
to work in Jordan and are not entitled to work permits from the Ministry of Labor.7 However, a
recent report by the Jordanian government and the UN concludes that ‘The expectation is that
Syrian refugees will, over time, develop more contacts and relationships with Jordanian
employers in host communities, and make progressive inroads into informal employment’. The
6 UNHCR Global Appeal Update: Jordan, 2013.
7 International Labour Organization (ILO), Regional Office for the Arab States, Mission Report, 2013.
5
report indicates that, in 2013, approximately 160,000 Syrians were working illegally in the
Kingdom for low wages. These workers were observed mainly in informal agriculture,
construction, and food services.
Table 2 shows the number of registered Syrian refugees and an estimate of the potential
active labor force of Jordanians and refugees in the most affected governorates. Jordan had a
population of approximately 6.3 million people in 2013. The Amman, Irbid and Zarqa
governorates are the three largest governorates in Jordan, constituting 71.4% of the total
population.8
Nearly 61% of the registered Syrian refugees were located in these three
governorates. Additionally, these three governorates have the highest ratios of Syrian refugees to
Jordanians and the highest refugee density. Irbid contains the highest refugee density and has the
second largest population in Jordan after the Amman governorate; interestingly, however, it does
not contain the largest Syrian refugee population even though it is the closest to the Syrian
border. We also observe that Syrian refugees represent approximately 6.7%, 12.2%, and 6.9% of
the total potential active labor force in Amman, Irbid and Zarqa, respectively. These
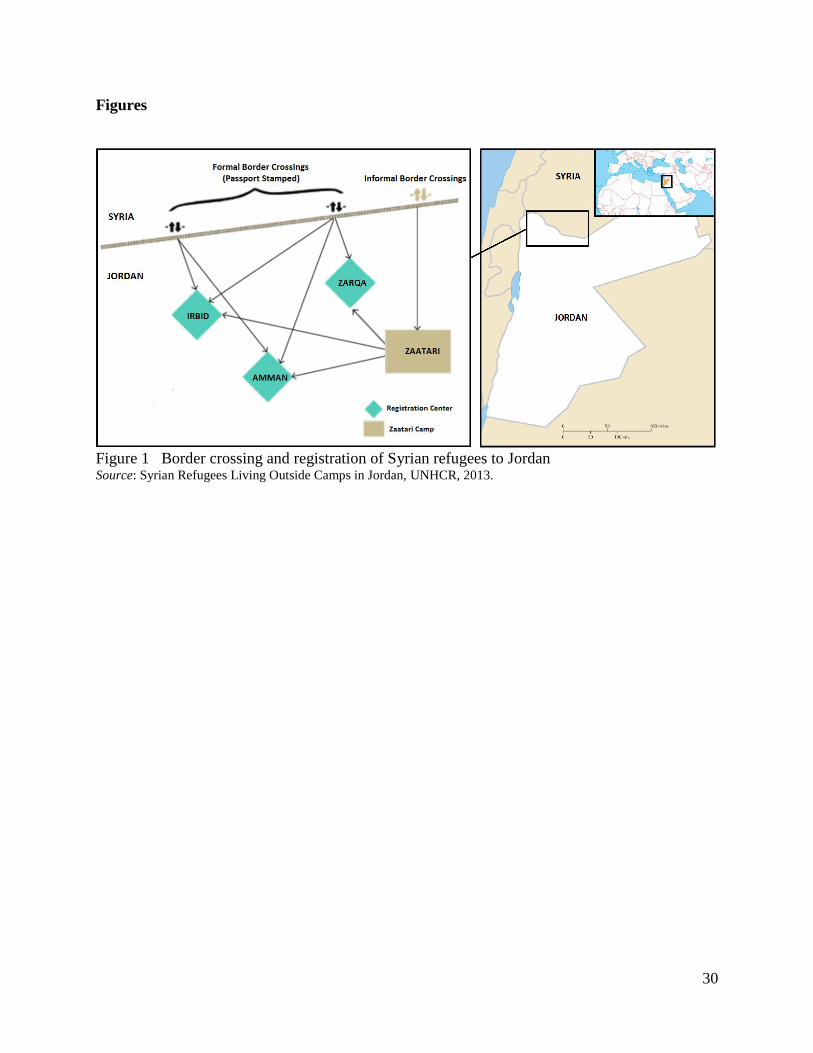
governorates have Syrian refugees who are distributed in camps and in urban areas. Figure 1
displays the movements of refugees from Syria to Jordan and the locations of the Amman, Irbid
and Zarqa governorates. The closest governorate to the Syrian border is Irbid, which is located in
the North region next to the Syrian border. The Amman governorate (includes the capital city)
borders the Zarqa governorate, which is the third largest governorate in Jordan by population.
Both Amman and Zarqa are located in the Central region.
[Table 2 near here]
[Figure 1 near here]
3. Related Literature
The economics literature on the effects of forced migration, particularly in host countries, is still
relatively undeveloped. Forced migration flows occur because of a variety of causal factors,
including, for example, persecution, natural and industrial disasters, environmental degradation,
8 Jordan is geographically divided into 12 provinces called governorates, and each one includes districts and sub-
districts. These governorates are distributed over three regions: the North region, the Central region, and the South
region.
6
war and conflict, ethnic discrimination, and human rights violations (Mason, 2000). It has been
shown that violence due to war and conflict has greater effects on the level of forced migration
than any other factors, including economic problems or political instability (Schmeidl, 1997;
Moore and Shellman, 2004). There is ample evidence that governments are inclined to conduct
indicative assessments to evaluate the economic and social burdens that these host countries have
to shoulder due to the influx of refugees and the increase in hosting costs (Chatty and Marfleet,
2013). This influx comes on the back of already hard-pressed public budgets and public services,
which generally results in increased population, stunted economic growth, strained political
structures, heightened tensions among host communities and environmental degradation, and
increased crime and insecurity (Hein, 1993; Murdoch and Sandler, 2002; Whitaker, 2002; Alix-
Garcia and Saah, 2010; Reuveny et al., 2010; Gomez et al., 2010).
Ruiz and Vargas-Silva (2013) review the literature exploring the impact of forced
migration, focusing on both forced migrants and host communities. Their paper concludes that
the long-term impact of forced migration due to events related to World War II has been positive
for many displaced groups. The reasons behind these positive outcomes include effective
resettlement policies, increased future mobility for those who were displaced and faster transition
to other sectors for agricultural workers. The authors observe that the long-term mobility of
forced migrants is key in determining their long-term outcomes. However, the abovementioned
finding is true for European countries. In the case of developing countries, the authors show that
the consequences of forced migration lead to degenerate outcomes ranging from negative labor
market outcomes to less income and less consumption smoothing. On the receiving end, i.e., the
host communities, the findings are both negative and positive. In some cases, winners are
identified, such as agricultural producers, who are able to take advantage of the cheaper labor
force represented by forced migrants, and the increase in demand for products (and potential
increase in prices). Losers include local workers who have lost their jobs due to the supply of
cheaper labor following the influx of job-seeking refugees and more vulnerable hosts (children)
who may face long-term health consequences.
The effects of refugees on labor market outcomes in host countries can be related to the
wider literature estimating the impact of immigration on the host country’s labor market.
Empirical studies conclude that immigrants exert a modest impact on labor market outcomes of
7
native-born workers (Friedberg and Hunt, 1995). Specifically, empirical evidence shows that the
effects on employment levels of natives are very low, whereas wages are negatively affected, but
only slightly. For example, D’Amuri et al. (2010) study the impact of immigrants on the western
German labor market. They find that immigrants to Germany in the 1990s had modest effects on
wages and employment levels of Germans. They also find that the new immigrants had no effect
on the employment of natives; however, there was a negative impact on the employment of old
immigrants. The authors conclude that there is close competition among immigrants but not
between immigrants and natives. In contrast, Borjas (2003) finds strong results suggesting that
immigrants to the US reduced the employment of natives. He shows that an increase of 10% in
the influx of immigrants resulted in a decrease in the number of weeks worked by approximately
2% for native-born workers who had the same skills. More recently, Manacorda et al. (2012)
find that, for the same education and skills group, immigration reduced the wages of previous
immigrants but with a weak effect on the wages of native-born workers in the UK. They argue
that these results appear to suggest that immigrants and native-born workers are imperfect
substitutes in production. By the same token, Ottaviano and Peri (2012) also conclude that
natives and immigrants are imperfect substitutes in the US. Specifically, they show that
immigration had a positive impact on the wages of natives but that the effect was small.
However, there was a substantial negative effect on the wages of earlier immigrants. In his
seminal work, Chiswick (1978, 1986) argues that refugees’ lack of education and labor market
experience creates problems in signaling their skills. Moreover, these workers are characterized
as having lower motivation compared to economic migrants, as well as lower skills, which
makes it difficult for them to perform highly on the labor market. They are thus less likely to
have transferable skills in the labor market.
It has been documented that developing countries that host refugees for protracted
periods experience long-term economic, social, political, and environmental effects (Gomez et
al., 2010). Baez (2011) notes that developing countries receiving a sudden and large number of
refugees from neighboring countries may face the problem of overpopulation, which leads to
higher competition for resources in the host country. De Groot (2010) mentions that neighboring
countries suffering from the spillover effects of conflict are likely to host the bulk of refugees,
which negatively influences economic growth through the destruction of productive labor.
According to De Groot (2010), refugees in neighboring countries are attracted to less-productive
8
activities. Bah (2013) notes that refugees’ flows urge the host country to provide more necessary
public services, which leads to increased resource scarcity. However, refugees may positively
influence the country’s economic growth if they have a high level of human or physical capital or
because of the increase in international aid flows to the host country. However, for Chambers
(1986), refugees are likely to reduce the employment of locals by driving down wages and thus
putting locals out of a source of income. Kondylis (2010) finds that displaced men and women
from Bosnia and Herzegovina are less likely to be employed than those who stayed. It is worth
mentioning that refugees forced to move due to wars and conflicts do not migrate in search of
work opportunities. In other words, they are non-economic migrants, and their migration is push-
driven rather than pull-driven (Ruist, 2013). Thus, there is less correlation between the influx of
refugees and labor market outcomes in the host country.
In his literature review on migration in Africa, Lucas (2006) notes that approximately
three-quarters of African refugees from Sub-Saharan Africa remained in the region. The paper
shows that Djibouti, Zambia, Guinea, Ghana, and Tanzania are among the largest countries that
received refugees in terms of their ratio to the population. He argues that the effects of refugees
in these countries were also similar to those observed in developed economies. Arthur (1991)
finds that the labor market in urban areas in Ghana did not absorb the rapid flows of refugees
from other African countries, which resulted in a dramatic increase in the size of informal sectors
and unskilled workers. By the same token, Zetter and Deikun (2010) note that refugees living in
urban areas tend to increase competition with locals in the labor market, leading to conflict with
the communities in destination countries such as Malawi. Maystadt and Verwimp (2014) find
that forced refugees moving to Tanzania from Burundi (the neighboring country that witnessed
the genocides of Burundi and Rwanda in 1994) provided cheap labor, resulting in an increased
labor supply. Indeed, refugees helped small and medium firms find workers. Chaulia (2003)
finds that the first wave of Burundi refugees to Tanzania had positive effects on the labor market
by providing cheap workers in the agricultural sector. This could be explained by the
government’s policy to open the market without restrictions to integrate these refugees. The
effects of forced migration on the labor market in host countries were also empirically examined
in other economic regions. For example, Calderón and Ibañez (2009) show that internal forced
migration in Colombia had a more important effect in the informal sector labor market than in
9
the formal sector. For example, they find that an increase in the stock of refugees by 10% causes
wages to fall by 3%. They also find that the large flows of refugees had a negative impact on
employment opportunities of particularly low-skilled workers.
In the case of Jordan and the challenges that the Kingdom has been facing since the onset
of the conflict in Syria, a recent study conducted by Lozi (2013) investigates the effects of both
Syrian and Iraqi refugees on Jordan. Using foreign direct investment and food pricing, the author
concludes that the presence of refugees increased the food prices in Jordan. Moreover, the study
indicates that refugees in Jordan have had an impact on the national budget (leading to an
expansionary budget in 2012) due to the considerable increase in school enrollment, use of
public hospitals for health care, and the upsurge in consumption of government-subsidized fuel
and water. Moreover, Lozi (2013) concludes that the effects of refugees were overstated in terms
of positive and negative effects, indicating that refugees could not be held accountable for most
of the economic challenges in Jordan. Another study by Olwan and Shiyab (2012) seeks to
qualitatively examine the social, economic, and legal conditions of the Syrian refugees hosted in
the Kingdom. It also observes the role of the government in hosting Syrian refugees and
providing immediate relief, highlighting the challenges that the Jordanian government faces as a
result, especially in vital sectors such as healthcare, housing, education, as well as the need for
cash assistance. Zetter (2012) considers that the concept of refugee burden has become widely
used by governments and relief agencies. He concludes that governments tend to emphasize the
adverse effects and costs of hosting refugees, but these effects, although undeniable and well
documented, are only part of the story. He further argues that refugees can expand the productive
capacity of the host economy by increasing consumption, which is measured as a percentage of
the country’s GDP. However, such results are more likely to materialize in the long run
according to Zetter (2012).
Finally, in the aftermath of the 2003 war in Iraq, Saif and DeBartolo (2007) qualitatively
examine the effects of the war, and the influx of Iraqi refugees, on inflation and growth rates in
Jordan. The paper concludes that the Iraq war had important effects on inflation in Jordan due to
the increase in prices of food, fuel and real estate. However, the paper also notes that on the other
hand, displaced Iraqis in Jordan affected growth and inflation rates far less than what was
speculated and reported. The study underlines that the Iraq war had indeed caused inflation in
10
Jordan to surge; however, by taking into account the governorates in which Iraqi refugees were
hosted (mostly located in the capital city Amman) and the breakdown of inflation by
governorate, the indicators showed that the inflation rates in Amman between 2002 and 2005 and
in 2006 were lower than the rate of inflation across the entire country. The study further
elaborates that rural areas in Jordan were mostly affected by inflation, whereas the service sector
in Amman (hotels, restaurants, etc.) benefited from the spending of Iraqi refugees.
4. Data and Empirical Methodology
4.1. Data
The data used for this study cover the three main governorates of Jordan (i.e., Amman, Irbid and
Zarqa) that host the vast majority of registered Syrian refugees. The data are sourced from
Jordan’s Department of Statistics, the Central Bank of Jordan, and the UNHCR. We retrieve the
following variables: 1) the number of Syrian refugees in Jordan extracted from the UNHCR, 2) a
variable for the economic activity measured by construction permits for housing units from the
Central Bank of Jordan, and 3) labor market variables from Jordan’s Department of Statistics.
The number of Syrian refugees in thousands (SYR) in Jordan, i.e., the stock of refugees
recognized by the UNHCR, covers the period between January 2012 and December 2013,
observed monthly, at the level of the three governorates (Amman, Irbid and Zarqa). Baez (2011)
uses a similar variable when studying the impact of hosting refugees fleeing from the genocides
of Burundi and Rwanda on human capital and health consequences of children in Tanzania. He
argues that this variable helps to capture the variation in refugees intensity when examining their
effects and implications. He also notes that forced refugees in most cases are due to wars and
conflicts leading to a massive population shock. This allows to study the effects of this structural
variation in the population on economic conditions in the host country. This stock variable does
not take value zero during the most of period of the study since the arrival of refugees in the host
country is not a one-time shock, i.e. it starts from the first cohort of registered refugees and
continues as conflicts exist in the country of origin.
Economic activity (ECON) captured by the percentage change in the number of
construction permits (in thousands of square meters) is used as a control variable for economic
activity. This variable is also observed on a monthly basis, covering the period January 2012-
11
December 2013, at the level of the three governorates. It is defined as the percentage change
from the prior month. Mayer and Somerville (2000) note that construction of new buildings
affects overall output directly and indirectly because the owners of the new buildings will
consume other durable goods. Baumohl (2012) argues that a country’s economic activity can be
examined by looking at the volume of permits issued for construction.
Finally, labor market indicators (L) include three variables. First, employment rates
(EMP) (in percentage) are defined as the employment to population ratio, i.e., the ratio of the
total working age of the labor force to the total working age of the population in the country
excluding all refugees. Second, the unemployment rate (UNEMP) (as a percentage) is defined as
the share of the labor force that is without work but that is actively looking for work. Third, labor
force participation (LFORCE) (in percentage) is defined as the share of the population aged 15
years and above that is economically active.9 Due to the unavailability of monthly data for labor
market variables at the level of the governorates, we use a geometric interpolation technique to
obtain the monthly figures from quarterly data. This allows us to observe the data at the same
frequencies and have the same number of observations and the same coverage period as the SYR
and ECON variables. Thus, in the estimations, we match the monthly observations on Syrian
refugees with the monthly observations on ECON and L variables.10
Examining Table 3 shows
that the average unemployment rate is approximately 12.6%. The averages of the employment
and labor force participation rates are approximately 34.2% and 39.1%, respectively.
[Table 3 near here]
4.2. Empirical methodology
To examine the response of macroeconomic variables (ECON, L) to variations in the influx of
Syrian refugees (SYR), we resort to the Vector Autoregressive (VAR) model. Sims (1980) notes
that VAR models have the advantage of using the macroeconomic variables in order to
9 Labor market variables are drawn from the “Employment Survey” conducted by the Jordan’s Department of
Statistics. This survey provides data on the number of establishments and the number of workers in the public
sector, in addition to various economic activities in the private sector. However, this survey excludes those working
in the armed forces, public security, and civil defense. This survey is representative of the entire population of
workers. Specifically, the survey collects data on workers from 1) all firms employing 50 people or more, 2) 50% of
firms having 35-49 workers, 3) 20% of firms with 10-24 employees, and 4) 10% of firms employing 1-9 persons. 10
We also run the empirical investigation using the quarterly data for the labor market variables covering the period
Q4:2007-Q4:2013. This allows us to obtain the same number of observations as the monthly data for Syrian
refugees and construction permits. Even though the variables are observed at different frequencies, the results
remain qualitatively similar.
12
characterize the joint dynamic behavior of the time-series without imposing strong restrictions to
identify the estimated parameters. Even when some applications of the VAR estimates, such as
the impulse response functions (IRFs), require identification restrictions, this is done in a more
systemic way. In other words, the restrictions are imposed only on the dynamic relationships
between a pair of variables that could be hidden in the standard econometrics models. In our
paper, the application of the VAR model is in line with the literature examining the impact of
immigration on macroeconomic indicators and economic conditions in the host country (see, for
example, the recent work of Boubtane et al., 2013a, 2013b; Damette and Fromentine, 2013).11
These studies argue that there might be an endogenous relationship between the inflow of
immigrants and the economic conditions and labor market in the host countries. This means that
migrants may have an impact on the economic conditions in the host country, but also economic
situations in the host country may have an influence on the flows of migrants. Thus, the VAR
approach is an appropriate framework to address the potential endogeneity problem by
considering the variables to be endogenous in the system. This helps to avoid making ad hoc
assumptions about the variables of the system (Marr and Siklos, 1994) as in the case of
instrumental variables. Another advantage of the VAR model is the isolation of the effects of
macroeconomic variables on the inflow of immigrants. Our VAR approach is therefore used
because it provides a means to examine the impact of the influx of Syrian refugees on the labor
market in the host country (Jordan), capturing the linear interdependencies or Granger-type
causality among the variables.
The VAR model provides a multivariate framework in which all variables are treated
symmetrically. A VAR system contains a set of n time series variables ),...,,( 21 ntttt XXXX ,
where each is expressed as a linear function of p lags of itself and of all of the other n–1
variables as follows:
0 1 1 2 2 ; 1, , t t t p t p tX a a X a X a X t T (1)
11
For example, Boubtane et al. (2013a) use a similar VAR framework with three variables which are the
immigration rate, GDP per capita in the host country as proxy for economic conditions, and labor market indicators
in the host country measured by the: total unemployment rates, total employment rates, native-born unemployment
rates, and foreign-born unemployment rates.
13
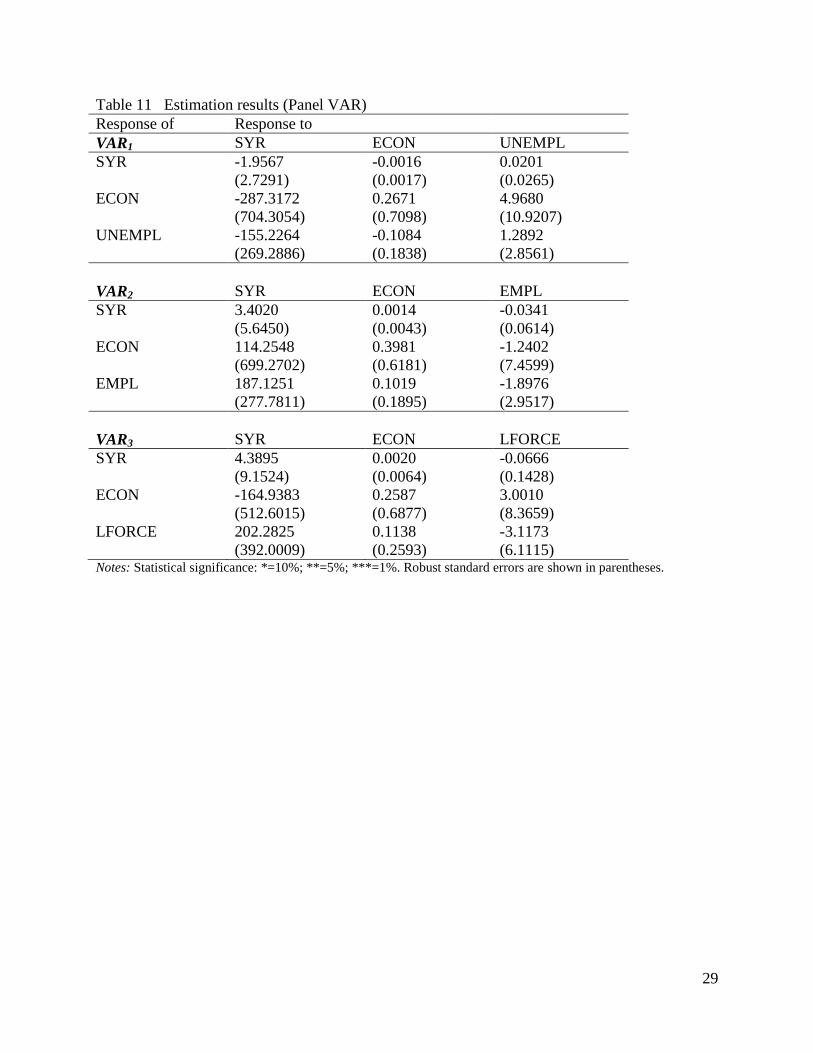
The VAR model used here focuses on three variables, where Xt = (SYRt, ECONt, Lt) is the
vector of stationary variables. These variables are modeled together as endogenous variables. a0
is the intercept vector of the VAR, ai ( )n n are the coefficient matrices, and ),...,,( 21 ntttt
denotes the independent and identically distributed disturbance terms of the VAR system. We
can then represent equation (1) as a VAR system of equations through which Syrian refugees,
economic activity, and labor market are considered endogenously:
01 1 1 1 1
1 1 1
n n n
t i t i i t i i t i t
i i i
SYR a SYR ECON L
(2)
02 2 2 2 2
1 1 1
n n n
t i t i i t i i t i t
i i i
ECON a SYR ECON L
(3)
03 3 3 3 3
1 1 1
n n n
t i t i i t i i t i t
i i i
L a SYR ECON L
(4)
where , , are the parameters to be estimated; i is the lag length; and the subscript t
represents time.
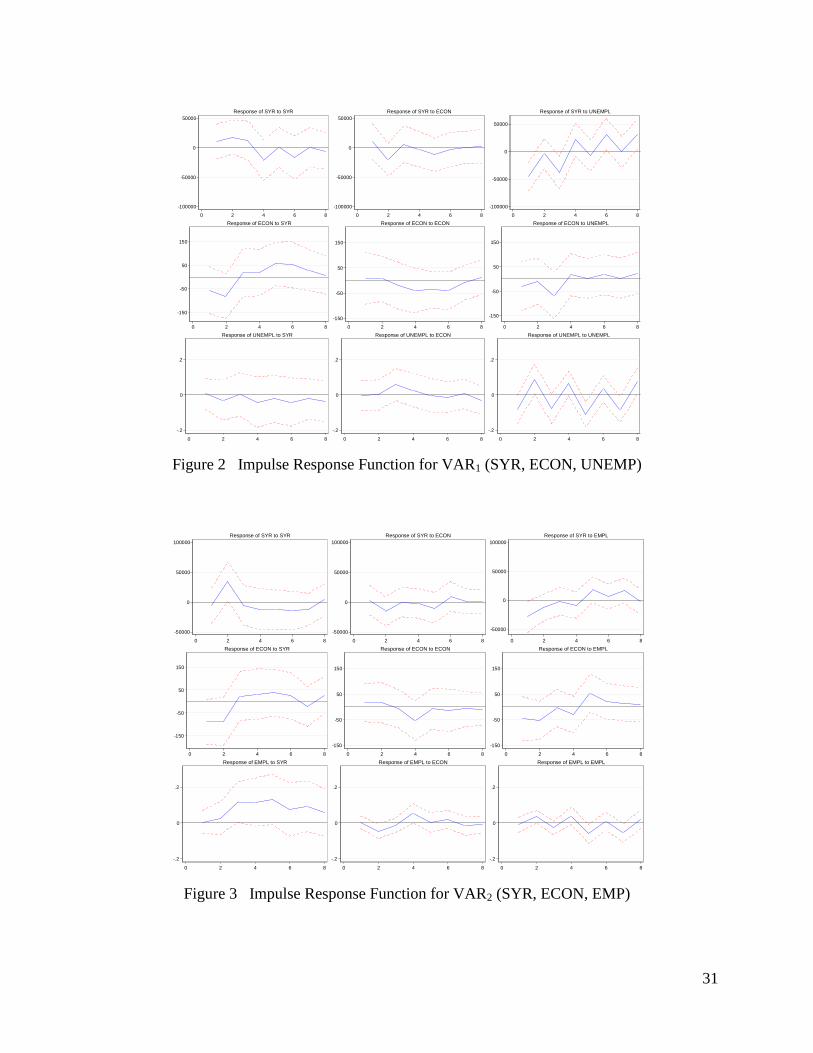
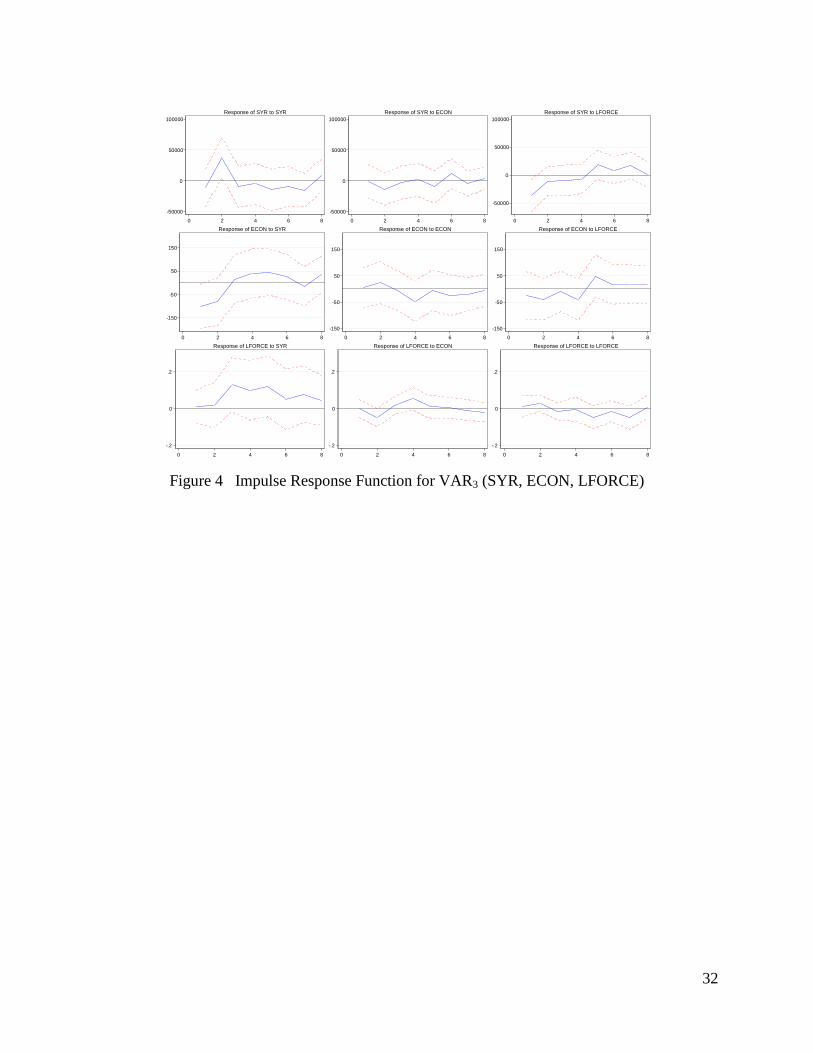
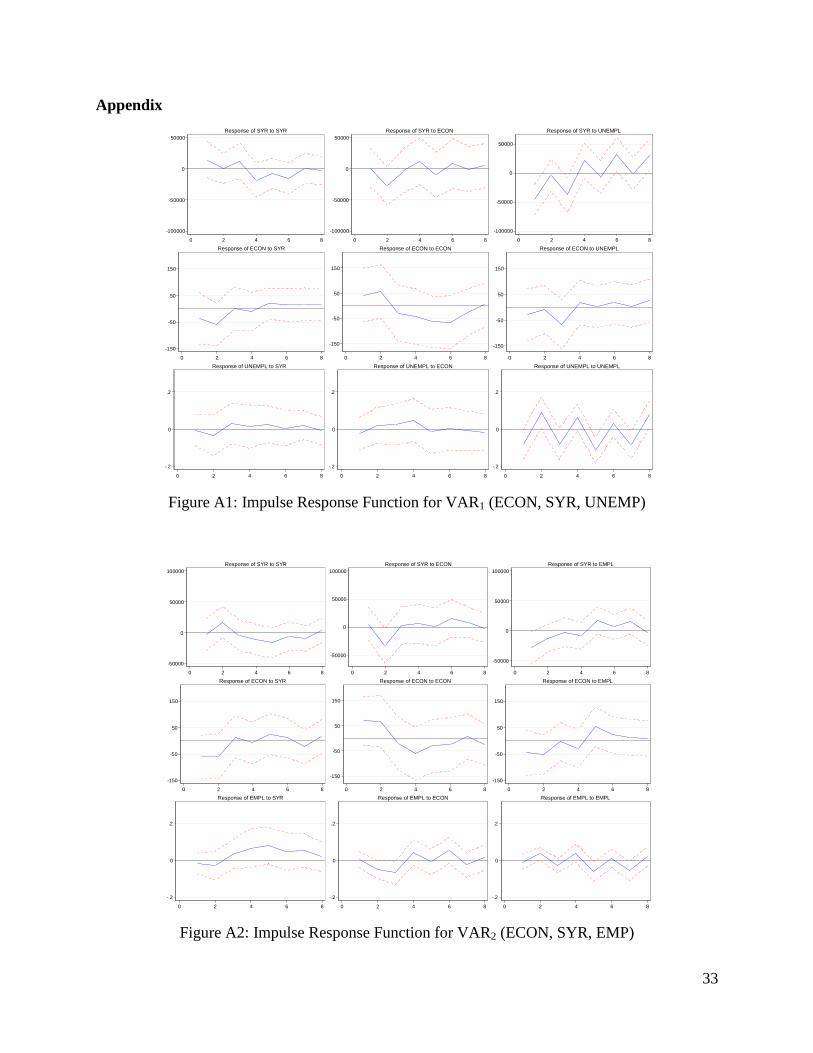
Three VAR systems have thus been estimated. Each VAR has been labeled as follows:
Hospitalization services (every 10,000 persons need
approximately 20 beds)
US$ 197,000 (per bed)
Urban water delivery US$ 102.30 (annually/per person)
Running and maintaining municipal services (electricity,
construction of roads, insecticides)
US$ 115.80 (annually/per person)
Source: Impact of Hosting Syrian Refugees, Ministry of Planning and International Cooperation, 2013.
Table 2 Registered Syrian refugees and estimates of active labor force in the highly affected
governorates, 2014
Jordanian Registered Refugee Active Labor Force
Population Refugees Density Jordanians Syrian Refugees
Amman 2,473,400 164,297 0.067 604,897 41,426
Irbid 1,137,100 139,716 0.115 292,325 35,690
Zarqa 951,800 66,624 0.073 202,843 14,063
Total 4,562,300 370,637 - 1,100,065 91,179
Jordan 6,388,000 604,868 0.095 - - Source: Needs Assessment Review of the Impact of the Syrian Crisis on Jordan, Ministry of Planning and
International Cooperation and United Nations, 2013 and UNHCR, 2014.
Table 3 Summary statistics of labor market variables
Unemployment (%) Employment (%) Labor force participation (%)
Mean 12.6 34.2 39.1
Maximum 14.3 35.8 41.2
Minimum 10.8 32.5 37.3
Std. Dev. 0.8 0.7 0.9
26
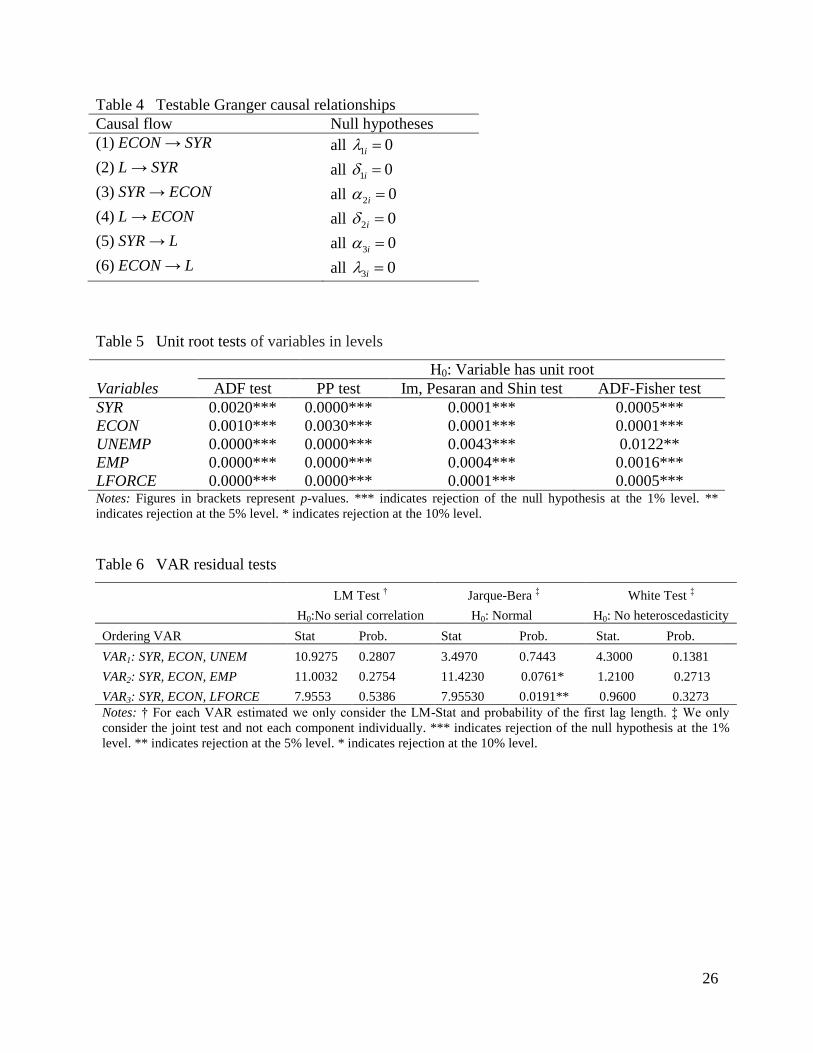
Table 4 Testable Granger causal relationships
Causal flow Null hypotheses
(1) ECON → SYR all 1 0i
(2) L → SYR all 1 0i
(3) SYR → ECON all 2 0i
(4) L → ECON all 2 0i
(5) SYR → L all 3 0i
(6) ECON → L all 3 0i
Table 5 Unit root tests of variables in levels
H0: Variable has unit root
Variables ADF test PP test Im, Pesaran and Shin test ADF-Fisher test
SYR 0.0020*** 0.0000*** 0.0001*** 0.0005***
ECON 0.0010*** 0.0030*** 0.0001*** 0.0001***
UNEMP 0.0000*** 0.0000*** 0.0043*** 0.0122**
EMP 0.0000*** 0.0000*** 0.0004*** 0.0016***
LFORCE 0.0000*** 0.0000*** 0.0001*** 0.0005*** Notes: Figures in brackets represent p-values. *** indicates rejection of the null hypothesis at the 1% level. **
indicates rejection at the 5% level. * indicates rejection at the 10% level.
Table 6 VAR residual tests
LM Test † Jarque-Bera
‡ White Test
‡
H0:No serial correlation H0: Normal H0: No heteroscedasticity
Notes: † For each VAR estimated we only consider the LM-Stat and probability of the first lag length. ‡ We only
consider the joint test and not each component individually. *** indicates rejection of the null hypothesis at the 1%
level. ** indicates rejection at the 5% level. * indicates rejection at the 10% level.
27
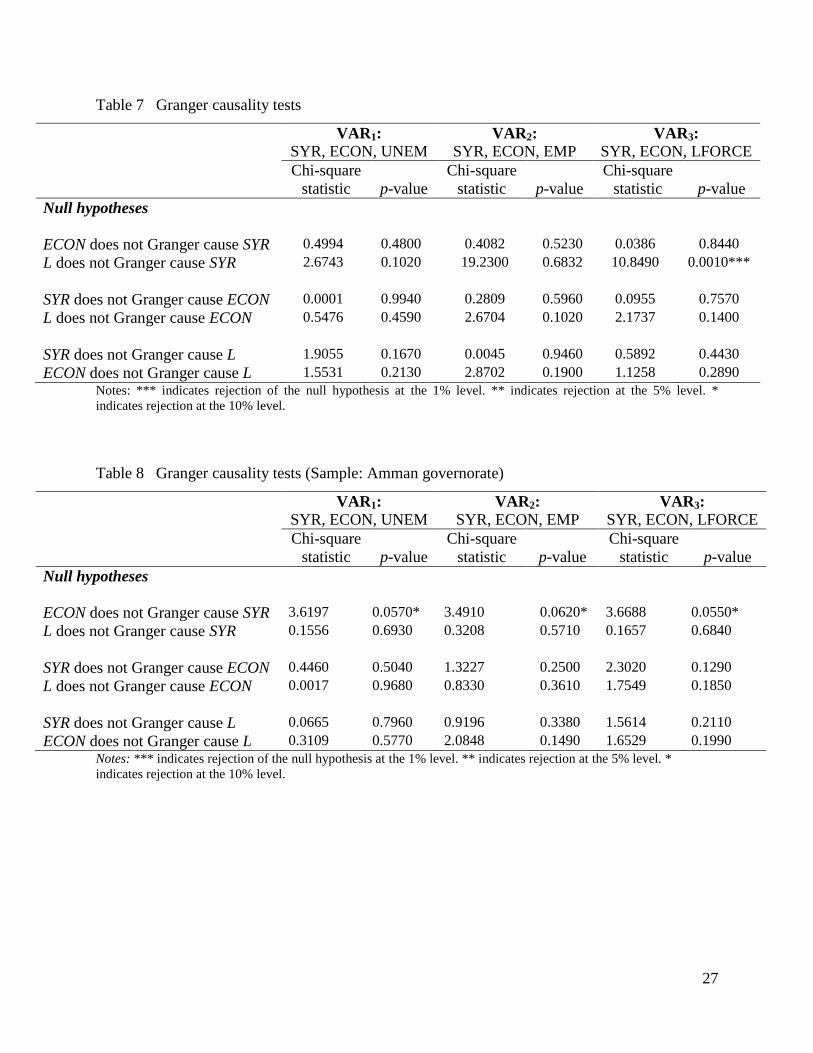
Table 7 Granger causality tests
VAR1:
SYR, ECON, UNEM VAR2:
SYR, ECON, EMP VAR3:
SYR, ECON, LFORCE
Chi-square
statistic
p-value
Chi-square
statistic
p-value
Chi-square
statistic
p-value
Null hypotheses
ECON does not Granger cause SYR 0.4994 0.4800 0.4082 0.5230 0.0386 0.8440
L does not Granger cause SYR
2.6743
0.1020
19.2300
0.6832 10.8490
0.0010***
SYR does not Granger cause ECON 0.0001 0.9940 0.2809 0.5960 0.0955 0.7570
L does not Granger cause ECON
0.5476
0.4590
2.6704
0.1020
2.1737
0.1400
SYR does not Granger cause L 1.9055 0.1670 0.0045 0.9460 0.5892 0.4430
ECON does not Granger cause L 1.5531 0.2130 2.8702 0.1900 1.1258 0.2890 Notes: *** indicates rejection of the null hypothesis at the 1% level. ** indicates rejection at the 5% level. *


![SYRIAN REFUGEES AND THE RIGHT TO WORK: DEVELOPING … · 2015-01-14 · BIDINGER - SYRIAN REFUGEES AND THE RIGHT TO WORK.DOCX (DO NOT DELETE) 1/14/2015 10:05 AM 2015] SYRIAN REFUGEES](https://static.documents.pub/doc/80x56/5e8c8eb271ffea1c093f2e2f/syrian-refugees-and-the-right-to-work-developing-2015-01-14-bidinger-syrian.jpg)
