Doc1 1130 benjamin A. lindy The Impact of Teacher Collective Bargaining Laws on Student Achievement: Evidence from a New Mexico Natural Experiment abstract. This Note uses the 1999 sunset and 2003 reauthorization of New Mexico’s public employee collective bargaining law to estimate the causal effect of teacher collective bargaining on student achievement. This Note finds that mandatory teacher bargaining laws increase the performance of high-achieving students while simultaneously lowering the performance of poorly achieving students. After establishing this core empirical result, the Note explores its implications for current trends in American education policy and for normative arguments about the role of teachers’ unions in public schools. author. Yale Law School, J.D. 2010; Yale College, B.A. 2003. Many thanks to Ian Ayres, John Donohue, Christine Jolls, Jens Ludwig, Barbara Schone, and Chris Griffin for research guidance and excellent teaching; to Paige Elisha, Jonathan Justl, and my family for support and encouragement; to Kenneth Jamison for help preparing this Note for publication; and to my former students and colleagues for a topic that matters.
Transcript
Doc1
1130
benjamin A. lindy
The Impact of Teacher Collective Bargaining
Laws on Student Achievement: Evidence
from a New Mexico Natural Experiment
abstract. This Note uses the 1999 sunset and 2003 reauthorization of New Mexico’s public
employee collective bargaining law to estimate the causal effect of teacher collective bargaining
on student achievement. This Note finds that mandatory teacher bargaining laws increase the performance of high-achieving students while simultaneously lowering the performance of
poorly achieving students. After establishing this core empirical result, the Note explores its
implications for current trends in American education policy and for normative arguments about the role of teachers’ unions in public schools.
author. Yale Law School, J.D. 2010; Yale College, B.A. 2003. Many thanks to Ian Ayres, John Donohue, Christine Jolls, Jens Ludwig, Barbara Schone, and Chris Griffin for research guidance
and excellent teaching; to Paige Elisha, Jonathan Justl, and my family for support and
encouragement; to Kenneth Jamison for help preparing this Note for publication; and to my former students and colleagues for a topic that matters.
the impact of teacher collective bargaining
1131
note contents
introduction 1132
i. teacher collective bargaining laws 1136
ii. the nonempirical literature on teacher bargaining 1139 A. The “Teachers’ Unions Are Terrible” Arguments 1140 B. The “Teachers’ Unions Are Vital” Arguments 1143
iii. the empirical literature on teacher bargaining 1144 A. Cross-Sectional Comparisons and Endogeneity Problems 1144 B. Panel Data and Instrumental Variable Approaches 1147
iv. new mexico’s natural experiment 1149 A. Natural Experiment Studies 1151 B. Data 1152 C. Econometric Models 1158 D. Results 1162 E. Possible Limitations 1164
v. discussion and implications 1169 A. Explaining the Core Findings 1169 B. Normative Arguments Against Mandatory Bargaining 1174 C. Policy Relevance 1178
conclusion 1180
appendix a 1181
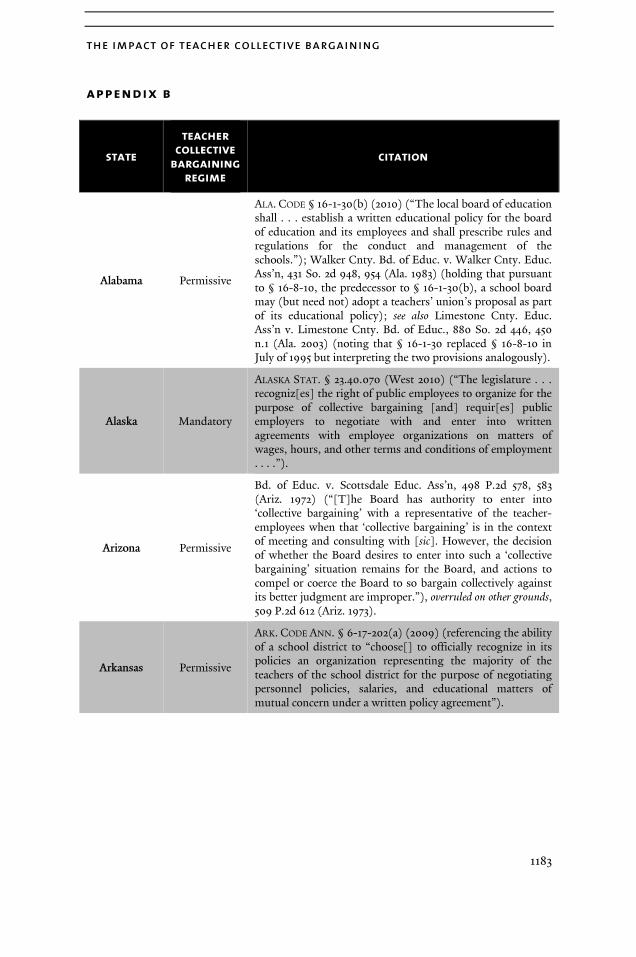
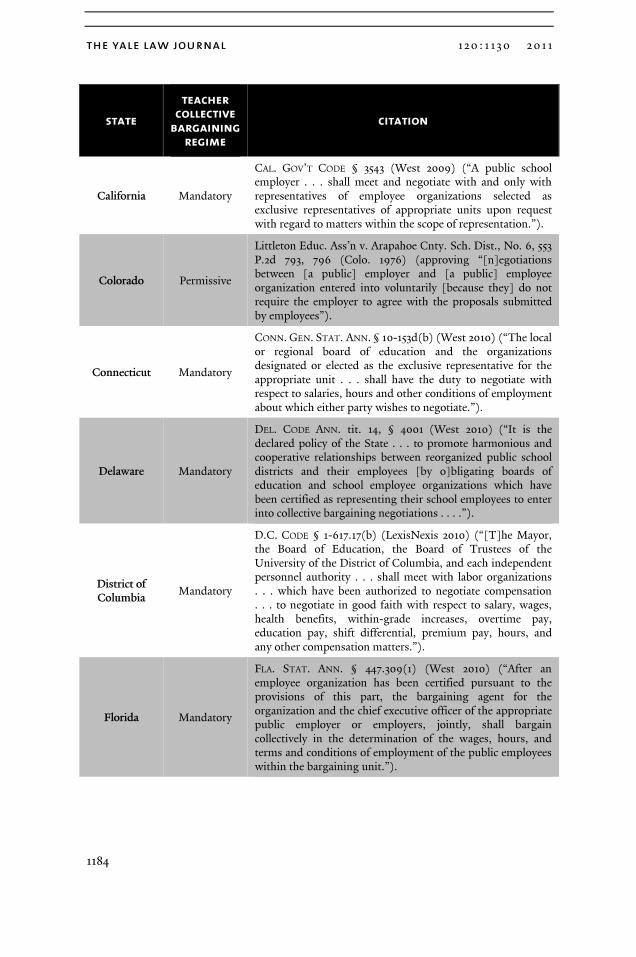
appendix b 1183
the yale law journal 120: 1130 2 011
1132
introduction
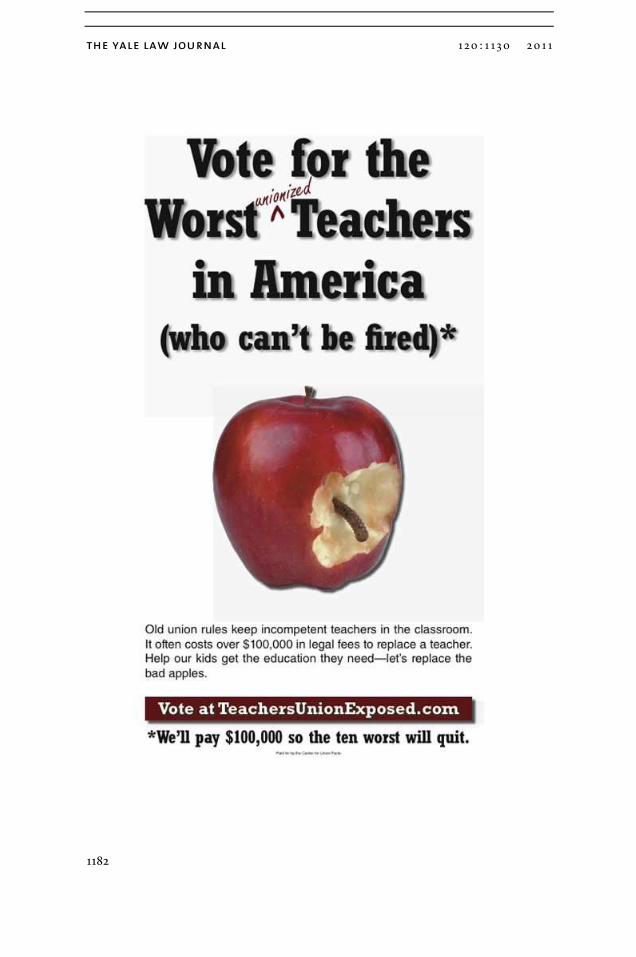
An interest group called the “Center for Union Facts” ran a two-page advertisement in the New York Times in the spring of 2008.1 It depicted a small boy hanging from a coat hook by his jacket as if hung there by a bully. The advertisement read: “The Biggest Bully In Schools? Teacher Unions. Teacher unions bully principals into keeping bad teachers, scare politicians who support school reform, and block efforts to pay great teachers higher pay. It’s time to stand up to the bully.”2 The advertisement offered to give America’s ten worst union-protected teachers $100,000 to resign, and it directed readers to a website where they could submit nominations.3
The group’s advertisement is but a single example of the strong anti-teachers’ union sentiment that appears in the mainstream media.4 For years, this criticism has come primarily from conservatives.5 More recently, however, tensions have developed between unions and liberals as well. Through its “Race to the Top” program, President Obama’s Department of Education has encouraged state legislatures to pass laws that threaten core union values.6 The program seeks, for example, to reward states that tie teacher evaluations in part
1. Ctr. for Union Facts, Advertisement, N.Y. TIMES, Mar. 11, 2008, at A15, reprinted infra Appendix A.
2. Id.
3. Id.
4. For anti-union pieces in the popular press, see, for example, Steven Brill, The Rubber Room, NEW YORKER, Aug. 31, 2009, at 30; and Steve Malanga, Unions vs. Taxpayers, WALL ST. J., May 14, 2009, at A17. For an entertaining anti-union segment from a popular television show, see The Simpsons: Waverly Hills 9-0-2-1-D’oh (FOX television broadcast May 3, 2009), in which Bart’s teacher earns tenure and, after delegating teaching duties to Ralph, begins reading a magazine behind her desk.
5. See, e.g., Edwin Chen & Maria L. La Ganga, Dole Vows Renewal with Trust, L.A. TIMES, Aug. 16, 1996, at A1 (“Dole received some of the most enthusiastic applause when he leveled sharp words at teachers unions, whom he blamed for the state of public education in America.”); Walter Shapiro, Scripted Candidates Show Off Their Reading Skills, USA TODAY, Oct. 6, 1999, at 2A (“[M]ost . . . Republicans go out of their way in education speeches to lambaste the teachers unions . . . .”).
6. Compare Final Priorities, Requirements, Definitions, and Selection Criteria, 74 Fed. Reg. 59,688, 59,697 (Nov. 18, 2009) (requiring states to repeal laws that ban the use of test score data in teacher evaluations in order to be eligible for Race to the Top grants), with Danny Hakim & Jeremy W. Peters, Legislators Balk at Tying Teacher Tenure to Student Tests, N.Y. TIMES, Apr. 9, 2008, at B1 (describing earlier union success in getting New York legislators to pass a law that bans “student test scores from being considered when teacher tenure determinations are made”).
the impact of teacher collective bargaining
1133
to student performance on standardized tests.7 Union leaders have publicly criticized the program,8 led major campaigns to defeat responsive state laws,9 and fought for language that subordinates the new policies to existing collective bargaining agreements.10
Why do teachers’ unions occupy such a controversial place in discussions of American education policy? Teachers’ unions exert tremendous power over the structure and operations of America’s public schools.11 In thirty-four states and the District of Columbia, teachers’ unions can require school districts to engage in collective bargaining over a wide range of issues.12 Those issues include teacher salaries, grievance and dismissal procedures, class sizes, the length of the school day and school year, the amount of free time that teachers have during the work day, transfer and layoff procedures, and even the number and duration of required after-school meetings.13 Teachers’ unions argue that the
7. See Final Priorities, Requirements, Definitions, and Selection Criteria, 74 Fed. Reg. at 59,751 (“States, LEAs [local educational agencies], or schools must include multiple measures [of teacher effectiveness], provided that teacher effectiveness is evaluated, in significant part, by student growth (as defined in this notice).”).
8. See Nick Anderson, Unions Criticize Obama’s School Proposals as ‘Bush III,’ WASH. POST, Sept. 25, 2009, at A5.
9. See, e.g., Josh Hafenbrack & Leslie Postal, ‘Start Over’ on Teacher Pay Bill, ORLANDO
SENTINEL, Apr. 16, 2010, at A1 (describing a union-led campaign to defeat a bill that would make Florida more competitive in the Race to the Top program by tying teacher compensation to student performance); Jeremy P. Meyer, Legions Line Up for Showdown on School Tenure, DENVER POST, Apr. 18, 2010, at B1 (describing a union-led campaign to defeat a bill that would make Colorado more competitive in the Race to the Top program by changing teacher tenure rules in that state).
10. See Steven Brill, The Teachers’ Unions’ Last Stand: How Obama’s Race to the Top Could Revolutionize Public Education, N.Y. TIMES, May 23, 2010, § 6 (Magazine), at 32 (discussing qualifiers inserted into the district-level memoranda of understanding required under Race to the Top).
11. See, e.g., Paul T. Hill, The Costs of Collective Bargaining Agreements and Related District Policies, in COLLECTIVE BARGAINING IN EDUCATION 89, 91-92 (Jane Hannaway & Andrew J. Rotherham eds., 2006) (describing the power that teachers’ unions can exert on school policy through the collective bargaining process); Richard D. Kahlenberg, The History of Collective Bargaining Among Teachers, in COLLECTIVE BARGAINING IN EDUCATION, supra, at 7 (describing the growth in teachers’ union membership even as overall union membership in the United States has declined).
12. See Teacher Rules, Roles and Rights: Scope of Bargaining, NAT’L COUNCIL ON TCHR. QUALITY, http://www.nctq.org/tr3/scope (last visited Nov. 3, 2010). For a discussion of the state laws that govern teacher collective bargaining, see infra Part I.
13. See EMILY COHEN, KATE WALSH & RISHAWN BIDDLE, NAT’L COUNCIL ON TEACHER QUALITY, INVISIBLE INK IN COLLECTIVE BARGAINING 16-24 (2008), available at http://www.nctq.org/p/publications/docs/nctq_invsible_ink.pdf (cataloging many of the governance issues that unions influence through collective bargaining). The primary
the yale law journal 120: 1130 2 011
1134
ability to bargain over these issues ensures fair treatment for America’s teachers; union critics counter that the bargaining process advances the interests of teachers over the needs of students.14 Disagreements over these and other issues have led to recent confrontations between districts and unions across the United States, including high-profile clashes in California,15 Colorado,16 Florida,17 New York,18 and the District of Columbia.19
As these confrontations multiply, it is troubling that there is remarkably little empirical evidence of the true impact of teacher bargaining on student achievement. Rigorous empirical work is crucial in public policy debates because often one’s intuition about the effect of a policy turns out to be incorrect.20 Unfortunately, the existing empirical literature on teacher
argument of this report’s authors is that unions influence school governance in multiple ways: through state legislatures, through state regulatory agencies, and through state courts. Id. at 1-2. They acknowledge, however, that collective bargaining still shapes many important school governance issues. Id. at 2, 16-24.
14. For example, class-size restrictions and seniority-based salary ladders constrain the spending options of school districts: funding that goes toward hiring additional teachers to keep class sizes down or toward seniority-based pay increases is funding that cannot go toward other priorities like bonuses for highly effective teachers. Alternatively, layoff and transfer policies could protect the interests of senior teachers at the expense of more effective teachers regardless of whether they are more experienced. For further discussion of these (and other) arguments over the potential merits of teacher bargaining, see infra Part II.
15. See Sandy Banks, Is This Truly for the Children?, L.A. TIMES, May 16, 2009, at A2 (criticizing civil disobedience demonstrations conducted by the L.A. teachers’ unions designed to prevent job cuts).
16. See Jeremy P. Meyer, Teacher Evaluation: After Signing, Factions Dig into Details, DENVER
POST, May 21, 2010, at A1 (describing the Colorado Education Association’s resistance to a new teacher evaluation bill aimed at making Colorado more competitive for Race to the Top).
17. See Sarah Longwell, Op-Ed., Crist’s Mistakes, SUNSENTINEL (Fort Lauderdale), June 6, 2010, at 5F.
18. See Brill, supra note 10.
19. See, Sam Dillon, A Tentative Contract Deal for Washington Teachers, N.Y. TIMES, Apr. 8, 2010, at A21.
20. For example, despite microeconomic theory that shows why increasing the minimum wage should lead to an increase in unemployment, empirical work has shown that the opposite may sometimes be true. See David Card & Alan B. Krueger, Minimum Wages and Employment: A Case Study of the Fast-Food Industry in New Jersey and Pennsylvania, 84 AM. ECON. REV. 772 (1994). In the field of education policy, despite the strong intuition that smaller class sizes should improve student achievement, empirical work has shown that large-scale efforts to reduce class size actually reduce student achievement for minority students. See Christopher Jepsen & Steven Rivkin, What Is the Tradeoff Between Smaller Classes and Teacher Quality? (Nat’l Bureau of Econ. Research, Working Paper No. 9205, 2002).
the impact of teacher collective bargaining
1135
bargaining suffers from a series of methodological flaws, and as a result it has produced inconsistent evidence.21 Some studies find that teacher bargaining has a positive effect on student achievement, and some studies find the opposite.22 Rather than clarifying the debate between union supporters and critics, the existing empirical literature has instead fueled both sides.
This Note provides a way forward by offering new and reliable empirical evidence of the causal impact of teacher bargaining on student achievement. It does so by exploiting a previously untapped natural experiment from New Mexico. Between 1993 and 1999, New Mexico—like most states—required school districts to enter into a formal collective bargaining process with a teachers’ union once that union was properly recognized.23 In 1999, however, the enabling piece of state legislation expired, and until 2003—when the legislature reinstated the law—school districts in New Mexico could refuse to bargain with teachers’ unions. Through the use of panel data regressions with state and year fixed effects, this Note uses this set of legal changes to identify the causal impact of mandatory collective bargaining laws on student achievement. It finds that mandatory bargaining laws lead to an increase in students’ SAT scores and a decrease in high school graduation rates. The laws appear to have no effect on per-pupil expenditures.
This Note proceeds as follows. Part I describes the relevant legal background on teacher collective bargaining and shows how state bargaining laws potentially affect student achievement. Part II reviews in greater depth the conflicting arguments that union supporters and union critics have made about teacher bargaining. Part III shows how methodological flaws in the existing empirical studies of teacher bargaining prevent those studies from clarifying the theoretical debates from Part II. Part IV describes the Note’s empirical strategy and presents its core findings. Part V then discusses those findings along several dimensions. It uses interviews with local union and district leaders to suggest possible explanations for the results in Part IV. It also explores the normative implications of these findings and their relevance for contemporary debates over American school policy.
21. See infra Part III.
22. For studies finding a positive impact, see sources cited infra note 80. For studies finding a negative impact, see infra note 81.
23. See infra Part I.
the yale law journal 120: 1130 2 011
1136
i . teacher collective bargaining laws
Teachers’ unions influence public school policy in large part through the collective bargaining process.24 This Part reviews the state laws that establish collective bargaining for teachers and that govern its scope. It also shows how collective bargaining leads to contract provisions that potentially influence student achievement. These discussions provide important context for the arguments that union supporters and critics make about collective bargaining (discussed in Part II), and they help explain the significance of the legal changes New Mexico experienced in 1999 and 2003 (discussed in Part IV).
As state government employees, public school teachers are exempt from federal labor laws.25 For this reason, states have tremendous flexibility in shaping the collective bargaining rights of teachers. Some states have extensive bargaining regimes that mirror the federal system established under the National Labor Relations Act.26 Other states impose powerful restrictions on public employee bargaining. For example, although the First Amendment protects the right of public school teachers to join a teachers’ union,27 states can ban teacher strikes28 and even ban collective bargaining altogether.29
24. See supra note 11.
25. See 29 U.S.C. § 152(2) (2006).
26. Id. §§ 151-169. California, for example, has an extensive bargaining regime mirroring the federal system. See CAL. GOV’T CODE § 3543 (Deering 1999) (establishing the right of teachers to be represented by a union and their right to good-faith bargaining from their employers); Cnty. Sanitation Dist. No. 2 v. L.A. Cnty. Emps. Ass’n, Local 660, 699 P.2d 835, 850 (Cal. 1985) (establishing the right of public employees to strike in California absent express statutory prohibition or threat of imminent danger to the public); see also Carol A. Vendrillo, Collective Bargaining in California’s Public Sector, in COLLECTIVE BARGAINING IN
THE PUBLIC SECTOR 137, 145-47 (Joyce M. Najita & James L. Stern eds., 2001) (describing California’s teacher collective bargaining regime).
27. Although the Supreme Court has never directly addressed this issue, the federal courts of appeals seem to uphold this proposition uniformly. See, e.g., Conn. State Fed’n of Teachers v. Bd. of Educ. Members, 538 F.2d 471 (2d Cir. 1976); Am. Fed’n of State, Cnty. & Mun. Emps. v. Woodward, 406 F.2d 137 (8th Cir. 1969); McLaughlin v. Tilendis, 398 F.2d 287 (7th Cir. 1968); see also KENNETH H. OSTRANDER, THE LEGAL STRUCTURE OF COLLECTIVE
BARGAINING IN EDUCATION, at xiv (1987) (“Teachers came away from the federal courts with a constitutional right to organize.”).
28. See, e.g., IND. CODE ANN. § 20-29-9-1 (LexisNexis 2007) (“It is unlawful for . . . a school employee . . . to take part in or assist in a strike against a school employer . . . .”); MICH. COMP. LAWS ANN. § 423.202 (West 2001) (“A public employee shall not strike . . . .”).
29. See, e.g., N.C. GEN. STAT. § 95-98 (2009) (“Any . . . contract . . . between the governing authority of any . . . institution of the State of North Carolina, and any labor union . . . as bargaining agent for any public employees . . . is hereby declared to be against the public policy of the State, illegal, unlawful, void and of no effect.”); TEX. GOV’T CODE ANN.
the impact of teacher collective bargaining
1137
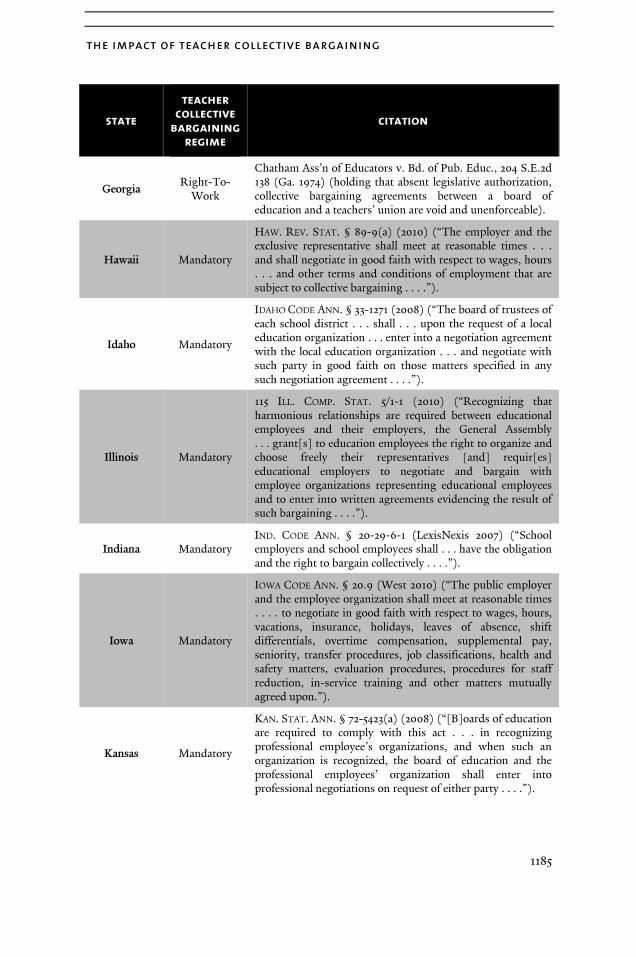
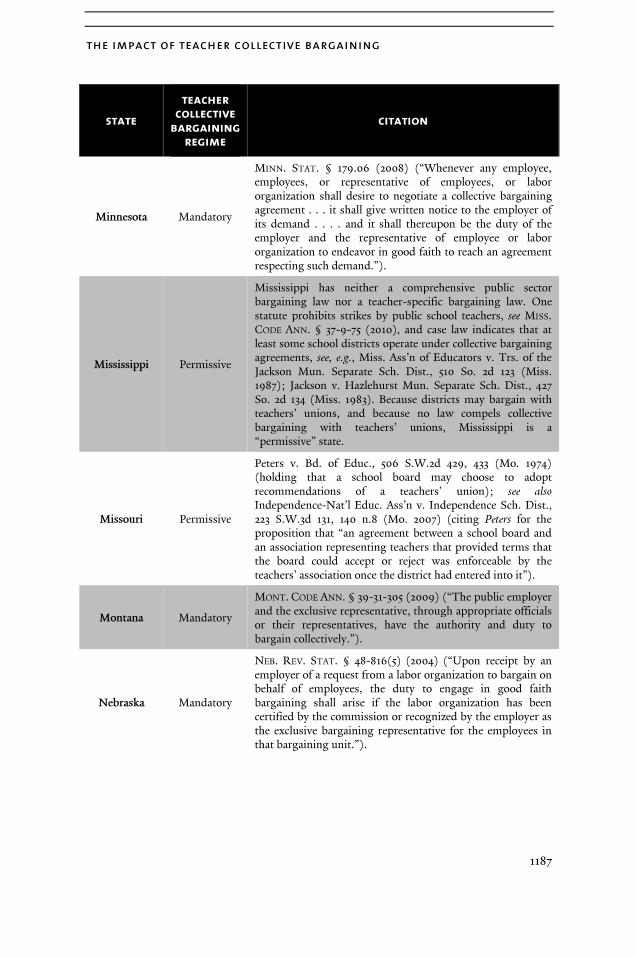
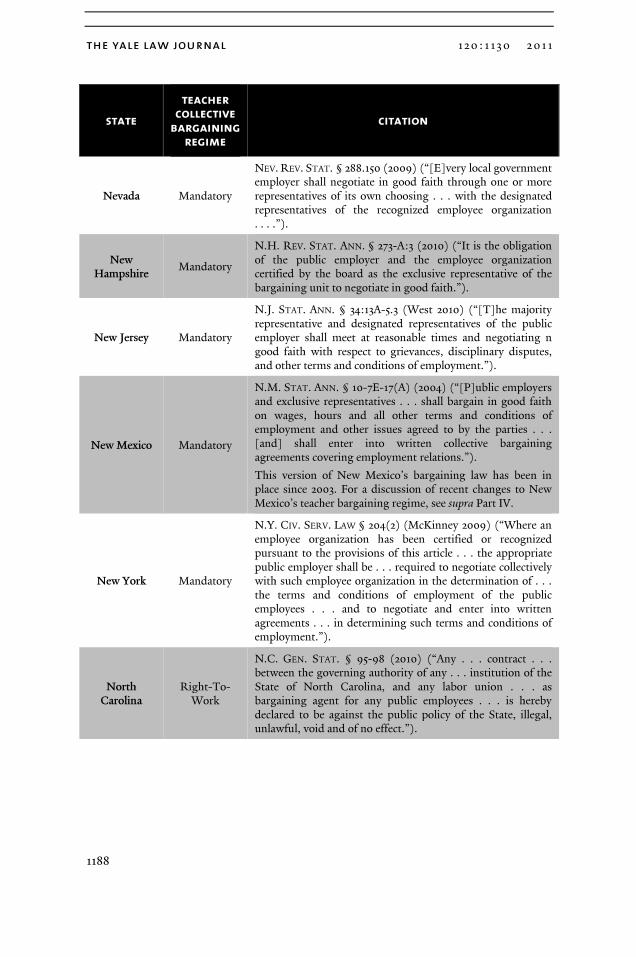
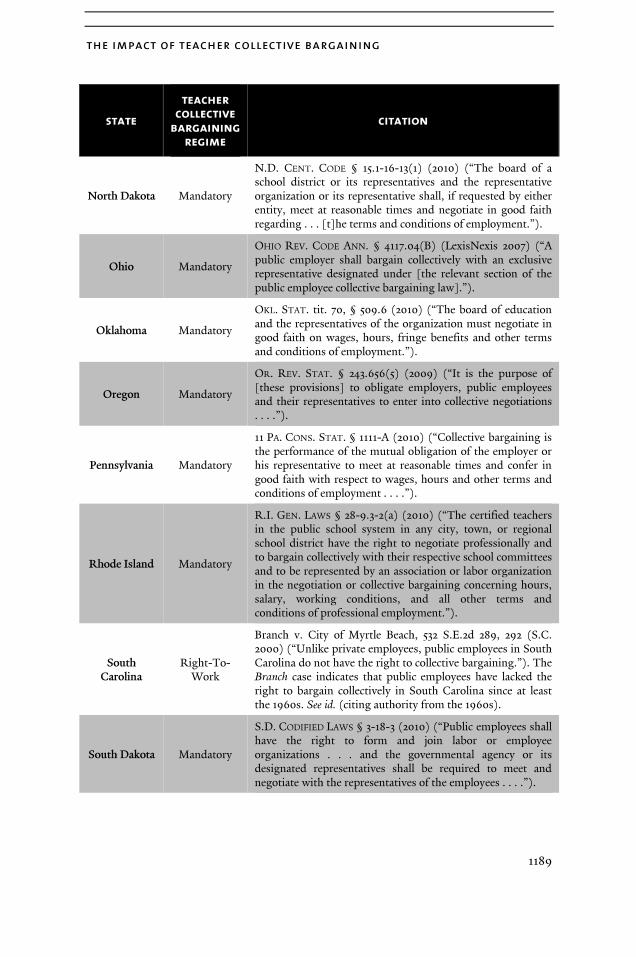
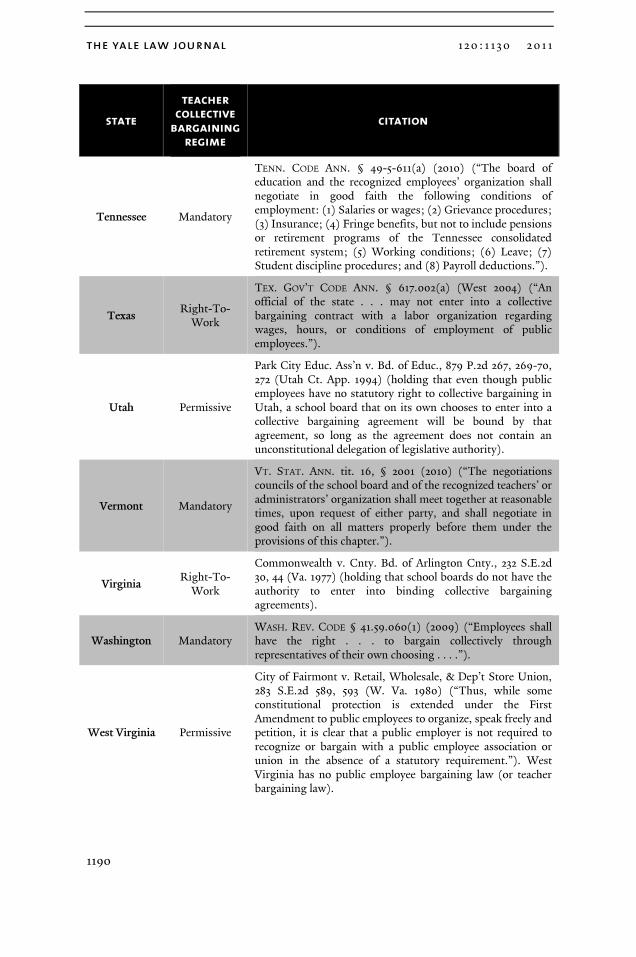
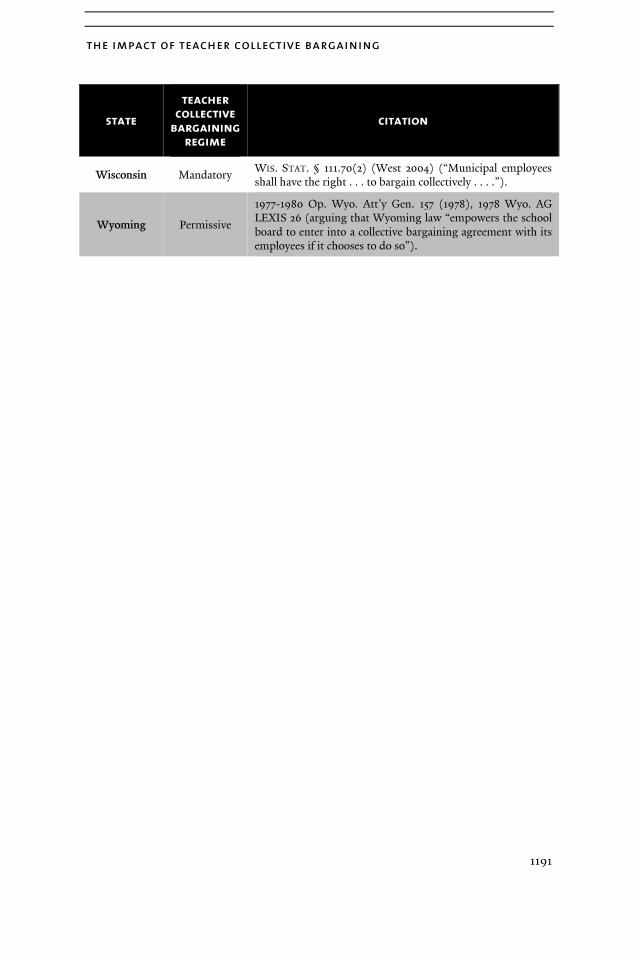
Despite the diversity of legal regimes, one can usefully classify each state as falling into one of three categories.30 The first category consists of “mandatory” states, where the law requires school districts to bargain collectively with a properly recognized teachers’ union.31 The second category consists of “permissive” states, where a district may choose whether or not to engage in collective bargaining.32 The third category consists of “right-to-work” states, where the law expressly prohibits collective bargaining between a school district and a teachers’ union.33
Most states have mandatory bargaining regimes.34 Borrowing heavily from federal labor law, these regimes typically involve three components: provisions for exclusive representation, an obligation to bargain in good faith, and impasse procedures. “Exclusive representation” refers to the inability of the school district to bargain with any employees other than the exclusive bargaining representative.35 Attempts to bargain with subgroups of teachers—what some call “divide and conquer” strategies—are expressly illegal.36 Under
§ 617.002(a) (West 2009) (“An official of the state . . . may not enter into a collective bargaining contract with a labor organization regarding wages, hours, or conditions of employment of public employees.”).
30. This classification follows the National Council on Teacher Quality’s website, cited supra note 12. See also infra Appendix B (classifying all fifty states and the District of Columbia and providing citations to controlling statutes and case law).
31. See, e.g., OHIO REV. CODE ANN. § 4117.04(B) (LexisNexis 2009) (“A public employer shall bargain collectively with an exclusive representative designated under [the relevant section of the public employee collective bargaining law].”); WASH. REV. CODE ANN. § 41.59.060(1) (West 2006) (“Employees shall have the right . . . to bargain collectively through representatives of their own choosing . . . .”). For a complete list of “mandatory” states, see infra Appendix B.
32. See, e.g., ARK. CODE ANN. § 6-17-202(a) (2009) (referencing the ability of school districts to “choose[] to officially recognize in its policies an organization representing the majority of the teachers of the school district for the purpose of negotiating personnel policies, salaries, and educational matters of mutual concern under a written policy agreement”); Littleton Educ. Ass’n v. Arapahoe Cnty. Sch. Dist., No. 6, 553 P.2d 793, 796 (Colo. 1976) (approving “[n]egotiations between [a public] employer and [a public] employee organization entered into voluntarily [because they] do not require the employer to agree with the proposals submitted by employees”). For a complete list of “permissive” states, see infra Appendix B.
33. See, e.g., sources cited supra note 29. For a complete list of “right-to-work” states, see infra Appendix B.
34. See Teacher Rules, Roles and Rights: Scope of Bargaining, supra note 12.
35. See, e.g., CAL. GOV’T CODE § 3543(a) (West 1999); N.M. STAT. ANN. § 10-7E-15 (LexisNexis 2004).
36. For a discussion of these provisions, see MYRON LIEBERMAN, UNDERSTANDING THE TEACHER
UNION CONTRACT: A CITIZEN’S HANDBOOK 15 (2000), which describes district bargaining “with individual employees or any third party without permission of the union” as an unfair
the yale law journal 120: 1130 2 011
1138
the “obligation to bargain in good faith,” both the union and the school district must propose contract terms and do their best to reach compromises in areas of disagreement.37 State agencies police this process.38 Should those agencies find that unions or districts are guilty of bargaining in bad faith (because of a refusal to negotiate or the taking of too inflexible a position on a given issue), they can impose stiff penalties.39 “Impasse procedures” typically involve nonbinding mediation or a factfinding process whereby a neutral third party publicly provides a set of terms that the third party believes to be fair under the circumstances.40 The goal here is to impose pressure on the bargaining parties; a desire to “look[] good in the eyes of their respective constituencies” following the judgment of a neutral third party will in theory push both sides toward the most reasonable position on a contentious issue.41
What provisions typically emerge from this process, and in what ways might they influence district operations? I already noted in the Introduction several types of common collective bargaining provisions.42 Terms governing the length of the school day, the school calendar, class sizes, and the after-school time of teachers all impose restrictions on how school districts allocate their budgets. If, for example, the contract requires class sizes to remain below a certain threshold, then the district may have to hire additional teachers even if it would rather put those same funds to a different use. A recent study of
labor practice. See also ROBERT A. GORMAN & MATTHEW W. FINKIN, BASIC TEXT ON LABOR
LAW: UNIONIZATION & COLLECTIVE BARGAINING 502-03 (2d ed. 2004) (describing the rationale for exclusive representation in the context of federal labor law).
37. E.g., NEB. REV. STAT. § 48-816(1) (2004) (“The commission shall require good faith bargaining concerning the terms and conditions of employment of its employees by any employer.”); N.M. STAT. ANN. § 10-7E-17 (2004) (“[P]ublic employers and exclusive representatives . . . shall bargain in good faith on wages, hours, and all other terms and conditions of employment . . . .”). See generally LIEBERMAN, supra note 36, at 19-22 (describing the duty to bargain in good faith and surveying application of state statutes in various state court cases).
38. See LIEBERMAN, supra note 36, at 14 (describing the role of state labor boards in “evaluating charges of unfair labor practices”).
39. See id. at 15 (describing the penalties that state labor boards can impose as “severe”).
40. See, e.g., Joan Parker, Judicial Review and Legislative Response: The New Jersey Public Sector Collective Bargaining Experience, in COLLECTIVE BARGAINING IN THE PUBLIC SECTOR, supra note 26, at 21, 32 (describing mediation under New Jersey law); Gregory M. Saltzman & Shlomo Sperka, Public Sector Collective Bargaining in Michigan: Law and Recent Developments, in COLLECTIVE BARGAINING IN THE PUBLIC SECTOR, supra note 26, at 106, 115 (describing mediation under Michigan law); Vendrillo, supra note 26, at 146 (describing mediation under California law).
41. OSTRANDER, supra note 27, at 63.
42. See supra note 13 and accompanying text.
the impact of teacher collective bargaining
1139
California contracts identified other ways in which contract provisions restrict the management options of school districts.43 Many contracts include “voluntary transfer” rights for most teachers and “involuntary transfer” protections for senior teachers.44 Under these provisions, districts cannot always assign teachers to the schools and classrooms that they wish. A district must honor the “voluntary” requests of many teachers to teach in certain areas before engaging in an “involuntary” placement. Further, in the event of an “involuntary” placement, districts must assign teachers with lower levels of seniority first. The work of other researchers suggests that these transfer provisions are common not only in California but in other states as well.45 It is also worth noting that the total size of these contracts can be quite large. For example, the New York teachers’ contract is 165 pages long,46 the Philadelphia teachers’ contract is 275 pages long,47 and the Los Angeles teachers’ contract is 350 pages long.48 With each page of provisions come additional restrictions on district control over district policy.
The net impact of state teacher bargaining laws certainly appears substantial. Not only must districts engage in a costly and time-consuming bargaining process, but they also face restrictions on their management authority. Nevertheless, it is not entirely clear—as a theoretical matter—whether these burdens on districts lead to positive or negative outcomes for students. After all, are not smaller class sizes also good for students?49 Part II examines how past researchers have come to very different conclusions about the impact of teacher bargaining on student achievement.
i i . the nonempirical literature on teacher bargaining
Academics have come to two starkly different conclusions about the impact of teacher bargaining. Some insist that it does real damage to school systems.
43. Terry M. Moe, Collective Bargaining and the Performance of the Public Schools, 53 AM. J. POL. SCI. 156, 161, 168 (2009).
44. See id.
45. See Marguerite Roza & Paul T. Hill, How Within-District Spending Inequities Help Some Schools To Fail, in BROOKINGS PAPERS ON EDUCATION POLICY 201, 204, 216 (Diane Ravitch ed., 2004).
46. See Brill, supra note 10, at 34.
47. See COHEN ET AL., supra note 13, at 8.
48. See id. at 6.
49. But see Jepsen & Rivkin, supra note 20 (finding that large reductions in class size reduce teacher quality in schools with a high percentage of minority students).
the yale law journal 120: 1130 2 011
1140
Others insist with equal force that teacher bargaining is vital for progress and reform. A review of the theoretical arguments scholars have made shows not only the hotly contested nature of this issue but also the need for reliable empirical work in this area. Empirical research has the potential to clarify an academic debate in ways that theory alone cannot.
A. The “Teachers’ Unions Are Terrible” Arguments
Critics of teachers’ unions typically make two types of arguments. The first asserts that the collective bargaining process makes effective school management impossible because it ties the hands of district administrators. Scholars have criticized, for example, the different forms of job protection that emerge from collective bargaining agreements.50 District leaders cannot run an effective school system, the argument goes, if they cannot remove low performers. Other scholars focus on the influence of collective bargaining on district finances.51 Contracts typically peg salary increases to seniority, limit the ability of management to remove teachers, and require districts to hire additional teachers before allowing the number of students in a given class to exceed a fixed number.52 This combination of contract provisions has the potential to bury schools under the cost of employing an unreasonably large and intractable workforce.
One writer takes this first argument a step further and argues that collective bargaining exacerbates the inequalities that exist between high-performing and low-performing districts.53 Under most collective bargaining agreements, seniority plays a central role in certain teacher hiring decisions.54 When a
50. See, e.g., Richard D. Kahlenberg, The History of Collective Bargaining Among Teachers, in COLLECTIVE BARGAINING IN EDUCATION, supra note 11, at 7, 18 (noting that in Florida, 0.05% of public school teachers were dismissed involuntarily while 7.9% of the general workforce was dismissed involuntarily); see also Lala Carr Steelman, Brian Powell & Robert M. Carini, Do Teacher Unions Hinder Educational Performance? Lessons Learned from State SAT and ACT Scores, 70 HARV. EDUC. REV. 437, 441 (2000) (citing academic work arguing that teachers’ unions “protect ineffective workers”).
51. See Hill, supra note 11, at 91-92, 94; Steelman, Powell & Carini, supra note 50, at 441 (citing academic work arguing that teachers’ unions “unnecessarily drive up costs [for school systems]”).
52. See Hill, supra note 11, at 91-92, 94.
53. Id. at 94-95, 102-03.
54. See id. at 94-95; see also NAT’L COUNCIL ON TEACHER QUALITY, BUMPING HR: GIVING
PRINCIPALS MORE SAY OVER STAFFING 4-5, 7-8 (2010), available at http://www.nctq.org/ tr3/docs/nctq_site_based_hiring.pdf (describing the significant role that seniority plays in
the impact of teacher collective bargaining
1141
principal has in mind a teacher that she would like to hire who is not the most senior teacher in the pool, the principal has an incentive to delay posting the position in the hopes that the senior teacher will take a position elsewhere. Because suburban schools often post vacancies earlier in the year, the principal’s strategic behavior facilitates the drift of skilled teachers away from struggling districts toward higher-performing ones.55 In addition, collective bargaining may actually facilitate a wealth transfer away from low-performing districts. Were each school’s budget to reflect only the cost of its own teachers, low-poverty schools (with better, more experienced teachers) would pay more for their staff than high-poverty schools. Rather than requiring low-poverty schools to bear this cost, collective bargaining agreements often force school budgets to account for the average cost of a teacher in the district. Thus, low-poverty schools pay less than they otherwise would, while high-poverty schools pay more than they otherwise would.56
A second type of argument insists that teacher collective bargaining distorts the democratic accountability of public school systems.57 Contrast the tactics available to unions in the private sector with the tactics available to unions in the public sector. In the case of the private sector, unions exert influence on management primarily through the collective bargaining process. In the case of the public sector, unions can also pressure management at the polls: if a teachers’ union does not like a set of district policies, it can vote the party on the other side of the bargaining table out of office.58 Teachers’ unions exert
districts with collective bargaining agreements, specifically when teachers are “excessed” or when teachers request a transfer between schools).
55. See Hill, supra note 11, at 94-95.
56. See id. at 102-03.
57. See, e.g., Frederick M. Hess & Andrew P. Kelly, Scapegoat, Albatross, or What? The Status Quo in Teacher Collective Bargaining, in COLLECTIVE BARGAINING IN EDUCATION, supra note 11, at 53, 65; Terry M. Moe, Union Power and the Education of Children, in COLLECTIVE BARGAINING
IN EDUCATION, supra note 11, at 229, 233; Robert L. Green & Bradley R. Carl, A Reform for Troubled Times: Takeovers of Urban Schools, 569 ANNALS AM. ACAD. POL. & SOC. SCI. 56, 59 (2000).
58. See, e.g., Frederick M. Hess & Andrew P. Kelly, supra note 57, in COLLECTIVE BARGAINING IN
EDUCATION, supra note 11, at 53, 65 (noting that management bargains “in a delicate position” because it “works for school board members who have good reason to avoid labor-management conflict”); Ben Fischer, CPS Teacher Transitions to Union Chief, CINCINNATI
ENQUIRER, May 10, 2009, at B3 (describing the Cincinnati Federation of Teachers as “kingmaker in school board elections”); see also Ben Smith, Teachers Union Helped Unseat Fenty, POLITICO (Sept. 15, 2010, 10:40 PM), http://www.politico.com/blogs/bensmith/ 0910/Teachers_union_helped_unseat_Fenty.html (describing how the American Federation of Teachers “spent roughly $1 million” to defeat then-Mayor Adrian Fenty in an effort “to put the brakes on his aggressive efforts to shake up the city’s schools system”).
the yale law journal 120: 1130 2 011
1142
enormous influence in local elections,59 and this influence should worry those that want elected school boards to respond to more than one constituency.60 To the extent that school boards should reflect the educational priorities of other groups—of parents, students, community groups, or even the business community—union power threatens a key democratic institution.
The literature criticizing teachers’ unions thus suggests several ways in which union activity may negatively impact student achievement. Collective bargaining may reduce teacher quality (through excessive job protections and circumscribed hiring rights), sap financial resources from a district (through increased spending on teacher salaries), or subvert the oversight of a school board that should reflect broader sets of values.
59. See sources cited supra note 58.
60. Individual Justices and the Court as a whole have praised local school boards for their ability to reflect community values and ensure democratic accountability in the public school context. See, e.g., Bd. of Educ. v. Pico, 457 U.S. 853, 894 (1982) (Powell J., dissenting) (“School boards are uniquely local and democratic institutions . . . . [T]he governance of [public schools] traditionally has been placed in the hands of a local board, responsible locally to the parents and citizens of school districts. Through parent-teacher associations [PTAs], and even less formal arrangements that vary with schools, parents are informed and often may influence decisions of the board.”); Ingraham v. Wright, 430 U.S. 651, 670 (1977) (basing its holding that the Eighth Amendment does not prohibit corporal punishment in public schools in part on “[t]he openness of the public school and its supervision by the community”); San Antonio Indep. Sch. Dist. v. Rodriguez, 411 U.S. 1, 50 (1973) (“Each locality is free to tailor local programs to local needs. . . . No area of social concern stands to profit more from a multiplicity of viewpoints and from a diversity of approaches than does public education.”).
Several scholars and practitioners have praised local school boards for similar reasons. See, e.g., DONALD R. MCADAMS, WHAT SCHOOL BOARDS CAN DO 9 (2006) (“[B]oard members are usually expected to pay close attention to parents and other constituents and have the final say on district policies. By design, legislatures have placed school districts as close as possible to the people they serve.”); Bernard W. Bell, Marbury v. Madison and the Madisonian Vision, 72 GEO. WASH. L. REV. 197, 232 (2003) (cataloguing articles where scholars have argued that “the most effective democracy occurs at local levels of government”); James C. Denver III, Note, Tinker Revisited: Fraser v. Bethel School District and Regulation of Speech in the Public Schools, 1985 DUKE L.J. 1164, 1186 (“Once elected, the school board, through parent-teacher organizations, is more informed and aware of the community’s values than any other governmental agency.”). For further discussion of this argument and for an exposition of the counterargument that teacher collective bargaining actually increases democratic accountability, see Martin H. Malin, Public Employees’ Right To Strike: Law and Experience, 26 U. MICH. J.L. REFORM 313, 318-20 (1993).
the impact of teacher collective bargaining
1143
B. The “Teachers’ Unions Are Vital” Arguments
Other writers have argued that collective bargaining by teachers improves the performance of school systems. These arguments tend to fall into one of three categories. The first set of arguments claims that teachers’ unions preserve a basic level of dignity for teachers, which enables them to perform their jobs more effectively.61 Historians of teachers’ unions point to the fact that early teacher strikes won basic dignities like having a lunch break (free from supervisory duties), not having to provide a doctor’s note when sick, and avoiding “noneducational tasks like bathroom supervision.”62 When teachers are treated more like professionals, the argument goes, they bring a heightened level of care and responsibility to their work, which benefits the entire system.
The second set of arguments might be called the “what’s good for teachers is good for students” arguments. These writers point to collective bargaining agreements that create more preparation time for teachers, smaller class sizes, and tougher student discipline policies.63 Satisfied teachers also tend to remain in positions longer, accruing valuable experience and passing a benefit along to students in the form of improved instruction.64 Here, an alignment of incentives allows teachers pursuing their own self-interest to improve the quality of education that students receive.
The third set argues that teachers’ unions have themselves been the primary advocates of school reform.65 Writers in this camp praise what they call “reform bargaining”66 and point to pressure that teachers’ unions have put on districts to adopt mentor programs,67 peer-review procedures,68 higher academic standards,69 a longer school year,70 and even some forms of public
61. See Kahlenberg, supra note 50, at 11 (describing early union leaders’ claim that “collective bargaining was essential to getting administrators to treat teachers like true professionals”).
62. Id. at 13, 17.
63. See id. at 17; see also Steelman, Powell & Carini, supra note 50, at 442 (citing various sources that make these arguments).
64. See Steelman, Powell & Carini, supra note 50, at 441.
65. See Susan Moore Johnson & Susan M. Kardos, Reform Bargaining and Its Promise for School Improvement, in CONFLICTING MISSIONS? TEACHERS UNIONS AND EDUCATIONAL REFORM 7 (Tom Loveless ed., 2000).
66. Id. at 8.
67. See id. at 33.
68. See Kahlenberg, supra note 50, at 20.
69. See id. at 21.
70. See Johnson & Kardos, supra note 65, at 25.
the yale law journal 120: 1130 2 011
1144
school choice.71 According to this line of argument, teachers’ unions actually push for important reforms in districts that might not otherwise consider them.
The “teachers’ unions are vital” arguments thus suggest an entirely different set of causal pathways through which teacher collective bargaining might operate. Here, collective bargaining brings dignity to the teaching profession, allows teachers to pursue their own self-interest in ways that benefit students, and permits teachers to take the lead in pushing reform.
i i i . the empirical literature on teacher bargaining
Unfortunately, the existing empirical literature on teachers’ unions is of little use in resolving these disagreements. Although many published empirical studies of the impact of teacher collective bargaining exist, virtually all of them suffer from the same set of methodological flaws. This Part explains what these flaws are and shows how they undermine the conclusions that most studies reach.
A. Cross-Sectional Comparisons and Endogeneity Problems
How might a researcher determine whether teacher collective bargaining has a positive or negative impact on student outcomes? The most basic approach involves cross-sectional regression techniques.72 A Harvard
71. See Kahlenberg, supra note 50, at 21. It is worth noting that there may be serious legal problems with “reform bargaining” should its advocates push this model too vigorously. State collective bargaining laws typically give properly recognized teachers’ unions the right to bargain over “terms and conditions of employment,” but state courts recognize that many of the most important decisions that affect a given school system belong, as a matter of public policy, to the publicly elected school board. See Martin H. Malin & Charles Taylor Kerchner, Charter Schools and Collective Bargaining: Compatible Marriage or Illegitimate Relationship?, 30 HARV. J.L. & PUB. POL’Y 885, 913-14 (2007). Such decisions are, according to state courts, outside the scope of what constitutes a “condition of employment.” See, e.g., Racine Educ. Ass’n v. Wis. Emp’t Relations Comm’n, 571 N.W.2d 887 (Wis. Ct. App. 1997) (holding that the school calendar was not a mandatory subject of collective bargaining under the state’s teacher collective bargaining statute); see also Malin & Kerchner, supra, at 915-17 (discussing this case and others). Given these limits on the scope of collective bargaining under state law, the prospects for reform bargaining may be rather narrow.
72. Cross-sectional regressions rely on data that have been collected at a single point in time. See JEFFREY M. WOOLDRIDGE, INTRODUCTORY ECONOMETRICS: A MODERN APPROACH 861 (3d ed. 2006). For cross-sectional studies of teacher bargaining, see F. HOWARD NELSON &
MICHAEL ROSEN, INST. FOR WISCONSIN’S FUTURE, ARE TEACHERS’ UNIONS HURTING
AMERICAN EDUCATION? A STATE-BY-STATE ANALYSIS OF THE IMPACT OF COLLECTIVE
the impact of teacher collective bargaining
1145
Educational Review study from 2000,73 for example, regressed the state average SAT and ACT scores from 1993 on the percentage of teachers in each state under a collective bargaining agreement and a set of control variables.74 They found that teacher collective bargaining was positively correlated with improvements in SAT scores, holding constant the control variables in their model.75
The major problem with cross-sectional analysis is that one cannot infer causation unless one has controlled for all possibly relevant variables. If researchers omit a variable from their model that (1) has an effect on the dependent variable and (2) is correlated with the independent variable of interest, the regression will yield biased results.76 In the Harvard Educational
BARGAINING AMONG TEACHERS ON STUDENT PERFORMANCE (1996); Randall W. Eberts, Union Effects on Teacher Productivity, 37 INDUS. & LAB. REL. REV. 346 (1984); Paul W. Grimes & Charles A. Register, Teachers’ Unions and Student Achievement in High School Economics, 21 J. ECON. EDUC. 297 (1990); and Steelman, Powell & Carini, supra note 50.
For my purposes, I treat four additional studies as cross-sectional ones. See Randall W. Eberts & Joe A. Stone, Teacher Unions and the Productivity of Public Schools, 40 INDUS. & LAB. REL. REV. 354 (1987); Michael M. Kurth, Teachers’ Unions and Excellence in Education: An Analysis of the Decline in SAT Scores, 8 J. LAB. RES. 351 (1987); Martin Milkman, Teachers’ Unions, Productivity, and Minority Student Achievement, 18 J. LAB. RES. 137 (1997); Moe, supra note 43. Their classification as cross-sectional studies is not immediately apparent because each study uses a dependent variable that captures growth over time. See, e.g., Eberts & Stone, supra, at 356 (measuring change in students’ math scores); Kurth, supra, at 358 (measuring change in state average SAT scores). Critically, however, these authors only observe their key independent variable (that is, their measure of union activity) at a single point in time. See Eberts & Stone, supra, at 355-57; Kurth, supra, at 365; Moe, supra note 43, at 161-62. Milkman does not make this fact explicit in his study, but one can infer it from his consistent references to “union schools” and “nonunion schools.” See Milkman, supra, at 138, 141 tbl.1, 143. Because they lack variation across time in their independent variable, the authors cannot employ a “fixed effects” model, and they do not attempt an “instrumental variable” model. See infra Section III.B. These studies are therefore subject to the common set of endogeneity concerns that this Section develops.
73. Steelman, Powell & Carini, supra note 50.
74. Regression analysis will separate the effect of the key independent variable on the dependent variable from the effects of the control variables on the dependent variable. For an introduction to regressions and control variables, see WOOLDRIDGE, supra note 72, at 23-64. The Harvard Educational Review study included controls for the percentage of minority test-takers in each state, parental education, parental income, percentage of students taking the test in each state, and several other factors. Steelman, Powell & Carini, supra note 50, at 446 tbl.1.
75. See Steelman, Powell & Carini, supra note 50, at 449 tbl.2.
76. See WOOLDRIDGE, supra note 72, at 95-98. Note that omitting variables that influence the dependent variable and are not correlated with the independent variable of interest will not lead to biased estimates. See id. at 96. Thus, the Harvard Educational Review study need not have controlled for every possible variable that could affect state SAT scores, but, to
the yale law journal 120: 1130 2 011
1146
Review study, for example, the researchers used no control variables for the salaries of teachers in each state.77 Systems with lower teacher salaries presumably attract lower-quality teachers, who in turn produce students who perform worse on the SATs. However, teachers in those systems may either be more likely to unionize (to protect themselves from salary cuts) or less likely to unionize (if small salaries make them unwilling to pay union dues). Without a full set of controls, one cannot isolate the effect of teacher bargaining.
These omitted-variable concerns have, in general, led empirical scholars to distrust cross-sectional regression as a tool for identifying causal estimates.78 Economists call these concerns endogeneity problems. Variation in an independent variable is endogenous if one cannot determine its source, and one runs the risk of producing biased estimates.79 Unfortunately, virtually all of the empirical work on the impact of teacher collective bargaining comes from cross-sectional regressions that suffer from these very problems. Some of these studies find that collective bargaining has a positive effect on student achievement.80 Others find a negative impact.81 Because one cannot be sure that any of these studies controls for all potentially relevant variables, the competing findings of these studies manage to fuel both sides of the debate without providing much reliable information.
eliminate bias, it must have controlled for every possible variable that affects state SAT scores and that is also correlated with the strength of collective bargaining in that state.
77. Steelman, Powell & Carini, supra note 50, at 446 tbl.1.
78. See, e.g., WOOLDRIDGE, supra note 72, at 13-14 (describing cross-sectional data and the difficulty of making causal inferences); Moe, supra note 43, at 162-63 (noting that “[e]ndogeneity bias is always a concern” in cross-sectional models and noting that his controls are “quite extensive”).
79. See WOOLDRIDGE, supra note 72, at 862 (defining “endogenous explanatory variable”).
80. See NELSON & ROSEN, supra note 72; Morris M. Kleiner & Daniel L. Petree, Unionism and Licensing of Public School Teachers: Impact on Wages and Educational Output, in WHEN PUBLIC
SECTOR WORKERS UNIONIZE 305 (Richard B. Freeman & Casey Ichniowski eds., 1988); Eberts, supra note 72; Eberts & Stone, supra note 72; Grimes & Register, supra note 72; Milkman, supra note 72; Steelman, Powell & Carini, supra note 50.
81. See Caroline Minter Hoxby, How Teachers’ Unions Affect Education Production, 111 Q.J. ECON. 671 (1996); Kurth, supra note 72; Moe, supra note 43; Sam Peltzman, Political Economy of Public Education: Non-College-Bound Students, 39 J.L. & ECON. 73 (1996). Professor Moe’s study in the American Journal of Political Science is the most recent empirical analysis of teacher collective bargaining. Although Professor Moe’s study includes many compelling control variables, his study still struggles to rule out all endogeneity concerns. He lacks a control, for example, for the quality of administrators in a given school district: if harsh or micromanaging superintendents tend to lead to strong unions with expansive collective bargaining agreements, and if the same types of administrators are associated with higher (or lower) student test scores, Professor Moe’s estimates will be biased.
the impact of teacher collective bargaining
1147
The challenge is to find empirical methods that avoid these endogeneity problems. The next Section reviews the ways in which some scholars have tried to do so.
B. Panel Data and Instrumental Variable Approaches
A first method of dealing with endogeneity makes use of “panel” (or “longitudinal”) data.82 Panel data regressions require information about entities at multiple points in time. The key advantage of panel data is a researcher’s ability to control for “fixed effects”83 and “time trends.”84 A fixed effect is a control variable that captures any unobserved quality that is constant over time and that potentially influences the dependent variable.85 For example, if the Harvard Educational Review study had observations on states in multiple years, inclusion of state fixed effects in the model would control for differences in teacher salaries across states (so long as those salaries are constant over time).86 A time trend is a control variable that captures any nonconstant, unobserved quality, so long as it changes linearly over time.87 For example, if the underlying demographics of a region are changing, so long as these shifts are roughly linear, a time trend will control for any influence they have on the dependent variable.
Professors Morris Kleiner and Daniel Petree have published the only panel data study of teacher collective bargaining.88 They obtained state average SAT scores and dropout rates in multiple years and matched that data with the percent of teachers in each state who operate under a collective bargaining
82. See WOOLDRIDGE, supra note 72, at 448-49 (defining panel data); Kleiner & Petree, supra note 80, at 308 (discussing authors’ use of longitudinal data to measure the impact of teachers’ unionization).
83. See Ian Ayres & John J. Donohue III, Shooting Down the “More Guns, Less Crime” Hypothesis, 55 STAN. L. REV. 1193, 1200 (2002) (describing panel data with fixed effects analysis as “the current state-of-the-art technique of micro-econometric evaluation”).
84. See WOOLDRIDGE, supra note 72, at 366, 504 (defining a time trend and giving an example of a panel data regression model with a city-specific time trend).
85. See id. at 461-62.
86. The statement assumes that the percentage of teachers operating under a collective bargaining agreement in each state also changes. Without this variation in the independent variable of interest, one cannot use a fixed effects methodology. Note further that a fixed effects design allows the researchers to control for a factor like teacher salaries even though the researchers have no direct measure of this variable. The key advantage of fixed effects is the ability to control for unobserved differences across observations.
87. See supra note 84.
88. Kleiner & Petree, supra note 80.
the yale law journal 120: 1130 2 011
1148
agreement. Controlling for state and year fixed effects, they found that teacher collective bargaining has a positive effect on SAT scores and a negative effect on dropout rates (that is, fewer students appear to be dropping out).89 Although their study design avoids many of the problems identified with cross-sectional studies, their work ultimately suffers from a different problem. One result of the mathematics behind panel data regressions is that models tend to overstate the precision of their results.90 In other words, results that are in fact not statistically different from zero may appear to be statistically significant. More recently, econometricians have developed correction techniques for this problem,91 but because the Kleiner and Petree study was published before those techniques became common practice, it does not include them. Thus, one cannot determine from their study the true effect of teacher bargaining on student outcomes.
A second advancement over cross-sectional regression is the use of instrumental variables. An instrumental variable functions like a proxy for the independent variable of interest, but the proxy—unlike the variable of interest itself—remains uncorrelated with potential omitted variables.92 Professor Hoxby has published the only instrumental variable analysis of the impact of teacher collective bargaining.93 She uses as an instrumental variable the date on which states pass laws that either force districts to bargain with teachers’ unions (that is, laws that make a state a “mandatory” state) or force districts to meet with teachers’ unions (that is, laws that formalize a state’s status as a “permissive” state).94 She argues that the passage of such laws impact the dependent variable (here, state dropout rates) and that they do so only through the independent variable of interest (union activity).95
89. Id. at 313-14.
90. See Marianne Bertrand, Esther Duflo & Sendhil Mullainathan, How Much Should We Trust Differences-in-Differences Estimates?, 119 Q.J. ECON. 249 (2004).
91. See id.
92. For example, if one wants to measure the effect of skipping class on the final grades of college students, one might use the distance students live from campus as an instrumental variable. See WOOLDRIDGE, supra note 72, at 513-14. The number of days a student misses class is likely endogenous: fewer days in class likely reduces grades for many students, but some students may skip a class because they find that class too easy. Distance from campus may be a helpful instrument (1) because it likely affects the frequency with which students skip class and (2) because distance from campus may have no relationship with the other reasons why students skip class.
93. Hoxby, supra note 81.
94. See id. at 686.
95. See id. at 688.
the impact of teacher collective bargaining
1149
The Hoxby study is the most sophisticated in the empirical literature on teacher collective bargaining, but it raises at least two concerns. First, it is not clear that her instrument is a valid one. An instrument will produce biased results if the instrument is correlated with changes in the dependent variable that are not caused by changes in the endogenous independent variable.96 States may have passed teacher bargaining laws at the same time that they launched other education initiatives. They may, for example, have simultaneously changed the state academic curriculum. Because one cannot rule out the possibility that the instrument captures the effects of these other changes, one cannot be certain that her instrument is a valid one. Second, the study relies on very old data. The changes in state law that the author exploits occurred during the 1970s and 1980s,97 and policymakers might—with good reason—be more interested in a more contemporary assessment of the operation of teachers’ unions in school systems.
The methodological flaws in existing empirical research have led to conflicting (and unreliable) estimates of the impact of teacher bargaining on student outcomes. These conflicting estimates have in turn fueled both sides of the theoretical debates discussed in Part II. The next Part of this Note turns to a new methodological strategy—the natural experiment—and it shows how a previously unstudied set of legal changes in New Mexico lets one use this strategy to provide more reliable estimates of the impact of teacher bargaining on student outcomes.
iv. new mexico’s natural experiment
New Mexico is unique among all states because its teacher bargaining regime changed in the last two decades. The state passed its first public employee bargaining statute in 1992, which effectively made New Mexico a mandatory bargaining state.98 The legislature included in that law a sunset clause: the law would remain in effect from April 1, 1993, to July 1, 1999, unless a subsequent legislature reauthorized it.99 In 1999, New Mexico’s Republican
96. Return to the skipping-class example, discussed supra note 92. One might worry that a student’s distance from campus is correlated with the student’s final grade for a reason other than the number of classes a student misses. It might be the case, for example, that poorer students (who on average earn lower final grades) live farther away from campus (where housing may be less expensive). In this case, the instrument will not be valid.
97. Hoxby, supra note 81, at 684 tbl.2.
98. Public Employee Bargaining Act § 26, 1992 N.M. Laws 131, 157 (codified as amended at N.M. STAT. ANN. § 10-7E-26 (2010)).
99. Id. §§ 28, 30, 1992 N.M. Laws 159.
the yale law journal 120: 1130 2 011
1150
governor vetoed the legislature’s attempt to rereauthorize the statute.100 It was not until Governor Bill Richardson, a Democrat, took office in 2003 that the New Mexico legislature successfully passed a new version of the original bargaining law.101 Thus, while the collective bargaining regimes for teachers’ unions in other states remained largely static,102 New Mexico went from being a mandatory state (1993 to 1999) to being a permissive state (1999 to 2003) and then back again (2003 to present).
This set of legal changes permits the use of an estimation strategy that constitutes a significant improvement over past empirical work on the effects of teacher bargaining. The first Section explains this “natural experiment” methodology and how it has been used in other contexts. The remaining Sections present the Note’s empirical analysis. They describe the dataset, the specific regression models, and the core results.
100. See John Dendahl, With Richardson’s Help, Unions Regain Foothold, ALBUQUERQUE J., June 6, 2005, at A5 (describing Governor Gary Johnson’s veto of the 1999 reauthorization attempt).
101. Public Employee Bargaining Act § 26, 2003 N.M. Laws 38, 69 (codified at N.M. STAT. ANN. § 10-7E-26 (2010)). This version of the law became effective on July 1, 2003, and it contains no sunset clause.
There is at least one other potentially significant difference between the 1992 law and the 2003 law. The 2003 version of the bargaining statute gives either party the right to request binding arbitration should an impasse occur at the end of mediation. Compare id. § 18(B)(2), 2003 N.M. Laws at 62 (providing for binding arbitration), with Public Employee Bargaining Act § 18(B), 1992 N.M. Laws at 152 (providing for mediation and factfinding only). This difference does not undermine this Note’s analysis for two reasons. First, it is possible that the addition of an arbitration clause in 2003 would simply understate the Note’s findings. State legislatures have included arbitration provisions to limit the power of the union to make demands on the public employer. See Saltzman & Sperka, supra note 40, at 116-17 (describing how Michigan added a binding arbitration provision to its public-sector bargaining law to limit the power of certain public-sector unions). What my analysis captures in 2003, in other words, is the effect of a “watered-down version” of mandatory collective bargaining. Because I find that even this watered-down version leads to significant impacts on student outcomes, I can be reasonably confident that an “un-watered-down” version of collective bargaining would lead to impacts that are at least that large. Second, as an additional robustness check, I drop the observations from after 2002 and repeat the analysis (thereby estimating the effect of mandatory bargaining using the sunset only and not the reauthorization). See infra Section IV.E. The core results are robust to this change in specification (which removes those years where an arbitration clause was present).
102. Most states passed collective bargaining statutes between 1960 and 1990. See Hoxby, supra note 81, at 682-83, 684 tbl.2.
the impact of teacher collective bargaining
1151
A. Natural Experiment Studies
Natural experiments use legal changes as an exogenous source of variation, and in so doing they avoid many of the endogeneity problems associated with cross-sectional analyses.103 These studies typically compare an area affected by a legal change to an area unaffected by that legal change. Critically, natural experiments compare these two groups both before and after the legal change occurs. As a result, one can control for any constant unobservable differences across groups and (with more than two time periods) unobserved differences across groups that trend linearly.104 Researchers use a variety of terms to refer to natural experiments. When researchers have two groups and two time periods, they call this type of natural experiment a “difference-in-difference” design; when they have multiple groups in multiple time periods, they often use the terms “natural experiment” and “panel data with fixed effects” interchangeably.105 Researchers have used this methodology to study the effects of an increase in the minimum wage (when one state raised the minimum wage and an adjacent state did not),106 to study the effects of an increase in workers’ compensation benefits (when states raised their compensation benefits for some groups but not for others),107 and to study the
103. See WOOLDRIDGE, supra note 72, at 454-60; Bruce D. Meyer, Natural and Quasi-Experiments in Economics, 13 J. BUS. & ECON. STAT. 151 (1995). For a discussion of the potential endogeneity problems that remain, see infra Section IV.E.
104. Consider as an example Card & Krueger, supra note 20. In that study, the authors use an increase in New Jersey’s minimum wage law as a natural experiment. They compare the difference in employment in fast food restaurants between New Jersey and Pennsylvania before and after the increase in New Jersey’s minimum wage. When they subtract fast food employment rates in the two states before the legal change, they get the average difference in employment between the two states. When they subtract the same rates after the legal change, they get the average difference between the two states plus the effect of the legal change. When they subtract the first difference from the second difference, the average differences between the states cancel out, and they are left with the effect of the legal change alone. See also WOOLDRIDGE, supra note 72, at 454-60 (describing difference-in-difference methodology and referencing other examples of difference-in-difference studies).
105. The label “natural experiment” is still worthy of independent status because panel data regressions can analyze variation that comes from sources other than legal changes or policy shifts. See, e.g., Sanders Korenman & David Neumark, Does Marriage Really Make Men More Productive?, 26 J. HUM. RESOURCES 282 (1991) (using panel data to measure the effect of getting married on male wages).
106. Card & Krueger, supra note 20.
107. Bruce D. Meyer, W. Kip Viscusi & David L. Durbin, Workers’ Compensation and Injury Duration: Evidence from a Natural Experiment, 85 AM. ECON. REV. 322 (1995).
the yale law journal 120: 1130 2 011
1152
effects of employer-based hiring incentives (when some cities received funding for those incentives while others did not).108
In the case of the sunset (and reauthorization) of New Mexico’s bargaining law, one can compare student outcomes in New Mexico to student outcomes in other states before and after the two legal changes. Because this strategy allows for the inclusion of fixed effects and time trends, one worries far less about omitted variables. Further, by employing the precision adjustment techniques that the Kleiner and Petree study lacked, this analysis can provide more reliable estimates than past work. The natural experiment design should therefore produce estimates of the impact of teacher bargaining that are both unbiased and precise.
B. Data
The analysis requires a panel that includes data on New Mexico and other states in multiple years. The panel must cover a time period that starts a few years before the 1999 sunset and continues for a few years after the 2003 reinstatement. With these needs in mind, this Note uses three dependent variables that allow for comparisons across all fifty states (and the District of Columbia) in the relevant time period: state average SAT scores (SAT) for the years 1993 through 2007,109 state average freshman graduation rates (AFGR) for the years 1996 to 2005,110 and state average per-pupil expenditures (PPE) for the years 1993 to 2007.111
108. Leslie E. Papke, Tax Policy and Urban Development: Evidence from the Indiana Enterprise Zone Program, 54 J. PUB. ECON. 37 (1994).
109. The College Board’s website has made state-year-average SAT scores publicly available. See Archived SAT Data & Reports, C. BOARD, http://professionals.collegeboard.com/data -reports-research/sat/archived (expand any of the year hyperlinks; then follow “Tables & Related Items” hyperlink; then select “Table 3: Mean SAT I Verbal and Math Scores by State, with Changes for Selected Years”) (last visited Dec. 7, 2010).
110. States measure their graduation rates in different ways, and it is often difficult to make useful comparisons across states. AFGR is the graduation rate measure that the National Center for Education Statistics (NCES) recommends for cross-state, cross-time comparisons. NAT’L CTR. FOR EDUC. STATISTICS, 2 USER’S GUIDE TO COMPUTING HIGH
SCHOOL GRADUATION RATES, at iii (2006), available at http://nces.ed.gov/pubs2006/ 2006605.pdf. According to NCES, a state’s AFGR is
the number of graduates divided by the estimated count of freshmen 4 years earlier. The estimated averaged freshman enrollment count is the sum of the number of 8th-graders 5 years earlier, the number of 9th-graders 4 years earlier (because this is when current year seniors were freshmen), and the number of 10th-graders 3 years earlier, divided by 3.
the impact of teacher collective bargaining
1153
SAT scores make a useful dependent variable because one can easily compare them across states and because they are available in every year.112 SAT scores provide information about college-bound students only, but attention to graduation rates can provide information about the effect of teacher bargaining on lower-performing, non-college-bound students. Graduation rates, however, are a notoriously unreliable metric because states and municipalities have so much flexibility in defining who counts as a “dropout.”113 AFGR is a particular method for calculating graduation rates that avoids reliance on local definitions.114 One calculates AFGR for a given area by dividing the estimated number of high school graduates in that region for a given year by the number of students who were freshmen five years earlier.115 The U.S. Department of Education considers AFGR to be the most accurate way of measuring actual
MICHAEL PLANTY ET AL., NAT’L CTR. FOR EDUC. STATISTICS, THE CONDITION OF EDUCATION
2008, at 133 (2008), available at http://nces.ed.gov/pubs2008/2008031.pdf.
111. Data on per-pupil expenditures is available through the Census Bureau. Statistical Abstracts, U.S. CENSUS BUREAU, http://www.census.gov/prod/www/abs/statab.html (expand any of the year hyperlinks; then follow “Section 4. Education”) (last visited Nov. 3, 2010).
112. The availability of SAT data in every year makes this dependent variable a stronger candidate than using state scores on the National Assessment of Education Progress (NAEP). The NAEP is a federally administered test in reading and math that is given to a representative sample of fourth and eighth graders every two years. NAEP Overview, NAT’L CTR. FOR EDUC. STATISTICS, http://nces.ed.gov/nationsreportcard/about/ (last visited Nov. 3, 2010). Although the NAEP is more representative than the SAT (because only college-bound students take the latter), prior to the 2001 No Child Left Behind (NCLB) Act, NAEP testing was optional for states, and even after the NCLB Act, states take the NAEP every two years. See Catherine M. Hombo, NAEP and No Child Left Behind: Technical Challenges and Practical Solutions, 42 THEORY INTO PRAC. 59 (2003) (describing the changes in NAEP participation that NCLB requires); NAEP History of State Participation, 1990-1998: Public Schools, NAT’L CTR. FOR EDUC. STATISTICS, http://nces.ed.gov/nationsreportcard/about/ statehistorypublic.asp (last visited Dec. 7, 2010) (showing state participation between 1990 and 1998). Use of SAT scores thus provides more observations than use of the NAEP, and the higher the number of observations, the greater the precision of the analysis. See WOOLDRIDGE, supra note 72, at 101-02.
113. See, e.g., Michael Dobbs, States’ Graduation Data Criticized: Independent Study Shows Disparities, WASH. POST, June 24, 2005, at A3. In North Carolina, for example, the state recently boasted of a ninety-seven percent graduation rate when a third of students dropped out of high school and when nearly fifty percent of all African-American students dropped out of high school. How can such a high “graduation rate” coexist with these staggering dropout rates? The state had defined its graduation rate as the percent of high school graduates who received their diplomas in four or fewer years. In other words, the state effectively defined “graduation rate” in a way that ignored actual high school dropouts. Id.
114. See supra note 110.
115. See supra note 110.
the yale law journal 120: 1130 2 011
1154
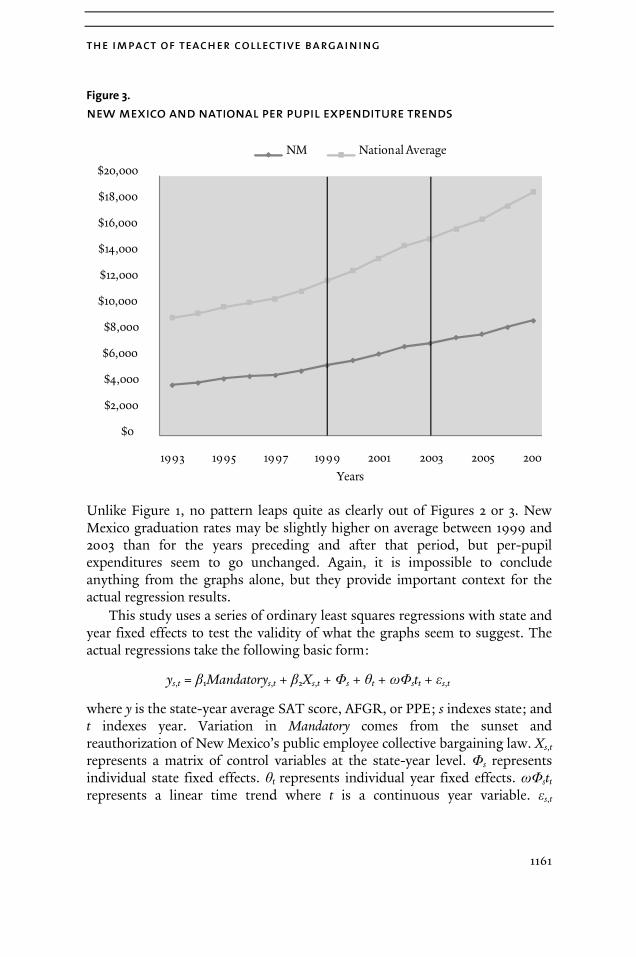
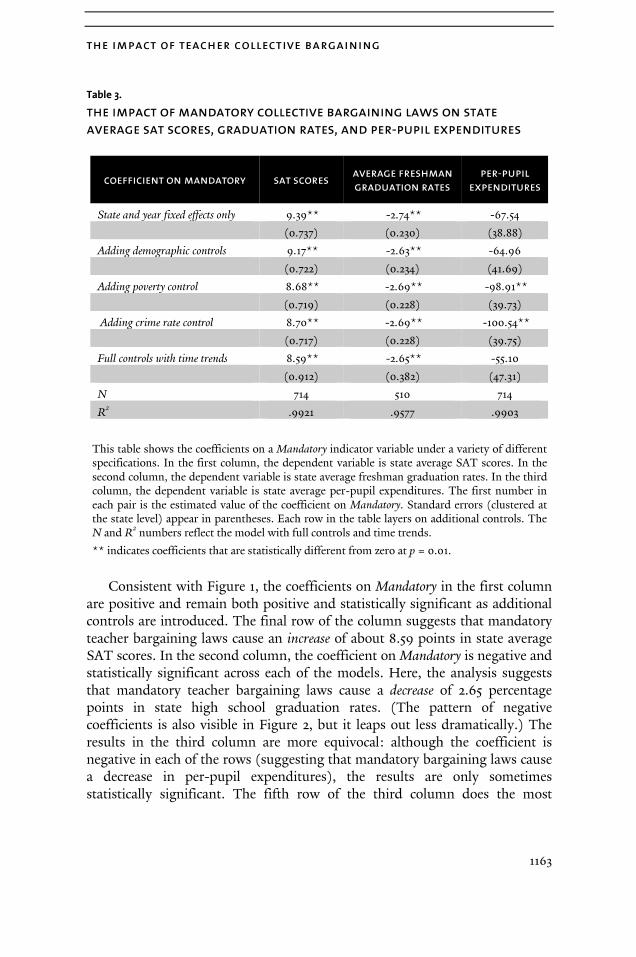
dropout rates across regions.116 The analysis includes PPE as the third dependent variable to see if teacher bargaining significantly increases (or decreases) district expenses.117 If teachers’ unions force districts to spend more than they otherwise would (as some critics have suggested),118 one should observe an increase in PPE associated with teacher bargaining.
The use of state average data makes states themselves the unit of analysis. This choice has the disadvantage of limiting the total number of observations in the dataset and precluding more nuanced analysis. If individual school district averages (or individual student scores) were available, one could detect the effects of teacher bargaining with more precision and explore whether the legal shifts affected different groups in different ways. However, because more granular data are not available, the analysis has to occur at the state level. Even here, however, one finds strong evidence that teacher bargaining affects student achievement.
The key independent variable in the analysis is an indicator variable for a state’s legal status. This variable Mandatory is equal to one if the state in the given year had a mandatory teacher bargaining regime (and equal to zero otherwise).119 The coding of Mandatory is based on the relevant statute or case law in each jurisdiction.120 As Table 1 illustrates, between 1993 and 2007, the only change in Mandatory comes from the sunset and reauthorization of New Mexico’s teacher bargaining law.
116. See supra note 110.
117. See Common Core of Data (CCD)-State Fiscal Reports, NAT’L CTR. FOR EDUC. STATISTICS, http://nces.ed.gov/ccd/pub_rev_exp.asp (last visited Nov. 3, 2010).
118. See supra Section II.A.
119. See supra Part I.
120. The website for the National Council on Teacher Quality contains links to the relevant state code provisions and the relevant state cases. See Teacher Rules, Roles and Rights: Scope of Bargaining, supra note 12. For a complete list of states and their bargaining regimes, see infra Appendix B.
the impact of teacher collective bargaining
1155
Table 1.
state laws governing the collective bargaining of public school teachers
number of states
1993 to 1999
Mandatory 35
Permissive 11
Right-To-Work 5
1999 to 2003
Mandatory 34
Permissive 10
Right-To-Work 5
2003 onward
Mandatory 35
Permissive 11
Right-To-Work 5
Mandatory states have passed statutes that require school districts to bargain with an official union bargaining agent once more than 50% of the teachers in a given district have voted to unionize. “Permissive” states (either by statute or by court ruling) allow districts to bargain with a union representative at their discretion. “Right-to-work” states expressly forbid bargaining with union representatives in public schools by statute. States have been coded following the National Council on Teacher Quality’s website, cited supra note 12.
Note that states where Mandatory is equal to zero could be permissive or right-to-work states. Any differences between permissive and right-to-work states, however, will be captured in the state-specific fixed effects terms because the bargaining regime of all other states remained constant over the course of the data set.121
In addition to the dependent variables (SAT, AFGR, and PPE) and the key independent variable (Mandatory), the dataset needs to include enough control variables to account for other factors that could influence student achievement. Fixed effects and time trends on their own control for a great deal: the model will control for any constant differences across states and any linear trends. Still, there may be some state-specific changes that are correlated with student
121. See infra Section IV.C.
the yale law journal 120: 1130 2 011
1156
achievement that do not trend in a linear fashion. For this reason, the data include controls for three factors that appear to influence student achievement and that may change rapidly: state racial composition,122 state poverty rates,123 and state crime rates.124 Research suggests that each of these factors is correlated with student achievement and can shift suddenly over time.125
122. Data on demographic composition of states by year are publicly available through the Center for Disease Control’s Wide-Ranging Online Data for Epidemiologic Research (CDC WONDER). Population Information, CDC WONDER, http://wonder.cdc.gov/ population.html (last visited Apr. 1, 2010). For evidence that race is strongly correlated with student academic performance, see, for example, Jaekyung Lee, Racial and Ethnic Achievement Gap Trends: Reversing the Progress Toward Equity?, 31 EDUC. RESEARCHER 3, 6 fig.3 (2002), which shows persistent gaps between the performance of white and black students over time and persistent gaps between the performance of white and Hispanic students over time. Reports of sudden shifts in ethnic patterns across states are common. See, e.g., Juliet Eilperin, Pa. House Candidates Vie for Agricultural Correctness, WASH. POST, Aug. 11, 2002, at A6 (“The DNC is focusing on 15 states, most of which have experienced dramatic increases in the growth of their Hispanic populations.”); Ian Shapira, Rise in Latino Enrollment Is Slowing, WASH. POST, Nov. 4, 2007, at W1 (“[T]he school system numbers indicate that the dramatic increase in the county’s Hispanic population has slowed considerably.”); Mark Sundeen, The Big-Sky Dem, N.Y. TIMES., Oct. 8, 2006, § 6 (Magazine) at 36 (“In Nevada, Arizona, and Colorado, a sharp rise in the Hispanic population in the last decade may also have helped tilt the voting base to the left.”).
123. The U.S. Census Bureau makes poverty statistics available for all states in most recent years. See Small Area Income and Poverty Estimates, U.S. CENSUS BUREAU, http://www.census.gov/did/www/saipe/county.html (last visited Nov. 3, 2010) (offering data from 1993 through 2008 but missing data on 1994). Poverty is also strongly linked with student achievement and subject to rapid changes over time. See, e.g., Jeanne Brooks-Gunn & Greg J. Duncan, The Effects of Poverty on Children, FUTURE CHILD., Summer/Fall 1997, at 55 (1997) (“[H]undreds of studies have documented the association between family poverty and children’s health, achievement, and behavior . . . .”); Editorial, Focus on Kids, STAR-LEDGER (Newark, N.J.), July 17, 1998, at 28 (“A report by the National Center for Children in Poverty at Columbia University found every region had sharp increases and significant drops [in poverty rates]. In our area, New York saw an increase of more than 20 percent, but New Jersey experienced a decline.”).
124. The U.S. Census Bureau has made crime statistics publicly available for each state in most years. See Statistical Abstract of the United States, U.S. CENSUS BUREAU, http://www.census.gov/compendia/statab/past_years.html (follow any year hyperlink; then follow “Section 5. Law Enforcement, Courts, and Prisons” hyperlink). Some empirical work suggests that exposure to crime may itself influence student achievement. See Natasha K. Bowen & Gary L. Bowen, Effects of Crime and Violence in Neighborhoods and Schools on the School Behavior and Performance of Adolescents, 14 J. ADOLESCENT RES. 319, 319 (1999) (“Measures of neighborhood and school danger both contributed significantly to the prediction of each school outcome . . . .”).
125. See supra notes 122-124. The dataset lacks a control for the percentage of students in each state that took the SATs each year. For a discussion of how the lack of such a control does not undermine this Note’s analysis, see infra Section IV.E.
the impact of teacher collective bargaining
1157
Table 2 shows summary statistics for the complete dataset. The first column presents summary statistics for New Mexico between 1993 and 2007; the second presents summary statistics for the rest of the United States during the same time period.
The Table shows that New Mexico differs from the rest of the United States along several dimensions. Its average SAT scores tend to be higher than other states. Its graduation rates tend to be lower; its Hispanic population is significantly higher. The standard deviations are also significantly larger for the rest of the United States than they are for New Mexico, but this fact should not be surprising. The second column includes all other states in the country, and one should expect more variation across all of those states than within New Mexico.126 Although it might be more desirable to study a state that matches the characteristics of other states more closely than New Mexico does, the legal changes in New Mexico are entirely unique. As a result, New Mexico appears to be the only state where this type of analysis is possible.
126. A final note concerns the number of observations in Table II. The National Council of Education Statistics has only made AFGR measures available between 1996 and 2005. See Common Core of Data (CCD)-State Fiscal Reports, supra note 117. Similarly, the U.S. Census Bureau is missing poverty data for the year 1994. See Small Area Income and Poverty Estimates, supra note 123. These missing data should not be a concern because the figures are missing for all states in the relevant years; it would be a different matter if the missing data were systematically related to the legal changes we were trying to measure. See WOOLDRIDGE, supra note 72, at 492-93.
the yale law journal 120: 1130 2 011
1158
Table 2.
summary statistics (all states, 1993-2007)
new mexico other states combined
Average SAT Score (Verbal + Math) 1098.27 1064.60
(6.09) (68.59)
Average Freshman Graduation Rate (%) 64.46† 73.93†
(1.94) (7.82)
Expenditures per Pupil ($) 6062.12 7119.06
(1625.55) (2193.59)
White Population (thousands) 832.02 3930.21
(11.22) (3532.44)
African-American Population
(thousands) 37.09 697.37
(4.98) (806.63)
Hispanic Population (thousands) 764.01 693.50
(70.16) (181.46)
“Other” Population (thousands) 182.78 268.62
(15.80) (611.03)
Percent Below Poverty Line 18.64† 12.35†
(1.37) (3.21)
Crimes per 100,000 People 5625.53 4359.98
(858.58) (1931.62)
N 15 750
This Table shows summary statistics for the full dataset. The “New Mexico” column shows the averages of aggregate state figures for the years 1993 to 2007 (with standard deviations in parentheses). The “Other States Combined” column shows the same figures for the rest of the United States in the same time period (including the District of Columbia but not including New Mexico).
† indicates that certain variables are missing data in certain years: the National Council of Education Statistics has only made AFGR available between the years 1996 to 2005, and the U.S. Census Bureau has not released poverty statistics for 1994.
C. Econometric Models
Before running a single regression, it is useful to plot the performance of New Mexico’s students on the SATs relative to the national average. Figure 1 shows New Mexico’s average SAT scores for the years 1993 through 2007 plotted against the national average (excluding New Mexico) for the same time period.
the impact of teacher collective bargaining
1159
Figure 1.
new mexico and national sat score trends
The vertical lines represent the two significant legal changes in New Mexico, the first representing the sunset of the original public employee collective bargaining law and the second representing the law’s reinstatement. Two features of this graph should be apparent immediately. First, relative to the rest of the United States, New Mexico’s scores appear to dip when the law sunsets. Second, the state’s scores rise again once the law was back on the books. Of course, it is impossible to conclude anything from the graph alone. The changes in the New Mexico scores could be driven by something else that happened in 1999 and in 2003. The regressions will try to control for as many other things that also could have happened in those years as possible (for example, shifts in state demographics). If state SAT scores are in fact moving with these legal changes, then the regression results should confirm what this graph visually suggests. This figure also helps provide the intuition behind the need for state and year fixed effects: one needs a way of controlling for the fact that New Mexico always seems to score above the national average (state fixed effects) and a way of controlling for the fact that the rest of the country as a whole seems to be trending upward (state-year time trends).
1010
1020
1030
1040
1050
1060
1070
1080
1090
1100
1110
1120
1993 1995 1997 1999 2001 2003 2005 2007
Years
NM National Average
the yale law journal 120: 1130 2 011
1160
Figures 2 and 3 plot New Mexico’s AFGR and per-pupil expenditures against the national average for the same years.
Figure 2.
new mexico and national afgr trends
0.00
10.00
20.00
30.00
40.00
50.00
60.00
70.00
80.00
90.00
100.00
1996 1997 1998 1999 2000 2001 2002 2003 2004 2005
Years
NM National Average
the impact of teacher collective bargaining
1161
Figure 3.
new mexico and national per pupil expenditure trends
Unlike Figure 1, no pattern leaps quite as clearly out of Figures 2 or 3. New Mexico graduation rates may be slightly higher on average between 1999 and 2003 than for the years preceding and after that period, but per-pupil expenditures seem to go unchanged. Again, it is impossible to conclude anything from the graphs alone, but they provide important context for the actual regression results.
This study uses a series of ordinary least squares regressions with state and year fixed effects to test the validity of what the graphs seem to suggest. The actual regressions take the following basic form:
where y is the state-year average SAT score, AFGR, or PPE; s indexes state; and t indexes year. Variation in Mandatory comes from the sunset and reauthorization of New Mexico’s public employee collective bargaining law. Xs,t represents a matrix of control variables at the state-year level. Φs represents individual state fixed effects. θt represents individual year fixed effects. ωΦstt represents a linear time trend where t is a continuous year variable. εs,t
$0
$2,000
$4,000
$6,000
$8,000
$10,000
$12,000
$14,000
$16,000
$18,000
$20,000
1993 1995 1997 1999 2001 2003 2005 2007
Years
NM National Average
the yale law journal 120: 1130 2 011
1162
represents a random error term. To avoid the precision problem of the Kleiner and Petree study, the analysis that follows clusters standard errors at the state level to account for possible serial correlation.127
D. Results
Table 3 presents the basic results of this analysis. It shows the estimated values of β1 under a series of different specifications. Each of the columns runs the analysis with a different dependent variable, beginning with SAT scores and moving to graduation rates and per-pupil expenditures. The rows layer on additional controls until the final row in each column shows the results for the full model that appeared at the end of Section IV.C. The first number in each set of three is the estimated coefficient on Mandatory (i.e., β1). The number in parentheses is the coefficient’s standard error. Each coefficient represents the estimated impact on the relevant dependent variable of requiring school districts to bargain with a teachers’ union (holding everything else in the model constant).
127. See WOOLDRIDGE, supra note 72, at 500.
the impact of teacher collective bargaining
1163
Table 3.
the impact of mandatory collective bargaining laws on state average sat scores, graduation rates, and per-pupil expenditures
coefficient on mandatory sat scores average freshman
graduation rates per-pupil
expenditures
State and year fixed effects only 9.39** -2.74** -67.54
(0.737) (0.230) (38.88)
Adding demographic controls 9.17** -2.63** -64.96
(0.722) (0.234) (41.69)
Adding poverty control 8.68** -2.69** -98.91**
(0.719) (0.228) (39.73)
Adding crime rate control 8.70** -2.69** -100.54**
(0.717) (0.228) (39.75)
Full controls with time trends 8.59** -2.65** -55.10
(0.912) (0.382) (47.31)
N 714 510 714
R2
.9921 .9577 .9903
This table shows the coefficients on a Mandatory indicator variable under a variety of different specifications. In the first column, the dependent variable is state average SAT scores. In the second column, the dependent variable is state average freshman graduation rates. In the third column, the dependent variable is state average per-pupil expenditures. The first number in each pair is the estimated value of the coefficient on Mandatory. Standard errors (clustered at the state level) appear in parentheses. Each row in the table layers on additional controls. The N and R
2
numbers reflect the model with full controls and time trends.
** indicates coefficients that are statistically different from zero at p = 0.01.
Consistent with Figure 1, the coefficients on Mandatory in the first column are positive and remain both positive and statistically significant as additional controls are introduced. The final row of the column suggests that mandatory teacher bargaining laws cause an increase of about 8.59 points in state average SAT scores. In the second column, the coefficient on Mandatory is negative and statistically significant across each of the models. Here, the analysis suggests that mandatory teacher bargaining laws cause a decrease of 2.65 percentage points in state high school graduation rates. (The pattern of negative coefficients is also visible in Figure 2, but it leaps out less dramatically.) The results in the third column are more equivocal: although the coefficient is negative in each of the rows (suggesting that mandatory bargaining laws cause a decrease in per-pupil expenditures), the results are only sometimes statistically significant. The fifth row of the third column does the most
the yale law journal 120: 1130 2 011
1164
complete job of controlling for potentially confounding factors, and the fact that the coefficient in this row is not statistically significant prevents one from making any claims about the impact of teacher bargaining on per-pupil expenditures.
One can make much stronger claims about the effects of teacher bargaining laws on student achievement: controlling for state and year fixed effects, state time trends, and non-linear shifts in demographics, poverty, and crime, mandatory bargaining regimes seem to cause an increase in SAT scores and a decrease in high school graduation rates. One can convert the figures in Table 3 to standardized impact estimates (measurements made in terms of the standard deviation of the dependent variable), and doing so provides a quick sense of how large these effects really are. Dividing the increase in SAT scores from the final row by the standard deviation of SAT scores in the dataset produces an effect size of about 0.125 standard deviations. The same analysis yields an effect size of about 0.34 standard deviations for high school graduation rates. Compare these estimates with a recent study of the federal Head Start preschool program, which found that short-term impact estimates for program participants were between 0.10 and 0.24 standard deviations.128 This Note returns to the issue of “how big” these impacts are in Part V, but for now it is worth noting that the figures in Table 3 are similar in magnitude (if not somewhat larger) than at least one other significant intervention in the education policy arena.
E. Possible Limitations
Natural experiments are not without their limitations.129 This Section identifies three potential problems with the Note’s empirical strategy and shows that none of them is fatal.
A first problem has to do with how a researcher specifies a given regression model. Scholars have been able to criticize the work of other empiricists by showing how sensitive their results are to slight changes in model
128. See ADMIN. FOR CHILDREN & FAMILIES, U.S. DEP’T OF HEALTH & HUMAN SERVS., HEAD
START IMPACT STUDY: FIRST YEAR FINDINGS, at i (2005), available at http://www.acf.hhs.gov/programs/opre/hs/impact_study/reports/first_yr_finds/first_yr _finds.pdf. For further discussion of the size of these impacts, see infra Section V.B.
129. For examples of empirical work showing how slight changes in model specification with panel data can lead to major changes in results, see Ayres & Donohue, supra note 83, at 1206-22; and John J. Donohue & Justin Wolfers, Uses and Abuses of Empirical Evidence in the Death Penalty Debate, 58 STAN. L. REV. 791, 804-21 (2005).
the impact of teacher collective bargaining
1165
specification.130 For example, Professors Ian Ayres and John Donohue have shown how adding a control for time trends changes the core results of a major empirical study of the effect of “right-to-carry” firearm laws on crime rates.131 If a study’s major finding is that sensitive to what should be minor changes in specification, it is difficult to put much weight on that study’s results.
Table 3 provides some evidence that this Note’s core results are not especially sensitive to model specification. The results for SAT scores remain positive and statistically significant in each row, and the results for graduation rates remain negative and statistically significant in each row. Still, one can do more to test the sensitivity of these results. All of the regressions in Table 3 assume that New Mexico school districts felt the impact of the sunset as soon as it happened. Such an assumption may be unrealistic. Imagine, for example, that a district operating under a collective bargaining agreement in 1999 honored that contract until it expired, at which point the district abandoned the bargaining process. One can model this phenomenon by recoding Mandatory with a one-year lag: in other words, one runs the same regressions assuming that no district felt an impact from the sunset until a year after the sunset took place.132 The intuition here is that if some fraction of New Mexico districts felt the impact of the sunset more gradually, then running the regressions with the lagged model should show results similar to those in Section IV.D. If the results change wildly under the lagged model, then the core results will be less compelling. (Note, however, that several school districts withdrew from collective bargaining immediately following the sunset.133 Because at least some of the districts cancelled bargaining in 1999,
130. Ayres & Donohue, supra note 83, at 1267-68; see also Donohue & Wolfers, supra note 129, at 805-06 (finding that small changes in model specification alter the key findings of a major empirical study of the deterrent effect of the death penalty).
131. Ayres & Donohue, supra note 83, at 1267-68.
132. One can extend this analysis to include two- and three-year lags. Results for a two-year lag (available upon request) show the same pattern of results that appear in Table IV. Results for a three-year lag lack significant meaning because by 2002 many school officials expected the bargaining law to be reauthorized. See Telephone Interview with John Martinez, Principal Consultant, Mgmt. Assocs. (June 11, 2010). Mr. Martinez has negotiated more than seventy public-sector labor agreements, many for New Mexico public school systems. Telephone Interview with Juan B. Montoya, Exec. Dir., N.M. Pub. Emp. Labor Relations Bd. (June 7, 2010). I address possible endogeneity concerns with the 2003 reauthorization later in this Section.
133. See It’s Not Over ’Til It’s Over: Collective Bargaining Continues Throughout New Mexico, ADVOCATE’S VOICE (Santa Fe, N.M.), Dec. 1999, at 6 (listing the Deming, Hatch, Las Cruces, and Truth or Consequences school systems as having abandoned bargaining in 1999).
the yale law journal 120: 1130 2 011
1166
one should expect the lag model to understate the true impact of the legal shift.)
Table 4 presents the results of the lag model. For the sake of comparison, it reproduces the results from Table 3 in the “Baseline” column of each panel. The results are encouraging: the signs remain the same, the results that were statistically significant in Table 3 remain statistically significant, and the results are slightly smaller in absolute value. One can attribute this dampening or muting effect to the fact that the lag model excludes any impact from the sunset that districts felt in 1999.134 The important point here is that even after this additional change in model specification, the sign and statistical significance of the core results remain unchanged.
A second problem concerns lingering sources of endogeneity. Although panel data models with fixed effects and time trends can rule out most omitted variable problems, there is at least one type that remains. If something unmeasured impacts the dependent variable and changes at precisely the same time as the independent variable of interest, then the unmeasured factor will bias the regression’s results. Imagine, for example, that New Mexico’s governor launched a series of aggressive education reforms just as the state bargaining statute expired. The regressions in this Note would confound the effects of these new education reforms with the effects of the change in bargaining regime. Fortunately, there appear to be no changes in state education policy that coincide with the 1999 sunset. Although Governor Gary Johnson (New Mexico’s governor at the time the bargaining law expired) pushed for an expansive school voucher program,135 he was ultimately unsuccessful.136 Extensive searching in newspaper databases revealed no major changes in state education policy (or other changes in state policy) that coincided with the sunset of the state’s bargaining law.
It is harder to rule out confounding factors associated with the 2003 reauthorization. Governor Richardson tackled a number of education priorities in 2003: in addition to signing the new public employee bargaining act, he also signed a new teacher licensing statute and reorganized the state’s public school
134. See id.
135. See Loie Fecteau, Governor Starts Voucher Road Show, ALBUQUERQUE J., Apr. 22, 1999, at D3 (“Johnson said he is traveling the state to talk about school vouchers to increase public understanding of the issue before he calls lawmakers into a special legislative session, starting May 4.”).
136. See Jessica L. Sandham, N.M. Legislature Rejects Governor’s Voucher Plan, EDUC. WK., May 19, 1999, at 15 (“New Mexico lawmakers handed a resounding defeat last week to Gov. Gary E. Johnson’s plan to provide low-income children with vouchers worth roughly $3,000 to attend any public, private, or religious school in the state.”).
the impact of teacher collective bargaining
1167
governance structure.137 New Mexico citizens also passed a constitutional amendment that made it easier for the state to spend certain state funds on its public schools.138 Because each of these changes occurred in 2003, and because each potentially influenced student achievement, the 2003 legal shift raises significant endogeneity concerns. Note, however, that the 1999 sunset remains plausibly exogenous: no other state education policy changes seem to have occurred at the same time. As an additional robustness check, one can run the same analysis from Section IV.C using only the years 1993 through 2002 in the dataset. When one limits the data in this way, the estimates of the coefficient on Mandatory come only from the 1999 sunset and not from the 2003 reauthorization. If the results are robust, then there should not be meaningful differences in this final analysis.
The columns labeled “Sunset Only” in Table 4 present these results. The coefficients remain positive and statistically significant for SAT scores and remain negative and statistically significant for graduation rates. Thus, even when we strip away the part of the sample that raises endogeneity concerns, we still find the same pattern of results: mandatory collective bargaining laws raise average SAT scores and depress high school graduation rates.
137. See The Governor’s Year, ALBUQUERQUE J., Dec. 28, 2003, at A6 (describing, among other changes, Governor Richardson’s new power to appoint a state level “secretary of education”).
138. See id.
the yale law journal 120: 1130 2 011
1168
Table 4.
robustness checks
This table shows the sensitivity of the core results to changes in model specification. The “Baseline” columns reproduce the results from Table III. The “1 Year Lag” columns model the sunset and reauthorization of New Mexico’s bargaining law as though each took effect one year after each legal change actually occurred. The “Sunset Only” column runs the “Baseline” specification, but only for the years 1993 through 2002. It thus captures the effect of the sunset but not the reauthorization. Standard errors (clustered at the state level) appear in parentheses.
* and ** indicate that a coefficient is statistically different from zero at p = 0.05 and p = 0.01 respectively.
There remains a third potential limitation. This Note’s analysis would be stronger if it could control for the percentage of students taking the SATs in each state in each year. This concern is ultimately a minor one: fixed effects and time trends effectively control for any constant differences between states in the percent of students taking the SAT and control for any state level trends in those percentages. The only type of movement that these controls would not eliminate is a discrete, one-time jump in the percent of students taking the
SATs. Although this Note cannot rule out the presence of such a jump, its presence certainly appears unlikely. To see why, return to Figure 1. Even if the composition of the students taking the SATs in New Mexico changed dramatically in 1999 (leading to the sharp drop in SAT scores in Figure 1), how likely is it that the composition again changed in 2003 (when the scores begin to rise) and did so in the opposite direction? Although the regressions themselves cannot rule out this possibility, common sense suggests that the alleged phenomenon is exceedingly unlikely.
No panel data regression is a perfect substitute for a random assignment study. Still, the models that this Note has employed appear to avoid common pitfalls. They appear robust to different specifications; they persist when the sample is limited to pre-reauthorization; and it is difficult to be too concerned with an inability to measure the percent of students taking the SATs. Given the weaknesses of past empirical research in this area, the Note’s empirical findings appear to be the best available evidence of the causal impact of teacher collective bargaining on student achievement.
v. discussion and implications
The core findings of this study suggest that mandatory collective bargaining laws in the public school context lead to an increase in SAT scores and a decrease in graduation rates. They further suggest that these laws have no impact on per-pupil expenditures. Significantly, the study design that generated these results provides more reliable estimates of the causal impact of teacher collective bargaining laws than prior literature. To what extent should these results matter? This Part explores the study’s core empirical findings along three dimensions. It first tries to re-create what may have happened in New Mexico between 1999 and 2003. It asks why the sunset of the bargaining law had the effects that it had. Second, it uses Part IV’s empirical findings to make normative arguments against teacher collective bargaining: not only does teacher bargaining fail a purely utilitarian cost-benefit analysis, but it offers improvement only at the expense of those who are already worse off. The third Section explores the Note’s policy relevance, noting in particular how these results expose a significant and troubling trade-off.
A. Explaining the Core Findings
If one can assume that lower performing students tend to drop out of high school and that higher performing students tend to take the SATs, then these
the yale law journal 120: 1130 2 011
1170
results suggest that mandatory collective bargaining shifts the focus of schools away from low-performing students toward higher-performing ones.139 Why might this be the case? As New Mexico temporarily became a permissive state, what story could explain a decline in the performance of SAT-taking students and a simultaneous increase in graduation rates? Like most empirical studies, the regression results cannot themselves explain why these changes took place. Rather than leave this key question unanswered, however, this Section uses interviews with union leaders, district negotiators, and public officials to reconstruct the ways in which the actual operations of New Mexico’s public schools changed.
It is useful to begin by considering the extent of teacher collective bargaining in New Mexico prior to the 1999 sunset. Although the state has not kept records of the pre-1999 contracts,140 one reliable estimate suggests that roughly thirty districts operated under collective bargaining agreements prior to 1999.141 Those thirty districts enrolled more than half of New Mexico’s public school students142 and included the four largest districts in New Mexico.143 Any changes that occurred as a result of the sunset would therefore be felt by a very large number of New Mexico’s students.
139. This shift in focus is inconsistent with the findings of one of the earliest empirical studies of teachers’ unions. See Eberts & Stone, supra note 72, at 359-60. In that study, the authors found that collective bargaining increased the test scores of students near the middle of the skill distribution while decreasing the scores of students at the top and at the bottom of that distribution. Id. The authors attribute this finding to union improvements in “the standardization of the workforce, work rules, and production techniques.” Id. at 361. This study’s findings suggest instead that union activity leads to a focus on the top of the distribution and not the middle of it.
140. See Telephone Interview with Juan B. Montoya, supra note 132 (stating that the New Mexico Public Employee Relations Board does not keep records of pre-1999 contracts).
141. See Telephone Interview with John F. Kennedy, Partner, Cuddy & McCarthy, LLP (June 8, 2010) (noting that thirty districts operated under collective bargaining agreements prior to 1999). Cuddy & McCarthy represents seventy-five percent of the school districts in New Mexico. Id.
The thirty-district figure adds up to less than one hundred percent of New Mexico districts because teachers must vote to join a bargaining unit before collective bargaining can begin, and unions were not able to organize teachers in all of New Mexico’s districts. See Telephone Interview with Sharon Morgan, President, Nat’l Educ. Ass’n—N.M., (Mar. 21, 2010) (noting that many school districts have not organized for bargaining); see also supra Part I (describing the collective bargaining process).
142. See Telephone Interview with John F. Kennedy, supra note 141.
143. The Albuquerque, Gallup-McKinley, Las Cruces, and Santa Fe school districts all engaged in collective bargaining prior to 1999. See It’s Not Over ’Til It’s Over, supra note 133 (Las Cruces and Santa Fe); Telephone Interview with John Martinez, supra note 132 (Gallup-
the impact of teacher collective bargaining
1171
Eleven of those roughly thirty districts chose not to continue collective bargaining once their existing contracts expired.144 Although state records do not identify these districts by name, union newsletters from the time period and interviews with local experts together identify at least ten of these eleven districts145: Deming Public Schools, Dulce Independent Schools, Gallup-McKinley County Schools, Hatch Valley Municipal Schools, Hobbs Municipal Schools, Las Cruces Public Schools, Pecos Independent Schools, Reserve Independent Schools, Truth or Consequences Schools, and Tucumcari Public Schools.146 These ten districts enrolled more than 56,000 students in 2000, just over 17% of New Mexico’s public school students. Thus, not only did more than half of the state’s students attend schools in districts that operated under teacher collective bargaining agreements, nearly a third of those districts elected to abandon the bargaining process as soon as they had the power to do so.
So what exactly changed in New Mexico school districts after the 1999 sunset? Consider first the eleven districts that abandoned bargaining altogether. Experts involved with teacher bargaining in New Mexico at the time describe three distinct changes in those districts. First, districts gained
McKinley); Telephone Interview with Charles White, Former Deputy Superintendent of Albuquerque Pub. Sch. (June 8, 2010) (Albuquerque).
U.S. Census Bureau data makes it possible to determine the student enrollment in individual New Mexico school districts in 2000. See School District Demographics System, NAT’L COUNCIL FOR EDUC. STATISTICS, http://nces.ed.gov/surveys/sdds/ed/index.asp (select “New Mexico” from the state drop-down menu) (last visited June 13, 2010). These four districts have the largest enrollment in New Mexico at that time. Id. Summing the enrollment of all individual districts, we can find the total number of students enrolled in New Mexico in 2000. When we use that total enrollment figure as the denominator and the student enrollment in these four districts as the numerator, we find that their combined enrollment constitutes just over forty percent of New Mexico’s total enrollment.
144. See PUB. EMP. LABOR RELATIONS BD., REPRESENTATION CASES: 2004-2009, at 2 (2009), available at http://www.pelrb.state.nm.us/pdf/case-stats-and-desc/ RepresentationCasesAsOf_2009Dec31.pdf; Telephone Interview with Juan B. Montoya, supra note 132 (indicating that “incumbent” petitions figure in the Representation Cases document reflects the number of bargaining units that had been in existence in pre-1999 that then lost their bargaining status between 1999 and 2003).
145. See It’s Not Over ’Til It’s Over, supra note 133; Telephone Interview with John Martinez, supra note 132; Telephone Interview with Sharon Morgan, supra note 141; Telephone Interview with Charles White, supra note 143.
146. Although the Las Cruces schools initially dropped collective bargaining, the unions successfully backed school board candidates in subsequent elections that brought collective bargaining back. See School Board Election Outcomes, ADVOCATE’S VOICE (Santa Fe, N.M.), May/June 2001, at 7 (describing the National Education Association’s school board victory in Las Cruces).
the yale law journal 120: 1130 2 011
1172
additional control over how they spent their annual budgets.147 Under New Mexico law, school funding is to some extent fungible across different types of expenditures.148 Thus, once a district pulled out of collective bargaining, it could reallocate resources away from contract requirements and toward other priorities.149 Second, teachers lost the grievance rights they enjoyed under earlier collective bargaining agreements.150 Under many of these agreements, teachers could file grievances that would ultimately be decided by an independent arbitrator.151 Union critics attack these procedures for making it time-consuming and prohibitive for principals to discipline or terminate underperforming teachers.152 (Union advocates counter that such provisions are vital for teacher protection from arbitrary administrators.153) Although many school boards provided for other types of grievance procedures that continued to exist, teachers in these districts faced a narrower set of options when filing a grievance.154
One can speculate about how these first two changes may have led to an increase in graduation rates. Free from the funding obligations of their collective bargaining agreements, districts may have shifted funding to new priorities, ones that presumably affected the achievement of low-performing students. Then, with one set of grievance procedures eliminated, districts conceivably had additional time and resources to allocate to the same new priorities. But what were these priorities? And what about the decrease in SAT scores? The above stories remain, at this point, both speculative and incomplete. A third change in the districts that abandoned bargaining provides a more compelling explanation, one that may explain not only the rise in graduation rates but the decrease in SAT scores as well.
147. See Telephone Interview with John F. Kennedy, supra note 141.
148. See id.
149. State statutes and regulations impose restrictions on how districts allocate their resources, but a district that dropped collective bargaining could avoid any additional restrictions that may have come from collective bargaining agreements. See id.
150. See Telephone Interview with Sharon Morgan, supra note 141.
151. See id.
152. See supra Section II.A.
153. See supra Section II.B.
154. Telephone Interview with Sharon Morgan, supra note 141; see also Telephone Interview with John Martinez, supra note 132 (noting noncontract grievance procedures available to teachers).
the impact of teacher collective bargaining
1173
Absent collective bargaining agreements, teachers lost certain transfer rights.155 Under many pre-1999 collective bargaining agreements, districts had to honor voluntary transfers of teachers before forcing any teachers to move schools and, when there were conflicting voluntary transfer requests, districts had to grant requests in reverse order of seniority.156 A number of researchers have criticized these contract-imposed transfer rules because they allow senior teachers—those with the most experience, who are often higher-performing teachers—to concentrate themselves in a district’s higher-income, higher-performing schools.157 It is hardly surprising that established teachers at the peak of their careers would want to teach in a less taxing environment, one with engaged students, engaged parents, and newer facilities. High-poverty schools with lower-performing students, by contrast, wind up with the least experienced (and least successful) teachers.158 This change in transfer rights is especially significant because it helps explain not only why low-performing students began to improve but also why the achievement of high-performing students began to fall: if districts were able to shift high-quality teachers away from concentrated areas of high performance to areas of high need, one would expect to see the performance of high-achieving students fall. The loss of transfer rights remains, at present, the most compelling explanation for Part IV’s results, at least in the context of the districts that abandoned bargaining.159
Consider then those districts that elected to continue with collective bargaining after 1999. Even here, local reports suggest that the bargaining
155. See Telephone Interview with John Martinez, supra note 132; Telephone Interview with Sharon Morgan, supra note 141.
156. See Telephone Interview with Sharon Morgan, supra note 141.
157. See LINDSEY LUEBCHOW, NEW AM. FOUND., EQUITABLE RESOURCES IN LOW INCOME
SCHOOLS: TEACHER EQUITY AND THE FEDERAL TITLE I COMPARABILITY REQUIREMENT 5 (2009), available at http://www.newamerica.net/files/nafmigration/Equitable_Resources_in _Low_Income_Schools.pdf. The work of other scholars confirms that large intradistrict disparities in school quality exist in large school districts. See, e.g., James E. Ryan & Michael Heise, The Political Economy of School Choice, 111 YALE L.J. 2043, 2085 (2002) (“[N]eighborhood schools within large districts are quite segregated by race and income.”).
158. See LUEBCHOW, supra note 157, at 5. It is worth mentioning that experience is likely an imperfect proxy for teaching quality. See Eric Alan Hanushek & Steven G. Rivkin, How To Improve the Supply of High-Quality Teachers, in BROOKINGS PAPERS ON EDUCATION POLICY, supra note 45, at 7; Daniel Aaronson, Lisa Barrow & William Sander, Teachers and Student Achievement in the Chicago Public High Schools 27-29 (Fed. Reserve Bank of Chi., Working Paper No. 2002-28, 2003), available at http://www.chicagofed.org/digital_assets/ publications/working_papers/2002/wp2002-28.pdf.
159. Note that this story remains—at best—suggestive. Absent more extensive survey evidence of New Mexico teachers and administrators, it would be irresponsible to attribute too much to the possible effect of new intradistrict transfer policies.
the yale law journal 120: 1130 2 011
1174
law’s sunset had a substantial impact on district-union relations. Aware of the fact that districts could withdraw from collective bargaining, unions took a less aggressive approach in their negotiations.160 Similarly, unions were less likely to challenge district management by filing grievances because they now needed to maintain positive relationships and avoid confrontation.161 One union official has also described a general loss of morale among New Mexico educators that followed the law’s sunset.162 This drop in morale may have led to a decline in effort, and some teachers may have even left New Mexico for states where teacher bargaining was required.163
The changes that occurred in the districts that abandoned bargaining hint at possible explanations for the results in Part IV. If contract negotiations were less contentious, and if unions filed fewer grievances, districts may have had more time and resources to devote to improving the performance of at risk students. If a loss of morale was especially acute among teachers in higher performing schools, the performance of college-bound students may have suffered. Like some of the evidence that appeared earlier in this Section, however, much remains both speculative and incomplete. Further work in this area may uncover additional local evidence, but for the purposes of this Note, the important point is that the empirical results from Part IV are consistent with a contemporaneous set of actual changes in the day-to-day operations of New Mexico’s public schools.
B. Normative Arguments Against Mandatory Bargaining
Armed with the empirical findings from Part IV, one can begin to make stronger normative claims about mandatory collective bargaining. Consider first a utilitarian position. Previous work in this field makes it possible to monetize the effects of these policy shifts and conduct a crude cost-benefit analysis. Professor Rouse has estimated that the cost of dropping out of high school is approximately $260,000 in lost future earnings.164 Professors Kane
160. See Telephone Interview with Robert Brown, Former Consultant for N.M. Sch. Dists. (June 6, 2010) (indicating that there was “a lot more cooperation” between districts and unions after the 1999 sunset); Telephone Interview with Sharon Morgan, supra note 141 (“At that time, we felt the need to be less confrontational and find areas of common agreement.”).
161. See Telephone Interview with John Martinez, supra note 132.
162. See Telephone Interview with Sharon Morgan, supra note 141.
163. See id.
164. Cecilia Elena Rouse, Labor Market Consequences of an Inadequate Education 21, 22, 24 (Sept. 2005) (unpublished manuscript), available at http://www.literacycooperative.org/
the impact of teacher collective bargaining
1175
and Staiger have suggested that a one standard deviation improvement on a nationally normed test translates into an added lifetime earning potential of between $120,000 and $280,000.165 Table 5 uses these estimates to cash out the costs of an increased dropout rate and the benefits of improved SAT scores.
The table uses the most conservative estimates from Part IV and the state of Colorado in the year 2005 as a test case.166 Were Colorado (currently a permissive state)167 to pass a mandatory collective bargaining law, one would expect the high school graduation rate to drop by 1.55 percentage points. According to the U.S. Census Bureau, around 230,000 students were enrolled in Colorado high schools in 2005. If one assumes that twenty-five percent of those students were seniors, one can calculate the expected number of new dropouts and get a rough sense of the cost of the expected decrease in graduation rates.168 According to the College Board, twenty-six percent of Colorado’s senior class took the SATs in 2005.169 Using the estimate from the final row of the “Sunset Only” column in Table 4 and the standard deviation of SAT scores from all states and all years, one would expect these test-takers to experience an improvement of 0.115 standard deviations. Multiplying this impact estimate by the expected number of SAT test takers and by the Kane and Staiger estimates, one can calculate the expected benefits of these boosted SAT scores.
Table 5 shows the results of this analysis. Two important points emerge from the table. First, the magnitude of these impacts is large, with costs and benefits in the hundreds of millions of dollars. Second, the bottom row
documents/TheLaborMarketConsequencesofanInadequateEd.pdf. These figures are discounted to their 2005 value.
165. Kane and Staiger report figures of $110,000 and $256,000, which are discounted to 2002 dollars. Thomas J. Kane & Douglas O. Staiger, The Promise and Pitfalls of Using Imprecise School Accountability Measures, 16 J. ECON. PERSP., Autumn 2002, at 91, 110-11. Using the same three percent discount rate that the authors use, one arrives at about $120,000 and $280,000 in 2005 dollars.
166. Using the year 2005 is arbitrary, but a year must be picked in order to express the Rouse and Kane and Staiger estimates in present value equivalents.
167. See infra Appendix B.
168. I apply the dropout rate to seniors only. Note that this choice understates the true cost of the additional dropouts. A decrease in AFGR should be applied to the freshman class, which is presumably larger than the senior class because students drop out over the course of high school. Unfortunately, the number of freshmen in 2000 is unavailable. By multiplying 1.15% by the smaller number of seniors (instead of the larger number of freshmen), I systematically understate the number (and therefore the cost) of the additional high school dropouts.
169. See Archived SAT Data & Reports, supra note 109. These data are available only for more recent years and are unavailable for the years at the beginning of the panel.
the yale law journal 120: 1130 2 011
1176
“differences” are not consistently positive. In other words, we cannot rule out the possibility that the net gain to society from a mandatory collective bargaining regime is positive.
The results of this crude cost-benefit analysis provide a starting point for a utilitarian critique of teacher collective bargaining. If one’s normative criterion is the maximization of social welfare, then mandatory collective bargaining is a poor choice for a state policy because the monetized value of the gain to high-performing students does not necessarily outweigh the monetized value of the loss to low-performing students. Of course, there are internal problems with this argument: the cost-benefit analysis has not, for example, taken into account the welfare gain that teachers experience under mandatory bargaining. Further, one needs a way of trading off that welfare gain against the net loss of welfare to students.
the impact of teacher collective bargaining
1177
Table 5.
cost benefit analysis
cost benefit analysis (colorado)
High School Students in Colorado (a Permissive State)
In 2005 230,000
If Colorado Became a Mandatory Bargaining State
Expected Increase in Average SAT Score (Points) 7.89
Expected Decrease in Graduation Rate (Percentage Points) 1.55
Cost
Assumed Number of High School Seniors (25% of Student Body) 57,500.00
Number of Additional Drop-Outs 891
Total Cost $231,725,000
Benefit
Percent of Colorado Seniors Taking the SATs in 2005 26%
Number of Colorado SAT Takers 14,950
Total Benefit
- Low Estimate $206,653,798.42
- High Estimate $480,939,745.62
Difference
Using Low Estimate -$25,071,202
Using High Estimate $249,214,746
This table uses Colorado (currently a “permissive” state) as a test case to cash out the costs and benefits of mandatory teacher bargaining laws. The expected increase in SAT scores and the expected decrease in graduation rates come from the final row of the “Sunset Only” columns in Table IV. The “Total Cost” figure assumes that a high school drop-out loses $260,000 in total lifetime earnings (discounted to 2005 dollars). See Rouse, supra note 164, at 24. The “Total Benefit” figures assume that a one standard deviation increase in test score performance is associated with an increase in lifetime earnings of between $110,000 and $256,000 (discounted to 2005 dollars). See Kane & Staiger, supra note 165, at 110-11.
The larger issue, however, is the presence of nonutilitarian concerns. The empirical findings of Part IV suggest that, under mandatory collective bargaining, any improvement in student achievement comes at the expense of poor-performing students. If one believes that society owes more to those who are born with less, and if Part IV is correct, it is difficult to see how mandatory collective bargaining is justified. Different legal and philosophical writers have
the yale law journal 120: 1130 2 011
1178
expressed this normative principle in different terms,170 but the basic idea—that those at the top should not be made even better off at the expense of those at the bottom—is consistent with what would seem to be the moral intuitions of most people. Without the empirical results of Part IV, these normative arguments have less power because they turn on unresolved empirical questions: Does collective bargaining make already disadvantaged people worse off? If so, by how much? The empirical results in this Note therefore provide a powerful basis for a normative critique of teacher collective bargaining.
C. Policy Relevance
Clashes between teachers’ unions and reformers are not going away. Even though the Department of Education has distributed the Race to the Top grants,171 confrontations between school reformers and teachers’ unions continue to flare. In Washington, D.C., for example, the American Federation of Teachers spent approximately one million dollars to defeat Adrian Fenty’s mayoral reelection bid.172 Fenty had appointed Michelle Rhee as the chancellor of the DC Public Schools, and Rhee’s aggressive, antiseniority, pay-for-performance policies frequently brought her into conflict with the local teachers’ union.173 As states that earned Race to the Top grants implement their new policies, as the Obama administration considers another round of similar grants,174 as Congress wrestles with the reauthorization of No Child Left
170. See JOHN RAWLS, A THEORY OF JUSTICE 65 (rev. ed. 1999) (“[T]he higher expectations of those better situated are just if and only if they work as part of a scheme which improves the expectations of the least advantaged members of society.”); Anthony T. Kronman, Wealth Maximization as a Normative Principle, 9 J. LEGAL STUD. 227, 242 (1980) (“In my view, social institutions . . . should be used to mitigate the effects of the natural lottery; for the law to intensify them is perverse.”).
171. See Stephanie Banchero, Nine States, D.C., Win Race for Aid to Schools, WALL ST. J., Aug. 25, 2010, at A2.
172. See Smith, supra note 58.
173. See, e.g., Kristin Ehrgood, With D.C. Teacher Firings, the Students Finally Come First, WASH. POST, Aug. 8, 2010, at C5; Bill Turque, Teachers’ Chief Is in the Hot Seat, WASH. POST, Oct. 1, 2008, at B1; Bill Turque, Union Contests Layoffs of Teachers in Court, WASH. POST, Oct. 8, 2009, at B8.
174. Abby Phillip, ‘Race to the Top’ Winners Chosen, POLITICO (Aug. 24, 2010, 4:39 PM EDT), http://www.politico.com/news/stories/0810/41420.html (noting that Secretary of Education Arne Duncan would like the program to continue). For a discussion of union opposition to the initial Race to the Top program, see supra notes 8-10 and accompanying text.
the impact of teacher collective bargaining
1179
Behind,175 and as a host of smaller, local education policy decisions are made, conflicts between the unions and their opponents will continue to emerge.
In this context, the core results from Part IV have significant policy implications. First, the results help resolve the competing claims from Part II. At first glance, the results seem to provide ammunition for both sides of the debate. Scholars who argue that teachers’ unions improve the quality of schools (through “dignity” arguments, “aligned incentive” arguments, or “reform bargaining” arguments) can point to the increase in New Mexico’s SAT scores. Those who argue that teachers’ unions do damage to school systems (through excessive tolerance of poor teaching performance, for example) can point to New Mexico’s increased dropout rate. On closer inspection, however, the findings suggest how both camps might be correct: mandatory collective bargaining may improve the welfare of higher-performing students at the expense of lower-performing students. For policymakers, this Note’s analysis replaces intuitively appealing but mutually inconsistent theoretical arguments with a very clear tradeoff. Teacher bargaining does improve student performance, but it appears to do so at the expense of lower-performing students. Future efforts to shape teacher bargaining policies should engage that tradeoff explicitly.
Further, the Note’s findings have the potential to change not just the thinking of policy makers but also the conversations that take place in the media about teacher bargaining. The Note’s findings should put the rhetorical burden of persuasion squarely on the shoulders of the union. At least in the context of New Mexico, union power in the bargaining process led to a decrease in the academic performance of students who were already low-performing. In public discussions, union critics should be able to demand from union advocates a response that addresses how the union-favored policy will not harm low-performing students. These critics should demand more than just a “teachers unions are vital” argument; they should demand either new, reliable empirical evidence that the findings in this Note are incorrect or a retreat on the part of the union from the desired policy. In the past, advocates on both sides have been able to cite “teachers unions are vital” arguments or “teachers unions are terrible” arguments with rhetorical impunity. This Note requires those on the union side of these arguments to produce something more.
175. David S. Broder, The Next Issue: Education, WASH. POST, Mar. 28, 2010, at A15 (“So far, the most critical comments [about No Child Left Behind and the reauthorization process] have come from the heads of the two big teachers unions, which could doom these changes in a Democratic Congress.”).
the yale law journal 120: 1130 2 011
1180
conclusion
Despite widespread criticism in the popular press, the empirical literature on teachers’ unions has traditionally been thin. Endogeneity problems have prevented past analyses from cutting through the din of the nonempirical literature. By exploiting an exogenous shock to the legal system governing teachers’ unions in New Mexico, this Note tries to isolate the causal impact of teacher collective bargaining on student achievement. It finds that mandatory collective bargaining laws lead to an increase in SAT scores and a decrease in high school graduation rates while having no effect on per-pupil expenditures. These impacts are large, with monetized values in the hundreds of millions of dollars. They further suggest that if teachers’ unions have a positive effect on student achievement, it comes at the expense of lower-performing students.
Empirical evidence—like the evidence presented in this Note—should play a central role in the development of American education policy. Such evidence can neutralize compelling-but-incorrect theoretical arguments and lay bare the very real tradeoffs that are at stake. As unions and their opponents continue to clash over the formation of education policy, it is critical that reliable empirical evidence inform that process.
the impact of teacher collective bargaining
1181
appendix a
The following advertisements appeared in the New York Times in March of 2008. See supra note 1.
the yale law journal 120: 1130 2 011
1182
the impact of teacher collective bargaining
1183
appendix b
state
teacher
collective
bargaining
regime
citation
Alabama Permissive
ALA. CODE § 16-1-30(b) (2010) (“The local board of education shall . . . establish a written educational policy for the board of education and its employees and shall prescribe rules and regulations for the conduct and management of the schools.”); Walker Cnty. Bd. of Educ. v. Walker Cnty. Educ. Ass’n, 431 So. 2d 948, 954 (Ala. 1983) (holding that pursuant to § 16-8-10, the predecessor to § 16-1-30(b), a school board may (but need not) adopt a teachers’ union’s proposal as part of its educational policy); see also Limestone Cnty. Educ. Ass’n v. Limestone Cnty. Bd. of Educ., 880 So. 2d 446, 450 n.1 (Ala. 2003) (noting that § 16-1-30 replaced § 16-8-10 in July of 1995 but interpreting the two provisions analogously).
Alaska Mandatory
ALASKA STAT. § 23.40.070 (West 2010) (“The legislature . . . recogniz[es] the right of public employees to organize for the purpose of collective bargaining [and] requir[es] public employers to negotiate with and enter into written agreements with employee organizations on matters of wages, hours, and other terms and conditions of employment . . . .”).
Arizona Permissive
Bd. of Educ. v. Scottsdale Educ. Ass’n, 498 P.2d 578, 583 (Ariz. 1972) (“[T]he Board has authority to enter into ‘collective bargaining’ with a representative of the teacher-employees when that ‘collective bargaining’ is in the context of meeting and consulting with [sic]. However, the decision of whether the Board desires to enter into such a ‘collective bargaining’ situation remains for the Board, and actions to compel or coerce the Board to so bargain collectively against its better judgment are improper.”), overruled on other grounds, 509 P.2d 612 (Ariz. 1973).
Arkansas Permissive
ARK. CODE ANN. § 6-17-202(a) (2009) (referencing the ability of a school district to “choose[] to officially recognize in its policies an organization representing the majority of the teachers of the school district for the purpose of negotiating personnel policies, salaries, and educational matters of mutual concern under a written policy agreement”).
the yale law journal 120: 1130 2 011
1184
state
teacher
collective
bargaining
regime
citation
California Mandatory
CAL. GOV’T CODE § 3543 (West 2009) (“A public school employer . . . shall meet and negotiate with and only with representatives of employee organizations selected as exclusive representatives of appropriate units upon request with regard to matters within the scope of representation.”).
Colorado Permissive
Littleton Educ. Ass’n v. Arapahoe Cnty. Sch. Dist., No. 6, 553 P.2d 793, 796 (Colo. 1976) (approving “[n]egotiations between [a public] employer and [a public] employee organization entered into voluntarily [because they] do not require the employer to agree with the proposals submitted by employees”).
Connecticut Mandatory
CONN. GEN. STAT. ANN. § 10-153d(b) (West 2010) (“The local or regional board of education and the organizations designated or elected as the exclusive representative for the appropriate unit . . . shall have the duty to negotiate with respect to salaries, hours and other conditions of employment about which either party wishes to negotiate.”).
Delaware Mandatory
DEL. CODE ANN. tit. 14, § 4001 (West 2010) (“It is the declared policy of the State . . . to promote harmonious and cooperative relationships between reorganized public school districts and their employees [by o]bligating boards of education and school employee organizations which have been certified as representing their school employees to enter into collective bargaining negotiations . . . .”).
District of Columbia
Mandatory
D.C. CODE § 1-617.17(b) (LexisNexis 2010) (“[T]he Mayor, the Board of Education, the Board of Trustees of the University of the District of Columbia, and each independent personnel authority . . . shall meet with labor organizations . . . which have been authorized to negotiate compensation . . . to negotiate in good faith with respect to salary, wages, health benefits, within-grade increases, overtime pay, education pay, shift differential, premium pay, hours, and any other compensation matters.”).
Florida Mandatory
FLA. STAT. ANN. § 447.309(1) (West 2010) (“After an employee organization has been certified pursuant to the provisions of this part, the bargaining agent for the organization and the chief executive officer of the appropriate public employer or employers, jointly, shall bargain collectively in the determination of the wages, hours, and terms and conditions of employment of the public employees within the bargaining unit.”).
the impact of teacher collective bargaining
1185
state
teacher
collective
bargaining
regime
citation
Georgia Right-To-Work
Chatham Ass’n of Educators v. Bd. of Pub. Educ., 204 S.E.2d 138 (Ga. 1974) (holding that absent legislative authorization, collective bargaining agreements between a board of education and a teachers’ union are void and unenforceable).
Hawaii Mandatory
HAW. REV. STAT. § 89-9(a) (2010) (“The employer and the exclusive representative shall meet at reasonable times . . . and shall negotiate in good faith with respect to wages, hours . . . and other terms and conditions of employment that are subject to collective bargaining . . . .”).
Idaho Mandatory
IDAHO CODE ANN. § 33-1271 (2008) (“The board of trustees of each school district . . . shall . . . upon the request of a local education organization . . . enter into a negotiation agreement with the local education organization . . . and negotiate with such party in good faith on those matters specified in any such negotiation agreement . . . .”).
Illinois Mandatory
115 ILL. COMP. STAT. 5/1-1 (2010) (“Recognizing that harmonious relationships are required between educational employees and their employers, the General Assembly . . . grant[s] to education employees the right to organize and choose freely their representatives [and] requir[es] educational employers to negotiate and bargain with employee organizations representing educational employees and to enter into written agreements evidencing the result of such bargaining . . . .”).
Indiana Mandatory IND. CODE ANN. § 20-29-6-1 (LexisNexis 2007) (“School employers and school employees shall . . . have the obligation and the right to bargain collectively . . . .”).
Iowa Mandatory
IOWA CODE ANN. § 20.9 (West 2010) (“The public employer and the employee organization shall meet at reasonable times . . . . to negotiate in good faith with respect to wages, hours, vacations, insurance, holidays, leaves of absence, shift differentials, overtime compensation, supplemental pay, seniority, transfer procedures, job classifications, health and safety matters, evaluation procedures, procedures for staff reduction, in-service training and other matters mutually agreed upon.”).
Kansas Mandatory
KAN. STAT. ANN. § 72-5423(a) (2008) (“[B]oards of education are required to comply with this act . . . in recognizing professional employee’s organizations, and when such an organization is recognized, the board of education and the professional employees’ organization shall enter into professional negotiations on request of either party . . . .”).
the yale law journal 120: 1130 2 011
1186
state
teacher
collective
bargaining
regime
citation
Kentucky Permissive
Fayette Cnty. Educ. Ass’n v. Hardy, 626 S.W.2d 217, 220 (Ky. Ct. App. 1980) (“While public employees do not have the right to strike, a public agency may elect to negotiate with a representative of its employees, although it has no duty to do so.” (internal citations omitted)).
Louisiana Permissive
La. Teachers’ Ass’n v. Orleans Parish Sch. Bd., 303 So. 2d 564, 567-68 (La. Ct. App. 1974) (“We see no reason founded on public policy why collective bargaining should not be allowed in the public sector, when the public employer in its discretion has willingly decided to utilize this method of constructing its labor relations.”).
Maine Mandatory ME. REV. STAT. ANN. tit. 26, § 965 (Supp. 2009) (“It is the obligation of the public employer and the bargaining agent to bargain collectively.”).
Maryland Mandatory
MD. CODE ANN., EDUC. § 6-408(b)(1) (LexisNexis 2008) (“On request a public school employer . . . shall meet and negotiate with at least two representatives of the employee organization that is designated as the exclusive negotiating agent for the public school employees in a unit of the county on all matters that relate to salaries, wages, hours, and other working conditions.”).
Massachusetts Mandatory
MASS. GEN. LAWS ANN. ch. 150E, § 6 (West 2010) (“The employer and the exclusive representative shall meet at reasonable times . . . and shall negotiate in good faith with respect to wages, hours, standards or productivity and performance, and any other terms and conditions of employment, including without limitation, in the case of teaching personnel employed by a school committee, class size and workload, but such obligation shall not compel either party to agree to a proposal or make a concession; provided, however, that in no event shall the right of any employee to run as a candidate for or to hold elective office be deemed to be within the scope of negotiation.”).
Michigan Mandatory
MICH. COMP. LAWS § 423.215 (2010) (“A public employer shall bargain collectively with the representatives of its employees . . . and may make and enter into collective bargaining agreements with those representatives.”).
the impact of teacher collective bargaining
1187
state
teacher
collective
bargaining
regime
citation
Minnesota Mandatory
MINN. STAT. § 179.06 (2008) (“Whenever any employee, employees, or representative of employees, or labor organization shall desire to negotiate a collective bargaining agreement . . . it shall give written notice to the employer of its demand . . . . and it shall thereupon be the duty of the employer and the representative of employee or labor organization to endeavor in good faith to reach an agreement respecting such demand.”).
Mississippi Permissive
Mississippi has neither a comprehensive public sector bargaining law nor a teacher-specific bargaining law. One statute prohibits strikes by public school teachers, see MISS. CODE ANN. § 37-9-75 (2010), and case law indicates that at least some school districts operate under collective bargaining agreements, see, e.g., Miss. Ass’n of Educators v. Trs. of the Jackson Mun. Separate Sch. Dist., 510 So. 2d 123 (Miss. 1987); Jackson v. Hazlehurst Mun. Separate Sch. Dist., 427 So. 2d 134 (Miss. 1983). Because districts may bargain with teachers’ unions, and because no law compels collective bargaining with teachers’ unions, Mississippi is a “permissive” state.
Missouri Permissive
Peters v. Bd. of Educ., 506 S.W.2d 429, 433 (Mo. 1974) (holding that a school board may choose to adopt recommendations of a teachers’ union); see also Independence-Nat’l Educ. Ass’n v. Independence Sch. Dist., 223 S.W.3d 131, 140 n.8 (Mo. 2007) (citing Peters for the proposition that “an agreement between a school board and an association representing teachers that provided terms that the board could accept or reject was enforceable by the teachers’ association once the district had entered into it”).
Montana Mandatory
MONT. CODE ANN. § 39-31-305 (2009) (“The public employer and the exclusive representative, through appropriate officials or their representatives, have the authority and duty to bargain collectively.”).
Nebraska Mandatory
NEB. REV. STAT. § 48-816(5) (2004) (“Upon receipt by an employer of a request from a labor organization to bargain on behalf of employees, the duty to engage in good faith bargaining shall arise if the labor organization has been certified by the commission or recognized by the employer as the exclusive bargaining representative for the employees in that bargaining unit.”).
the yale law journal 120: 1130 2 011
1188
state
teacher
collective
bargaining
regime
citation
Nevada Mandatory
NEV. REV. STAT. § 288.150 (2009) (“[E]very local government employer shall negotiate in good faith through one or more representatives of its own choosing . . . with the designated representatives of the recognized employee organization . . . .”).
New Hampshire
Mandatory
N.H. REV. STAT. ANN. § 273-A:3 (2010) (“It is the obligation of the public employer and the employee organization certified by the board as the exclusive representative of the bargaining unit to negotiate in good faith.”).
New Jersey Mandatory
N.J. STAT. ANN. § 34:13A-5.3 (West 2010) (“[T]he majority representative and designated representatives of the public employer shall meet at reasonable times and negotiating n good faith with respect to grievances, disciplinary disputes, and other terms and conditions of employment.”).
New Mexico Mandatory
N.M. STAT. ANN. § 10-7E-17(A) (2004) (“[P]ublic employers and exclusive representatives . . . shall bargain in good faith on wages, hours and all other terms and conditions of employment and other issues agreed to by the parties . . . [and] shall enter into written collective bargaining agreements covering employment relations.”).
This version of New Mexico’s bargaining law has been in place since 2003. For a discussion of recent changes to New Mexico’s teacher bargaining regime, see supra Part IV.
New York Mandatory
N.Y. CIV. SERV. LAW § 204(2) (McKinney 2009) (“Where an employee organization has been certified or recognized pursuant to the provisions of this article . . . the appropriate public employer shall be . . . required to negotiate collectively with such employee organization in the determination of . . . the terms and conditions of employment of the public employees . . . and to negotiate and enter into written agreements . . . in determining such terms and conditions of employment.”).
North Carolina
Right-To-Work
N.C. GEN. STAT. § 95-98 (2010) (“Any . . . contract . . . between the governing authority of any . . . institution of the State of North Carolina, and any labor union . . . as bargaining agent for any public employees . . . is hereby declared to be against the public policy of the State, illegal, unlawful, void and of no effect.”).
the impact of teacher collective bargaining
1189
state
teacher
collective
bargaining
regime
citation
North Dakota Mandatory
N.D. CENT. CODE § 15.1-16-13(1) (2010) (“The board of a school district or its representatives and the representative organization or its representative shall, if requested by either entity, meet at reasonable times and negotiate in good faith regarding . . . [t]he terms and conditions of employment.”).
Ohio Mandatory
OHIO REV. CODE ANN. § 4117.04(B) (LexisNexis 2007) (“A public employer shall bargain collectively with an exclusive representative designated under [the relevant section of the public employee collective bargaining law].”).
Oklahoma Mandatory
OKL. STAT. tit. 70, § 509.6 (2010) (“The board of education and the representatives of the organization must negotiate in good faith on wages, hours, fringe benefits and other terms and conditions of employment.”).
Oregon Mandatory
OR. REV. STAT. § 243.656(5) (2009) (“It is the purpose of [these provisions] to obligate employers, public employees and their representatives to enter into collective negotiations . . . .”).
Pennsylvania Mandatory
11 PA. CONS. STAT. § 1111-A (2010) (“Collective bargaining is the performance of the mutual obligation of the employer or his representative to meet at reasonable times and confer in good faith with respect to wages, hours and other terms and conditions of employment . . . .”).
Rhode Island Mandatory
R.I. GEN. LAWS § 28-9.3-2(a) (2010) (“The certified teachers in the public school system in any city, town, or regional school district have the right to negotiate professionally and to bargain collectively with their respective school committees and to be represented by an association or labor organization in the negotiation or collective bargaining concerning hours, salary, working conditions, and all other terms and conditions of professional employment.”).
South Carolina
Right-To-Work
Branch v. City of Myrtle Beach, 532 S.E.2d 289, 292 (S.C. 2000) (“Unlike private employees, public employees in South Carolina do not have the right to collective bargaining.”). The Branch case indicates that public employees have lacked the right to bargain collectively in South Carolina since at least the 1960s. See id. (citing authority from the 1960s).
South Dakota Mandatory
S.D. CODIFIED LAWS § 3-18-3 (2010) (“Public employees shall have the right to form and join labor or employee organizations . . . and the governmental agency or its designated representatives shall be required to meet and negotiate with the representatives of the employees . . . .”).
the yale law journal 120: 1130 2 011
1190
state
teacher
collective
bargaining
regime
citation
Tennessee Mandatory
TENN. CODE ANN. § 49-5-611(a) (2010) (“The board of education and the recognized employees’ organization shall negotiate in good faith the following conditions of employment: (1) Salaries or wages; (2) Grievance procedures; (3) Insurance; (4) Fringe benefits, but not to include pensions or retirement programs of the Tennessee consolidated retirement system; (5) Working conditions; (6) Leave; (7) Student discipline procedures; and (8) Payroll deductions.”).
Texas Right-To-Work
TEX. GOV’T CODE ANN. § 617.002(a) (West 2004) (“An official of the state . . . may not enter into a collective bargaining contract with a labor organization regarding wages, hours, or conditions of employment of public employees.”).
Utah Permissive
Park City Educ. Ass’n v. Bd. of Educ., 879 P.2d 267, 269-70, 272 (Utah Ct. App. 1994) (holding that even though public employees have no statutory right to collective bargaining in Utah, a school board that on its own chooses to enter into a collective bargaining agreement will be bound by that agreement, so long as the agreement does not contain an unconstitutional delegation of legislative authority).
Vermont Mandatory
VT. STAT. ANN. tit. 16, § 2001 (2010) (“The negotiations councils of the school board and of the recognized teachers’ or administrators’ organization shall meet together at reasonable times, upon request of either party, and shall negotiate in good faith on all matters properly before them under the provisions of this chapter.”).
Virginia Right-To-Work
Commonwealth v. Cnty. Bd. of Arlington Cnty., 232 S.E.2d 30, 44 (Va. 1977) (holding that school boards do not have the authority to enter into binding collective bargaining agreements).
Washington Mandatory WASH. REV. CODE § 41.59.060(1) (2009) (“Employees shall have the right . . . to bargain collectively through representatives of their own choosing . . . .”).
West Virginia Permissive
City of Fairmont v. Retail, Wholesale, & Dep’t Store Union, 283 S.E.2d 589, 593 (W. Va. 1980) (“Thus, while some constitutional protection is extended under the First Amendment to public employees to organize, speak freely and petition, it is clear that a public employer is not required to recognize or bargain with a public employee association or union in the absence of a statutory requirement.”). West Virginia has no public employee bargaining law (or teacher bargaining law).
the impact of teacher collective bargaining
1191
state
teacher
collective
bargaining
regime
citation
Wisconsin Mandatory WIS. STAT. § 111.70(2) (West 2004) (“Municipal employees shall have the right . . . to bargain collectively . . . .”).
Wyoming Permissive
1977-1980 Op. Wyo. Att’y Gen. 157 (1978), 1978 Wyo. AG LEXIS 26 (arguing that Wyoming law “empowers the school board to enter into a collective bargaining agreement with its employees if it chooses to do so”).