21
i Ministry of Tourism The Impact of the Western Hemisphere Travel Initiative on Travel to/from Ontario October 2005 Tourism Research Unit
i
Ministry of Tourism
The Impact of the Western Hemisphere Travel Initiative on Travel to/from Ontario
October 2005
Tourism Research Unit

Table of Contents
Table of Contents ....................................................................................................................... i Executive Summary................................................................................................................... ii
Introduction .............................................................................................................................. iii The Impact of the WHTI on U.S. Travel to Ontario ..................................................................1
Awareness of the WHTI in America ......................................................................................1 How many American adults currently have a valid passport? ...............................................2 How many Americans are likely to have a passport by the time the WHTI comes into effect? .....................................................................................................................................3 What will the U.S. passport possession rate be over the next few years? ..............................5 How many U.S. visits to Ontario will likely have no passports by 2007/08?........................5 How this will affect U.S. visits to Ontario?............................................................................7
The Impact of the WHTI on Travel from Ontario to the U.S...................................................10
Awareness of the WHTI in Ontario......................................................................................10 How many Canadian adults currently have a valid passport? ..............................................10 And how many are likely to get one?...................................................................................11 How will the Canadian passport possession rate change by 2007/08?.................................12 How many Ontario visits to the U.S. would have no passports by 200708? .......................13 How this will affect Ontario’s outbound travel to the U.S.? ................................................14
Net Impact on tourism in Ontario and its regions ....................................................................16
i

Executive Summary • It is estimated that the number of U.S. visits to Ontario will decrease by 1.3%
(290,000 visits) in 2007 after the first stage of the implementation of the Western Hemisphere Travel Initiative (WHTI) and by 13.6% (3.2 million visits) in 2008 after the second stage of the implementation, compared to the base-line scenario in which the WHTI passport requirements do not exist.
• The cumulative loss of U.S. visits to Ontario is estimated to be at 3.5 million by
2008, which is equivalent to 16.2% of U.S. visits to Ontario in 2004. The cumulative loss of tourism revenue is estimated to be Cnd$700 million which translates into 7,000 jobs for Ontario’s tourism industry.
• It is estimated that the number of Ontario outbound trips to the U.S. will decrease by
0.5% (or 106,000 trips) in 2007 after the first stage of the WHTI implementation, and by up to 3.3% (736,000 trips) in 2008 after the second stage of the implementation, compared to the base-line scenario.
• The cumulative loss of Ontario residents’ trips to the U.S. is estimated to be
842,000 by 2008, which is equivalent to 5% of Ontario’s outbound trips to the U.S in 2004. The cumulative loss of Ontarians’ spending in the U.S. is estimated to be Cnd$200 million.
• It is estimated that of the total loss of 842,000 visits by Ontarians to the US, 100,000
visits in 2007 and 680,000 in 2008 would be redirected to a destination within the province. This would partially offset the decrease of U.S. visits to Ontario.
• The passport possession rate among American adults (18 year +) in Ontario’s near
and mid U.S markets was 37% in May 2005; while among Ontarian adults, it was 54%.
• In May 2005, 35% of U.S. adults in Ontario’s near and mid U.S. travel markets were
aware of the WHTI passport requirement. In addition, 33% of US adults in the same geographic area believed that a passport was already needed to visit Canada.
• The overall awareness of the WHTI passport requirement in Ontario was 48% in
May of 2005. In addition, 42% of Ontario adults believed that a passport was already needed to visit the U.S.
• Each year, about one-tenth (2.1 million in 2004) U.S. visits to Ontario use air or sea
to come to the province, while the majority (19.3 million in 2004) come by land. • Each year, about one-eighth (2.2 million in 2004) of the Ontario’s outbound visits to
the U.S. use air or sea, while the majority (16.1 million) use land-based transportation.
ii

Introduction
In April 2005, the U.S. Departments of State and Homeland Security announced the Western Hemisphere Travel Initiative (WHTI), requiring that US citizens have a valid passport to travel in the western hemisphere, including Canada, Mexico, Caribbean, Bermuda and Panama. The implementation of the WHTI is expected at the end of December 2006 for travel by air/sea and at the end of December 2007 for travel by land.
The purpose of this report is to investigate the impact of the WHTI on tourism in the province of Ontario and on Ontario’s travel to the U.S., for 2007 and 2008.
The basic information of the report is from two different surveys:
• Travel Intentions Survey, Ontario Ministry of Tourism (MTR), conducted by TNS Canadian Facts in May 2005. The population surveyed in the U.S. was U.S. adults (over 18 years old) in 11 states, Michigan, New York, Pennsylvania, Ohio, Illinois, Wisconsin, Minnesota, Indiana, Massachusetts, Maryland and Washington DC. These 11 states are Ontario’s near and mid U.S. markets, traditionally accounting for almost 90% of total US visitation to Ontario. The population surveyed in Canada was Canadian adults (over 18 years old) in Ontario, Winnipeg, Montreal and Quebec City
• 2004 International Travel Survey, conduced by Statistics Canada. The population surveyed was U.S residents of all age groups.
Information on the number of passports issued was obtained from the Canadian and US governments. Information from the ministry’s forecasting model was also used for quantifying the potential impact of the increase in travel cost due to WHTI.
For further information on this report, please contact us at: Tourism Research Unit Tourism Policy and Research Branch Ontario Ministry of Tourism 15th fl., 700 Bay Street Toronto, M7A 2E1 Tel: 416-325-7325 Fax: 416-314-7341 Email: [email protected] Website: www.research.tourism.gov.on.ca
iii
The Impact of the WHTI on U.S. Travel to Ontario Awareness of the WHTI in America
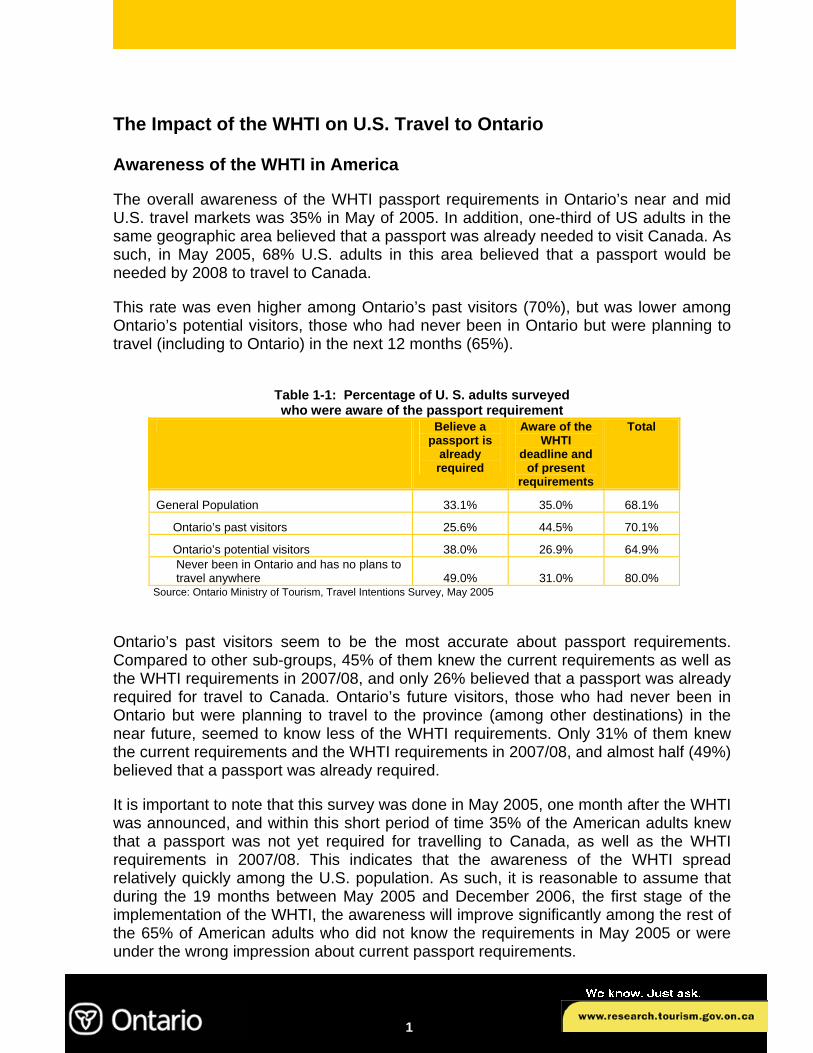
The overall awareness of the WHTI passport requirements in Ontario’s near and mid U.S. travel markets was 35% in May of 2005. In addition, one-third of US adults in the same geographic area believed that a passport was already needed to visit Canada. As such, in May 2005, 68% U.S. adults in this area believed that a passport would be needed by 2008 to travel to Canada.
This rate was even higher among Ontario’s past visitors (70%), but was lower among Ontario’s potential visitors, those who had never been in Ontario but were planning to travel (including to Ontario) in the next 12 months (65%).
Table 1-1: Percentage of U. S. adults surveyed who were aware of the passport requirement
Believe a passport is
already required
Aware of the WHTI
deadline and of present
requirements
Total
General Population 33.1% 35.0% 68.1%
Ontario’s past visitors 25.6% 44.5% 70.1%
Ontario’s potential visitors 38.0% 26.9% 64.9% Never been in Ontario and has no plans to travel anywhere 49.0% 31.0% 80.0%
Source: Ontario Ministry of Tourism, Travel Intentions Survey, May 2005
Ontario’s past visitors seem to be the most accurate about passport requirements. Compared to other sub-groups, 45% of them knew the current requirements as well as the WHTI requirements in 2007/08, and only 26% believed that a passport was already required for travel to Canada. Ontario’s future visitors, those who had never been in Ontario but were planning to travel to the province (among other destinations) in the near future, seemed to know less of the WHTI requirements. Only 31% of them knew the current requirements and the WHTI requirements in 2007/08, and almost half (49%) believed that a passport was already required.
It is important to note that this survey was done in May 2005, one month after the WHTI was announced, and within this short period of time 35% of the American adults knew that a passport was not yet required for travelling to Canada, as well as the WHTI requirements in 2007/08. This indicates that the awareness of the WHTI spread relatively quickly among the U.S. population. As such, it is reasonable to assume that during the 19 months between May 2005 and December 2006, the first stage of the implementation of the WHTI, the awareness will improve significantly among the rest of the 65% of American adults who did not know the requirements in May 2005 or were under the wrong impression about current passport requirements.
1
How many American adults currently have a valid passport?
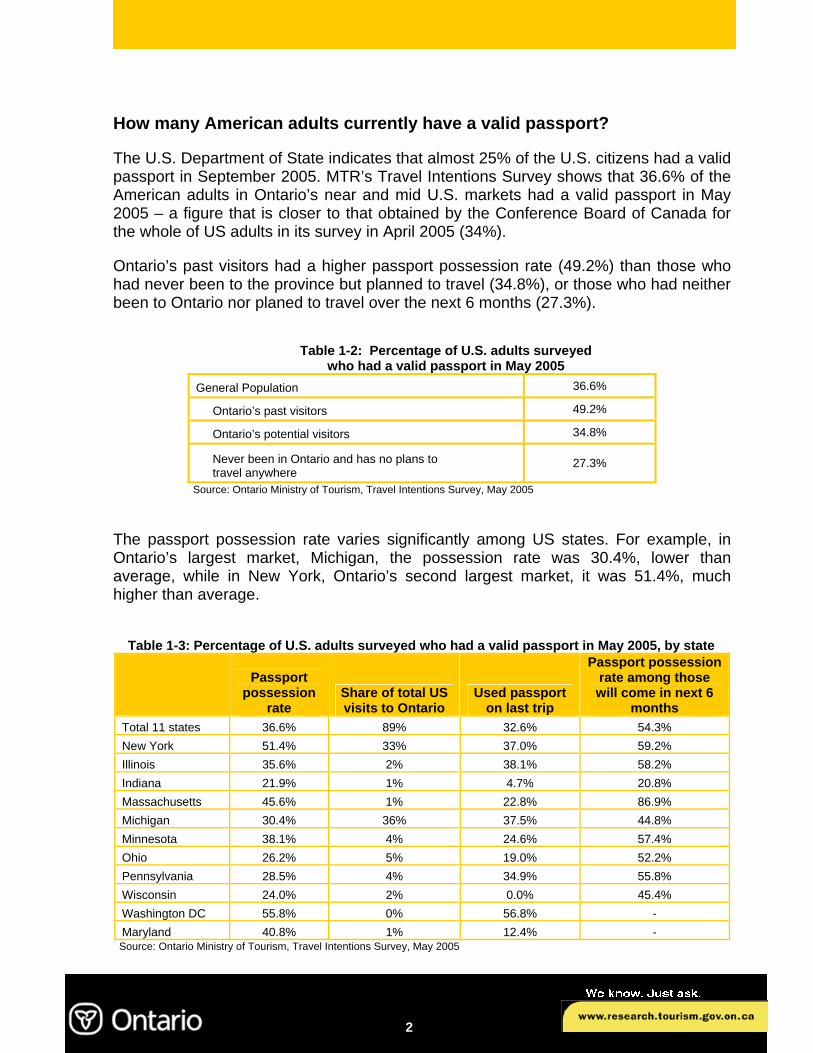
The U.S. Department of State indicates that almost 25% of the U.S. citizens had a valid passport in September 2005. MTR’s Travel Intentions Survey shows that 36.6% of the American adults in Ontario’s near and mid U.S. markets had a valid passport in May 2005 – a figure that is closer to that obtained by the Conference Board of Canada for the whole of US adults in its survey in April 2005 (34%).
Ontario’s past visitors had a higher passport possession rate (49.2%) than those who had never been to the province but planned to travel (34.8%), or those who had neither been to Ontario nor planed to travel over the next 6 months (27.3%).
Table 1-2: Percentage of U.S. adults surveyed
who had a valid passport in May 2005 General Population 36.6%
Ontario’s past visitors 49.2%
Ontario’s potential visitors 34.8%
Never been in Ontario and has no plans to travel anywhere
27.3%
Source: Ontario Ministry of Tourism, Travel Intentions Survey, May 2005
The passport possession rate varies significantly among US states. For example, in Ontario’s largest market, Michigan, the possession rate was 30.4%, lower than average, while in New York, Ontario’s second largest market, it was 51.4%, much higher than average.
Table 1-3: Percentage of U.S. adults surveyed who had a valid passport in May 2005, by state
Passport
possession rate
Share of total US visits to Ontario
Used passport on last trip
Passport possession rate among those will come in next 6
months Total 11 states 36.6% 89% 32.6% 54.3% New York 51.4% 33% 37.0% 59.2% Illinois 35.6% 2% 38.1% 58.2% Indiana 21.9% 1% 4.7% 20.8% Massachusetts 45.6% 1% 22.8% 86.9% Michigan 30.4% 36% 37.5% 44.8% Minnesota 38.1% 4% 24.6% 57.4% Ohio 26.2% 5% 19.0% 52.2% Pennsylvania 28.5% 4% 34.9% 55.8% Wisconsin 24.0% 2% 0.0% 45.4% Washington DC 55.8% 0% 56.8% - Maryland 40.8% 1% 12.4% -
Source: Ontario Ministry of Tourism, Travel Intentions Survey, May 2005
2
Among those who planned to come to Ontario in the next 6 months, the passport possession rate was even higher in May 2005 (54.3%). Those from Massachusetts had the highest passport possession rate (86.9%), while those from Indiana had the lowest (20.8%).
Almost one third (32.6%) of U.S adults in Ontario’s near and mid markets who travelled to Ontario between May 2004 and April 2005 already used a passport to cross the border. This proportion was even higher among those from Michigan (37.5%) and New York (37.0%). Overall, 60% of those who came to Ontario during this period and had a valid passport used it.
How many Americans are likely to have a passport by the time the WHTI comes into effect?
To answer this question we will need to examine four different groups of Americans: a) those that did not have a passport in May 2005, but had one in the past 5 years, b) business travellers, c) residents of the US who are not currently citizens and d) the remaining population.
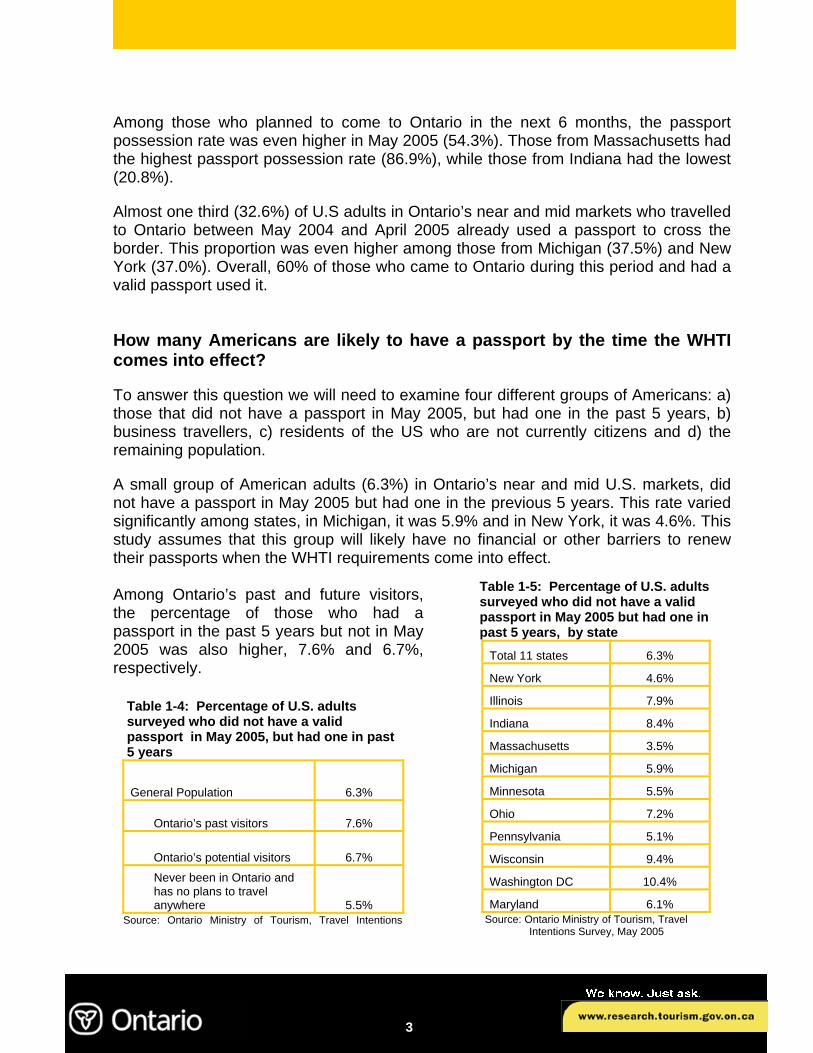
A small group of American adults (6.3%) in Ontario’s near and mid U.S. markets, did not have a passport in May 2005 but had one in the previous 5 years. This rate varied significantly among states, in Michigan, it was 5.9% and in New York, it was 4.6%. This study assumes that this group will likely have no financial or other barriers to renew their passports when the WHTI requirements come into effect. Among Ontario’s past and future visitors, the percentage of those who had a passport in the past 5 years but not in May 2005 was also higher, 7.6% and 6.7%, respectively.
3
Table 1-5: Percentage of U.S. adults surveyed who did not have a valid passport in May 2005 but had one in past 5 years, by state
Total 11 states 6.3%
New York 4.6%
Illinois 7.9%
Indiana 8.4%
Massachusetts 3.5%
Michigan 5.9%
Minnesota 5.5%
Ohio 7.2%
Pennsylvania 5.1%
Wisconsin 9.4%
Washington DC 10.4%
Maryland 6.1% Source: Ontario Ministry of Tourism, T avel r Intentions Survey, May 2005
Table 1-4: Percentage of U.S. adults surveyed who did not have a valid passport in May 2005, but had one in past 5 years
General Population 6.3%
Ontario’s past visitors 7.6%
Ontario’s potential visitors 6.7%
Never been in Ontario and has no plans to travel anywhere 5.5%
Source: Ontario Ministry of Tourism, Travel Intentions

The second group that would likely possess a valid passport by 2007 is business travellers. On average, 4.3% of the adults in Ontario’s near and mid U.S. markets who had been to Ontario were travelling for business purposes. It is assumed in this report that this group of travellers will either have a valid passport or get one when the time comes.
Figure 1-1: Number of U.S. passports issued, 1974-2004
2,415,0033,169,999
4,967,895
3,282,488
7,292,182
8,825,410
0
1,000,000
2,000,000
3,000,000
4,000,000
5,000,000
6,000,000
7,000,000
8,000,000
9,000,000
1974
1976
1978
1980
1982
1984
1986
1988
1990
1992
1994
1996
1998
2000
2002
2004
Source: U.S. Department of State In the last ten years, the number of U.S. passports issued each year (including new and renewals) more than doubled and reached 8.8 million in 2004 (Figure 1-1). Based on this historical trend and the increasing capacity that the U.S. government is putting in place to process the passport applications, it is estimated that the number of passports issued between 2005 and 2008 will grow on average of 400,000 annually. Since U.S. passports are valid for 10 years, and assuming that 100% of the passports issued get renewed in 10 years, the new passports issued between 2005 and 2008 will be around 4 million each year. In the last 10 years, on average 650,000 US residents were naturalized as American citizens each year. Since these residents already had a passport from their country of origin, it is assumed here that when they become US citizens they will obtain a US passport. Since MTR’s Travel Intentions Survey included U.S. citizens as well as US residents with no U.S. citizenship, when the members of the latter group become US citizens and apply for a U.S. passport the overall US residents’ passport possession rate recorded by the Survey (which includes US as well as non-US passports) will not be affected. Therefore, the new US passports issued to these new citizens will have to be excluded when calculating the future passport (of both US and non-US passports) possession rate of the US residents. Assuming that the naturalization rates will be maintained at the same levels of the last ten years, the annual passports issued to American citizens who did not have one
4
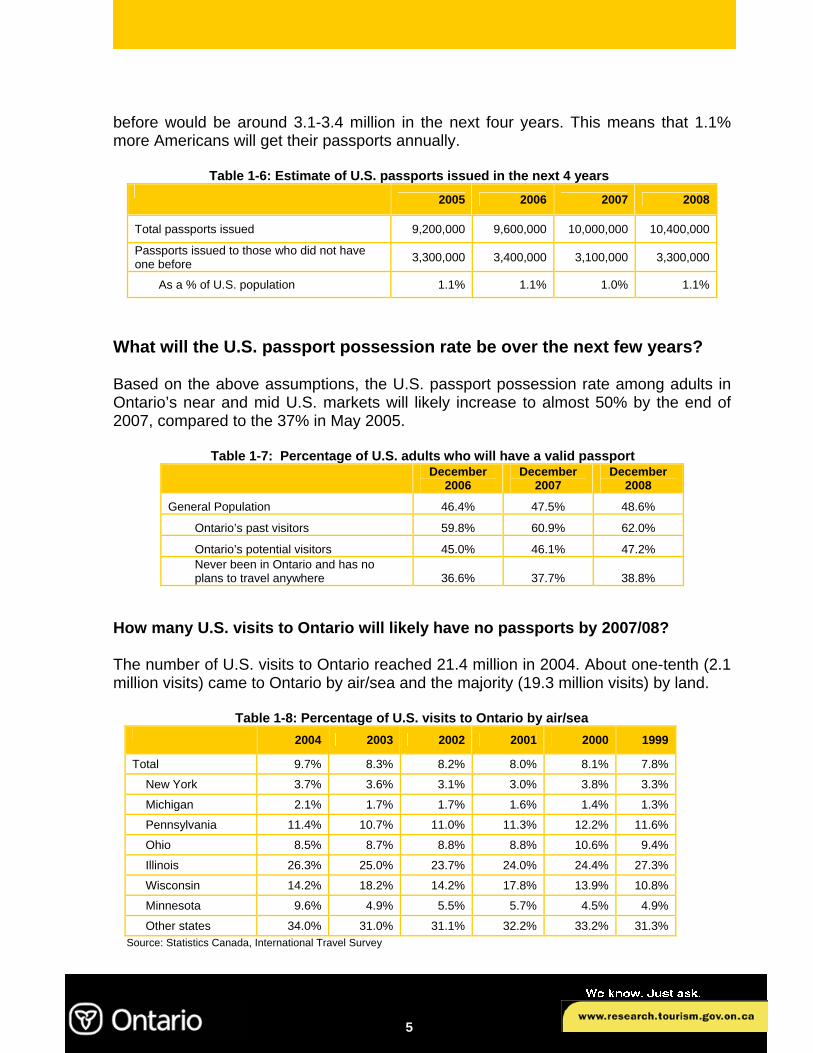
before would be around 3.1-3.4 million in the next four years. This means that 1.1% more Americans will get their passports annually. Table 1-6: Estimate of U.S. passports issued in the next 4 years
2005 2006 2007 2008
Total passports issued 9,200,000 9,600,000 10,000,000 10,400,000
Passports issued to those who did not have one before 3,300,000 3,400,000 3,100,000 3,300,000
As a % of U.S. population 1.1% 1.1% 1.0% 1.1%
What will the U.S. passport possession rate be over the next few years? Based on the above assumptions, the U.S. passport possession rate among adults in Ontario’s near and mid U.S. markets will likely increase to almost 50% by the end of 2007, compared to the 37% in May 2005. Table 1-7: Percentage of U.S. adults who will have a valid passport
December 2006
December 2007
December 2008
General Population 46.4% 47.5% 48.6%
Ontario’s past visitors 59.8% 60.9% 62.0%
Ontario’s potential visitors 45.0% 46.1% 47.2% Never been in Ontario and has no plans to travel anywhere 36.6% 37.7% 38.8%
How many U.S. visits to Ontario will likely have no passports by 2007/08? The number of U.S. visits to Ontario reached 21.4 million in 2004. About one-tenth (2.1 million visits) came to Ontario by air/sea and the majority (19.3 million visits) by land. Table 1-8: Percentage of U.S. visits to Ontario by air/sea
2004 2003 2002 2001 2000 1999
Total 9.7% 8.3% 8.2% 8.0% 8.1% 7.8%
New York 3.7% 3.6% 3.1% 3.0% 3.8% 3.3%
Michigan 2.1% 1.7% 1.7% 1.6% 1.4% 1.3%
Pennsylvania 11.4% 10.7% 11.0% 11.3% 12.2% 11.6%
Ohio 8.5% 8.7% 8.8% 8.8% 10.6% 9.4%
Illinois 26.3% 25.0% 23.7% 24.0% 24.4% 27.3%
Wisconsin 14.2% 18.2% 14.2% 17.8% 13.9% 10.8%
Minnesota 9.6% 4.9% 5.5% 5.7% 4.5% 4.9%
Other states 34.0% 31.0% 31.1% 32.2% 33.2% 31.3% Source: Statistics Canada, International Travel Survey
5

Note that this report uses data on a “visit” basis, which refers to a stop made by a traveller in Ontario, and not a person basis. As such, 4 visits to Ontario could be one person visiting Ontario 4 times during a year or four people each visiting Ontario once. According to the International Travel Survey, each year, 76% - 79% of the U.S. visits to Ontario who were asked whether they had been to Canada in the past are repeat visits with an average number of visits to Canada over a 5 year span of 4 per year. The remaining were first-time visits or those who did not specify whether the visit was a repeat visit.
Table 1-9: Percentage of U.S. visits to Ontario that were repeat visits (among those who were asked this question)
2004 2003 2002 2001 2000 1999
Total 78.9% 78.5% 77.1% 75.9% 75.9% 75.6% New York 74.8% 72.6% 72.6% 69.6% 68.8% 69.2% Michigan 82.6% 81.5% 81.7% 80.9% 79.3% 79.2% Pennsylvania 74.5% 75.1% 73.8% 71.9% 69.9% 70.2% Ohio 74.6% 74.1% 74.2% 74.2% 74.2% 71.3% Illinois 74.5% 78.1% 76.5% 73.7% 76.4% 75.3% Wisconsin 78.9% 73.8% 75.7% 74.1% 72.1% 73.6% Minnesota 88.4% 91.2% 87.5% 83.7% 87.4% 84.9% Other states 79.9% 80.6% 76.8% 76.9% 78.2% 78.3%
Source: Statistics Canada, International Travel Survey However, only 40% of the total US visits to Ontario were asked whether they had been in Canada before and the majority (85%) of those who were asked this question were overnight visitors. For the remaining 60% of the visits to Ontario, all of which were same-day visits by automobiles, there is no such information available. This report assumes that this group has the same proportion of repeat visits and frequency of trips to Canada, as the 40% of visits who had been asked this question. The Travel Intentions Survey provides a more precise picture of the repeat trips taken by those who had been in Ontario. The average number of overnight trips to Ontario by those who had been in Ontario between May 2004 and April 2005 was 2.2.
Table 1-10: The average number of overnight trips to Ontario per person during the period of May 2004 –April 2005
Total 2.2
Visiting Friends & Relatives 2.5
Visiting Cottage /Country Homes 1.5
Other Pleasure 1.8
Business 2.2
Other reasons 1.2 Source: Ministry of Tourism, Travel Intentions Survey, May 2005
6

Assuming the proportion of repeat visits and the frequency of overnight trips taken by those repeat visitors remain the same over the next several years, it is estimated that 892,000 U.S. person visits to Ontario by air/sea will likely have no passports in 2007, accounting for 4.2% of the 21.2 million projected person visits. In 2008, 8.1 million U.S. person visits to Ontario by land will likely have no passport, accounting for 36.3% of the projected 22.2 million person visits. Table 1-11: Number of U.S. visits to Ontario that will likely have no passports
By the end of 2006 By the end of 2007
Total (000)
% of total visits to Ontario
Total (000)
% of total visits to Ontario
Total 892 4.2% 8,058 37.7%
First-time visitors 238 1.1% 2,171 10.1%
Repeat visitors 654 3.1% 5,887 27.5%
How this will affect U.S. visits to Ontario? In addition to passport possession rate, the proportion of repeat visits and the frequency of trips taken by repeat visitors, the way in which visitors will amortize the costs of a new passport is also an important factor in estimating the WHTI impacts. The cost of a passport for an American adult is US$97 and valid for ten years. The average spending by U.S. visitors to Ontario in 2004 was Cnd$240.35 per person per trip. This includes their spending on transportation from the U.S. to Canada and spending in Ontario on accommodation, food and beverage, public transportation, private transportation, recreation and entertainment and retail. Table 1-12: Average spending per U.S. visitor to Ontario, 2004
U.S. $240.35 New York $122.59 Michigan $130.43 Pennsylvania $317.66 Ohio $271.63 Illinois $579.24 Wisconsin $495.06 Minnesota $253.37 Other states $587.46
Source: Statistics Canada, International Travel Survey. This report presents three different impact scenarios based on different assumptions about the proportion of repeat visits, the frequency of trips taken by repeat visits and the amortization of the passport costs.
7

High Scenario:
Assumes that all travellers who did not have a passport will amortise the costs of the new passport over one trip only (the next trip).
40% of the U.S. visits were asked whether they had been in Canada before (mostly overnight visitors). Among these 40% visits, 79% had been to Canada within the last five years, with an average number of 4 overnight trips per year, and 21% were first-time visits or did not specify
Medium Scenario:
Assumes that travellers who did not have a passport will amortise the costs of the passport over the number of trips to Canada and that the number of previous trips to Canada for the 60% of visits for which no information exists is the same as for the 40% visits for which information exists.
Total U.S. visits to Ontario
( 21.4 million in 2004)
60% of the visits that had no information on past visitation were primarily same-day visits by auto.
Low Scenario:
Assumes that travellers who did not have a passport will amortise the costs of the passport over the number of trips to Canada and that the visits for which no information is available(60%) have the same proportion of repeat visits as the group for which information is available (40%), but double the frequency of repeat trips.
Applying the price elasticity of demand derived from the Ministry’s forecasting model, which represents the U.S. residents’ reaction to a change in the costs of their trip to Ontario, it is estimated that, under the medium scenario, the number of visits from U.S. to Ontario will decrease by 1.3% (or 290,000 visits) in 2007 and by 13.6% (or 3.2 million visits) in 2008, compared to the base-line scenarios, in which the WHTI passport requirements did not exist. Table 1-13: Estimated loss due to the WHTI for Ontario’s tourism industry
2007 2008
Person visits (‘000) 290 3,199
Tourism Receipts (CND$ millions) $58 $652
Number of tourism jobs in Ontario 600 6,500
Under the High Scenario, the loss of U.S. person visits to Ontario’s tourism industry could reach 1.2 million in 2007 and 12.4 million in 2008, a decline of 5.6% and 56.0%, respectively, compared to the base-line scenario for those years. It should be noted that this is an extreme scenario which assumes that those who did not have a passport
8

will get a passport for travel only once and only to Ontario during the entire 10 years. While in reality, Americans travelled much more often once they have a passport. For example, in 2004, the median number of trips to overseas destinations (excluding Canada and Mexico, and over 80% of these trips require a passport) by Americans was 2, which means that of those Americans who traveled to overseas destinations, half of them took one trip in 2004 and the other half took at least two trips in the same year. Under the Low Scenario, the loss of person visits would be 290,000 in 2007 and 2.8 million in 2008, a decline of 1.3% and 12.7%, respectively, compared to the base-line scenario.
9

The Impact of the WHTI on Travel from Ontario to the U.S. Awareness of the WHTI in Ontario
Compared to the 35% overall awareness in the US the of the WHTI passport requirements, in Ontario, Quebec City, Montreal and Winnipeg it was 47.6% (48.4% in Ontario) in May 2005. In addition, 42.2% of Canadian adults in the aforementioned geographic area believed that a passport was already required to visit the U.S. As such, in May 2005, almost 90% Canadian adults (90.1% in Ontario) believed that a passport would be needed by 2008 to travel to the U.S.
This rate was even higher among Ontarians who were planning to travel to the US (92%), but lower among those who did not plan to travel to the U.S. (89%). Given such a high level of awareness, it is reasonable to believe that by the time the WHTI passport requirements are implemented, the number of people who are still not aware of the requirements would be minimal.
Table 2-1: Percentage of Canadian adults surveyed who were
aware of the WHTI passport requirement Believe a
passport is already required
Aware of the deadline and
of present requirements
Total
General population 42.2% 47.6% 89.8% Future visitors to the U.S. in 6 months 35.8% 56.2% 92.0% Have no plan to travel to the U.S. 44.5% 44.4% 88.9%
Source: Ontario Ministry of Tourism, Travel Intentions Survey, May 2005 How many Canadian adults currently have a valid passport? According to Passport Canada, almost 35% of Canadian citizens had a valid passport in 2005. The survey from the Conference Board of Canada indicates that, in April 2005, 41% of Canadian adults (over the age of 18) had a valid passport. MTR’s survey in May 2005 shows that 54.3% of the Canadian adults in Ontario, Winnipeg, Montreal and Quebec City had a valid passport (54.1% in Ontario). Again, those who were planning to visit the U.S. over the next 6 months had higher passport possession rate of 69.2% than those who did not plan to travel to the U.S. (48.7%). Table 2-2: Percentage of Canadian adults surveyed who had a valid passport in May 2005
General population 54.3%
Future visitors to the U.S. in 6 months 69.2%
Have no plans to travel to the U.S. 48.7% Source: Ontario Ministry of Tourism, Travel Intentions Survey, May 2005
10

And how many are likely to get one? Over one-tenth of the adults (11.2%) in Ontario, Winnipeg, Montreal and Quebec City didn’t have a passport in May 2005, but had one in the previous 5 years (11.2% in Ontario). Again, this rate was higher among those who planed to visit the U.S. over the next 6 months (12.3%) and lower among those who did not plan to visit the U.S. (10.8%). This group of travellers is assumed in this report to be facing no financial or other barriers in getting a passport when the time comes.
Table 2-3: Percentage of Canadian adults surveyed who didn’t have a valid passport in May 2005 but had one in past 5 years
General population 11.2%
Future visitors to the U.S. in 6 months 12.3%
Have no plan to travel to the U.S. 10.8% Source: Ontario Ministry of Tourism, Travel Intentions Survey, May 2005
The incidence of travelling to the U.S. for business purposes among Ontario population is not available. This report assumes that it is the same as that in the U.S. for trips to Ontario (according to the Travel Intentions Survey, the percentage of Americans planning to come to Ontario for business trips is almost identical to that of Ontario residents planning business trips to the US). This means that 4.3% of the Ontario adults travel to the U.S. for business purposes. Again, this report assumes that these travellers either have a passport or would get one when the time comes. In the last five years, the number of Canadian passports issued (including new and renewals) increased by over 50% and reached 3 million in 2004 (Figure 2-1).
Figure 2-1: Number of Canadian passports issued, 1998-2004
1,624,732 1,926,6282,280,328
3,000,000
0
1,000,000
2,000,000
3,000,000
4,000,000
1998
1999
2000
2001
2002
2003
2004
Source: Passport Canada
11

Based on this historical trend, it is estimated that the number of Canadian passports issued between 2005 and 2008 will grow on average by 300,000 annually. Since a Canadian passport is valid only for 5 years, assuming that 100% of the people will renew their passports in 5 years, the number of new passports issued between 2005 and 2008 will be around 1.5 million each year.
In the last ten years, the number of Canadian residents being naturalized as Canadian citizens is estimated to be 200,000 each year. Again, these people already had a valid passport before becoming Canadian citizens; therefore they will not affect the passport possession rate among Canadian residents, as recorded by the Survey, should they get a Canadian passport. Therefore, the new passports issued to them have to be excluded when calculating the future passport possession rate of Canadian residents.
Assuming that the naturalization rates remain the same over the next several years, the passports issued to those Canadian citizens who did not have one before would be around 1.3 million annually between 2005 and 2008. This means that 4.1% more Canadians will get their passports each year.
Table 2-4: Estimate of the number of passports issued to Canadian citizens
in the next 4 years
2005 2006 2007 2008
Total passports issued 3,300,000 3,600,000 3,900,000 4,200,000
Passports issued to those who didn’t have one before 1,200,000 1,300,000 1,400,000 1,400,000
% of Canadian population 3.8% 4.1% 4.3% 4.4%
How will the Canadian passport possession rate change by 2007/08?
Based on the above assumptions, the Canadian passport possession rate among adults in Ontario, Winnipeg, Montreal and Quebec City will likely increase to almost 80% by the end of 2007 compared to 54% in May 2005.
Table 2-5: Percentage of Canadian adults surveyed
who will have a valid passport December
2006 December
2007 December
2008
Total adults 73.2% 77.3% 81.4%
Future visitors to the U.S. over the next 6 months 73.2% 77.3% 81.4%
12

How many Ontario visits to the U.S. would have no passports by 200708?
In 2004, outbound visit from Ontario to the U.S. reached 18.3 million. About one-eighth (12% or 2.2 million visits) went to the States by air/sea and the rest (88% or 16.1 million visits) went by land.
Table 2-6: Percentage of Ontario visits to the U.S. by air/sea
2004 2003 2002 2001 2000 1999
Total visits 12.0% 11.2% 10.9% 11.8% 12.4% 11.8%
Source: Statistics Canada, International Travel Survey. Again, this report uses data on a “visit” basis for Ontario residents’ trips to the U.S., and not on a person basis. As such 4 visits to the US could be one person making 4 trips or four people making each one trip.
There is no information available on how many Canadians or Ontarians take their first trip to the U.S. each year, but other information supports the assumption that, proportionally, more Canadians had been to the U.S. than Americans to Canada. For example, according to the Ministry’s Travel Activities and Motivation Survey (2000), 33% of adult Canadians had visited the US over a two year period, while only 15% of Americans had visited Canada over the same period. As a result, the proportion of Ontarians who had visited the U.S. for the first time would be equal or lower than that of Americans who visited Ontario for the first time. This report assumes that it is equal.
In addition to the higher incidence of visitation, Canadians visit the US more frequently than Americans visit Canada. It is estimated that, in 2004, Ontario residents who went to the U.S. for non-business purposes took an average of 4.4 overnight trips, while the U.S. residents in Ontario’s near and mid U.S. markets who came to Ontario during the 12 months period of May 2004 - April 2005 took an average of 2.2 non-business overnight trips. Based on the above assumptions, it is estimated that 576,000 visits (3.2% of Ontario’s outbound visits to the U.S.) would have no passports in 2007 and 3.4 million visits (18.5% of Ontario’s outbound visits to the U.S.) would have no passports in 2008. Table 2-7: Number of Ontario visits to the U.S that likely will have no passports
By the end of 2006 By the end of 2007 Total (000)
% of total visits to the U.S
Total (000)
% of total visits to the U.S.
Total 576 3.2% 3,370 18.5%
First-time visitors 124 0.7% 723 4.0%
Repeat visitors 452 2.5% 2,646 14.5%
13
How this will affect Ontario’s outbound travel to the U.S.?
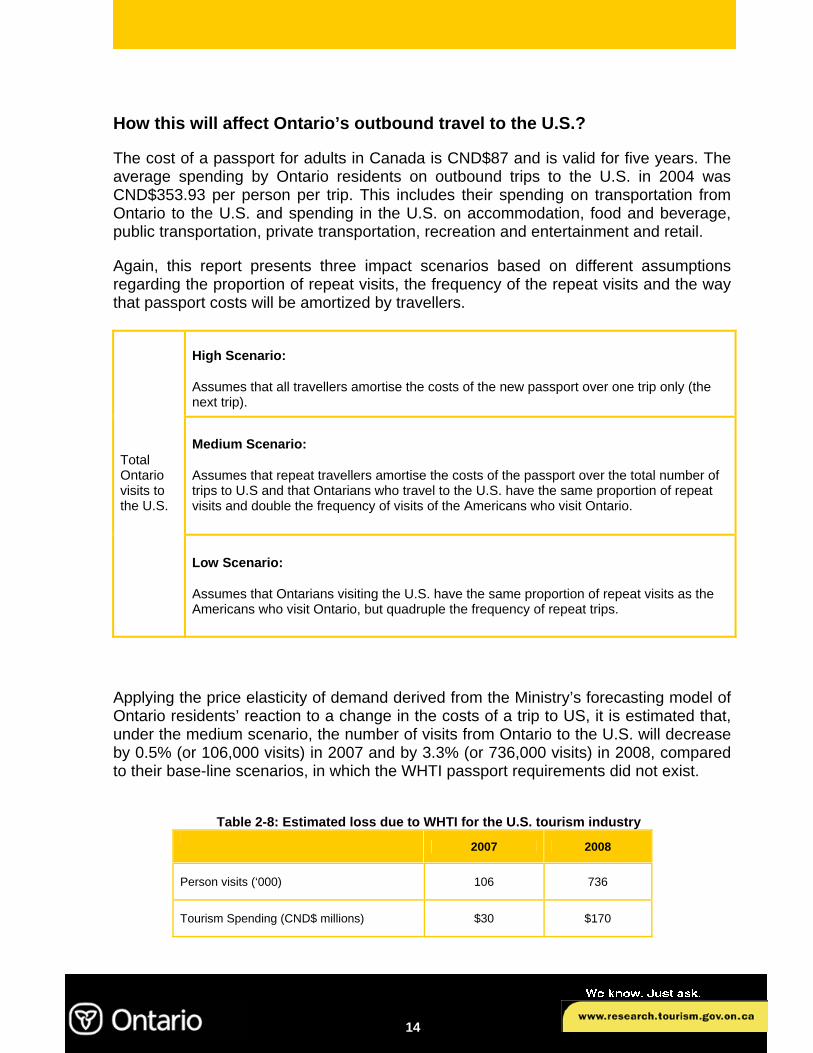
The cost of a passport for adults in Canada is CND$87 and is valid for five years. The average spending by Ontario residents on outbound trips to the U.S. in 2004 was CND$353.93 per person per trip. This includes their spending on transportation from Ontario to the U.S. and spending in the U.S. on accommodation, food and beverage, public transportation, private transportation, recreation and entertainment and retail.
Again, this report presents three impact scenarios based on different assumptions regarding the proportion of repeat visits, the frequency of the repeat visits and the way that passport costs will be amortized by travellers.
High Scenario:
Assumes that all travellers amortise the costs of the new passport over one trip only (the next trip).
Medium Scenario:
Assumes that repeat travellers amortise the costs of the passport over the total number of trips to U.S and that Ontarians who travel to the U.S. have the same proportion of repeat visits and double the frequency of visits of the Americans who visit Ontario.
Total Ontario visits to the U.S.
Low Scenario:
Assumes that Ontarians visiting the U.S. have the same proportion of repeat visits as the Americans who visit Ontario, but quadruple the frequency of repeat trips.
Applying the price elasticity of demand derived from the Ministry’s forecasting model of Ontario residents’ reaction to a change in the costs of a trip to US, it is estimated that, under the medium scenario, the number of visits from Ontario to the U.S. will decrease by 0.5% (or 106,000 visits) in 2007 and by 3.3% (or 736,000 visits) in 2008, compared to their base-line scenarios, in which the WHTI passport requirements did not exist.
Table 2-8: Estimated loss due to WHTI for the U.S. tourism industry
2007 2008
Person visits (‘000) 106 736
Tourism Spending (CND$ millions) $30 $170
14

Under the High Scenario, the U.S tourism industry could lose 333,000 person visits from Ontario in 2007 and 2.0 million in 2008, a decline of 1.6% and 9.1%, respectively, compared to the base-line scenario. Again, this is an extreme scenario which assumes that those who did not have a passport will get a passport for travel only once and only to the U.S during the entire 5 years. While in reality, Ontario residents travelled much more often once they have a passport. For example, in 2004, those Ontario residents who went to overseas countries (excluding the US, and all of these trips require a passport) took an average of 3.5 overnight trips per person for non-business purposes.
Under the Low Scenario, the loss of person visits would still be 290,000 in 2007 and 615,000 in 2008, a decline of 1.3% and 2.7%, respectively, compared to the base-line scenario.
15

Net Impact on tourism in Ontario and its regions Some Ontario residents who do not have a passport by the end of 2007 may substitute domestic travel for international travel. Historically, the probability of Ontario residents travelling in the province is 93.8% of the total visits they took in Canada. As such, under the Medium Scenario in the previous section, it is estimated that 100,000 of the total “impacted” visits from Ontario to the U.S. in 2007 and the 680,000 visits in 2008 will be re-directed to Ontario destinations. As such, the overall loss of person visits to Ontario will be reduced to 183,000 in 2007 and 2.4 million in 2008. Table 3-1: Estimated net impact of travel to/from Ontario (‘000)
2006 2007
2008 2009
Base-line
Inbound 123,037 127,399 131,424 135,494
Ontario 94,512 97,829 100,830 103,833
Other Canadian provinces 5,758 5,647 5,532 5,427
U.S. 20,268 21,230 22,221 23,238
Overseas countries 2,499 2,692 2,841 2,995
Outbound 30,950 32,445 33,850 35,261
Other Canadian provinces 7,565 7,753 8,138 8,489
U.S. 20,326 21,504 22,396 23,327
Overseas countries 3,059 3,188 3,316 3,445
With the potential impact of the WHTI
Inbound 123,037 127,216 129,067 133,019
Ontario 94,512 97,926 101,502 104,525
Other Canadian provinces 5,758 5,647 5,532 5,427
U.S. 20,268 20,950 19,192 20,071
Overseas countries 2,499 2,692 2,841 2,955
Outbound 30,950 32,343 33,167 34,649
Other Canadian provinces 7,565 7,759 8,194 8,547
U.S. 20,326 21,397 21,657 22,557
Overseas countries 3,059 3,188 3,316 3,445 Notes: 1. Base-line is provided by Global Insight, refers to projection under the scenario of no WHTI passport requirements. 2. Discrepancies are due to rounding While U.S. visits to Ontario are expected to decline by 13.6% in 2008 according to the Medium Scenario, the number of visits from New York State could decrease by as much as 18.4%, and those from Michigan could decrease by as much as 28.0%. As such, destinations in the province with higher proportion of American visitors will be affected disproportionately, e.g., Essex, the Niagara Region and North-western Ontario.
16
This report did not differentiate the impact by length of stay (same-day visitors vs. overnight visitors), primarily because the lack of data to perform this type of analysis. It will only be noted here that the impact on same day visits may be different than that of overnight visitors for two reasons: First, from a spending perspective, because the average spending of same-day visitors is usually lower than that of overnight visitors, the increase in the trip-costs of a same-day visits will be higher in relative terms and as such result in a larger decrease of same-day visits than overnight visits. On the other hand, from the trip frequency perspective, same-day visitors may have more repeat visits than overnight visitors and as such the passport costs could be lower on a per visit basis, i.e., amortized over a larger number of trips. Due to these two conflicting factors, it is not possible to predict what the impact might be without any further information.
17


