28
The Impact of Tire Design on Vehicle Braking Performance Frank Walloch – Continental Tire North America
| Date post: | 12-Mar-2018 |
| Category: |
Documents |
| Upload: | dangkhuong |
| View: | 227 times |
| Download: | 3 times |
page 1
The Impact of Tire Design onVehicle Braking Performance
Frank Walloch – Continental Tire North America
page 2
Agenda
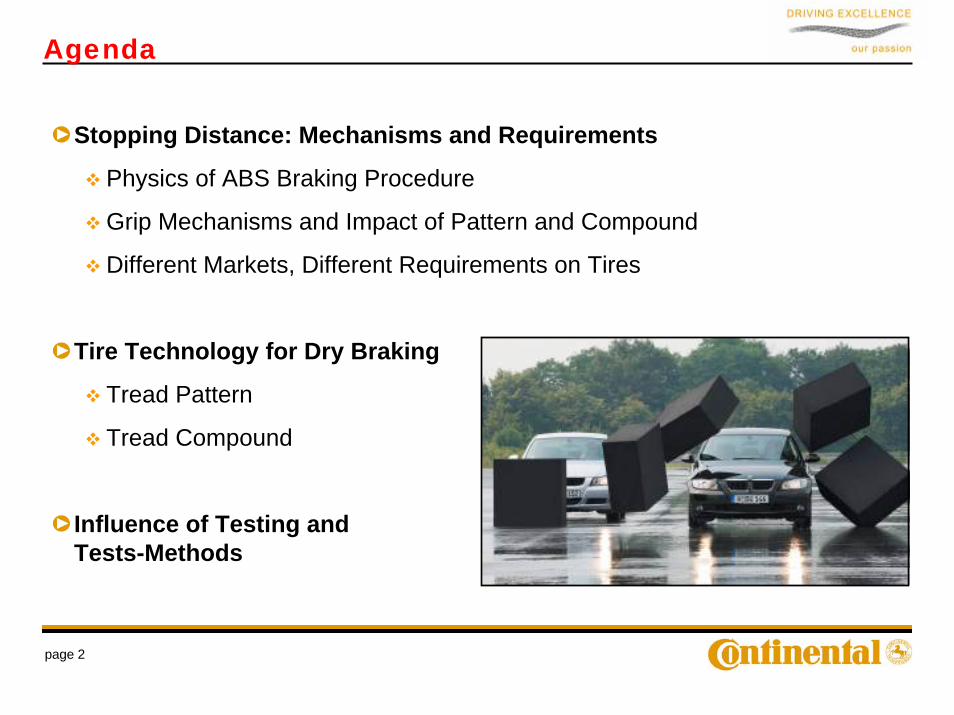
Stopping Distance: Mechanisms and Requirements
Physics of ABS Braking Procedure
Grip Mechanisms and Impact of Pattern and Compound
Different Markets, Different Requirements on Tires
Tire Technology for Dry Braking
Tread Pattern
Tread Compound
Influence of Testing andTests-Methods
page 3
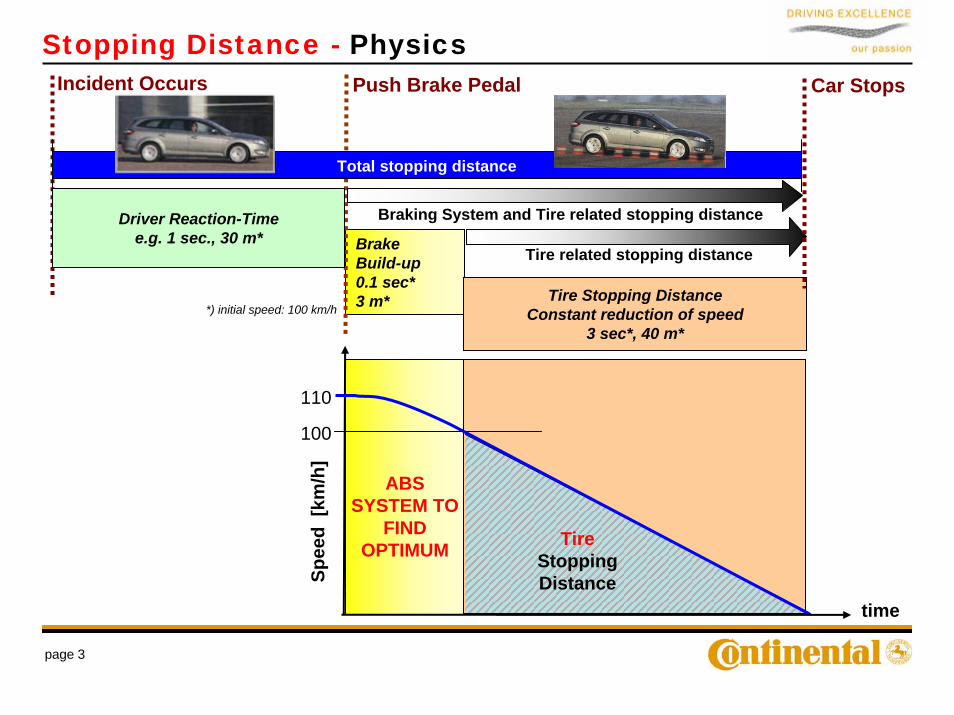
BrakeBuild-up0.1 sec*3 m*
Stopping Distance - Physics
Tire Stopping DistanceConstant reduction of speed
3 sec*, 40 m*
Braking System and Tire related stopping distance
Tire related stopping distance
Push Brake Pedal Car Stops
*) initial speed: 100 km/h
Driver Reaction-Timee.g. 1 sec., 30 m*
110
100
Spee
d [k
m/h
]
Tire Stopping Distance
time
ABS SYSTEM TO
FIND OPTIMUM
Total stopping distance
Incident Occurs
page 4
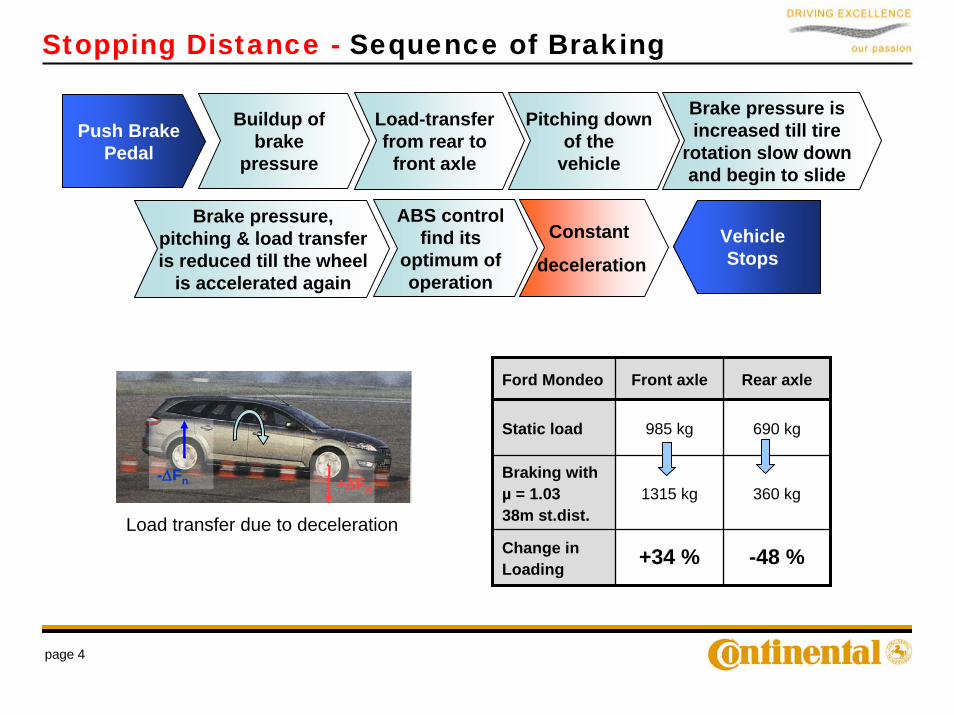
Stopping Distance - Sequence of Braking
Ford Mondeo Front axle Rear axle
Static load 985 kg 690 kg
Braking with µ = 1.0338m st.dist.
1315 kg 360 kg
Change in Loading +34 % -48 %
Push Brake Pedal
Buildup of brake
pressure
Pitching down of the
vehicle
Load-transfer from rear to
front axle
Brake pressure is increased till tire
rotation slow down and begin to slide
Brake pressure, pitching & load transfer is reduced till the wheel
is accelerated again
ABS control find its
optimum of operation
Constant
decelerationVehicle Stops
+ΔFn-ΔFn
Load transfer due to deceleration
page 5
µ
80 1000
0,5
1,0
slip[%]6040200
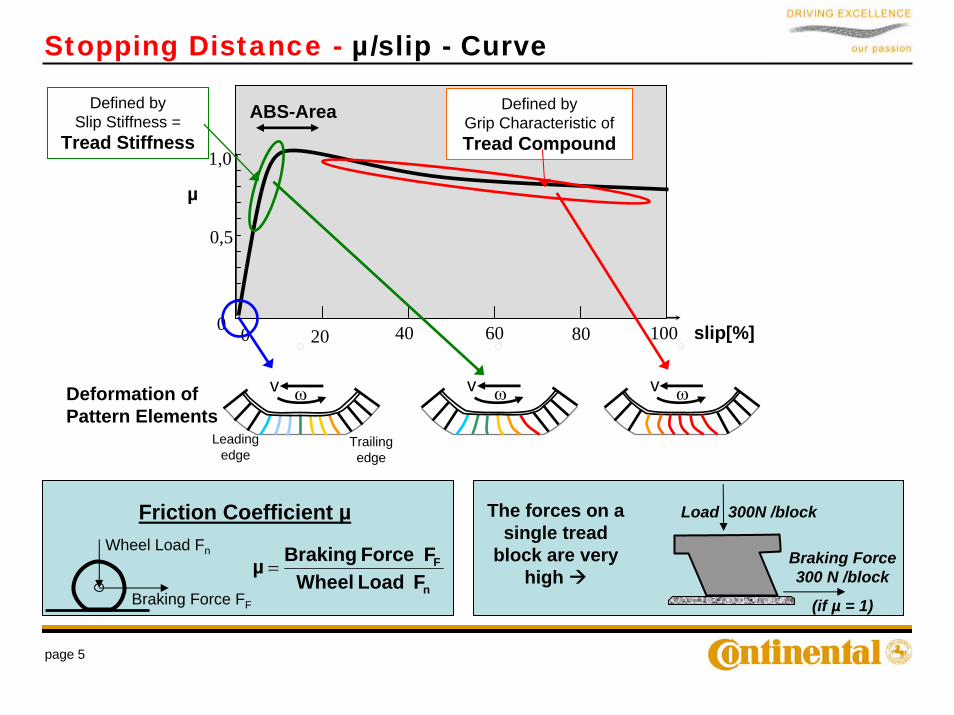
Stopping Distance - µ/slip - Curve
Deformation of Pattern Elements
ωv
Leadingedge
Trailingedge
ωv
Defined bySlip Stiffness =
Tread Stiffness
ωv
Defined byGrip Characteristic of Tread Compound
ABS-Area
Friction Coefficient µ
n
F
F Load WheelF Force Brakingµ =
Wheel Load Fn
Braking Force FF
The forces on a single tread
block are very high
Load 300N /block
Braking Force300 N /block
(if µ = 1)
page 6
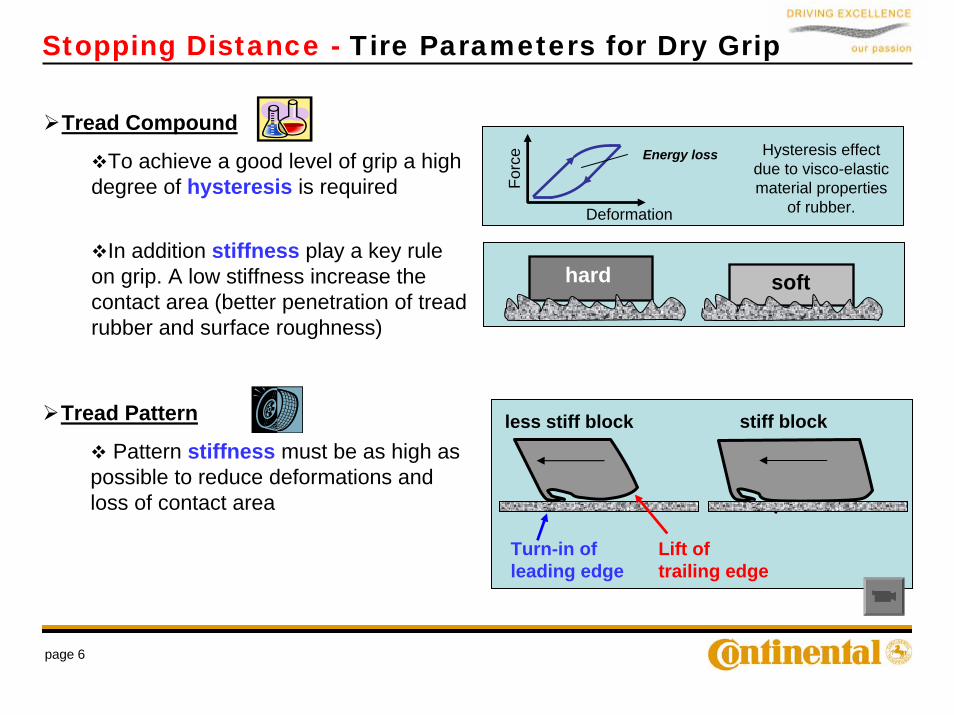
Stopping Distance - Tire Parameters for Dry Grip
Tread Compound
To achieve a good level of grip a high degree of hysteresis is required
In addition stiffness play a key rule on grip. A low stiffness increase the contact area (better penetration of tread rubber and surface roughness)
Tread Pattern
Pattern stiffness must be as high as possible to reduce deformations and loss of contact area
hard soft
Turn-in of leading edge
Energy loss
Forc
e
Deformation
Lift of trailing edge
less stiff block stiff block
Hysteresis effect due to visco-elastic material properties
of rubber.
page 7
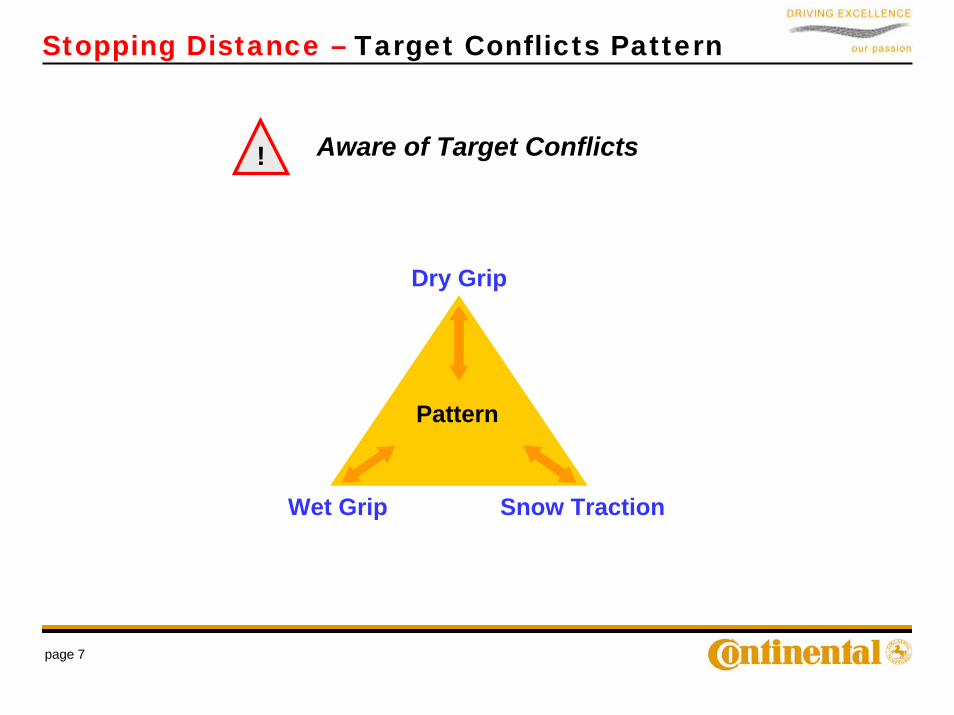
Aware of Target Conflicts!
Dry Grip
Wet Grip Snow Traction
Pattern
Stopping Distance – Target Conflicts Pattern
page 8
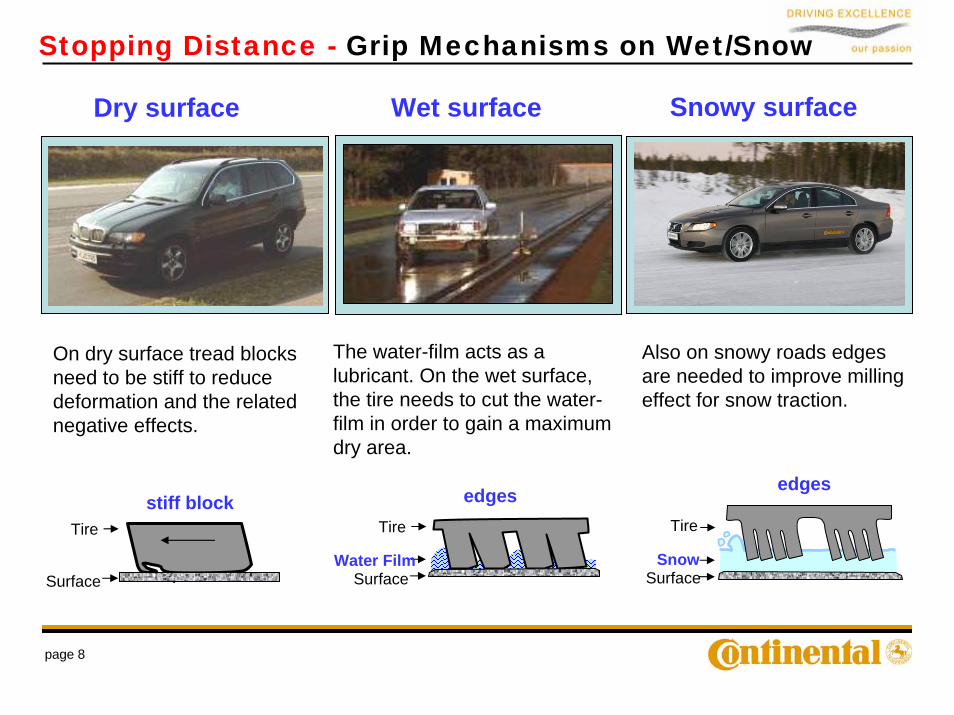
Stopping Distance - Grip Mechanisms on Wet/Snow
Water FilmSurface
Tire
The water-film acts as a lubricant. On the wet surface, the tire needs to cut the water-film in order to gain a maximum dry area.
Also on snowy roads edges are needed to improve milling effect for snow traction.
On dry surface tread blocks need to be stiff to reduce deformation and the related negative effects.
stiff block
Dry surface Wet surface Snowy surface
SnowSurface
Tire
Surface
Tire
edges edges
page 9
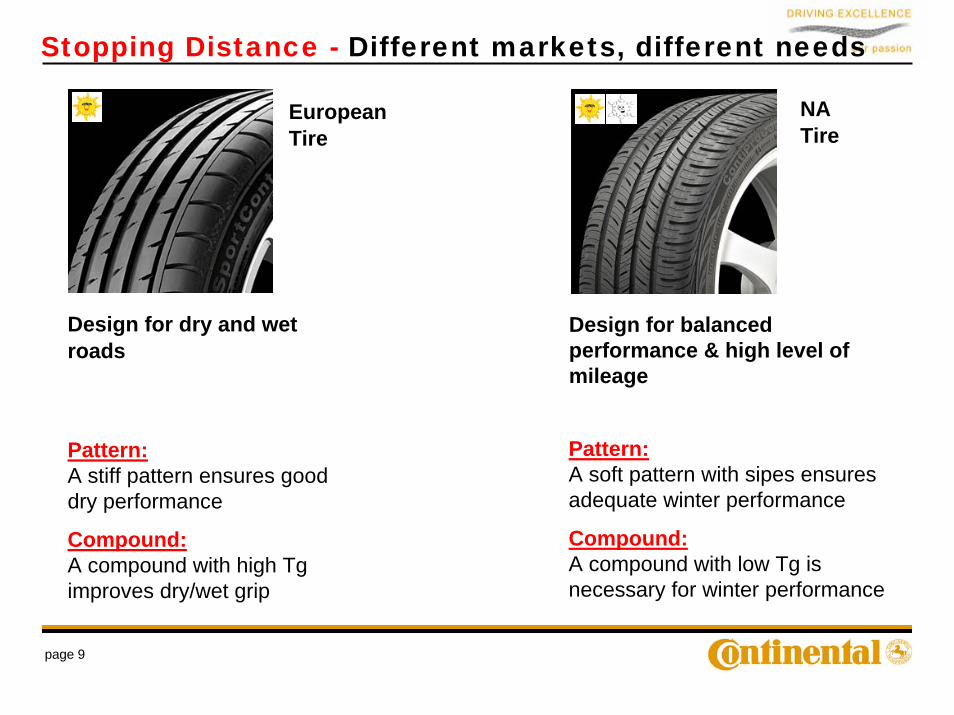
Stopping Distance - Different markets, different needs
Design for balanced performance & high level of mileage
Design for dry and wet roads
Pattern:A soft pattern with sipes ensures adequate winter performance
Compound:A compound with low Tg is necessary for winter performance
Pattern:A stiff pattern ensures good dry performance
Compound:A compound with high Tg improves dry/wet grip
European Tire
NATire
page 10
STOPPING DISTANCE
Technology and Application
TREAD PATTERN
page 11
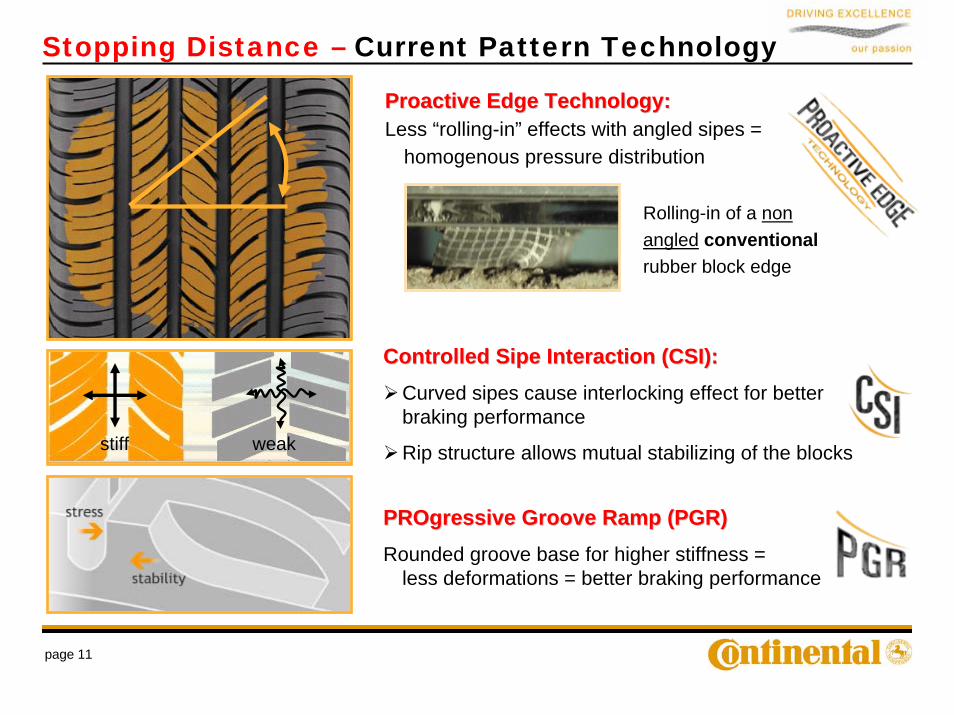
PROgressive Groove Ramp (PGR)PROgressive Groove Ramp (PGR)Rounded groove base for higher stiffness =
less deformations = better braking performance
Proactive Edge Technology:Proactive Edge Technology:Less “rolling-in” effects with angled sipes =
homogenous pressure distribution
Rolling-in of a non angled conventional rubber block edge
Controlled Sipe Interaction (CSI):Controlled Sipe Interaction (CSI):Curved sipes cause interlocking effect for better braking performance
Rip structure allows mutual stabilizing of the blocksstiff weak
Stopping Distance – Current Pattern Technology
page 12
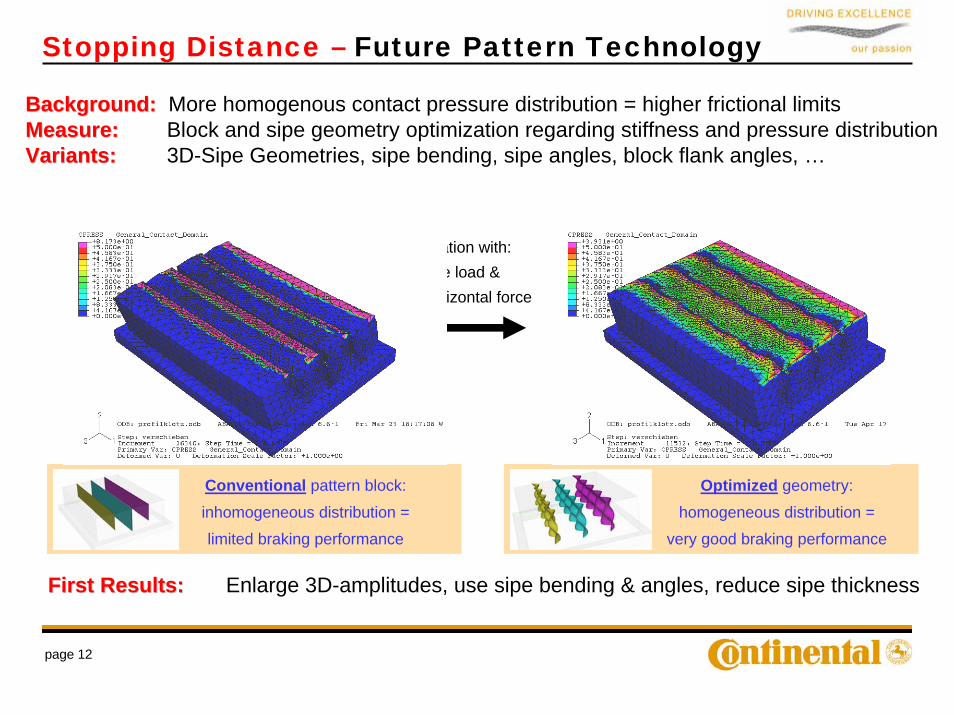
Simulation with:same load &
same horizontal force
Background:Background: More homogenous contact pressure distribution = higher frictional limitsMeasure:Measure: Block and sipe geometry optimization regarding stiffness and pressure distributionVariants:Variants: 3D-Sipe Geometries, sipe bending, sipe angles, block flank angles, …
Conventional pattern block:
inhomogeneous distribution =
limited braking performance
Optimized geometry:
homogeneous distribution =
very good braking performance
First Results:First Results: Enlarge 3D-amplitudes, use sipe bending & angles, reduce sipe thickness
Stopping Distance – Future Pattern Technology
page 13
STOPPING DISTANCE
Technology and Application
TREAD COMPOUND
page 14
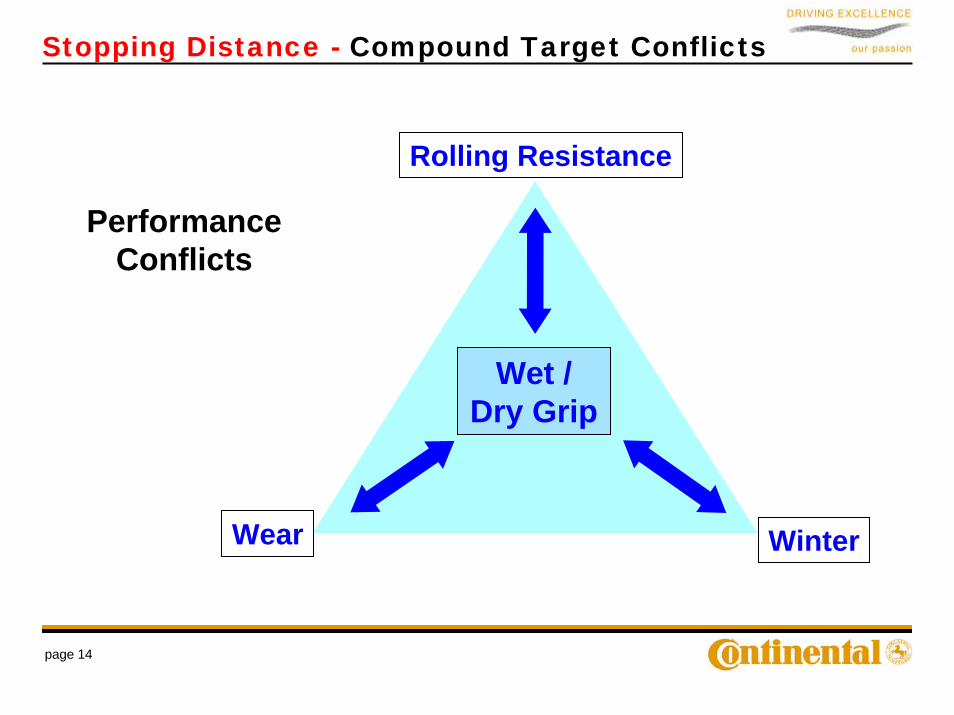
Wet / Dry Grip
Rolling Resistance
Wear Winter
Performance Conflicts
Stopping Distance - Compound Target Conflicts
page 15
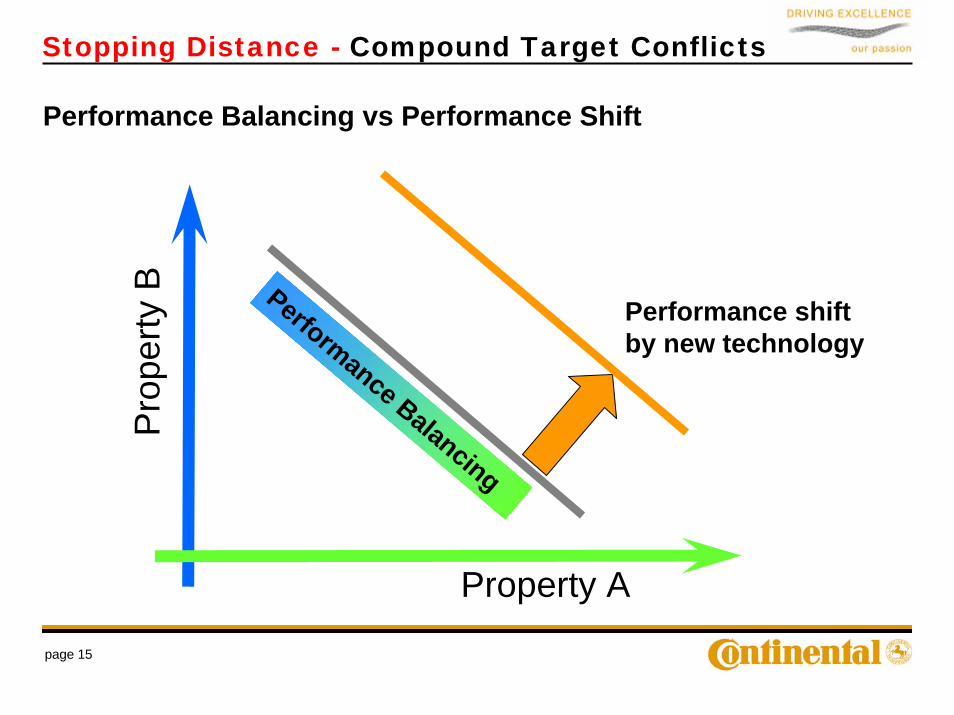
Performance Balancing vs Performance ShiftP
rope
rty B Performance Balancing
Performance shiftby new technology
Property A
Stopping Distance - Compound Target Conflicts
page 16
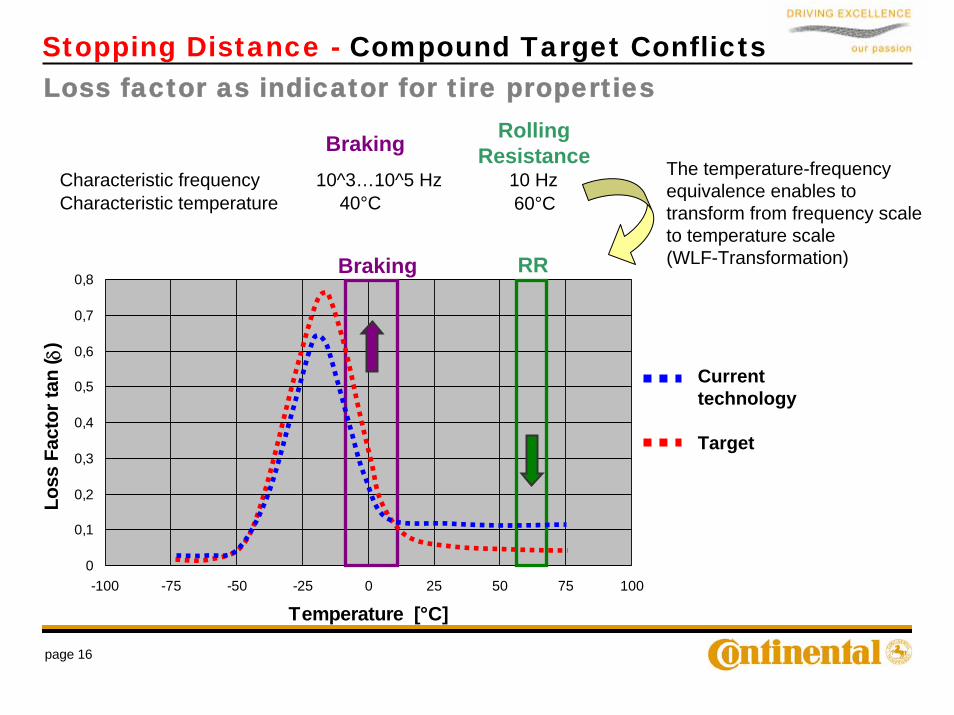
Stopping Distance - Compound Target ConflictsLoss factor as indicator for tire properties
0
0,1
0,2
0,3
0,4
0,5
0,6
0,7
0,8
-100 -75 -50 -25 0 25 50 75 100
Temperature [°C]
Loss
Fac
tor t
an ( δ
)
Braking RR
Current technology
Target
Rolling Resistance
60°C10 Hz
Braking
Characteristic temperatureCharacteristic frequency
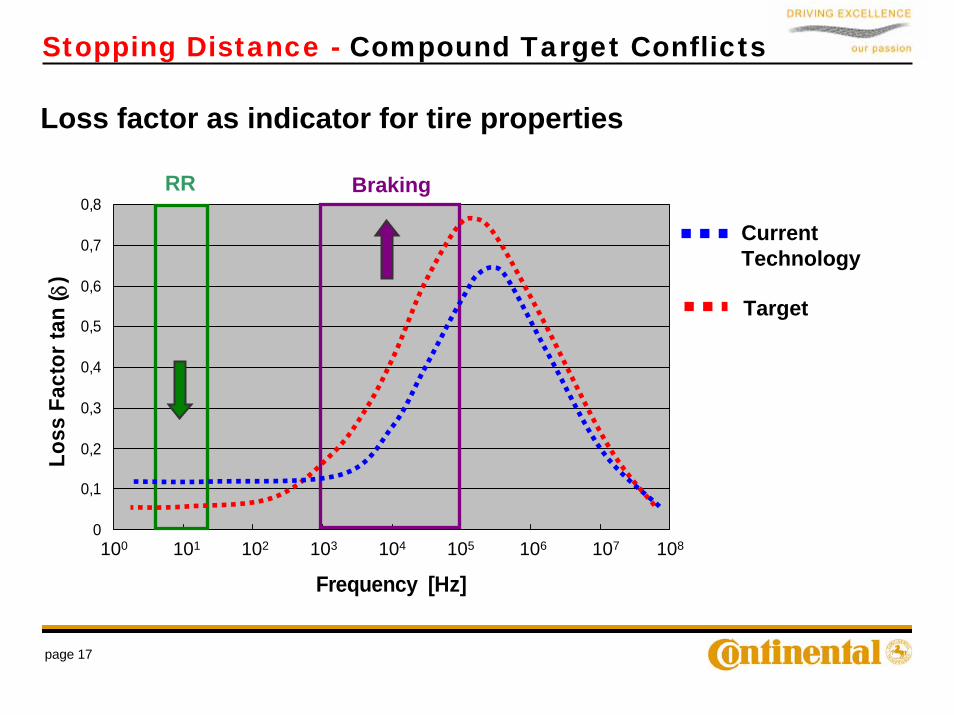
40°C10^3…10^5 Hz The temperature-frequency
equivalence enables to transform from frequency scale to temperature scale(WLF-Transformation)
page 17
0
0,1
0,2
0,3
0,4
0,5
0,6
0,7
0,8
1,E+00 1,E+01 1,E+02 1,E+03 1,E+04 1,E+05 1,E+06 1,E+07 1,E+08
Frequency [Hz]
Loss
Fac
tor t
an ( δ
)
BrakingRR
Current Technology
Target
Loss factor as indicator for tire properties
Stopping Distance - Compound Target Conflicts
100 101 103102 105104 106 107 108
page 18
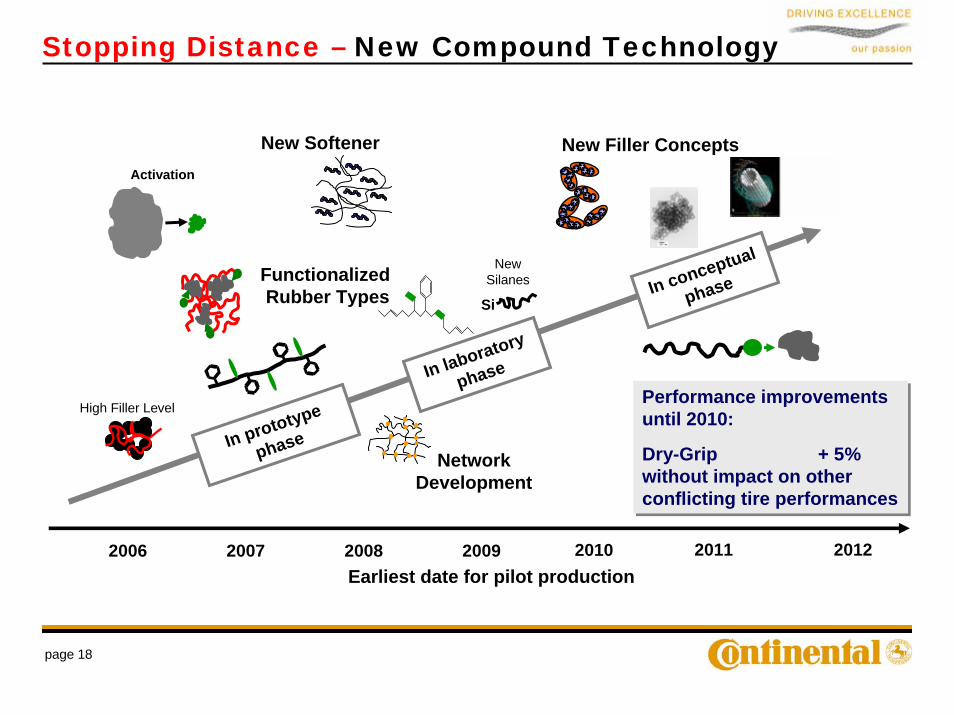
NetworkDevelopment
In prototype
phase
Activation
2006 2007 2008 2009 2011 20122010
High Filler Level
New Filler Concepts
Performance improvements until 2010:
Dry-Grip + 5% without impact on other conflicting tire performances
Performance improvements until 2010:
Dry-Grip + 5% without impact on other conflicting tire performances
In conceptual
phaseNew
Silanes
New Softener
Si
In laboratory
phase
Functionalized Rubber Types
Earliest date for pilot production
Stopping Distance – New Compound Technology
page 19
STOPPING DISTANCE
Influence of Testing
page 20
36
38
40
42
44
46
5 15 25Temperature [°C]
Stop
ping
dis
tanc
e [m
]
A B C
D E FCompounds
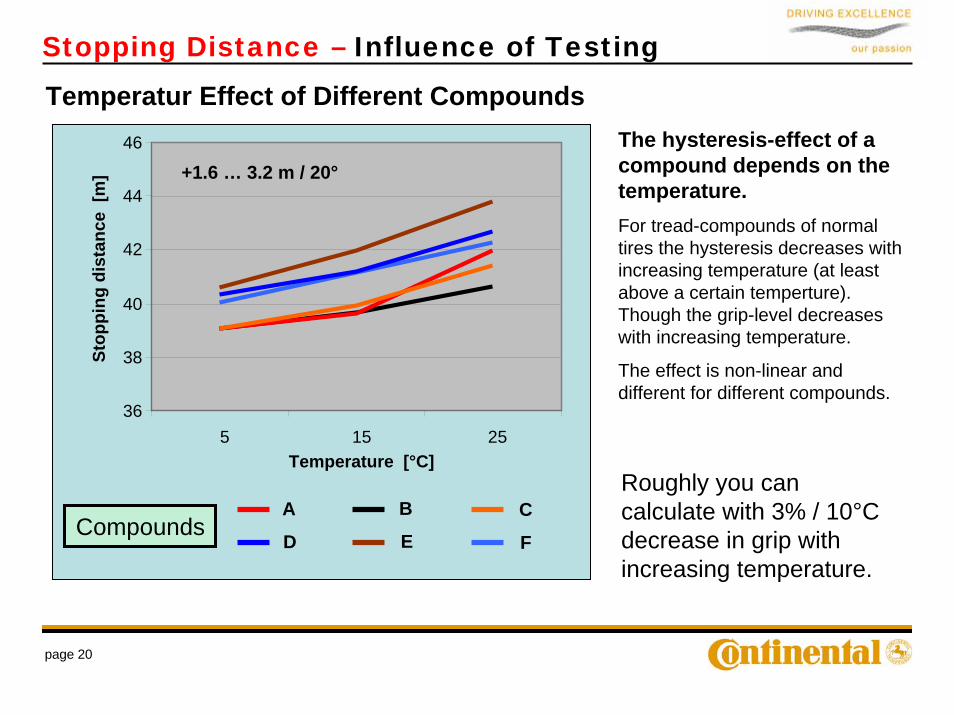
+1.6 … 3.2 m / 20°
Temperatur Effect of Different CompoundsThe hysteresis-effect of a compound depends on the temperature.For tread-compounds of normal tires the hysteresis decreases with increasing temperature (at least above a certain temperture). Though the grip-level decreases with increasing temperature.
The effect is non-linear and different for different compounds.
Stopping Distance – Influence of Testing
Roughly you can calculate with 3% / 10°C decrease in grip with increasing temperature.
page 21
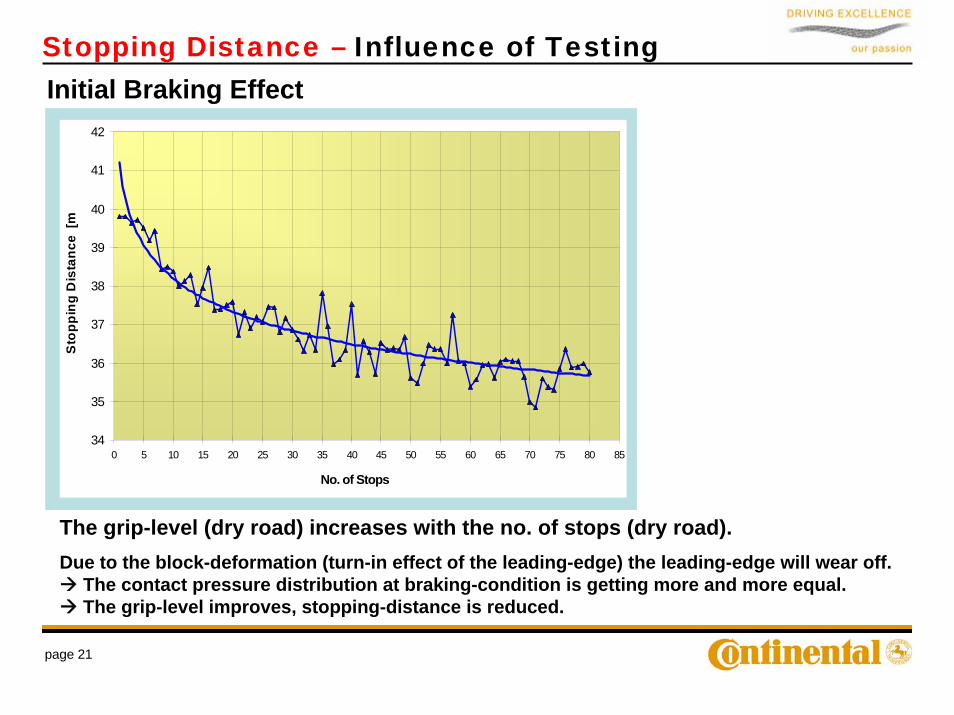
Initial Braking Effect
34
35
36
37
38
39
40
41
42
0 5 10 15 20 25 30 35 40 45 50 55 60 65 70 75 80 85
No. of Stops
Sto
ppin
g D
ista
nce
[m
The grip-level (dry road) increases with the no. of stops (dry road).Due to the block-deformation (turn-in effect of the leading-edge) the leading-edge will wear off.
The contact pressure distribution at braking-condition is getting more and more equal. The grip-level improves, stopping-distance is reduced.
Stopping Distance – Influence of Testing

page 22
3 6
3 8
4 0
4 2
4 4
4 6
4 8
5 0
5 2
5 4
5 6
0 5 1 0A n z a h l B re m s u n g e n
Bre
msw
eg in
m
Summer-tire
AllSeason-tire
Winter-tire
Initial Braking Effect
Stop
ping
Dis
tanc
e [m
]
No. of stops
Initial Braking Effect
Stopping Distance – Influence of Testing
The effect depends on the pattern stiffness:
Summer tire pattern (rib-structure):small deformation of blocks
small initial braking effect
Winter tire pattern (block-structure with sipes):strong deformation of pattern elements
strong initial braking effect.
General driving:Positive effects exist:Main effect here is- increasing pattern-stiffness by reducingnon-skid-depth.
Wet roads:The effect is smaller and has a tendency in opposite direction:Sharp edges are better to cut the water-film.
page 23
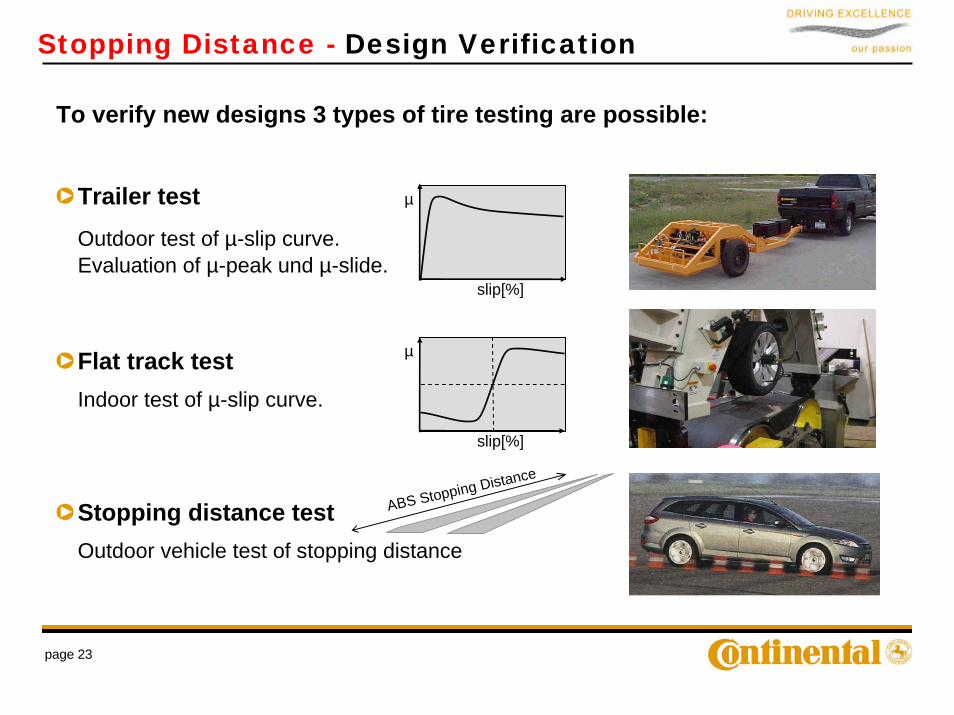
To verify new designs 3 types of tire testing are possible:
Trailer test
Outdoor test of µ-slip curve.Evaluation of µ-peak und µ-slide.
Flat track testIndoor test of µ-slip curve.
Stopping distance testOutdoor vehicle test of stopping distance
ABS Stopping Distance
µ
µ
slip[%]
slip[%]
Stopping Distance - Design Verification
page 24
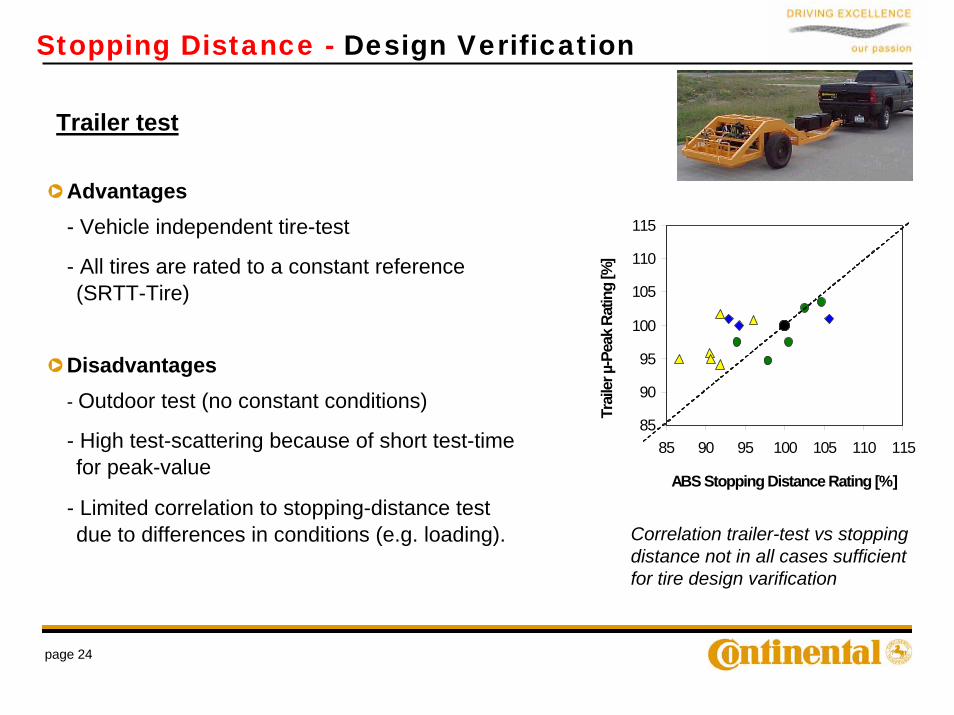
Trailer test
Advantages- Vehicle independent tire-test
- All tires are rated to a constant reference (SRTT-Tire)
Disadvantages- Outdoor test (no constant conditions)
- High test-scattering because of short test-time for peak-value
- Limited correlation to stopping-distance testdue to differences in conditions (e.g. loading). Correlation trailer-test vs stopping
distance not in all cases sufficient for tire design varification
85
90
95
100
105
110
115
85 90 95 100 105 110 115
ABS Stopping Distance Rating [%]
Trai
ler µ
-Pea
k Ra
ting
[%]
Stopping Distance - Design Verification
page 25
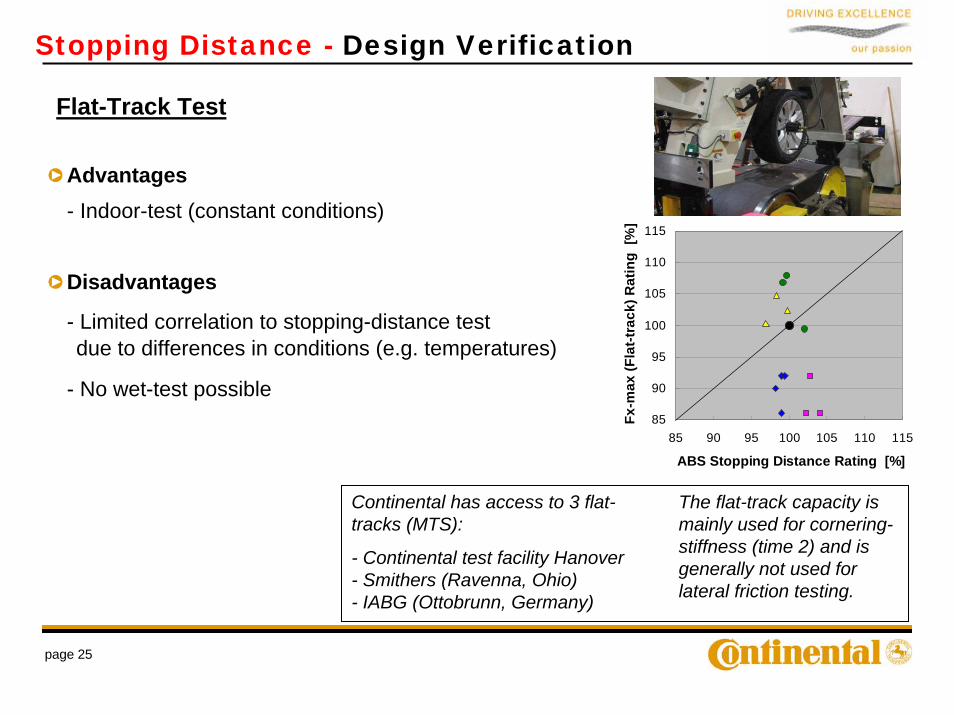
Flat-Track Test
Advantages- Indoor-test (constant conditions)
Disadvantages
- Limited correlation to stopping-distance testdue to differences in conditions (e.g. temperatures)
- No wet-test possible
The flat-track capacity is mainly used for cornering-stiffness (time 2) and is generally not used for lateral friction testing.
Continental has access to 3 flat-tracks (MTS):
- Continental test facility Hanover- Smithers (Ravenna, Ohio)- IABG (Ottobrunn, Germany)
85
90
95
100
105
110
115
85 90 95 100 105 110 115
ABS Stopping Distance Rating [%]
Fx-m
ax (F
lat-t
rack
) Rat
ing
[%]
Stopping Distance - Design Verification
page 26
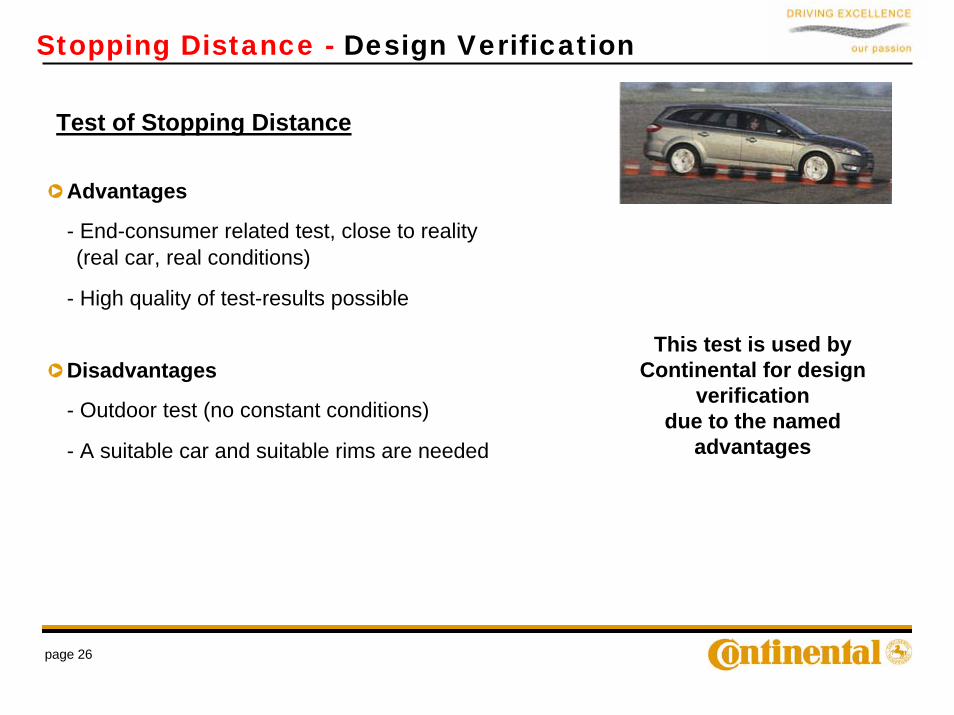
Test of Stopping Distance
Advantages
- End-consumer related test, close to reality(real car, real conditions)
- High quality of test-results possible
Disadvantages
- Outdoor test (no constant conditions)
- A suitable car and suitable rims are needed
This test is used by Continental for design
verificationdue to the named
advantages
Stopping Distance - Design Verification
page 27
Stopping Distance - Summary
Summary
The physics of ABS procedure have been investigated.
Based on the grip mechanisms we found the relevant parameters inthe tire design.
New technologies have been developed in order shift target conflicts dry / wet / snow / rolling resistance on a higher level.
Test conditions have a significant influence on the prediction accuracy of rating and raking in the market.
page 28
Q&A
Thank you for attention


