Lau Chor Tak Institute of Global Economics and Finance The Chinese University of Hong Kong 13/F, Cheng Yu Tung Building, 12 Chak Cheung Street, Shatin, Hong Kong The Impact of U.S. Imports from China on U.S. Consumer Prices and Expenditures by Lawrence J. Lau and Junjie Tang Working Paper No. 66 May 2018
Transcript
Lau Chor Tak Institute of Global Economics and Finance
The Chinese University of Hong Kong 13/F, Cheng Yu Tung Building, 12 Chak Cheung Street, Shatin, Hong Kong
The Impact of U.S. Imports from China on U.S. Consumer Prices and Expenditures
by
Lawrence J. Lau and Junjie Tang
Working Paper No. 66
May 2018
Acknowledgements
The Lau Chor Tak Institute of Global Economics and Finance is grateful to the following individuals
and organizations for their generous donations and sponsorship (in alphabetical order):
Donors
Johnson Cha Agile Group Holdings Limited
Vincent H.C. Cheng Asia Financial Holdings Ltd
Jonathan K.S. Choi Bank of China (Hong Kong) Limited
Fred Hu Zuliu BCT Financial Limited
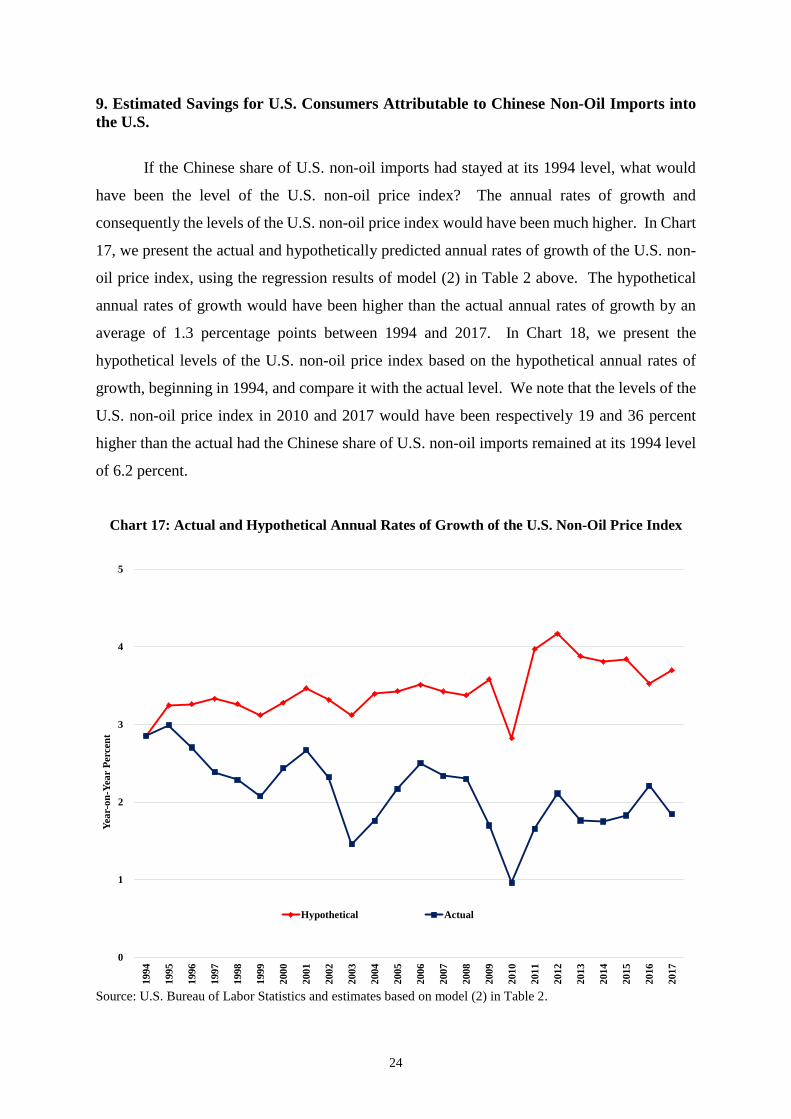
Tak Ho Kong China Concept Consulting Ltd
Lau Chor Tak and Lau Chan So Har First Eastern Investment Group
Lawrence J. Lau Four Seas Group
Chien Lee Hang Lung Properties Limited
Antony Leung Henderson Land Development Co. Ltd.
Wei Bo Li Hong Kong Exchanges and Clearing Limited
Francis Lui Hony Capital Limited
Robert Ng Industrial and Commercial Bank of China (Asia) Limited
Simon Suen Lai Sun Development Co., Ltd.
Wong Ting Chung Lau Chor Tak Foundation Limited
Lincoln Yung Man Wah Holdings Limited
Allan Zeman Sing Tao News Corporation Ltd.
Sun Hung Kai Properties Ltd.
Tai Sang Bank Limited
The Bank of East Asia, Limited
The Hongkong and Shanghai Banking Corporation Limited
The Lanson Foundation
Wing Lung Bank Limited
Programme Supporters
C.K. Chow Bangkok Bank Public Co Ltd
Alvin Chua Bank of China (Hong Kong) Limited
Fang Fang Bank of China Limited - Phnom Penh Branch
Eddy Fong Bei Shan Tang Foundation
Victor K. Fung China Development Bank
Wei Bo Li China Soft Capital
K.L. Wong HOPU Investment Management Co Ltd
Industrial and Commercial Bank of China - Phnom Penh Branch
King Link Holding Limited
Sun Wah Group
The Santander-K Foundation
UnionPay International
1
The Impact of U.S. Imports from China on U.S.
Consumer Prices and Expenditures§
Lawrence J. Lau and Junjie Tang1
May 2018
Abstract: The objective of this study is to estimate the extent of the benefits to U.S. consumers
that may be attributable to access to imported consumer goods from China. Imported consumer
goods can keep the levels and rates of increases of the prices of consumer goods in the U.S.
low, thus benefitting U.S. consumers. The focus is on the effects of imports of apparel and
non-oil consumer goods on their prices in the U.S. and consequently on the respective U.S.
household consumption expenditures on these goods. It will be demonstrated empirically that
Chinese imports into the United States have helped to keep the prices of consumer goods low
in the U.S. since 1994. It is found that between 1994 and 2017, a one-percentage-point increase
in the share of U.S. apparel imports from China would lower the annual rate of growth of the
U.S. apparel price index by approximately 0.2 percentage point. Similarly, a one-percentage-
point increase in the share of U.S. non-oil imports (which include apparel imports) from China
would lower the annual rate of growth of U.S. non-oil price index by approximately 1.0
percentage point. The level of the U.S. CPI in 2017 would have been 27 percent higher if the
share of U.S. non-oil imports originated from China had remained at its 1994 level of 6.2
percent. The reduced price of non-oil consumer goods has resulted in an estimated average
annual saving for U.S. consumers of US$623 billion between 1994 and 2016, approximately
12 percent of the average annual U.S. non-oil consumer expenditure during the same period.
and Kwoh-Ting Li Professor in Economic Development, Emeritus, of Stanford University; and Junjie Tang is a
Ph.D. Candidate in the Department of Economics, The Chinese University of Hong Kong. They are most grateful
to Mrs. Ayesha Macpherson Lau for her helpful comments and suggestions but retain sole responsibility for all
remaining errors. The opinions expressed herein are those of the authors and do not necessarily reflect the views
of the Institute.
2
1. Introduction
An economy that trades voluntarily with the rest of the world always enjoys a positive
net benefit in the aggregate. This is because with voluntary international trade, the set of
consumption possibilities of the economy is always enlarged and properly contains the original
set of consumption possibilities in the absence of trade. This means that, with trade, the
economy can attain not only all the consumption possibilities available to it previously but also
some additional consumption possibilities that are not previously attainable. The economy
must therefore be better off as a whole with trade than without trade. Thus, in principle, the
welfare of every citizen can be improved, if necessary, by adopting and implementing
appropriate policies for the distribution and/or redistribution of the gains from trade. Moreover,
the addition of more potential trading partner-countries can further enlarge the set of
consumption possibilities of the economy and hence improve the overall welfare of its citizens.
The same holds true for the rest of the world, so that all economies participating in world trade
benefit when a previously autarkic economy opens itself up to trade.
The benefits to an economy from international trade can occur in two principal ways:
first, its exporters can export more goods and hence create more GDP, profits and employment
for the economy; second, its importers can also benefit as the increased demands for imports
augment their revenues and profits as well as generate additional employment; and its
consumers can enjoy more, cheaper and greater varieties of imported consumer goods and
services, and its producers can similarly enjoy more, better and cheaper choices of imported
inputs, including equipment, energy, materials and services. However, even though there is
always a positive net benefit for the economy as a whole, imports can potentially disrupt
domestic industries through competition with domestically produced goods and services and
displacement of workers employed in these domestic industries. With international trade,
losers will be created in the economy in addition to winners, unless appropriate compensation
and redistribution policies are adopted and implemented by the government. The market on its
own is not able to compensate the losers from international trade.
The objective of this study is to estimate the extent of the benefits to U.S. consumers
that may be attributable to access to imported consumer goods from Mainland China. 2
2 In this paper, Mainland China and China are used interchangeably.
3
Imported consumer goods can keep the levels and rates of increases of the prices of consumer
goods low, thus benefitting the consumers. In addition, imported consumer goods can also
result in greater variety and hence more choice for the consumers. The focus of this study is
on the empirical identification of the effects of imports of selected Chinese consumer goods
into the U.S. on the domestic U.S. prices of these consumer goods and hence on the
expenditures of U.S. households on these consumer goods.
We examine the impact of apparel imports3 from China on the price of apparel in the
United States over the period from 1989 to 2017. It is found that the annual rate of increase of
the U.S. apparel price index is negatively related to the share of U.S. apparel imports originated
from China, other things being equal. Moreover, it is possible to attribute an average decline
in the annual rate of growth of the U.S. apparel price index of 0.2 percentage point to each
percentage point increase in the Chinese share of total U.S. apparel imports between 1994 and
2017. We also examine the impact of non-oil consumer goods imports from China on the
annual rate of growth of the price index of non-oil consumer goods in the U.S. A similar
negative impact is found: there was an estimated average decline in the annual rate of growth
of the price of U.S. non-oil consumer goods of 1.0 percentage point for each percentage point
increase in the Chinese share of total U.S. non-oil imports between 1994 and 2017. The
reduced price of non-oil consumer goods has resulted in an estimated average annual saving
for U.S. consumers of US$623 billion between 1994 and 2016, approximately 12 percent of
the average annual U.S. non-oil consumer expenditure during the same period. Moreover, the
reduced rates of growth of the price of non-oil consumer goods in the U.S. translated directly
into a lowered rate of core CPI inflation, enabling a lower nominal as well as real rate of
interest. All of these constitute concrete net benefits to U.S. consumers from the bilateral trade
between China and the U.S.
3 Apparel imports in this study include SITC 2-digit “apparel, clothing accessories”, and SITC 2-digit “footwear”,
as reported by the U.S. Census Bureau. We use apparel as a shorthand for apparel and footwear.
4
2. The Growth of Chinese Apparel Imports into the United States
In Chart 1, we present the value of U.S. apparel imports from China in current as well
as constant 2017 prices and its share of total U.S. apparel imports. The Chinese share rose
from an estimated 16.6 percent in 1989 to a peak of 48.1 percent in 2010. It has since been in
decline, falling to 39.6 percent in 2017. In terms of absolute value, U.S. apparel imports from
China rose from an estimated US$4.9 billion in 1989 to a peak of US$52.2 billion in 2015, a
more than tenfold increase. The rate of growth of U.S. apparel imports from China has greatly
moderated since 2010. In real terms, Chinese apparel imports also reached a peak in 2011,
levelled off and began to fall in 2015.
Chart 1: The Nominal and Real Values of U.S. Apparel Imports from China (2017 Prices)
and Its Share of Total U.S. Apparel Imports
Source: U.S. Census Bureau and estimates of the authors for the years prior to 1996; the nominal values of imports
are converted to real values of imports by the U.S. apparel price index (U.S. Bureau of Labor Statistics), which
includes both apparel and footwear.
It is useful to examine the share of total apparel imports in total U.S. consumer
expenditure on apparel. Imports of apparel into the U.S. from Asia began in the 1950s, first
from Japan, and then successively from Hong Kong, Taiwan and South Korea. China is a
relatively new supplier, beginning in the 1990s and becoming a major apparel exporter to the
0
10
20
30
40
50
60
0
10
20
30
40
50
60
198
9
199
0
199
1
199
2
199
3
199
4
199
5
199
6
199
7
199
8
199
9
200
0
200
1
200
2
200
3
200
4
200
5
200
6
200
7
200
8
200
9
201
0
201
1
201
2
201
3
201
4
201
5
201
6
201
7
Pe
rce
nt
US
$ B
illi
on
s
The Nominal Value of U.S. Apparel Imports from China (Left Scale)
The Real Value of U.S. Apparel Imports from China, in 2017 Prices (Left Scale)
Chinese Share of Total U.S. Apparel Imports (Right Scale)
5
U.S. after it acceded to the World Trade Organization (WTO) in 2001 and then only after the
expiration of the Multi-Fibre Agreement in 2005. Thus, the disruption of the U.S. domestic
apparel industry began a long time ago and cannot be simply attributed to Chinese imports. In
fact, the share of Chinese imports has already begun to decline in 2010, replaced by imports
from Vietnam, Bangladesh, Cambodia and Indonesia. Between 1989 and 2013, the ratio of the
value of U.S. apparel imports to total U.S. apparel consumer expenditure grew rapidly, from
an estimated 19.5 percent to a peak of 55.9 percent. Since then, it has declined to 48.8 percent
in 2016 (see Chart 2). Taking into account the fact that the value of apparel imports includes
only the wholesale costs and not the retail distribution margins, the share of imports in the U.S.
retail apparel market must have been around 75 percent or perhaps even higher, assuming a
distribution margin of at least 50 percent on imports.
Chart 2: The Ratio of the Value of U.S. Apparel Imports to
Total U.S. Apparel Consumer Expenditure
Source: U.S. Census Bureau and U.S. Bureau of Labor Statistics.
10
15
20
25
30
35
40
45
50
55
60
198
9
199
0
199
1
199
2
199
3
199
4
199
5
199
6
199
7
199
8
199
9
200
0
200
1
200
2
200
3
200
4
200
5
200
6
200
7
200
8
200
9
201
0
201
1
201
2
201
3
201
4
201
5
201
6
Pe
rce
nt
The Ratio of the Value of U.S. Apparel Imports to Total U.S. Apparel Consumption Expenditure
6
In Chart 3, we present the distribution of U.S. apparel imports by country or group of
counties of origin, based on a slightly different set of data published by the Office of Textiles
and Apparel (OTEXA), U.S. Department of Commerce.4 Chart 3 shows that the growth of
U.S. apparel imports from China has been mostly at the expense of Hong Kong, South Korea
and Taiwan. In their peak year of 1989, Hong Kong, South Korea and Taiwan combined
accounted for 36.9 percent of total U.S. apparel imports, comparable to the share of imports
from China of 41.2 percent in its peak year of 2010.5 The share of apparel imports from the
Association of Southeast Asian Nations (ASEAN) has been rising steadily and reached 20.4
percent in 2017. It, perhaps together with Bangladesh, is expected to eventually supplant China
to become the largest apparel exporter to the U.S. because of their lower labor costs and weaker
exchange rates.
Chart 3: The Distribution of U.S. Apparel Imports by Countries of Origin
Source: The Office of Textiles and Apparel, U.S. Department of Commerce.
4 For country comparisons, we turn to the data of U.S. imports of textiles and apparel reported by the Office of
Textiles and Apparel (OTEXA), U.S. Department of Commerce, due to the lack of comparable SITC data series
for other countries. While the OTEXA data do not include footwear imports, they show a similar pattern as the
SITC data series. See http://otexa.trade.gov/msrpoint.htm. 5 OTEXA data show that the share of apparel imports from China peaked at 41.2 percent in 2010. Likewise, the
SITC data series (including both apparel and footwear) placed the Chinese peak in the same year but with a larger
share, at 48.1 percent.
0
10
20
30
40
50
60
70
80
90
100
19
89
19
90
19
91
19
92
19
93
19
94
19
95
19
96
19
97
19
98
19
99
20
00
20
01
20
02
20
03
20
04
20
05
20
06
20
07
20
08
20
09
20
10
20
11
20
12
20
13
20
14
20
15
20
16
20
17
Pe
rce
nt
Hong Kong, South Korea and Taiwan
China (Mainland)
ASEAN
The Rest of the World
7
3. The U.S. Apparel Price Index and U.S. Apparel Imports
In Chart 4, we present the levels (the line) and the annual rates of growth (the columns)
of the U.S. apparel price index (1980=100) from 1953 to 2017. The U.S. apparel price index
rose rapidly between 1966 and 1991 at an average annual rate of almost 4 percent, but between
1991 and 2010, it declined at an average annual rate of 0.2 percent. The level of the U.S.
apparel price index peaked in 1993, and its value in 2017 was actually below that in 1991! As
discussed below, this decline may be attributed in part to the increase in the share of U.S.
apparel imports from China during this period.
Chart 4: The Level and the Annual Rate of Growth of the U.S. Apparel Price Index (1980=100)
Source: U.S. Bureau of Labor Statistics.
30
40
50
60
70
80
90
100
110
120
130
140
150
160
170
-6
-5
-4
-3
-2
-1
0
1
2
3
4
5
6
7
8
19
53
19
55
19
57
19
59
19
61
19
63
19
65
19
67
19
69
19
71
19
73
19
75
19
77
1979
19
81
19
83
19
85
19
87
19
89
19
91
19
93
19
95
19
97
19
99
20
01
20
03
20
05
20
07
20
09
20
11
20
13
2015
20
17
Ind
ex:
198
0=
10
0
Per
cen
t
Annual Rate of Growth of the Apparel Price Index (Left Scale)
Level of the Apparel Price Index (Right Scale)
8
In Chart 5, we present the level of the U.S. apparel price index (1980=100) and the
Chinese share of U.S. apparel imports from 1989 to 2017. It is apparent that the higher the
Chinese share of U.S. apparel imports, the lower the level of the U.S. apparel price index.
Apparel imports from China have helped to keep the level of the U.S. apparel price index low.
We note that the deceleration of the rate of growth of the U.S. apparel price index in 1990
coincided with the rise in the share of apparel imports from China. Beginning in 1993, the U.S.
apparel price index declined almost continuously until 2010, when the Chinese share of U.S.
apparel imports also reached a peak. (In terms of real value, U.S. apparel imports from China
reached a peak in 2011.) After 2010, the Chinese share of U.S. apparel imports began to
decline, and the U.S. apparel price index resumed its upward climb until 2014, when apparel
imports from ASEAN countries began to supplant apparel imports from China. The
appreciation of the Renminbi relative to the U.S. Dollar during this period also played a role.
In Chart 6, we present the annual rate of growth of the U.S. apparel price index and the
annual change in the share of U.S. apparel imports from China. It shows that the annual rate
of growth of the U.S. apparel price index was almost always in the opposite direction to the
annual change in the Chinese share of U.S. apparel imports between 1994 and 2014. During
this period, whenever the Chinese share of U.S. apparel imports went up, the U.S. apparel index
came down, and vice versa. Since 2014, the effect due to the decline of the Chinse share of
U.S. apparel imports has begun to be offset by the rise in the ASEAN share.
9
Chart 5: The Level of the U.S. Apparel Price Index and the Share of U.S. Apparel Imports
from China
Source: U.S. Census Bureau and U.S. Bureau of Labor Statistics.
Chart 6: The Annual Rate of Growth of the U.S. Apparel Price Index (Percent) and
the Change in the Share of U.S. Apparel Imports from China (Percentage Point)
Source: U.S. Census Bureau and U.S. Bureau of Labor Statistics.
125
130
135
140
145
150
155
0
10
20
30
40
50
60 1
98
9
199
0
199
1
199
2
199
3
199
4
199
5
199
6
199
7
199
8
199
9
200
0
200
1
200
2
200
3
200
4
200
5
200
6
200
7
200
8
200
9
201
0
201
1
201
2
201
3
201
4
201
5
201
6
201
7
Ind
ex
: 1
980
=10
0
Pe
rce
nt
Chinese Share of U.S. Apparel Imports (Left Scale)
U.S. Apparel Price Index, 1980=100 (Right Scale)
198
9
199
0
199
1
199
2
199
3
199
4
199
5
199
6
199
7
199
8
199
9
200
0
200
1
200
2
200
3
200
4
200
5
200
6
200
7
200
8
200
9
201
0
201
1
201
2
201
3
201
4
201
5
201
6
201
7
-3
-2
-1
0
1
2
3
4
5
6
7
Ye
ar-
on
-Ye
ar
Pe
rce
nt
Annual Change in the Chinese Share of U.S. Apparel Imports
Annual Rate of Growth of the U.S. Apparel Price Index
10
4. The Relationship between the U.S. Apparel Price Index and the Share of U.S. Apparel
Imports from China
We explore econometrically the relationship between the annual rate of growth of the
U.S. apparel price index and the share of U.S. apparel imports from China. Our hypothesis is
that an increase in the share of a new low-cost supplier such as China would reduce the rate of
growth of the U.S. apparel price index. However, an increase in the share of apparel imports
from a mature supplier such as Hong Kong, South Korea and Taiwan would increase the rate
of growth of the U.S. apparel price index. Thus, it is the difference between the changes in
their shares over time that matter. We therefore introduce the share difference variable, “the
share of apparel imports from China – the share of apparel imports from Hong Kong, South
Korea and Taiwan combined”. During this period, the Chinese share was rising, the combined
share of apparel imports from Hong Kong, South Korea and Taiwan was falling, and the share
difference was rising, thus putting downward pressure on the U.S. apparel price index.6
Moreover, we allow the effects of the Chinese share of imports to be asymmetric, that is, to
differ depending on whether the Chinese share has been on a rising or falling trend, that is,
before or after 2010. Another variable that may affect the rate of growth of the U.S. apparel
price index is the rate of change of the nominal Renminbi/U.S. Dollar exchange rate. In
addition, we also allow the exchange rate effects to differ before and after the Chinese exchange
rate reform of 1994.
The annual rate of growth of the U.S. apparel price index, measured in terms of
percentage points, is regressed on the difference between the Chinese share of U.S. apparel
imports and the share of Hong Kong, South Korea and Taiwan combined (measured in the
form of a decimal number between zero and one), the one-year lagged percentage change of
the nominal Renminbi/U.S. Dollar exchange rate, and the annual rate of change of the U.S.
Consumer Price Index (CPI). The results are presented in Table 1.
6 In the actual estimation, we take the natural logarithm of the share difference variable. Thus, it cannot be allowed
to become negative. We add a constant to the share difference variable to keep it from becoming negative. This
constant is chosen to be 0.20251, the value that maximizes the goodness of fit of the regression of the annual rate
of growth on the share difference variable.
11
Table 1: Regression of the Annual Rate of Growth of the U.S. Apparel Price Index
The Annual Rate of Growth of the U.S.
Apparel Price Index
(1) (2)
Difference between the share of U.S. apparel imports from
China and the combined share from Hong Kong, S. Korea
and Taiwan (ln)
-1.832*** -2.258***
(0.561) (0.926)
Difference between the share of U.S. apparel imports from
China and the combined share from Hong Kong, S. Korea
Annual rate of change of the U.S. CPI (lagged 1 year) 0.369
(0.290)
Constant -3.735*** -3.171***
(0.679) (0.926)
estimated from AR(1) model 0.653
Durbin-Watson statistic 0.934 1.4824
Number of observations 28 28
R2 0.646 0.558
Adjusted R2 0.566 0.458
Residual standard error 1.165
(df = 22)
1.273
(df = 23)
F-statistic 8.035***
(df = 5; 22)
4.992***
(df = 5; 23)
Notes: Numbers in parentheses are estimated standard errors. ***Significant at the 1-percent level; **significant at
the 5-percent level; *significant at the 10-percent level.
Table 1 shows that the annual rate of growth of the U.S. apparel price index is
significantly negatively affected by an increase in the share of Chinese apparel imports, other
things being equal. Moreover, the effect is asymmetric, depending on whether the share has
been on a rising or falling trend. In addition, the rate of growth of the U.S. apparel price index
12
is significantly negatively affected by the lagged devaluation of the Renminbi relative to the
U.S. Dollar since the exchange rate reform of 1994. However, it does not seem to be
statistically significantly affected by the annual rate of change of the U.S. Consumer Price
Index. The relatively low value of the Durbin-Watson statistic of model (1) suggests that there
may exist positive first-order autocorrelation in the stochastic disturbance terms of the
regression model. We therefore apply the Prais-Winsten (PW) procedure to correct for the
serial correlation, dropping the statistically insignificant U.S. CPI variable. The results are
reported as model (2) in Table 1. The Durbin-Watson statistic is substantially improved. In
addition, the values of the estimated parameters in model (2) are not substantially different
from those in model (1), showing that the estimation is relatively robust.7
We use the results of model (2) in our further analysis of the U.S. apparel price index.
Between 1994 and 2017, a one-percentage-point increase in the Chinese import share would
decrease the rate of growth of the U.S. apparel price index by approximately 0.2 percentage
point. In Chart 7, we present the actual and fitted values of our regression of the annual rate of
growth of the U.S. apparel price index as reported in Table 1 under model (2). It is clear that
the annual rate of growth of the U.S. apparel price index is explained very well by the model.
7 The Prais-Winsten procedure assumes that the stochastic disturbance terms follow a first-order autoregressive
process: 𝜀𝑡 = 𝑡 + 𝑡−1, where 𝑡 is assumed to be independently and identically distributed with constant
variance. (See, for example, J. M. Wooldridge, Introductory Econometrics: A Modern Approach, 5th ed., Mason,
OH: South-Western Cengage Learning, 2013.) has been estimated to be 0.65.
13
Chart 7: Actual and Fitted Values of the U.S. Apparel Price Index
Source: U.S. Census Bureau and fitted values derived from model (2) in Table 1.
In 1994, China undertook an exchange rate reform, and the Renminbi became current
account convertible. If the Chinese share of U.S. apparel imports had stayed at its 1994 level,
what would have been the level of the U.S. apparel price index? The annual rates of growth
and consequently the levels of the U.S. apparel price index would have been much higher. In
Chart 8, we present the actual and hypothetically predicted annual rates of growth of the U.S.
apparel price index, using the regression results of model (2) in Table 1 above. The
hypothetical annual rates of growth are higher than the actual annual rates of growth by an
average of 1.0 percentage point per annum between 1994 and 2017. In Chart 9, we present the
hypothetical levels of the U.S. apparel price index based on the hypothetical annual rates of
growth, beginning in 1994, and compare them with the actual levels. We note that the U.S.
apparel price index in 2010 and 2017 would have been respectively 5 percent and 27 percent
higher than the actual had the Chinese share of U.S. apparel imports remained at its 1994 level
of 22.2 percent.
-3
-2
-1
0
1
2
3
4
519
90
19
91
19
92
19
93
19
94
19
95
19
96
19
97
19
98
19
99
20
00
20
01
20
02
20
03
20
04
20
05
20
06
20
07
20
08
20
09
20
10
20
11
20
12
20
13
20
14
20
15
20
16
20
17
Ye
ar-
on
-Ye
ar
Pe
rce
nt
Actual Fitted by Model (2)
14
Chart 8: Actual and Hypothetical Annual Growth Rates of the U.S. Apparel Price Index
Source: Estimates of the hypothetical growth rates are based on model (2) in Table 1.
Chart 9: Actual and Hypothetical Levels of the U.S. Apparel Price Index
Source: Estimates of the hypothetical levels are based on model (2) in Table 1.
-4
-3
-2
-1
0
1
2
3
4
5
19
94
19
95
19
96
19
97
19
98
19
99
20
00
20
01
20
02
20
03
20
04
20
05
20
06
20
07
20
08
20
09
20
10
20
11
20
12
20
13
20
14
20
15
20
16
20
17
Ye
ar-
on
-Ye
ar
Pe
rce
nt
Hypothetical Actual
80
85
90
95
100
105
110
115
120
125
19
94
19
95
19
96
19
97
19
98
19
99
20
00
20
01
20
02
20
03
20
04
20
05
20
06
20
07
20
08
20
09
20
10
20
11
20
12
20
13
20
14
20
15
20
16
20
17
Ind
ex
: 1
994
=10
0
Actual Hypothetical
15
5. Estimated Savings for U.S. Consumers Attributable to Chinese Apparel Imports into
the U.S.
If the level of the U.S. apparel price index were higher, so would the corresponding
U.S. consumer expenditure on apparel be. There are three possible assumptions as to how U.S.
consumers adjust their expenditure on apparel in response to changes in the apparel price index.
“Assumption 1” is that the real expenditure on apparel would remain the same, that is, the price
elasticity of the demand for apparel is zero. An alternative assumption, “Assumption 2”, is that
the nominal value of U.S. consumer expenditure on apparel would remain the same, that is, the
price elasticity of the demand for apparel is minus one. Assumptions 1 and 2 represent the two
extreme cases. Realistically, in response to an increase in the price of apparel, the real
consumer expenditure on apparel will decline but not to the same extent as implied by a price
elasticity of demand of minus one. An attempt is made to estimate the value of the price
elasticity of the demand for apparel, which turns out to be -0.56, that is, if price increases by 1
percent, the real expenditure decreases by 0.56 percent.8 This is then our “Assumption 3”.
The actual and the hypothetical U.S. nominal consumer expenditures on apparel under
each of the assumptions are presented in Chart 10.9 Chart 10 shows that between 1994 and
2016, the value of the annual saving to U.S. consumers resulting from a lower price of U.S.
apparel amounted to an average of US$13 billion under Assumption 1 and an average of US$6
billion under Assumption 3. As a comparison, the average annual U.S. nominal consumer
expenditure on apparel was US$204 billion over the same period.
8 An attempt is made to estimate the price elasticity of the U.S. demand for apparel by regressing the natural
logarithm of real expenditure on apparel on the natural logarithms of the price index of apparel and the total
consumer expenditure. The estimated price elasticity is -0.56. See the Appendix for the details of the estimation. 9 We stopped with 2016 in Chart 10 because the household consumption expenditure data for 2017 were not
available.
16
Chart 10: Actual and Hypothetical U.S. Annual Nominal Consumer Expenditures on Apparel
Source: U.S. Bureau of Labor Statistics and estimates of the authors.
An alternative way to assess the impact of the increase in the Chinese import share is
to examine how the real consumer expenditure on apparel would have changed under the three
alternative assumptions. The actual and the hypothetical real consumer expenditures on
apparel under each of the assumptions are presented in Chart 11. Between 1994 and 2016,
U.S. consumers would have reduced their real expenditure on apparel, that is, they would have
to do with less, by an average of US$12 billion per annum in 2017 prices under Assumption 2
and US$7 billion per annum under Assumption 3. As a comparison, the actual average annual
U.S. real consumer expenditure on apparel during this period was US$205 billion.
0
50
100
150
200
250
300
350
19
94
19
95
19
96
19
97
19
98
19
99
20
00
20
01
20
02
20
03
20
04
20
05
20
06
20
07
20
08
20
09
20
10
20
11
20
12
20
13
20
14
20
15
20
16
US
$ B
illi
on
Actual
Assumption 1: The price elasticity of the demand for apparel is zero
Assumption 2: The price elasticity of the demand for apparel is unity
Assumption 3: The price elasticity of the demand for apparel is 0.56
17
Chart 11: Actual and Hypothetical U.S. Annual Real Consumer Expenditures on Apparel
(2017 Prices)
Source: U.S. Bureau of Labor Statistics and estimates of the authors.
6. The Impact of the U.S. Apparel Price Index on the U.S. Consumer Price Index (CPI)
The U.S. apparel price index has an average weight of 4.1 percent over the period 1994–
2017 in the U.S. Consumer Price Index (CPI).10 Thus, a change of one percentage point in the
apparel price index translates into a change of 0.041 percent in the U.S. CPI. The increase in
the Chinese share of apparel imports since 1994 has reduced the annual rate of change of the
U.S. apparel price index by 1.0 percentage point on average between 1994 and 2017. The U.S.
annual rate of inflation as measured by the CPI would be reduced by 0.041 percentage points
on average (1.0 x 0.041). Cumulatively, this translates into a one-percent decrease in the level
of the U.S. CPI in 2017.11
10 This is calculated based on the weights used in the goods basket for the U.S. CPI, reported by the U.S. Bureau
of Labor Statistics, https://www.bls.gov/cpi/data.htm. 11 The cumulative effect is greater than -0.041 x 23 = -0.943 because of compounding.
0
50
100
150
200
250
300
35019
94
19
95
19
96
19
97
19
98
19
99
20
00
20
01
20
02
20
03
20
04
20
05
20
06
20
07
20
08
20
09
20
10
20
11
20
12
20
13
20
14
20
15
20
16
US
$ B
illi
on
in
20
15
Pri
ces
Actual
Assumption 1: The price elasticity of the demand for apparel is zero
Assumption 2: The price elasticity of the demand for apparel is unity
Assumption 3: The price elasticity of the demand for apparel is 0.56
18
7. An Application to U.S. Non-Oil Imports
In this section, we apply our model for the U.S. apparel price index to the U.S. non-oil
price index. The results are essentially similar to what we have obtained for the U.S. apparel
price index. In Chart 12, we present the value of U.S. non-oil imports from China in current
prices as well as constant 2017 prices and its share of total U.S. non-oil imports. The Chinese
share of total U.S. non-oil imports rose more or less continuously from 2.7 percent in 1989 to
21.6 percent in 2009, with a significant acceleration after 2001, when China acceded to the
World Trade Organization. However, since 2009, the Chinese share of U.S. non-oil imports
has stayed within a narrow range between 21 and 23 percent. In terms of absolute value, U.S.
non-oil imports from China rose from US$12.0 billion in 1989 to US$505.6 billion in 2017, a
fortyfold increase.
Chart 12: The Nominal and Real Values of U.S. Non-Oil Imports from China (2017 Prices) and
Its Share of Total U.S. Non-Oil Imports
Source: U.S. Census Bureau.12
12 The non-oil imports are calculated by subtracting the crude petroleum imports from customs good imports of
the U.S. The data are from the U.S. Bureau of the Census.
0
2
4
6
8
10
12
14
16
18
20
22
24
0
50
100
150
200
250
300
350
400
450
500
550
600
1989
1990
1991
1992
1993
1994
1995
1996
1997
1998
1999
2000
2001
2002
2003
2004
2005
2006
2007
2008
2009
2010
2011
2012
2013
2014
2015
2016
2017
Per
cen
t
US
$ B
illi
on
s
The Nominal Value of U.S. Non-Oil Imports from China (Left Scale)
The Real Value of U.S. Non-Oil Imports from China, in 2017 Prices (Left Scale)
Chinese Share of U.S. Non-Oil Imports (Right Scale)
19
In Chart 13, the ratio of the total value of U.S. non-oil imports to total U.S. non-oil
consumer expenditure is presented. It shows the very rapid growth of total U.S. non-oil imports
relative to total domestic non-oil consumer expenditure, from 17.0 percent in 1989 to 29.1
percent in 2016. Taking into account the fact that the value of non-oil imports reflects only the
wholesale costs and not the retail distribution margins, the share of imports in the retail non-
oil consumer goods market must have been at least 40 percent or even higher.
In Chart 14, we present the levels (the line) and the annual rates of growth (the columns)
of the U.S. non-oil price index13 from 1959 to 2017. The U.S. non-oil price index rose rapidly
between 1967 and 1993, at an average annual rate of 5.8 percent, but between 1994 and 2017,
the annual rate of growth remained subdued and was never above 3 percent in any year. This
decline in the rate of growth of the U.S. non-oil price index may likewise be attributed in part
to the increase in the share of U.S. non-oil imports from China.
Chart 13: The Ratio of the Value of U.S. Non-Oil Imports to
Total U.S. Non-Oil Consumer Expenditure
Source: U.S. Census Bureau and U.S. Bureau of Labor Statistics.
13 We use the U.S. core CPI as reported by the U.S. Bureau of Labor Statistics to represent the U.S. non-oil price
index.
15
17
19
21
23
25
27
29
31
33
35
1989
19
90
19
91
19
92
19
93
19
94
19
95
19
96
19
97
19
98
19
99
20
00
20
01
20
02
20
03
20
04
20
05
2006
20
07
20
08
20
09
20
10
20
11
20
12
20
13
20
14
20
15
20
16
Per
cen
t
The Ratio of the Value of U.S. Non-Oil Imports to Total U.S. Non-oil Consumption Expenditure
20
Chart 14: The Level and the Annual Rate of Growth of the U.S. Non-Oil Price Index
Source: U.S. Bureau of Labor Statistics.
In Chart 15, we present a scatter diagram between the annual rate of growth of the U.S.
non-oil price index and the Chinese share of U.S. non-oil imports. It is apparent that the higher
the Chinese share of U.S. non-oil imports, the lower the annual rate of growth of the U.S. non-
oil price index. U.S. non-oil imports from China have helped keep the increases in the U.S.
non-oil price index low.
0
50
100
150
200
250
300
350
400
-2
0
2
4
6
8
10
12
14
195
9
196
1
196
3
196
5
196
7
196
9
197
1
197
3
197
5
197
7
197
9
198
1
198
3
198
5
198
7
198
9
199
1
199
3
199
5
199
7
199
9
200
1
200
3
200
5
200
7
200
9
201
1
201
3
201
5
201
7
Ind
ex
: 1
980
=10
0
Pe
rce
nt
Annual Rate of Growth of the U.S. Non-Oil Price Index (Left Scale)
Level of the U.S. Non-oil Price Index (Right Scale)
21
Chart 15: A Scatter Diagram of the Annual Rate of Growth of the U.S. Non-Oil Price Index
versus the Chinese Share of U.S. Non-Oil Imports (1989–2017)
Source: U.S. Bureau of Labor Statistics and U.S. Census Bureau.
8. The Relationship between the U.S. Non-Oil Price Index and U.S. Non-Oil Imports from
China
We explore econometrically the relationship between the annual rate of growth of the
U.S. non-oil price index and the share of U.S. non-oil imports from China. The annual rate of
growth of the U.S. non-oil price index, measured in terms of percentage points, is regressed on
the natural logarithm of Chinese share of U.S. non-oil imports, measured in the form of a
decimal number between zero and one (again, distinguishing between the rising and the falling
phases), the one-year lagged percentage change of the nominal Renminbi/U.S. Dollar exchange
rate (again distinguishing between before and after the reform of 1994), and the one-year
lagged annual rate of growth of the U.S. non-core price index, which is composed of food and
energy price indices.14 The results are presented in Table 2.
14 We estimate the annual rate of growth of the U.S. non-core price index in the following way: % change of non-
core price index = [ % change of CPI – 0.773 x % change of core CPI ] / 0.227, where 0.773 and 0.227 are the
respective weights of core CPI and non-core price index in total CPI, according to the U.S. Bureau of Labor
Statistics.
1.0
1.5
2.0
2.5
3.0
3.5
4.0
4.5
5.0
5.5
0 2 4 6 8 10 12 14 16 18 20 22 24
An
nu
al
Ra
te o
f G
row
th o
f U
.S.
No
n-O
il P
rice
In
dex
(Per
cen
t)
Chinese Share of U.S. Non-Oil Imports (Percent)
22
Table 2: Regression of the Annual Rate of Growth of the U.S. Non-Oil Price Index
The Annual Rate of Growth of the U.S.
Non-Oil Price Index
(1) (2)
Share of the U.S. non-oil imports from China (ln) -1.435*** -1.402***
(0.215) (0.261)
Share of the U.S. non-oil imports from China, 2011–2017