The Pennsylvania State University The Graduate School Department of Mechanical Engineering THE IMPACT OF VARIOUS OXIDIZERS ON THE OVERALL PERFORMACE OF A DIRECT FLAME SOLID OXIDE FUEL A Thesis in Mechanical Engineering by Nicholas M. Donadio 2010 Nicholas M. Donadio Submitted in Partial Fulfillment of the Requirements for the Degree of Master of Science August 2010
Transcript
The Pennsylvania State University
The Graduate School
Department of Mechanical Engineering
THE IMPACT OF VARIOUS OXIDIZERS ON THE OVERALL PERFORMACE OF A
DIRECT FLAME SOLID OXIDE FUEL
A Thesis in
Mechanical Engineering
by
Nicholas M. Donadio
2010 Nicholas M. Donadio
Submitted in Partial Fulfillment
of the Requirements
for the Degree of
Master of Science
August 2010
ii
The thesis of Nicholas M. Donadio was reviewed and approved* by the following:
Rich A. Yetter
Professor of Mechanical Engineering
Thesis Co-Advisor
Jongguen Lee
Senior Research Associate of Mechanical Engineering
Thesis Co-Advisor
Stefan Thynell
Professor of Mechanical Engineering
Karen A. Thole
Professor of Mechanical Engineering
Head of the Department of Mechanical and Nuclear Engineering
*Signatures are on file in the Graduate School
iii
ABSTRACT
The power output of a direct-flame solid oxide fuel cell (SOFC) was studied using
hydrogen (H2) as the fuel for the flame and various oxidizers, which included oxygen (O2),
nitrous oxide (N2O), nitric oxide (NO), and nitrogen dioxide (NO2). The fuel-rich diffusion flame,
which is located only a few millimeters away from the anode side of the SOFC, is used to reform
the fuel and heat the SOFC. On the cathode side, an oxidizing gas is either stagnant or forced to
pass over the face. The SOFC used is a 20mm diameter button cell with a Ni-based anode, a
Hionic electrolyte (which is a material specially made by Fuel Cell Materials), and a strontium-
doped lanthanum manganite (LSM) cathode.
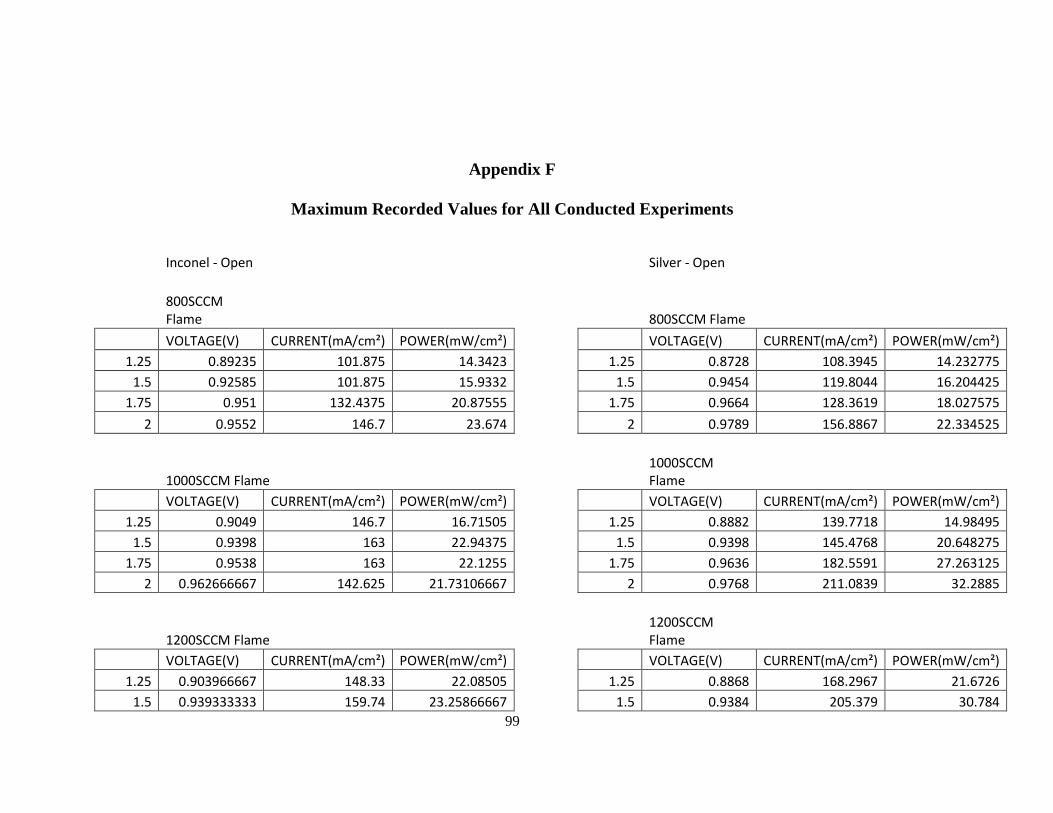
Experiments were conducted to study the effects of different parameters of the flame as
well as the oxidizers being used. The total flame gas flow rate and the equivalence ratio (φ) were
tested using two different current collecting meshes for the cathode. It was found that when using
a silver mesh, which has high electric conductivity, the SOFC preformed best at the highest flow
velocities (1200 SCCM) and equivalence ratios (φ), which produced a power output of 38.13
mW/cm2.
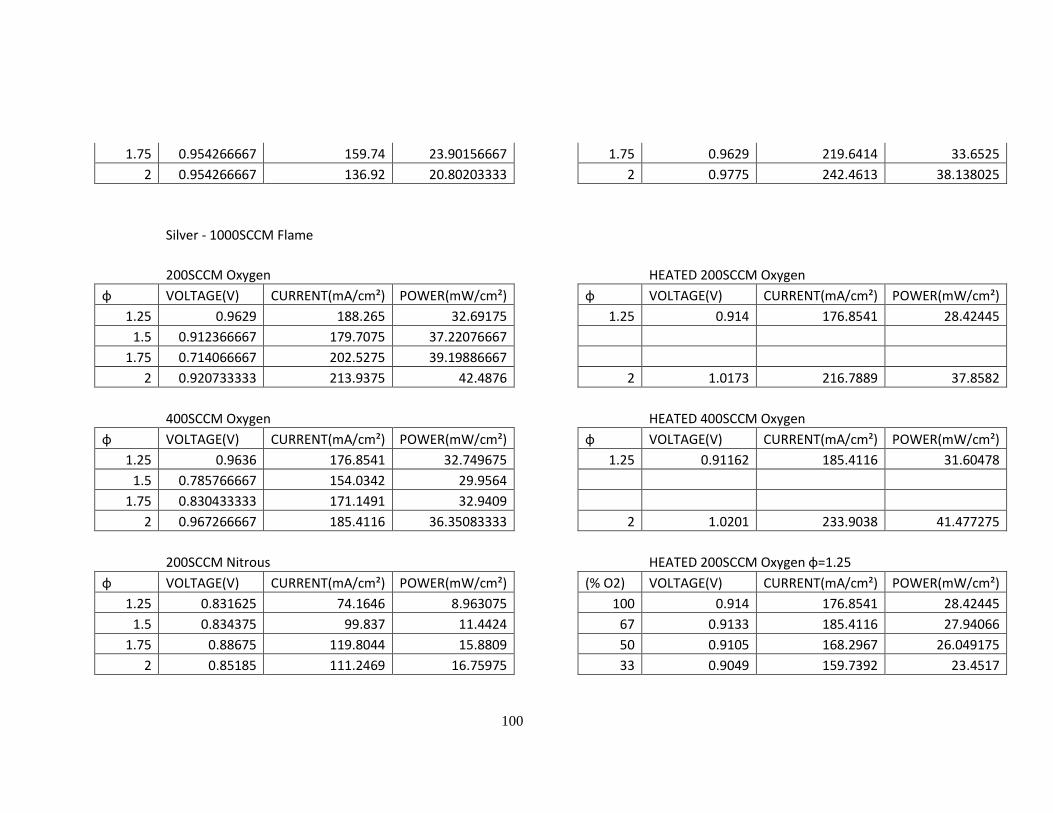
The SOFC was also tested to see how an impinging oxidizer affected the SOFC
performance. Pure molecular oxygen was used as the oxidizer and produced the highest power
density recorded when the equivalence ratio was the highest (72.64 mW/cm2 at φ=2.0). Other
nontraditional oxidizers were tested and the results showed that the molecules with the largest
oxygen-nitrogen ratios produced the highest power outputs at the optimal conditions. Thus the
performance increased as the oxidizer gas was changed from N2O to NO to NO2. Although NO2
produced the largest power density of the three nitrogen oxides used (63.63 mW/cm2),
performance degradation was observed during prolonged use.
iv
TABLE OF CONTENTS
LIST OF FIGURES ................................................................................................................. vi
LIST OF TABLES ................................................................................................................... viii
ACKNOWLEDGEMENTS ..................................................................................................... ix
NOMENCLATURE ................................................................................................................ x
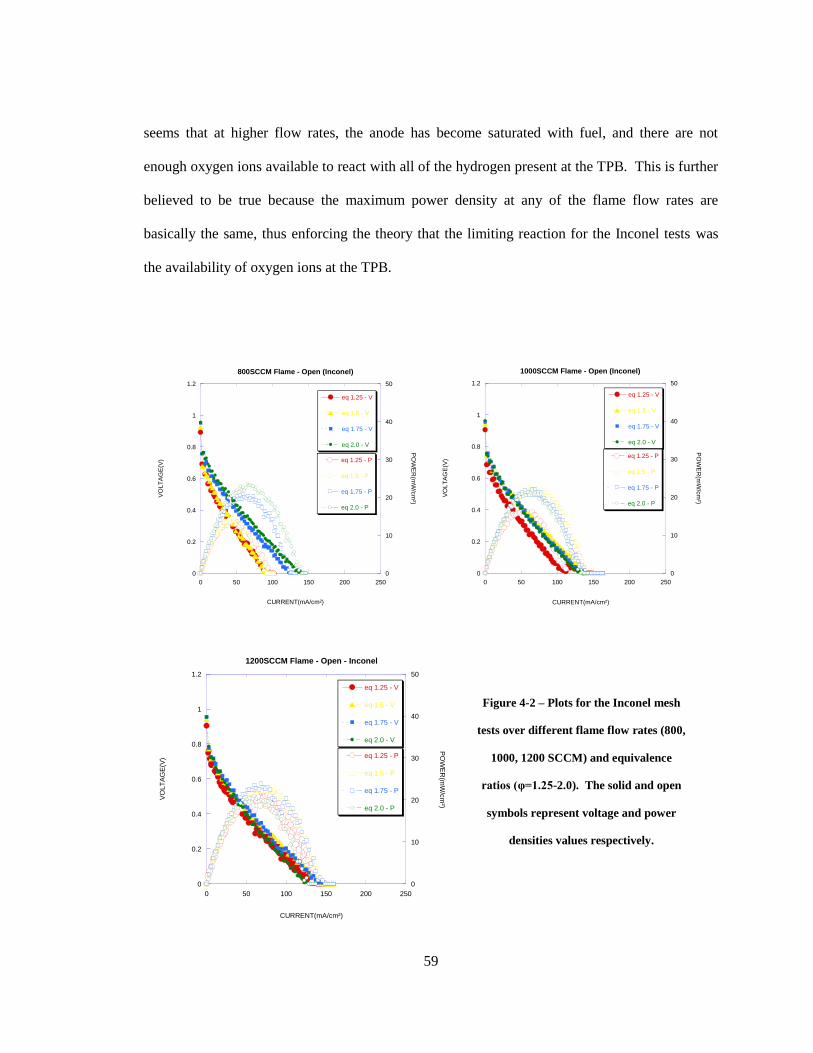
Figure 4-2: Graphs for the Inconel mesh experiments. ........................................................... 59
Figure 4-3: Graphs for the silver mesh experiments. .............................................................. 61
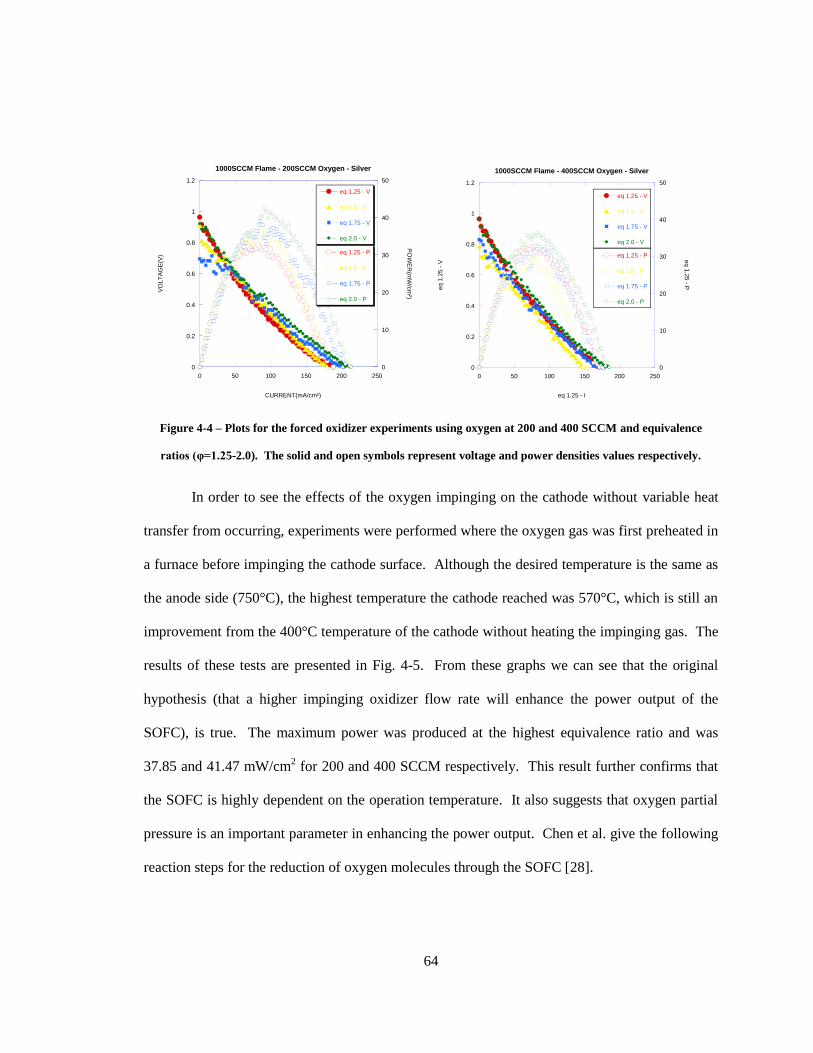
Figure 4-4: Graphs for the forced oxidizer experiments (oxygen). ........................................ 64
Figure 4-5: Graphs for the heat oxidizer experiments. ........................................................... 66
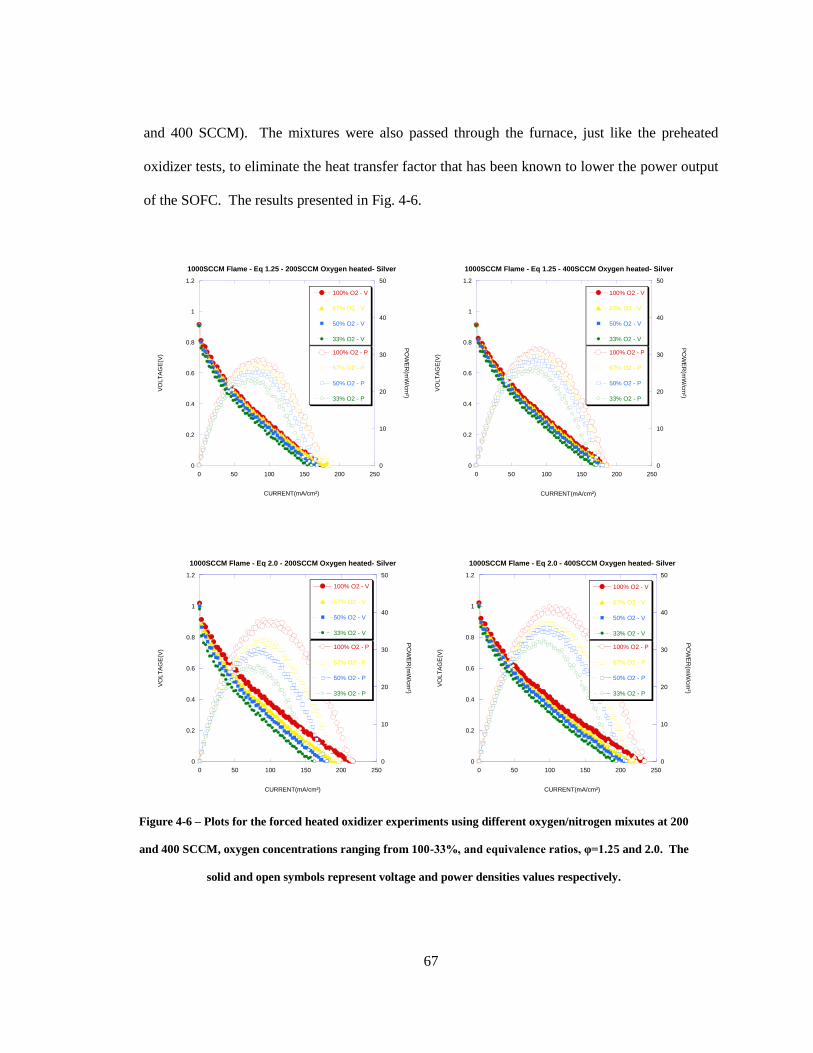
Figure 4-6: Graphs for the mixed oxygen-nitrgen gas experiments. ...................................... 67
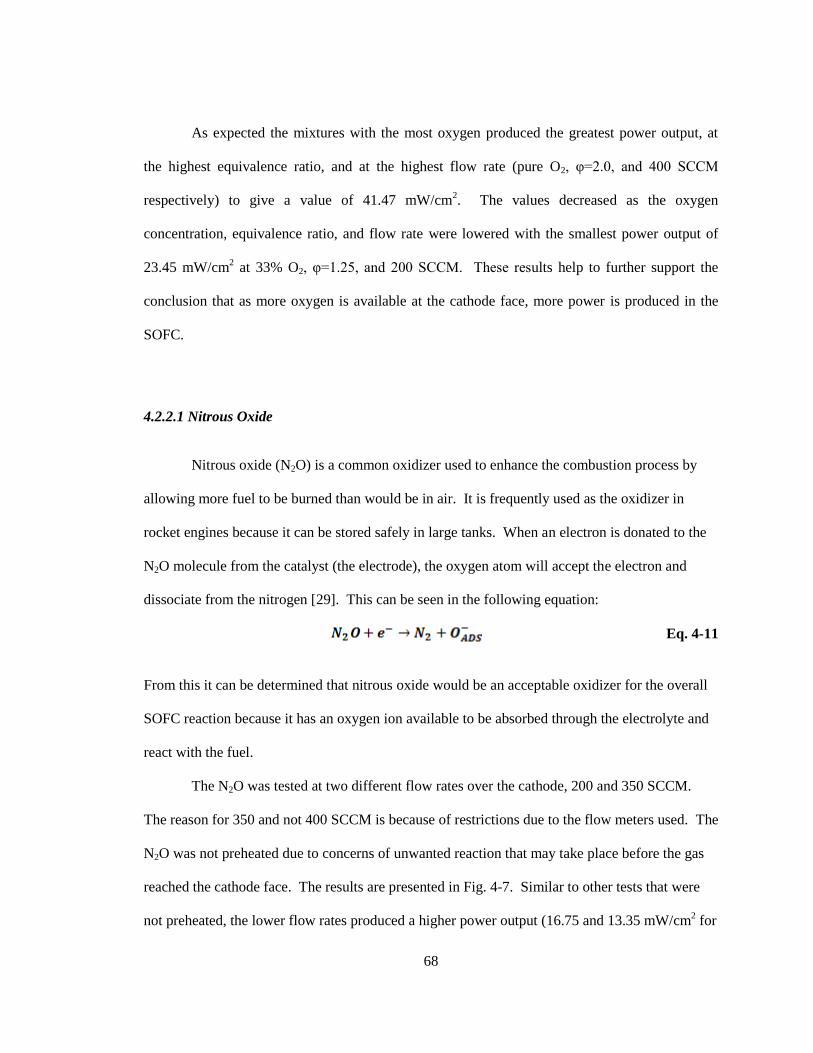
Figure 4-7: Graphs for the nitrous oxide experiments. ........................................................... 69
vii
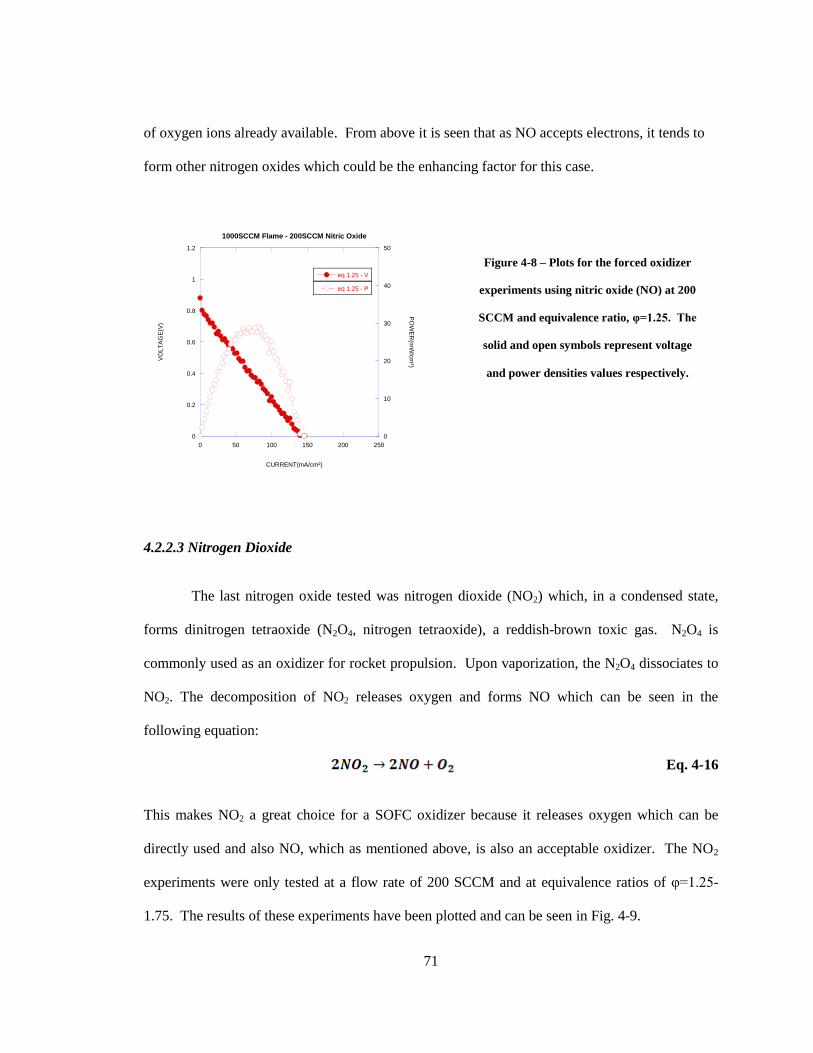
Figure 4-8: Graph for the nitric oxide experiments . .............................................................. 71
Figure 4-9: Graph for the nitrogen dioxide experiments. ....................................................... 72
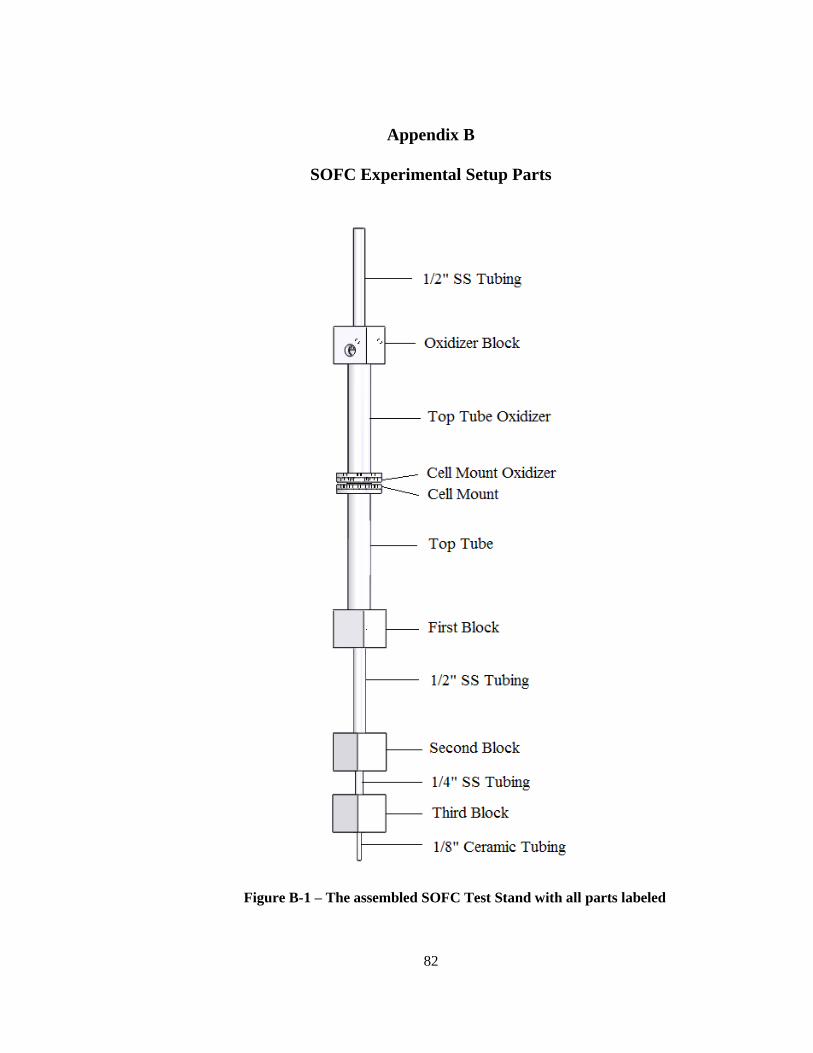
Figure B-1: Drawing of the assembled experimental test stand. ............................................ 82
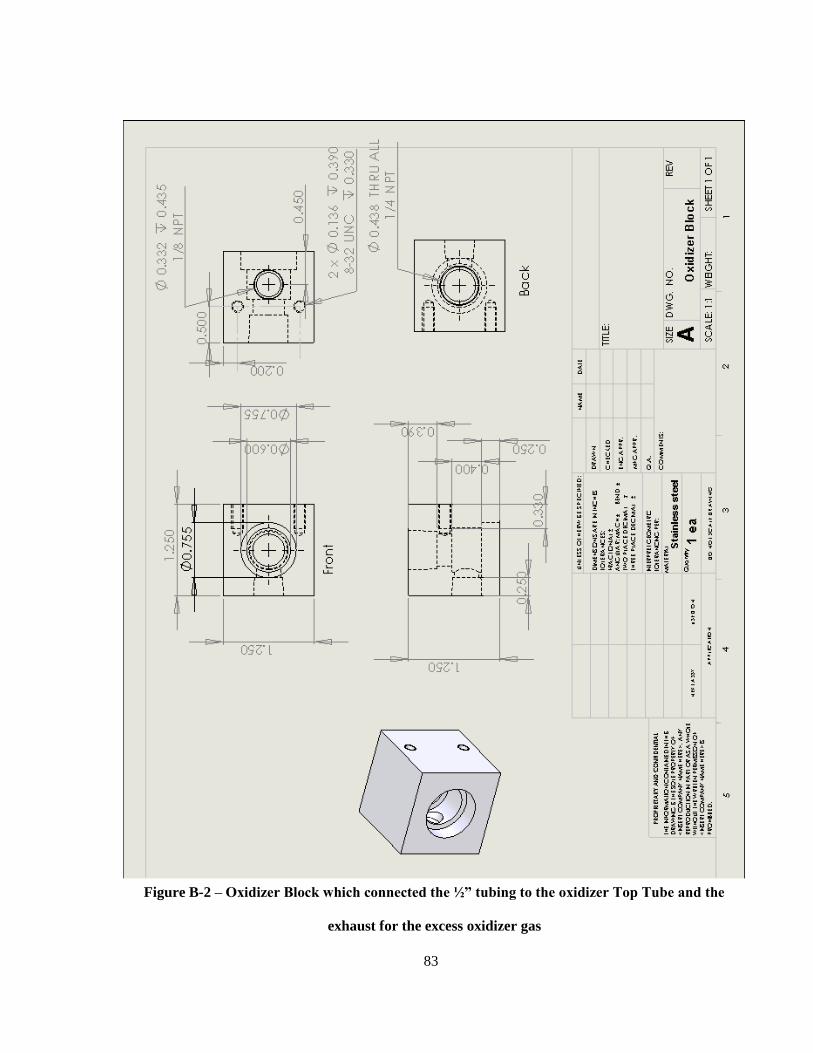
Figure B-2: Drawing of the oxidizer block. ............................................................................ 83
Figure B-3: Drawing of the top oxidizer tube. ........................................................................ 84
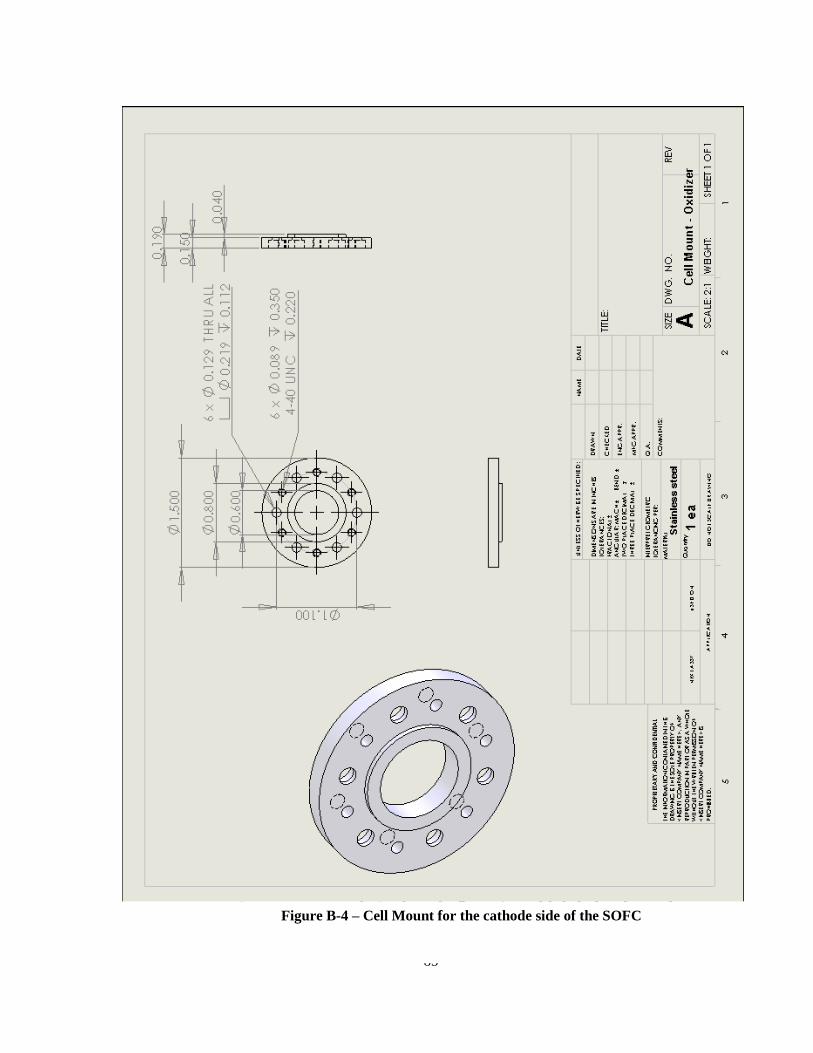
Figure B-4: Drawing of the cell mount for the cathode side. .................................................. 85
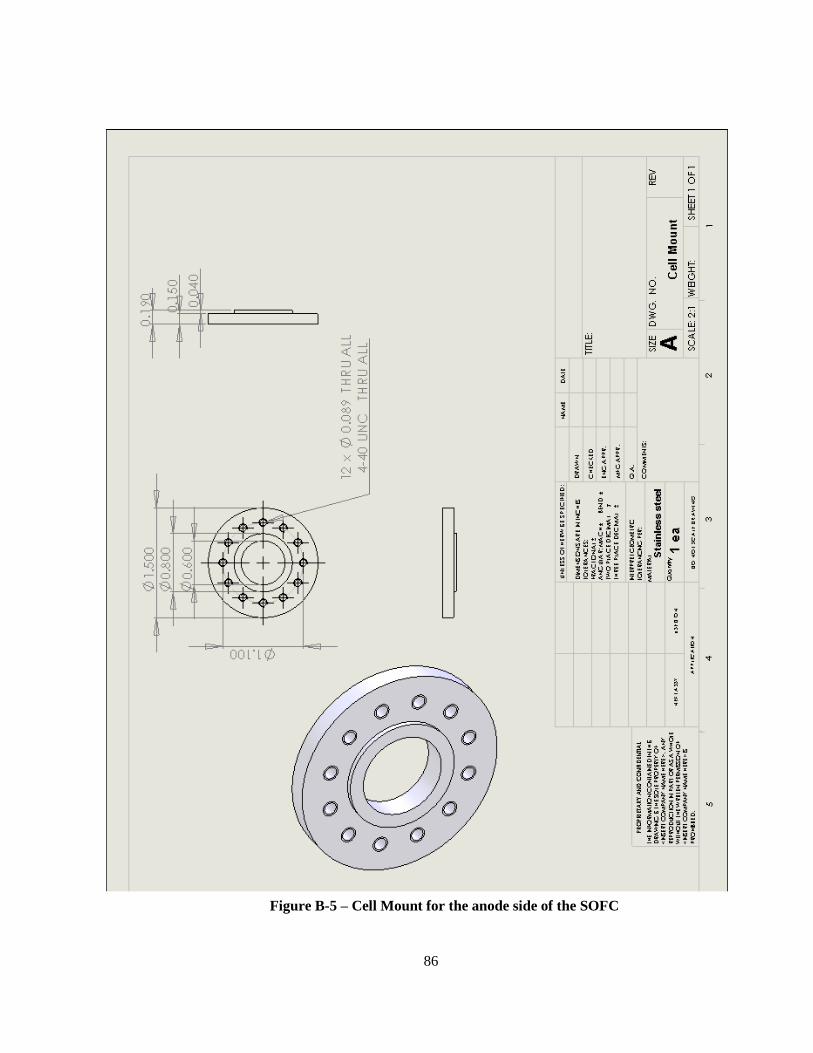
Figure B-5: Drawing of the cell mount for the anode side. .................................................... 86
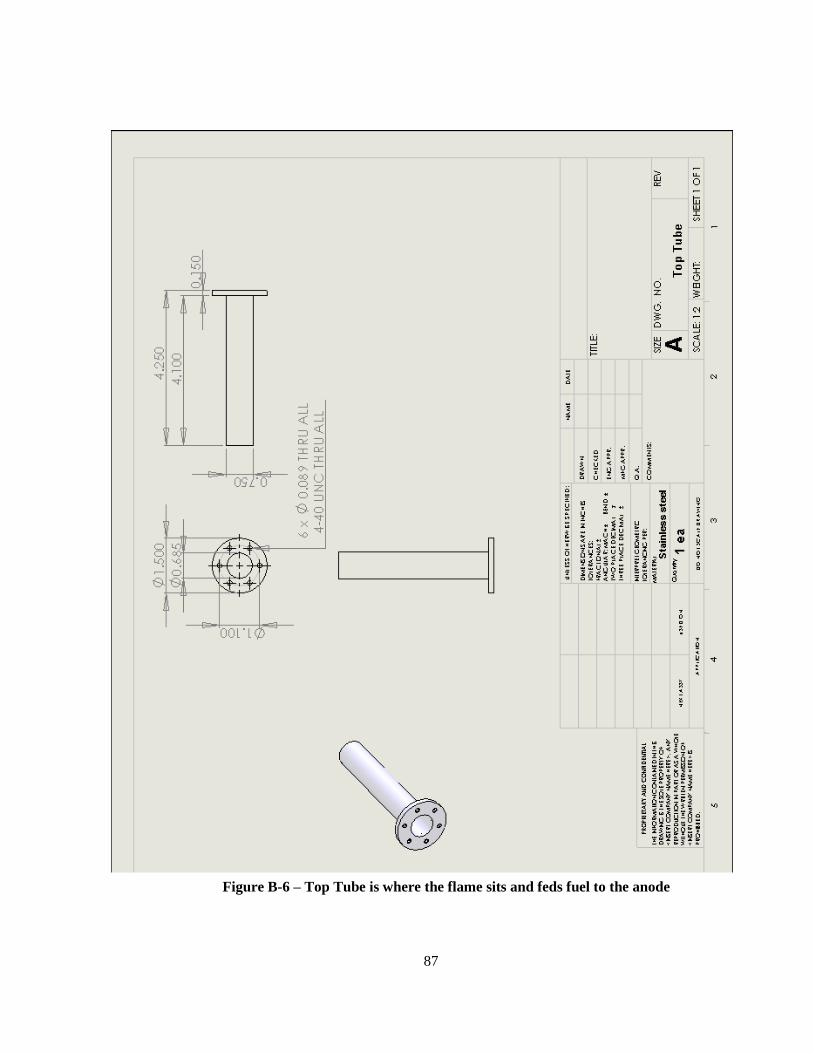
Figure B-6: Drawing of the top flame tube. ............................................................................ 87
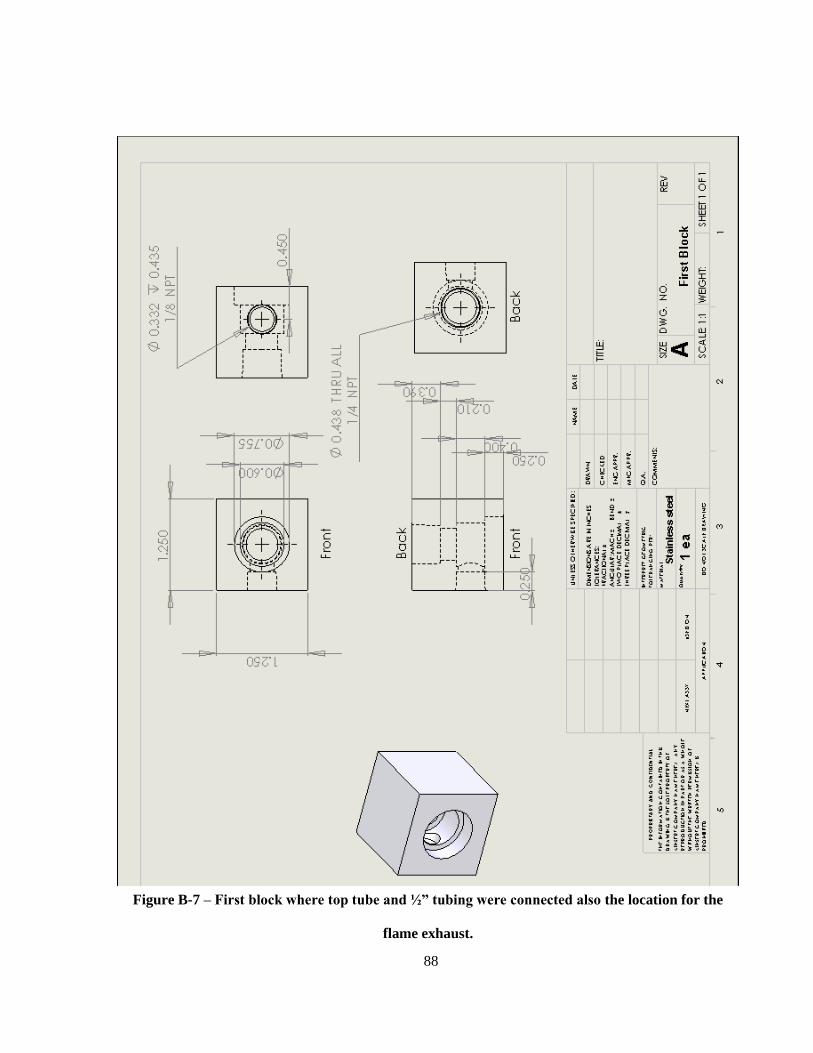
Figure B-7: Drawing of the first block.................................................................................... 88
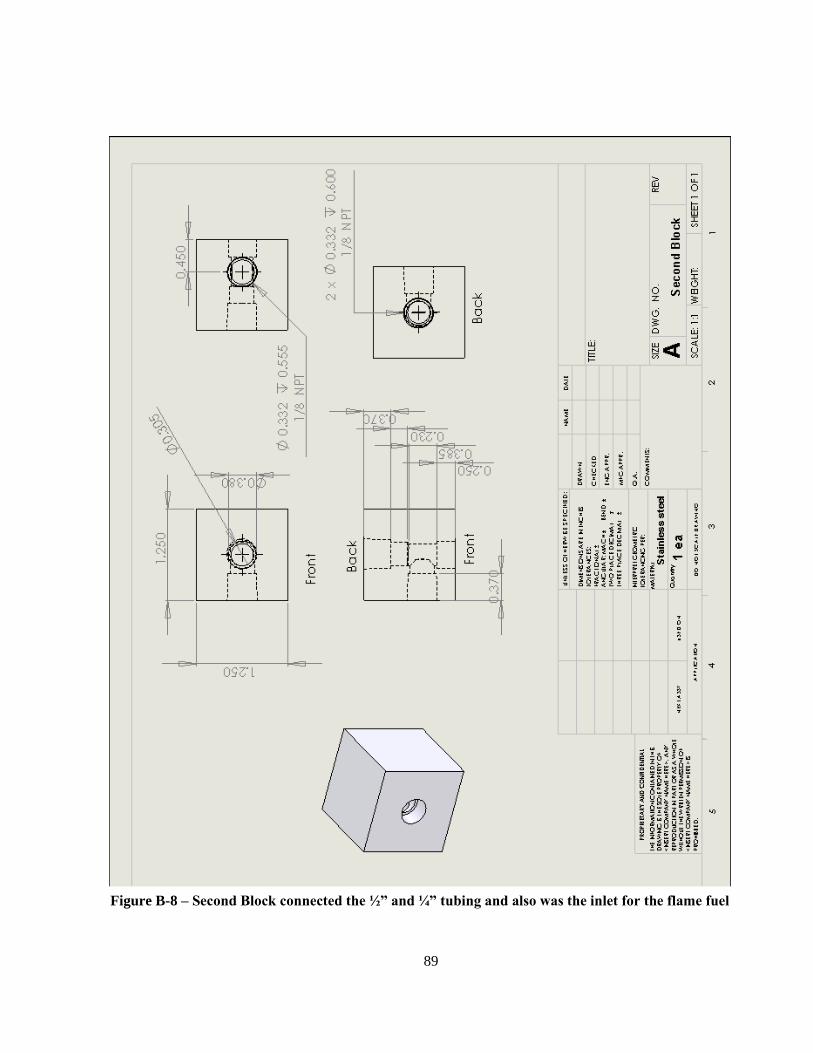
Figure B-8: Drawing of the second block. .............................................................................. 89
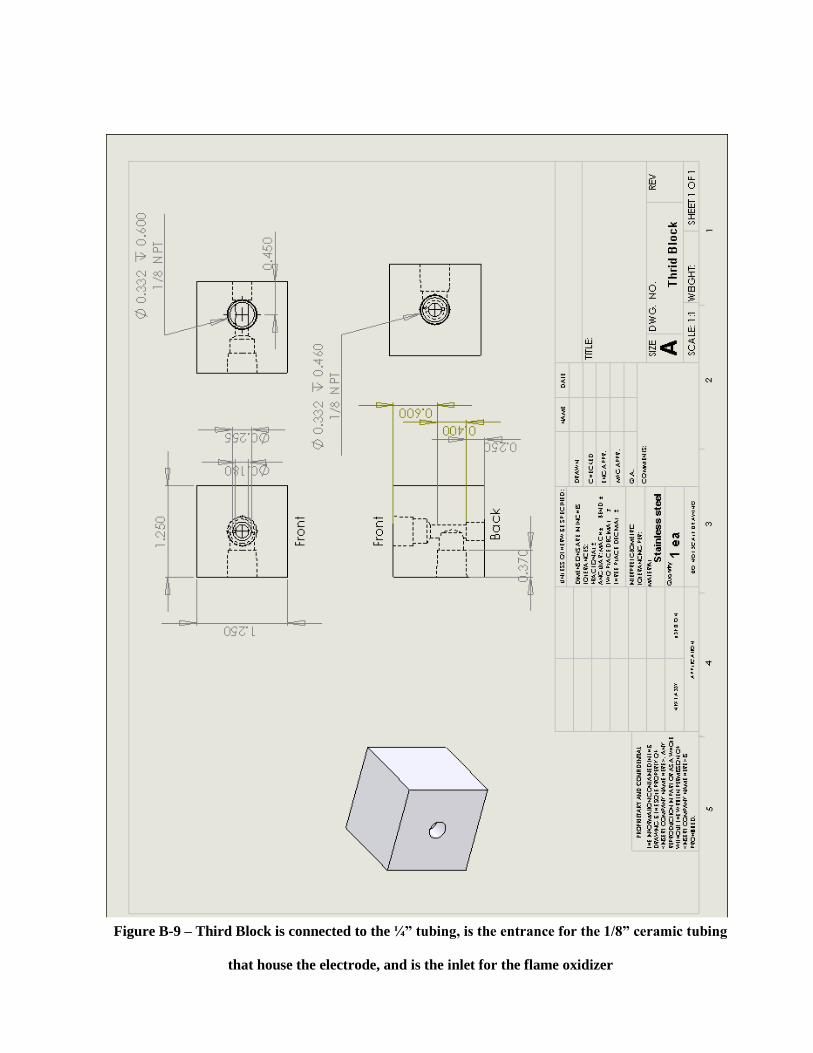
Figure B-9: Drawing of the thrid block. ................................................................................. 90
Figure C-1: Pictures of the silver mesh cut over the cathode and applying the silver ink
to the mesh/cathode. ......................................................................................................... 91
Figure C-2: Pictures of the mesh/cathode/ink after the furnace and applying the LSM
paste to the mesh/cathode................................................................................................. 93
Figure C-3: Pictures of the nickel mesh cut over the anode ................................................... 93
Figure C-4: Pictures of the the silver ink on the mesh/andoe and applying the nickel
paste over the mesh/anode. .............................................................................................. 94
Figure C-5: Picture of the alumina felt o-rings. ...................................................................... 94
Figure C-6: Picture of the alumina flet o-ring placement around the anode .......................... 95
viii
LIST OF TABLES
Table 1-1: A chart with the current fuel cells available today. ............................................... 4
Table 2-1: The advantages and disadvantages of different cell configurations. ..................... 30
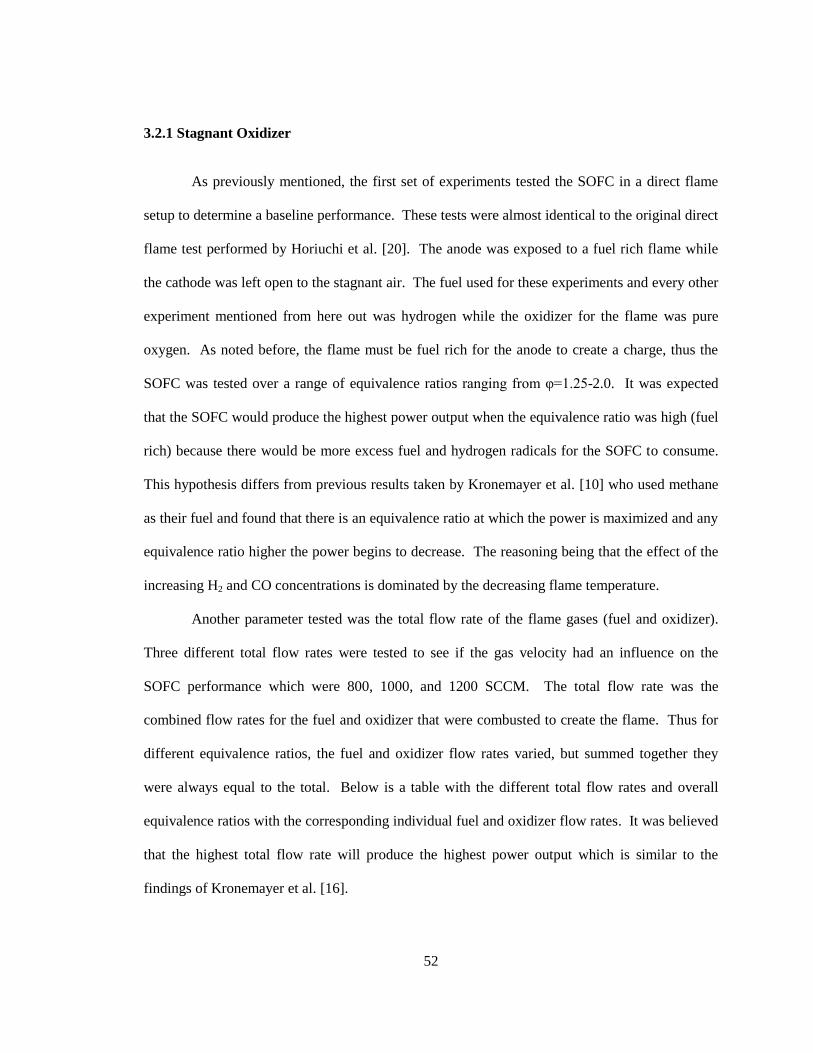
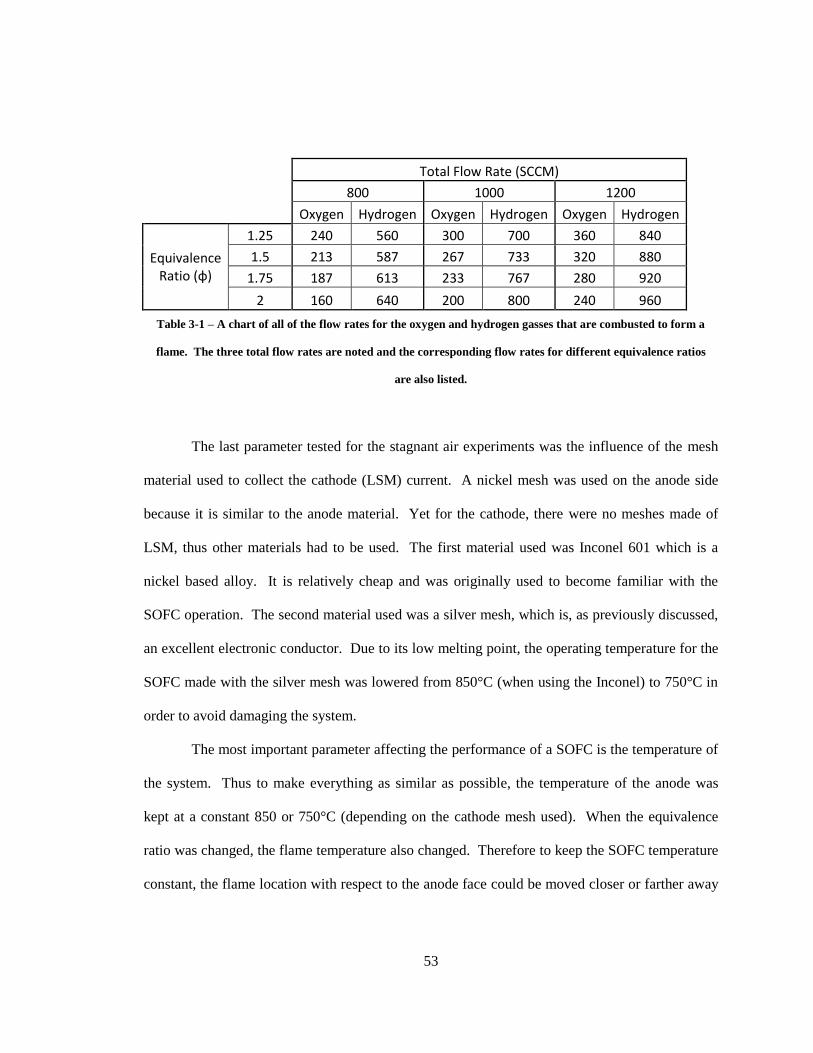
Table 3-1: The flow rates for the diffusion flame at different euqilvance ratios. ................... 53
Table F-1: The maximum recorded values for all of the performed experiments. ................. 99
ix
ACKNOWLEDGEMENTS
I would like to start by expressing my sincere gratitude to my advisor Dr. Richard A.
Yetter and co-advisor Dr. Jonnguen Lee for their continuous guidance and support. I would like
to thank them for giving me the opportunity to work in the Propulsion Engineering Research
Center as an undergraduate and providing me the chance to continue my work as a graduate
student. The experience of working in the lab, their constant support and input, as well as giving
me the freedom to conduct my own research, has proven to be an invaluable experience. I would
also like to thank Dr. Stefan Thynell for his time and effort in reviewing my thesis.
The research presented herein was funded the United States Air Force through the
STTR program in collaboration with Taitech Incorporated. My sincerest gratitude to Dr. Steven
Lin at Taitech and Dr. Mitat Birkan of the AFOSR for allowing me to work on the Micro
Chemical Propulsion project contract #FA9550-09-C-0069.
I would also like to thank Ms. Amanda Baker at Penn State‟s Material Research Lab for
all her help and guidance, Mr. Larry Horner for all the help with manufacturing and machining
different parts for my project, Ms. Mary Newby and Mr. John Raiser for all of their
administrative assistance, as well as all of the members of Dr. Yetter‟s research group for their
help and assistance in my research.
Finally I would like to thank my mother, Pat Donadio, and my father, Mark Donadio, for
their never ending love and support. They have provided me with wonderful opportunities and
have been extremely supportive and understanding my entire life, which has given me the
confidence and strength to achieve my goals. I am truly grateful to them as well as my brothers
and friends who have pushed me over the years to do my best.
x
NOMENCLATURE
Symbols
A - Amps
ADS - Adsorbed
C - Coulomb
e- - Electro charge
E - Energy
Eo - Standard cell potential (V)
Eo
cell - Reversible energy (V)
Ecell - Operating cell voltage
ERS - Electrochemical reaction site
EVD - Electrochemical vapor deposition
F - Faraday constant (96485.34 C/mol)
ΔGo - Gibb‟s free energy (J)
i - Current density (A/cm2)
io - Exchange current density (A/cm2)
I - Current (A)
J - Joule
LPG - Liquefied petroleum gas
LSM - Strontium-doped lanthanum maganite
MEMS - Microelectromechanical system
n - number of moles
OCV - Open current voltage (V)
Q - Reactant quotent
R - Universal gas constant (8.314 J/K*mol)
Ri - Internal resistance (Ω)
SOFC - Solid Oxide Fuel Cell
T - Temperature
TPB - Three phase boundary region
V - Volt
VERS, Vo - Oxygen vacancies
W - Watt
xi
YSZ - Yttria-stabalized zirconia
z - number of electrons
Greek
η - Over potential
ηa - Anode polarization
ηc - Cathode polarization
φ - Equivalence Ratio
Ω - Ohm
1
Chapter 1
Introduction
With an ever increasing demand for new sources for power generation, fuel cells are an
excellent alternative. A fuel cell is an energy conversion device that produces electricity and heat
by an electrochemical combination of a fuel and an oxidant [1-5]. Unlike batteries, the chemical
reactants and products are not physically part of the actual fuel cell system, but are supplied
externally. In a fuel cell, a fuel is passed over an anode where it is oxidized thus releasing an
electron. At the same time an oxidizer (typically pure oxygen or air) is passed over the cathode
where it is reduced and accepts the electron. The ions produced are transferred between the
anode and cathode through an ion conducting electrolyte [3]. The flow of the electron from the
anode to the cathode produces direct current electricity [2]. The electrochemical reactions take
place at the interfaces of the anode/electrolyte and cathode/electrolyte which, combined with the
gas, is the three phase boundary region [1]. Fuel cells appear to be one of the most efficient and
effective solutions to today‟s environmental problems [3]. Comparing fuel cells with more
conventional power generation methods, many advantages can be seen. These advantages
include higher conversion efficiency for the fuel-to-cell electricity conversion chain, potential for
cogeneration, and much lower emission of green house gases and toxic pollutants (i.e. NOX and
SOX emissions) [1,4,6].
1.1 Fuel Cell History
The fuel cell technology has been around for more than 160 years [3]. Volta was the first
to observe the electrical phenomena in a scientific setting, while Ritter, also known as the
2
founder of electrochemistry, continued to develop the understanding of electricity. Sir Humphrey
Davy was the first to create a simple fuel cell in 1802. It was based upon a compound (C/H2O,
NH3/O2/C) which was able to produce a feeble electric shock. Schonein in Switzerland reported
the discovery of the principle of the fuel cell from 1829-1868. Around the same time, Sir
William Grove made an improved wet-cell battery in 1839. It was based on reversing the
electrolysis of water to produce electricity using a dilute sulphuric acid as the electrolyte and
platinum electrodes. He observed that when the current was switched off, a small current flowed
through the circuit in the opposite direction. This was a result of a reaction between the
electrolysis products (H2 and O2) which were catalyzed by the platinum electrodes. From this
observation he concluded that there must be a „notable surface of action‟ between the gas, the
electrode, and the electrolyte [7]. Thus came about the concept of the three-phase boundary
region. In 1899 Nernst discovered solid oxide electrolysis which brought about the first ceramic
fuel cell. Monde and his assistant Lander preformed experiments with a hydrogen/oxygen based
fuel cell and were the first to coin the actual term „fuel cell‟. Oswald really began to develop the
theoretical understanding of the fuel cell operation. Baur did research on several different types
of fuel cells. One of his biggest achievements was with a high temperature device and most
importantly a cell that used an electrolyte that consisted of clay and metal oxides. In the late
1930s, Bacon started researching alkali electrolyte fuel cells and built his first working cell in
1939. Since the mid-1940s, fuel cell research has been the focus of larger groups, the largest
three being from the US, Germany, and the former USSR. In the 1960s the first application was
used on the NASA Apollo space program. Twenty years later, in the mid-1980s, government
agencies began to significantly increase their funds for fuel cell R&D with the leading countries
being the US, Canada, and Japan. [3]
3
1.2 Types of Fuel Cells
Today there are many types of fuel cells which use different materials and work under
various operating conditions. In all cases the basic operating principles are the same: at the
anode a fuel is oxidized into protons and electrons, at the cathode oxygen is reduced to oxide
species, and they both react to form water [7]. The electrolyte can be either proton or oxide ion
permitting. Each type of fuel cell is classified by the electrolyte used as the ion conductor and its
chemical characteristics, which in turn determine the operating temperature [4]. An overview of
several different fuel cells is given below in Table 1-1.
In Table 1-1 the fuel cells are characterized firstly by their operating temperatures. The
first five have low to medium temperatures (50-210°C) and relatively low efficiencies (40-50%).
The latter three have high operating temperatures (600-1000°C) and higher efficiencies (45-60%
and up to 90% with heat recovery) than the first five. There are other types of fuel cells which
are not as commonly used which include the air-depolarized cell, sodium amalgam cells,
biochemical fuel cells, inorganic redox cells, regenerative cells, alkali metal-halogen cell, and so
on. Most of the current fuel cell research has been focused on PEMFC and SOFC which seem to
be the most promising for widespread commercial applications [7]. SOFCs, in particular, are a
great option for power production because it is the most efficient fuel cell under development, is
very fuel flexible, does not consist of any moving parts, has extremely low emissions, and has
high quality by-products which can be used for co-generation or in combined cycles [3]. The
main problem with the SOFC is its high operating temperature, thus much of the current research
has been focused on exploring other materials that can possibly lower the operating temperature.
4
Table 1-1 – A chart consisting of the major fuel cells available today. Each fuel cell is characterized
by its electrode and its chemical reactions.
Fuel cell type Operating
Temperatures
Electrolyte Fuel Oxidant Efficiency
Alkaline fuel
cell (AFC)
50-200°C Potassium
hydroxide
(KOH)
Pure hydrogen
or hydrazine
liquid methanol
O2/Air 50-55%
Direct
methanol fuel
cell (DMFC)
60-200°C polymer Liquid
methanol
O2/Air 40-55%
Phosphoric
acid fuel cell
(PAFC)
160-210°C phosphoric acid Hydrogen from
hydrocarbons
and alcohol
O2/Air 40-50%
Sulfuric acid
(SAFC)
80-90°C Sulfuric acid Alcohol or
impure
hydrogen
O2/Air 40-50%
Proton-
exchange
membrane
(PEMFC)
50-80°C Polymer, proton
exchange
membrane
Less pure
hydrogen from
hydrocarbons or
methanol
O2/Air 40-50%
Molten
Carbonate
fuel cell
(MCFC)
630-650°C Molten salt such
as nitrate,
sulphate,
carbonates…
H2, CO, natural
gas, propane,
marine diesel
CO2/O2/Air 50-60%
Protonic
ceramic
(PCFC)
600-700°C Thick
membrane of
barium cerium
oxide
Hydrocarbons O2/Air 45-60%
Solid oxide
fuel cell
(SOFC)
600-1000°C Ceramic as
stabilized
zirconia and
doped
perovskite
Hydrogen,
hydrocarbons,
carbon
monoxide
O2/Air 45-60%
5
1.3 Introduction to Solid Oxide Fuel Cells
The solid oxide fuel cell (SOFC) is one of the most efficient and environmental-friendly
technologies available for generating power. The SOFC is characterized by having a solid
ceramic electrolyte which is a metal oxide. Similar to other fuel cells, the SOFC consists of a
cathode, at which oxygen is reduced to ions, which pass through the solid electrolyte, to the
anode, where they react with the fuel (generally hydrogen), producing electricity, water
molecules, and heat [3,7]. The most common materials used are yttria-stabilized zirconia (YSZ)
for the electrolyte, strontium-doped lanthanum manganite (LSM) for the cathode, nickel/YSZ for
the anode, and doped lanthanum chromite or high-temperature metals for the interconnect [5].
The operating temperature range is from 600-1000°C, and has several advantages over other
types of fuel cells which include not using precious metals in the fabrication and operation, all
materials are solids thus no liquids are involved, high operating temperature which allows internal
reforming to occur, invariant electrodes, and very high efficiencies which can reach 65% [2-4,7].
The high operating temperature of the SOFC can be seen as both an advantage and a
disadvantage. It is beneficial because it promotes rapid reaction kinetics, thus allowing reforming
of fuels (hydrocarbons) within the fuel cell (internal reforming). Thus there is no need for an
external reformer, allowing simpler and cheaper designs [3,4,6]. Another advantage of the high
temperatures is that the byproduct heat formed during operation can be used in cogeneration or
bottoming cycling which can increase the overall efficiency even higher. Other advantages
include: quiet, vibration free operation, high power density, and immunity to carbon monoxide
poisoning. The main disadvantage of the high operating temperature is the strict requirements
placed on the materials being used. Only materials that can withstand these extreme temperatures
can be used and they tend to be rare and expensive. Also due to the high temperatures, there is a
longer startup and cool down time. A considerable amount of current research is focused on
6
lowering the operating temperature which will allow the use of cheaper and more desirable
materials for fabrication.
1.3.1 SOFC History
Along with the discovery of the solid oxide electrolyte by Nernst in 1899, came the first
conceived SOFC. The main discovery being that mixtures of metal oxides can poses higher
conductivities then non mixtures [7]. He noted several different mixed oxides that exhibited high
conductivity at high temperatures, including a form of the most currently used composition of
85% zirconium oxide and 15% yttrium oxide. In 1905 Haber filed the first patent on fuel cells
containing a solid electrolyte. The electrolyte consisted of glass and porcelain and the electrodes
were made from platinum and gold. In 1916, the first patent on a fuel cell with metal oxides as
the electrodes and ceramic solids as the electrolyte was submitted by Swiss scientists Baur and
Treadwell. It was not until 1935 when Schottky suggested using yttria-stabalized zirconia,
similar to that of Nernst, as the electrolyte material. In 1937 Baur and colleague H. Preis
operated the first solid oxide (or ceramic) fuel cell with a yttria-stabilized zirconia electrolyte at
1000°C [4]. Wagner discovered that the mixed oxide solid solutions have vacancies in their
anion sublattice, thus confirming that they are oxide ion conductors. Research began to
significantly increase around the world in the late 1950s in countries such as the Netherlands and
the United States. At a conference in 1959, a discussion was held on fuel cells and it was
determined that the solid electrolyte had several problems which included relatively high internal
electrical resistance, melting, and short circuiting [3]. Not everyone gave up on the technology
and in 1962, Westinghouse was experimenting with solid electrolytes consisting of zirconium and
calcium oxides. Since then the ceramic fuel cells have made much progress and there is a
7
widening interest in this technology [2]. Due to climbing energy prices and advances in material
technology, research on SOFCs is one of the biggest topics for producing electricity.
1.3.2 Applications
The SOFC is being developed for different scenarios in which high power reliability and
minimal or no emissions are desired. The two major ones being scaling up for larger power
plants (hundreds of MW) and scaling down to use as on-chip power supplies for
microelectromechanical devices(a few Watts) [3,7]. Currently the most dominant application
area for SOFCs is stationary systems which can range from several kW to several MW of
electrical power. The reason SOFCs make such a good fit for large scale application is because
the properties can be exploited as follows: the high operating temperatures are able to be isolated
easier, constant-power generation is advantageous over constant start-up and shut-down
operation, natural gas is an excellent fuel and is readily available for stationary applications, and
the high operating temperature is perfect for combined cycling systems where the overall
efficiency can be as high as 80% [1,7].
Other applications include smaller size systems for residential heat and power
cogenerations, auxiliary power units for trucks and cars, and on smaller power range systems for
portable power generation for both civil and military applications [1,3]. As mentioned
previously, some applications have brought the SOFC down to the micro-scale. This would allow
for the replacement of batteries and the possibility for power supplies for microelectromechanical
(MEMS) devices [1]. In order for the SOFC to break through into the main stream, the cost needs
to be lowered and the long term stability as well as overall performance needs to be improved.
8
1.4 Motivation
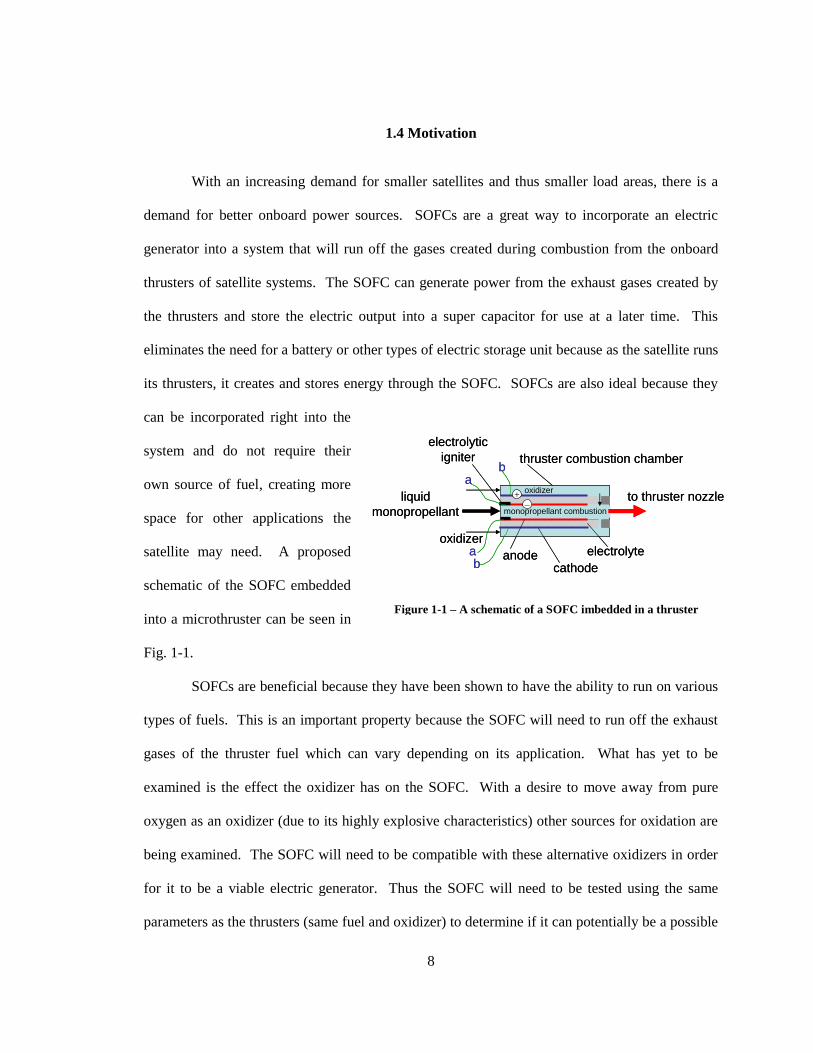
With an increasing demand for smaller satellites and thus smaller load areas, there is a
demand for better onboard power sources. SOFCs are a great way to incorporate an electric
generator into a system that will run off the gases created during combustion from the onboard
thrusters of satellite systems. The SOFC can generate power from the exhaust gases created by
the thrusters and store the electric output into a super capacitor for use at a later time. This
eliminates the need for a battery or other types of electric storage unit because as the satellite runs
its thrusters, it creates and stores energy through the SOFC. SOFCs are also ideal because they
can be incorporated right into the
system and do not require their
own source of fuel, creating more
space for other applications the
satellite may need. A proposed
schematic of the SOFC embedded
into a microthruster can be seen in
Fig. 1-1.
SOFCs are beneficial because they have been shown to have the ability to run on various
types of fuels. This is an important property because the SOFC will need to run off the exhaust
gases of the thruster fuel which can vary depending on its application. What has yet to be
examined is the effect the oxidizer has on the SOFC. With a desire to move away from pure
oxygen as an oxidizer (due to its highly explosive characteristics) other sources for oxidation are
being examined. The SOFC will need to be compatible with these alternative oxidizers in order
for it to be a viable electric generator. Thus the SOFC will need to be tested using the same
parameters as the thrusters (same fuel and oxidizer) to determine if it can potentially be a possible
thruster combustion chamber
to thruster nozzle
oxidizer
liquid
monopropellant
anodecathode
electrolyte
+
monopropellant combustion
oxidizer
electrolytic
igniter
a
a
b
b
thruster combustion chamber
to thruster nozzle
oxidizer
liquid
monopropellant
anodecathode
electrolyte
+
monopropellant combustion
oxidizer
electrolytic
igniter
a
a
b
b
Figure 1-1 – A schematic of a SOFC imbedded in a thruster
9
addition to the system. Since a significant body of research has already been concentrated on
various fuels, the focus of this paper will be determining the effectiveness of different oxidizers,
other than molecular oxygen, on the performance of the SOFC.
1.5 Thesis Overview
The following sections of this thesis are designed to give the reader a complete
understanding of the solid oxide fuel cell as well as detailed descriptions of the experimental
setup, experiments, and results. First a comprehensive review of the SOFC is presented, which
includes how the SOFC works, the various parts and their corresponding materials, as well as the
different cell configurations, fuels, and experimental setups that can be used with a SOFC. Next
the focus turns to the research performed. Each of the experiments are individually reviewed
along with their corresponding setups. The experimental results are presented and discussed with
explanations as to what is believed to be the rate limiting steps for power production within the
SOFC. Finally, the conclusions are summarized and future work is proposed.
10
Chapter 2
The Solid Oxide Fuel Cell
The solid oxide fuel cell is comprised of an electrolyte, anode, cathode, and interconnect
which are layered together to form a complete cell. All of the components are essential and must
meet the same requirements which include: proper stability (chemical, phase, morphological, and
dimensional) in oxidizing and reducing environments, chemical compatibility, proper
conductivity, and similar coefficients of thermal expansion [2]. Furthermore, the electrolyte and
interconnect must be a dense material in order to separate the fuel and oxidizer, while the anode
and cathode must be porous to allow the transportation of gases to the reaction sites (or the three
phase boundary region). Other properties which are not necessarily vital but desirable are high
strength, high durable, and low cost. The SOFCs differ from the other fuel cells for several
reasons: they are composed of all-solid-state components, they operate at very high temperatures,
and due to the characteristics, there is no fundamental restriction on the cell configuration [3].
In theory, any gas that can be electrochemically oxidized or reduced can be used as the
fuel or oxidizer for a fuel cell respectively [2]. The most commonly used fuel is hydrogen
because of its high electrochemical reactivity. Common fuels such as hydrocarbons, alcohols, or
coal, which are widely available, can also be used. For the oxidizer, oxygen is the most common
gas used since it is readily and economically available being in the air. At the electrolyte, only
electrical energy and water are produced when the cell is running at its most efficient state.
The SOFC can be classified as either being an oxygen ion conductor or proton conductor.
The major difference is whether the hydrogen or oxygen ions are allowed to pass through the
electrolyte, thus determining on which side the water is produced [2]. The oxygen conductor is
the type most widely used while a proton conductor has only been suggested in theory [3].
11
2.1 Operating Principles of a SOFC
The solid oxide fuel cell is a particular type of fuel cell that is known for its very high
operating temperatures. The SOFC is made up of three different components: 1) the cathode, 2)
the anode, and 3) the electrolyte. All three components are made up of very specific and different
materials (which are explained below). The process in which a SOFC produces electrical power
is fairly simple. Oxygen (air) passes over the cathode where it is reduced to oxygen ions. The
oxygen ions migrate through the electrolyte to the anode. At the anode, the oxygen ions react
with the fuel (which is usually hydrocarbon based) to produce electrical power and water. Below
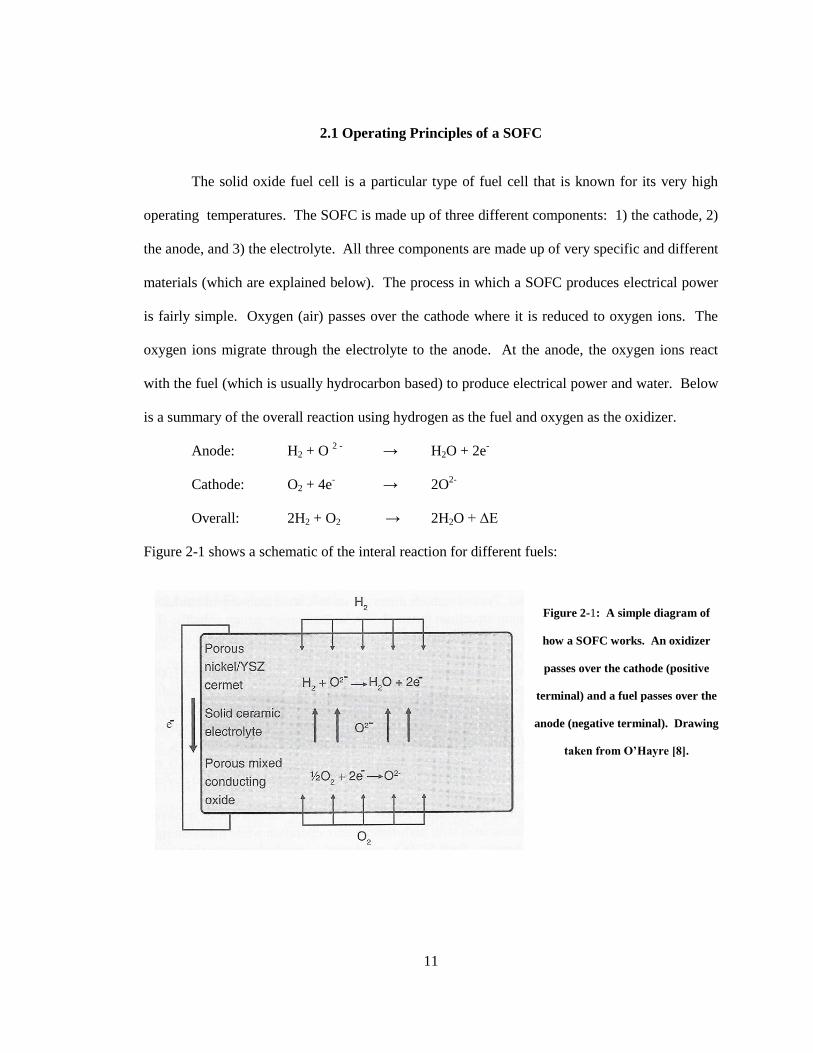
is a summary of the overall reaction using hydrogen as the fuel and oxygen as the oxidizer.
Anode: H2 + O 2 -
→ H2O + 2e-
Cathode: O2 + 4e- → 2O
2-
Overall: 2H2 + O2 → 2H2O + ΔE
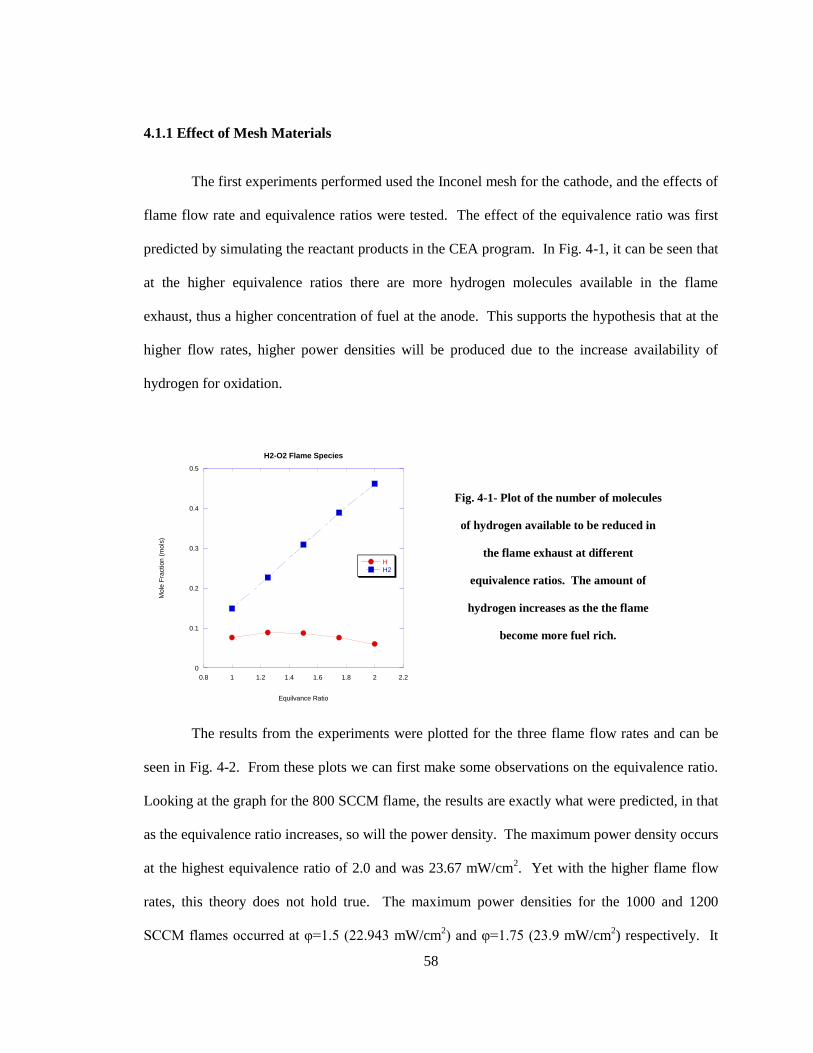
Figure 2-1 shows a schematic of the interal reaction for different fuels:
Figure 2-1: A simple diagram of
how a SOFC works. An oxidizer
passes over the cathode (positive
terminal) and a fuel passes over the
anode (negative terminal). Drawing
taken from O’Hayre [8].
12
Fig. 2-2 - Simplified schematic of electrode-
electrolyte interface in a fuel cell, showing
the TPB regions where the electrode
particles, electrolyte, and gas pores are all in
contact with each other. Drawing Taken
from O’Hayre [8].
2.1.1 Electrochemistry
The electrochemistry of a SOFC is strongly dependent on the high operating temperature
required to allow sufficient ionic conductivity of the ceramic electrolyte [1]. Unlike other fuel
cells the SOFC is a charge carrier and does not dissolve reactants or products. This brings about
the need for an additional phase, the gas phase, driving the total amount of phases to three:
electrolyte, electrode, and gas phase. Thus the concept of the three phase boundary (TPB) region
was established and it is the only place in the fuel cell where electrochemistry can take place
because it is the only place where the three phases are all spatially close enough for a reaction to
occur (see Figure 2-2).
The reversible voltage Eocell is the max voltage that can be achieved by a SOFC under
specified conditions of temperature and gas composition. Eo
cell can be calculated from the Nernst
equation:
Eq. 2-1
where R is the universal gas constant, T is the temperature, z is the number of electrons
transferred in the cell, F is Faraday‟s constant, Q is the reaction quotient (which can be calculated
13
from the gas partial pressure), and Eo is the standard cell potential. E
o can be found by the
following equations:
Eq. 2-2
where ΔGo is the Gibb‟s free energy, n is the number of moles of electrons, and F is Faraday‟s
constant. The voltage of the operating cell Ecell is always lower than Eocell. This is due to the fact
that as the current is drawn from the fuel cell, the cell voltage falls due to internal resistance and
polarization losses [2]. Thus, the voltage of an operating cell is given as:
Eq. 2-3
where IRi is the internal resistance or ohmic loss (I is cell current and Ri is the internal resistance
of the cell) and ηa and ηc are the anode and cathode polarization respectively. Ohmic losses result
from the resistance of the electrolyte and the other cell components. Polarization (overpotential)
losses are associated with the electrochemical reaction taking place at the interface between the
electrodes and electrolyte [2].
2.1.2 Anode Reactions
The electrochemical oxidation of hydrogen on the nickel anodes in contact with YSZ has
not received much attention due to the fact that it is believed that the polarizations losses at the
SOFC anodes are small compared to the reducing cathode [2]. The oxidation of hydrogen at the
nickel electrode produces water according to the following equation:
Eq. 2-4
14
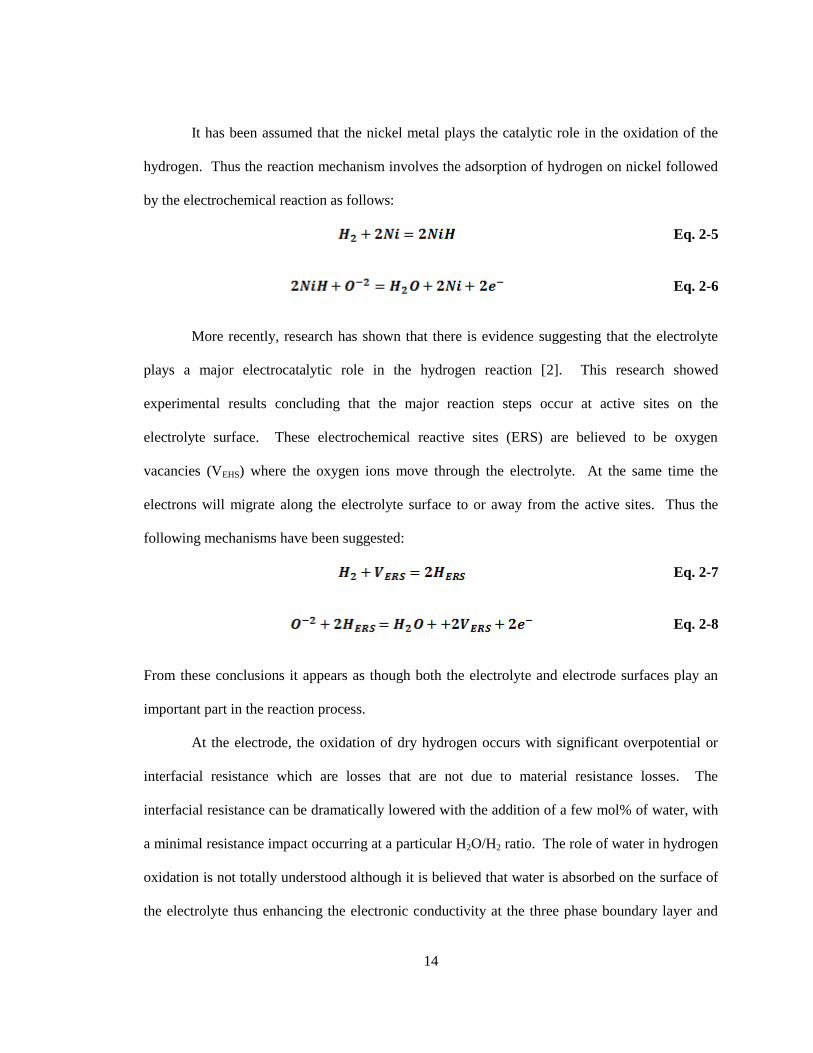
It has been assumed that the nickel metal plays the catalytic role in the oxidation of the
hydrogen. Thus the reaction mechanism involves the adsorption of hydrogen on nickel followed
by the electrochemical reaction as follows:
Eq. 2-5
Eq. 2-6
More recently, research has shown that there is evidence suggesting that the electrolyte
plays a major electrocatalytic role in the hydrogen reaction [2]. This research showed
experimental results concluding that the major reaction steps occur at active sites on the
electrolyte surface. These electrochemical reactive sites (ERS) are believed to be oxygen
vacancies (VEHS) where the oxygen ions move through the electrolyte. At the same time the
electrons will migrate along the electrolyte surface to or away from the active sites. Thus the
following mechanisms have been suggested:
Eq. 2-7
Eq. 2-8
From these conclusions it appears as though both the electrolyte and electrode surfaces play an
important part in the reaction process.
At the electrode, the oxidation of dry hydrogen occurs with significant overpotential or
interfacial resistance which are losses that are not due to material resistance losses. The
interfacial resistance can be dramatically lowered with the addition of a few mol% of water, with
a minimal resistance impact occurring at a particular H2O/H2 ratio. The role of water in hydrogen
oxidation is not totally understood although it is believed that water is absorbed on the surface of
the electrolyte thus enhancing the electronic conductivity at the three phase boundary layer and
15
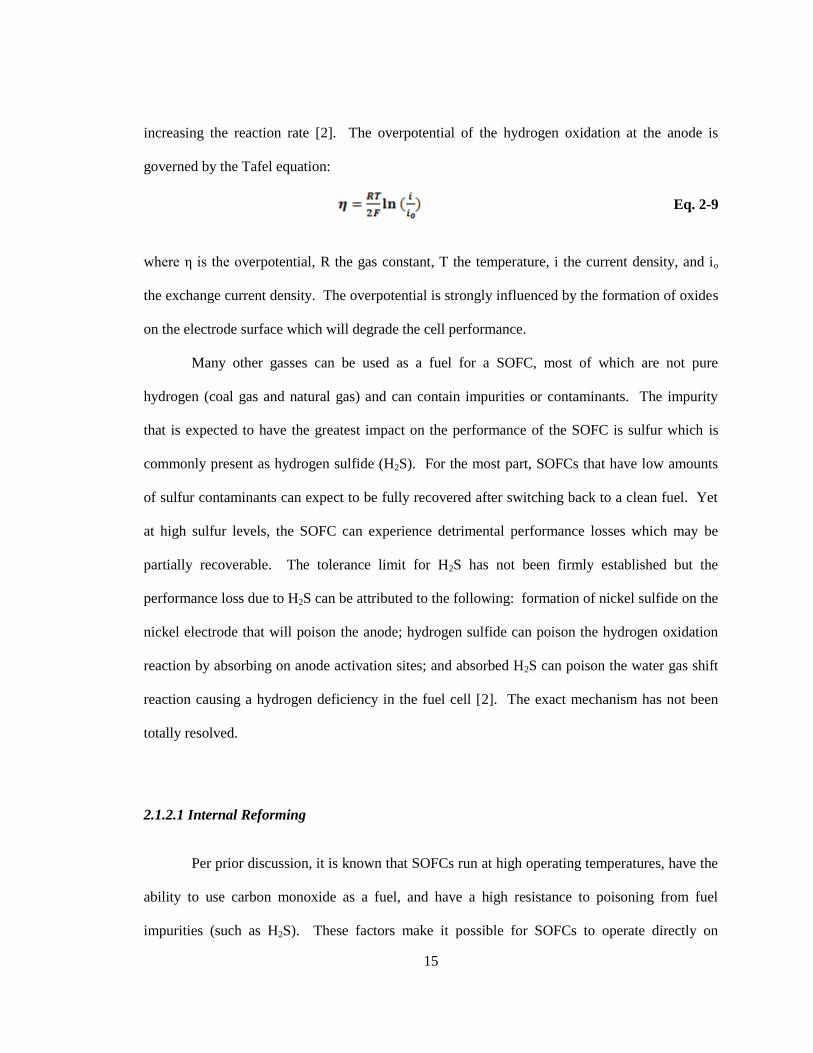
increasing the reaction rate [2]. The overpotential of the hydrogen oxidation at the anode is
governed by the Tafel equation:
Eq. 2-9
where η is the overpotential, R the gas constant, T the temperature, i the current density, and io
the exchange current density. The overpotential is strongly influenced by the formation of oxides
on the electrode surface which will degrade the cell performance.
Many other gasses can be used as a fuel for a SOFC, most of which are not pure
hydrogen (coal gas and natural gas) and can contain impurities or contaminants. The impurity
that is expected to have the greatest impact on the performance of the SOFC is sulfur which is
commonly present as hydrogen sulfide (H2S). For the most part, SOFCs that have low amounts
of sulfur contaminants can expect to be fully recovered after switching back to a clean fuel. Yet
at high sulfur levels, the SOFC can experience detrimental performance losses which may be
partially recoverable. The tolerance limit for H2S has not been firmly established but the
performance loss due to H2S can be attributed to the following: formation of nickel sulfide on the
nickel electrode that will poison the anode; hydrogen sulfide can poison the hydrogen oxidation
reaction by absorbing on anode activation sites; and absorbed H2S can poison the water gas shift
reaction causing a hydrogen deficiency in the fuel cell [2]. The exact mechanism has not been
totally resolved.
2.1.2.1 Internal Reforming
Per prior discussion, it is known that SOFCs run at high operating temperatures, have the
ability to use carbon monoxide as a fuel, and have a high resistance to poisoning from fuel
impurities (such as H2S). These factors make it possible for SOFCs to operate directly on
16
hydrocarbon fuels without the need for a separate and complex fuel processor to reform the
hydrocarbon fuel into hydrogen and carbon dioxide [7]. Instead the SOFC is able to reform the
fuel into H2 and CO within its own system, which is called internal reformation. This is a major
benefit of SOFCs because it not only increases the efficiency of the system, but it also reduces the
complexity. Another way to reform the fuel before passing it over the anode is to pass the
exhaust of a fuel rich flame over the anode. During the combustion process, especially if
hydrocarbons are used, the fuel will break down into hydrogen radicals that will be used to create
a current in the SOFC. Yet there are problems that come with internal reforming, most notably,
carbon deposition (also referred to as carbon coking), which is the build up of carbon on the
anode or other places in the SOFC. This needs to be avoided because over time it will lead to a
loss of fuel reforming, blocking of active sites, and an overall loss of cell performance.
Because of high operating temperatures a SOFC can reform conventional hydrocarbon
fuels internally either directly or indirectly. Direct reforming of the fuel on the anode offers the
simplest and most cost-effective solution. In this case, the anode must fulfill three roles: the first
as a reforming catalyst that converts the hydrocarbons into hydrogen and carbon monoxide, the
second as an electrocatalyst that electrochemically oxidizes the hydrogen and carbon monoxide to
water and carbon dioxide, and finally as an electrical conducting electrode [7]. The main
problem with direct internal reforming is the susceptibility of the nickel anode to carbon
deposition which is described further below.
Indirect internal reforming requires a separate catalyst to reform the hydrocarbon fuel.
This makes it much easier to manage and control the temperature of the system. The most
common oxidant for reforming the hydrocarbon fuel is steam which is added to the fuel feed.
The following is an example of steam reforming of a hydrocarbon fuel (methane) and a non-
hydrogen based fuel (carbon monoxide):
17
Eq. 2-10
Eq. 2-11
This process leaves one with a mixture of methane, water, carbon dioxide, and hydrogen.
The factors that affect the equilibrium are operating pressure, the temperature, and the steam ratio
[2]. When insufficient amounts of steam are present, carbon can be deposited on the anode
surface as follows (Eq. 2-12 & 13 correspond to Eq. 2-10 &11 without water being present):
Eq. 2-12
Eq. 2-13
This extra carbon formation or deposition is undesirable because it can be deposited on
the anode surface and can plug gas flow. This will degrade the anode performance by blocking
the active sites and thus result in a loss of cell performance.
2.1.3 Cathode Reactions
The overall cathode reaction for the oxygen reduction is as follows:
Eq. 2-14
The reaction is made up of a series of bulk and surface processes. One or several of these
processes can be the rate-determining step and can include: gas diffusion to the electrode or
within the pores of the electrode; adsorption and dissociation of oxygen on the electrode surface
or the electrolyte; diffusion of adsorbed oxygen on the electrode (on the electrolyte to the three
phase boundary layer or into the electrode/electrolyte interface); diffusion of electron holes in the
electrolyte; and charge transfer across the electrode/electrolyte phase boundary. The majority of
18
the experiments observing the oxygen reaction have used platinum for the electrodes. Many rate-
controlling steps have been proposed but it is well established that the rate-controlling step for the
oxygen reduction on platinum electrodes varies, depending on the experimental conditions, such
as oxygen partial pressure, temperature range, overpotential regime, and electrode characteristics
[2]. There is still much disagreement on the reaction kinetics‟ nature.
Contrary to platinum electrodes, oxygen reduction has not been as extensively studied for
oxide electrodes. Different oxide materials have different reaction mechanisms and different
catalytic activity for oxygen reduction which have been attributed to their different catalytic
ability for oxygen-molecule dissociation [2]. The concentration of oxygen absorption sites is
directly related to the concentration of defects or vacancies in the electrode. Thus a certain level
of oxygen vacancies are present, influencing the exchange of oxygen, and consequently the
reaction rate at the materials surface. The oxygen reaction takes place not only at the three phase
boundary region but also on the electrode surface according to the following equations:
Eq. 2-15
Eq. 2-16
This is a result of the presence of both electrons and oxygen vacancies, mixed electronic
and ionic conduction in the electrode material. The interfacial resistance of doped LaMnO3 (a
common cathode material which will be discussed in more detail later) is strongly dependent on
the firing temperature during the fabrication. This is a result of changes in the contact area at the
electrolyte/electrode interface and the length of the three-phase boundary layer where the
electrochemical reaction takes place. At higher temperatures, the electrodes have smother
particles resulting in an enhanced contact between the electrode particles and electrolyte thus a
19
larger capacitance. Yet due to the particles being smoother, the three-phase boundary layer
becomes shorter, resulting in higher interfacial resistance.
2.2 SOFC Parts and Materials
The SOFC is constructed from porous electrodes that are separated by a dense, oxygen
ion conducting electrolyte [6]. The materials for these parts need to be very specific in order for
the power generation process to occur. They are selected based on very particular criteria. The
materials must be able to conduct electricity, must be chemically and structurally stable at high
temperatures, have little to no reactivity between materials, and all materials must have matching
thermal expansions to avoid delamination and cracking. It is also important that these materials
are cost effective and easy to fabricate. Each component of the SOFC as well as interconnects
and sealants are further discussed in the following sections.
SOFC parts have been intensively studied since its discovery by Nernst. While many
materials have been tested and used successfully there is still much research going on to find the
optimal combination of metals and ceramics. Many physical properties need to be considered
when deciding on part materials which include the thermal expansion coefficient, mechanical
strength, ionic and electronic conductivity, chemical compatibility with other components, etc.
[1,7]. The most common materials used for SOFCs are as follows: Oxygen-ion conducting
stabilized zirconia is used for the electrolyte and determines the operating temperature. It is also
used as a barrier to prevent the two electrodes from coming into contact. Nickel/stabilized
zirconia is used for the anode (negative electrode) and disperses the fuel and conducts the
electrons that are freed from the fuel. Doped lanthanum manganite for the cathode (positive
electrode) distributes the oxidizer onto its surface and conducts electrons back from the external
circuit. The two electrodes must bring into contact the three phase boundary which is the location
20
where the gas, solid electrolyte, and electrode are all in contact [3]. Doped lanthanum chromite
or precious metals for the interconnects allows the collection of the electrons and thus the
production of electrical energy. All parts will be discussed in more detail in the following
sections.
The following is a list of the main requirements for the different SOFC components [3]:
Proper stability (chemical, phase, morphological, and dimensional)
Proper conductivity
Chemical compatibility with other components
Similar thermal expansion to avoid cracking during the cell operation
Dense electrolyte and interconnect to prevent gas mixing
Porous anode and cathode to allow gas transport to the reaction site
High strength and toughness
Fabricability
Amenable to particular fabrication conditions
Compatibility at higher temperatures at which the ceramic structures are
fabricated
Low Cost
2.2.1 Solid Electrolyte
The material used for the solid electrolyte must be able to allow oxygen ion
transportation, but it also cannot be porous to keep the fuel and oxidizer separated. The most
effective electrolyte for the high-temperature SOFC is zirconia doped with 8 to 10 mole percent
yttria ((ZrO2)X(Y2O3)1-X), or yttria-stabilised zirconia (YSZ) [9]. Not only does this material have
21
good oxygen ion conductivity but it is stable in both oxidizing and reducing atmospheres [7].
Yttrium oxide is the component in the electrolyte that allows oxygen ion transportation to take
place. Although other oxides have also been experimented with and have proved to work, Y2O3
has yielded the most promising results.
The main purpose of the solid electrolyte is to allow the transfer of oxygen ions (O2-
)
from one electrode to the other where it will react with the fuel to generate electrical voltage [6].
It also must be able to separate both the fuel and oxidizer from reacting with the cathode and
anode respectively. Thus the electrolyte must be made of a non-porous, ion-conducting material.
The most common material used for the electrolyte is stabilized zirconia (ZrO2), especially yttria-
stabilized zirconia (YSZ, Y2xZr1-2xO2-x, where x-dopant concentration in mol% Y2O3 in ZrO2),
because it is able to conduct oxygen-ions without electron conduction, is stable in both reducing
and oxidizing atmospheres, is not reactive towards the other component materials, and is non
porous thus does not allow the mixing of the fuel and oxidizer gasses [1,2,3,6,7]. In its pure
form, ZrO2 is a poor choice for an electrolyte due to its low ionic conductivity which is a result
from a crystal structure without enough oxygen vacancies. In order to increase the number of
vacancies, certain oxides can be added to alter the crystal structure to cubic form which also
increases the oxygen vacancy concentration (see Fig. 2-3). The most commonly used oxides or
dopants are CaO, MgO, Y2O3, Sc2O3, as well as certain rare-earth oxides [2]. Doping with Y2O3
exchanges the Zr4+
cations of the ZrO2 host lattice with Y3+
cations, thus allowing the formation
of oxygen vacancies [1,9]. These vacancies are important because it is where oxygen ion
conduction takes place, allowing for the transfer of oxygen ions through these spaces in the
stabilize zirconia. The oxygen ions from the cathode “leap” from vacancy to vacancy until they
reach the anode [3]. To achieve the maximum conductivity, the minimum amount of dopant is
required to fully stabilize the cubic phase [2,7]. While doping of ZrO2 with Y2O3 does not yield
the highest conductivity, YSZ is the most commonly stabilized form because of its availability
22
and cost. Besides conductivity, it is desirable to have an electrolyte that has a high fracture
toughness. Unfortunately YSZ is rather brittle, thus many approaches are being taken to increase
mechanical properties without lowering the conductivity. The innovative fuel cell company, Fuel
Cell Material, has already developed a new Hionic electrolyte that is much stronger than YSZ
(Appendix A).
While YSZ is the most common electrolyte, other types are also being developed
including stabilized bismuth oxide (Bi2O3). This material shows its highest conductivity at
similar temperatures to YSZ. Yet at lower temperature (between 500-700°C) the conductivity is
much higher than that of stabilized zirconia [2,9]. Thus it may be possible to use Bi2O3 at lower
temperature but because of the ease at which it can be reduced under low oxygen partial pressures
makes the practical use questionable. Another electrolytic material under consideration is ceria
(CeO2) doped with CaO, Y2O3, or various rare-earth oxides which can have an ionic conductivity
up to five times higher than YSZ [1]. It is an excellent oxygen ion conductor but at high
temperatures, the material departs from its stoichiometric state in a reducing atmosphere [2]. The
most current electrolyte research is focusing on finding materials that have lower operating
temperature. The reduction in temperature without lowering the ion conductivity will reduce the
Figure 2-3 – A molecular view of pure ZrO2 (right) and YSZ (left). The YSZ has oxygen vacancies, where
one vacancy is created for every two yttria doped atoms. Drawing taken from O’Hayre [8].
23
material and fabrication complexity and improve the cell reliability. The most notable material
being examined today is LaSrGaMgO (LSGM) [9].
2.2.2 Anode
Unlike the solid electrolyte, the anode must be a porous material to allow the
transportation of the fuel to and the transportation of the products of fuel oxidation away from the
electrolyte/cathode interface. The structure must also be stable at high operating temperatures
[6,7]. Since the fuel arriving at the anode is generally reduced, metals can be used as the anode
material. These metals must not oxidize under the operating conditions, limiting the choice of
metals to use to nickel, cobalt, and other noble metals [2,7]. In general nickel is mainly used due
to its low cost compared to the aforementioned metals. Yet the anode cannot be made completely
out of nickel due to its high thermal expansion coefficient. In order to get around this problem,
the anode is made from metallic nickel with a YSZ skeleton. This provides a thermal expansion
coefficient comparable to the electrolyte and inhibits sintering of the metal particles [9].
The anode‟s purpose is to allow the hydrogen molecules to reach the electrolyte where
they will be oxidized and react with the oxygen ion to form water, simultaneously releasing an
electron. Thus it must be a porous, electronically-conducting material. Since the anode face is
subjected to the reducing condition of the fuel, common metals can be used for the fabrication
[3]. However, because the fuel‟s composition changes during the SOFC‟s operation, the metals
used must be non-oxidized. The most common of these metals used is nickel due to its low cost
and high catalytic activity [4]. Instead of pure nickel, a Ni/YSZ mixture is used to meet all of the
necessary requirements for operation. The YSZ support maintains the porous structure, supports
the nickel metal particles, and provides a thermal expansion coefficient close to the other cell
components. The electrical conductivity of the nickel/YSZ cermet (ceramic-metal mixture, or a
24
mixed ionic and electronic conductor [1]) is dependent on the nickel content and its
microstructure. The anode cermet is commonly made from YSZ and NiO powders and the NiO
is reduced in situ to nickel metal when exposed to the fuel [2]. Due to the loss of oxygen
molecules, the reduced anode is more porous due to the conversion of NiO to nickel metal. This
reduction takes little time and the maximum conductivity is quickly reached, then falls off slowly
before reaching a steady state. During long term operation, sintering of the nickel particles is a
concern which will result in a loss of conductivity. The threshold for electrical conductivity is
about 30 volume % nickel; below this, the mixture will act like the YSZ electrolyte and above, it
will have too large of a thermal expansion coefficient mismatch for the high temperature
operation [7].
Other materials that are being considered for the anode include cobalt and ruthenium [6].
Cobalt , like nickel, can be placed in the fuel environment without being oxidized. It also has a
high sulfur tolerance but is not commonly used due to its high cost [2]. Ruthenium has recently
been tested and showed a better resistance to sintering and a higher reforming activity than nickel
but is also not used because of its cost [7].
Most recently the attention of some developers has been focused on investigating bi-layer
anodes in an attempt to reduce some ohmic polarization loss at the interface between the anode
and electrolyte [9]. There would be a mixed conductivity for both electrons and oxygen ions
which would allow the extension of the three-phase boundary region between the reactant, anode,
and electrolyte (Fig. 2-4).
25
2.2.3 Cathode
Similar to the anode, the cathode must be an electronically conducting material with a
porous structure and must also be stable in an oxidizing environment, all at the high operating
temperature. Due to the previous criterion, the choice of materials are limited to noble metals or
oxides that have high electrical conductivity, and because of the cost of the noble metals, oxides
are exclusively used. While many doped oxides have been studied, strontium-doped lanthanum
manganite, La1-xSrxMnO3 (LSM) is the most commonly used [7]. It is common for the cathode to
consist of two different layers. The first being a mixture of LSM and YSZ which gives the
cathode a thermal expansion coefficient close to the electrolyte (YSZ). The second layer,
Figure 2-4 – Two drawings of the three-phase boundary regions (TPB) made of different anode
materials. A) The typical electronically conducting cermet, and B) a mixed electronic/ionic conductor.
The mixed conductor allows for a larger area of where the electron exchange can occur. Drawing taken
from Larminie [9].
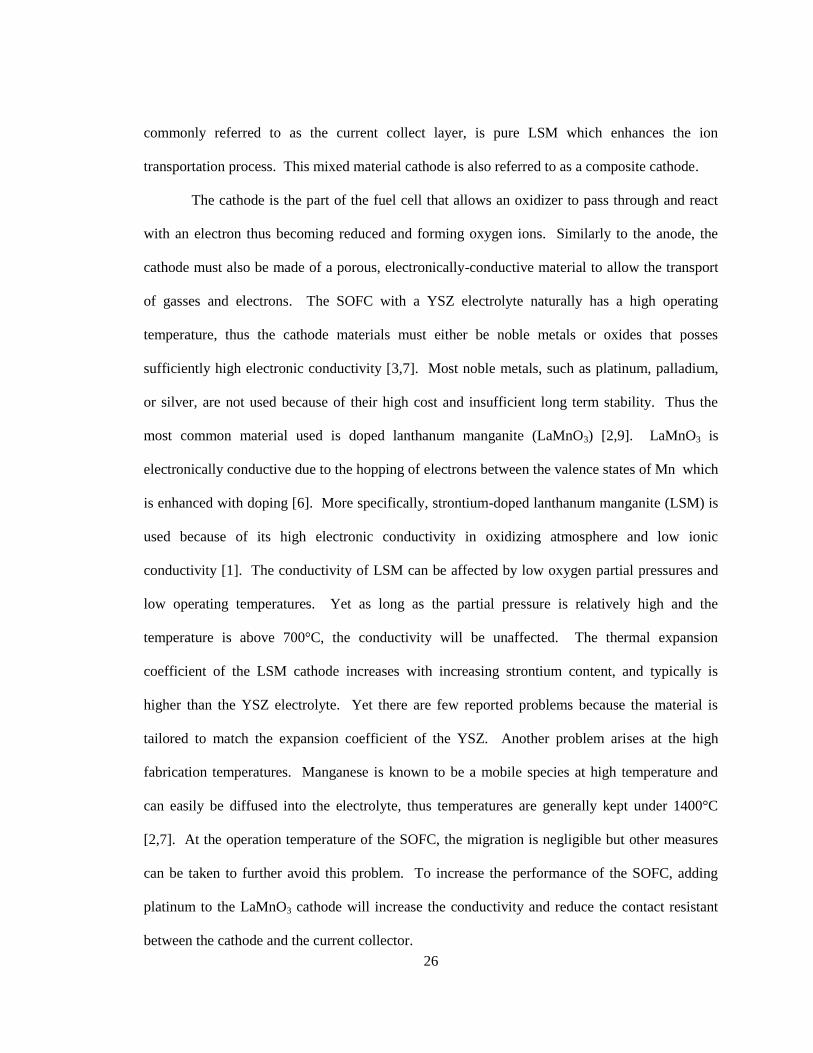
26
commonly referred to as the current collect layer, is pure LSM which enhances the ion
transportation process. This mixed material cathode is also referred to as a composite cathode.
The cathode is the part of the fuel cell that allows an oxidizer to pass through and react
with an electron thus becoming reduced and forming oxygen ions. Similarly to the anode, the
cathode must also be made of a porous, electronically-conductive material to allow the transport
of gasses and electrons. The SOFC with a YSZ electrolyte naturally has a high operating
temperature, thus the cathode materials must either be noble metals or oxides that posses
sufficiently high electronic conductivity [3,7]. Most noble metals, such as platinum, palladium,
or silver, are not used because of their high cost and insufficient long term stability. Thus the
most common material used is doped lanthanum manganite (LaMnO3) [2,9]. LaMnO3 is
electronically conductive due to the hopping of electrons between the valence states of Mn which
is enhanced with doping [6]. More specifically, strontium-doped lanthanum manganite (LSM) is
used because of its high electronic conductivity in oxidizing atmosphere and low ionic
conductivity [1]. The conductivity of LSM can be affected by low oxygen partial pressures and
low operating temperatures. Yet as long as the partial pressure is relatively high and the
temperature is above 700°C, the conductivity will be unaffected. The thermal expansion
coefficient of the LSM cathode increases with increasing strontium content, and typically is
higher than the YSZ electrolyte. Yet there are few reported problems because the material is
tailored to match the expansion coefficient of the YSZ. Another problem arises at the high
fabrication temperatures. Manganese is known to be a mobile species at high temperature and
can easily be diffused into the electrolyte, thus temperatures are generally kept under 1400°C
[2,7]. At the operation temperature of the SOFC, the migration is negligible but other measures
can be taken to further avoid this problem. To increase the performance of the SOFC, adding
platinum to the LaMnO3 cathode will increase the conductivity and reduce the contact resistant
between the cathode and the current collector.
27
Other materials can be used for the cathode and include doped lanthanum cobaltite
(LaCoO3) which belongs to the same class of oxide compounds as LaMnO3 [2,9]. LaCoO3 has its
differences in that it is less susceptible to reduction, it has a higher thermal expansion coefficient,
and it will react more readily with YSZ at high temperatures. In the early stages of SOFC
development, tin-doped indium oxide (In2O3) was used for the cathode. It showed great electrical
conductivity under the operating conditions but it is also the most costly and least
thermodynamically stable, thus it is no longer used. There can be a significant reduction in cost
of the cathode material if less expensive, lower purity raw materials are used instead of the pure
lanthanum compounds [6].
2.2.4 Interconnects
While not physically part of the SOFC, the current collecting meshes serve a very
important purpose in the generation of power. Mainly the meshes serve three purposes: 1) to
provide electrical contact between adjacent cells, 2) to distribute air/fuel to the cathode/anode,
and 3) to connect several SOFCs together (thus they are also referred to as the interconnects)
[7,9]. The meshes must adhere to the strictest restrictions out of all of the SOFC components and
are as follows: the material must be nearly 100% conductive, is stable in both oxidizing and
reducing atmospheres at high temperatures, has a thermal expansion similar to the anode and
cathode and can not react with either, and must be impermeable for particular applications where
it is the only thing separating the fuel and oxidizer from the cathode and anode respectively.
Currently metals are the best option for meshes and tend to be Inconel type stainless steels for the
cathode and other metals such as nickel for the anode. Other types of meshes made out of
lanthanum chromite, LaCrO3, have been developed but are not as commonly used due to high
costs.
28
Doped lanthanum chromite is most commonly used as the interconnection material [6,9].
Metals can also be used as the interconnect but they tend to be expensive „inconel‟ type stainless
steels or precious metals. Other metals that contain chromium can poison the cathode and thus
are not used. Also, due to the oxygen rich environment, the metal interconnects can form an
oxide coating which would limit the electrical conductivity and act as a barrier for mass transport.
The requirements for the interconnect are the most severe of all the cell components and
are summarized as follows [6]:
Nearly 100% electronic conductivity
Stable in both oxidizing and reducing atmospheres at the cell‟s operating temperature
Low permeability for oxygen and hydrogen to minimize the combination of fuel and
oxidizer
A thermal expansion coefficient close to that of the electrodes and electrolyte
Non reactive with the electrodes, electrolyte, and electric contact material
2.2.5 Sealing Materials
A critical issue with a SOFC is being able to create a gas tight seal that will properly
separate the fuel and oxidizer from the cathode and anode respectively. This is very important
because a SOFC will not function properly if the fuel and oxidizer are not properly separated.
There is an exception to this which is discussed later where both the anode and cathode are both
subjected to a fuel/oxidizer mixture in what is known as a single chamber setup. Due to the high
operating temperature of the SOFC, proper sealing can be a difficult obstacle to overcome. The
common approach has been to use glasses that have transition temperatures close to the operating
temperature of the SOFC [9]. As the temperature rises, the glass softens and forms a nice seal
around the fuel cell‟s edges. Similarly, soft metals such as gold can be used to accomplish the
same effect or other types of ceramic pastes that have thermal expansion coefficients similar to
29
the SOFC can be used. The problem with this technique is the possibility that silica from the
glass could migrate to the electrode, especially the anode, thus causing degradation in cell
performance [9].
There is also the possibility of using compressions seals in which the SOFC is
sandwiched between some tubing. In this case, an alumina felt o-ring can be placed around the
edge of the SOFC. The felt‟s sealing ability is enhanced by adding an alumina slurry to the felt
before applying it to the fuel cell. The SOFC, along with the alumina felt, will be sandwiched
between the tubing for the fuel and oxidizer, creating a gas tight seal.
2.3 Cell Configurations
SOFCs are able to be fabricated into several different shapes and configurations. The
most popular and widely used configurations are the planar or flat-plate and tubular designs.
Each shape results in distinct current paths and requires or incorporates different cell
configurations [5]. The single fuel cell can be classified into two larger categories: the self-
supporting and external-supporting. Each is described below in more detail.
30
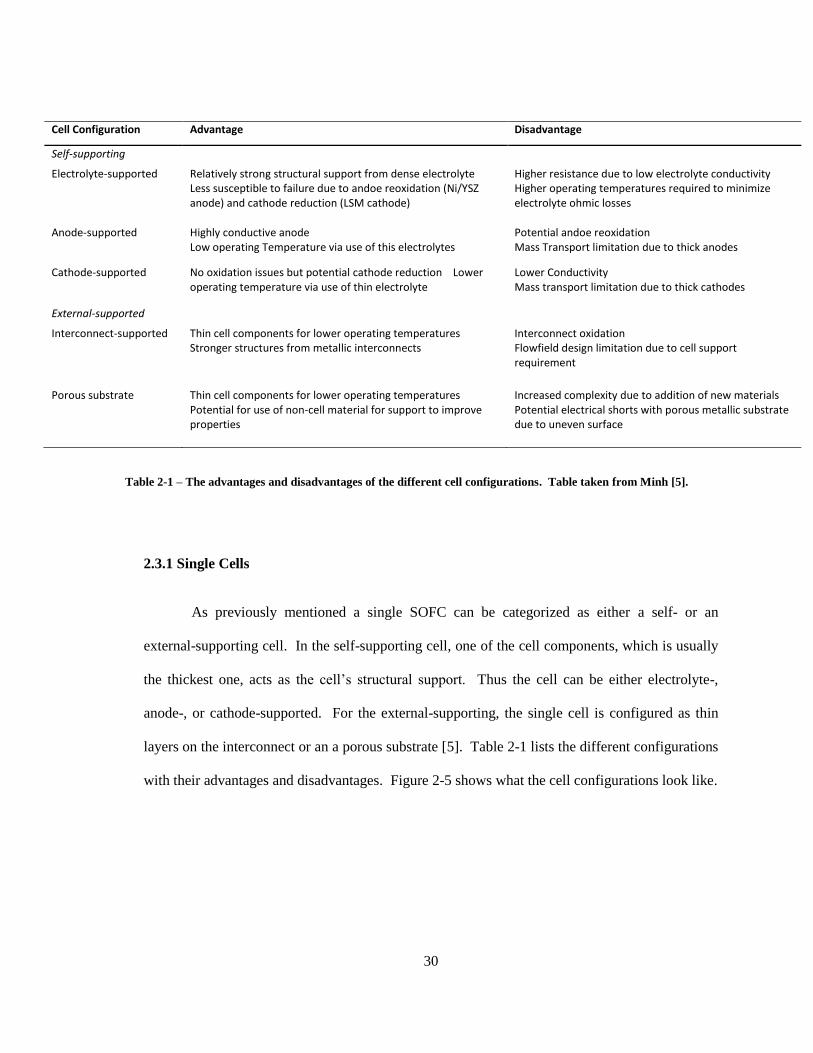
2.3.1 Single Cells
As previously mentioned a single SOFC can be categorized as either a self- or an
external-supporting cell. In the self-supporting cell, one of the cell components, which is usually
the thickest one, acts as the cell‟s structural support. Thus the cell can be either electrolyte-,
anode-, or cathode-supported. For the external-supporting, the single cell is configured as thin
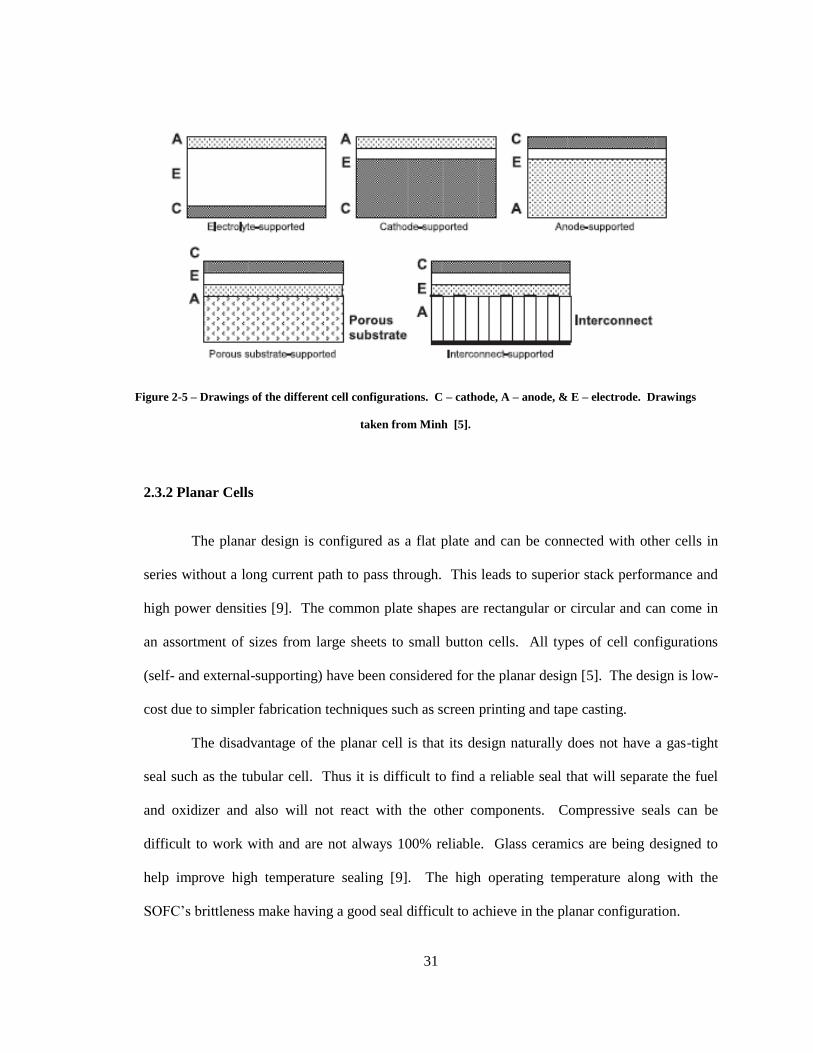
layers on the interconnect or an a porous substrate [5]. Table 2-1 lists the different configurations
with their advantages and disadvantages. Figure 2-5 shows what the cell configurations look like.
Cell Configuration Advantage Disadvantage
Self-supporting
Electrolyte-supported Relatively strong structural support from dense electrolyte Less susceptible to failure due to andoe reoxidation (Ni/YSZ anode) and cathode reduction (LSM cathode)
Higher resistance due to low electrolyte conductivity Higher operating temperatures required to minimize electrolyte ohmic losses
Anode-supported Highly conductive anode Low operating Temperature via use of this electrolytes
Potential andoe reoxidation Mass Transport limitation due to thick anodes
Cathode-supported No oxidation issues but potential cathode reduction Lower operating temperature via use of thin electrolyte
Lower Conductivity Mass transport limitation due to thick cathodes
External-supported
Interconnect-supported Thin cell components for lower operating temperatures Stronger structures from metallic interconnects
Interconnect oxidation Flowfield design limitation due to cell support requirement
Porous substrate Thin cell components for lower operating temperatures Potential for use of non-cell material for support to improve properties
Increased complexity due to addition of new materials Potential electrical shorts with porous metallic substrate due to uneven surface
Table 2-1 – The advantages and disadvantages of the different cell configurations. Table taken from Minh [5].
31
Figure 2-5 – Drawings of the different cell configurations. C – cathode, A – anode, & E – electrode. Drawings
taken from Minh [5].
2.3.2 Planar Cells
The planar design is configured as a flat plate and can be connected with other cells in
series without a long current path to pass through. This leads to superior stack performance and
high power densities [9]. The common plate shapes are rectangular or circular and can come in
an assortment of sizes from large sheets to small button cells. All types of cell configurations
(self- and external-supporting) have been considered for the planar design [5]. The design is low-
cost due to simpler fabrication techniques such as screen printing and tape casting.
The disadvantage of the planar cell is that its design naturally does not have a gas-tight
seal such as the tubular cell. Thus it is difficult to find a reliable seal that will separate the fuel
and oxidizer and also will not react with the other components. Compressive seals can be
difficult to work with and are not always 100% reliable. Glass ceramics are being designed to
help improve high temperature sealing [9]. The high operating temperature along with the
SOFC‟s brittleness make having a good seal difficult to achieve in the planar configuration.
32
2.3.3 Tubular Cells
The tubular SOFC was pioneered by the US Westinghouse Electric Corporation (now
Siemens Westinghouse Power corporation) in the late 1970s [9]. The original design had the
anode deposited on a porous zirconia support tube. This was later reversed and the cathode was
the first layer to be deposited and had the anode on the outside. The tubular design is configured
as a tube and can have several variations such as closed at one end or open at both ends. The
most common cell configuration is made of a cathode material (cathode-supported) and the
electrolyte and anode layers are applied on top of the cathode layer [5]. The main advantage is
there are no seals needed since the gasses can be separated to the outer and inner section of the
tube. The problem with this design is the low power density resulting from the long paths that the
electrical power needs to travel through. Also, the expensive fabrication techniques such as
electrochemical vapor deposition (EVD) are other disadvantages of the tubular design [9].
2.4 Fuels
Since the flame species are generally the same for all hydrocarbons, you will always have
hydrogen radicals in the products or the exhaust of the flame [10]. It has been shown that a
voltage output can be produced from gases, liquids, and solid fuels alike. Although some fuels
have better power output then others, all three types of fuels are able to become a source of
electricity for the SOFC.
A fuel cell is not an energy producer but an energy converter [1]. Thus in order for the
generation of electrical power, a fuel must be supplied to the fuel cell. The SOFC is the most fuel
flexible fuel cell and can run on a variety of fuels. Almost anything can be used for a fuel as long
as it contains or produces some hydrogen or carbon monoxide. Due to the high operating
33
temperature of the SOFC, it is possible to operate the cell directly on hydrocarbon fuel without
the need for a separate complex external fuel processor to reform the hydrocarbon fuel into
hydrogen and carbon dioxide. Thus internal reforming is possible where the fuel can be
catalytically converted within the SOFC [7]. Using hydrocarbons is particularly advantageous
over pure hydrogen because they are easier to store, are more efficient at producing energy, and
are readily available [3,7]. The fuels are not limited to gasses and can come in all types of forms
such as liquids, and even solids.
2.4.1 Gaseous Fuels
Currently the most common fuel source for SOFCs are gases. Hydrocarbons are the most
commonly used gases because of their high generation of hydrogen in the exhaust gases. Natural
gases are generally preferred over other hydrocarbons because they are widely available and pose
less of a challenge then heavier hydrocarbons [11]. Other gases that have been examined are
methane, propane, and butane.
After hydrogen, methane is the most widely used fuels for SOFCs. When using methane,
there is a possibility that carbon coking can occur which will lower the cell‟s overall
performance. This can be avoided by adding steam to the fuel feed so there is a H2O:CH4 ratio
that is greater than three. Coking can also be avoided when anodes that do not contain Nickel are
used. This is because CH4 is not electrocatalytically oxidized for these anodes and the methane
reacts with the nickel to form carbon and hydrogen. Hydrogen will always outperform methane
due to a catalytic limitation, with CH4 being more difficult to activate [12]. The performance gap
between H2 and CH4 is smaller at higher temperatures. Methane‟s lower power densities
compared to hydrogen may be related to the higher mass of methane molecules, which yields
slower gas-phase diffusion and increased concentration polarization. Yet less methane gas
34
diffusion is needed to yield the same cell current because it reacts with four times as many
oxygen molecules as hydrogen [13].
Lin et al. conducted tests using methane and observed that the resistance was higher for
methane than for hydrogen, suggesting that the electrochemical oxidation step was slower for
methane. They also showed that oxygen ion current was partially responsible for preventing
coking as follows [11]:
At low current densities there is a low O2-CH4 ratio, thus the reaction products
are primarily solid carbon and hydrogen.
Eq. 2-15
As the ratio increases to half, the main change is that the solid carbon is replaced
by CO
Eq. 2-16
When the ratio is above 0.5 the there will be no coking at all due to CO and H2
being replaced by CO2 and H2O
Eq. 2-17
The carbon may block the anode pores, degrading cell performance, or the coke buildup
may lead to volume expansion and consequent micro-cracking, presumably leading to an
interruption of anode current collection pathways.
Many individuals and groups have focused on testing SOFCs with different gasses. For
example, Bessler used methane as well as propane and butane and Hibino et al. used methane,
ethane, propane as their fuels [1,14]. Other research used the fuel to produce a flame that delivers
a reformed form of the fuel to the anode. This is called the direct flame setup and is discussed in
35
a later section. Some of the researchers that used this method are Vogler et al. who used methane
as the fuel for their flame [15]. Kronemayer et al. used methane propane and butane as the fuel
for their flame [16].
Unlike other fuel cells where carbon monoxide is harmful, the SOFC can use carbon
monoxide as a fuel. Thus other types of hydrocarbon-based fuels or syngasses (e.g., natural gas,
biomass, and coal) can be used as the fuel without the concern of CO poisoning [17]. Biomass
and coal will contain some amount of H2S which will need to be removed. The other components
of the mixture are H2, CO, CO2, H2O, and N2. Suxanwarangkul et al. [17] made their own syngas
by mixing H2, CO, CO2, and N2 and humidified the gas before it reached the anode. They studied
the influence of N2 and CO2 dilution as well as fuel composition ratio and found the following:
The cell potential was greater at 900 than 800°C because the open-circuit is
higher and the overpotentials are lower at the higher temps
There is a small enhancement in cell performance at higher flow rates
The cell potential improves as H2 concentrations increase although open current
voltages (OCV) are similar
The cell potential is worse when the fuel is diluted with CO2
In the syngas tests, the more H2 present the higher the performance
Decoloration of the anode surface indicates Ni depletion
The main problem with using hydrocarbons for the fuel is the formation of carbon coking
when using Ni as the catalyst for the anode. Although there is a small range of temperatures at
which coking will not occur, it only happens when using methane and not for larger
hydrocarbons. Park et al. [18] have tested a Cu-ceria anode that was supplied with hydrogen or
n-butane with hydrogen yielding the highest open current voltage (OCV). The butane fuel was
36
tested for 48 hours with no change in the cell performance. Afterwards they looked at the interior
of the setup and found that the anode was clean but the tube wall was covered in tar. When
testing with toluene, carbon coking was observed, but after switching back to butane of an hour,
the cell performance returned to the original value [18]. Thus they determined that the anode is
self-cleaning.
2.4.2 Liquid Fuels
While not as common, liquid fuels have shown to be a potential fuel source for SOFC.
Liquid fuels are expected to vaporize before reaching or being brought to the anode of the fuel
cell by means of flowing nitrogen in the fuel feed, thus are in a gaseous phase [19]. Mainly liquid
hydrocarbons are used, but recently some researchers have been looking towards nonconventional
sources to fuel the SOFC. Some liquid fuels that have been tested are ethanol, butanol, and
kerosene [20]. Experimental results have shown that there is a significant increase in the power
density with the increase in molecular weight. Yet with these larger molecules, particularly ones
larger than ethanol, soot formation was observed, which can hinder the performance of the SOFC.
Kerosene is an example of this problem but with a small airflow over the wick, the soot formation
was diminished and the power density was enhanced.
Kim et al. [21] studied a SOFC operating on liquid hydrocarbons, including synthetic
diesel fuel. They noticed that toluene has a low OCV due to surface-reaction limitations. This is
due to the number of complex surface reactions at the anode surface thus limiting the amount of
hydrogen being oxidized. At low concentrations, the current is limited by diffusion of toluene
through the anode. At high concentrations, the current is likely controlled by oxidation kinetics at
the triple phase boundary region and ion conductivity. For toluene, n-decane, and synthetic diesel
fuel, the power density was stable for four hours of operation. When the fuels were not diluted
37
with nitrogen, tar was formed and the performance decreased. Yet the tar was removed by
passing dry nitrogen over the anode. Thus the reversible deactivation was due to gas-phase, free-
radical reactions that occur on the anode surface and clog pores. Another group, Hibino et al.,
used ethanol and liquefied petroleum gas (LPG) for their fuels [14].
Zhou et al. have used less processed jet fuel and Pennsylvania crude oil as fuels for the
SOFC [22]. The crude oil has important characteristics that make it more amendable to use in a
SOFC [19]. It has a very low asphaltic content and is dominated by n-alkanes with some
cycloalkanes. The crude oil will also not contribute to carbon coking like other aromatic or
asphaltic oils and has a low sulfur and nitrogen content. Both the jet fuel and crude oil have
lower OCVs then when hydrogen was used but have similar results to toluene and slightly lower
than other hydrocarbon fuels. Each fuel‟s OCV was also determined by the fuel concentration.
The higher the concentration the higher the current density [19]. Problems with these fuels are
their substantial amount of sulfur. This is one of the reasons believed to cause the performance
decline. The other likely cause is coke formation inside the anode.
Zhou et al. showed that vegetable oils can be used as a fuel. The application of vegetable
oil as a waste by-product, does not require any post processing other than simply filtering the oil
through paper to remove particulate matter. After that, the oil can be directly used. The
advantage of vegetable oil is that it is free of most of the contaminants found in fossil energy
sources such as petroleum, shale oil or coal driven liquids [22]. The oil was taken from a local
fast-food restaurant without any processing steps. Although the OCVs were lower than when
hydrogen is used, it was similar to the OCV of the reported jet fuel and toluene, and slightly
lower than other hydrocarbon gases. Vegetable oil is comprised of large molecules, thus a
number of partial reactions are possible [22]. Due to the lack of knowledge of the chemical
reaction of the vegetable oil, it is difficult to determine the efficiency of the fuel cell.
38
Similar to the gasses, the liquids can be combusted to form a flame that can fuel the
SOFC. Horiuchi et al. used ethanol, butanol, and kerosene for their fuels in the flame. The fuels
that had larger molecules were observed to form soot. Wang et al. [23] used an ethanol lamp to
provide the flame for the fuel cell. Ethanol is an ideal fuel because it is a nontoxic, renewable
and easily obtainable resource with high energy density.
2.4.3 Solid Fuels
Any combustible can be a source of fuel for a SOFC, thus, while not very common, a
solid can be used. Horiuchi et al. used a candle (paraffin wax) and wood pieces for their fuels.
The solid fuel must be directly burned since it cannot be easily vaporized. They were able to
observe a power output from the fuel cell although it was much lower compared to both the liquid
and gasses used. The solid fuels proved to be difficult to work with because it was hard to control
the flame (from flickering and jumping around). When a small stream of air was added to the
flame, the power density was increased which is due to the increase in efficiency of combustion
[20].
2.5 Different Experimental Setups
The solid oxide fuel cell has been successfully used in several different configurations.
For instance there is the single chamber solid oxide fuel cells (SCFC) [11], the dual chamber
(DCFC), and the direct flame “no-chamber” (DFFC) [10,14,20] (Fig. 2-6). All three cases have
their own benefits and are generally used for different applications.
39
2.5.1 Single Chamber SOFC
In the single chamber setup, the SOFC is placed in a tube so that both the anode and
cathode are exposed to the same gas which is a fuel-air mixture, thus making it sealant free [23].
Because there is no need to separate the supply of fuel and air, it is more thermally and
mechanically shock resistant than conventional fuel cells [14]. The ideal anode should catalyze
the partial oxidation of the hydrocarbon fuel to H2 and CO as well as catalyze the electro
oxidation of these gasses. The ideal cathode should be entirely inert toward the hydrocarbon fuel
yet catalyze the electro-reduction of the oxygen gas [24].
The main disadvantage of the single chamber setup is that it must have a low fuel
concentration in order for oxidation to occur safely without an explosion. To avoid an explosion
of the mixed fuel-air gas, a fuel concentration in the setup should be rigidly kept higher than its
Figure 2-6 – Diagrams of different SOFC experimental setups. A) The single chamber, B) the dual
chamber, and C) the direct flame setup. The experiments preformed in this thesis used a combination of
the dual chamber and direct flame setups which has been called the direct flame dual chamber setup.
40
upper explosion limit. At this range, the oxygen is deficient for complete fuel oxidation, and thus
is safe for operation [20].
2.5.2 Dual Chamber SOFC
The dual chamber SOFC (DCFC) setup, has the fuel and oxidizer separated so that each
one only passes over the anode and cathode, respectively. This greatly reduces the risk of
combustion because the fuel and oxidizer are never in contact with each other. The dual chamber
setup is normally comprised of a single cell (button cell) that is sealed to the end of a quartz or
alumina (ceramic) tube with a glass or silver seal [11,17]. The tube has an inlet where the fuel is
delivered to the anode, and an outlet where the products and extra fuel exit. The cathode is left
open to the ambient air or can have the same setup as the anode where there is a tube that delivers
the oxidizer to the anode. This is the most common setup for large scale applications because it
has the minimum requirement for the catalytic selectivity of electrodes [23]. Both the DCFC and
the SCFC need to be placed in a heater in order for the SOFC to reach its operating temperature.
2.5.3 Direct Flame SOFC
The direct flame SOFC setup (DFFC) is based on the combination of a combustion flame
with a solid oxide fuel cell in a simple “no-chamber” setup [10,15]. The fuel rich flame is placed
only a few millimeters away from the anode surface and acts as a partial oxidation fuel processing
unit while providing the heat required for SOFC operation [23]. The cathode is exposed to the
ambient air. The direct flame setup does not require an external heater and coking associated
with higher hydrocarbons are significantly reduced [1]. The use of a free flame to operate an
SOFC was first published by Horiuchi et al. This setup relaxes the selectivity for the catalysts
41
that is required with the single chamber setup and thus can operate at higher temperatures. Also
the direct flame setup is able to have higher fuel concentrations at the anode and oxygen at the
cathode [15].
Advantages: Very fuel flexible (can use virtually any carbon-based fuel or
anything that contains hydrogen). Simple no chamber setup; the system is
thermally self sustained and there are no sealing issues. Rapid startup time
because the flame heats up the system.[10,16,20]
Disadvantages: Low overall efficiency. Since part of the fuel‟s chemical energy
is consumed in the flame, it is no longer available for electrical power. Material
stresses due to the flame are a major challenge. [10,16]
2.5.3.1 The Flame
Different types of flames can be constructed from different types of burners. The two
main types being Bunsen burners and flat flame burners (Fig. 2-7). Flat-flame burners are well
suited for planar cells because they have a uniform radial profile. This means that the entire
anode surface will be subjected to the same conditions. The Bunsen burner on the other hand, has
a non-uniform axial velocity distribution, thus resulting in a cone shape. It is believed that the
best flame is a premixed laminar flat flame because it is the most stable and has a convenient
shape [20]. The burners are operated with a premixed fuel/air combination at various equivalence
ratios φ, which can be calculated using the following equation:
Eq. 2-18
42
The flame must be fuel rich, thus the equivalence ratio must be greater than φ>1.0. When
the flame is fuel rich, the flame exhaust will contain excess fuel (hydrogen and carbon monoxide)
which will fuel the SOFC. If the flame is fuel lean, then the flame exhaust will only contain
oxygen as all the fuel is used up in the combustion process. Thus there will be no fuel and the
SOFC will not output any power.
When Wang et al. used an ethanol lamp to produce a flame for the SOFC they noticed
that the diffusion flame can be characterized by a three-layer structure. These layers include the
outer, inner, and central flame (Fig. 2-8). This differs from a premixed flame because it is an
inter-diffusion flame of ethanol and oxygen. Thus there is a gradient of oxygen and fuel
concentrations with an increasing oxygen-to-fuel ratio increasing from the center to the outside.
The temperature also increases from the center to the outer flame [23]. Therefore the SOFC
power output depended on which section of the flame layer was exposed to the anode surface.
The same can be said for the solid fuels that Horiuchi et al. used.
Figure 2-7 – Drawings of two possible flame types to be used with a direct flame solid oxide fuel cell (DFFC). On
the left is the flat flame burner and on the right is the cone shaped Bunsen burner. Taken from Bessler [M]
43
2.5.4 Dual Chamber-Direct Flame SOFC
The dual chamber direct flame solid oxide fuel cell is a hybrid of the dual chamber and
DFFC setups. Thus you have an anode that is subjected to the exhaust of a fuel rich flame in one
chamber, and the other chamber an oxidizer is forced over the cathode. Both the fuel and
oxidizer are always separated and the flame is used to heat the system and provide the fuel to the
anode. Because each chamber is separated by the SOFC and leakage of gasses is not desired, the
need for a good sealing material arises. The dual chamber DFFC (or simply DFFC) was used in
this experiment and from here out will be referred to when discussing the setup.
Figure 2-8 – Schematic of the shape of the flame from an ethanol lamp. On the left there is no fuel cell and on the
right the fuel cell is placed over the flame at different positions. Drawing taken from Wang [23]
44
Chapter 3
Experiments
In order to validate the effectiveness of the SOFC, tests were conducted in a small
counterflow burner configuration with the SOFC stagnation surfaces separating fuel rich products
produced from a premixed flame and from an opposing oxidizer. A special dual chamber direct
flame setup was fabricated to house the SOFC and allow for the necessary experiments to be
conducted. Once a baseline was determined for the direct flame fuel cell that was exposed to
ambient air, other oxidizers were forced over and performance measurements were taken (voltage
output vs load) for various oxidizers. The experimental setup, as well as the different
experiments that were conducted, are described in more detail in the following sections.
3.1 Experimental Setup
The SOFCs used for these experiments were purchased from FuelCellMaterials.com.
They are composed of a 150μm thick Hionic zirconia-based electrolyte, a Ni-YSZ anode and a
LSM cathode which are both 50μm thick. The electrodes have a 12.5mm diameter and the entire
button cell is 20mm in diameter. The Hionic zirconia-based electrolyte is a patent pending
product from Fuel Cell Materials and is as strong as if
not stronger than yittria- and scandium-based
electrolytes (Appendix A) [25]. For the current
collecting meshes, either Inconel 601 (which is a
nickel based alloy) or a silver mesh was used for the
cathode. The mesh covers the entire cathode face and
was applied by silver ink and then fired in a furnace
Figure 3-1 – A picture of the SOFC button cell
used for the experiments. The green face (left) is
the anode and the black face (right) is the cathode.
45
at 100°C for one hour to allow for the ink to dry. A nickel metal mesh was applied to the anode
using the same silver ink and acts as the current collector. In order to enhance the current
collection performance for the cathode and anode, a paste, which was the same material as the
cathode and anode (LSM and nickel respectively) was applied to both sides. These pastes acted
as enhancers and increased the surface contact between the current collecting meshes and the
SOFC faces. The LSM paste was applied first and fired in the furnace at 860 or 900°C for one
hour if silver or inconel was used as the mesh respectively. The normal firing temperature for the
LSM paste is 900°C, but because of the low melting temperature of the silver mesh, the firing
temperature needed to be lowered to 860°C. The nickel paste was applied to the anode and the
nickel mesh was then dried in situ during operation. The entire process with the furnace program
temperatures and durations can be found in Appendix C. Both meshes had leads coming off them
to be able to collect the output from the SOFC. The leads were then connected to a zero-voltage
load box (ZVL60-10-20L from AMREL Systems Inc) which will be discussed in more detail
below.
3.1.1 Test Chamber
Similar to other groups that performed tests on SOFCs [1,10,15,23], a direct flame test
setup was constructed for a single button cell. This setup was different from ones used by other
groups because it combined certain aspects from both the dual chamber and the direct flame
experiment. Like other direct flame setups, the SOFC was positioned directly above a Bunsen
burner type flame which acted as a fuel reformer while heating up the system to its operating
temperature. Also similar to the dual chamber setup, the fuel and oxidizer were separated and
delivered to the anode and cathode faces respectively through a set of tubes on either side of the
SOFC. The test stand for these experiments combines the two. The flame was positioned in the
46
tube that delivers the fuel while on the opposite side of the SOFC, a tube delivered the oxidizer to
the cathode.
Figure 3-2 shows the actual experimental test stand with an enlarged view of the area
where the SOFC sits and the tubes that deliver the gasses for the flame and the oxidizer. The
information on the dimensions and configuration can be found in Appendix B. The lower half of
the test stand consisted of several tubes within each other that allowed for a diffusion flame to be
established below the anode. The innermost tubing is ceramic with nichrome wire inside. The
nichrome wire was used to provide a spark to ignite the fuel/oxidizer combination while the
ceramic tube provided electrical insulation, allowing a spark to only be produced at the exit of the
fuel/oxidizer tubes. The ceramic tubing was within the fuel tube and around that was the oxidizer
Figure 3-2 – A picture of the direct flame dual chamber SOFC experimental setup. On the left is an actual
photo of the setup and on the right is a zoomed in diagram. The diagram shows where the SOFC sits in the test
stand in relation to the other components.
47
tube. Both the fuel and oxidizer tubes carried their corresponding gases to the SOFC face where
they were ignited by nichrome wire to produce a diffusion flame. The flame served dual
purposes: it heated up the fuel cell to its operating temperature and also reformed the fuel to
supply hydrogen radicals and unburned hydrogen molecules to the anode. The fuel rich flame,
with equivalence ratios ranging between φ = 1.25-2.0, was maintained because SOFCs cannot
efficiently produce a useable voltage output at equivalence ratios lower than stochiometric
conditions as discussed previously. The location of the flame with respect to the anode was set so
that the temperature at the anode face is always the same as the equivalence ratio was varied. A
K-type thermocouple was positioned at the center of the anode face and was used to ensure the
proper operating temperature. The outer most tubing allows for the burned gases from the
combustion process to be exhausted.
The cathode side of the setup consisted of a carrier tube and an exhaust tube. The inner
tube was what carried the oxidizing gases at room temperature and allowed it to impinge the
cathode face. The outer tube allowed all unused gas to leave the system and be exhausted. It was
believed that the oxidizer was drawing heat away from the system, reducing the performance of
the SOFC. Thus tests were also preformed with a preheated oxidizer to see how much of an
influence the oxidizer temperature had on the performance of the SOFC. These experiments as
well as the furnace are described below.
When putting the SOCF into the setup, it was first sandwiched between alumina felt
washers and two aluminum holding plates. The alumina felt washers act as a compressive sealer
to keep the fuel and oxidizing gases separated. Before the alumina felt was placed on the SOFC,
an alumina slurry is applied to the washers. This slurry enhanced the seal between the fuel cell
and the aluminum holder and made sure there was no leakage of gases in to opposite sides of the
SOFC test chambers. The SOFC and felt washers were then sandwiched between the two
aluminum holding plates which were screwed together to form an air tight seal. Finally the
48
aluminum mounts were screwed into the test stand. The entire process is explained in more detail
in Appendix C.
All the gases were supplied to the test stand through Teledyne/Hasting mass flow
controllers. All the flow controllers were HFC 202 series and spanned a range of flow rates from
500 to 3000 standard cubic centimeters per minute (SCCM). The flow rates were set through the
mass flow controller (Model 400, Teledyne/Hasting). The fuel and oxidizer for the flame were
ignited with a high voltage ceramic capacitor charger (Amazing1.com). The igniter was triggered
immediately after the fuel and oxidizer began to flow and created a spark where the two gasses
mixed. All temperature readings were measured with a K-type thermocouple (Omega.com).
3.1.2 Amrel Load Box
A SOFC‟s performance was based on its voltage, power density, and current density. To
determine these values, a known resistance needed to be applied to the SOFC. This resistance (or
load) acted as a current sink, and from a range of applied loads, the corresponding current,
voltage, and power was measured and calculated. With these values, a polarization curve could
be made to better analyze the SOFC being used. Setting a proper range of resistances for a single
Figure 3-3 – Pictures of the flow controllers (left), flow meter (center), and igniter box (right).
49
SOFC button cell can be difficult due to the nature of the low outputs from the cell. Thus a zero
volt electronic load box (AMEREL ZVL Series of Zero-volt DC Electronic eLoads), which is
specifically designed for single cell testing was used (see Appendix D for more load box details).
The load box was able to be controlled through a computer using AMERL‟s eLoad Virtual Panel
application. This allowed for the user to program a set of increasing load values to automatically
span the range of the SOFC voltage output, providing current vs. voltage and current vs. power
graphs.
A simple diagram of the setup can be seen in Figure 3-4. The SOFC was connected to
the load box through a set of Kelvin Clips. These clips were attached to the SOFC through the
leads from the current collecting meshes. Wires from the clips were then attached to the load
box. One wire from each clip (a positive and negative lead) was attached to the input port on the
load box. The other wire from each clip was plugged into the output terminals of the load box. A
RS-232 to USB cable connected the RS-232 port on the load box to the computer which allowed
for remote control of the load box.
Figure 3-4 – A simple schematic of the SOFC-load box-computer system. The SOFC is connected to the load
box through a set of Kelvin clips. The load box and computer are connected through a RS-232 cable.
50
3.1.3 Tube Furnace
As mentioned above, some of the experiments preformed required preheating the oxidizer
above room temperature to minimize the heat loss due to the unheated oxidizing gas. Thus in
order to do this a tube furnace as well as tape heaters were used to raise and maintain the
oxidizer‟s temperatures. The furnace was a LindenbergBlue tube furnace with a maximum
operating temperature of 1200°C (See Appendix E for more furnace details). Quartz tubing was
used as the gas carrier inside the furnace because of its high melting temperature (~1600°C). The
inlet and outlet of the tubes are ¼” and then increases to ½” in the middle section of the tube.
The larger diameter area was also filled with alumina fish spine beads (Omega.com). The beads
were used to facilitate the heat transfer to the slow moving gas by increasing the heated surface
area. The fish spine beads were kept within the larger section by plugging the smaller tubing with
quartz wool. Two tubes, each 42” long, were placed inside of the furnace and were connected
through a metal tube through Swagelok fittings outside of the furnace. The metal tube was
wrapped in insulation to help maintain the temperature.
Figure 3-5 – Different views of the furnace setup. The furnace and controller (left), an internal view of the furnace with
quartz tubes (center), and a zoomed in view of the quartz tubes filled with alumina fish spine beads and plugged with quartz
wool.
51
While the furnace was able to heat up the oxidizer to
high temperatures, the heat would quickly dissipate once the
oxidizer left the furnace. To maintain the high temperature,
all of the metal tubing from the furnace exit, to the cathode
face was wrapped in high temperature heating tapes
(McMaster Carr). The tubes and tapes were also insulated to
help keep the heat from dissipating. The maximum
temperature the tapes could reach was 760°C and was
successful in keeping the oxidizer temperatures elevated
to a maximum temperature of 570°C.
3.2 Performed Experiments
In order to determine the effect of different oxidizers on the relative performance of a
direct flame SOFC, a number of different oxidizers which could potentially be used as oxidizers
for propulsion systems were tested. Baseline tests were performed to develop an understanding
of the SOFC characteristics. The first tests performed were similar to previous experiments
where the SOFC was heated and fueled by a combustion flame and the cathode was left open to
the ambient air. The next set of experiments conducted were designed to study the effect of an
oxidizer flowing over the cathode surface. The experiments are described below in more detail.
Figure 3-6 – A picture of the SOFC test stand
wrapped in heat tapes to help maintain the
oxidizer temperature.
52
3.2.1 Stagnant Oxidizer
As previously mentioned, the first set of experiments tested the SOFC in a direct flame
setup to determine a baseline performance. These tests were almost identical to the original direct
flame test performed by Horiuchi et al. [20]. The anode was exposed to a fuel rich flame while
the cathode was left open to the stagnant air. The fuel used for these experiments and every other
experiment mentioned from here out was hydrogen while the oxidizer for the flame was pure
oxygen. As noted before, the flame must be fuel rich for the anode to create a charge, thus the
SOFC was tested over a range of equivalence ratios ranging from φ=1.25-2.0. It was expected
that the SOFC would produce the highest power output when the equivalence ratio was high (fuel
rich) because there would be more excess fuel and hydrogen radicals for the SOFC to consume.
This hypothesis differs from previous results taken by Kronemayer et al. [10] who used methane
as their fuel and found that there is an equivalence ratio at which the power is maximized and any
equivalence ratio higher the power begins to decrease. The reasoning being that the effect of the
increasing H2 and CO concentrations is dominated by the decreasing flame temperature.
Another parameter tested was the total flow rate of the flame gases (fuel and oxidizer).
Three different total flow rates were tested to see if the gas velocity had an influence on the
SOFC performance which were 800, 1000, and 1200 SCCM. The total flow rate was the
combined flow rates for the fuel and oxidizer that were combusted to create the flame. Thus for
different equivalence ratios, the fuel and oxidizer flow rates varied, but summed together they
were always equal to the total. Below is a table with the different total flow rates and overall
equivalence ratios with the corresponding individual fuel and oxidizer flow rates. It was believed
that the highest total flow rate will produce the highest power output which is similar to the
findings of Kronemayer et al. [16].
53
Total Flow Rate (SCCM)
800 1000 1200
Oxygen Hydrogen Oxygen Hydrogen Oxygen Hydrogen
Equivalence Ratio (φ)
1.25 240 560 300 700 360 840
1.5 213 587 267 733 320 880
1.75 187 613 233 767 280 920
2 160 640 200 800 240 960
The last parameter tested for the stagnant air experiments was the influence of the mesh
material used to collect the cathode (LSM) current. A nickel mesh was used on the anode side
because it is similar to the anode material. Yet for the cathode, there were no meshes made of
LSM, thus other materials had to be used. The first material used was Inconel 601 which is a
nickel based alloy. It is relatively cheap and was originally used to become familiar with the
SOFC operation. The second material used was a silver mesh, which is, as previously discussed,
an excellent electronic conductor. Due to its low melting point, the operating temperature for the
SOFC made with the silver mesh was lowered from 850°C (when using the Inconel) to 750°C in
order to avoid damaging the system.
The most important parameter affecting the performance of a SOFC is the temperature of
the system. Thus to make everything as similar as possible, the temperature of the anode was
kept at a constant 850 or 750°C (depending on the cathode mesh used). When the equivalence
ratio was changed, the flame temperature also changed. Therefore to keep the SOFC temperature
constant, the flame location with respect to the anode face could be moved closer or farther away
Table 3-1 – A chart of all of the flow rates for the oxygen and hydrogen gasses that are combusted to form a
flame. The three total flow rates are noted and the corresponding flow rates for different equivalence ratios
are also listed.
54
from the anode face to heat or cool the system. All the parameters for the open cathode
experiments are summarized below:
Anode Fuel – combustion flame (hydrogen & oxygen)
Cathode Oxidizer – ambient air
Total Flow Rates – 800, 1000 & 1200 SCCM
Overall Equivalence Ratios – φ=1.25-2.0
Operating Temperature – 850 or 750°C (for a Inconel or silver mesh
respectively)
3.2.2 Forced Oxidizer
All previous groups that have conducted Direct Flame SOFC tests have had the cathode
exposed to the ambient air. For the desired application to incorporate the fuel cells onboard a
satellite in outer space, there is no air for the cathode. The fuel cell must use the onboard oxidizer
used for thrust applications, which will be flowed over the cathode before it enters the
combustion chamber. Thus, the test stand was constructed where the SOFC was subjected to a
flame on the anode and an oxidizer impinging on the cathode face. First, oxygen was used for the
oxidizer and then other nitrogen based oxidizers (nitrous oxide (N2O), nitrogen dioxide (NO2),
and nitric oxide(NO)) were tested. For all the experiments described from here after, the flame
was set with a total flow rate of 1000 SCCM and was tested over a range of equivalence ratios
from φ=1.25-2.0. These tests are described below in more detail.
55
3.2.2.1 Oxygen
For the SOFC to generate power, oxygen molecules need to be reduced at the cathode,
thus exchanging electrons and producing electrical power. It is believed that pure oxygen would
be the best oxidizer, better than air which contains only 21% oxygen. The oxygen impinged the
cathode face at two different flow rates, 200 and 400 SCCM. The forced oxidizer was expected
to outperform the stagnant air for two reasons. The first one was already mentioned in that air is
only comprised of 21% oxygen, thus with pure oxygen, there will be more O2 molecules available
for the reduction reaction. Secondly, forcing the oxidizer over the cathode will increase the
concentration of oxygen molecules at the cathode face, thus allowing for more reactions to occur
at the three phase boundary region.
The problem with forcing the oxidizer over the cathode is the enhanced heat transfer
which will lower the overall temperature of the SOFC. Knowing how critical the operating
temperature is, it was believed that the forced oxidizer could potentially reduce the performance
of the SOFC instead of enhancing it. Thus, as described in the previous section, it was proposed
to preheat the oxidizer before it reached the cathode in order to keep that temperature constant.
The temperature of the cathode with the preheated oxidizer was 570°C, which is still lower than
the operating temperature of 750°C, but higher than the unheated oxidizer which was around
400°C. Oxygen was the only oxidizer that was preheated due to the high reactivity of the
nitrogen based oxidizers discussed next.
3.2.2.2 Nitrogen Based Oxidizers
Experiments were conducted to determine how effective nitrogen based oxidizers were
when used as the primary oxidizer for the SOFC. Today, standard oxidizers used for propulsion
56
applications are nitrogen based because pure oxygen must be stored cryogenically for volume
limitations. Furthermore, many of today‟s rockets use a monopropellant because they require less
complex systems. One monopropellant that is particularly interesting is HAN-based ionic liquid
monopropellants (HAN: hydroxylammonium nitrate), because of the formation of nitrogen
oxides during decomposition. The primary products are nitrogen, nitric oxide, and nitrous oxide,
while trace amounts of nitrogen dioxide have been detected [32]. Thus NO, N2O, and NO2 were
used as the SOFC oxidizer to see the feasibility of using these gasses for space applications.
To get a better understanding of how the nitrogen based oxidizers may perform, tests
were conducted using different mixtures of oxygen and nitrogen. This was done to simulate the
oxygen-nitrogen content in each of the oxidizers. Therefore oxygen was diluted with nitrogen to
67, 50 and 33% to mimic the oxygen and nitrogen ratio that may be present when NO2, NO, and
N2O dissociate respectively.
Out of the nitrogen based oxidizers tested, it was believed that the power output
generated for a given flow rate would be the highest for NO2 and the lowest for N2O (NO2 > NO
> N2O). This is based on the oxygen-nitrogen ratio being the highest for NO2 (2:1) thus having
more oxygen molecules available at the cathode surface than for the NO (1:1) or the N2O (1:2).
All three gasses were tested at two flow rates, 200 and 400 SCCM.
The following is a brief summary of the operating parameters for the forced oxidizer